I C U N F C S 1999 S 1999
69
UNITED NATIONS FRAMEWORK CONVENTION ON CLIMATE CHANGE INITIAL COMMUNICATION UNDER THE UNITED NATIONS FRAMEWORK CONVENTION ON CLIMATE CHANGE SEPTEMBER 1999 KIRIBATI GOVERNMENT INITIAL COMMUNICATION UNDER THE UNITED NATIONS FRAMEWORK CONVENTION ON CLIMATE CHANGE SEPTEMBER 1999
Transcript of I C U N F C S 1999 S 1999

UNITED NATIONS FRAMEWORK CONVENTION ON CLIMATE CHANGE
INITIAL COMMUNICATION UNDER THE
UNITED NATIONS FRAMEWORK CONVENTION ON
CLIMATE CHANGE
SEPTEMBER 1999
KIRIBATI GOVERNMENT
INITIAL COMMUNICATION UNDER THE
UNITED NATIONS FRAMEWORK CONVENTION ON
CLIMATE CHANGE
SEPTEMBER 1999

UNITED NATIONS FRAMEWORK CONVENTION ON CLIMATE CHANGE
KIRIBATI GOVERNMENT
INITIAL COMMUNICATION UNDER THE CONVENTION
1999
KIRIBATI GOVERNMENT
MINISTRY OF ENVIRONMENT AND SOCIAL DEVELOPMENT
TARAWA, KIRIBATI
SEPTEMBER 1999

Prepared byMinistry of Environment and Social Development in collaboration with
the Country Climate Change Study Team and noted by the Kiribati Government

iii
PrefaceThere are certain premises that underscore Kiribati’ grave concern about climate change. Thepremises are that climate change is occurring, its impacts include a rising sea level, there-fore low lying atolls would progressively submerge. The premises are based on IPCC As-sessment Reports which give a global scenario for sea level rise to be between 15 cm and 95cm by the end of the 21 st century, and the inadequacy of existing commitments to reducegreenhouse gas emissions to the level that would achieve stabilisation of atmospheric con-centrations at a safe level. They are also based on available information about the sea levelaround the region, and around Kiribati. More significantly, people in Kiribati are observingextensive coastal erosion taking place, not only of the beach but also of the land, displacingnow some of them from their traditional house plots since the early 1900, and felling coco-nut trees and other varieties of vegetation at the coastal areas.
Kiribati government and the people are extremely worried and also scared by the potentialfor the sea level to rise as a result of the enhanced greenhouse effect, and recognise at thesame time that there is very little that that they can effectively do to prevent global warmingor to effectively adapt to the accelerated sea-level rise. The threat their atoll country is fac-ing from the climate change typifies a global problem that requires international coopera-tion in planning for effective measures to address the problem of climate change. It is forthis reason that Kiribati has all along participated fully, to the extent of its capability, in theimplementation of the United Nations Framework Convention on Climate Change. There-fore, in fulfillment of the reporting commitment under the UNFCCC, arts. 4 and 12, Kiribatigovernment is submitting this initial communication.
Several organisations and ministries have contributed towards the production of this report.In Kiribati, the National Climate Change Study Team prepared the initial draft and furtherrevisions leading to this report. External assistance for production, and publication of thereport was provided by South Pacific Regional Environment Programme’s (SPREP) Publi-cation Unit, and immediately by the PICCAP Management Team. Funds required to meetthe costs of the enabling activities to produce the report were provided by the Global Envi-ronment Facility. As Minister responsible for climate change issues and on behalf of Kiribatigovernment, it is an honour for me to express to them all my appreciation and gratitude.
Hon. Kataotika TekeeMinister of Environment and Social Development

iv

v
Foreword
“This report has been prepared by the Climate Change Study Team and noted by the
Government of the Republic of Kiribati. The Team was established in 1995 under the USIn Country Climate Change Studies Initiatives Programme as an interdisciplinary andinterministerial committee to develop Kiribati capability to implement the United NationsFramework Convention on Climate Change. It continues to function for this purpose underthe Pacific Island Climate Change Assistance Programme (PICCAP) when this project wasimplemented in Kiribati at the beginning of 1998. The PICCAP objectives were more fo-cused on enabling the Pacific island countries participating in the programme to compile theirnational communications as required under Art. 12 of the United Nations Framework Con-vention on Climate Change (UNFCCC), and as far as possible using guidelines given inConference of the Parties (COP) 2 decision in document FCCC/CP/1996/L.12.
Under the PICCAP, training programmes on methodologies for assessing greenhouse gasemissions, the vulnerability of key sectors and for identifying adaptation options, as well asconsultancy work to assess mitigation options were provided. In addition, some public aware-ness raising activities were undertaken in the form of radio programmes, newsletter, and work-shops. These activities have enhanced Kiribati capability to generally implement the Con-vention and to complete this report.”
Tererei Abete-ReemaChairperson and EnvironmentCoordinator, Ministry of Environmentand Social Development
Temakei TebanoManager,Atoll Research Programme,USP
Eita MetaiAssistant Water Engineer, MinistryWorks and Energy
Tianuare TaeueaHealth Inspector, Ministry of Health
Tekena TeitibaDirector, Meteorological Services.
Ioane UbaitoiAgricultural Officer, Ministry of NaturalResources
Naomi AtaueaMineral Officer, Ministry ofNatural Resources
Erene NikoraDirector of Lands, Ministry ofHome Affairs and RuralDevelopment
Tooti TekinaitiSenior Fisheries Officer, Ministryof Natural Resources
Tekena TiroaStatistician, Ministry of Financeand Economic Planning
Nakibae TeuataboPICCAP National Coordinator
National Climate Change Study Team

Executive Summary
The Republic of Kiribati is a small island state with a total land area of 800 sq. km distrib-uted unequally between 32 low lying atolls and one raised limestone atoll. The 32 atolls aregenerally within any heights from less than a meter to four meters above the mean sea level.Eleven of these atolls are uninhabitable because of their small size and lack of ground waterlens. The atolls spread over a total Exclusive Economic Zone of 3.5 million sq. km.
It became independent in 1979, and is a least developed country. In 1995 the population was78000, and the great majority of the population live off the limited productivity of the sandyland, and the high productivity of the marine area.
The Republic of Kiribati is among the most vulnerable countries to adverse impacts of cli-mate change and accelerated sea-level rise. Kiribati people sense their being very vulner-able to sea level rise. This explains the continuing efforts made by Kiribati to participate inglobal action programmes to address climate change and its adverse impacts.
Kiribati is a party to the United Nations Framework Convention on Climate Change. It in-tends also to sign and ratify the Kyoto Protocol. This report is a requirement of the UNFCCC,and the contents are geared to present the special circumstances of Kiribati as an atoll na-tion, and a least developed country.
Kiribati government undertakes its climate change activities in collaboration with SPREP andother regional partners. This has to be the strategy because of Kiribati special circumstances,a small island state of low lying atolls, and least developed.
There are also gaps in information and knowledge, such as about the formation and reshap-ing of all the atolls, datum and trend of mean sea level, and scenarios on climate change andsea level rise. From Kiribati standpoint, these gaps contribute more to the vulnerability ofthese atolls, rather than alleviating it.
There is a growing sense in Kiribati that they should do what they can to mitigate and adaptto impacts of climate change. The strategies identified are in the energy sector, adoption ofmore appropriate technologies, upgrading of existing energy generation to more efficientlevel, and introducing steps necessary to reflect environmental costs in the production anddistribution of goods and services. For adaptation strategies, the sectors considered impor-tant are coastal zone, water resource, agricultural systems and public health.
Planning for climate change and sea level rise is planning for sustainable development. Thisrequires that the planning process should be participatory. Public awareness raising, andcooperation in scientific research are important programmes for capacity building strategy.They are considered as important elements in national action programmes to address climatechange.
A list of projects is included in the report. Brief explanation of the rationales is given, butthe designing and full justifications of the programmes and projects are to be developed ina time line that fit in with the overall national project planning.

Contents
Preface iiiForeword vExecutive Summary vi
Chapter 1: Introduction 11.1 Global Action on Climate Change 21.2 National Policy on Climate Change 21.3 National Activities on Climate Change 2
Chapter 2: National Circumstances 52.1 Introduction 62.2 Coral Atoll Formation 62.3 Geophysical Features 72.4 Climate 102.5 Hydrogeological Situation 112.6 Oceanographic Conditions 122.7 Mean Sea Level 132.8 Ecosystems of the Atolls 132.9 Demographic Situation 142.10 Level of Education, Training and Skills 162.11 Social Milieu 162.12 Economic Conditions 172.13 Regional Economic Differences 192.14 Summary 20
Chapter 3: Greenhouse Gas Emissions and Mitigation 213.1 Introduction 223.2 Methodology 223.3 Lack of data, in particular Country Specific Data for Emission Factors 223.4 Assessment and Evaluation of Emissions by Sectors 233.5 Problems faced in identifying Mitigation Options 253.6 Mitigation Options 253.7 Further Requirements towards Definitive Options, and Plausible Implementation Strategy 27
Chapter 4: Vulnerability and Adaptation 294.1 Introduction 304.2 Methodologies 304.3 Climate Change and Sea-Level Rise Scenarios 314.4 Socio-economic Scenarios 324.5 Atoll system and some selected sectors 334.6 Problems faced in identifying Adaptation Options 394.7 Adaptation Options 40
Chapter 5: Proposed List of Programmes and Brief Description of Concepts 455.1 Climate Change and Sea Level National Monitoring Center 465.2 Integrated Coastal Zone Management Plan 465.3 Public Awareness Programme 475.4 Education and Training Programme 475.5 Research and Information Dissemination 475.6 Greenhouse Gas Inventory Programme 485.7 Technology Transfers Programme 485.8 Water Supplies Programme 495.9 Alternative Energy Sources 495.10 Public Awareness on Health Impacts of Climate Change, and Appropriate Response Measures 49
References 50
Annex 54

Introduction
Chapter 1
2
1.1 Global Action on Climate Change
From the late 1980s, the world community of scientists first raised their concern about theincreasing trends in the global temperature, sea level, and of the atmospheric concentrationsof greenhouse gases, principally carbon dioxide, from industrial processes. In response, theWorld Meteorological Organisation and the United Nations Environmental Programme in 1988jointly established the Intergovernmental Panel on Climate Change (IPCC) which produced in1990 its first assessment report on the science and impacts of, and response to, climate change.In this report it is suggested that on balance of evidence global warming could be linked toenhanced greenhouse effect arising from anthropogenic emissions of greenhouse gases.
In keeping with IPCC’s activities and convergence of scientific opinions on key issues onclimate change, a number of United Nations General Assembly Resolutions on climate changeissues were adopted also in the late 1980s. These include resolutions on a mandate establish-ing the Intergovernmental Negotiation Committee (INC) on a framework convention on cli-mate change, and on the recognition of threats to small island states from impacts of sea-levelrise.
The INC held its first negotiation session early in 1991, and at its fifth session in May 1992, itadopted what is now known as the United Nations Framework Convention on Climate Change(UNFCCC). Heads of Governments from many countries including Kiribati signed this con-vention during the United Nations Conference on Environment and Development (UNCED)held in Brazil in June 1992. It entered into force on the 21st March, 1994 for countries which hadbefore then ratified the Convention, and for Kiribati on the 8th May, 1995.
1.2 National Policy on Climate Change
Kiribati is vitally concerned about impacts of global climate change and the need to monitorthese impacts. Recognising that this is a global problem to be addressed at the internationallevel, and yet sensing its vulnerability to the impacts from sea-level rise as a low lying andleast developed atoll country, Kiribati decides to participate in international forums address-ing the wide ranging issues on climate change. It is desirous too to build up its national ca-pability to deal with any adverse impacts. The objective of socio-economic development plan-ning is to generate a sustained, real rate of economic growth, which should be seen againstthe recognition of global warming and sea-level rise (National Planning Office, 1997).
Kiribati government is enacting a framework law on the management of the local environ-ment, establishing a responsible authority, procedures and mechanisms for public participa-tion in the management, ensuring further that socio-economic development is on sustainablepath, and making a commitment to implement any international or regional conventions andagreements on the global environment of which Kiribati is a party.
1.3 National Activities on Climate Change
Kiribati attended some of the first meetings of the IPCC which led up to the production of thefirst IPCC Assessment Report in 1990. It was also represented at the Ministerial level at theSecond World Climate Conference, and at meetings of the small island states on climate changeand sea level rise. Consistently, Kiribati has aired its serious concern about a bleak prospectfor the future that it now faces under climate change and sea-level rise scenarios.

3
Other small island states would not hope for a better future and this shared concern about thefuture has led to the formation of the Alliance of Small Island States (AOSIS) and its recogni-tion in the INC and now the UNFCCC processes.
Kiribati participated at the INC sessions, and continues to do so in the UNFCCC Conferencesand some of the meetings of the Subsidiary Bodies. The costs of attendance at these meet-ings have normally been paid for from the UNFCCC Special Funds, and at times by bilateraldonors which in the past included New Zealand. It also continues to participate at some of theconferences and workshops arranged by IPCC.
In 1993 Kiribati government formulated and adopted its first National Environmental Manage-ment Strategy. One of the objectives is the protection of the natural resource base throughprogrammes which include vulnerability assessment and coastal zone management. It shouldbe noted that at the time, there were no clearly understood methodologies on how to under-take a vulnerability assessment study. Equally there had not been a clear understanding inKiribati about coastal zone management, although certain laws contain provisions for desig-nating any part of the foreshores for the purpose of regulating, through permitting system,the removal of beach materials. Furthermore, there are provisions on procedures for land rec-lamation activities, and on land use planning.
A specific programme for climate change is the vulnerability assessment and coastal zoneprotection which has these aims:- “a) To review works already done on Kiribati’s vulnerabil-ity to projected sea-level rise, and advance it to a level where it is possible for economic andresource planners to generate appropriate coastal zone management strategies. b) To insti-tute early protection measures against coastal erosion through coastal vegetation establish-ment and rehabilitation.” (Kiribati Government. 1994 p.26). As with all the programmes listedin the NEMS, there was no funding to implement in a systematic way these activities.
Monitoring of weather conditions is carried out by the Meteorological Division with surfaceand upper air observing stations in Tarawa, and limited surface observing capabilities aremaintained on Butaritari, Banaba, Beru, Arorae, Kanton, Kiritimati, and Tabuaeran. The siteswere selected possibly to meet the need for civil aviation, but now with greater need to under-stand the climate change, the Meteorological Division would want to establish more observ-ing stations. The arrangement for reporting rainfall only from the other atolls is not satisfac-torily carried out.
The Meteorological Division has benefited from limited technical and technological coopera-tion through some work programmes of the WMO, and through regional and bilateral initia-tives. Kiribati is not a member of WMO and is considering applying for membership at thenext opportunity.
United States National Oceanographic and Atmospheric Administration maintains automatedequipment for monitoring wind profiles from Tarawa with the cooperation of the Meteorologi-cal Division. Another equipment is maintained on Kiritimati.
New Zealand National Institute for Water and Atmosphere maintains equipment for solar ra-diation measurement at Tarawa in close collaboration with the Meteorological Division.
Australia South Pacific Sea Level Monitoring programme was started in the early 1990s, anda tide gauge has been installed at Tarawa. This programme is managed by the AustralianNational Tidal Facility (NTF) based at the Flinders University in South Australia. Under thisprogramme short training courses have been organised in the region and also at the NTFHeadquarters. This programme was Australian government’s response to heads of govern-ments of the Pacific Island states concern about climate change and sea level rise which theyexpressed at one of the FORUM meetings in the late 1980s.

4
Kiribati participated also in the US Climate Change Country Study Programme. Through thisprogrammes, a National Climate Change Study Team was established in 1995. A first green-house gas inventory was compiled for the year 1990, a vulnerability assessment of the watersupply for South Tarawa, including some level of training, and also of the coastal area of someparts of South Tarawa were undertaken. Data base on climate statistics was updated to in-clude data fron observing stations throughout the country, in particularly, at the Line andPhoenix stations.
Pacific Island Climate Change Assistance Programme (PICCAP), a regional programme, hasenabled Kiribati to produce this report which is based to a significant extent on works done bynationals. These include those of the nationals who have undertaken trainings on specificmethodologies such as for greenhouse gas inventories, and for vulnerability and adaptationassessments. Public awareness programmes, in the form of workshops, radio programmes,and a newsletter were also initiated. The aim is to inform the public about climate changeissues so that they can meaningfully participate at a planned workshop to develop a nationalpolicy and action programmes to enhance adaptation, and also to mitigate climate change.

5
Chapter 2
National Circumstances

6
2.1 Introduction
The Republic of Kiribati attained political independence in 1979, before which time it was aBritish colony since the early 1890s. The only major economic resource, phosphate, minedsince 1900 was exhausted at the time of independence thus creating a challenge for the newrepublic to face in its aspiration for economic growth and a reasonable standard of living forits people.
Kiribati remains a least developed country, with a steadily increasing population which in 1995was about 78000 compared to about 64000 in 1985. Except for one raised limestone island (seesection 2.3, p 11), Kiribati is all atolls, land formation which is low, most vulnerable to sea-levelrise, and poor in land based resources. The atolls are sand, gravel, and limestone, with thinsoil to support limited agricultural crops.
The predominant tree is the coconut tree, which the Kiribati people have found many uses tosupport their subsistence lifestyle. Kiribati people have their own unique culture, includingtheir own language, traditional knowledge and skills related to their immediate environment.The link between culture and the environment is very strong.
Kiribati economy is based on government expenditures, foreign aid, and on the service sectorin the country. There are few small manufacturing industries, and the import bill far exceedsthe export bill, which is based on copra and some fish products. Very little specialisation ex-ists within the small service and industrial sectors.
The level of education, and of technical skills of the people for industrial development is notas high as those of the more developed Pacific island States.
In conclusion, Kiribati is low lying atolls, least developed, and very vulnerable to unfavorableconditions in the world economy and the world environment. It is most vulnerable to climatechange and sea-level rise.
2.2 Coral atoll formation
Atoll formation involves geological time horizon, over which synergy of natural phenomenatook place. Sea level changes occurred consistent with the cycles of glaciation andinterglaciation, the subsidence of the volcanic islands continued, coral growth at its rims,formation first of the coral fringing reefs, and finally the barrier reefs forming the present landin the atoll had also occurred. Other theories of atoll formation include stable island structure,planed off and truncated with formation of reef building organisms during the cycle of glacia-tion and interglaciation.
The atoll formation can conveniently be considered in three phases. The first stage was oc-curring during the rapid rise of the sea level during the period from 8000 to 6000 B.P when coralreefs were growing vertically at a rapid rate also. From 6000 to 3500BP the reef formation tookplace, the period too when the sea-level was stabilising at its current level ( Wo o d r o f f eand McLean,1992 cited in Wilson, 1994).
Submerged barrier reefs exist in some atolls, for example Tarawa (Paulay, et.al 1995). Elevationarea exists as an extension, at the western side, of Nonouti atoll. Is this a new island formingor is it the reef base of a disappeared island?
Marshall and Jacobson (1985) suggested that Tarawa atoll was formed 2500 BP. They alsoobserved that the change from coral reef top sediments (rapid reef growth) to unconsolidated

7
sediment could have occurred even at different periods. The latter facie were formed after thecoral had ceased to grow when they reached the sea surface. Tops of these coral growths,below the surface of the ground, occur also at varying depths. This information could sug-gest complex formation of atolls, with implications for any vulnerability assessments.
Woodroffe and McLean (1998) suggested that Kiritimati atoll has been a stable atoll becausePleistocene limestones are found within the land surface and part of the shore of Kiritimati.Further more it was experiencing a latest fall in sea level over the last 1500 years, since coralfossils at levels between 0.5 and 1.5 m. above the same species of living coral were dated toabout 1500 yrs old. This information would suggest that Kiritimati atoll could be less vulner-able than other atolls in Kiribati, but this would be so if the sea level around Kiritimati were notto rise by the year 2100 contrary to what Kiribati senses from IPCC global scenarios of sealevel rise.
Geological studies of the island have been useful in establishing the past sea level, and whilstthere are evidence that it could have been higher in the past there had not been work to estab-lish features of islands that had then existed. Secondly, climate change and sea-level rise thatare at issue are not for time horizons in millennia but within decades and a century.
Corals are sensitive to sea-temperature, the depths of water, and the amount of light that getsto them. Other conditions would include sediment load, exchange of seawater between theocean and the lagoon, turbidity, and productivity. These other conditions could easily resultfrom domestic actions. Some evidence of coral bleaching has been observed in Tarawa la-goon, but these have occurred in areas where conditions have been altered by human activi-ties.
2.3 Geophysical features
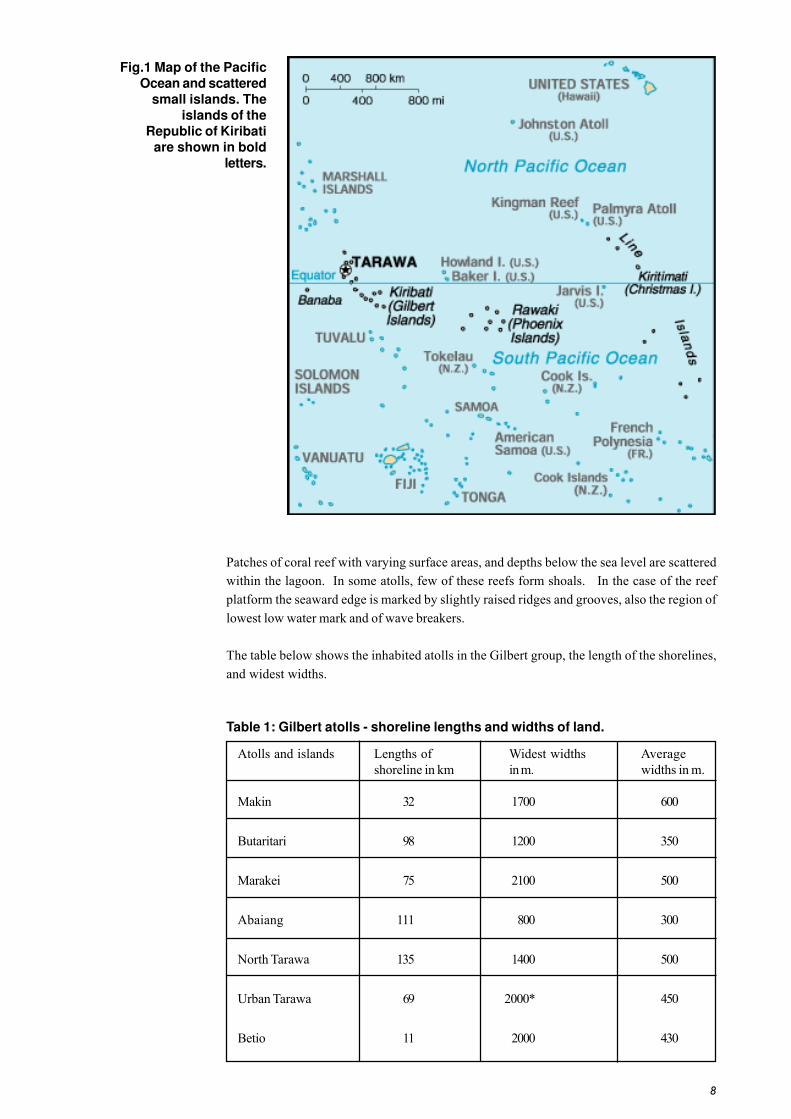
The Republic of Kiribati consists of 32 low lying atolls and 1 raised limestone island (Banabaknown also as Ocean island). They are scattered within the part of the Pacific Ocean boundedby two parallels at about 50N and 70S, and by longitudes at 1680E and 1680W. The total landarea is about 800 sq km compared to the total Exclusive Economic Zone of about 3.5 million sqkm., and the distance between the most westerly situated island and the most easterly situ-ated island is about 4000 km.
The 32 atolls and one oceanic island (Banaba) cluster into three groups. The Gilbert group inthe west has 17 atolls (including Banaba); the Line group in the east has 8 atolls, and thePhoenix group with 8 atolls lies in between. Kiritimati atoll, in the Line group, is the largestatoll in Kiribati with a land area of 363.7 sq km, but the second largest atoll is about a tenth ofthat size. The rest of the atolls have varying areas from as little as a few square kilometers. Inthe Gilbert group, the smallest atoll has a land area of 4.7 sq km with a population of 1181 in1995 and a density of 250 persons per sq km. The atolls in the Gilbert group, and three atollsof the Northern Line group are inhabited; the rest of the atolls are uninhabitable, although asmall number of government employees maintain communication facilities at Kanton in thePhoenix group. Part of Tarawa atoll known as South Tarawa is the capital “city” of the coun-try.
The atolls are generally elongated in a north-south orientation, with the eastern side facingthe predominant easterly winds. Several passages separate islands in most of the atolls, andthese have allowed exchange of seawater on the two opposite sides of the atoll to take place.Intertidal reef platforms with varying widths (150 –200 m.) exist around table reefs and at atollswith lagoons on the side facing the prevailing winds. Intertidal mud platform extends seawardfrom the lagoonal beach to the lowest low water mark beyond which the platform slopes to theseabed. The maximum depth of Tarawa lagoon is about 25 meters (Paulay.1985).
8
Patches of coral reef with varying surface areas, and depths below the sea level are scatteredwithin the lagoon. In some atolls, few of these reefs form shoals. In the case of the reefplatform the seaward edge is marked by slightly raised ridges and grooves, also the region oflowest low water mark and of wave breakers.
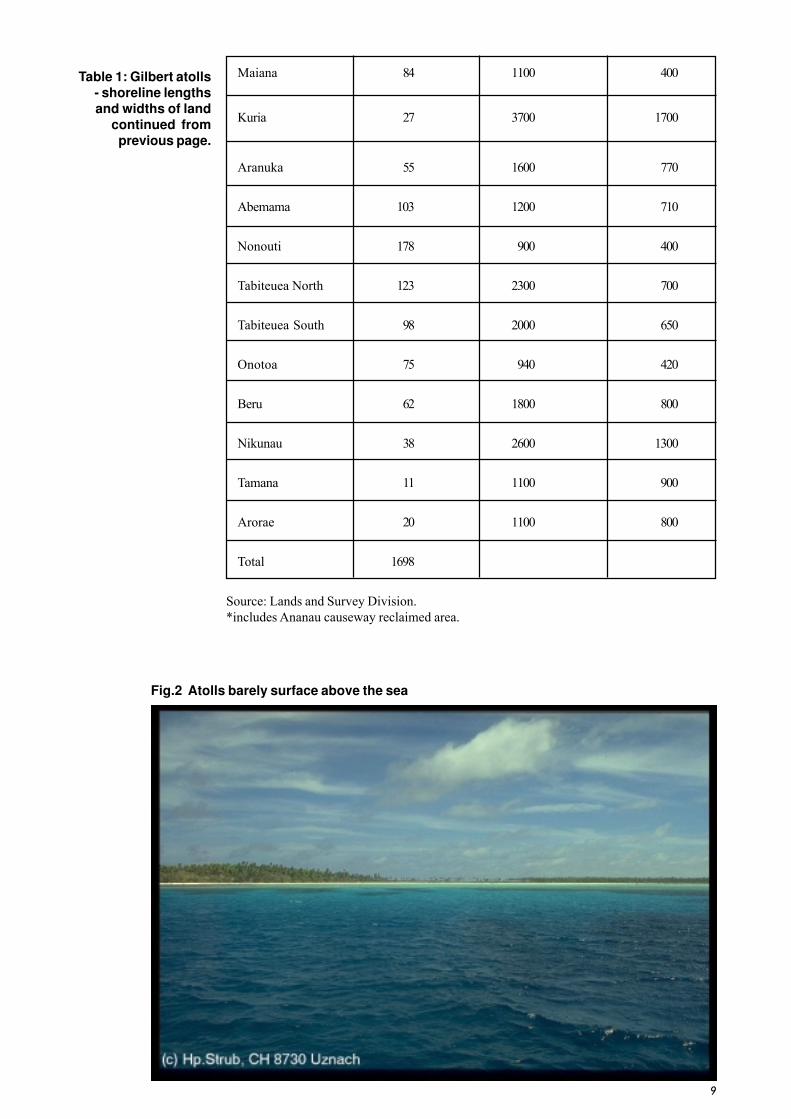
The table below shows the inhabited atolls in the Gilbert group, the length of the shorelines,and widest widths.
Table 1: Gilbert atolls - shoreline lengths and widths of land.
Atolls and islands Lengths of Widest widths Averageshoreline in km in m. widths in m.
Makin 32 1700 600
Butaritari 98 1200 350
Marakei 75 2100 500
Abaiang 111 800 300
North Tarawa 135 1400 500
Urban Tarawa 69 2000* 450
Betio 11 2000 430
Fig.1 Map of the PacificOcean and scattered
small islands. Theislands of the
Republic of Kiribatiare shown in bold
letters.
9
Maiana 84 1100 400
Kuria 27 3700 1700
Aranuka 55 1600 770
Abemama 103 1200 710
Nonouti 178 900 400
Tabiteuea North 123 2300 700
Tabiteuea South 98 2000 650
Onotoa 75 940 420
Beru 62 1800 800
Nikunau 38 2600 1300
Tamana 11 1100 900
Arorae 20 1100 800
Total 1698
Source: Lands and Survey Division.*includes Ananau causeway reclaimed area.
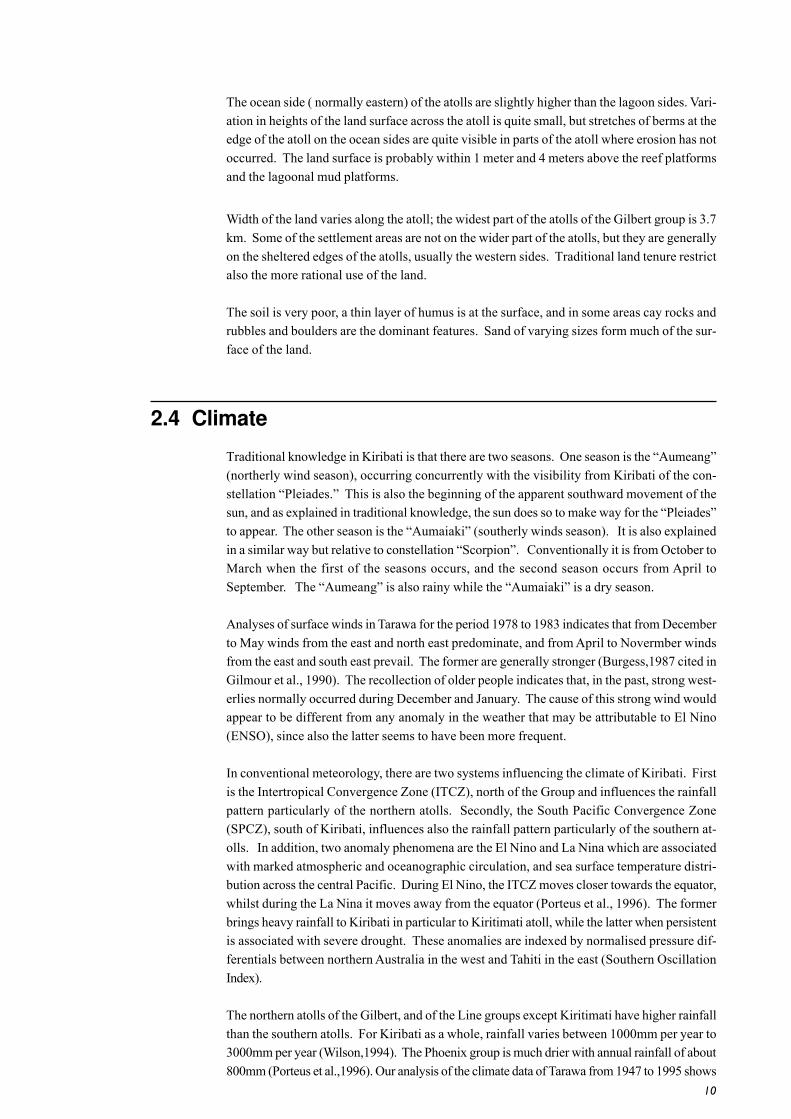
Fig.2 Atolls barely surface above the sea
Table 1: Gilbert atolls- shoreline lengthsand widths of land
continued fromprevious page.
10
The ocean side ( normally eastern) of the atolls are slightly higher than the lagoon sides. Vari-ation in heights of the land surface across the atoll is quite small, but stretches of berms at theedge of the atoll on the ocean sides are quite visible in parts of the atoll where erosion has notoccurred. The land surface is probably within 1 meter and 4 meters above the reef platformsand the lagoonal mud platforms.
Width of the land varies along the atoll; the widest part of the atolls of the Gilbert group is 3.7km. Some of the settlement areas are not on the wider part of the atolls, but they are generallyon the sheltered edges of the atolls, usually the western sides. Traditional land tenure restrictalso the more rational use of the land.
The soil is very poor, a thin layer of humus is at the surface, and in some areas cay rocks andrubbles and boulders are the dominant features. Sand of varying sizes form much of the sur-face of the land.
2.4 Climate
Traditional knowledge in Kiribati is that there are two seasons. One season is the “Aumeang”(northerly wind season), occurring concurrently with the visibility from Kiribati of the con-stellation “Pleiades.” This is also the beginning of the apparent southward movement of thesun, and as explained in traditional knowledge, the sun does so to make way for the “Pleiades”to appear. The other season is the “Aumaiaki” (southerly winds season). It is also explainedin a similar way but relative to constellation “Scorpion”. Conventionally it is from October toMarch when the first of the seasons occurs, and the second season occurs from April toSeptember. The “Aumeang” is also rainy while the “Aumaiaki” is a dry season.
Analyses of surface winds in Tarawa for the period 1978 to 1983 indicates that from Decemberto May winds from the east and north east predominate, and from April to Novermber windsfrom the east and south east prevail. The former are generally stronger (Burgess,1987 cited inGilmour et al., 1990). The recollection of older people indicates that, in the past, strong west-erlies normally occurred during December and January. The cause of this strong wind wouldappear to be different from any anomaly in the weather that may be attributable to El Nino(ENSO), since also the latter seems to have been more frequent.
In conventional meteorology, there are two systems influencing the climate of Kiribati. Firstis the Intertropical Convergence Zone (ITCZ), north of the Group and influences the rainfallpattern particularly of the northern atolls. Secondly, the South Pacific Convergence Zone(SPCZ), south of Kiribati, influences also the rainfall pattern particularly of the southern at-olls. In addition, two anomaly phenomena are the El Nino and La Nina which are associatedwith marked atmospheric and oceanographic circulation, and sea surface temperature distri-bution across the central Pacific. During El Nino, the ITCZ moves closer towards the equator,whilst during the La Nina it moves away from the equator (Porteus et al., 1996). The formerbrings heavy rainfall to Kiribati in particular to Kiritimati atoll, while the latter when persistentis associated with severe drought. These anomalies are indexed by normalised pressure dif-ferentials between northern Australia in the west and Tahiti in the east (Southern OscillationIndex).
The northern atolls of the Gilbert, and of the Line groups except Kiritimati have higher rainfallthan the southern atolls. For Kiribati as a whole, rainfall varies between 1000mm per year to3000mm per year (Wilson,1994). The Phoenix group is much drier with annual rainfall of about800mm (Porteus et al.,1996). Our analysis of the climate data of Tarawa from 1947 to 1995 shows

11
that no maximum of rainfall in any year has occurred in May and June, thus we would suggestthat these months are regarded as the driest months in any one year (Teuatabo, et al.,1996),even among the months of the generally regarded dry season, May to September. It is duringMay to June too when the South Equatorial Current and the Counter Equatorial Current areweak (McLean,1989). The wetter months in the Gilbert group are generally from October toApril.
Drought occurs intermittently, and has serious impacts on food and water. But there is nodefinition of a drought, and this fact has presented some difficulties for water management.Traditionally drought is regarded as a period when coconut trees progressively wither be-cause of insufficient rainfall or soil moisture. Royds Consulting engineers (Royds Consultinget.al. 1996) suggested that 2000 mm rainfall in a year with supplemental rainwater catchmentshould be required for urban Tarawa.
The mean annual temperature throughout Kiribati varies from about 260C to about 320C(Wilson,1994). In the Line islands, the highest mean sea surface temperature occurs in themiddle of the year, also the driest part of the year when the ITCZ is at its most northerly posi-tion (Porteus et al.,1996).
In the atolls, air surface temperature is greatly influenced by the sea surface temperature, andnot markedly by the annual variation in the solar radiation. Nonetheless, the warmest monthsare from September to November, whilst the coolest months are from January to March. Onthe basis of available data on air temperature at Tarawa covering the period 1951 to 1995, sim-ple trend fitting indicates a negligible temperature increase of 0.00080C per year. On the otherhand, the global temperature has increased by between 0.2 and 0.30C over the last 40 years(Houghton et al.,1996. p.26). These imply that over the past 40 years the trend in the tempera-ture recorded in Tarawa has been a factor of ten below the global temperature trend.
2.5 Hydrogeological situation
The islands in the Gilbert group except Banaba, and the atolls of the Northern Line islandshave limited ground water lenses at places along the atolls. Potable ground water in wellswithin village areas and in some cases away from the villages provides water supply for thepeople.
Ground water lenses may exist below the ground surface. A minimum width of 300 meters ofthe land is required for the water lens to exist (Marshall et al.,1995). Another important require-ment is the presence of unconformity layer between the generally younger Holoceneunconsolidated materials on top, and the older Pleistocene layer of coral limestone below. Inthe case of Tarawa, an unconformity layer between the two layers is found to exist 10 to 15 mbelow the mean sea level. The Holocene sediments above the unconformity layer are lesspermeable to sea water than the coral limestone which allows more readily sea water to flowthrough, and this difference in permeability favours the formation of water lenses within theHolocene sediments (Falkland,1992).
The water table is generally about 0.5 m above the mean sea level, and the vadose zone (be-tween soil layer and water table) is generally 2 m thick. The water table oscillates on a dailybasis with the tides, and in the long term with the mean sea level (Marshall, et al.,995). Theseimply that the water table is between 1.5 m and 2.5 m below the ground surface (Falkland.1992), implying land surface to be between 2 to 3 meters above the mean sea level.
The ground water supply in South Tarawa is dependent on the recharge, and also on the areaof the land. Withdrawl, including leakage, from the supply is a function also of demographic,

12
technological, and economic parameters. The sustainable yield estimate of the galleries sup-plying potable water in South Tarawa is about 1300 cubic meters per day, which means thatabout 26000 persons can be supplied with water at 50 liters per head per day. With leakage inthe system and the use of water by institutions including hospital, and training institutions,it is estimated that the sustainable yield is sufficient for about 20000 persons. This implies thatthe water supply for the population of 28350 in South Tarawa falls short of the recommendedWHO standard of 50 liters per person per day.
The ground water situation in Tarawa may be similar to some island situations on other atolls.However, there has been inadequate research carried out on the other atolls in Kiribati.
2.6 Oceanographic conditions
In traditional knowledge according to an informant, there are two distinct types of surfacewaves; waves in the open ocean referred to as the “bones” of the ocean, and land attractedwaves known as “land waves”. The former stretches longitudinally and moves from east towest, being also the direction of the predominant wind. The latter are other waves coming tothe land.
Waves approach the atoll coastlines at various angles depending on the wind direction andthe coastline alignment. The “bones” of the ocean persistently approach the reef edge oneastern side of the atoll, while the “land” waves approach the remaining parts of its shoreline.
Wave breaker and the intertidal zone around the atoll act as natural protection to the shore-line. Some parts of the coastline are also protected by natural beach rocks and conglomeratesparallel to, and as terraces along the beach. In some places, they are perpendicular to thebeach and lies across the reef platform. The beaches, berms, and coastal vegetation provideadditional protection of the land from wave action.
Two sets of alternating pairs of high and low tides occur within the day. Furthermore, springtides occur during the full and new moon phases, while neap tides occur during the quartermoon phases. Spring tides during the “Aumeang” months are generally higher than whenoccurring in the “Aumaiaki” season. An implication of this traditional knowledge is that thetide levels are determined by the phases of the moon, and that the variation in heights ofspring tides is associated with positions of the moon relative to those of the sun in the courseof the latter’s apparent zonal movement in a year.
Wave heights, frequencies, and the depths of the sea determine also the forces of the waveson the shoreline. Storm surges occurring during spring high tides are occasionally experi-enced. Waves overtop part of the coastal land and cause flooding and destruction to settle-ment areas and fruit trees. Cyclones and hurricanes occurring close to Kiribati generate wavesthat impact in destructive ways on the atolls.
There are no quantitative measures of oceanographic data for the islands except for Tarawa.Depths of Tarawa lagoon are generally between 6 m and 22 m (Gilmore et.al. 1990). Paulay(1995) gave the maximum depth of 25 m. The tidal range is between 0.55 m and 1.71 m.
However, “the maximum height of waves recorded in the Tarawa atoll and its vicinity are 5meters according to the Pilot Chart of the North Pacific Ocean” (Japan International Coopera-tion Agency, 1985. p.2-4.). In another study and a more recent one by the same agency butrelating to the ports development in Kiribati, the estimated maximum height in the lagoon is 0.5m for about 90% of the times, whereas the height of ocean waves is 1.5 meters (Japan Interna-tional Cooperation Agency,1995.). In some parts of Tarawa, ocean wave heights on reaching

13
the beach have been as high as 3.5 meters (Burgess,1987 cited in Gilmore et al.,1990) and thisheight has proved quite destructive. The land surface is at any height of less than 4 metersabove the sea level.
2.7 Mean Sea Level
A tide gauge was installed and monitored by the University of Hawaii at Tarawa in 1974. In1992 Australian National Tidal Facility installed a Sea level Fine Resolution Acoustic Measur-ing Equipment at Tarawa. However, it had not been possible to re-establish the earliest na-tional datum; a new datum has therefore been fixed using UN Hydrological datum and refer-enced to some existing bench marks located on land at Betio islet.
In his analysis of records from the University of Hawaii tide gauge, Solomon (1997, p.16) con-cludes that “sea levels are generally higher than the original mean sea level which indicates arise in the mean of up to 0.078 m over the 23 year dataset”. This implies an increase of about33.9 cm per 100 years. Etuati (1994) in her B.Sc (Hon.) thesis observed also that from the UStide gauge data set sea level would have risen by 4 mm per year. In comparison, the global sealevel has risen by about 10 to 25 centimeters over the last 100 years (Houghton, 1996 p.29),that is between 1 and 2.5 mm per year.
Criticism has been expressed that simple trend fitting is sensitive to a selected time frame. TheNational Tidal Facility has estimated that trends on incremental time basis of the mean sealevel have shown a decrease in more recent times, reversing the increasing trends over theearlier but shorter time frame since the tide equipment was installed in the early 1990s. Moreo-ver, our own analysis of the maxima of the sea level indicates that there has been an increasingtrend over the period for which the trend in the mean sea level has been decreasing.
A longer series of sea level data is needed to enable an accurate assessment of the state of thesea level in Kiribati. While these data include residuals, due to atmospheric and other sourcesof forcing apart from the gravitational force of the earth- moon-sun system, extreme recordsare discarded but would merit analysis to establish their nature as these would have signifi-cant impacts on the Kiribati atolls.
The natural variability of sea level, El Nino and La Nina effects on the sea level, could sub-sume any signal of global warming induced sea-level rise around Kiribati. Subject to accuracyof the University of Hawaii tide gauge, there appears to be good reason to note that sea levelaround Tarawa has increased over the last 23 years at the rate faster than the global rate overthe last 100 years. This accords with the more general sense of the people of Kiribati.
2.8 Ecosystems of the Atolls
Overflying Kiribati atolls, one observes levelled tops of leaves of coconut trees (Cocosnucifera). This is the ubiquitous tree of numerous uses in Kiribati. Other trees and plants forwhich rights of ownership are respected include pandanus trees (Pandanus tectorius), gianttaro (Cyrtosperma chamissionis) grown in swampy areas dug out to depths below the watertable, and breadfruit trees (Artocarpus sp.) normally grown within villages and settlementareas.
Other lesser dominating trees, plants and herbs that grow naturally on the atolls includeScaevola taccada (te mao), Tournefortia argentea (te ren), Morinda citrifolia (te non)Guettarda speciosa (te uri), Pemphis acidula (te ngea), and species of mangroves. Theyhave several uses but grow wildly that they are not regarded as being owned by land owners,

14
and are freely exploited. However, in Tarawa where the monetary system is gaining domi-nance there is increasing awareness of the situation that these trees belong to the owner ofthe land on which they grow. Few of these trees tend to dominate a limited area starting fromthe shoreline across inland for few meters.
Although the atolls are very narrow, an indeterminable region around the shoreline is “coastalarea”. The major part of this area in the seaward direction is the beach which slopes down-wards to the intertidal platform. In certain parts of the coastal areas of some atolls, mangrovespecies grow naturally. They have vital functions in the atoll system although there are noprogrammes to conserve and protect them.
Beach rocks, boulders, aggregates and coral sand constitute the natural beach. Conglomerateparallel or longitudinal to the shorelines form part of the beach. Their function in stabilizingthe beach has traditionally been recognised, but it is also realised that they provide goodmaterials for causeways, seawalls, and other construction works. Stability of any beach de-pends on the types of materials constituting it.
The intertidal zone, and the contiguous sea bed and sea beyond provide natural habitats formarine living resources. These include 600 to 800 species of finfish and about 200 species ofcoral (Wilson,1994. p.14). Marine resources have traditionally been considered to be plentifuland would never be depleting. In the late 1970s government began to monitor the status ofthe marine resources in particular of Tarawa. Some finfish and invertebrate species were notedto be depleting, for example, bone fish (Albula vulpes), sprangled emperor (Lethrinusnebulosus), and giant clam (Tridacna gigas). Overfishing in inshore areas has been attrib-uted to be the cause of the depletion of these species (Beets, 1995).
Shell fish is also an important food for Kiribati people. In South Tarawa, the dominant speciesis Anadara uropigmelana. However, abundance is recognised as being variable over time,even by geological time frame (Tebano, et al. 1995). With excessive exploitation, this sourceof food supply for the urban population might not be sustainable.
Marine resources of other atolls are not exploited to the same extent as the resources in Tarawa.Nonetheless, commercial fisheries are also starting on some of those islands, and monitoringof these resources, for example, grouper and sea cucumber, has become an important activityof the government.
2.9 Demographic situation
The total population was 77658 recorded during the latest census in 1995. 71757 of this popu-lation live on the 17 atolls of the Gilbert group with a combined land area of 286 sq. km. SouthTarawa has a population of 28350. The densities vary between islands; the highest density is1799 per sq. km of South Tarawa, and the lowest density is 54 per sq. km of Banaba, but thisisland is owned by I-Kiribati (Kiribati people) by descent, most of whom now live at Rambiisland in Fiji.
The rest of the population lives in the Line Group at Kiritimati (Christmas), Tabuaeran (Fan-ning), and Teraina (Washington). Kiritimati has a total area of 388 sq. km with a population of3225, therefore a population density of 8 persons per sq. km. Teraina has a population densityof 102 per sq. km whilst Tabuaeran has a density of 48. Kanton in the Phoenix group has anarea of 9.15 sq. km. Only a handful of government officials and their families, maintaining aircommunication infrastructure on the island, live there. One of the constraints for permanentsettling in the islands in the Phoenix group is the lack of ground water.

15
Atolls in the Line and Phoenix groups are owned by the Republic. They are inhabited bypeople from the Gilbert group who have worked for many years on those atolls, or were reset-tled there in the case of Tabuaeran and Teraina in a resettlement scheme of the late 1980s. Thisscheme arose from the need to populate the two atolls, and not related to any adaptation planfor climate change and projected sea level rise. The scheme was ended when it was consid-ered that optimum population levels for each of the atolls has been reached.
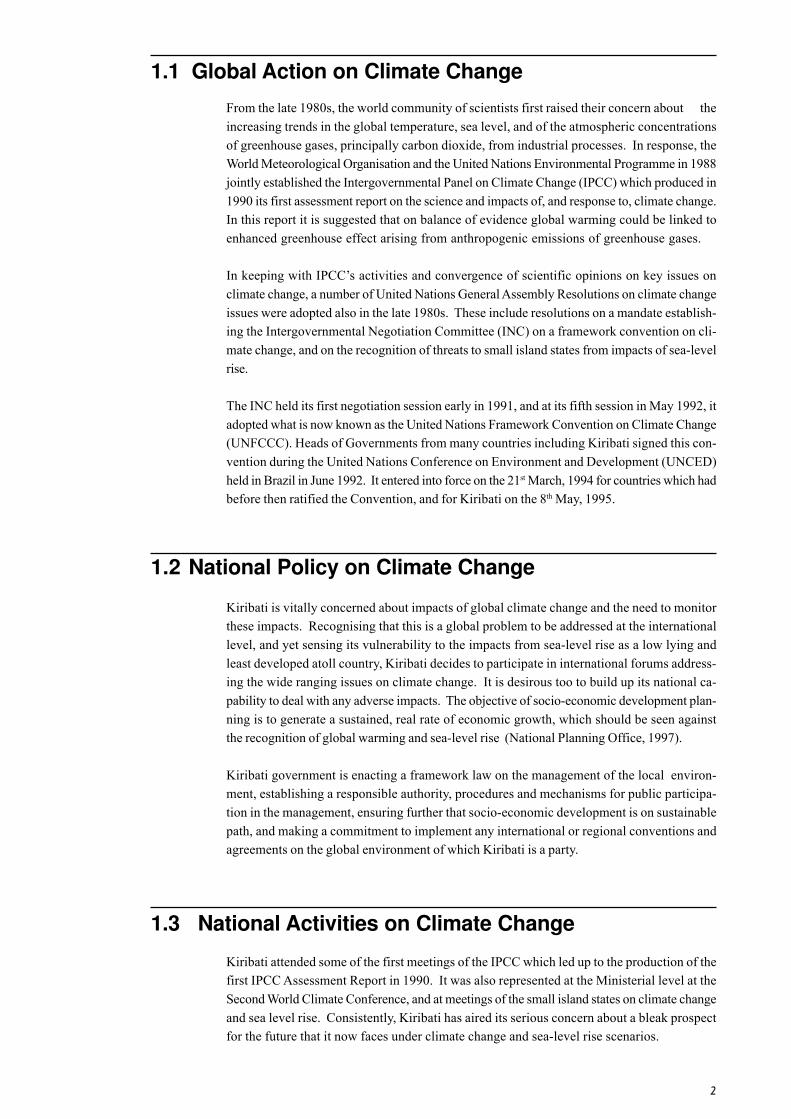
Population age structure shows that 15% are under 4 years of age, and that 41% are under 15years of age. About 50% of the population are between 15 and 50 years of age, and only 10%are over 50 years of age.
Households are also important units in demography. In the 1995 census, the total number ofhouseholds was 11920, implying an average of 6.5 persons per household for Kiribati. It wasthe same as for the Gilbert group, and a little less than the average for Line islands which was6.6. These averages were lower than the averages for urban Tarawa and for Kiritimati whichwere 8.0 and 7.2 respectively. These are the two urban areas in the country.
The previous census was in 1990 when the population was then 72333. The estimatedintercensal natural growth rate was 1.42% per annum. During that period the population ofSouth Tarawa had increased by 2.2% per year. But the increase of the population of the Lineislands was 4.2% as a result of the resettlement scheme noted above.
There has been very little migration to overseas countries, but of the total air departures of8418 from Tarawa to other countries, 58% of this number were by I Kiribati. The main pur-poses for departures by I Kiribati would be for government businesses, conferences, training,or employment overseas. Yet for such purposes, the total departures do not come to the 58%of all departures, which might suggest that there was some migration of I Kiribati for the pur-pose of resettling in other countries.
-6000-4000-200002000400060008000
Population
0 to 4
5 to 9
10 to 14
15 to 19
20 to 24
25 to 29
30 to 34
35 to 39
40 to 44
45 to 49
50 to 54
55 to 59
60 to 64
65 to 69
70 to 74
75+
Age
Gro
up
FemaleMale
Figure 3: Population Age-Sex Structure 1995
16
2.10 Level of education, training and skills
First level of education is from the ages of 6 to 14. In 1995 census, the population over 25years of age who had not attended primary education was 0.8%, compared with 9% in the caseof those of over 25 years in 1990 who had never attended schools (Demmke,A.et.al.1998.) In1977 primary education was made compulsory by legislation, and this could have the effecton the improvement of the level of education.
The improvement in the overall level of education appeared minimal and government has rightlygiven more attention to the school systems, moreover it is encouraging community initiativesto establish preschools for the age group between 3 and 5.
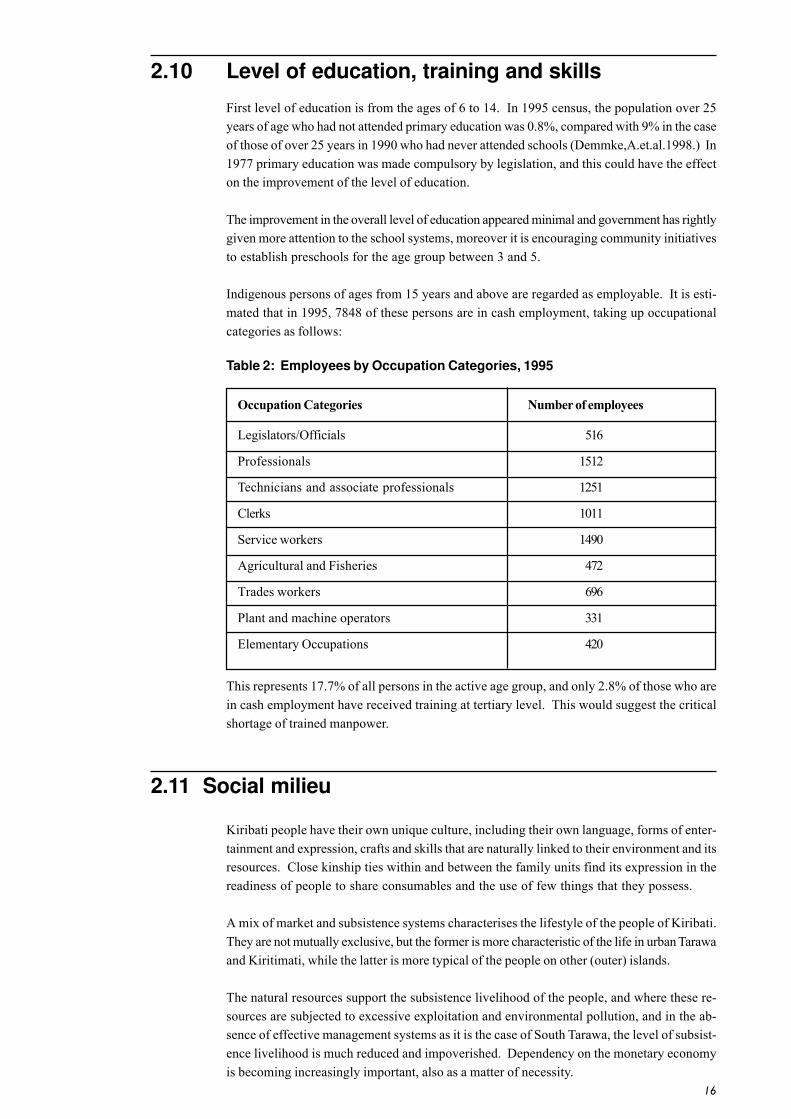
Indigenous persons of ages from 15 years and above are regarded as employable. It is esti-mated that in 1995, 7848 of these persons are in cash employment, taking up occupationalcategories as follows:
Table 2: Employees by Occupation Categories, 1995
Occupation Categories Number of employees
Legislators/Officials 516
Professionals 1512
Technicians and associate professionals 1251
Clerks 1011
Service workers 1490
Agricultural and Fisheries 472
Trades workers 696
Plant and machine operators 331
Elementary Occupations 420
This represents 17.7% of all persons in the active age group, and only 2.8% of those who arein cash employment have received training at tertiary level. This would suggest the criticalshortage of trained manpower.
2.11 Social milieu
Kiribati people have their own unique culture, including their own language, forms of enter-tainment and expression, crafts and skills that are naturally linked to their environment and itsresources. Close kinship ties within and between the family units find its expression in thereadiness of people to share consumables and the use of few things that they possess.
A mix of market and subsistence systems characterises the lifestyle of the people of Kiribati.They are not mutually exclusive, but the former is more characteristic of the life in urban Tarawaand Kiritimati, while the latter is more typical of the people on other (outer) islands.
The natural resources support the subsistence livelihood of the people, and where these re-sources are subjected to excessive exploitation and environmental pollution, and in the ab-sence of effective management systems as it is the case of South Tarawa, the level of subsist-ence livelihood is much reduced and impoverished. Dependency on the monetary economyis becoming increasingly important, also as a matter of necessity.

17
On the outer islands where the natural resources are more abundant, and where exploitationof these resources is not as intensive as in urban Tarawa, except for some commercial speciessuch as grouper, sea cucumber, clam and mud worm, the people there depend largely on thesubsistence form of livelihood.
Subsistence lifestyle is the traditional way of life. Basic human needs, food and shelter, aresupplied by available resources and traditional knowledge, skills and activities at the house-hold level. The distribution of labour within the household and across the households forcommunity obligations had evolved and well established. Cash and imported commoditieshave long been introduced and with their utilities the subsistence way of life of village house-holds are greatly improved. For the unemployed (in cash employment), life at the outer is-lands could be a better option than life on South Tarawa.
Village community at island levels is a recognised social unit. However, the traditional solidar-ity and social norms of the people within the village under one “maneaba” have been modifiedby affiliation to different religious organisations. In urban Tarawa where the great majority ofpeople do not belong to any of the traditional villages there, the latter has more influence onthe people than the former.
Traditional forms of social controls tend to be weakened in urban Tarawa and Kiritimati due inpart to the dislocation of people from their traditional villages, and to their experiencing newutilities available from the cash economy.
It is often said that economic development has also bad effects on people and culture. Inurban Tarawa, crimes have increased in numbers and complexities, and signs of struggling forsurvival are also evident. The traditional sense of dignity, and the rationales of an egalitariansociety have been lost, as new values based on acquisition of material wealth are dominating.
Life expectancy at birth is 58 years for men and 65 for women. Infant mortality rate is 62 perthousands birth, while crude birth rate is 33 births per thousand of the population (Demmke,A.et.al.1998). These rates are high.
2.12 Economic Conditions
Gross domestic product is used as measure of national wealth. However, subsistence activi-ties and products, and those that do not enter into the formal market system are generallydifficult to value.
Capital formation consists of infrastructures such as roads, wharves, buildings, machineries,and ships. Land is a precious asset to Kiribati people and in the Gilbert group it is ownedprivately by an individual, an individual with his brothers and sisters, or owned jointly by anumber of individuals. In the Phoenix and the Line groups, land is owned by the state.
In South Tarawa, rentals for land leased by government from landowners is at the rate of $A850/acre for non commercial areas, $A1200/acre for commercial areas, and $A638/acre for waterreserve areas. In 1999 this is estimated to cost $A917232. Land transactions in the open marketindicate a wide range in the prices of land from anything between few units of thousands totens of thousands an acre (Nikora, 1999. personal commun.).
There are traditional knowledge and skills forming the basis, together with natural resources,for subsistence way of living and activities. Significant cultural sites have also spiritual val-ues but which are not subjective to evaluation based on monetary measure.

18
Comparison of GDPs at constant prices over the years from 1990 to 1995 indicates an annualgrowth rate of about 3%, from $A40.6 million to $A49.2 million (National Planning Office. 1997).Per capita GDP shows also an annual growth of about 2%, from $A567 to $A614.
Inter-annual fluctuations in the GDPs are largely explained by changes in copra world pricesand fishing licenses for distant water fishing nations. With the “Trade” sector, the primarysector is second to Government expenditures in its contribution to the GDP. Contributionfrom private housing sector has steadily increased which could reflect increased aspirationfor western type of housing than traditional housing. Transport appears to be steadily in-creasing.
The highest contributor to the GDP is government spending or the public sector. In otherwords, the economy of Kiribati is dominated by the public sector. In 1990 the governmentexpenditure was 75.6% of the GDP, and in 1995 it was 89.3%. The increase is due to the in-crease in expenditures in the social services. However, in terms of cash employment, thepublic sector accounted for about 79% and 67% for the years 1990 and 1995 respectively. Thisdrop might indicate an increase in the private sector employment relative to the public sector.
The table below shows the contributions of sectors to the GDP during the period from 1990 to1995.
Table 3: Gross Domestic Products at market prices in $A’000sConstant Prices at 1991
Sector 1990 1991 1992 1993 1994 1995
Agriculture 765 1193 1342 1410 1606 1451
Fisheries 1572 2318 2009 1714 1740 2108
Manufacturing 397 365 193 321 356 513
Electricity 736 737 748 776 834 839
Construction 1213 1988 969 845 1030 882
Trade 6501 6655 7395 6754 6760 6857
Transport 3847 3934 4091 4440 5539 5176
Communication 1313 1348 1419 1490 1561 1632
Financial 2094 2486 1917 1887 1821 1817less ImputedBank charges 1825 1770 1687 1617 1609 1018
Housing 944 1153 922 844 1229 1081Gov’t and otherCommunity Services 11309 11841 12572 12710 14125 14937
Plus Indirect Taxes 7384 7122 7272 8237 7741 10192
Less subsidies 694 669 683 774 727 957
Subsistence fisheries 5088 4759 4281 4065 4205 4294
Total GDP atMarket Prices 40647 43460 42761 43102 46211 49205
( Source: Statistics Office)

19
Dependency of Kiribati on foreign aid for development is an important aspect of the economy,particularly in financing trade deficits. Currently indebtedness is not a problem. However, inrecent years, foreign aid has been decreasing, and the contribution to GDP from this source isalso declining.
The only significant export commodities from Kiribati are copra, and fish. Copra productionincreases from 4682 tons in 1990 to 13,159 tons in 1995, the highest production since 1979.This might be a response to the high subsidy paid for copra since 1995. It also indicates thatthere is real potential to increase copra production. On the other hand, the volumes of exportof fish and other marine products declined over the same period, and the annual import billhas always been higher, creating annual deficits in the balance of trade, since independenceand the ending of the mining of phosphate from Banaba.
Imports of machinery and transport equipment in 1990 was valued at $A400,000 and in 1995 itincreased to $A657,000 (Rouatu. 1996). Import of passenger cars was higher in 1995 than itwas in 1991. However, the trend reverses in the case of imports of buses. They are used inpublic transport. Development of public transport is also affected by the condition of roads,and town land planning.
2.13 Regional economic differences
Development activities and benefits concentrate on South Tarawa and Kiritimati.
The small island of Betio in South Tarawa has an area of about 1.7 sq. km, and is the main port,industrial and commercial center. The population was 10344 in 1995, implying a density of6085 per sq km then. In 1978 the population was 7626, and in 1990 it was 9443. This increasein the population is alarming, and government is embarking on structural strategic planningfor Betio with plans to cover also the rest of South Tarawa which has a population of 18000 in1995. Ministry of Home Affairs and Rural Development (Urban/Land Planning Unit. 1993 p.1)warned that “of all the islands in Kiribati, Betio faces the most pressing environmental, eco-nomic, and social problems.”
Betio is connected to the rest of South Tarawa by a 3.4 kilometer causeway, with a small open-ing for a channel to allow fishing skiffs to access between the lagoon on one side and theocean on the other side of the causeway. Tar sealed main road runs along the edges of theislands on the side facing the lagoon.
On other atolls, natural passages separating the islands are connected also by causewaysand in some cases with culvert openings. Unsealed roads run along the edges of the atolls.
Services and opportunities for investments are better on South Tarawa. Yet the living condi-tion of people in this urban area might not be healthier than that of those in the rural atolls andislands. One reason is that the natural resources of South Tarawa have been overexploited,and subsistence life style which feed on these resources is therefore increasingly impover-ished. Cash dependant lifestyle is the alternative that some enjoy, but with low monetaryGDP, as well as with the strong traditional mutual support system among related members ofthe community, the majority of the people must be just barely meeting their basic human needs.
Kiritimati is a different story. Land area is half that of the total area of all the other atolls andis owned by government. The area of the lagoon is large, and the population is small. Naturalresources are comparatively under exploited, although there is a general decline in the abun-dance of land crabs and of birds. There are no traditional inhabitants and so the lifestyle
20
developing is one of a new making. But ground water lens is very limited and is a major con-straint on the development initiatives for the island.
The natural environment includes birds and bone fish. Kiritimati is accessible from Hawaii andboth tourism and game fishing are being promoted at this atoll.
2.14 Summary
With the above circumstances, Kiribati is rightly recognised as a least developed small islandstate. It should also be recognised as groups of low lying coral atolls.

21
Chapter 3
Greenhouse gasemissions and mitigation
22
3.1 Introduction
Under Articles 4.1 a) each of the country parties has an obligation to report on its greenhousegas emissions by sources and removals by sinks. Comparable methodologies should be usedand Intergovernmental Panel on Climate Change has provided guidelines on such method-ologies..
Kiribati prepared its greenhouse gas emissions for the years 1990 and 1994. Needless to saythat technical and financial resources were made available from bilateral and multilateral sourcesrespectively for each of the two years in question. The 1990 inventory was prepared as partof the US Country Study Programme, and 1994 inventory was undertaken as part of the PacificIsland Assistance Programme funded by the GEF.
3.2 Methodology
IPCC methodology for national greenhouse gas inventories was used. However, due to lackof data at activity level, it is only possible to use the Reference Approach. Default conversionfactors were used. These default values need to be replaced by more appropriate subregionalor national data.
Greenhouse gases included in the inventories are carbon dioxide, methane, nitrous oxides,oxides of nitrogen, and carbon monoxide. There are no estimates of NMVO, HFCs, PFCs andSF6. CO2 is assumed to be produced solely from the burning of fossil fuels, and that accordingto IPCC Guidelines (IPCC.1995) this is on the high side due to the assumption that other gasesemitted finally turned into CO2 and further that not all fuels were completely burned.
Due to the lack of data related to Land Use Change and Forestry we have assumed that therewere no emissions from activities in this sector, and also from the industrial sector. The latteris a more realistic assumption than the former, as continually changes in the land use are tak-ing place, in particular on South Tarawa and Kiritimati. Population increase and the increas-ing level of development imply land use changes, but data on acreage producing, throughhuman activities, increment or loss of carbon stock are not available, nor the rates relating todifferent types of vegetation cover are known.
Details of the inventories following the reference approach are given in Annex 1 of this report.
3.3 Lack of data, and in particular country specific datafor emission factors
Kiribati contribution to global emission of greenhouse gases was estimated in 1994 to be 18.566Gg CO2, and 0.425 Gg. methane. These are insignificant and the accuracy is also dependenton the extent that de fault values would match local conditions and technologies. Clearlythere is need to develop emission factors for Pacific small island states that should also reflecttheir different physical environment and level of development.
Data on land use change and agricultural practices are not available. These imply data onchange of different vegetation cover.

23
3.4 Assessment and evaluation of emissions by sectors
The sole source of CO2 is from the burning of fossil fuels. All fossil fuels are imported intoKiribati. There are only two importers namely Kiribati Oil Company Limited and the BritishPetroleum Company. The former imports all types of ground fuels and some aviation fuelwhile the latter supplies only aviation fuels for the small internal air service and a very irregu-lar international flights connecting Tarawa, Nauru, Majuro and Nadi. Small importers includeKirigas Company which imports LPG, and occasionally government departments which haveimported bitumen.
Much of the fuels are used in the urban areas, South Tarawa and Kiritimati, for the generationof electricity, and in the transport sector. Kerosene is widely used for cooking throughoutKiribati, and for lighting especially on the rural atolls and islands.
Table below shows a comparative figures of imports of the different fuels for the years 1990and 1994.
Table 4 Imports of fuels in 1990 and 1994
Fuel Imports for 1990 and 1994
Fuel Types Quantity in toe
1990 1994
Secondary Fuels
Gasoline 1755 2148
Jet Kerosene 1027 1260
Other Kerosene 496 995
Diesel Oil 5700 5656
Residual Fuel Oil 0 12
LPG 25 39
Ethane 0
Naphtha 0
Bitumen 61
Lubricants 190
Fuel imports have increased over the four year period and this may be reflected in the in-creases of the total contributions to the GDP from the Electricity and Transport sectors overthe same period. Relative to other sectors, growth in the electricity sector shows a slightdecrease, whereas the transport sector indicates a slight increase. These patterns of theirrespective contributions to GDP would appear consistent with government policies whichemphasizes social services over infrastructure.
The objectives of the energy sector are to supply “efficient” electricity “in urban areas fordomestic and commercial consumers, and (facilitate) greater utilisation of renewable energysystems which are proven to be technically and economically viable” (National Planning Of-fice. 1997, p.72). The combined available capacity of the generation plants in South Tarawa is2.8 MW, and electricity tariffs are 32c per unit for domestic use, and 39 cents per unit for com-mercial and industrial consumption.
24
Electricity is supplied by Public Utilities Board, a self financing parastatal corporation.
Sea and air transports are important services to maintain communication between atolls andthe groups, in particular between South Tarawa and Kiritimati, and Tarawa and the rest of theatolls. The objectives in these sectors are to provide safe, adequate, and reliable services.Kiribati is also mindful of the need to limit environmental pollution that can be caused byshipping services. Air Kiribati is the only air service operator and there is no competition sothat the cost to the travelling public may not also reflect efficiency in the operation. The impli-cation is that emission levels per utility could be high.
There are few small shipping service operators besides the government owned Kiribati Ship-ping Company Ltd. More participation from the private sector is encouraged, and the effectof this on fuel consumption and emission is not clear, so long as Kiribati remain unable to usethe detailed technological approach for the greenhouse gas inventory.
For road transport, it is estimated that the total length of all the main roads on the atolls isaround 500 km. The total road in South Tarawa is about 30 km and is tar sealed. On Kiritimatimuch of the length of the road is also tar sealed. Roads on rural areas are constructed of sandand gravel topped by compacted reef mud. Since independence, Kiribati has on two or threeoccasions mounted national programmes of road upgrading and improvement. Quality of roadson rural atolls would have implication on emissions from road vehicles.
The number of vehicles imported into Kiribati each year for the period between 1990 and 1994has fluctuated. Whilst the cumulative year by year total vehicles would increase, this appearsnot clear from the registers kept by the local governments in the urban area. There is no policyon imports of vehicles and it is likely that it will steadily increase.
Skiffs and out-board motors are increasingly replacing traditional canoes and sails in inshorefisheries and for insular marine transport. Out-board motors are imported and the quantitiesfluctuates between years, but the recent estimate in 1995 of the total number in Kiribati isaround 930 (Tiroa.1997).
Kerosene stoves are widely used in South Tarawa and Kiritimati, and to some extent on theouter islands. In 1995 the total number imported was around 1420 which could be an increasefrom earlier years. Electric cookers and gas stoves are also used in South Tarawa and Kiritimati.
Carbon Dioxide emission is estimated to have increased from 13.4 Gg in 1990 to about 18.5 Ggin 1994. 98% of the total emission in 1990 comes from diesel, 0.3% from gasoline, 0.2% fromkerosene, 0.1% from LPG, and 1.2% from lubricants. The distribution in 1994 are: 42.1% diesel;26.5% gasoline; 29.9% kerosene; 0.12% LPG; and 0.01 lubricants (Metai et. al. 1998). Thesedistributions may reflect contributions by sectors to the overall national emission. Diesel isused for electricity generation and, also with gasoline for transport. Kerosene and LPG areused for home cooking.
Methane, Carbon Monoxide, Nitrous Oxides, and Oxides of Nitrogen are produced from biomassburning. Much biomass is also used for cooking, especially in rural areas. It is estimated thatmethane from this source has almost trebled in 1994 from what it was in 1990. Garden wasteconsisting of dead leaves and branches of trees, bushes and grass are also occasionally burned,instead of being buried, as this was a more traditional way to dispose this stream of waste.
Methane emission from landfills and domestic livestock shows little increase in 1994 over thelevel in 1990. Wastewater produces also methane, but it was considered that the amount ofwastewater would be very insignificant. This might prove to be an underestimation.

25
Increases are also noticed in the emissions of the other three gases. All these emissions arefrom biomass burned in cooking, and the increase reflects the population increase and avail-ability of fuel wood.
3.5 Problems faced in identifying mitigation options
A least developed country such as Kiribati implies limited natural resource base, lack of diver-sification in the economy, low level of specialisation, and lack of trained manpower. Theseattributes limit Kiribati options for mitigation. In recognising this problem, Kiribati would notpresume that this report exhausts options for mitigating climate change.
The lack of, or inaccessibility to information on appropriate technologies that can be trans-ferred to Kiribati, even for the purpose of replacing existing technologies and machineries inuse, is also a constraint to be able to identify potential options for mitigating climate change.
Data and information system for environmental management is not in place. On the otherhand, high technological tools in use elsewhere to acquire, store and display any kind of datarequired for management purposes could also benefit Kiribati. Identification of activities, ar-eas and ecosystems that could benefit from appropriate management measures with benefitsalso for mitigating climate change is made difficult without good data and information.
Climate change is still viewed as a separate problem, that could be left to the EnvironmentMinistry to take care, whilst economic development within the traditional paradigm of theunchanging climate is being pursued at sectoral, and national planning levels. Opportunitiesto incorporate mitigation measures in any economic development programmes could haveslipped.
Climate change and sea level rise scenarios at the local level have not been developed to adegree of confidence that would enable government to give full attention to the need to miti-gate climate change and to adapt to its impacts. Kiribati contribution to the global emissionis insignificant, and it needs to develop economically. However, government recognises thatas yet there is confidence in the scenarios for the whole globe, and will fully participate in anyspecific global action to mitigate climate change.
3.6 Mitigation options
Fossil fuels imported are for the types of the technologies and machineries that are in use inKiribati. Information on appropriate technologies is required so that practicable options fortransfers of those that are more efficient in terms of fuel consumption, and emission levels peroutput could be encouraged through appropriate policies.
Import tariffs could be made to reflect preferences for cleaner machineries and type of fossilfuels. Currently there is no duty on home use kerosene, a negligible tariff rate is charged foraviation fuels, a four cents Australian per liter is charged for diesel, and 12 cent per liter ischarged for motor spirit (gasoline). Furthermore, kerosene and gasoline are included in theprice control regulation. These policies need evaluation in terms of cost to the global envi-ronment that they impute through the emission of greenhouse gases.
Electrification of urban Tarawa is supplied by two power plants with the total supply of 2.8MW. Power loss from the plant, distribution cable, and transformer is unavoidable. Howeveron occasions the plants emit smokes which indicates inefficiency with regard to the use of

26
fuel. Between 1990 and 1994 power losses have varied between 13.8% and 21.6%. Option formitigation that has been identified is energy saving at end uses.
It is also recognised that the electric grids were designed when demand was lower. Powerfactors have also decreased especially over recent years, after 1994, which may imply that theelectricity may not be optimally produced.
Evaluation of the electricity generation system is also a mitigation option.
Reticulated water supply is provided for residents on South Tarawa and on Kiritimati. As aconservation measure, water supply is rationed. In the past, consumers were charged for theamount of water they used but maintenance and monitoring of the system had proved prob-lematic and was discontinued. Water meters and rates would provide better means of moni-toring consumption at the end use level.
Photovoltic cell systems are used in some rural areas to provide lighting for community build-ings and some traditional houses. On some islands, solar pumps are installed to bring waterfrom wells located away from the village areas closer to the households. Solar water pumpsare also installed at the secondary schools in rural areas. This system has discouraged theinevitable increase in the use of small power generators at the rural areas. Solar energy tech-nology, its development, and application should be encouraged.
In South Tarawa, the Public Utilities Board (PUB) has a monopoly in the generation and dis-tribution of electricity. The current policy is to encourage competition to supplement the PUB’ssupply (National Planning Office. 1997).
There is an increase in the number of vehicles running on the road. The number of privatepassenger cars is increasing faster than the number of vehicles currently used for public trans-port. Import tariffs for the former are higher than for the latter. However, the tariffs do notdistinguish between new vehicles and used vehicles. Tariffs could be made to reflect more ofthe contributions that the different vehicles are expected to make to the greenhouse gas emis-sions.
Trees and plants that are recognised as being owned by landowners are well managed andprotected. But other trees and shrubs are freely exploited, or simply cleared, and are not re-planted. Grasses are normally weeded out as they are considered as waste. This traditionalattitude about cleaning is being discouraged through radio programmes and replanting ofthese wild trees and shrubs is encouraged through biodiversity programmes. Public aware-ness programmes to extend value systems to include environmental resources should con-tribute to the mitigation of climate change.
Waste disposal in the urban area of South Tarawa is in the form of open dump. The site isnormally at the shoreline and in a number of cases waste streams disposed have been used asfill materials for land reclamation. Open dumping and other engineering methods for manag-ing waste disposals would have different emission factors. Alternative forms of waste dis-posal could produce less methane than open dumping.
Research on the atoll system and human activities, including agro-forestry, shore based fish-eries activities, and waste disposals should also provide knowledge leading to the recogni-tion of other potential options for mitigation.

27
3.7 Further requirements towards definitive options, andplausible implementation strategy
The Climate Change Study Team should be strengthened. Its terms of reference should bereviewed. The Team would be a core group of technical personnel to work with a proposedClimate Change Monitoring Center listed in chapter 5 below.
Management system for data and information on all sources and sinks of greenhouse gasesneeds to be established. Raw data on imports and consumption of fossil fuels are available,but consumption at detailed technological level including end use appliances would requiresome research work.
Kerosene stoves are widely used in addition to the use of biomass for cooking. Assessmentof emissions from these activities could lead to development of appropriate and cleaner tech-nologies for home cooking.
Evaluation of the electricity generation system in South Tarawa and on Kiritimati could beuseful. Such exercise would help to identify components of the system that are not operatingat their designed optimal level or whether there are better alternative options for their replace-ments.
Waste disposal is a major problem on South Tarawa. Decomposition of the biomass dependson weather conditions, but as the waste is left in the open and unprotected it could releasemuch more greenhouse gases to the atmosphere than the case would be if soil adsorptioncould be enhanced. More research work is required to assess the best option for waste dis-posal.


Chapter 4
Vulnerability and adaptation
30
4.1 Introduction
The atolls of Kiribati are most vulnerable to the impacts of climate change which include ac-celerated sea-level rise. This is because of their small sizes, low lying topography, limitedresource endowment, and also because Kiribati is a least developed country. This impliesthat these atoll systems would not be able to adjust to the adverse impacts of climate changeand sea-level rise without serious repercussions on the national socio-economic circumstances.It also implies that some of the atolls would soon be unable to support human habitation. Sea-level rise poses a serious threat to Kiribati. President Tito explains this sense in these words,“Our hopes in celebrating a ‘Millennium in Harmony with Nature’ are being shattered by thefailure of the KYOTO Conference to give sufficient guarantee for a secure future in the nextmillennium for low-lying islands like Kiribati” (Sawada, undated. p.5).
In several workshops at which climate change and sea level rise were presented as new factorto take into account in planning for management measures for the atoll ecosystems, a persist-ent question for which offered answers never satisfied participants was “what is Kiribati gov-ernment doing about climate change?” In truth, people in Kiribati get worried to hear climatechange and sea level rise, but are anxious to be able to do something for themselves. They donot think that the Kyoto Protocol target of about 5% reduction of greenhouse gases on the1990 level is “sufficient for a secure future” for Kiribati.
Adaptation is taken to mean any activities that either reduces adverse impacts of the globalwarming, or enhances any consequential adjustment of Kiribati peoples lifestyles to fit in withthe adverse impacts. IPCC has suggested three forms of adaptation to sea level rise. They areaccommodation, protection, and retreat. A fourth option should be external resettlement butthis is an option to signal the failure of the human race to have used and managed the globalenvironment wisely. Accommodation in Kiribati case would include internal migration, andthis option would depend on more detailed assessment of the varying degrees of the vulner-ability of the different atolls.
Planning for adaptation is clearly complex. There are non-climatic factors which would eitheradversely, or positively affect the ability of Kiribati people to adapt to yet climate change andsea level rise scenarios. The former situation is more likely to be the case.
4.2 Methodologies
IPCC framework for vulnerability assessment involves seven steps:- step 1: delineation ofstudy area and specification to ASLR scenarios; step 2: inventory of study area characteris-tics; step 3: identification of development factors; step 4: physical changes and natural sys-tem responses; step 5: identification and specification of response strategies; step 6: vulner-ability analyses; and step 7: identification of tasks and needs. These steps were followed ina preliminary study confined to a small area in South Tarawa. The result of this study has ledto the realisation by Kiribati government that a comprehensive assessment, in terms of cov-erage of the country and sectors, is required (Abete, 1993).
A comprehensive assessment is not feasible at this stage, and the vulnerability analysis wouldimply even a discipline on its own, incorporating underpinning disciplines in sectors selected,availability of data, and models that may be employed. The lack or inadequacy of data on theenvironment of Kiribati limits the use of appropriate models on impacts and vulnerability.
Qualitative information is therefore equally important in the analysis. This approach has alsobeen used, in combination with any quantitative analysis approach that may have been adopted,

31
in the vulnerability assessment on the selected sectors. Such a mix of approaches shouldnevertheless be identifiable and consistent with IPCC 7 steps for Vulnerability Assessmentwhich are listed above.
4.3 Climate Change and Sea-Level Rise Scenarios
IPCC have published global scenarios for global temperature and sea level rise in its 1990Assessment Report, and updated these in its 1995 Assessment Report. They relate to thetime of the equivalent doubling of the carbon dioxide atmospheric concentration from the preindustrial level. The updated scenarios and the doubling time are better than those given inthe 1990 Assessment Report, one reason was an improvement in understanding of the roles ofaerosols. No scenarios have been given at a regional or subregional level because there is noconfidence in the models at this high resolution level. This gap in the information is the causeof a dilemma in any vulnerability and impact assessment for any country.
US Country Studies Management Team (1994) explains one methodology to develop regionalscenarios for climate change is by extrapolating scenarios at grid points containing the regionor place of interest to obtain scenarios for that location. Kiribati efforts to obtain appropriategrid point scenarios were unsuccessful. Likewise its effort in seeking advice on scenariosfrom institutions in the Pacific region was of no consequence.
With that situation, it is understandable that some of climate change and sea level rise sce-narios that have been used for vulnerability and adaptation assessments would not receivethe consensus of scientists, particularly within the South Pacific region. This fact would alsoexplain why earliest studies on vulnerability and adaptation assessment in Kiribati have tendedto be vague about scenarios against which the assessments were made. Recent studies aremore definitive about the scenarios that they use.
All the study areas are on Tarawa, and the sectors that have been studied include coastalareas, water lens, agricultural systems and public health. The latest study was by nationals aspart of the training course they attended at the International Global Change Institute at theUniversity of Waikato, New Zealand.
The table overleaf shows the scenarios that were used by different authors, location of expo-sure units, and sectors.
In all cases, Kiribati should experience sea level rise. At the current rise of 4mm per year (Etuati,1994; Solomon, 1997), it is estimated that by the year 2025 sea level would have risen by 10cm;consistent also with the scenarios by Jones (1998).

32
rohtuA raeY troperehtfoeltiT noitacoL srotceS esirlevelaeSsoiranecs
etamilCegnahcsoiranecs
,effordooW&,D.C
.F.R,naelCcM
2991 otytilibarenluVitabiriKA:esiRleveL-aeSdetareleccA
ydutSyranimilerP
nitelsiatouB.awaraT
aeralatsaoC ybmc001-mc03sadessimsidtub0012
.ylekilnu
.raelctoN
nomoloS 8991 foytilibarenluVehtfotnemssessAaeSdetareleccAotitabiriK,oiteB
.esiRleveL
nitelsioiteB.awaraT
aeralatsaoC ,mc05,mc03:*LSM.0012ybmc59,m2,m8.1:THH
.m5.22
.deredisnoctoN
dnaK,malAC.A,dnalklaF
7991 foegnahCetamilCotytilibarenluVretawhserfikirnoBeht
.awaraT,snel
niikirnoB.awaraT
ecruoserretaW htiw*LSMtnerruCfonoitcuder%gniyrav
htiwenodnallafniar.oslagnipmupdecuder
htiwLSMdesaercnI,noitcuderllafniar%52decuderahtiwenodnaLSM.oslahtdiwdnalsi
llafniartnerruc,m1fodnalsidecuderdna
.htdiw
nidetacidnisAleveLaeSeht
.soiranecS
.R,senoJ 8991 ehtfostcapmIehtfosisylanAnAdnalsIcificaPnolocotorPotoyK
fonoitacifitnedIenotraPseirtnuoCehtnihtiwesiRleveL-aeStnetaL
0202dna5991tametsySetamilCrofderaperptroperhcraeserA
lanoigeRcificaPhtuoSeht.emmargorPtnemnorivnE
cificaPhtuoS.noigeR
esirlevelaeS nodesab1oiranecSsnoissimehtiw,a29SI
suoiravmorfghgfotub,5991nisecruossnoissimeninoitcudersuoiravhtiW.0002yb-1:seitivitisnesetamilc
-5;5202-5002mc21.5202-0202mc21
rofa29SI2oiranecS23-41:PKneht,0002
.0502ybmc
&I,iotiabU.T,aeueaT
8991 niitabiriK.lareneg
,erutlucirgA,htlaeHcilbuPlatsaoC,retaW
sdrazah
;5202yb7.91-mc3.9;0502ybmc7.93-8.91
0012ybmc1.49-9.84
ybC05.2-5.0yb2.2-9.0;5202
yb5.4-5.1;05020012
Table: 5: Vulnerability and Adaptation Assessments since 1992.
*Mean Sea Level is equated to a zero mark used in the Australian National Tidal Facility equipment locatedat the Betio wharf, South Tarawa. In fact the assessed MSL is 1.6 m above this zero mark.4.4 Socio-eco-nomic scenarios
4.4 Socio-economic scenarios
There has been no attempt to quantitatively establish any socio-economic scenarios. Onepossible consequence of this information gap is to obscure the human dimension of the vul-nerability. Equally it could result in being too presumptuous about the impacts of climatechange on Kiribati, by attributing the cause of any environmental degradation to climate change.
In Kiribati case, we consider that important consideration for the formulation of socio-eco-nomic scenarios could be based on demographic and economic projected trends and adjustedfor any foreseeable influences of national policies and external factors. We can only assessthese in qualitative terms.

33
Over the past twenty years, Kiribati infant mortality rate has improved from 120 to 65, and lifeexpectancy has also increased from 49 to 63 years. Nonetheless these improvements are be-low current levels that are enjoyed by more developed Pacific Island states (National Plan-ning Office. 1997 p.86). It is further noted that family planning remained below targeted lev-els, and that only social and economic factors would be deciding factors on the populationtrend. Intercensal population increase rates have fluctuated to the lowest level of 1.42% perannum over the recent intercensal period, 1990-1995. This was a drop from the earlier intercensalperiod, 1985-1990, when it was 2.26%. Based on these facts, we consider that the populationwill continue to increase; it is not possible to say whether a stable population will be achievedover the next 100 years. If such a situation should arise, then it would be because of naturallimitation, including on food and water supplies, rather than any conscious policy of govern-ment to limit population size.
Population increase implies greater pressure on environmental resources. It also implies greaterdemands on government services, and high rate of economic development to maintain percapita real income. Being a largely traditional community and society, requirements for eco-nomic development would imply greater and sustained efforts in education and other mod-ernizing processes to go on. Aspiration for better infrastructure would increase. Economicdevelopment where there is limited opportunity would imply greater dependence on foreignaid, or a fall in the standard of living. Consequences would be overseas migration, or revert-ing to subsistence lifestyle to create more pressure on traditional resources.
An alternative assessment would be economic policies that are less responsive to the devel-opmental needs of the increasing population. Pressure on environmental resources wouldstill be a force to reckon. But government services could be restricted to some minimum level,and economic development be considered solely in terms of the amount of GDP. In this casereliance on traditional and subsistence lifestyle would prevail, and under the scenarios of biggerpopulation would imply a even more impoverished subsistence livelihood.
The two variants of economic development strategies and their interaction with populationwould alternately be dominating factors in determining socio-economic scenarios. For Kiribati,as one of the most vulnerable low lying atoll countries, adverse impacts of the sea-level riseon the atoll systems would override any impacts of the socio-economic development.
Few population projections were sighted. Ministry of Home Affairs estimated that in 2010 thepopulation of South Tarawa would be 46,000 (Ministry of Home Affairs and Rural Develop-ment,1995). A range estimate given in Kingston Morrison for the same year is between 35000and 47500 (Kingston Morrison,1996).
In summary, socio-economic scenarios would be about demographic trends, GDP trends, andthe state and trends of the abundance and use of the traditional resources. External factorsinclude foreign aid in the form of capital, technology, knowledge and skill which would con-tribute to GDP growth. Population would also increase. But traditional resources includingskills and knowledge would become more wanting. On per capita basis, the national welfarewould tend to decrease. Overall, Kiribati will remain in the least developed countries catego-ries through the foreseeable future. When adverse impacts of climate change and sea levelrise become well demonstrated, Kiribati people would have already experienced greater hard-ship and costs caused by climate change and sea-level rise impacts.
4.5 Atoll system and some selected sectors
Each of the inhabited atoll is an ecosystem on its own. No two atolls are similar, except fortheir general features of being small in land area, generally flat with the land surface at anyheight from less than a meter to about 4 meters above the sea level. Yet vulnerability assess-

34
ment studies that have been carried out were limited to few areas of South Tarawa. The resultswould therefore be generalised to all atolls, but significant differences in the case of anyother atolls would also be pointed out
Water Lens
From their study of Bonriki (in South Tarawa) water lens, Alam and Falkland (1997) consid-ered that water lens would be more sensitive to the amount of rainfall, the width of the island,rather than to a rise in the sea level. The effect of the sea-level rise would raise the water lensbut without any significant change in the depth of freshwater limit. A 50 cm rise in sea levelwould raise the water table by approximately the same amount so it was thought there couldbe a slight increase in the thickness of the freshwater lens. A 1 meter rise would most likelycause inundation of the island near the sea. A combined impact of a rise of 1 meter in sea level,erosion by 12.3%, and current rainfall would be 10% reduction in the water lens.
During the latest period without rain, experienced from May 1998 to March1999, a droughtcondition was declared by Kiribati government. La Nina conditions prevailed also in 1998.Rain came in late March and continued during April and May 1999. With the coming of rain,a widespread diarrhea struck South Tarawa to claim some life. If the freshwater lens would risewith the sea level rise and to cause inundation, impacts on the health of the people would beanticipated.
Limited freshwater lens exist on all of the inhabited atolls except on Banaba (Ocean Is.). Tarawaatoll at which the study area is located has a lagoon like other atolls, but there are table reefscharaterised by fringing reefs all around and non existence of a lagoon. These types of atollsinclude Makin, Nikunau, Tamana and Arorae, in the Gilbert group.
With the sea-level rise scenarios, it would be most likely that a pattern of erosion and accre-tion would evolve that could change also the distribution of ground water lens. There are noscenarios established for rainfall; it is however probable that rainfall may not change but thatits intensity could increase in which case land coastal erosion from rainfall would exacerbate..
In summary, water lens would be affected through erosion that might be associated with sea-level rise, but intense rainfall would tend to improve the quality of the ground water lens withinthe atoll. There could be problem when the water lens get very close to the land surface.
Fig.4: Coastalindeterminable
boundary betweenland and the seaacross the atoll.
However,traditionally thenarrow strip ofland parallel to
the shoreline andfew meters inland
is regarded as“Mataniwin te
aba” which hasthe literal
translation of“leadership land”.

35
Coastal area and hazards
There is no hinterland on atolls, and coastal area is evidently the whole of the atolls. In Kiribatithe average width of the atolls is about 667 meters and sea spray freely circulate
The earliest studies (Woodroffe et.al 1992) concluded that complex patterns of erosion andaccretion have already occurred at Buota islet on, separated from Bonriki by a narrow naturalpassage, because of coastal structures such as causeways and seawalls built along SouthTarawa, including Buota islet.
The total coastline of South Tarawa is about 69 km, and we estimated that about 18.9% iscovered by seawalls, wharves and causeways. Whilst this could be considered to be thecause of the complex pattern of erosion and accretion, it might equally be viewed as a re-sponse already taken by the public and the private sectors to adapt to impacts of climate changeand sea level rise.
Throughout South Tarawa, complex pattern of erosion and accretion has been occurring. Asa result, individual islets and any stretch of land would either have gained or lost in area. Thisis the case also of other atolls in the Gilbert group.
Solomon (1997) analysed tide records from the University of Hawaii equipment and from theAustralian National Tidal Facility tide gauge. The former were installed in 1974 while the latterwere installed in 1992. He concluded that the sea level has risen by 3.3 mm per year, but thatthe total land area of Betio according to other research, including Gill 1993, has increased.This is an admonition against the simpler view that sea level rise would simply cause landinundation and erosion. However, we observed that 45% of the shoreline of Betio is coveredby coastal structures which might explain why the land area has increased.
The whole of Betio is leased from landowners by government so that much of structural changeon the coast were initiated by government to provide and protect infrastructures, includinghousing, buildings, roads, and wharf. Betio is also the commercial centre in Kiribati and heav-ily populated. Moreover, it is part of Tarawa atoll, and might not be adequately represent theadverse impact of the observed sea-level rise on the total area of the atoll.
With the sea level rise having been observed in Betio, but at the same time with much coastalstructural protection, which may be viewed also as spontaneous mitigation, having beenconstructed, it is difficult to isolate which is the cause of the increase in the land area.
However, the same study suggested that Betio would be vulnerable from overtopping. Thisis in relation to the scenario of sea level of 1.5 meters above the IPCC scenarios of 30 cm, 50cm, and 95 cm by the year 2100. The 1.5 m was based on the current mean sea level and themaximum of the residuals according to the Australian National Tidal Facility data. We shouldnote however that the current mean sea level was above the zero mark of the tide gauge, whereasthe scenarios were based on IPCC scenarios added on to the current mean sea level presumednow to be equal to the zero mark. The study could therefore be optimistic, but even as it issome parts of Betio islet would be subjected to overtopping and in extreme storm conditions“all but the highest parts of the western shore would be overtopped by runup” (Solomon.1997, p.50).
Overtopping from storm surges has regularly occurred in some parts along the shore of Betio,even in areas where there are seawalls. Overtopping destroy breadfruit trees, and few otherfruit trees that may grow on the coastal area. However, storm surges need not necessarilyresult in erosion. But complex pattern of change in the land formation would most likely oc-cur; nonetheless such a scenario is equally destructive and costly to any atoll, since the landarea is very small and options for land utilisation are constrained by that fact.
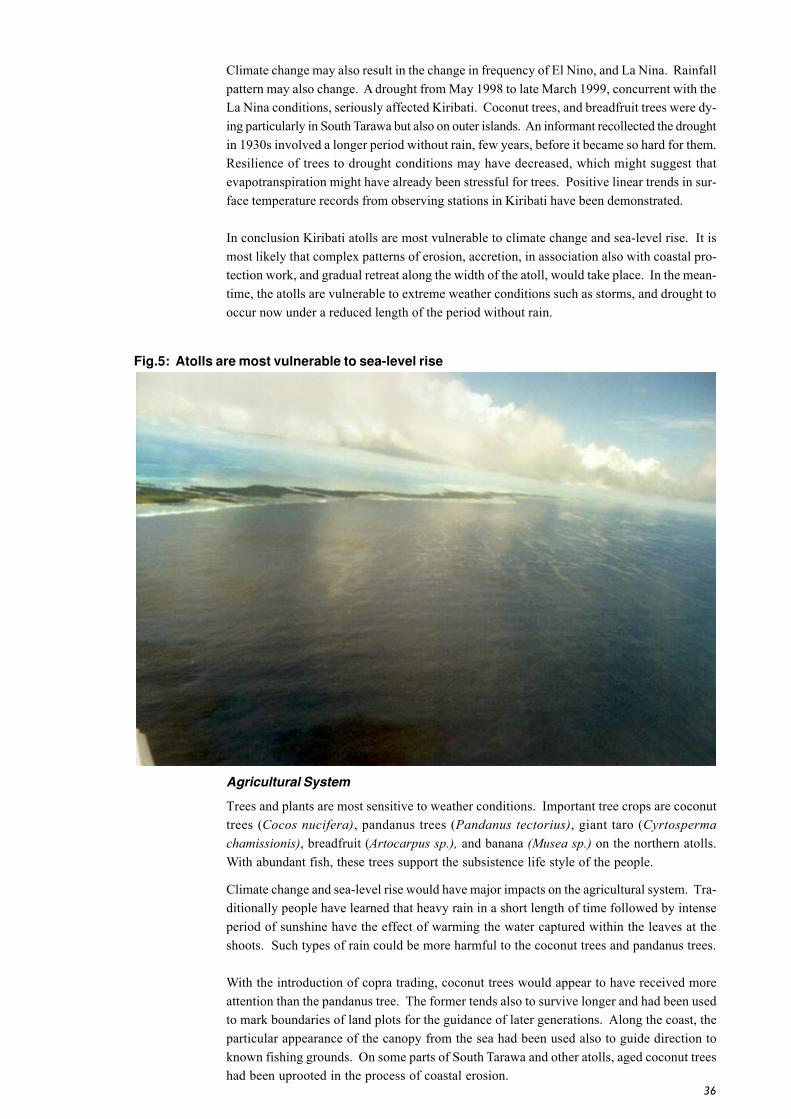
36
Climate change may also result in the change in frequency of El Nino, and La Nina. Rainfallpattern may also change. A drought from May 1998 to late March 1999, concurrent with theLa Nina conditions, seriously affected Kiribati. Coconut trees, and breadfruit trees were dy-ing particularly in South Tarawa but also on outer islands. An informant recollected the droughtin 1930s involved a longer period without rain, few years, before it became so hard for them.Resilience of trees to drought conditions may have decreased, which might suggest thatevapotranspiration might have already been stressful for trees. Positive linear trends in sur-face temperature records from observing stations in Kiribati have been demonstrated.
In conclusion Kiribati atolls are most vulnerable to climate change and sea-level rise. It ismost likely that complex patterns of erosion, accretion, in association also with coastal pro-tection work, and gradual retreat along the width of the atoll, would take place. In the mean-time, the atolls are vulnerable to extreme weather conditions such as storms, and drought tooccur now under a reduced length of the period without rain.
Agricultural System
Trees and plants are most sensitive to weather conditions. Important tree crops are coconuttrees (Cocos nucifera), pandanus trees (Pandanus tectorius), giant taro (Cyrtospermachamissionis), breadfruit (Artocarpus sp.), and banana (Musea sp.) on the northern atolls.With abundant fish, these trees support the subsistence life style of the people.
Climate change and sea-level rise would have major impacts on the agricultural system. Tra-ditionally people have learned that heavy rain in a short length of time followed by intenseperiod of sunshine have the effect of warming the water captured within the leaves at theshoots. Such types of rain could be more harmful to the coconut trees and pandanus trees.
With the introduction of copra trading, coconut trees would appear to have received moreattention than the pandanus tree. The former tends also to survive longer and had been usedto mark boundaries of land plots for the guidance of later generations. Along the coast, theparticular appearance of the canopy from the sea had been used also to guide direction toknown fishing grounds. On some parts of South Tarawa and other atolls, aged coconut treeshad been uprooted in the process of coastal erosion.
Fig.5: Atolls are most vulnerable to sea-level rise

37
A coconut tree replanting scheme in the late 1960s based on the assumption that coconuttrees would grow better and more productive if their roots were also to be within reach of thewater lens proved to be a failure. If the water lens were to be lifted up as a result of the rise inthe sea level, then the coconut trees could be less productive. This assessment would also beconsistent with the experience that the coconut trees in damper soil, as for example, in thenorthern Gilberts are less productive than on those of the drier South.
Certain varieties of pandanus trees are found on some atolls, whilst still other varieties arefound in some other atolls. An attempt to disseminate these varieties to atolls where they arenot found proved unsuccessful, implying that small differentials in the climate between atollsexist and that these trees are sensitive to such small differentials in the amount of rainfall, andtemperature.
Giant taro planted in dug out pits reaching the water lens would be adversely affected. It isknown that where the pit is within a thin water lens, uprooting a giant taro causes the infiltra-tion or the “upwelling” of salt water into the pit. In the northern Gilbert many large pits (fewacres) are owned by a number of families, and these pits would be affected by the sea-levelrise.
Some islets in Tarawa are disappearing, and with drought and sea-level rise the vegetationstructure are changing. Coconut trees along the “coastal” area (mataniwin te aba) witheredand die while undergrowths of salt bush (Scaevola sericea), beach heliotrope (Tournefotiaargentia), beach mulberry (Morinda citrifolia), and varieties of low grasses were succeed-ing them. These types of vegetation are also first to appear on new accreted lands. With theanticipated complex change in the pattern of erosion and accretion to occur from the sea-levelrise, there would also follow changes in the succession of trees and plants. Human interven-tion would be directed to the planting of the traditionally more valuable trees in new accretedland, but might not be extended to planting other trees and plants as a conscious effort toprotect coastal and land erosion.
Mangroves thrive also in the intertidal zone along parts of some atolls. These plants haveessential functions to protect the beach. Where they exist, it is considered that the beachwould be stable. Whilst this may be true in many cases, an informant said of the mangrovesalong a particular beach section in Tarawa, in connection with the claim that they protect thecoast, that they were encroaching onto the land as the shoreline retreated.
Economic development provides incentives for diversification of tree crops and for growingshort term vegetables. This has success on South Tarawa, and at the northern atolls of theGilbert group. Also traditional management of the long term tree crops is being encouraged,but this is facing the challenge from the changing value system about agriculture arising fromsome level of modernization taking place in the country. Short term cash earning from copraand other products of the coconut trees, pandanus trees, and other plant are preferred thanthe sustainability of the land productivity. Pandanus trees might receive increasingly lessattention, yet this is an important tree for local construction and home amenities.
Demographic factors have impacts on agriculture through the traditional land tenure system,land sizes, and distribution. Population densities in rural islands reflect not only spatial areaof settlement but also the distribution of resources that are normally obtained from the land.Land is not equally distributed, so that there may be under-utilised lands and overexploitedlands.
In summary, it is suggested that the pattern and intensity of the rainfall, the feature of thewater lens would greatly affect the agricultural system. The latter would also be affected bythe width of the land and, with the predicted complex change in the pattern of erosion andaccretion even to be caused also by the sea-level rise, the land productivity might decrease.
38
To maintain the current level (late 1990s) of land productivity, the future population of Kiribatiwould have to work harder.
Diseases
Through impacts of climate change on the atoll ecosystems, Kiribati people would ultimatelyface the downstream effects such as lifestyle diseases.
A start of an unexpected period of rain in late March 1999 and through to May, after a shortperiod of drought referred to above was associated with a form of diarrhea spreading in SouthTarawa, causing some deaths across all ages. The disease was not identified but the healthauthority believed that it was a form of virus that would get cured through the patient devel-oping natural antibodies (Radio Kiribati. 26th April, 1999: Health Announcement). Precautionmeasures advised include the boiling of drinking water.
Drinking water from wells can be contaminated through leaching of pollutants, runoff fromnearby grounds during raining periods, salt intrusion from salt water underneath the waterlens. Sources of pollution are the wastes on the land, coastal areas and the sea. Guidelines onhow to protect wells should be developed and widely distributed; the wells should addition-ally be monitored for quality.
Traditionally, people know that mosquitoes are more abundant after a period of rain. Prior tothe onset of a rainy period, ants and other ground dwelling insects move to sheltered areasincluding those that they can find inside houses. Flies might also tend to stick around insheltered areas in houses. Spring tides could also contaminate ground water lens for it is acommon knowledge that at the onset of spring tides, babies would normally contact diarrhea.Waste including those of the packaging of imported commodities, garden yard waste, andwaste from domestic animals such as pigs and chickens, would provide different levels ofattractiveness for vector disease carriers depending also on the amount of moisture from rainor otherwise that they contain.
In the dry season, the range of the vectors could be wider. People are also more mobile. Withthe impossibility of getting rid of all the nesting places of these vectors, any disease thatstruck the atolls may spread more rapidly in dry season, for example dengue fever.
Any temporal and intensity changes in rainfall pattern from the traditionally dry (Aumaiaki)and wet (Aumeang) seasons would most likely affect the incidences of the vector and water-borne diseases. The effects would be through impacts on the breeding grounds of the vec-tors, namely mosquitoes, flies, and other insects.
Increasing trend in temperature has been observed from the observing stations in Kiribati.The trend has been very small, but even then some older people thought that they have feltthis change. However, heat waves could not occur in the atolls but the glaring sun coulddamage eyesight, accelerate aging process, and reduce the general health and productivity ofthe people.
In summary, should climate change results in any change in the alternating pattern of rainyand dry seasons, in temperature, and in the moisture content of waste, then the incidence ofdiseases might change for the worse and new diseases might occur. A warmer climate couldexceed the optimum climate conditions for Kiribati people.
Marine ecosystems
Corals are important ecosystems for the atolls. Factors affecting their health include sea tem-perature, depth below sea surface, and amount of sunlight. They are known to thrive better

39
in oceanic conditions rather than lagoonal conditions (Maragos 1974 cited in Paulay et.al 1995).In the lagoon, nonetheless, patch reefs and shoals exist. Abundance of coral is greater aroundany natural passages to submerged barrier reefs.
Corals have important functions for adaptation of the atolls to climate change and sea-levelrise adverse impacts. A common question that has been raised by Kiribati people is whethercorals growth rate would be able pace with the projected rates of the increase of sea-level rise,that is sea-level scenarios. It is for this reason also that geological studies of the atolls arerelevant.
The atolls were understood to be formed between 4000 –3000 B.P. This was the period of reefforming when the corals had reached the sea surface, after their rapid growth period in concertwith the rapidly rising sea level during the marine transgression period. The rate of coral growthwas between 5 mm to 8 mm per year (Marshall et.al. 1985), but during that time the sea levelwas rising at a more rapid rate of about 15 mm per year (Schofield,1977). Nevertheless IPCC(Bijlsma, et.al 1995) consider a growth rate of 10 mm per year to be more representative. Com-paring this growth rate to IPCC scenarios of sea-level rise at a slower rate, it would appear thatcoral growth could keep pace with the anticipated rate of rise of the sea level.
However, the limiting factor would be sea surface temperature against the tolerance tempera-ture level of 250 -290 C (Nurse et al. 1998). Coleman (1989) quotes an annual mean sea surfacetemperature of 28.40 C around Tarawa. The rate of temperature increase would therefore be anequally critical factor as the sea-level rise in determining the vulnerability of the atolls.
Schofield (1977) suggested that the maximum sea level during the marine transgression periodoccurred some 200 years after the occurrence of the maximum in New Zealand. There could bestill controversy over whether the sea level in Kiribati was higher during that period. Thisinformation might suggest to some people that this pattern could repeat itself although thetwo sea-level rise phenomena arose from different causes. However, land formation and hu-man settlement could occur in a later period and therefore this analogue could not be used toimply anything about the vulnerability of the atolls to climate change and sea-level rise.
Coastal areas would be seriously affected. The protective roles of the reef platforms, ridges,grooves, beach rocks and conglomerates, and patches of reefs and shoals, sea grasses sur-rounding the atolls would be inadequate for the impacts of the sea-level rise and temperaturerise. Stability of the beach rocks and conglomerates under temperature stress has not beenassessed, but it has been observed that they get cracked and parts flaked off. Coastal erosionis a common problem throughout Kiribati.
Structural changes in the coast have been attributed as a major cause of the erosion. How-ever for South Tarawa we estimated that about 19% of the shoreline has been modified byengineering structures including sea wall, wharves, and causeways. But there has been neg-ligible modification of coastal areas of some outer islands, yet they too have serious coastalerosion problems.
In conclusion, corals have a crucial role in determining the vulnerability of the atolls to theadverse impacts of climate change and the rise in sea level. In turn, their ability to provide thisimportant function will be determined equally by both temperature increase and sea level rise.Climate change threatens the survival of corals and so too of Kiribati.
4.6 Problems faced in identifying adaptation optionsGaps in data and in knowledge about the atolls contribute significantly to the difficulty facedin trying to identify options for adaptation. Whilst global scenarios of temperature increasesand sea level rise are sufficient for global action to be taken to address climate change, sce-

40
narios at the local level are highly controversial that any adaptation measures based on suchscenarios are likely not to be given due consideration. Data and knowledge would thereforelend greater justification to adaptation measures.
Data and knowledge should also guide policy formulation for areas and sectors of the physi-cal and socio-economic environment of Kiribati. Gaps in data and knowledge could misdirectpolicies towards different focus from areas which when given attention can ensure long termbenefits to the economy and environment. If this were to be the case, reactive policies wouldprevail, thus exacerbating environmental problems and loosing opportunities to adopt effec-tive measures to adapt to the impacts of climate change and sea-level rise.
Shorter and mid term time horizons are immediately more realistic for planning purposes. Evenwhen sustainable development is being acknowledged, any longer term policy measures evenwhere accumulated benefits over cost would be positive, other policy measures with moreimmediate benefits but at a greater accumulated cost over the longer term period would bepreferred. This perspective does not assist in planning for adaptation measures.
In summary, this report should not create any impression that adaptation options identifiedhere are a closed set.
4.7 Adaptation options
General options
Economic development objectives are based on the national aspiration to increase the percapita income of the people. This is a shift from the pre and early independence policy whenthe objective was self reliance. Productive sectors and infrastructure, and rural developmentwere then given priority.
The current developmental objectives take greater account of the potential of human resourceto raise national productivity, and entrepreneurs acumen in developing the nation. Greaterresources are being allocated to social services, in particular education, and there is less em-phasis on population planning. Restructuring of the economy is being pursued.
These policies have implications for sustainable development. Adverse environmental im-pacts and consequences of failures of the earlier policies are now being addressed, such asthe construction of openings to solid causeways. The current policies based on human re-source development and the restructuring of the economy would in future show their impacts,including most likely an over exploitation of environmental resources. This means over ex-ploitation of the land as a living area and habitat for tree crops and vegetation, of the marineareas as habitat for marine living resources. They could be avoided by taking stronger meas-ures in the management of the environment. At the same time immediate benefits from a cleanerenvironment would be realised. Environmental considerations need to be integrated intoeconomic planning.
The first option would be to enact an environmental framework law, and to effectively imple-ment such laws. Kiribati government is processing environmental Bill through parliament.Environmental Impact Assessment process and pollution controls form important parts of thisBill.
More effort is needed to enhance Kiribati people’s awareness of their environment and cli-mate change issues. Furthermore, the level of awareness should be such that it will be possi-ble to redefine some of the motives of people in their activities that have direct impacts on theenvironment.

41
Water Supplies
Fresh groundwater lenses are the source of potable water supply to people on rural areas andalso in urban areas. For urban Tarawa and Kiritimati, piped water systems should be upgradedthrough replacement of components (leaks) that are inefficient, and the system extended tocover people who are not served. After this work has been done, water supplied from thesystem should be metered and users charged. Owners of any building with permanent roof-ing should be encouraged to install and build rain water storage for the building. Importedrain water tanks with capacity greater than 300 litres are not dutiable, however, the more usedconcrete tanks are dutiable through the materials that are used for their construction. Thisdisparity should perhaps be corrected.
Private wells in urban Tarawa should be regularly tested and monitored for biological andchemical pollution, and owners advised of the quality of the water and of steps to improveand maintain quality standard.
Drought must be defined, for South Tarawa, Kiritimati, Banaba, and atolls in the Gilbert. Pa-rameters to be incorporated in the definition will include population, and amount of rainfall ina set period, possibly a month. The definition should capture elements of forecast over longerperiod, say three months.
Coastal Zone and Hazards
Coastal zone management has been strongly advocated as the key planning framework foradaptation. The objectives are to: 1) Avoid development in areas that are vulnerable to inun-dation; 2) Ensure that critical natural systems continue to function; 3) Protect human lives,essential properties and economic activities against the ravage of the seas. Strategies advo-cated are: retreat; accommodation; and protection (IPCC Coastal Zone Management Subgroup.1990).
These strategies should be considered within the overall context of Kiribati, its physical andsocio-economic environment. Infrastructure such as roads and causeways, wharves and portfacilities, institutional buildings, public housing, electric and telecommunication under groundcables, water and sewerage pipes, and airfields are the responsibility of government. Cur-rently the policy is to protect them from coastal erosion, but efforts have not all been success-ful. Because land is very limited protection strategy have been preferred, and where these fail,there has been no option but to allow buildings to crumble into the encroaching sea. As forprivate properties, owners are taking adaptive measures to protect their properties, failing inthese they simply accept their loss.
A Coastal Zone Management Plan should be developed. Protection of important public infra-structure such as parts of the roads should now be planned, including seawall construction.In this connection appropriate designed concrete blocks, instead of coral boulders should bedeveloped. Planting of mangroves around the coast should start. In developing CoastalManagement Plan, wide public participation is an important part of the process. Human ac-tivities that seriously impact on the coastal area, and potential uses of vegetation to protectshorelines are important information for developing the plan. A pilot scheme should start inurban Tarawa, and Kiritimati.
Agricultural System
Traditional agricultural system should be revived, including a reevaluation of traditional valuesystem on products and uses of trees and plants. Economic agricultural policies such as sub-sidies should be re-appraised as they could insidiously undermine Kiribati culture and thetraditional value system underlying agricultural system.

42
Conservation of biodiversity is a good adaptation programme and should be associated witha sharpened recognition of the values of local trees and plants, followed by a new sense ofownership for trees and plants that are currently regarded to be under the ‘commons’ regime.This should increase even more Kiribati peoples sense of value for their land, now clearlyeroding in the face of demonstrative effects of cash economy. But whilst traditional land ten-ure system should be kept, other forms of land rights as already exist in law such as lease-holds could be encouraged among indigenous people.
Trees and plants need to be identified to the species details. There are several species ofcoconut trees, numerous varieties of pandanus trees, few species of breadfruits, several spe-cies of giant taro, and few species of each of the other trees and plants. Uses, and potentialuses should be listed, and their specific preferred growing environment documented.
Adaptation option would involve a clear vision of the use plants and trees, and to selectivelyplant species that best suit a particular physical environment of the land, and a particularpurpose.
Rice, flour, sugar, and even tinned fish have become the preferred diet of Kiribati people. Whilstin urban South Tarawa, this is explained by the dominating cash economy, the situation inrural areas is different. The prices of rice, flour, and sugar are controlled and this could en-courage low price and higher consumption. There may be a need to consider appropriatedisincentive policies on consumption of flour and rise and for incentive policies to promotelocal food.
Subsidy for copra price has been a feature in government policies to raise the standard ofliving of the seemingly more disadvantageous rural people.
Diseases
Health statistics are currently kept by the Health Ministry. Analyses of the data should becarried out, and a detailed study on the impacts of climate change on human health should beundertaken. Different diseases and prevalence rates should be monitored, pathways throughwhich they can spread should also be explained.
The use of traditional medicines should be facilitated. But this should be limited to herbalmedicines from plants and trees that are not known to be poisonous themselves.
People may need to use head gears and sunglasses, and appropriate clothes to protect them-selves from the sun.
Marine Ecosystems
Marine ecosystems are crucially important to the people in the atolls. Yet in Kiribati, there isno effective management system in place to protect the marine and intertidal ecosystems es-pecially corals, sea grasses, fish, sediments and aggregates. In South Tarawa and Kiritimatithese ecosystems are very vulnerable also to excessive exploitation.
One adaptation option is to reestablish a traditional system of ownership and specific rightson coastal areas, including reef patches and shoals. This option appears to be supportedwith some qualifications in a workshop conducted on seven rural atolls of Kiribati. This op-tion merits serious consideration.
Removal of materials from the foreshores can be controlled. This is being done under the lawsthat were framed several decades ago; these laws need to be revised as part of any review ofpractices, including traditional rights, in the management of marine ecosystems.

43
Enhancement programmes for fish stocks, and also corals is desirable. Community participa-tion is important in all stages of the development of any such programme.
4.8 Summary
Adaptation in Kiribati should be based on an integrated and comprehensive approach. Localcommunities should be involved at all stages of the development of an adaptation programmes.A priority area should be coastal and marine areas and an adaptation plan, to be part of aclimate change action plan, should be drawn up, implemented, monitored and regularly up-dated.


Chapter 5
Proposed list of Programmesand brief description of concepts

46
5.1 Climate Change and Sea Level NationalMonitoring Center
IPCC’s scenarios relate to global equilibrium mean temperatures, and global mean sea level.Surprises are not ruled out and occurrences of unpleasant ones should be prevented. Varia-tions in temperature and sea level at regional level from the global scenarios are expected.This is because the current state of knowledge is as yet unable to produce, at equal confi-dence level as with the global scenarios, regional scenarios. But more immediately and ofdirect interest to any country is how it would be affected. Kiribati feels that way.
Vulnerability studies are premised on the global scenarios of mean temperatures and sea levelrise. When these are downscaled by whatever methods, results would be highly controver-sial. On the other hand, when requesting experts to provide scenarios for Kiribati, the advicehas consistently been that Kiribati should monitor the situation.
That being of a scientific interest, Kiribati interest is just to be able to know and sense theportended progressively perilous global environment of which impacts in all assessmentsendanger the very survival of small island states which Kiribati interprets to mean atolls first.
The functions and other details of the center will be developed at an opportune occasion, butthey should be geared to regional and scientific cooperation in understanding the unfoldingclimatic and oceanographic conditions. It should also collaborate with ongoing scientificresearch works in country, and to undertake or cause to be undertaken work on gaps in re-search areas, including analysis and documentation of extreme or unusual atmospheric andoceanographic events that occur in Kiribati.
5.2 Integrated Coastal Zone Management Plan
Incremental cost is the screening measure for climate change project proposals. This impliesthat for any proposal incremental cost attributable to climate change or for implementing theUNFCCC should be less than the global benefit, so that if climate change were in fact notoccurring, a global benefit would in any case have been achieved. From that minimal require-ment, the development and implementation of coastal zone management plan is seen as mostappropriate.
In Kiribati sense, the local benefit from such plan equates to the global benefit since its geo-graphical location and geophysical features make it one among the first countries likely toregister signals and impacts of the sea-level rise for the rest of the world. Coastal structuralmodifications have altered the natural tendency of erosion and accretion patterns, but alsoconclusions from studies converge on the understanding that sea-level rise should causeovertopping of atolls, and modification of otherwise a natural pattern of accretion and erosionunder no climatic and sea level changes. The problem in isolating the contribution of localcoastal modifications from that of the climate change and sea-level rise to the coastal changesin particular erosion is unlikely to be resolved before it will be too late for any useful action tobe taken. Kiribati needs to develop and implement appropriate coastal zone management strat-egies and programmes.
Coastal Zone Plan should consist of integrated components for which responsibilities areallocated to various authorities in line with existing government ministerial portfolios. A co-ordinating committee is essential, and the Climate Change Monitoring Center should be amember.
Details including of projects and activities shall be developed when an opportune time comes.

47
5.3 Public Awareness Programme
Public awareness activities have been undertaken as part of ongoing environmental pro-grammes. Methods of public awareness raising that have been used are workshops, radioprogrammes, a newsletter, school quizz broadcast over radio, and poem and poster competi-tions on environmental themes. These activities have given Kiribati people a fresh senseand view of their environment.
Public awareness on climate change and accelerated sea level rise had been focused on con-cepts, and global actions that are taken to address the problems. When these were explainedat the workshops, a common reaction was an expressed desire to know any actions that gov-ernment intends to undertake locally. There is no concrete answer to offer yet.
Future public awareness activities should be on consolidating and fostering public participa-tion in developing, and implementing climate change activities. Furthermore, public aware-ness should include as an important element, the dissemination of information on researchesand on international consensus on issues, that is, on matters initiated by IPCC and UNFCCCprocesses. Effort should be made to disseminate to policy makers appropriate information,and recommended response measures; the aim is to get acceptance of, and to operationalisethe need to integrate such information on climate change and accelerated sea-level rise intonational policy formulation and planning.
Details of the Programme shall be developed when an opportune time comes.
5.4 Education and Training Programme
Study of the environment should start at home. Kiribati is all ocean and atolls. The celestialsphere is clearly visible as blue sky forming the backdrop of the cloudy otherwise invisibleatmosphere under the powerful sun. At night times, the sky is lighted up part of the times bythe moon and at all the times by twinkling and bluish dominating stars. Education authoritiesshould strengthen the provision of curriculum for junior and secondary schools after widerpublic consultation including with people outside of the education profession.
Atoll environment should be given a little more emphasis in courses at the regional university.Long term scholarship awards for climate change issues should be provided with intakes onthe basis of grades in secondary form 6 achievement.
Short-term specific courses should be designed to meet particular areas of concern of atollcountries as they arise. Some already exist and these need to continue.
Details of this programme shall be developed when opportune time arises.
5.5 Research and Information Dissemination
The UNFCCC requires that there is cooperation in research activities to understand climatechange. Capacity building is important for this cooperation to be meaningful and fruitful.Whilst education and training programme will develop national capacity to collaborate onscientific research, it is also useful for trained nationals to be associated with scientific re-search on aspects of the environment of Kiribati. The tendency so far has been to limit thiscooperation to the collection of raw data in the field, and not to involve nationals in the ana-lytical and interpretive parts of the research. The cooperation should go further to see thatnationals participate in analytic and interpretive work on raw data. Short attachments in a

48
developed country partner by Kiribati nationals or a short attachment in Kiribati by expertsfrom the developed country partner could be a suitable approach to develop this cooperation.
From the earlier chapters of the report it is obvious that much is required to understand theclimate and processes in the atolls. Existing data on Kiribati climate need to be analysed in-cluding identifying gaps in works already done with a view to direct research into new areasfor which raw data is available.
Appropriate and more efficient technologies, as alternative to some existing technologies evenfor domestic appliances, need to be developed.
The human vulnerability and resilience, socio-cultural response to climate change and sealevel rise and to extreme climatic events including droughts, storms, tidal waves, and inunda-tion need to be understood.
Implications of administrative and regulatory policies for mitigating or adapting to climatechange need to be better understood.
Research results should be communicated to policy makers. Technical reports have to besimplified, and copies of the simplified version should be distributed to ministers and secre-taries. Whilst this is achieved in the Executive Summary part of the report, not all technicalreports include this part.
For members of the general public, a workshop to present conclusions in the study would beuseful. Attempts when useful should also be made to translate information into the local lan-guage.
5.6 Greenhouse gas inventory Programme
Inventory of greenhouse gases will be regularly updated. But there are recognised gaps indata, nor there is any centralized data base with regular updating procedures. Data relatingto vegetation covers and land use change are not available, and emission factors based onlocal conditions and different technologies in use in Kiribati are not also available. Emissionsof greenhouse gases from soil and plantations need also to be assessed.
Waste disposal practices should be assessed for their contribution to the greenhouse gasesemissions and for their impacts on water sources and vector diseases.
5.7 Technology transfers Programme
Assessment of the electric generation system in South Tarawa, with regard to optimal effi-ciency of the system relative to other available options even for different types of generatorsand cable distribution should be undertaken.
Information on available technologies and any compliance standards for level of emissions ofgreenhouse gases, if these exist, should be provided to Kiribati.

49
5.8 Water Supplies Programme
Water supplies available in South Tarawa, Kiritimati, and some outer islands are inadequate intimes of drought. Nonetheless there is also loss and leakage in the reticulated system, andfrom roofing catchment areas. Supplemental village wells need to be monitored in a moresystematic way for both health and resource assessment purposes.
Planning and management requirements for water supplies would enhance adaptation meas-ures to address climate change impacts on water. Projects need to be identified and should beconsidered as an important component of a climate change action plan
5.9 Alternative Energy Sources
The demand for electric power is increasing in the urban areas and also in rural atolls. Powerplants in urban areas are becoming inadequate for the growing demand, and increasingly inrural areas small unit generators are being installed by individuals and communities to meettheir needs for lighting and other end uses, such as for video and audio equipment.
Renewable energy from the sunlight, wind and ocean waves need technologies, skills andknowledge that are not readily available in Kiribati. Yet there may be real potential for theseenergy sources to supply future needs for energy in the atoll countries.
Home cooking uses open fire with fuel wood or kerosene stoves. More efficient stoves couldcontribute to the mitigation of climate change.
Kiribati atolls experience many hours of sunshine, unceasing ocean waves, and steady mod-erate winds.
5.10 Public Awareness on Health impacts of climatechange, and appropriate response measures.
Downstream effects of the impacts of climate change would include a changing livestyle toadapt to those impacts. New stresses and diseases are likely to develop, and health educa-tion will be useful to mitigate their effects on the population. Associated with this is a need formore resources to develop and implement effective population policies, and urban physicalplanning policies.

References

Alam,K. & Falkland, A.C. 1997. Vulnerability to Climate Change of the Bonriki FreshwaterLens, Tarawa. ECOWISE Environmental ACTEW Corporation.
Beets,J. 1995. Finfish Resources in Tarawa Lagoon: Documentation of Population Declines.In Abbott, R.R (editors) Management Plan for Tarawa Lagoon, Republic of KiribatiVolume 111: Management Plan. BioSystems Analysis, Inc.
Bijlsma, L., Ehler,C.N., Klein,R.J.T., Kulshrestha, S.M., McLean, R.F., Mimura,N.,
Nicolls,R.J., Nurse,L.A., Pe’rez Nieto,H., Stakhiv,E.Z., Turner,R.K., Warrick,R.A. Coastal Zoneand Small Islands. In Watson,R.T., Zinyowera, M.C., Moss,R.H. (eds.) 1995. ClimateChange 1995 Impacts, Adaptation and Mitigation of Climate Change Scientific-Tech-nical Analyses. IPCC, Cambridge Press.
Coleman,R. 1989. The Hydrodynamics and Sediment Transport A Pilot investigation intothe effects of construction of road links between the islets of North Tarawa Report pre-pared for Australian International Development Assistance Bureau Pacific RegionalTeam. Victorian Institute of Marine Study.
Demmke,A.,Haberkorn,G.,Rakaseta,V.L.,Lepers,C.,Beccalossi,G. 1998. Kiribati PopulationProfile Based on 1995 Census A guide for planners and policy makers. Secretariat ofthe Pacific Community.
Etuati, B 1994. Morphostratigraphy, Coastal Processes and Aggregate Resources in NorthTarawa, Kiribati. Honours degree thesis. Queensland University of Technology, Bris-bane, Australia.
Falkland, A.C. 1992. Republic of Kiribati Review of Tarawa Freshwater Lenses. AustralianInternational Development Assistance Bureau.
Gilmour,A.J. and Colman,R. 1990. Report of a consultancy on A Pilot Environmental StudyOf the Outer Island Development Program Republic of Kiribati. Macquarie University.
Houghton,J.T., Meira Filho,L.G., Callander,B.A., Harris,N.,Kattenberg,A., Maskell, K. (eds.).Climate Change 1995 The Science of Climate Change Contribution of WG1 to the Sec-ond Assessment Report of the Intergovernmental Panel on Climate Change. Intergov-ernmental Panel on Climate Change.
IPCC Coastal Zone Management Subgroup. 1990. Report of the Coastal Zone Manage-ment Subgroup Strategies for Adaptation to Sea Level Rise.
Jones,R. 1998. An Analysis of the Impacts of the Kyoto Protocol on Pacific Island CountriesPart One Identification of Latent Sea-Level Rise within the Climate System at 1995 and2020 A research report prepared for the South Pacific Regional Environment Pro-gramme. CSIRO Atmospheric Research.
Kingston Morrison. 1996. South Tarawa Intergrated Urban Plans and Program Study Fi-nal Report Volume 2 Main Report. Asian Development Bank.
Kiribati Government. 1994. Kiribati National Environmental Management Strategy. SPREP.
Marshall,J.F. and Jacobson,G. 1995. Holocene growth of mid-Pacific atoll: Tarawa, Kiribati.Coral Reefs (1995) 4:11-17

52
McLean, R. 1989. Kiribati and Sea Level Rise Report on a visit to the Republic of Kiribati inMay 1989 to consider implications of a projected rise in sea level in Kiribati at the requestof the Commonwealth Secretariat, Expert Group on Climate Change and Sea Level Rise.Department of Geography and Oceanography, University of New South Wales, Austral-ian Defence Force Academy.
Metai.E. & Tiroa, T. 1998. Inventory of Greenhouse Gs Emissions for Kiribati for the Year1994 Prepared for the Ministry of Environment and Social Development. (unpublished).
Ministry of Home Affairs and Rural Development. 1995. Draft for public Discussion UrbanManagement Plan for South Tarawa, Republic of Kiribati. Executive Summary.
National Planning Office. 1997. Republic of Kiribati Medium Term Strategy An Action Pro-gramme for the National Development Strategy through the year 2000. Ministry of Fi-nance and Economic Planning.
Nurse,L.A., McLean,R.F., and Suarez,A.G. Small Island States. In Watson,R.T., Zinyowera,M.C.,and Moss,R.H. (eds.) 1998. The Regional Impacts of Climate Change An Assess-ment of Vulnerability. WMO and UNEP.
Paulay, G. 1995. Benthic Ecology and Biota of Tarawa Lagoon: Influence of EquatorialUpwelling, Circulation, and Human Predation. In Abbott,R.R (editors) Management Planfor Tarawa Lagoon, Republic of Kiribati Volume 111: Management Plan. BioSystemsAnalysis, Inc.
Paulay,G. and Kerr,A.M. 1995. Coral Reefs and Coral Communities of Tarawa. In Abbott,R.R(editors) Management Plan for Tarawa Lagoon, Republic of Kiribati Volume 111: Man-agement Plan. BioSystems Analysis, Inc.
Porteus,A.S. and Thompson,C.S. 1996. The climate and weather of the Rawaki and NorthernLine Islands of Eastern Kiribati. NIWA Science and Technology Series No.42. The Na-tional Institute of Water and Atmospheric Research Ltd. New Zealand.
Rouatu, I. 1996a). Kiribati Immigration Statistics International Arrivals and Departures (upto 1995). Statistics Office Ministry of Finance.
Rouatu, I. 1996b). Kiribati 1995 International Trade. Statistics Office Ministry of Finance.
Royds Consulting, KPMG Pearl Marwick, and Kab Beriki and Associates. 1996. Sanitationand Public Health Project. Republic of Kiribati (Draft Final Report).
Schofield,J.C. 1997. Late Holocene Sea Level, Gilbert and Ellice Islands, West Central PacificOcean. N.Z. Journal of Geology and Geophysics Vol.20, No.3 (1977):503-29.
Takashi Sawada. Oh! My Motherland Is Sinking into the Sea. A message from The Republicof KIRIBATI. Associazone Casa “Cantico delle Creature”Assisi Italia.
Tebano,T. and Paulay,G. 1995. Variable Recruitment and Changing Environments Create Fluc-tuating Resource: The Biology of Anadara (Bivalvia: Arcidae) in Tarawa. InAbbott,R.R.(editors) Management Plan for Tarawa Lagoon, Republic of Kiribati Vol-ume 111: Management Plan. BioSystems Analysis, Inc.

53
Tererei Abete. 1993. The Kiribati Preliminary Assessment to Accelerated Sea-Level Rise. InMcLean,R. and Mimura,N. (editors) Vulnerability Assessment to Sea-Level Rise andCoastal Zone Management Proceedings of the IPCC Eastern Hemisphere Workshop.IPCC.
Teuatabo, N.and Teitiba, T. 1996. Analysis of Tarawa climate towards the year 2100 and Im-plications of Reports of the Intergovernmental Panel on Climate Change. (Report toKiribati Ministry of Environment and Social Development. Unpublished.)
Thaman, R.R, Clarke, W.E., Tebano,T.,Taniera,T.,and Eritaia,B. 1995. North Tarawa Conser-vation Area South Pacific Biodiversity Conservation Programme Project Preparation Docu-ment. Environment Unit, Ministry of Environment and Social Development, Kiribati.(unpublished.)
Tiroa, T. 1997. Kiribati Report on the 1995 Census of Population Volume 1: Basic Informationand Tables. Statistics Office Ministry of Finance.
U.S.Country Studies Management Team. 1994. U.S. Country Studies Program Guidance forVulnerability and Adaptation Assessments. Version 1.0
Ubaitoi,I and Taeuea,T. 1999. Vulnerability & Adaptation Assessment Report for the Repub-lic of Kiribati. (unpublished.)
Urban/Land Management. 1993. Draft Exhibition Betio Draft Structure and Management Plan.Ministry of Home Affairs and Rural Development.
Wilson, C. 1994. Kiribati State of the Environment Report 1994. South Pacific Regional En-vironment Programme.
Woodroffe, C.D. and McLean,R.F. 1998. Pleistocene morphology and Holocene emergence ofChristmas (Kiritimati) Island, Pacific Ocean Coral Reefs (1998) 17: 235-248.

Annex
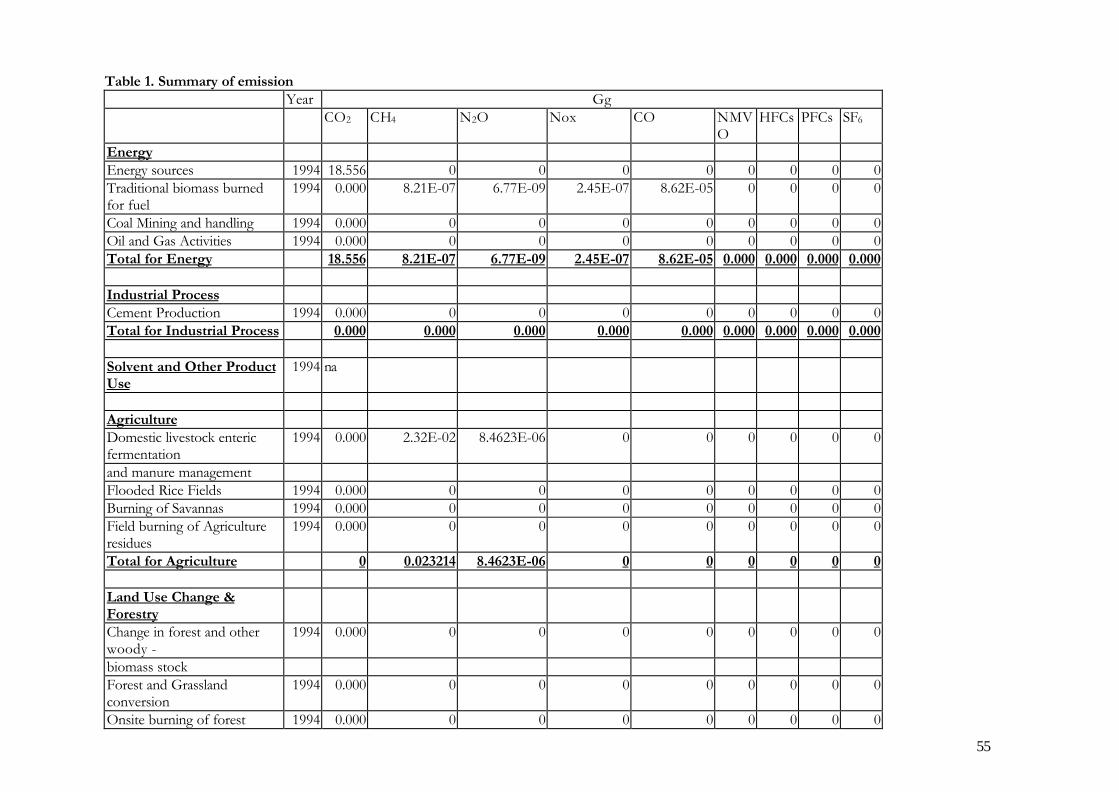
55
Table 1. Summary of emissionYear Gg
CO2 CH4 N2O Nox CO NMVO
HFCs PFCs SF6
EnergyEnergy sources 1994 18.556 0 0 0 0 0 0 0 0Traditional biomass burnedfor fuel
1994 0.000 8.21E-07 6.77E-09 2.45E-07 8.62E-05 0 0 0 0
Coal Mining and handling 1994 0.000 0 0 0 0 0 0 0 0Oil and Gas Activities 1994 0.000 0 0 0 0 0 0 0 0Total for Energy 18.556 8.21E-07 6.77E-09 2.45E-07 8.62E-05 0.000 0.000 0.000 0.000
Industrial ProcessCement Production 1994 0.000 0 0 0 0 0 0 0 0Total for Industrial Process 0.000 0.000 0.000 0.000 0.000 0.000 0.000 0.000 0.000
Solvent and Other ProductUse
1994 na
AgricultureDomestic livestock entericfermentation
1994 0.000 2.32E-02 8.4623E-06 0 0 0 0 0 0
and manure managementFlooded Rice Fields 1994 0.000 0 0 0 0 0 0 0 0Burning of Savannas 1994 0.000 0 0 0 0 0 0 0 0Field burning of Agricultureresidues
1994 0.000 0 0 0 0 0 0 0 0
Total for Agriculture 0 0.023214 8.4623E-06 0 0 0 0 0 0
Land Use Change &ForestryChange in forest and otherwoody -
1994 0.000 0 0 0 0 0 0 0 0
biomass stockForest and Grasslandconversion
1994 0.000 0 0 0 0 0 0 0 0
Onsite burning of forest 1994 0.000 0 0 0 0 0 0 0 0

56
Abandonment of managedland
1994 0.000 0 0 0 0 0 0 0 0
Total for Land Use Change& Forest
0.000 0.000 0.000 0.000 0.000 0.000 0.000 0.000 0.000
WasteLandfills 1994 0.000 0.42517755 0 0 0 0 0 0 0Domestic and Commercialwastewater
1994 0.000 0.00000001 0 0 0 0 0 0 0
Industrial wastewatertreatment
1994 0.000 0 0 0 0 0 0 0 0
Total for Waste 0.000 0.425 0.000 0.000 0.000 0.000 0.000 0.000 0.000
Total for All 18.556 0.4483924 8.46907E-06 2.44859E-07 8.62241E-05 0 0 0 0

57
MODULE ENERGY ENERGYSUBMODULE CO2 FROM ENERGY SOURCES (REFERENCE
APPROACH)CO2 FROM ENERGY SOURCES (REFERENCEAPPROACH)
WORKSHEET 1-1 1-1SHEETS 1 of 5 3 of 5
COUNTRYYEAR
STEP 1 STEP 4 STEP 5 STEP 6A B C D E F L M N O P
Production
Imports Exports International
StockChange
Apparent Carbon
Stored
NetCarbo
n
Fraction of
ActualCarbon
Actual CO2
Bunkers Consumption
Emissions
Carbon
Emissions Emissions
(Gg C) (GgC)
Oxidised
(Gg C) (Gg CO2)
FUEL TYPES F=(A+B-C-D-E)
M=(K-L)
O=(MxN) P=(Ox[44/12])
LiquidFossil
PrimaryFuels
Crude Oil 0.00 0.00 0.00 0.00
Orimulsion 0.00 0.00 0.00 0.00Natural Gas Liquids 0.00 0.00 0.00 0.00
SecondaryFuels
Gasoline 2148635.00
2148635.00
1.35 1.00 1.34 4.91
Jet Kerosene 1260745.00
1260745.00
0.81 1.00 0.81 2.96
OtherKerosene
995824.00
995824.00 0.71 1.00 0.70 2.58
Shale Oil 0.00 0.00 0.00 0.00Gas / DieselOil
5656729.00
5656729.00
2.15 2.15 0.99 2.13 7.82
ResidualFuel Oil
12780.00 12780.00 0.01 0.99 0.01 0.04
LPG 39483.00 39483.00 0.03 0.01 1.00 0.01 0.02Ethane 0.00 0.00 0.00 0.00Naphtha 0.00 0.00 0.00 0.00

58
Bitumen 0.00 0.00 0.00 0.00Lubricants 190937.0
0190937.00 0.06 0.06 0.99 0.06 0.22
PetroleumCoke
0.00 0.00 0.00 0.00
Refinery Feedstocks 0.00 0.00 0.00 0.00Other Oil 0.00 0.00 0.00 0.00
Liquid Fossil Totals 2.24 5.10 5.06 18.56Solid Fossil Primary
FuelsAnthracite(a)
0.00 0.00 0.00 0.00
Coking Coal 0.00 0.00 0.00 0.00Other Bit.Coal
0.00 0.00 0.00 0.00
Sub-bit. Coal 0.00 0.00 0.00 0.00Lignite 0.00 0.00 0.00 0.00Oil Shale 0.00 0.00 0.00 0.00Peat 0.00 0.00 0.00 0.00
SecondaryFuels
BKB & Patent Fuel 0.00 0.00 0.00 0.00
Coke Oven/Gas Coke 0.00 0.00 0.00 0.00Solid Fuel Totals 0.00 0.00 0.00 0.00Gaseous Fossil Natural Gas
(Dry)0.00 0.00 0.00 0.00
Total 2.24 5.10 5.06 18.56Biomass total 0.00 0.00 0.00
SolidBiomass
0.00 0.00 0.00 0.00
LiquidBiomass
0.00 0.00 0.00 0.00
Gas Biomass 0.00 0.00 0.00 0.00
(a) If anthracite is not separately available, include withOther Bituminous Coal.
(a) If anthracite is not separately available, include withOther Bituminous Coal.

59
This spreadsheet contains sheet 2 of Worksheet 4-1, in accordance with the revised 1996 IPCCGuidelines for National Greenhouse Gas Inventories.
MODULE AgricultureSUBMODULE Methane and Nitrous
Oxide Emissions fromDomestic LivestockEntericFermentation and Manure Management
WORKSHEET 4-1SHEET 2 Of 2 Nitrous Oxide
Emissions from AnimalProductionEmissions from Animal Waste Management Systems (AWMS)
COUNTRYYEAR
STEP 4A B C
Nitrogen Excretion EmissionFactor For
Total Annual Emissions
Nex(AWMS) AWMS of N2OEF3
(kg N/yr) (kg N2O–N/kg N)
(Gg)
Animal Waste Management System(AWMS)
C=(AxB)[44/28] / 1 000 000 Anaerobic lagoons 0 0.5 0 Liquid systems 0 0 Daily spread 0 Solid storage &drylot
0 0
Pasture range andpaddock
0
Other 10.7702 0.5 8.4623E-06Total 8.4623E-06

60
This spreadsheet contains sheet 2 of Worksheet 4-1, in accordance with the revised 1996 IPCCGuidelines for National Greenhouse Gas Inventories.
MODULE AgricultureSUBMODULE Methane and Nitrous Oxide Emissions from Domestic Livestock
EntericFermentation and Manure Management
WORKSHEET 4-1SHEET 2 Of 2 Nitrous Oxide Emissions from Animal Production
Emissions From Animal Waste Management Systems (AWMS)COUNTRY
YEARSTEP 4
A B CNitrogen Excretion Emission Factor
ForTotal Annual Emissions
Nex(AWMS) AWMS of N2OEF3
Animal Waste Management System(AWMS)
(kg N/yr) (kg N2O–N/kg N) (Gg)C=(AxB)[44/28] / 1 000 000
Anaerobic lagoons 0 0.5 0 Liquid systems 0 0 Daily spread 0 Solid storage &drylot
0 0
Pasture range andpaddock
0
Other 10.7702 0.5 8.4623E-06Total 8.4623E-06

61
This spreadsheet contains sheet 4 of Worksheet 6-2, in accordance with the revised 1996 IPCC Guidelines for NationalGreenhouse Gas Inventories.
MODULE WasteSUBMODULE Methane Emissions from Domestic and Commercial Wastewater and Sludge TreatmentWORKSHEET 6-2
SHEET 4 Of 4 Estimation of Methane Emissions from Domestic/Commercial Wastewater andSludge
COUNTRYYEAR
STEP 4A B C D E
Total Organic Emission Factor Methane Methane Net MethaneProduct (kg CH4/kg BOD) Emissions Recovered Emissions
(kg BOD/yr) Without and/or Flared (Gg CH4)Recovery/Flaring (kg CH4)
from Worksheet from Worksheet C = (A x B) E = (C - D)/1 000000
6-2, Sheet 1 6-2, Sheets 2 and 3 Wastewater 0.26889954 0.055 0.014789475 0 1.47895E-08 Sludge 0.04745286 0 0 0
Total: 0 1.47895E-08