I Budget S C A L Y E A R - Anne Arundel County, Maryland · janet s. owens county executive anne...
33
Janet S. Owens County Executive Current Expense Budget F I S C A L Y E A R 2 0 0 3 VOLUME 2 Revenue Overview
Transcript of I Budget S C A L Y E A R - Anne Arundel County, Maryland · janet s. owens county executive anne...
Janet S. OwensCounty Executive
Current ExpenseBudget
FISCAL
YEAR
2003
VOLUME 2Revenue Overview
JANET S. OWENSCOUNTY EXECUTIVE
ANNE ARUNDEL COUNTY, MARYLAND
JOHN M. BRUSNIGHAN JOHN R. HAMMONDCHIEF ADMINISTRATIVE OFFICER BUDGET OFFICER
ANNE ARUNDEL COUNTY COUNCIL
BILL D. BURLISONChairperson
PAMELA G. BEIDLEDANIEL E. KLOSTERMAN, JR.
SHIRLEY MURPHYCATHLEEN M. VITALE
BARBARA D. SAMORAJCZYKJOHN J. KLOCKO, III
FISCAL YEAR 2003CURRENT EXPENSE BUDGET

PREPARED BY
THE OFFICE OF BUDGETANNE ARUNDEL COUNTY, MARYLAND
ASSISTANT BUDGET OFFICERSRAYMOND M. ELWELL
FRED C. LICKTEIG
BUDGET AND MANAGEMENT ANALYSTS
CATHLEEN M. CONLYN
HENRY T. FARRELL, JR.
WAYNE R. GREKSA
CAROLYN P. KIRBY
KURT D. SVENDSEN
ADMINISTRATIVE SUPPORTPAT BLEVINS

FY2003 Budget General Fund Revenue Overview Page 1
GENERAL FUND REVENUES SUMMARY
FY2002
• Excluding the appropriated fund balance, General Fund revenues are projected to increase by $33 million (+4.2%). Total General Fund revenues including fund balance are projected to increase by $25.6 million (+3.1%).
• The increase in estimated FY2002 revenues compared to FY2001 actual revenues is largely due to the following increases: (a) property tax revenues (+$11.7 million); (b) grants (+$11.6 million); (c) local income tax (+$10.4 million); (d) recordation and transfer taxes (+$7.2 million); and (e) interfund reimbursements (+$1.5 million). These major increases are partially offset by projected decreases in several revenue categories compared to FY2001, including: (a) an $12.8 million decrease in budgeted fund balance; (b) a $3.7 million decrease in investment income; (c) a $1.9 million decrease in state shared revenues; (d) a $1.7 million decrease in licenses and permit revenues; and (e) other revenues ($1.2 million).
FY2003
• General Fund revenues are projected to increase by $21.8 million (+2.5%). Excluding the appropriated fund balance, revenues are projected to increase by $33.5 million (+4%).
• The estimated $35.2 million increase consists of the following notable changes: local income tax (+$14.2 million); property tax (+$13 million); other revenues (+$2.5 million); licenses and permits (+$2.2 million); sales taxes (+$1.9 million); interfund reimbursements (+$1.3 million); and state-shared revenues (+$0.9 million). These increases are partially offset by decreases in appropriated fund balance revenue (-$11.7 million); grants (-$2.2 million); and recordation and transfer taxes (-$1.5 million).
TABLE 1
General Fund Revenue Summary -- FY2003 Budget
FY2001 Estimated Revenues FY2002-FY2003 ChangeRevenue Classification Revenues FY2002 Revised FY2003 Amount PercentProperty Taxes $342,679,454 $354,386,000 $367,419,000 $13,033,000 3.7% Local Income Tax 257,789,570 268,162,000 282,340,000 14,178,000 5.3% State Shared Revenues 29,537,138 27,645,700 28,589,700 944,000 3.4% Grants & Aid-State/Federal 34,607,900 46,163,500 43,951,600 (2,211,900) (4.8%)Recordation & Transfer 52,854,357 60,026,000 58,521,000 (1,505,000) (2.5%)Local Sales Taxes 26,631,337 25,895,000 27,758,000 1,863,000 7.2% Licenses & Permits 13,313,670 11,600,200 13,795,200 2,195,000 18.9% Investment Income 4,941,677 1,200,000 2,350,000 1,150,000 95.8% Other Reimbursements & Revenues 20,820,747 19,665,000 22,199,500 2,534,500 12.9% Interfund Reimbursements 11,716,888 13,199,100 14,486,400 1,287,300 9.8% Total County Revenues $794,892,738 $827,942,500 $861,410,400 $33,467,900 4.0% Fund Balance (Appropriated) 41,168,700 33,768,000 22,055,900 (11,712,100) (34.7%)Total General Fund Revenues $836,061,438 $861,710,500 $883,466,300 $21,755,800 2.5%

FY2003 Budget General Fund Revenue Overview Page 2
FIGURE 1
TABLE 2 Shares of General Fund Revenues
(Less Appropriated Fund Balance Amounts) FY1991-2003
General Fund Revenues by Major Source -- Percentages of Total Revenues
Local State State & Recor- Fiscal Property Income Shared Federal dation and Other Year Tax Tax Revenues Grants Transfer Tax Revenues Total (3)1991 45.7% 28.7% 5.7% 5.3% 5.0% 9.6% 100.0% 1992 (1) 48.4% 28.3% 4.0% 3.2% 6.0% 10.1% 100.0% 1993 (2) 51.4% 28.5% 3.0% 1.7% 6.5% 8.9% 100.0% 1994 48.6% 28.3% 3.1% 3.8% 7.0% 9.2% 100.0% 1995 48.3% 28.4% 3.2% 4.1% 5.7% 10.3% 100.0% 1996 47.9% 28.3% 3.1% 4.4% 5.8% 10.5% 100.0% 1997 47.6% 29.3% 3.1% 3.9% 5.5% 10.6% 100.0% 1998 46.1% 30.6% 3.4% 3.7% 6.2% 10.0% 100.0% 1999 43.9% 32.3% 3.5% 3.7% 7.0% 9.6% 100.0% 2000 42.7% 32.9% 3.4% 3.6% 6.8% 10.6% 100.0% 2001 43.1% 32.4% 3.7% 4.4% 6.6% 9.8% 100.0% 2002E 42.8% 32.4% 3.3% 5.6% 7.3% 8.6% 100.0% 2003E 42.7% 32.8% 3.3% 5.1% 6.8% 9.3% 100.0%
FY2003 Operating Budget Revenues (less Fund Balance) -- $861,410,400
Recordation and Transfer Tax
6.8%
State Shared Revenue 3.3%
Miscellaneous Revenues 9.3%
Local Income Tax 32.8%
Property Taxes 42.7%
Federal and State Grants 5.1%

FY2003 Budget General Fund Revenue Overview Page 3
PROPERTY TAXESFiscal Year Amount Increase/(Decrease) Percent Change
2000 Actual $328,708,724 $14,301,071 4.6% 2001 Actual 342,679,454 13,970,730 4.3% 2002 Budget Estimate 352,010,000 9,330,546 2.7% 2002 Revised Estimate 354,386,000 11,706,546 3.4% 2003 Budget Estimate 367,419,000 13,033,000 3.7%
FY2002-2003 Revenue Estimates
The revised estimate of total FY2002 revenues is $11.7 million (+3.4%) more than FY2001 actual revenues. Current year revenues are estimated to increase by $14.2 million (+4.1%). Net current year credits are estimated to increase by $1.3 million (+17%) due primarily to increases in the homestead property tax credit program. Other miscellaneous property tax revenues, primarily from charges for the semiannual property tax payment program, are projected to hold steady. The 1998 General Assembly enacted legislation requiring homeowners to pay real property taxes on principal residences in semiannual installments unless they opt to make a single payment. This change dramatically increased the number of homeowners making semiannual property tax payments. The legislation also authorizes counties to charge a service fee at the time the second installment is due (December 31), although property owners could pay both installments on or before the first due date (September 30) and avoid the service fee. The service fees offset reduced investment income because the county will not have the funds to invest for the three months, from October through December. The FY2002 property tax revenue estimates include $1.2 million from semiannual payment fees, compared to $1.3 million in FY2001 and to $0.3 million in FY2000. FY2003’s total property tax revenues are projected to increase by $13 million (+3.7%). FY2003’s current year real property taxes are estimated to increase by $16 million, which is partially offset by increases in current year property tax credits totaling $4.3 million. Total FY2003 credits are projected to increase by $4.3 million (+50%), primarily as a result of increases in the Homestead (104%) Property Tax Credit Program and a change to the County Supplement to the Homeowners Property Tax Credit Program.
FY2003 Property Tax Revenue Limitation (“Tax Cap”) Summary
The FY2003 budget is the tenth budget after the Property Tax Revenue Limit approved by county voters in November 1992. The limit's provisions and its impact on FY2003 revenues can be summarized as follows:
Ø The percentage change of property tax revenues from properties on the rolls at the commencement of the fiscal year ("existing properties") cannot be more than the change in the Consumer Price Index ("CPI"), or 4.5%, whichever is less.
Ø The Washington-Baltimore Metropolitan Area's January 2002 CPI was 1.84% greater than the January 2001 CPI. This is the maximum percentage increase allowed for revenues from existing properties in FY2003.
Ø Estimated FY2002 property tax revenues subject to the limit are $353.5 million. This is the base for estimating the allowable revenue amount for FY2003.
Ø The increase in FY2003 revenues, excluding revenues from new construction added to the property tax rolls, cannot exceed $6.5 million (1.84% of $353.5 million).
Ø The estimated FY2003 growth rate of the existing properties assessable base (net of credits) is 3%. If current property tax rates are applied to the FY2003 net amount, an additional $10.8 million of additional revenues will be generated, which is $4.3 million more than the allowable increase ($6.5 million).
Ø The FY2003 budget includes a decrease of property tax rates from $0.96 to $0.95 for property located outside of Annapolis and from $0.556 to $0.55 for property located within Annapolis. The adopted budget’s FY2003 tax rates together with an increase in property tax credits that would result from a change in the County Supplement to the Homeowners Property Tax Credit

FY2003 Budget General Fund Revenue Overview Page 4
would generate an additional $6.3 million of additional revenues, which is less than the allowable $6.5 million increase.
“Truth in Taxation” Legislation
Chapter 80 (SB 626) was enacted by the 2000 General Assembly. As a result of this legislation, real property was converted to full-value (100%) for assessment purposes and the tax rates on real property were reduced by 60% on October 1, 2000. Consequently, the enacted FY2001 $2.40 county tax rate was changed to $0.96 for real property taxation purposes on that date. Personal property tax rates did not change, however, and are set at 2.5 times the real property tax rate. As a consequence, per penny property tax yields have risen substantially and there are now four tax rates for property in the county, depending on the type (real or personal) and location (inside or outside Annapolis). There are also now two Annapolis tax differential amounts (see below).
Electricity Deregulation – Impact on FY2003 Public Utility Property Assessable Base
Chapter 6 (HB 366) enacted by the 1999 General Assembly session phased in over a two-year period a 50% exemption for personal property that is machinery or equipment used to generate electricity for sale. Under previous law, this type of personal property was assessed at 100%. This property tax exemption resulted in an estimated reduction in utility personal property assessable base in the current year (FY2002) of approximately $381 million, which reduced revenues by an estimated $9.1 million. A large portion of the revenue reduction is offset by a $7.8 million state electricity deregulation grant to the county.
FY2002-2003 Assessable Base
The county’s FY2003 assessable tax base is projected to increase by 6% to $38.3 billion from an estimated FY2002 level of $36 billion. The real property base is expected to increase by 7%, which is the largest percentage increase in the last nine years. On the other hand, according to estimates by the State Department of Assessments and Taxation, the county’s personal property base is expected to be relatively unchanged at $2.4 billion.
TABLE 3
Anne Arundel County Assessable BaseFY1991-2000 Actual & FY2001-2002 Estimated
Real Property Personal Property Total Property
Fiscal Amount Percent Amount Percent Amount Percent Year (mill.) Change (mill.) Change (mill.) Change
1991 18,449.9 14% 1,487.6 6% 19,937.5 13% 1992 21,131.0 15% 1,544.9 4% 22,675.9 14% 1993 23,753.3 12% 1,960.0 27% 25,713.3 13% 1994 25,551.6 8% 1,985.8 1% 27,537.4 7% 1995 26,404.7 3% 2,074.3 4% 28,479.0 3% 1996 27,052.5 2% 2,187.7 5% 29,240.2 3% 1997 27,734.2 3% 2,305.0 5% 30,039.2 3% 1998 28,404.3 2% 2,340.6 2% 30,744.9 2% 1999 29,298.1 3% 2,383.3 2% 31,681.5 3% 2000 30,322.7 3% 2,532.4 6% 32,855.1 4% 2001 31,777.1 5% 2,409.1 (5%) 34,186.2 4%
2002E 33,557.8 6% 2,436.4 1% 35,994.2 5% 2003E 35,893.8 7% 2,428.5 (0%) 38,322.2 6%

FY2003 Budget General Fund Revenue Overview Page 5
The following table summarizes property tax rates and property tax data for homeowner-occupied properties:
TABLE 4 Summary of FY2002 and FY2003 Property Tax Rates and Related Data
Outside Annapolis
Within Annapolis
1. FY2002 tax rates (real property / personal property) $0.96 / $2.40 $0.556 / $1.39
2. FY2002 tax differential (real property / personal property) $0.404 / $1.01 3. FY2002 average property tax bill for homeowner-occupied
property
$1,607
$903 4. FY2002 property tax yield per penny $3,553,500 $286,000 5. FY2003 tax rates (real property / personal property) $0.95 / $2.375 $0.55 / $1.375 6. FY2003 tax differential $0.40 / $1.00 7. FY2003 average property tax bill for homeowner occupied
property
$1,635
$913 8. $ and percent changes from FY2002 average tax bill $28 / +1.7% $10/ +1.1% 9. FY2003 average full (market) value of homeowner occupied
property $177,800 $174,500
10. FY2003 average taxable value of homeowner occupied property (full value minus average homestead tax credit)
$172,100 $166,000
11. Effect of 1¢ change ($ and %) on average property tax bill $17 / 1% $16 / 1.8% 12. FY2003 property tax yield per penny $3,714,500 $298,000
Annapolis Tax Differential
The calculated FY2003 Annapolis tax differentials (i.e., the property tax rates for services that the county provides only outside Annapolis and that Annapolis provides for itself) using amounts in the County Executive’s proposed budget are $0.38 for real property and $0.95 for personal property. The calculated real property rate differential is $0.02 less than the adopted FY2002 real property tax differential ($0.40). The calculated personal property rate differential is $0.05 less than the adopted FY2002 personal property tax differential ($1.00).

FY2003 Budget General Fund Revenue Overview Page 6
The following table shows the history of property tax rates and yields per penny from the property tax:
TABLE 5 Property Tax Rate History – Rates and Yield Per Penny
FY1991 - FY2003
Change in Revenue
Fiscal County Tax Rates in Tax Revenue Yield per 1 ¢Year Tax Rates Annapolis Differentials Yield @ 1 ¢ Amount Percent
1991 2.46 1.31 1.15 885,200 72,800 9% 1992 2.46 1.31 1.15 978,500 93,300 11% 1993 2.46 1.31 1.15 1,106,000 127,500 13% 1994 2.38 1.15 1.23 1,162,300 56,300 5% 1995 2.35 1.23 1.12 1,211,100 48,800 4% 1996 2.38 1.29 1.09 1,257,800 46,700 4% 1997 2.38 1.37 1.01 1,299,750 41,950 3% 1998 2.38 1.37 1.01 1,340,200 40,450 3% 1999 2.36 1.35 1.01 1,382,600 42,400 3% 2000 2.36 1.35 1.01 1,430,000 47,400 3% 2001 0.96 / 2.40 0.556 / 1.39 0.404 / 1.01 3,673,500 2,243,500 157% 2002 0.96 / 2.40 0.556 / 1.39 0.404 / 1.01 3,839,500 166,000 5%
2003E 0.95 / 2.375 0.55 / 1.375 0.40 / 1.00 4,012,500 173,000 5%
FY2003 Budget General Fund Revenue Overview Page 7
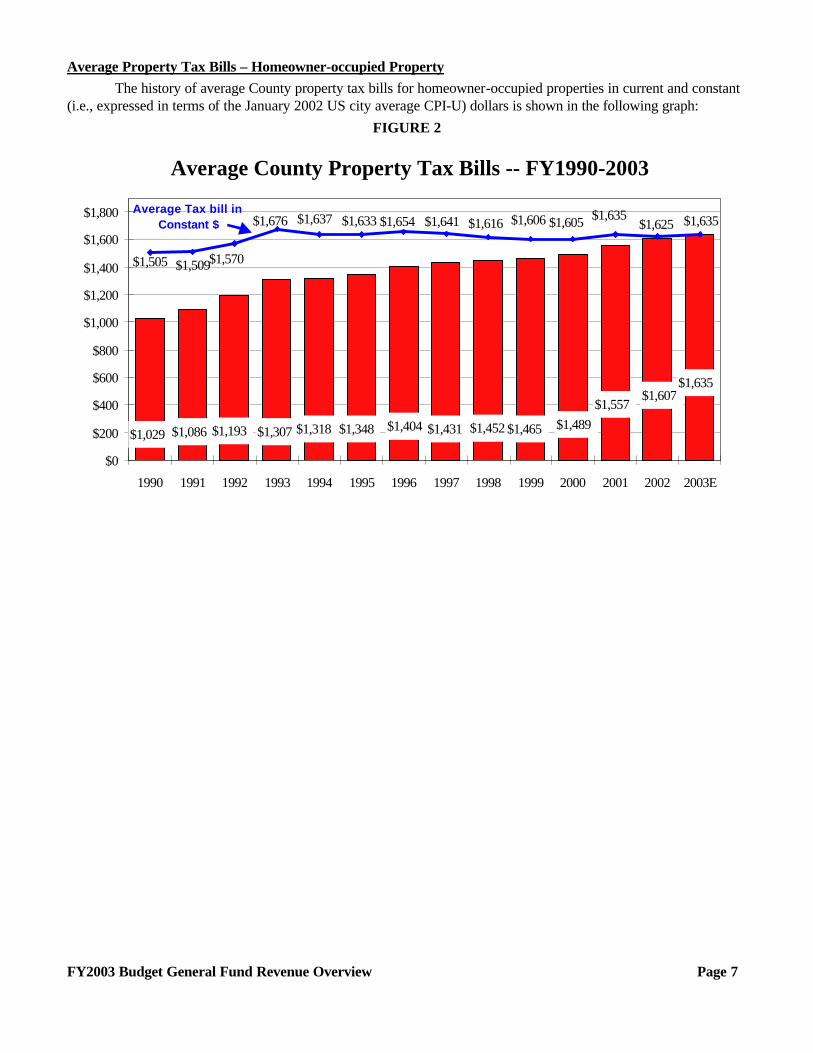
Average Property Tax Bills – Homeowner-occupied Property
The history of average County property tax bills for homeowner-occupied properties in current and constant (i.e., expressed in terms of the January 2002 US city average CPI-U) dollars is shown in the following graph:
FIGURE 2
Average County Property Tax Bills -- FY1990-2003
$1,635
$1,404$1,029 $1,086 $1,193 $1,307 $1,318 $1,348 $1,431 $1,452 $1,465 $1,489
$1,557$1,607
$1,635
$1,625$1,635$1,605$1,606$1,616$1,641$1,654$1,633$1,637$1,676
$1,570$1,509$1,505
$0
$200
$400
$600
$800
$1,000
$1,200
$1,400
$1,600
$1,800
1990 1991 1992 1993 1994 1995 1996 1997 1998 1999 2000 2001 2002 2003E
Average Tax bill in Constant $

FY2003 Budget General Fund Revenue Overview Page 8
LOCAL INCOME TAXFiscal Year Amount Increase/(Decrease) Percent Change
2000 Actual $253,197,128 $22,170,458 10.9% 2001 Actual 257,789,570 4,592,442 1.8% 2002 Budget Estimate 276,446,000 18,656,430 7.2% 2002 Revised Estimate 268,162,000 10,372,430 4.0% 2003 Budget Estimate 282,340,000 14,178,000 5.3%
Historically, strong annual income tax growth rates averaged more than 10% throughout most of the 1980’s. However, the 1990’s saw modest employment and personal income growth, which brought income tax growth rates down dramatically from the 1980’s. The past few years have exhibited a resurgent healthy growth rate due to capital gains income as a result of the booming stock market and a change in federal income tax treatment of capital gains income.
Local income tax revenues consist of two components: (a) distributions of quarterly withholdings and estimated income tax payments; and (b) other miscellaneous distributions, including penalty and interest payments, delinquent filings, fiduciary returns and previous tax year distributions from tax returns filed on or before April 15th. Over the past several years, the former component has accounted on average for about 85% of total revenues. Furthermore, the second component, though relatively much smaller, has historically shown great variability, as shown clearly in the following table:
TABLE 6 Historical Changes in Income Tax Revenues
FY1990-2000
Fiscal Quarterly With- Other Misc.Year holding Distrib. Distributions1991 3.1% (11.2%)1992 2.0% 12.0% 1993 9.1% (4.5%)1994 6.2% 1.9% 1995 6.0% 2.6% 1996 2.5% 21.2% 1997 5.3% 31.1% 1998 12.9% 6.4% 1999 6.6% 38.3% 2000 11.9% 3.8% 2001 6.0% 3.3%
State and Local Income Tax Simplification Enacted by 1999 General Assembly
Under the provisions of Chapter 493 enacted by the 1999 General Assembly, the local income tax rates for Anne Arundel County taxpayers’ taxable income are 2.53% for CY2002 and 2.56% for CY2003 and after. The legislation’s intended effect is to simplify the calculation of local income taxes by taxpayers when they complete their state income tax forms. Most notably, county taxpayers now use one personal exemption amount to determine both their state and local income tax liability. The legislation was enacted with the intent that it will generate the same amount of income tax revenue for the county as previous income tax law. There are no changes in current local income tax rates in the FY2003 budget.
FY2002 Revised Estimate
The estimated FY2001 actual to revised FY2002 income tax growth rate is 4%. However, after adjusting FY2001’s receipts for a one-time deduction of $9.4 million by the State Comptroller’s Office for erroneous

FY2003 Budget General Fund Revenue Overview Page 9
distributions of fiduciary return income taxes to the county over the previous three years, the adjusted estimated FY2001-FY2002 increase is 0.4%. The revised FY2002 estimates have been reduced by $8.3 million (-3%) from the original budget estimate because of the experience to date. Total receipts through March have only increased by 1.9% compared to the same period last year. The first two quarterly distributions of withholdings and estimated payments in November and February decreased almost 1% from last year’s distributions. Actual growth to date is therefore substantially under the original budget estimate of 7.2% (3.5% adjusted basis) growth. The decreased estimate is consistent with the State Board of Revenue Estimates’ forecasts of slumping state and local income tax revenues during the current fiscal year. The BRE’s March 2002 estimate for FY2002 state income tax is a 0.6% decline from FY2001. The county’s estimated FY2002 and FY2003 projected percentage changes are shown in the following table:
TABLE 7 Estimated Changes in Income Tax Revenues
FY2002-2003
Fiscal Quarterly With- Other Misc.Year holding Distrib. Distributions
2002 Budget 6.6% (11.0%)2002 Revised 0.6% (0.5%)
2003 Estimated 5.8% 3.1% The downward revision in the estimated growth rate for quarterly withholding distributions from 6.6% (original budget) to 0.6% (revised estimate) is based on the first two quarterly withholding income tax distributions though February 2002 received by the county from the State Comptroller’s Office, which were almost 1% less than the same period last year. The readily apparent reason for this year’s experience to date are a decline in estimated payments by taxpayers with capital gains. During the most recent three quarters (April through December of 2001), total statewide estimated payments received by the Comptroller’s Office decreased by 10.4%. The State Board of Revenue Estimates’ December 2001 report points out that capital gains declared by Maryland taxpayers, after almost quadrupling between 1994 and 1999, and after increasing by another 15% in 2000, are now estimated to decline by 35%-45% between 2001 and 2003. Therefore, FY2003’s capital gains could revert back to the level in 1997.
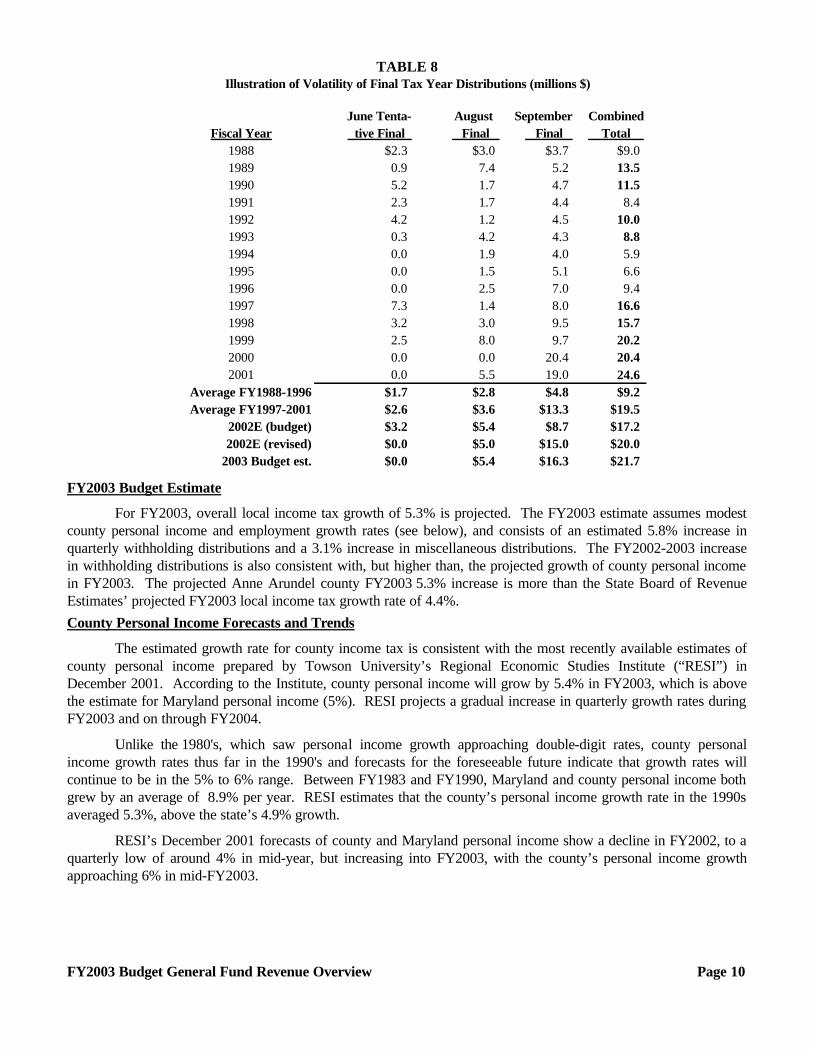
Consequently, there is good reason to be cautious about the remaining distributions for the year. Three separate “adjusting” distributions, representing payments by county taxpayers as part of their 2001 tax return filings, will be received between June and September later in (and in some cases, after the end of) this fiscal year. The three adjusting distributions traditionally account for more than half of the “other miscellaneous distributions” category described above (see Table 6). The FY2002 revised estimate for the three distributions ($20 million) is equal to the average of the past five years, each of which was the largest amounts ever received. The following table shows the volatility of these three separate distributions over the past several years:
FY2003 Budget General Fund Revenue Overview Page 10
TABLE 8 Illustration of Volatility of Final Tax Year Distributions (millions $)
June Tenta- August September CombinedFiscal Year tive Final Final Final Total
1988 $2.3 $3.0 $3.7 $9.01989 0.9 7.4 5.2 13.51990 5.2 1.7 4.7 11.51991 2.3 1.7 4.4 8.41992 4.2 1.2 4.5 10.01993 0.3 4.2 4.3 8.81994 0.0 1.9 4.0 5.91995 0.0 1.5 5.1 6.61996 0.0 2.5 7.0 9.41997 7.3 1.4 8.0 16.61998 3.2 3.0 9.5 15.71999 2.5 8.0 9.7 20.22000 0.0 0.0 20.4 20.42001 0.0 5.5 19.0 24.6
Average FY1988-1996 $1.7 $2.8 $4.8 $9.2Average FY1997-2001 $2.6 $3.6 $13.3 $19.5
2002E (budget) $3.2 $5.4 $8.7 $17.22002E (revised) $0.0 $5.0 $15.0 $20.0
2003 Budget est. $0.0 $5.4 $16.3 $21.7
FY2003 Budget Estimate
For FY2003, overall local income tax growth of 5.3% is projected. The FY2003 estimate assumes modest county personal income and employment growth rates (see below), and consists of an estimated 5.8% increase in quarterly withholding distributions and a 3.1% increase in miscellaneous distributions. The FY2002-2003 increase in withholding distributions is also consistent with, but higher than, the projected growth of county personal income in FY2003. The projected Anne Arundel county FY2003 5.3% increase is more than the State Board of Revenue Estimates’ projected FY2003 local income tax growth rate of 4.4%.
County Personal Income Forecasts and Trends
The estimated growth rate for county income tax is consistent with the most recently available estimates of county personal income prepared by Towson University’s Regional Economic Studies Institute (“RESI”) in December 2001. According to the Institute, county personal income will grow by 5.4% in FY2003, which is above the estimate for Maryland personal income (5%). RESI projects a gradual increase in quarterly growth rates during FY2003 and on through FY2004.
Unlike the 1980's, which saw personal income growth approaching double-digit rates, county personal income growth rates thus far in the 1990's and forecasts for the foreseeable future indicate that growth rates will continue to be in the 5% to 6% range. Between FY1983 and FY1990, Maryland and county personal income both grew by an average of 8.9% per year. RESI estimates that the county’s personal income growth rate in the 1990s averaged 5.3%, above the state’s 4.9% growth.
RESI’s December 2001 forecasts of county and Maryland personal income show a decline in FY2002, to a quarterly low of around 4% in mid-year, but increasing into FY2003, with the county’s personal income growth approaching 6% in mid-FY2003.

FY2003 Budget General Fund Revenue Overview Page 11
The following graph shows Towson University's quarterly Anne Arundel County and Maryland personal income growth rates for FY1986-2005:
FIGURE 3
County Employment Trends
Recent county and State of Maryland employment data indicates steady employment growth. County employment regained FY1990’s peak employment level in FY1993, and increased fairly steadily until early FY1997. County employment declined after FY1997 and did not reach the same level until the mid-FY2000, and has continued to increase at a fairly steady rate since then. The number of jobs reported by Anne Arundel County employers grew steadily since mid-FY1996, and remained steady at about 200,000 jobs during the most recent reported nine month period (January through September of 2001). During this period job growth averaged 4%, down from the previous fiscal year, whose 5.2% increase was the highest since the mid to late 1980’s. The county’s unemployment rate reached a peak of close to 6% in late FY1992, reached the same level in late FY1993, and declined until FY1995. The rate remained steady until late FY1998, after which it started again to decline to less than 3%. It was under 3% from FY1999 through late FY2002, and has been increasing in the past year since last May. The most recent data for February 2002 shows that the county’s unemployment rate was 4.1%, and is almost a full percentage point under the state’s rate and two percentage points under the rate for the entire US. The trends of county employment and unemployment rates since the early 1990s are shown in the following two graphs:
Quarterly Maryland and Anne Arundel County Personal Income Changes -- FY1986-2005
0%
2%
4%
6%
8%
10%
12%
FY1986FY1987
FY1988FY1989
FY1990FY1991
FY1992FY1993
FY1994FY1995
FY1996FY1997
FY1998FY1999
FY2000FY2001
FY2002FY2003
FY2004FY2005
Maryland (history)
AA County (history)
Maryland forecasted (RESI 12-2001)
AA Co forecasted (RESI 12-2001)

FY2003 Budget General Fund Revenue Overview Page 12
FIGURE 4
Anne Arundel Co. Monthly Employment -- FY1999-2002 (seasonally adjusted)
160,000
180,000
200,000
220,000
240,000
260,000
FY1999 FY2000 FY2001 FY2002
Employed AA Co. ResidentsJobs in AA County
FIGURE 5
Anne Arundel County, Maryland and US Monthly Unemployment Rates FY1991-2002 (seasonally adjusted)
0%
2%
4%
6%
8%
10%
FY1991 FY1992 FY1993 FY1994 FY1995 FY1996 FY1997 FY1998 FY1999 FY2000 FY2001 FY2002
Anne Arundel Co. Unemployment Rate
Maryland Unemployment Rate US Unemployment Rate
County Employment Forecasts
In addition to their forecasts of county personal income, the Regional Economic Studies Institute also provides forecasts of county employment. RESI’s December 2001 report forecasts county employment growth rates of 2.3% in FY2002 (down from 4.5% in FY2001), but increasing to almost 3% in FY2003 and FY2004.

FY2003 Budget General Fund Revenue Overview Page 13
STATE SHARED REVENUESFiscal Year Amount Increase/(Decrease) Percent Change
2000 Actual $26,128,151 $943,990 4.2% 2001 Actual 29,537,139 3,408,988 13.0% 2002 Budget Estimate 27,036,900 (2,500,239) (8.5%)2002 Revised Estimate 27,645,700 (1,891,439) (6.4%)2003 Budget Estimate 28,589,700 944,000 3.4%
FY2002 revenues are projected to decrease slightly because FY2001’s revenues included $1.8 million of additional receipts due to a one-time accrual adjustment, consisting of $0.5 million of admission and amusement taxes and $1.3 million of highway user revenues that are shared by the state with local subdivisions. If these amounts are excluded from FY2001’s revenues, the FY2002’s revenues are approximately the same as FY2001’s receipts because of lowered highway user revenues during the last part of FY2002 as higher gasoline prices take effect. The admissions and amusement tax has experienced healthy growth in the movie and coin-operated amusement device categories with the opening of Arundel Mills. In FY2003, state shared revenues are projected to increase by $0.9 million (+3.4%), 80% of which is due to an increase in highway user revenues, with the balance of the increase from admissions and amusement taxes.
GRANTS AND AID - STATE/FEDERALFiscal Year Amount Increase/(Decrease) Percent Change
2000 Actual $27,454,091 $1,253,980 5.1% 2001 Actual 34,607,900 7,153,809 26.1% 2002 Budget Estimate 45,533,300 10,925,400 31.6% 2002 Revised Estimate 46,163,500 11,555,600 33.4% 2003 Budget Estimate 43,951,600 (2,211,900) (4.8%)
The grants and aid category is projected to increase by $11.6 million (+33.4%) in FY2002. The following areas comprise most of the increase: (a) additional state grants to the Health Department, most notably a drug treatment program funded with the state’s tobacco-settlement monies (up $3.4 million, or +35.6%); (b) a doubling of the state electricity deregulation grant as noted above under property tax revenues (+$3.9 million); (c) additional state grants to the Department of Social Services (+$1.9 million) and increases in Health Department Federal grants (+$1.3 million).
In FY2003 grant revenues are expected to decrease to $44 million (-4.8%). The decrease from FY2002 is due to elimination of Circuit Court child support enforcement grants as a result of the transfer of Domestic Relations to the state. This decrease is partially offset by increases in other grant areas, notably health and social services grants.
RECORDATION AND TRANSFER TAXESFiscal Year Amount Increase/(Decrease) Percent Change
2000 Actual $52,159,563 $2,334,948 5.6% 2001 Actual 52,854,357 694,794 1.3% 2002 Budget Estimate 51,925,000 (929,357) (1.8%)2002 Revised Estimate 60,026,000 7,171,643 13.6% 2003 Budget Estimate 58,521,000 (1,505,000) (2.5%)
Recordation and Transfer tax revenues are without question the most erratic of all of the county’s major General Fund revenue sources. The experience of the past several years has amply borne out this fact. Since FY1980, fourteen years have seen increases, averaging more 20%. On the other hand, during that same period, eight years had decreases, averaging 10%. Using FY2001 actual revenues for comparison, that swing (plus 20% and
FY2003 Budget General Fund Revenue Overview Page 14
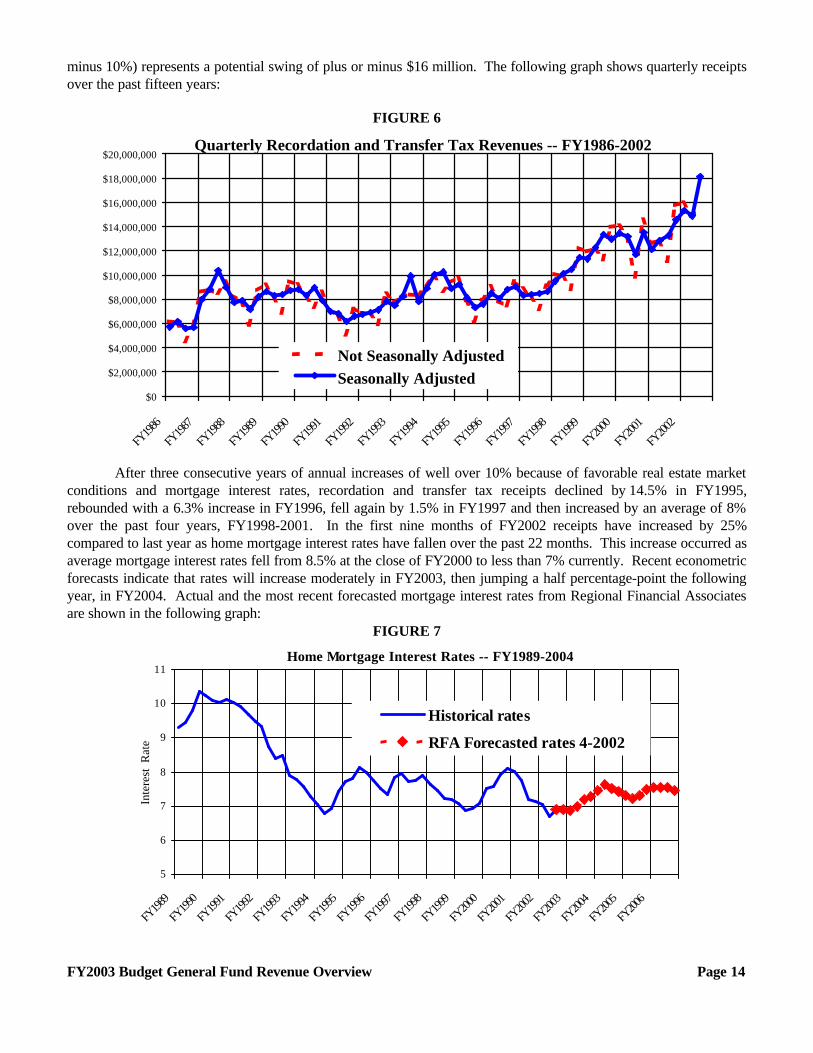
minus 10%) represents a potential swing of plus or minus $16 million. The following graph shows quarterly receipts over the past fifteen years:
FIGURE 6
Quarterly Recordation and Transfer Tax Revenues -- FY1986-2002
$0
$2,000,000
$4,000,000
$6,000,000
$8,000,000
$10,000,000
$12,000,000
$14,000,000
$16,000,000
$18,000,000
$20,000,000
FY19
86
FY19
87
FY19
88
FY19
89
FY19
90
FY19
91
FY19
92
FY19
93
FY19
94
FY19
95
FY19
96
FY19
97
FY19
98
FY19
99
FY20
00
FY20
01
FY20
02
Not Seasonally Adjusted
Seasonally Adjusted
After three consecutive years of annual increases of well over 10% because of favorable real estate market conditions and mortgage interest rates, recordation and transfer tax receipts declined by 14.5% in FY1995, rebounded with a 6.3% increase in FY1996, fell again by 1.5% in FY1997 and then increased by an average of 8% over the past four years, FY1998-2001. In the first nine months of FY2002 receipts have increased by 25% compared to last year as home mortgage interest rates have fallen over the past 22 months. This increase occurred as average mortgage interest rates fell from 8.5% at the close of FY2000 to less than 7% currently. Recent econometric forecasts indicate that rates will increase moderately in FY2003, then jumping a half percentage-point the following year, in FY2004. Actual and the most recent forecasted mortgage interest rates from Regional Financial Associates are shown in the following graph:
FIGURE 7
Home Mortgage Interest Rates -- FY1989-2004
5
6
7
8
9
10
11
FY19
89
FY19
90
FY19
91
FY19
92
FY19
93
FY19
94
FY19
95
FY19
96
FY19
97
FY19
98
FY19
99
FY20
00
FY20
01
FY20
02
FY20
03
FY20
04
FY20
05
FY20
06
Inte
rest
Rat
e
Historical rates
RFA Forecasted rates 4-2002
FY2003 Budget General Fund Revenue Overview Page 15
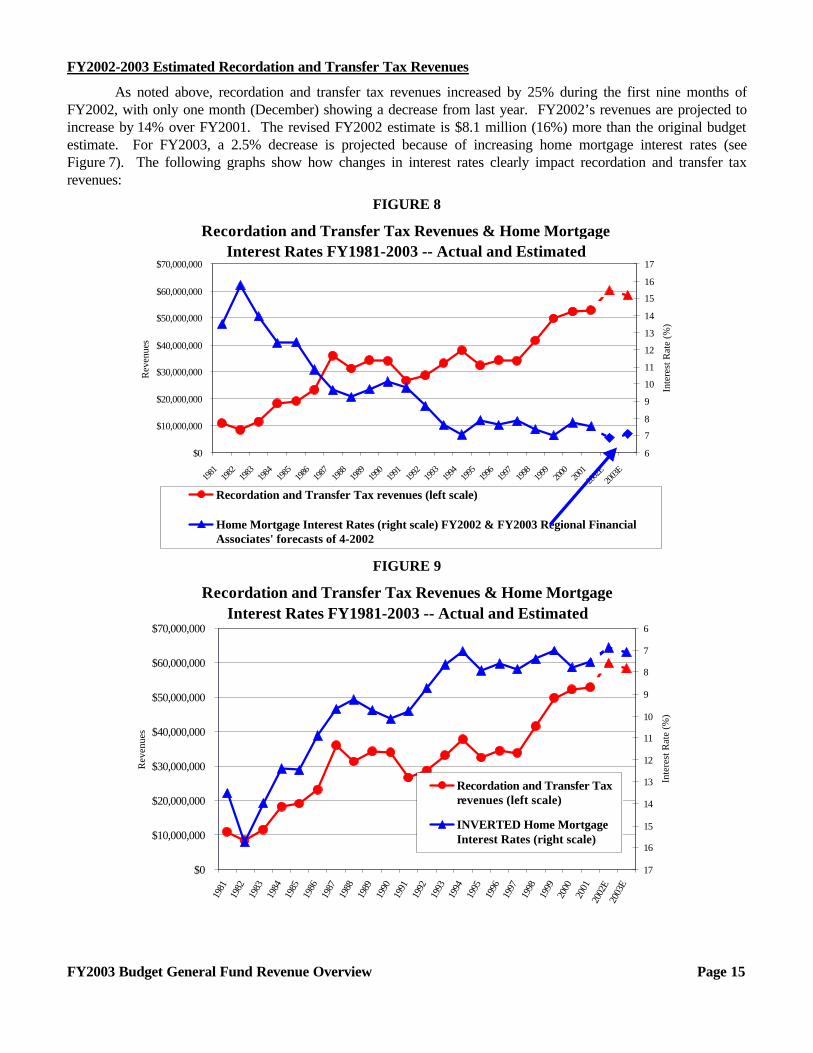
FY2002-2003 Estimated Recordation and Transfer Tax Revenues
As noted above, recordation and transfer tax revenues increased by 25% during the first nine months of FY2002, with only one month (December) showing a decrease from last year. FY2002’s revenues are projected to increase by 14% over FY2001. The revised FY2002 estimate is $8.1 million (16%) more than the original budget estimate. For FY2003, a 2.5% decrease is projected because of increasing home mortgage interest rates (see Figure 7). The following graphs show how changes in interest rates clearly impact recordation and transfer tax revenues:
FIGURE 8
Recordation and Transfer Tax Revenues & Home Mortgage Interest Rates FY1981-2003 -- Actual and Estimated
$0
$10,000,000
$20,000,000
$30,000,000
$40,000,000
$50,000,000
$60,000,000
$70,000,000
1981
19
82
1983
19
84
1985
19
86
1987
19
88
1989
19
90
1991
19
92
1993
19
94
1995
19
96
1997
19
98
1999
20
00
2001
2002
E20
03E
Rev
enue
s
6
7
8
9
10
11
12
13
14
15
16
17
Inte
rest
Rat
e (%
)
Recordation and Transfer Tax revenues (left scale)
Home Mortgage Interest Rates (right scale) FY2002 & FY2003 Regional FinancialAssociates' forecasts of 4-2002
FIGURE 9
Recordation and Transfer Tax Revenues & Home Mortgage Interest Rates FY1981-2003 -- Actual and Estimated
$0
$10,000,000
$20,000,000
$30,000,000
$40,000,000
$50,000,000
$60,000,000
$70,000,000
1981
19
82
1983
19
84
1985
19
86
1987
19
88
1989
19
90
1991
19
92
1993
19
94
1995
19
96
1997
19
98
1999
20
00
2001
20
02E
2003
E
Rev
enue
s
6
7
8
9
10
11
12
13
14
15
16
17
Inte
rest
Rat
e (%
)
Recordation and Transfer Taxrevenues (left scale)
INVERTED Home MortgageInterest Rates (right scale)
FY2003 Budget General Fund Revenue Overview Page 16
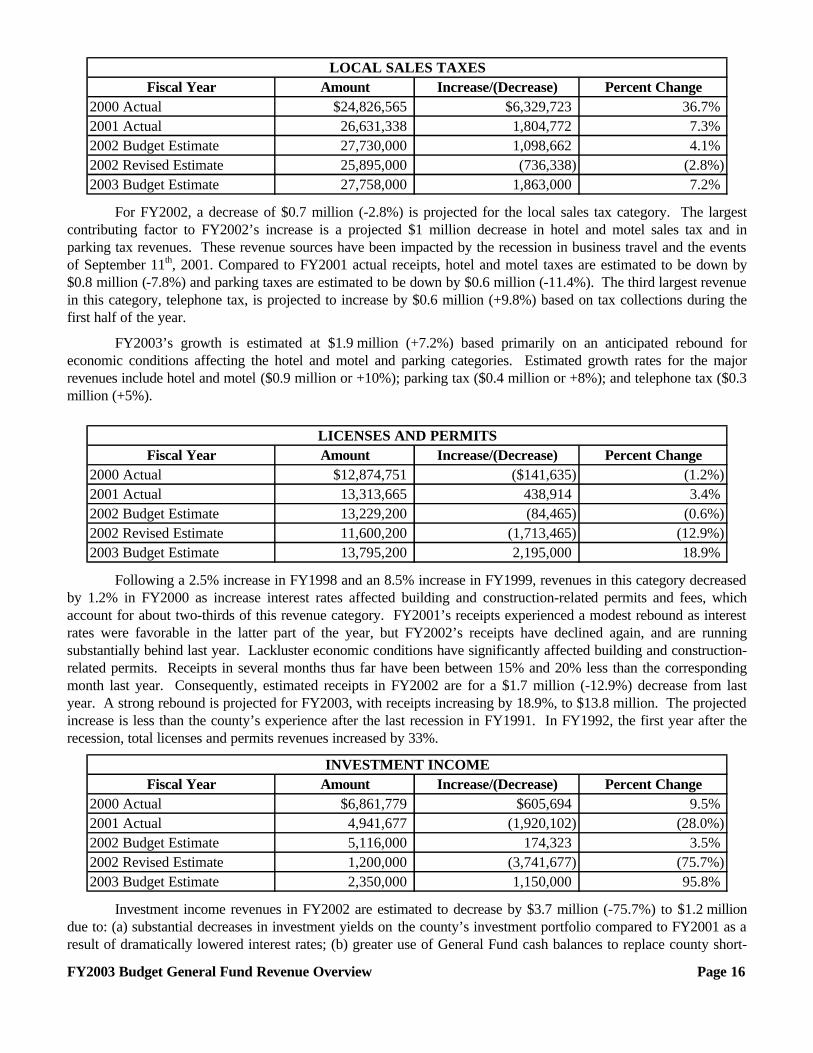
LOCAL SALES TAXESFiscal Year Amount Increase/(Decrease) Percent Change
2000 Actual $24,826,565 $6,329,723 36.7% 2001 Actual 26,631,338 1,804,772 7.3% 2002 Budget Estimate 27,730,000 1,098,662 4.1% 2002 Revised Estimate 25,895,000 (736,338) (2.8%)2003 Budget Estimate 27,758,000 1,863,000 7.2%
For FY2002, a decrease of $0.7 million (-2.8%) is projected for the local sales tax category. The largest contributing factor to FY2002’s increase is a projected $1 million decrease in hotel and motel sales tax and in parking tax revenues. These revenue sources have been impacted by the recession in business travel and the events of September 11th, 2001. Compared to FY2001 actual receipts, hotel and motel taxes are estimated to be down by $0.8 million (-7.8%) and parking taxes are estimated to be down by $0.6 million (-11.4%). The third largest revenue in this category, telephone tax, is projected to increase by $0.6 million (+9.8%) based on tax collections during the first half of the year.
FY2003’s growth is estimated at $1.9 million (+7.2%) based primarily on an anticipated rebound for economic conditions affecting the hotel and motel and parking categories. Estimated growth rates for the major revenues include hotel and motel ($0.9 million or +10%); parking tax ($0.4 million or +8%); and telephone tax ($0.3 million (+5%).
LICENSES AND PERMITSFiscal Year Amount Increase/(Decrease) Percent Change
2000 Actual $12,874,751 ($141,635) (1.2%)2001 Actual 13,313,665 438,914 3.4% 2002 Budget Estimate 13,229,200 (84,465) (0.6%)2002 Revised Estimate 11,600,200 (1,713,465) (12.9%)2003 Budget Estimate 13,795,200 2,195,000 18.9%
Following a 2.5% increase in FY1998 and an 8.5% increase in FY1999, revenues in this category decreased by 1.2% in FY2000 as increase interest rates affected building and construction-related permits and fees, which account for about two-thirds of this revenue category. FY2001’s receipts experienced a modest rebound as interest rates were favorable in the latter part of the year, but FY2002’s receipts have declined again, and are running substantially behind last year. Lackluster economic conditions have significantly affected building and construction-related permits. Receipts in several months thus far have been between 15% and 20% less than the corresponding month last year. Consequently, estimated receipts in FY2002 are for a $1.7 million (-12.9%) decrease from last year. A strong rebound is projected for FY2003, with receipts increasing by 18.9%, to $13.8 million. The projected increase is less than the county’s experience after the last recession in FY1991. In FY1992, the first year after the recession, total licenses and permits revenues increased by 33%.
INVESTMENT INCOMEFiscal Year Amount Increase/(Decrease) Percent Change
2000 Actual $6,861,779 $605,694 9.5% 2001 Actual 4,941,677 (1,920,102) (28.0%)2002 Budget Estimate 5,116,000 174,323 3.5% 2002 Revised Estimate 1,200,000 (3,741,677) (75.7%)2003 Budget Estimate 2,350,000 1,150,000 95.8%
Investment income revenues in FY2002 are estimated to decrease by $3.7 million (-75.7%) to $1.2 million due to: (a) substantial decreases in investment yields on the county’s investment portfolio compared to FY2001 as a result of dramatically lowered interest rates; (b) greater use of General Fund cash balances to replace county short-

FY2003 Budget General Fund Revenue Overview Page 17
term debt in lieu of issuing additional commercial paper; and (c) the impact of the more taxpayers opting for semiannual property tax payments which has reduced portfolio levels and therefore investment income because of the delay in the receipt of property tax payments. The weighted average yield in FY2001 on the biggest portion of the county’s investment portfolio was 6%, and reached a peak of 6.6% in midyear. After starting out at over 4% at the beginning of this year, however, the weighted average yield has declined to 2.4% currently. Greater use of cash balances instead of short-term debt played a large part in the county’s approximately $1.2 million underspending of interest appropriations.
The other significant portion of investment income for the General Fund is interest on bond and commercial paper proceeds that are held until they are paid out for capital projects. In FY2001 this revenue, sometimes referred to as the “Restricted Split Issues Portfolio,” accounted for about 15% of total investment income. Thus far in FY2002 the weighted average yield has decreased from 3.8% at the start of the year to under 2% currently. These rates compare to an average yield of 6.4% in FY20001.
Taking into account national forecasts for increased interest rates in FY2003 together with a return to an increased use of commercial paper for debt financing, a $1.2 million increase is projected.
OTHER REIMBURSEMENTS AND REVENUESFiscal Year Amount Increase/(Decrease) Percent Change
2000 Actual $26,432,897 $6,420,915 34.0% 2001 Actual 20,820,744 (5,612,153) (21.2%)2002 Budget Estimate 20,384,200 (436,544) (2.1%)2002 Revised Estimate 19,665,000 (1,155,744) (5.6%)2003 Budget Estimate 22,199,500 2,534,500 12.9%
FY2002 revenues in this category are projected to decline by $1.1 million (-5.6%) primarily because of the following: (a) a $0.5 million (-23%) decrease in subdivision and related fees; (b) a $1.4 million decline in Department of Social Services reimbursements because of the reduced costs of a State contract funded via DSS’ budget and (c) a $0.4 million decrease in 911 Trust Fund Reimbursements. The last occurs because of an accrual adjustment in FY2001. These decreases are partially offset by $0.9 million increased reimbursement by the state to the Detention Center; to increases CATV franchise fees ($162,000); and recreation and parks fees ($129,000).
FY2003 revenues are projected to increase by $2.5 million (+12.9%) to $22.2 million. Much of the increase is due an anticipated $0.5 million rebound in subdivision and related fees due to improved economic conditions and to $261,000 of additional CATV franchise fees and various other miscellaneous revenues. Other increases are projected for 911 Trust Fund reimbursements, recreation and parks fees, and miscellaneous public safety fees. The only notable decrease is in Aging Department fees.
INTERFUND REIMBURSEMENTSFiscal Year Amount Increase/(Decrease) Percent Change
2000 Actual $11,358,282 $160,987 1.3% 2001 Actual 11,716,888 358,606 3.2% 2002 Budget Estimate 13,176,100 1,459,212 12.5% 2002 Revised Estimate 13,199,100 1,482,212 12.7% 2003 Budget Estimate 14,486,400 1,287,300 9.8%
FY2002 revenues are projected to increase by $1.5 million (+12.7%) primarily because of: (a) a $1.1 million transfer to the General Fund from the Arundel Mills Tax Increment Fund.; (b) a $464,000 transfer to the General Fund from the Installment Purchase Agreement (“IPA”) Fund; and (c) a $426,000 (+7.2%) increase in pro-rata share reimbursements. Offsetting these increases is a $676,000 (-15.4%) decrease from capital project reimbursements that are running under the original budget estimates.
FY2003’s interfund reimbursements are projected to increase by $1.3 million (+9.8%) primarily because of the following: (a) $2 million increase in pro-rata share reimbursements by the Water and Sewer and Waste Collection

FY2003 Budget General Fund Revenue Overview Page 18
funds primarily resulting from a transfer of information technology resources to the new Department of Information Technology; and (b) a $464,000 increased transfer from the Nursery Road Tax Increment Fund. Offsetting these increases is a $744,000 reduction in the transfer to the General Fund from the Arundel Mills Tax Increment Fund and a $464,000 decrease in the FY2002 transfer to the General Fund from the Installment Purchase Agreement (“IPA”) Fund.
FUND BALANCE
The FY2003 General Fund budget is partially funded with an estimated June 30, 2002 county fund balance of $22.1 million. The unappropriated and undesignated fund balance available is $22.1 million. The following table shows the estimated unappropriated fund balance for June 30, 2002:
STATEMENT OF ESTIMATED UNAPPROPRIATED COUNTY GENERAL FUND BALANCE AT JUNE 30, 2002
Fund Balance, June 30, 2001 $55,896,500Less: Appropriated To Finance FY2002 Budget (33,768,000)Fund Balance, July 1, 2001 (Unappropriated and Undesignated) $22,128,500
FY2002 Budget Operations (1): Budgeted Appropriations $866,354,700 Estimated Expenditures 861,783,100
Expenditures less Appropriations 4,571,600
Budgeted Revenues $832,586,700Revised Estimate 827,942,500
Reduction in Estimated Revenues (4,644,200) ($72,600)
General Fund Balance At June 30, 2002 Projected $22,055,900
NOTE:(1) Appropriations, expenditures and revenues are exclusive of Board of Education non-Countyfunds which include State and Federal aid and miscellaneous BOE receipts. These non-Countyfunds are received directly by the Board of Education.

Code Revenue Name
Actual FY2000
Revenues
Actual FY2001
Revenues
Budgeted FY2002 Estimate
Revised FY2002
Estimate
Estimated FY2003
Revenues
General Fund RevenuesFY2000-2003 Detailed Amounts
1001.5036 Agricultural Tax Credit (303,305) (329,818) (346,000) (355,000) (369,000)1001.5045 Airport Noise Zone Credit (5,038) (3,715) (6,000) (3,000) (3,000)1001.5030 Civic Association Credit (382) 7,139 (1,000) (1,000) (1,000)1001.5038 Community Revitalization Tax 0 0 0 0 (200,000)1001.5031 Conservation Property Credit (7,752) (8,148) (11,000) (10,000) (10,000)1001.5015 Corporate Property - Curr Year 56,396,426 55,813,872 51,585,000 55,582,000 54,787,0001001.5016 Corporate Property - Prior Year 846,984 (1,632,740) (500,000) (2,100,000) (1,100,000)1001.5044 County Rezoned Tax Penalty (6,069) 1,856 1,000 17,000 5,0001001.5020 Fifty Year Deferred Credit 829 1,175 (2,000) (1,000) (1,000)1001.5037 Foreign Trade Zone Tax Credit 0 0 0 0 (300,000)1001.5025 Homeowner Credit - Local (865,486) (857,240) (975,000) (848,000) (1,534,000)1001.5032 Homeowner Tax Credit - State (3,469,276) (3,464,124) (3,850,000) (3,260,000) (3,420,000)1001.5035 Homestead Tax Credit (2,502,471) (2,640,610) (4,311,000) (4,081,000) (7,002,000)1001.5075 Penalty & Interest - Delinq Tax 880,044 811,775 864,000 886,000 930,0001001.5010 Pers Property - Current Year 1,316,808 1,351,374 1,431,000 1,319,000 1,332,0001001.5011 Pers Property - Prior Year (451,566) (785,860) (500,000) (900,000) (700,000)1001.5043 Prior Year Homestead Credit (15,728) 2,248 (25,000) 2,000 2,0001001.5042 Prior Year Old Age Credit (12,385) (75,724) (35,000) (60,000) (35,000)1001.5003 Real Property - Current Year 273,311,909 289,780,091 303,767,000 304,213,000 321,128,0001001.5004 Real Property - Prior Year (168,990) (14,764) (300,000) (500,000) (200,000)1001.5040 Service Charge - Lost Interest 274,217 1,185,027 1,320,000 1,189,000 654,0001001.5033 State Circuit Breaker Reimburs 3,469,276 3,464,124 3,812,000 3,244,000 3,403,0001001.5041 Svc Charge - Admin Fee 20,678 73,516 92,000 53,000 53,000
342,679,454Total 328,708,723Property Taxes 352,010,000 354,386,000 367,419,000
1001.5100 Local Income Tax 253,197,128 257,789,570 276,446,000 268,162,000 282,340,000
257,789,570Total 253,197,128Local Income Tax 276,446,000 268,162,000 282,340,000
1001.5111 Admissions & Amusement Tax 3,729,780 4,887,977 3,897,100 5,138,000 5,300,0001001.5112 Boat Recordation Fee 5,795 6,880 6,200 7,000 7,2001001.5113 Highway User Revenues 22,392,577 24,642,281 23,133,600 22,500,700 23,282,500
29,537,138Total 26,128,152State Shared Revenues 27,036,900 27,645,700 28,589,700
AGE.ST Aging - State Grants 1,046,369 1,199,902 1,210,500 1,347,400 1,433,700BUD.ST Budget Office - State Grants 0 3,910,101 7,820,000 7,820,200 7,820,200CSV.ST Central Services - State Grants 0 0 128,000 128,000 0
FY2003 Budget General Fund Revenue Overview Page 19
Code Revenue Name
Actual FY2000
Revenues
Actual FY2001
Revenues
Budgeted FY2002 Estimate
Revised FY2002
Estimate
Estimated FY2003
Revenues
General Fund RevenuesFY2000-2003 Detailed Amounts
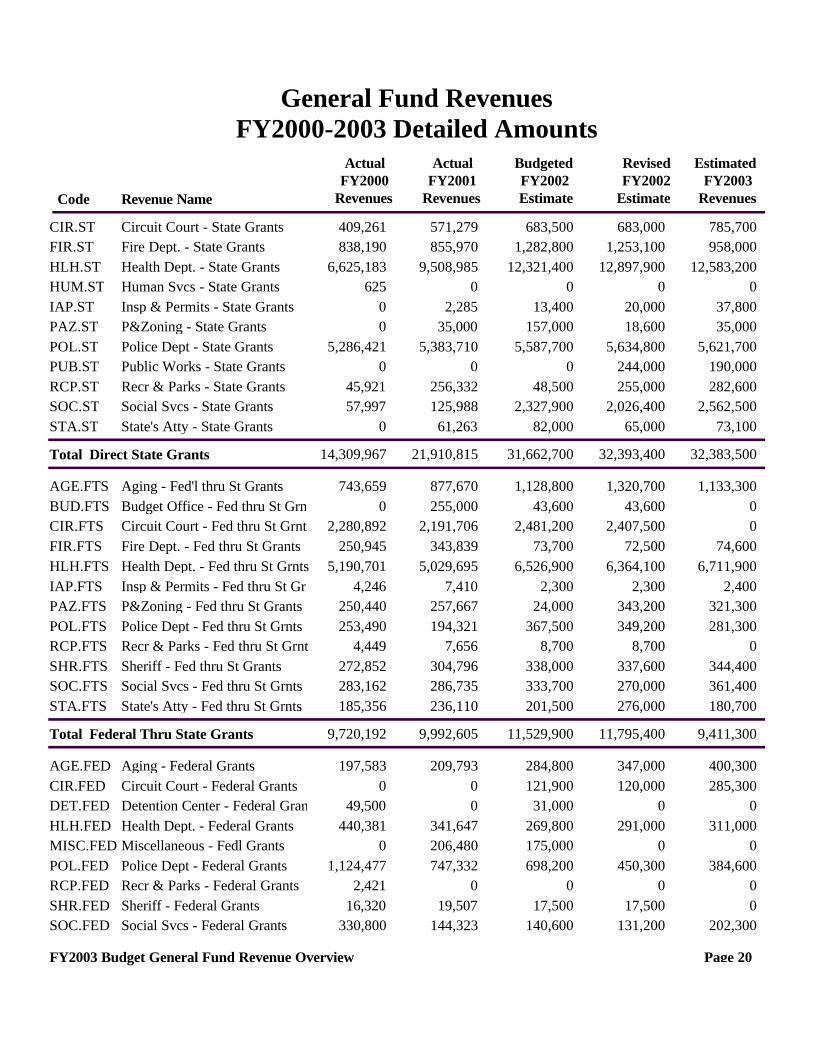
CIR.ST Circuit Court - State Grants 409,261 571,279 683,500 683,000 785,700FIR.ST Fire Dept. - State Grants 838,190 855,970 1,282,800 1,253,100 958,000HLH.ST Health Dept. - State Grants 6,625,183 9,508,985 12,321,400 12,897,900 12,583,200HUM.ST Human Svcs - State Grants 625 0 0 0 0IAP.ST Insp & Permits - State Grants 0 2,285 13,400 20,000 37,800PAZ.ST P&Zoning - State Grants 0 35,000 157,000 18,600 35,000POL.ST Police Dept - State Grants 5,286,421 5,383,710 5,587,700 5,634,800 5,621,700PUB.ST Public Works - State Grants 0 0 0 244,000 190,000RCP.ST Recr & Parks - State Grants 45,921 256,332 48,500 255,000 282,600SOC.ST Social Svcs - State Grants 57,997 125,988 2,327,900 2,026,400 2,562,500STA.ST State's Atty - State Grants 0 61,263 82,000 65,000 73,100
21,910,815Total 14,309,967Direct State Grants 31,662,700 32,393,400 32,383,500
AGE.FTS Aging - Fed'l thru St Grants 743,659 877,670 1,128,800 1,320,700 1,133,300BUD.FTS Budget Office - Fed thru St Grn 0 255,000 43,600 43,600 0CIR.FTS Circuit Court - Fed thru St Grnt 2,280,892 2,191,706 2,481,200 2,407,500 0FIR.FTS Fire Dept. - Fed thru St Grants 250,945 343,839 73,700 72,500 74,600HLH.FTS Health Dept. - Fed thru St Grnts 5,190,701 5,029,695 6,526,900 6,364,100 6,711,900IAP.FTS Insp & Permits - Fed thru St Gr 4,246 7,410 2,300 2,300 2,400PAZ.FTS P&Zoning - Fed thru St Grants 250,440 257,667 24,000 343,200 321,300POL.FTS Police Dept - Fed thru St Grnts 253,490 194,321 367,500 349,200 281,300RCP.FTS Recr & Parks - Fed thru St Grnt 4,449 7,656 8,700 8,700 0SHR.FTS Sheriff - Fed thru St Grants 272,852 304,796 338,000 337,600 344,400SOC.FTS Social Svcs - Fed thru St Grnts 283,162 286,735 333,700 270,000 361,400STA.FTS State's Atty - Fed thru St Grnts 185,356 236,110 201,500 276,000 180,700
9,992,605Total 9,720,192Federal Thru State Grants 11,529,900 11,795,400 9,411,300
AGE.FED Aging - Federal Grants 197,583 209,793 284,800 347,000 400,300CIR.FED Circuit Court - Federal Grants 0 0 121,900 120,000 285,300DET.FED Detention Center - Federal Gran 49,500 0 31,000 0 0HLH.FED Health Dept. - Federal Grants 440,381 341,647 269,800 291,000 311,000MISC.FED Miscellaneous - Fedl Grants 0 206,480 175,000 0 0POL.FED Police Dept - Federal Grants 1,124,477 747,332 698,200 450,300 384,600RCP.FED Recr & Parks - Federal Grants 2,421 0 0 0 0SHR.FED Sheriff - Federal Grants 16,320 19,507 17,500 17,500 0SOC.FED Social Svcs - Federal Grants 330,800 144,323 140,600 131,200 202,300
FY2003 Budget General Fund Revenue Overview Page 20

Code Revenue Name
Actual FY2000
Revenues
Actual FY2001
Revenues
Budgeted FY2002 Estimate
Revised FY2002
Estimate
Estimated FY2003
Revenues
General Fund RevenuesFY2000-2003 Detailed Amounts
STA.FED State's Atty - Federal Grants 32,344 230,089 102,000 30,000 111,200
1,899,171Total 2,193,826Direct Federal Grants 1,840,800 1,387,000 1,694,700
AGE.OTH Aging - Other Grants 29,638 0 29,600 29,600 29,600BUD.OTH Budget Office - Other Grants 0 0 44,100 44,100 0CIR.OTHE Circuit Court - Other Grants 0 5,000 0 0 0HLH.OTH Health Dept. - Other Grants 97,411 333,567 107,200 104,800 99,100MISC.OT Miscellaneous - Other Grants 500,000 0 0 0 0POL.OTH Police Dept - Other Grants 9,249 9,345 5,600 8,200 0SOC.OTH Social Svcs - Other Grants 546,844 457,397 313,400 401,000 333,400STA.OTH State's Atty - Other Grants 46,975 0 0 0 0
805,309Total 1,230,117Other Grants 499,900 587,700 462,100
1001.5751 Recordation Tax 25,100,396 25,876,470 24,912,000 30,390,000 29,478,0001001.5752 Transfer Tax 27,059,167 26,977,887 27,013,000 29,636,000 29,043,000
52,854,357Total 52,159,563Recordation & Transfer Tax 51,925,000 60,026,000 58,521,000
1042.5776 Electricity Sales Tax 4,377,779 4,192,861 4,322,000 4,334,000 4,507,0001042.5783 Gas - Direct Purch Sales Tax 0 (3,319) 0 0 01042.5777 Gas Sales Tax 692,430 646,035 713,000 627,000 652,0001042.5780 Hotel/Motel Sales Tax 8,778,632 10,226,394 10,609,000 9,431,000 10,374,0001042.5779 Misc. Power Sales Tax 63,313 100,961 69,000 86,000 90,0001042.5781 Parking Tax 5,140,254 5,528,590 5,913,000 4,897,000 5,289,0001042.5778 Telephone Sales Tax 5,774,157 5,939,815 6,104,000 6,520,000 6,846,000
26,631,337Total 24,826,565Local Sales Taxes 27,730,000 25,895,000 27,758,000
1256.5802 Amusement Licenses 165,476 166,920 197,000 160,000 165,0001157.5941 Animal Control Collections 174,063 192,420 175,000 207,000 209,0001157.5944 Animal Control Other 45,101 39,850 127,400 1,000 1,0001157.5942 Animal Control Summons 24,210 29,783 27,000 41,000 42,0001256.5957 Auctioneer Licenses 21,500 20,500 22,000 21,000 21,0001256.5953 Bail Bonds 4,850 10,000 6,000 13,000 13,0001626.5815 Beer, Wine & Liquor Licenses 579,703 590,837 590,000 590,000 595,0001256.5803 Bingo Licenses 16,225 50,054 31,500 35,000 35,0001262.5974 Buffer Exemption Application 0 50 0 0 01253.5882 Building Applications 334,914 311,595 317,000 303,000 394,000
FY2003 Budget General Fund Revenue Overview Page 21

Code Revenue Name
Actual FY2000
Revenues
Actual FY2001
Revenues
Budgeted FY2002 Estimate
Revised FY2002
Estimate
Estimated FY2003
Revenues
General Fund RevenuesFY2000-2003 Detailed Amounts
1253.5883 Building Permits 3,199,460 2,966,158 3,010,000 2,693,000 3,501,0001253.5886 Certificate of Occupancy Fee 32,246 34,552 41,000 33,000 43,0001254.5977 Coastal Flood Plain Waivers 0 0 0 1,000 1,0001253.5901 Construction Civil Fines 5,055 4,080 5,000 4,000 5,0001256.5832 Disposal System Applications 135 170 100 100 1001256.5833 Disposal System Examinations 540 230 300 200 2001256.5834 Disposal System Licenses 3,550 2,590 3,000 3,000 3,0001253.5871 Electrical Applications 261,869 279,765 311,000 228,000 296,0001253.5872 Electrical Permits 723,212 780,053 873,000 625,000 813,0001256.5821 Electrician Applications 2,950 4,060 4,000 3,000 3,0001256.5822 Electrician Examinations 1,050 450 1,000 300 3001256.5823 Electrician Licenses 90,085 90,185 98,000 93,000 93,0001256.5824 Electrician Other 10,680 12,460 2,000 12,000 12,0001751.5971 Food Service Facilities 298,872 314,893 295,000 295,000 295,0001253.5873 Gas Applications 99,075 93,840 110,000 69,000 90,0001253.5874 Gas Permits 159,479 151,530 173,000 111,000 144,0001256.5825 Gasfitter Applications 750 825 1,000 1,000 1,0001256.5826 Gasfitter Examinations 225 50 500 0 01256.5827 Gasfitter Licenses 7,700 8,200 7,000 8,000 8,0001256.5828 Gasfitter Other 51 28 700 700 7001253.5884 Grading Applications 15,279 15,433 16,000 16,000 21,0001253.5902 Grading CiviI Fines (19,044) 30,774 4,000 6,000 28,5001253.5885 Grading Permits 1,302,175 1,788,768 1,324,000 1,206,000 1,568,0001256.5958 Hucksters Licenses 8,825 12,100 11,000 19,000 19,0001253.5890 Impervious Coverage Fees 0 6,232 1,000 2,000 3,0001256.5918 Individual Mobile Home 22,675 21,090 19,000 22,000 22,0001253.5887 Investigation Fee 1,380 2,480 2,000 3,000 4,0001268.5970 Landscaping Screening Review 65,273 63,210 63,000 54,000 70,000multi.5962 Liquid Waste Hauler 2,765 2,550 5,000 2,300 2,3001611.5964 Marriage Licenses 222,750 214,270 227,000 211,000 212,0001256.5838 Mechanic Applications 2,370 2,790 2,000 2,000 2,0001253.5880 Mechanical Applications 156,810 149,255 150,000 117,000 152,0001256.5839 Mechanical Exams 425 1,100 2,000 1,000 1,0001256.5840 Mechanical Licenses 69,965 66,275 69,000 67,000 67,0001256.5841 Mechanical Other 0 0 1,000 0 01253.5881 Mechanical Permits 551,722 492,702 551,000 408,000 530,000
FY2003 Budget General Fund Revenue Overview Page 22

Code Revenue Name
Actual FY2000
Revenues
Actual FY2001
Revenues
Budgeted FY2002 Estimate
Revised FY2002
Estimate
Estimated FY2003
Revenues
General Fund RevenuesFY2000-2003 Detailed Amounts
1256.5919 Mobile Home Dealer 600 425 1,000 1,000 1,0001256.5960 Multiple Dwelling Late Fee 2,592 4,390 3,000 7,000 7,000multi.5959 Multiple Dwelling Licenses 380,745 316,747 350,000 348,000 355,0001266.5968 Non-conforming Use Fee 6,875 9,517 7,000 10,000 13,0001253.5889 Occup w/o Cert of Occ Fee 1,000 2,900 1,000 2,000 3,0001266.6001 Occupancy Permits 20,905 34,080 19,000 19,000 27,5001266.5951 Off-site Directional Signs 0 0 1,000 300 3001256.5954 Parade Permits 1,725 2,075 2,000 2,000 2,0001256.5956 Pawnbroker Licenses 1,950 1,550 2,000 2,000 2,0001754.6002 Percolation Tests 319,943 311,148 320,000 300,000 390,0001256.5829 Plumber Applications 1,955 2,850 2,000 2,000 2,0001256.5830 Plumber Licenses 59,555 61,405 69,000 65,000 62,0001256.5831 Plumber Other 0 0 1,000 700 7001253.5875 Plumbing Applications 127,045 126,620 131,000 98,000 127,0001253.5877 Plumbing Permits 481,381 472,690 479,000 398,000 517,0001253.5888 Reinspection Fee 18,015 32,640 21,000 36,000 47,0001256.5952 Roadside Vendor 15,175 23,275 13,000 27,000 28,0001259.5935 Rubble Inspections 313,335 138,200 320,000 124,400 128,1001754.5963 Scavenger Inspections 1,925 2,000 2,000 2,000 2,000multi.5975 Senior Center Annual Fee 51,702 73,757 62,700 55,700 01754.6005 Septic System Permit 204,364 211,740 205,000 197,000 256,0001253.5879 Septic Tank Applications 30,585 31,250 32,000 30,000 39,0001308.6030 Space Permits 98,385 226,513 158,000 78,000 101,0001157.5943 Spaying and Neutering Fees 44,731 41,341 44,800 43,000 44,0001256.5810 Special Event Licenses 5,200 6,600 6,000 5,000 6,0001754.6004 Swim Pool Oper Licenses 20,110 18,340 22,000 22,000 22,0001754.6003 Swimming Pool Permit 34,680 33,345 35,000 35,000 34,0001256.5928 Taxicab Late Fee 1,648 1,179 1,000 1,000 1,0001256.5927 Taxicab Licenses 18,235 24,806 20,000 17,000 20,0001256.5926 Taxicab Registration 30,820 43,225 42,000 44,000 42,0001256.5976 Towing License Applications 250 6,000 0 0 01256.5961 Towing Licenses 8,950 3,225 9,000 6,000 6,0001611.5860 Traders Licenses 675,545 733,893 700,000 700,000 700,0001256.5916 Trailer Park Licenses 14,040 17,460 17,000 17,000 17,0001256.5917 Trailer Park Rental 852,750 949,347 905,000 964,000 978,0001256.5835 Utility Contractor Applications 0 125 200 100 100
FY2003 Budget General Fund Revenue Overview Page 23

Code Revenue Name
Actual FY2000
Revenues
Actual FY2001
Revenues
Budgeted FY2002 Estimate
Revised FY2002
Estimate
Estimated FY2003
Revenues
General Fund RevenuesFY2000-2003 Detailed Amounts
1256.5836 Utility Contractor Exams 500 175 1,000 400 4001256.5837 Utility Contractor Licenses 3,645 3,510 4,000 4,000 4,0001268.5969 Waiver Requests 23,495 20,537 20,000 18,000 23,0001253.5876 Water & Sewer App Licenses 65,830 61,745 64,000 41,000 53,0001253.5878 Water & Sewer Inspections 133,860 125,613 132,000 89,000 116,0001754.6006 Well Water Test 50,303 34,791 50,000 5,000 7,0001266.5965 Zoning Fees 84,009 77,484 79,000 96,000 125,000
13,313,670Total 12,874,754Licenses & Permits 13,229,200 11,600,200 13,795,200
1044.6155 General Portfolio 4,090,065 2,690,777 3,792,000 700,000 1,500,0001044.6157 General Portfolio - Transfer In 978,036 847,835 0 0 01044.6152 Inv Income - Other Agencies 328,648 246,615 309,000 200,000 300,0001044.6153 Investment Income - Restricted 1,104,755 765,313 706,000 150,000 300,0001044.6156 Investment Income Sweep Accts 360,275 391,137 309,000 150,000 250,000
4,941,677Total 6,861,779Investment Income 5,116,000 1,200,000 2,350,000
1152.6185 911 Trust Fund Reimbursement 2,032,606 2,373,149 2,100,000 2,100,000 2,205,000aging.6550 Aging Fees (miscellaneous) 299,589 373,952 292,200 376,300 285,8001611.6525 Appearance Fees 29 70 300 500 5001420.6348 Aquatics Center 595,431 641,398 620,000 645,000 640,000multi.6297. Arundel Mills Review 895,399 0 0 0 01402.6344 Athletics - Area 1 49,376 83,635 87,100 87,000 79,3001402.6345 Athletics - Area 2 76,333 106,435 106,400 106,400 108,7001402.6346 Athletics - Area 3 123,007 66,445 67,400 67,400 84,5001402.6347 Athletics - Area 4 130,325 156,112 184,100 184,000 164,7001421.6327 B&A Trail 64 152 200 200 2001418.6351 Bachman Adult Athl Complex 108,572 146,118 150,000 155,000 175,2001265.6499 Base Maps 35,188 34,433 40,000 30,000 40,0001137.6172 Bay Ridge Special Police 55,970 67,182 74,100 74,100 78,5001573.6242 Board of Appeal Fees 20,620 28,338 30,600 26,000 28,0001402.6349 Cannon Stadium 38,128 45,922 40,000 45,000 46,0001001.6521 Car Phone Reimbursements 138 335 500 500 5001001.6300 CATV Franchise Fees 2,647,720 3,923,250 3,317,000 4,085,000 4,346,0001042.6280 Certificate of Lien 110,900 114,075 117,000 118,000 124,0001611.6523 Circuit Court Fines 29,211 193,551 25,000 80,000 82,0001061.6501 Commuter Fees 92,160 92,099 96,000 70,000 71,000
FY2003 Budget General Fund Revenue Overview Page 24

Code Revenue Name
Actual FY2000
Revenues
Actual FY2001
Revenues
Budgeted FY2002 Estimate
Revised FY2002
Estimate
Estimated FY2003
Revenues
General Fund RevenuesFY2000-2003 Detailed Amounts
1001.6502 County Code Sales 2,275 0 2,000 1,200 1,4001402.6343 Countywide Therapeutic 80,653 78,744 87,500 87,000 90,7001611.6201 Court Jury Fee Reimbursement 0 0 0 160,000 155,0001611.6202 Court Masters Reimbursement 0 0 359,900 250,000 550,0001611.6519 Court Transcript Sales 148,234 140,611 170,000 100,000 01552.6509 DC House Arrest 44,688 40,773 32,000 38,000 42,0001552.6508 DC Live-in Workout 200,871 310,717 260,000 340,000 340,0001552.6182 Det Ctr Weekend Reimburs 5,640 450 1,000 0 01552.6510 Detention Ctr Alter Sentence 23,345 24,020 20,000 24,000 27,0001255.6290 Dev Fee - Street Lights 143,324 64,235 45,000 57,800 59,5001268.6511 Developer Service Fee 272,008 324,334 300,000 220,000 320,0001001.6599 Discounts Taken 0 15,105 1,000 1,000 1,0001042.6513 Dishonored Check Fee 13,295 11,723 13,000 14,000 14,0001422.6325 Downs Park 143,898 148,209 145,000 150,000 150,0001402.6341 East County Recr Programs 338,968 404,811 415,000 415,000 432,0001001.6529 Encumbrance Write-offs 1,143,054 670,893 1,000,000 400,000 800,0001586.6177 Extradition Reimbursement 1,726 582 2,500 2,500 3,500multi.6181 Fed/St Reimb Social Services 2,363,355 2,052,564 658,900 645,800 696,4001171.6472 Fines Red Light Running 0 622,670 650,000 550,000 650,0001203.6194 Glen Burnie VFD Reimburseme 10,000 0 10,000 0 10,0001423.6306 Golf Course Greens Fees (158) 14,196 0 39,300 39,300multi.6251- Health Dept Fees 290,403 322,381 264,300 290,500 308,7001146.6198 Hi Intensity Drug Reimb O'time 12,991 14,349 20,000 10,000 16,0001552.6512 Inmate Medical Fees 7,768 11,094 8,000 10,000 12,0001061.6174 Insurance Recovery 435,782 479,288 470,000 280,000 475,0001434.6350 Kinder Farm Park Fees 15,866 18,525 12,000 20,000 20,0001129.6505 Liquor in Possession Fines 0 120 2,000 2,000 2,0001719.6515 M.A. Healthy Start 324,235 252,273 320,000 320,000 320,0001746.6500 M.A. Personal Care Provider 170,725 195,625 165,000 165,000 165,000multi.6516 M.A. School Health 255,998 243,207 190,000 190,000 190,000multi.6550 Miscellaneous Revenues 5,767,285 160,714 1,207,800 500,000 1,000,0001402.6340 North County Recr Programs 170,420 220,850 257,800 257,000 267,5001139.6522 Parking Fines 57,933 78,601 72,000 88,000 77,0001403.6337 Parks Miscellaneous 1,845 47,540 17,000 80,000 80,0001403.6321 Parks Revenue 111,296 126,998 110,000 120,000 127,0001430.6336 Permits - Jug Bay 10,753 11,675 12,100 12,000 12,000
FY2003 Budget General Fund Revenue Overview Page 25
Code Revenue Name
Actual FY2000
Revenues
Actual FY2001
Revenues
Budgeted FY2002 Estimate
Revised FY2002
Estimate
Estimated FY2003
Revenues
General Fund RevenuesFY2000-2003 Detailed Amounts
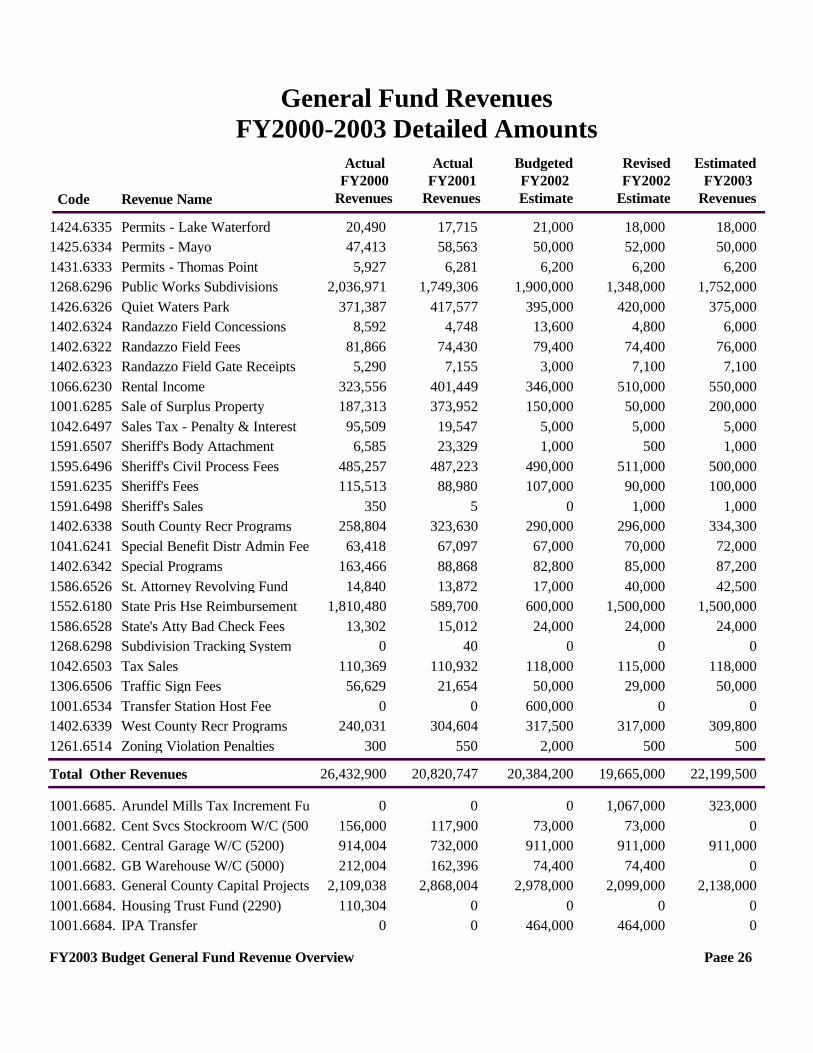
1424.6335 Permits - Lake Waterford 20,490 17,715 21,000 18,000 18,0001425.6334 Permits - Mayo 47,413 58,563 50,000 52,000 50,0001431.6333 Permits - Thomas Point 5,927 6,281 6,200 6,200 6,2001268.6296 Public Works Subdivisions 2,036,971 1,749,306 1,900,000 1,348,000 1,752,0001426.6326 Quiet Waters Park 371,387 417,577 395,000 420,000 375,0001402.6324 Randazzo Field Concessions 8,592 4,748 13,600 4,800 6,0001402.6322 Randazzo Field Fees 81,866 74,430 79,400 74,400 76,0001402.6323 Randazzo Field Gate Receipts 5,290 7,155 3,000 7,100 7,1001066.6230 Rental Income 323,556 401,449 346,000 510,000 550,0001001.6285 Sale of Surplus Property 187,313 373,952 150,000 50,000 200,0001042.6497 Sales Tax - Penalty & Interest 95,509 19,547 5,000 5,000 5,0001591.6507 Sheriff's Body Attachment 6,585 23,329 1,000 500 1,0001595.6496 Sheriff's Civil Process Fees 485,257 487,223 490,000 511,000 500,0001591.6235 Sheriff's Fees 115,513 88,980 107,000 90,000 100,0001591.6498 Sheriff's Sales 350 5 0 1,000 1,0001402.6338 South County Recr Programs 258,804 323,630 290,000 296,000 334,3001041.6241 Special Benefit Distr Admin Fee 63,418 67,097 67,000 70,000 72,0001402.6342 Special Programs 163,466 88,868 82,800 85,000 87,2001586.6526 St. Attorney Revolving Fund 14,840 13,872 17,000 40,000 42,5001552.6180 State Pris Hse Reimbursement 1,810,480 589,700 600,000 1,500,000 1,500,0001586.6528 State's Atty Bad Check Fees 13,302 15,012 24,000 24,000 24,0001268.6298 Subdivision Tracking System 0 40 0 0 01042.6503 Tax Sales 110,369 110,932 118,000 115,000 118,0001306.6506 Traffic Sign Fees 56,629 21,654 50,000 29,000 50,0001001.6534 Transfer Station Host Fee 0 0 600,000 0 01402.6339 West County Recr Programs 240,031 304,604 317,500 317,000 309,8001261.6514 Zoning Violation Penalties 300 550 2,000 500 500
20,820,747Total 26,432,900Other Revenues 20,384,200 19,665,000 22,199,500
1001.6685. Arundel Mills Tax Increment Fu 0 0 0 1,067,000 323,0001001.6682. Cent Svcs Stockroom W/C (500 156,000 117,900 73,000 73,000 01001.6682. Central Garage W/C (5200) 914,004 732,000 911,000 911,000 911,0001001.6682. GB Warehouse W/C (5000) 212,004 162,396 74,400 74,400 01001.6683. General County Capital Projects 2,109,038 2,868,004 2,978,000 2,099,000 2,138,0001001.6684. Housing Trust Fund (2290) 110,304 0 0 0 01001.6684. IPA Transfer 0 0 464,000 464,000 0
FY2003 Budget General Fund Revenue Overview Page 26

Code Revenue Name
Actual FY2000
Revenues
Actual FY2001
Revenues
Budgeted FY2002 Estimate
Revised FY2002
Estimate
Estimated FY2003
Revenues
General Fund RevenuesFY2000-2003 Detailed Amounts
1001.6685. Nursery Road Tax Incr Fund (2 1,170,278 1,376,888 1,506,000 1,578,000 2,045,0001001.6686. Pension System Fund (6050) 24,996 53,604 60,000 55,000 55,0001001.6682. Print Shop W/C (5000) 63,996 47,796 52,700 52,700 01001.6681. W&S Interest & Sinking (4200) 199,992 199,992 200,000 200,000 200,0001001.6681. W&S Operating Fund (4000) 3,450,000 3,480,000 3,820,000 3,820,000 5,160,0001001.6681. Waste Management Services Fu 1,190,004 1,089,996 1,159,000 1,159,000 1,976,4001001.6683. Water & Sewer Capital Projects 1,689,441 1,525,341 1,850,000 1,618,000 1,648,0001001.6684. Whitmore Parking Garage (200 68,226 62,971 28,000 28,000 30,000
11,716,888Total 11,358,283Interfund Reimbursements 13,176,100 13,199,100 14,486,400
1001.6691. Approp. Fund Balance 50,158,250 41,168,700 33,768,000 33,768,000 22,055,900
41,168,700Total 50,158,250Fund Balance 33,768,000 33,768,000 22,055,900
836,061,438820,160,199 866,354,700 861,710,500 883,466,300Grand Total All Revenues
FY2003 Budget General Fund Revenue Overview Page 27
FY2003 Budget General Fund Revenue Overview Page 28
TAXABLE ASSESSABLE BASEANNE ARUNDEL COUNTY, MARYLAND
FY2002 Revised Estimate
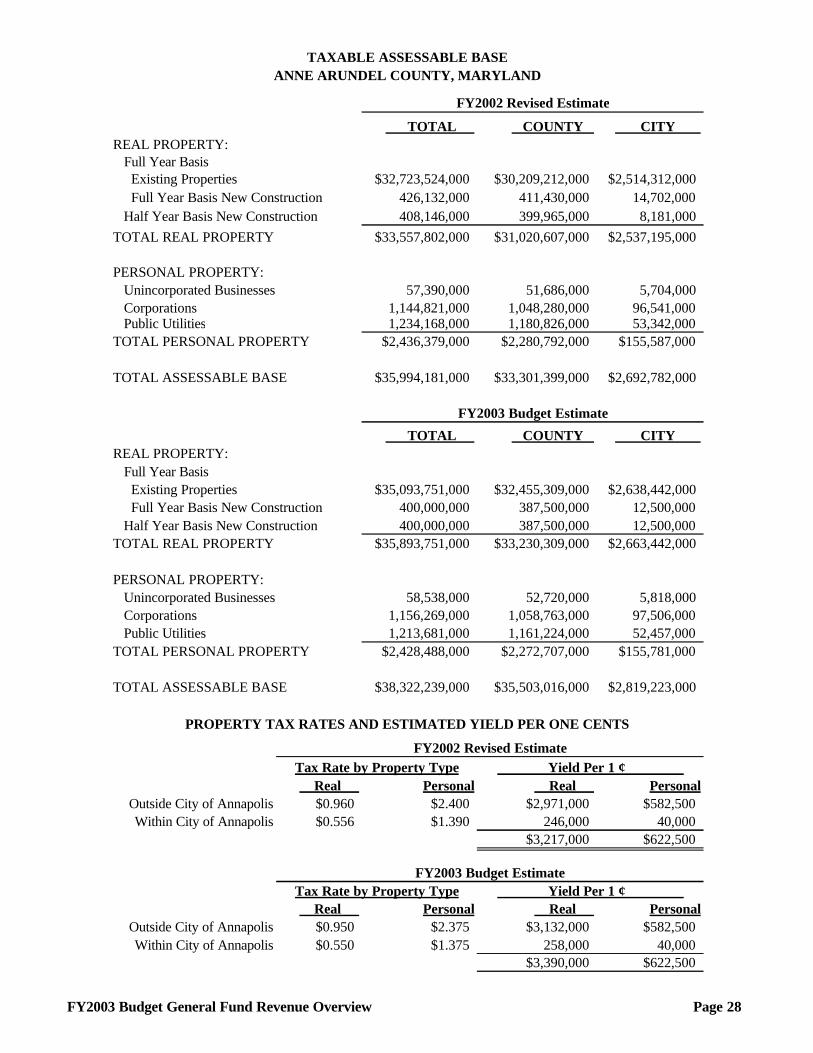
TOTAL COUNTY CITY REAL PROPERTY: Full Year Basis Existing Properties $32,723,524,000 $30,209,212,000 $2,514,312,000 Full Year Basis New Construction 426,132,000 411,430,000 14,702,000 Half Year Basis New Construction 408,146,000 399,965,000 8,181,000
TOTAL REAL PROPERTY $33,557,802,000 $31,020,607,000 $2,537,195,000
PERSONAL PROPERTY: Unincorporated Businesses 57,390,000 51,686,000 5,704,000 Corporations 1,144,821,000 1,048,280,000 96,541,000 Public Utilities 1,234,168,000 1,180,826,000 53,342,000TOTAL PERSONAL PROPERTY $2,436,379,000 $2,280,792,000 $155,587,000
TOTAL ASSESSABLE BASE $35,994,181,000 $33,301,399,000 $2,692,782,000
FY2003 Budget Estimate
TOTAL COUNTY CITY REAL PROPERTY: Full Year Basis Existing Properties $35,093,751,000 $32,455,309,000 $2,638,442,000 Full Year Basis New Construction 400,000,000 387,500,000 12,500,000 Half Year Basis New Construction 400,000,000 387,500,000 12,500,000TOTAL REAL PROPERTY $35,893,751,000 $33,230,309,000 $2,663,442,000
PERSONAL PROPERTY: Unincorporated Businesses 58,538,000 52,720,000 5,818,000 Corporations 1,156,269,000 1,058,763,000 97,506,000 Public Utilities 1,213,681,000 1,161,224,000 52,457,000TOTAL PERSONAL PROPERTY $2,428,488,000 $2,272,707,000 $155,781,000
TOTAL ASSESSABLE BASE $38,322,239,000 $35,503,016,000 $2,819,223,000
PROPERTY TAX RATES AND ESTIMATED YIELD PER ONE CENTS
FY2002 Revised EstimateTax Rate by Property Type Yield Per 1 ¢ Real Personal Real Personal
Outside City of Annapolis $0.960 $2.400 $2,971,000 $582,500Within City of Annapolis $0.556 $1.390 246,000 40,000
$3,217,000 $622,500
FY2003 Budget EstimateTax Rate by Property Type Yield Per 1 ¢ Real Personal Real Personal
Outside City of Annapolis $0.950 $2.375 $3,132,000 $582,500Within City of Annapolis $0.550 $1.375 258,000 40,000
$3,390,000 $622,500

FY2003 Budget General Fund Revenue Overview Page 29
ASSESSABLE BASE SUBJECT TO TAX CREDITSANNE ARUNDEL COUNTY, MARYLAND
FY2002 Revised EstimateTAX CREDIT PROGRAM TOTAL COUNTY CITY Agricultural Tax Credit $37,000,000 $37,000,000 $0Airport Noize Zone Tax Credit 270,000 270,000 0
Civic Association Tax Credit 60,000 60,000 0Community Revitalization Tax Credit 0 0 0Conservation Property Tax Credit 1,000,000 1,000,000 0Foreign Trade Zone Tax Credit 0 0 0Homeowners Tax Credit--Local 91,700,000 83,700,000 8,000,000Homeowners Tax Credit--State 360,600,000 310,600,000 50,000,000Homestead Tax Credit (104%) 452,000,000 388,000,000 64,000,000TOTAL $942,630,000 $820,630,000 $122,000,000
TOTAL BASE LESS CREDITS $35,051,551,000 $32,480,769,000 $2,570,782,000
FY2003 Budget EstimateTAX CREDIT PROGRAM TOTAL COUNTY CITY Agricultural Tax Credit $38,850,000 $38,850,000 $0Airport Noize Zone Tax Credit 284,000 284,000 0Civic Association Tax Credit 63,000 63,000 0Community Revitalization Tax Credit 21,000,000 21,000,000 0Conservation Property Tax Credit 1,050,000 1,050,000 0Foreign Trade Zone Tax Credit 31,600,000 31,600,000 0Homeowners Tax Credit--State 382,236,000 329,236,000 53,000,000Homeowners Tax Credit--Local 167,202,000 153,722,000 13,480,000Homestead Tax Credit (104%) 765,523,000 697,858,000 67,665,000TOTAL $1,407,808,000 $1,273,663,000 $134,145,000
TOTAL BASE LESS CREDITS $36,914,431,000 $34,229,353,000 $2,685,078,000

Office of the BudgetAnne Arundel County, Maryland
(410) 222-1222