Hyundai Motor Company Q4 2019 and Annual Business Results
28
Jan 22, 2020 Hyundai Motor Company Q4 2019 and Annual Business Results
Transcript of Hyundai Motor Company Q4 2019 and Annual Business Results

Jan 22, 2020
Hyundai Motor CompanyQ4 2019 and Annual Business Results

1
Cautionary Statement with Respect to Forward-Looking Statements
In the presentation that follows and in related comments by Hyundai Motor’s management, our use of the
words “expect,” “anticipate,” “project,” “estimate,” “forecast,” “objective,” “plan,” “goal,” “outlook,”
“target,” “pursue” and similar expressions is intended to identify forward looking statements.
The financial data discussed herein are presented on a preliminary basis before the audit from our
Independent Auditor; final data will be included in HMC’s Independent auditor’s report. While these
statements represent our current judgment on what the future may hold, and we believe these judgments
are reasonable, actual results may differ materially due to numerous important factors. Such factors
include, among others, the following : changes in economic conditions, currency exchange rates or
political stability; shortages of fuel, labor strikes or work stoppages; market acceptance of the
corporation’s new products; significant changes in the competitive environment; changes in laws,
regulations and tax rates; and the ability of the corporation to achieve reductions in cost and employment
levels to realize production efficiencies and implement capital expenditures at levels and times planned by
management.
We do not intend or assume any obligation to update any forward-looking statement, which speaks only
as of the date on which it is made.

Sales Summary
Table of Contents
P. 3 ~ 7
P. 8 ~ 20Financial Summary
Appendix P. 21 ~ 26

Sales Summary
Global wholesale P. 4 ~ 5
Sales Analysis P. 6 ~ 7

Korea
194195
China
207229
△9.8%
N. America
239232
Europe
(Thousand units)Q4 2018 Q4 2019
1,1961,226
Wholesale
△2.5%
Wholesale(ex.China)
982994
Russia
5452
India
133138
Others1
146153
S. America
7582
Global Wholesale
147146
Global Demand
HMC Global Sales3
Korea
US
Europe2
China
India
Global
Q4 2018 Q4 2019 YoY
(10K units)
△3.8%
48.3 49.2
436.8 429.1
+1.8%
619.1 591.3 △4.5%
78.7 78.7 △0.0%
4
2,359.8 2,331.5 △1.2%
+4.3% △1.2%
* Based on retail sales
+0.6% △0.4% +3.3%
△8.1% △4.2%
△1.8%
331.6 368.8 +11.2%
1 MEA, Asia-Pacific, Other regions, Commercial vehicles(ex. Korea CV)2 Western Europe excluding CV3 Wholesale including CV
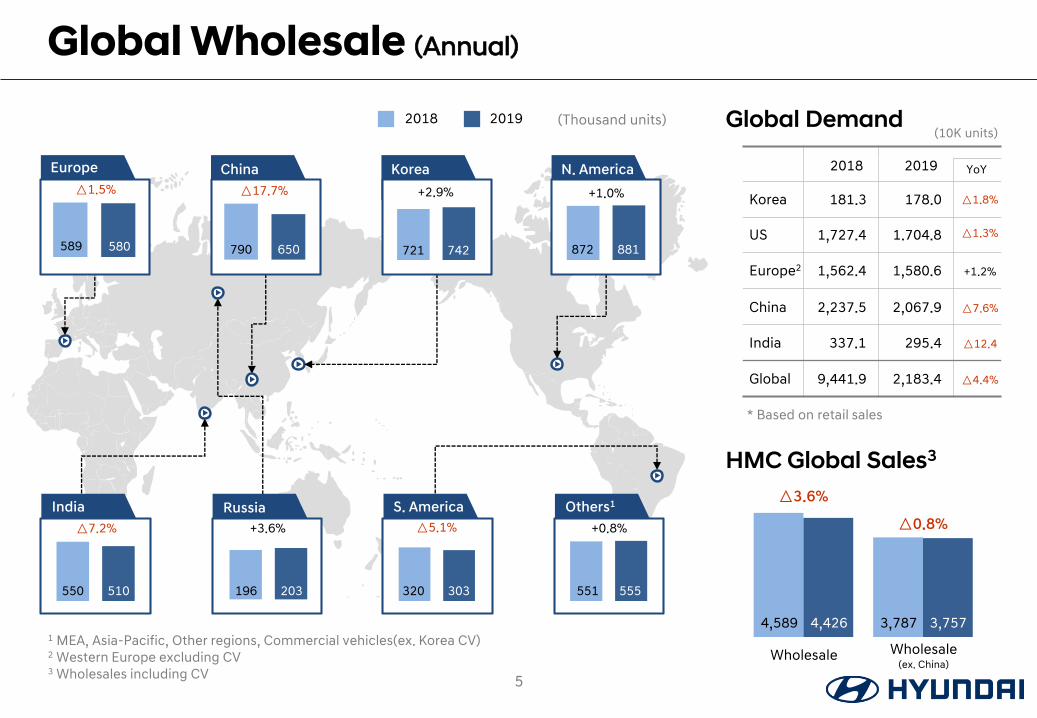
Korea
742721
China
650790
△17.7%
N. America
881872
Europe
2018 2019
4,4264,589
Wholesale
△3.6%
Wholesale(ex. China)
3,7573,787
Russia
203196
India
510550
Others1
555551
S. America
303320
Global Wholesale (Annual)
580589
Global Demand
HMC Global Sales3
Korea
US
Europe2
China
India
Global
2018 2019 YoY
(10K units)
△7.2%
181.3 178.0 △1.8%
1,727.4 1.704.8
1,562.4 1,580.6 +1.2%
2,237.5 2,067.9 △7.6%
337.1 295.4 △12.4
5
9,441.9 2,183.4 △4.4%
+3.6% △0.8%
+2.9% +1.0%
+0.8%△5.1%
△1.5%
△1.3%
1 MEA, Asia-Pacific, Other regions, Commercial vehicles(ex. Korea CV)2 Western Europe excluding CV3 Wholesales including CV
* Based on retail sales
(Thousand units)
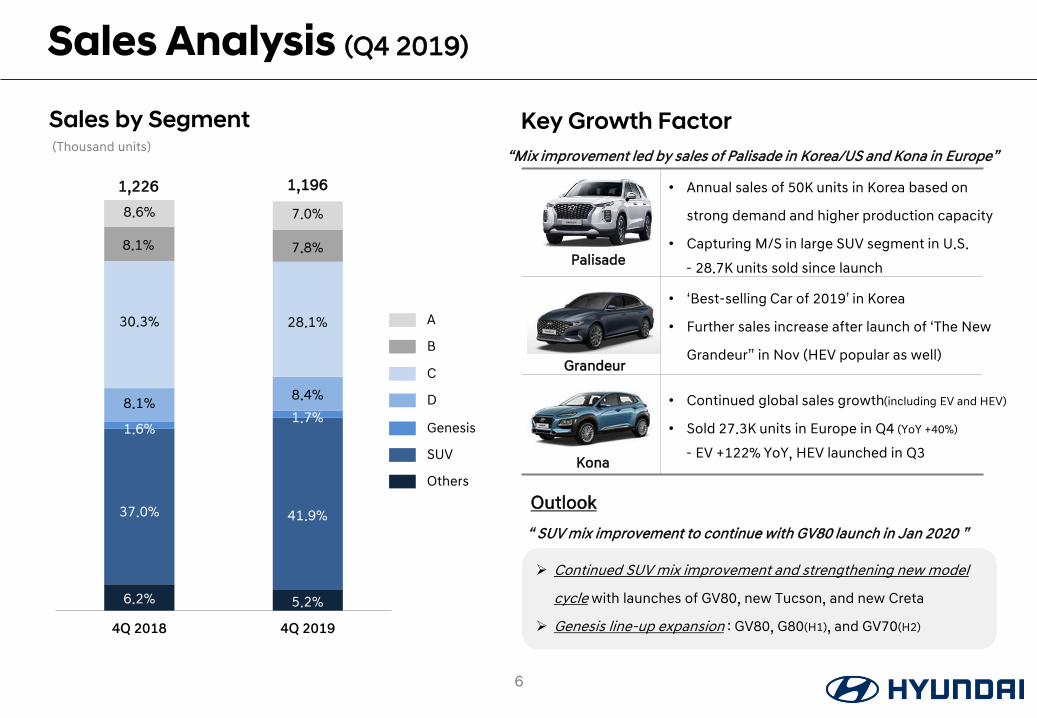
Continued SUV mix improvement and strengthening new model
cycle with launches of GV80, new Tucson, and new Creta
Genesis line-up expansion : GV80, G80(H1), and GV70(H2)4Q 2018 4Q 2019
1,226 1,196
Sales Analysis (Q4 2019)
Sales by Segment(Thousand units)
8.6%
8.1%
30.3%
8.1%
1.6%
37.0%
6.2%
7.0%
7.8%
28.1%
8.4%
1.7%
41.9%
5.2%
Key Growth Factor
• Annual sales of 50K units in Korea based on
strong demand and higher production capacity
• Capturing M/S in large SUV segment in U.S.
- 28.7K units sold since launch
• ‘Best-selling Car of 2019’ in Korea
• Further sales increase after launch of ‘The New
Grandeur” in Nov (HEV popular as well)
Palisade
Grandeur
6
“Mix improvement led by sales of Palisade in Korea/US and Kona in Europe”
Kona
• Continued global sales growth(including EV and HEV)
• Sold 27.3K units in Europe in Q4 (YoY +40%)
- EV +122% YoY, HEV launched in Q3
Outlook
“ SUV mix improvement to continue with GV80 launch in Jan 2020 ”
A
B
C
D
Genesis
SUV
Others
i10
i20
Elantra
Sonata
Creta
코나
투싼
싼타페
팰리세이드
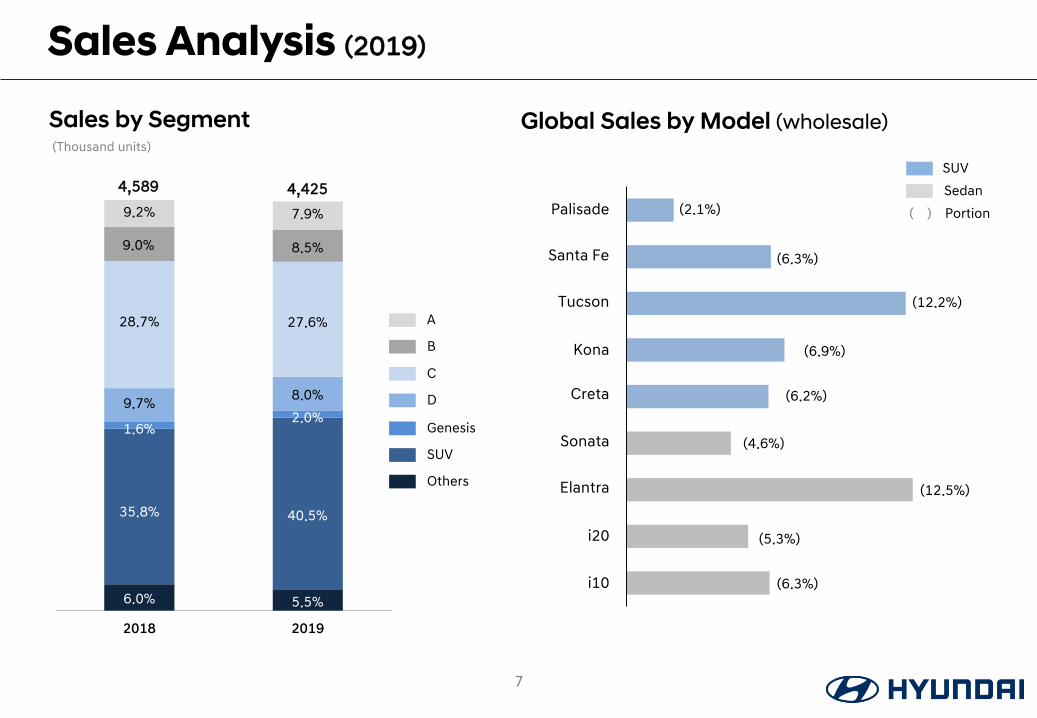
2018 2019
4,589 4,425
Sales by Segment(Thousand units)
9.2%
9.0%
28.7%
9.7%
1.6%
35.8%
6.0%
7.9%
8.5%
27.6%
8.0%
2.0%
40.5%
5.5%
Global Sales by Model (wholesale)
7
SUV
Sedan
(2.1%) ( ) Portion
(6.3%)
(12.2%)
(6.9%)
(6.2%)
(4.6%)
(12.5%)
(5.3%)
(6.3%)
Sales Analysis (2019)
A
B
C
D
Genesis
SUV
Others
Palisade
Santa Fe
Tucson
Kona
Creta
Sonata
Elantra
i20
i10

Financial Summary P. 9~10
Revenue by Divisions P. 11~12
Revenue Analysis P. 13~14
Operating Income Breakdown P. 15~16
Operating Income Analysis P. 17~18
Non-operating Income & Net Income P. 19~20
Financial Summary

Q4 2018 Q3 2019 Q4 2019 YoY QoQ
Revenue 25,231 26,969 27,868 +10.5% +3.3%
Cost of Good Sold 21,175 22,540 23,125 +9.2% +2.6%
Gross Profit 4,056 4,428 4,744 +17.0% +7.1%
Margin (%) 16.1% 16.4% 17.0%
SG&A 3,554 4,050 3,500 △1.5% △13.6%
Operating Income 501 379 1,244 +148.2% +228.5%
Margin (%) 2.0% 1.4% 4.5%
Non-operating Income
△389 50 △32
Tax 316 △31 360 13.9% -
Net Income △203 460 851 Turn-to-Profit +84.8%
Financial Summary (Q4 2019)
9
(Billion KRW)
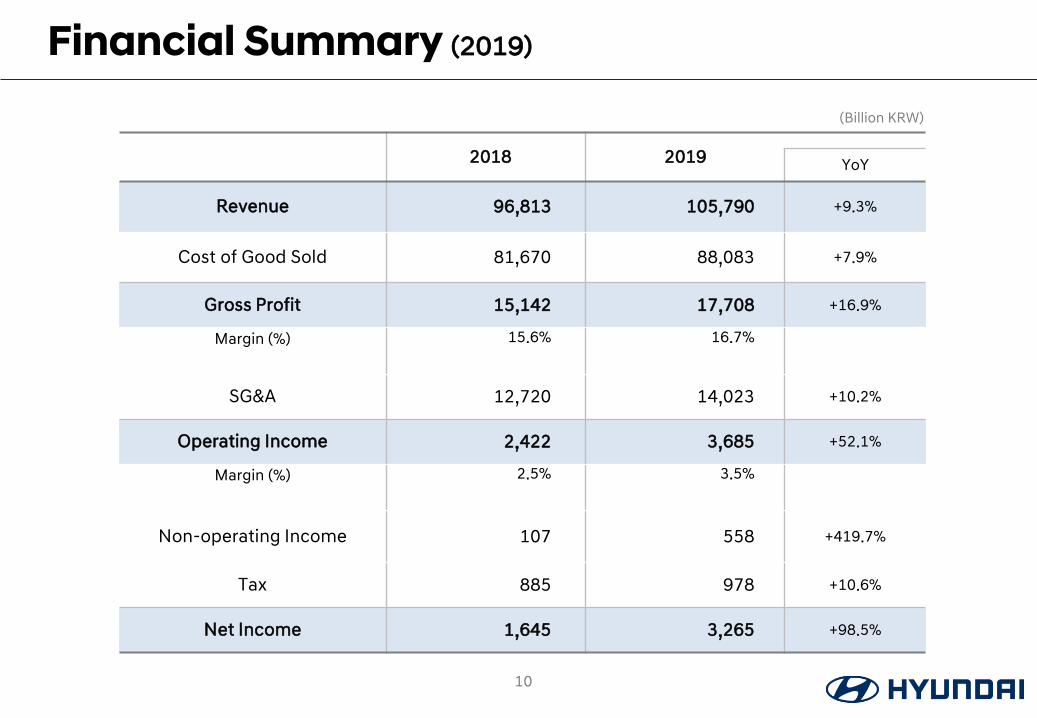
2018 2019 YoY
Revenue 96,813 105,790 +9.3%
Cost of Good Sold 81,670 88,083 +7.9%
Gross Profit 15,142 17,708 +16.9%
Margin (%) 15.6% 16.7%
SG&A 12,720 14,023 +10.2%
Operating Income 2,422 3,685 +52.1%
Margin (%) 2.5% 3.5%
Non-operating Income 107 558 +419.7%
Tax 885 978 +10.6%
Net Income 1,645 3,265 +98.5%
(Billion KRW)
10
Financial Summary (2019)

Automotive
Revenue by Division (Q4 2019)
Finance Others
20,399 22,232
Q4 2018 Q4 2019
2,923
3,657
Q4 2018 Q4 2019
1,908 1,979
Q4 2018 Q4 2019
(Billion KRW)
Mix improvementIncrease in new vehicle sales
in Korea / U.S.Continued sales growth
11
+1,833(+9.0%)
+71(+3.7%)
+734(+25.1%)

75,265 82,487
2018 2019
14,958
16,026
2018 2019
6,589 7,277
2018 2019
Improved residual value
12
+7,221(+9.6%)
+688(+10.4%)
+1,068(+7.1%)
Automotive Finance Others(Billion KRW)
Mix improvement and incentive reduction
Continuous sales growth
Revenue by Division (2019)
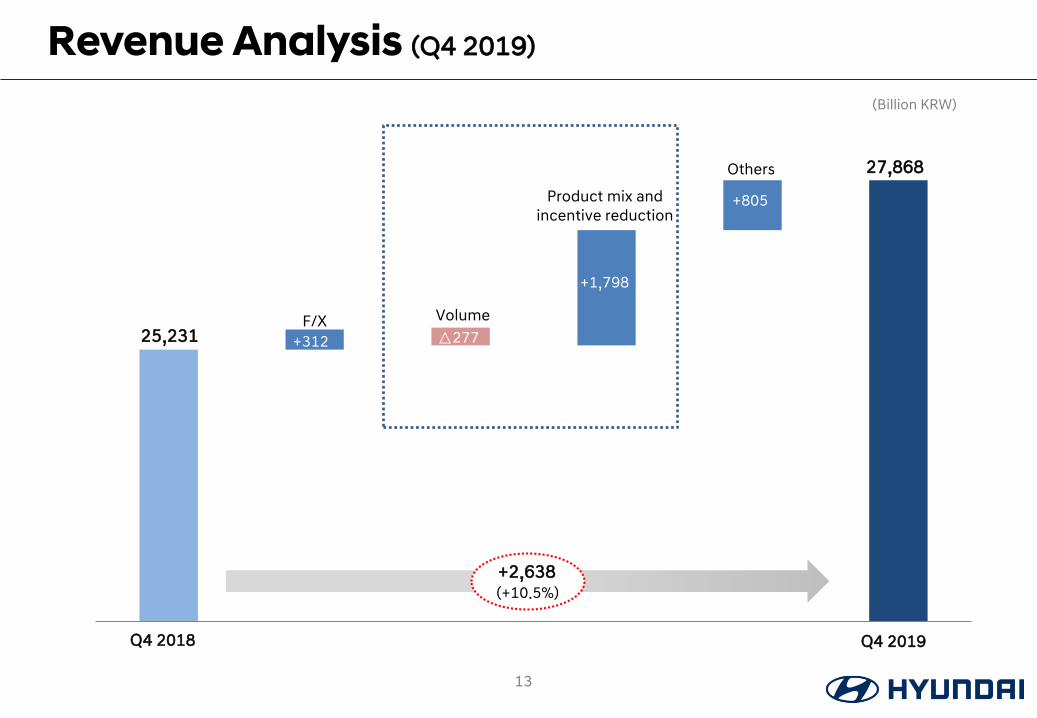
Revenue Analysis (Q4 2019)
Q4 2018 Q4 2019
25,231
27,868
(Billion KRW)
13
+1,798
+2,638(+10.5%)
+312
+805
△277
△277
Volume
Product mix andincentive reduction
F/X
Others

2018 2019
96,813
105,790
(Billion KRW)
Volume
Product mix andincentive reduction
F/X
Others
14
+6,703
+8,978(+9.3%)
+1,198
+1,757
+1,198
△680
Revenue Analysis (2019)

37
(109)
38 110
143
463
1,045
Q4 2018 Q4 2019
501
1,244
70% 75% 80% 85%
Q4 2019
Q4 2018
Operating Income Breakdown (Q4 2019)
Operating Income by Division COGS ratio
SG&A
83.9%
83.0%
1Commission fees, depreciation, etc.
15
(Billion KRW)
+742(+148.2%)
17
Automotive
Finance
Others
Adjustment
Others1
Research
Expenses forWarranties
Marketing
Salary
950 933
435 437
362 244
1,024 1,079
784 807
Q4 2018 Q4 2019
3,5003,554△55
(△1.5%)

508
-
105
179
747
888
1,062
2,618
2018 2019
2,422
3,685
70% 75% 80% 85%
2019
2018 84.4%
83.3%
16
+1,263(+52.1%)
3,353 3,505
1,126 1,290
1,998 2,596
3,438 3,735
2,805
2,897
2018 2019
14,02312,720
+1,303(+10.2%)
Operating Income Breakdown (Q4 2019)
Operating Income by Division COGS ratio
SG&A
1Commission Fees, depreciation, etc.
(Billion KRW)
Automotive
Finance
Others
Adjustment
Others1
Research
Expenses forWarranties
Marketing
Salary

Operating Income Analysis (Q4 2019)
17
Q4 2018 Q4 2019
501
1,244
△47
(Billion KRW)
Volume
Mix
FinanceDivisionCost
Improvement OtherExpenses
F/X
+143△23
+742(+148.2%)
+264
+318
+352

18
2018 2019
2,422
3,685△1,711
+888
△305
+1,263(+52.1%)
+264
+1,404
+987
Operating Income Analysis (2019)
(Billion KRW)
Volume
Mix
FinanceDivision
CostImprovement Other
Expenses
F/X

Non-operating Income & Net Income (Q4 2019)
Non-operating Income Net Income
△130
839
△74
12
Q4 2018 Q4 2019
△203
851
19
(Billion KRW)
+1,054(Turn-to-Profit)
Finance
EquityIncome
Others
△168
100 39
137
△206
△270
Q4 2018 Q4 2019
△ 389
(loss decrease)
△ 32
+356
Non-controlling
Controlling

405 543
223
352
△520
△336
2018 2019
107
1,508
3,014137
250
2018 2019
1,645
3,265
20
(+419.7%)+1,620
(+98.5)
558+451
Non-operating Income & Net Income (2019)
Non-operating Income Net Income(Billion KRW)
Finance
EquityIncome
Others
Non-controlling
Controlling

Appendix
Retail Sales by Region P. 23
Statement of Income P. 24
Statement of Financial Position P. 25
Statement of Cash Flows P. 26
2020 Business Plan P. 22
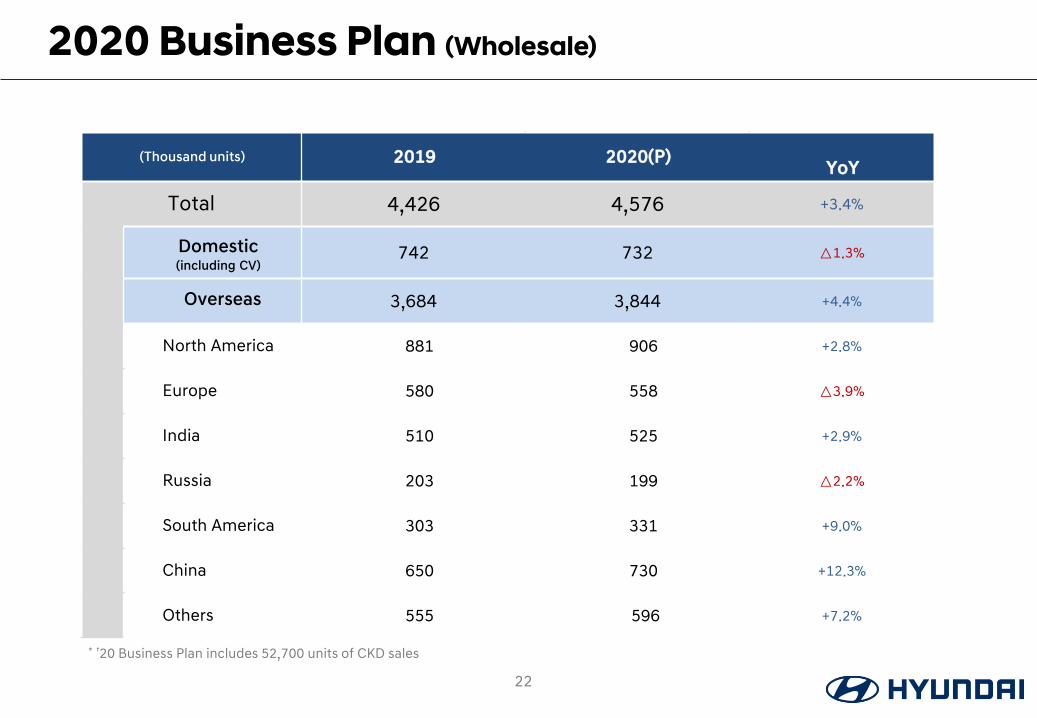
2020 Business Plan (Wholesale)
22
(Thousand units) 2019 2020(P)YoY
Total 4,426 4,576 +3.4%
742 732 △1.3%
3,684 3,844 +4.4%
North America 881 906 +2.8%
Europe 580 558 △3.9%
India 510 525 +2.9%
Russia 203 199 △2.2%
South America 303 331 +9.0%
China 650 730 +12.3%
Others 555 596 +7.2%
Domestic(including CV)
Overseas
* ’20 Business Plan includes 52,700 units of CKD sales

(Thousand units) Q4 2018 2018 Q4 2019 2019Q4 2019
vsQ4 2018
2019vs
2018
Korea 195 721 194 742 △0.4% +2.9%
US 176 678 189 710 +7.1% +4.7%
Western Europe 127 539 133 536 +4.3% △0.6%
India 152 544 154 515 +0.9% △5.3%
AMEA 81 297 84 325 +4.4% +9.5%
Brazil 49 189 49 198 +0.7% +4.5%
Russia 47 180 48 181 +0.4% +0.5%
Others 142 589 142 553 △0.2% △6.0%
Sub-total(ex-China)
970 3,737 992 3,760 +2.3% +0.6%
China 221 746 194 710 △12.2% △4.8%
China (CV) 3 12 2 6 △20.7% △50.3%
Total 1,193 4,495 1,188 4,476 △0.4% △0.4%
Retail Sales by Region
23

(Billion KRW) Q4 2018 Q1 2019 Q2 2019 Q3 2019 Q4 2019YoY QoQ
Revenue 25,231 23,987 26,966 26,969 27,868 +10.5% +3.3%
Gross Profit 3,999 3,913 4,623 4,428 4,744 +17.0% +7.1%
Margin (%) 15.8 16.3 17.1 16.4 17.0
SG&A 3,554 3,088 3,385 4,050 3,500 △1.5% △13.6%
Portion (%) 14.1 12.9 12.6 15.0 12.6
Operating Income 501 825 1,238 379 1,244 +148.2% +228.6%
Margin (%) 2.0 3.4 4.6 1.4 4.5
Income before tax 113 1,217 1,386 429 1,211 +975.9% +182.3%
Margin (%) 0.4 5.1 5.1 1.6 4.3
Net Income △203 954 999 460 851 Turn-to-Profit +84.8%
Margin (%) NM 4.0 3.7 1.7 3.1
D&A1 954 959 994 1,018 1,042
EBITDA 1,455 1,784 2,232 1,396 2,286
Statement of Income
24
1 IFRS 16, depreciation of lease assets included

(Billion KRW) Q3 2019 Q4 2019Diff. % change
Asset 191,670 194,565 2,895 1.5%
Current Asset(a) 75,868 76,137 268 0.4%
Liabilities(b) 115,645 118,120 2,475 2.1%
Current Liability(c) 54,258 53,301 △957 △1.8%
Debt(d) 79,668 81,372 1,704 2.1%
Provision(g) 7,593 7,126 △467 △6.1%
Equity(e) 76,025 76,445 420 0.6%
Capital Stock 1,489 1,489 - -
Capital Surplus 4,195 4,197 2 0.1%
Retained Earnings 67,439 68,284 845 1.3%
Current Ratio(a/c) 139.8% 142.8%
Liability to Equity(b/e) 152.1% 154.5%
Debt to Equity(d/e) 104.8% 106.4%
Statement of Financial Position
25

Statement of Cash Flows
26
(Billion KRW) Q4 2018 Q1 2019 Q2 2019 Q3 2019 Q4 2019
Beginning 9,336 9,114 8,953 9,492 9,209
Net Income △203 954 999 461 851
Depreciation 611 605 629 646 665
Amortization 343 314 322 325 326
Acquisition of Tangible △1,051 △1,047 △621 △862 △2,007
Acquisition of Intangible △651 △279 △351 △418 △669
Dividends paid - △4 △855 △263 -
Others1) 729 △705 416 △172 307
Ending 9,114 8,953 9,492 9,209 8,682
1 IFRS 16, depreciation of lease assets included

Thank you


![The Hyundai Motor Company[1]](https://static.fdocuments.in/doc/165x107/577ce3b51a28abf1038ccead/the-hyundai-motor-company1.jpg)