Hyundai Motor Company 2013AnnualBusiness Resultshmc/documents… · Appendix Sales Summary ... Mkt....
24
Hyundai Motor Company 2013 Annual Business Results January 23, 2014
Transcript of Hyundai Motor Company 2013AnnualBusiness Resultshmc/documents… · Appendix Sales Summary ... Mkt....

Hyundai Motor Company2013 Annual Business ResultsJanuary 23, 2014

Cautionary Statement with Respect to Forward-Looking Statements
In the presentation that follows and in related comments by Hyundai Motor’s management, our useof the words “expect,” “anticipate,” “project,” “estimate,” “forecast,” “objective,” “plan,” “goal,”“outlook,” “target,” “pursue” and similar expressions is intended to identify forward lookingstatements.
The financial data discussed herein are presented on a preliminary basis before the audit fromIndependent Auditor; final data will be included in HMC’s Independent auditors report. While thesestatements represent our current judgment on what the future may hold, and we believe thesejudgments are reasonable, actual results may differ materially due to numerous important factors.Such factors include, among others, the following : changes in economic conditions, currencyexchange rates or political stability; shortages of fuel, labor strikes or work stoppages; marketacceptance of the corporation’s new products; significant changes in the competitive environment;changes in laws, regulations and tax rates; and the ability of the corporation to achieve reductions incost and employment levels to realize production efficiencies and implement capital expenditures atlevels and times planned by management.
We do not intend or assume any obligation to update any forward-looking statement, which speaksonly as of the date on which it is made.

Sales Summary
Financial Summary
Revenue & Profit Analysis
Table of ContentsTable of Contents
Appendix

Sales Summary
◇ Retail Sales
◇ Wholesale

2012 2013
1
4,6214,392
2012
1,027847405444
1,8281,731
2013
+5.2%
641667
721703
+2.5%△4.0%
+21.2%
△8.8%
+5.6%
4,732 (7.3%↑yoy)
E U China
Korea
US
Others
Source : Company data (Includes shipment of LCV / Excludes CKD sales)
(Unit : 1,000 vehicles)
Sales Summary : Retail Sales
Global Retail SalesGlobal Plant Sales

294 269
145134
52
2012 2013
CV RV PC
575 590
128 131
2012 2013RV PC
2
393 345
112 135
162 161
2012 2013
CV RV PC
47.3% 46.4%
M/S
667 641-4.0%
4.9% 4.6%
703 721+2.5%
3.5% 3.3%
444 405-8.8%
M/S M/S
Source : Company Data / Automotive News / ACEA
Sales Results by Key Region
Korea US EU
(Unit : 1,000 vehicles)
■ Reduction in market demand (10.3%↓) and aged modelscaused decrease in sales
■ RV sales portion increased (20.1%↑) with Santa Fe
■ Strong sales of Elantra(MD 218,429 / 21%↑yoy)
■ 54% of Industry Avg. Incentive(’13.1~4Q Avg. : $1,377/unit)
■ Due to the decrease in market demand(2.0%↓), the sales has decreased.
■ Pursue qualitative growthover quantitative growth.

45 27
167 225
229 86 104
303 304 361 399
641 633
856 1,031
1,911 1,820
2012 2013
Korea
China
India
US
Czech
Turkey
Russia
Brazil
China CV
3
60.4% 60.2%
17.3% 15.5%
16.3% 17.9%
6.0% 6.4%
2012 2013
CV
RV
Mid
PC
4,4104,732
+7.3%
Sales Summary : Wholesale
Sales Volume by plant Sales Mix by Segment
(Unit : 1,000 vehicles)
• Sales volume by plant (Wholesale basis)

◇ Statement of Income
◇ Statement of Financial Position
Financial Summary (K-IFRS)
◇ Cash Flow Highlights
◇ Financial Summary by division

2012 2013 Change
Sales Revenue 84,470 87,308 3.4%Gross Profit 19,502 19,448 △0.3%
Margin (%) 23.1 22.3SG&A 11,061 11,132 0.6%
Portion (%) 13.1 12.8Operating Profit 8,441 8,316 △1.5%
Margin (%) 10.0 9.5Recurring Profit 11,610 11,697 0.7%
Margin (%) 13.7 13.4Net Profit 9,061 8,994 △0.7%
Margin (%) 10.7 10.3Depreciation 1,698 1,769Amortization 823 782EBITDA 10,961 10,867
4
Consolidated Statement of Income
(KRW Billion)
• Consolidated Statement of Income (K-IFRS), Business results of BHMC is accounted in equity income accounting• Operating income presentation adjusted • Net Profit includes non-controlling interest

5
2012 2013 Change
Sales Revenue 84,470 87,308 3.4%
Automotive 71,307 71,535 0.3%
Finance 8,663 9,893 14.2%
Other 4,500 5,880 30.7%
Operating Profit 8,441 8,316 △1.5%
Automotive 6,719 6,413 △4.6%
Finance 1,178 1,120 △4.9%
Other 255 388 52.6%
Consolidation adjustment 289 394 36.3%
Financial Summary by Division
(KRW Billion)
• Consolidated Statement of Income (K-IFRS)

2012 2013 Change
Assets 121,538 133,422 11,884
Current Assets 54,848 58,856 4,009
Cash & Cash Equivalents* 19,143 21,748 2,604
Liabilities 73,620 76,839 3,218
Current Liabilities 32,836 31,920 △916
Short & Long-Term Debt 45,207 47,967 2,760
Provision 7,009 6,906 △103
Equity 47,918 56,583 8,665
Current Ratio (%) 167.0 184.4
Debt / Equity Ratio (%) 94.3 84.8
Net Debt 26,064 26,219
EBITDA / Interest Expense 25.7 x 31.8 x
6
Consolidated Statement of Financial Position
(KRW Billion)
• Consolidated Statement of Financial Position (K-IFRS)• Cash & Cash Equivalents : Cash & cash equivalents + Short-term financial instruments

7
6,759
+ 2,551
+ 8,994 △ 7,270
△ 4,162
6,872
BeginningCash Balance
EndingCash Balance
Net Income
Depreciation /Amortization
Tangible /Intangible Asset
Others
(KRW Billion)
• Consolidated Cash Flow Highlights (K-IFRS) • Above figures includes consolidation adjustments by business division (Automotive / Finance / Others)
Consolidated Cash Flow Highlights

◇ Sales Revenue Analysis
◇ COGS and SG&A
◇ Other Items
Revenue & Profit Analysis

8
Start of Brazil PlantAdditional Capacity at Turkey PlantIncrease in sales portion of RV
4,500 5,880 8,663 9,893
71,307 71,535
2012 2013
84,47087,308 + 2,838
(3.4%↑)
KRW depreciation against the USDUSD / KRW 1,124.9 1,092.8 (△2.9%)
Increase in incentive spending
• BHMC(Chinese Plants) under the equity method• Revenue from each business segment(Auto, Finance, Others) under the consolidated basis
Sales Revenue Positive/ Negative Contributors
(KRW Billion)
Positive Factors
Negative Factors
Sales Revenue Analysis
Automotive Finance Others

9
76.9% 77.7%
2012 2013 2012 2013
+0.8%pt 11,062 11,133+0.6%
2.7%
3.6%
0.3%1.1%
5.3%
2.8%
3.4%
0.2%0.9%
5.4%
COGS and SG&A
SG&ACOGS
(% of Revenue) (% of Revenue, KRW billion)
Provision
Warranties
Mkt. Exp.
Salary
SG&A
Others
• Consolidated Statement of Income (K-IFRS)

10
20132012
243 71 345253
2,5823,057
2012 : 3,169 2013 : 3,381
20132012 20132012
• Consolidated Statement of Income (K-IFRS)
Other Itmes
Other Items
(KRW Billion)
Other Other Income / Expense
Finance Finance Income / Expense Equity Earnings

2014 Business Plan
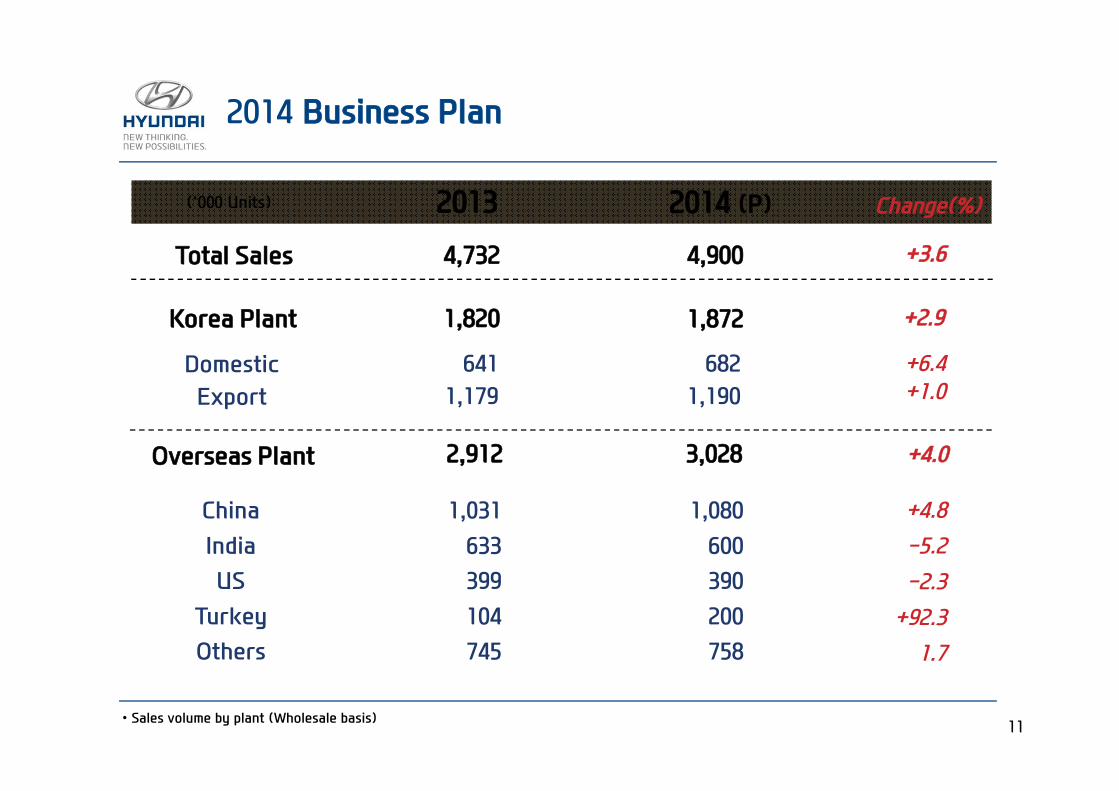
Total Sales +3.64,732
1,820Korea Plant
DomesticExport
6411,179
4,900
1,872
6821,190
Overseas Plant 2,912
ChinaIndiaUS
TurkeyOthers
1,031633399104745
3,028
+2.9
+6.4+1.0
+4.0
+4.8-5.2-2.3+92.31.7
Change(%)2013 2014 (P)
11
(‘000 Units)
1,080600390200758
2014 Business Plan
• Sales volume by plant (Wholesale basis)

Appendix
◇ Overseas Plant Operations
◇ Statement of Income (Quarterly)

360 412
117 135
165
210
214
274
2012 2013
Elantra Sonata Tucson 기타
222 205
139 194
2012 2013
Sonata Elantra
11
2012 2012 Chg.
Rev. 6,992 7,385 5.6%
2012 2013 Chg.
Rev. 14,519 19,433 34%
399361
856
1,031
Overseas Plant : HMMA & BHMC
US Plant (HMMA) China Plant (BHMC)
Sales Volume Revenue Sales Volume Revenue
(Unit : 1,000 vehicles / KRW Billion)
• Above figures are standalone results base

12
2012 2013 Chg.
Rev. 5,097 4,737 △7%
2012 2013 Chg.
Rev. 1,576 1,816 15%
251 216
135 130
113 110
142 177
2012 2013
i10 i20
Eon Others
633641
318
83
86
2012 2013
Accent i10 i20
86
104
Sales Volume Revenue Sales Volume Revenue
India Plant (HMI) Turkey Plant (HAOS)
(Unit : 1,000 vehicles / KRW Billion)
Overseas Plant : HMI & HAOS
• Above figures are standalone results base

13
2012 2013 Chg.
Rev. 5,311 5,450 2.6%
2012 2013 Chg.
Rev. 2,855 2,751 △3.6%
131 124
45 35
127 145
2012 2013
i30 ix20 ix35
304303
125 128
100 101
2012 2013
Solaris Rio (Kia)
229225
Czech Plant (HMMC) Russia Plant (HMMR)
Sales Volume Revenue Sales Volume Revenue
(Unit : 1,000 vehicles / KRW Billion)
Overseas Plant : HMMC & HMMR
• Above figures are standalone results base

14
2012 2013 Chg.
Rev. 414 2,384 -
27
167
2012 2013
HB
167
27
Overseas Plant : HMB
Brazil Plant (HMB)
Sales Volume Revenue
(Unit : 1,000 vehicles / KRW Billion)
• Above figures are standalone results base

15
2012 2013 2012 vs.20134Q Total 1Q 2Q 3Q 4Q Total
Global Plant Sales 1,227 4,410 1,172 1,219 1,109 1,232 4,732 7.3%
Korea Plant 528 1,911 447 475 403 496 1,820 △4.8%
Overseas Plant 699 2,499 725 744 706 736 2,912 16.5%
Sales Revenue 22,719 84,470 21,367 23,184 20,819 21,938 87,308 3.4%
Gross Profit 5,008 19,502 4,704 5,319 4,604 4,821 19,448 △0.3%
Margin (%) 22.0 23.1 22.0 22.9 22.1 22.0 22.3SG&A 3,175 11,062 2,836 2,912 2,594 2,791 11,133 0.6%
Portion(%) 14.0 13.1 13.3 12.6 12.5 12.7 12.8Operating Profit 1,833 8,441 1,869 2,407 2,010 2,030 8,316 △1.5%
Margin (%) 8.1 10.0 8.7 10.4 9.7 9.3 9.5Recurring Profit 2,533 11,610 2,744 3,195 2,815 2,943 11,697 0.7%
Margin (%) 11.1 13.7 12.8 13.8 13.5 13.4 13.4Net Profit 1,894 9,061 2,088 2,524 2,252 2,130 8,994 △0.7%
Margin (%) 8.3 10.7 9.8 10.9 10.8 9.7 10.3
Statement of Income (Quarterly)
(Unit : 1,000 vehicles / KRW Billion)
• Consolidated Statement of Income (K-IFRS), Business results of BHMC is accounted in equity income accounting• Operating income presentation adjusted • Net Profit includes non-controlling interest