Hyundai Motor Company 1H 2020 Consolidated Final
62
HYUNDAI MOTOR COMPANY AND ITS SUBSIDIARIES CONSOLIDATED FINANCIAL STATEMENTS FOR THE THREE-MONTH AND SIX-MONTH PERIODS ENDED June 30, 2020 AND 2019 (Unaudited) ATTACHMENT: INDEPENDENT AUDITORS’ REVIEW REPORT HYUNDAI MOTOR COMPANY
Transcript of Hyundai Motor Company 1H 2020 Consolidated Final
HYUNDAI MOTOR COMPANY AND ITS SUBSIDIARIES
CONSOLIDATED FINANCIAL STATEMENTS FOR THE THREE-MONTH AND SIX-MONTH PERIODS ENDED June 30, 2020 AND 2019 (Unaudited)
ATTACHMENT: INDEPENDENT AUDITORS’ REVIEW REPORT
HYUNDAI MOTOR COMPANY
Contents
INDEPENDENT AUDITORS’ REVIEW REPORT ----------------------------------------------------------- 1 CONSOLIDATED FINANCIAL STATEMENTS
CONSOLIDATED STATEMENTS OF FINANCIAL POSITION ----------------------------------- 4 CONSOLIDATED STATEMENTS OF INCOME ------------------------------------------------------ 6 CONSOLIDATED STATEMENTS OF COMPREHENSIVE INCOME --------------------------- 7 CONSOLIDATED STATEMENTS OF CHANGES IN EQUITY ------------------------------------ 8 CONSOLIDATED STATEMENTS OF CASH FLOWS ----------------------------------------------- 10 NOTES TO THE CONSOLIDATED FINANCIAL STATEMENTS --------------------------------- 12
152, Teheran-ro, Gangnam-gu, Seoul 06236(Yeoksam-dong, Gangnam Finance Center 27th Floor)Republic of Korea
Independent Auditors’ Review Report
The Board of Directors and Shareholders Hyundai Motor Company:
Reviewed financial statements We have reviewed the accompanying condensed consolidated interim financial statements of Hyundai Motor Company and its subsidiaries (the “Group”), which comprise the condensed consolidated statement of financial position as of June 30, 2020, the condensed consolidated statements of income, comprehensive income for the three-month and six-month periods ended June 30, 2020 and 2019, the condensed consolidated statements of changes in equity and cash flows for the six-month periods ended June 30, 2020 and 2019 and notes, comprising a summary of significant accounting policies and other explanatory information.
Management’s responsibility Management is responsible for the preparation and fair presentation of these condensed consolidated interim financial statements in accordance with Korean International Financial Reporting Standards (“K-IFRS”) No.1034 Interim Financial Reporting, and for such internal control as management determines is necessary to enable the preparation of financial statements that are free from material misstatement, whether due to fraud or error.
Auditors’ review responsibility Our responsibility is to issue a report on these condensed consolidated interim financial statements based on our reviews.
We conducted our reviews in accordance with the Review Standards for Quarterly and Semiannual Financial Statements established by the Securities and Futures Commission of the Republic of Korea. A review of interim financial information consists of making inquiries, primarily of persons responsible for financial and accounting matters, and applying analytical and other review procedures. A review is substantially less in scope than an audit conducted in accordance with Korean Standards on Auditing and consequently does not enable us to obtain assurance that we would become aware of all significant matters that might be identified in an audit. Accordingly, we do not express an audit opinion.
Conclusion Based on our reviews, nothing has come to our attention that causes us to believe that the accompanying condensed consolidated interim financial statements referred to above are not prepared, in all material respects, in accordance with K-IFRS No.1034 Interim Financial Reporting. . Other matters The consolidated statement of financial position as of December 31, 2019, and the related consolidated statements of income, comprehensive income, changes in equity and cash flows for the year then ended, which are not accompanying this report, were audited by us in accordance with Korean Standards on Auditing and our report thereon, dated March 4, 2020, expressed an unqualified opinion. The accompanying statement of financial position as of December 31, 2019, presented for comparative purposes, is not different from that audited by other us from which it was derived in all material respects.
The procedures and practices utilized in the Republic of Korea to review such condensed consolidated interim financial statements may differ from those generally accepted and applied in other countries.
ssssssssssssssssssssssssssss
Seoul, Korea August 14, 2020
This report is effective as of August 14, 2020, the review report date. Certain subsequent events or circumstances, which may occur between the review report date and the time of reading this report, could have a material impact on the accompanying condensed consolidated interim financial statements and notes thereto. Accordingly, the readers of the review report should understand that the above review report has not been updated to reflect the impact of such subsequent events or circumstances, if any.
cc
새 스탬프
HYUNDAI MOTOR COMPANY AND ITS SUBSIDIARIES
CONSOLIDATED FINANCIAL STATEMENTS FOR THE THREE-MONTH AND SIX-MONTH PERIODS ENDED JUNE 30, 2020 AND 2019
The accompanying consolidated financial statements, including all footnote disclosures, were prepared by, and are the responsibility of, the Company.
Lee, Won Hee Chief Executive Officer HYUNDAI MOTOR COMPANY
Main Office Address: (Road Name Address) 12, Heolleung-ro, Seocho-gu, Seoul (Phone Number) 02-3464-1114
HYUNDAI MOTOR COMPANY AND ITS SUBSIDIARIES
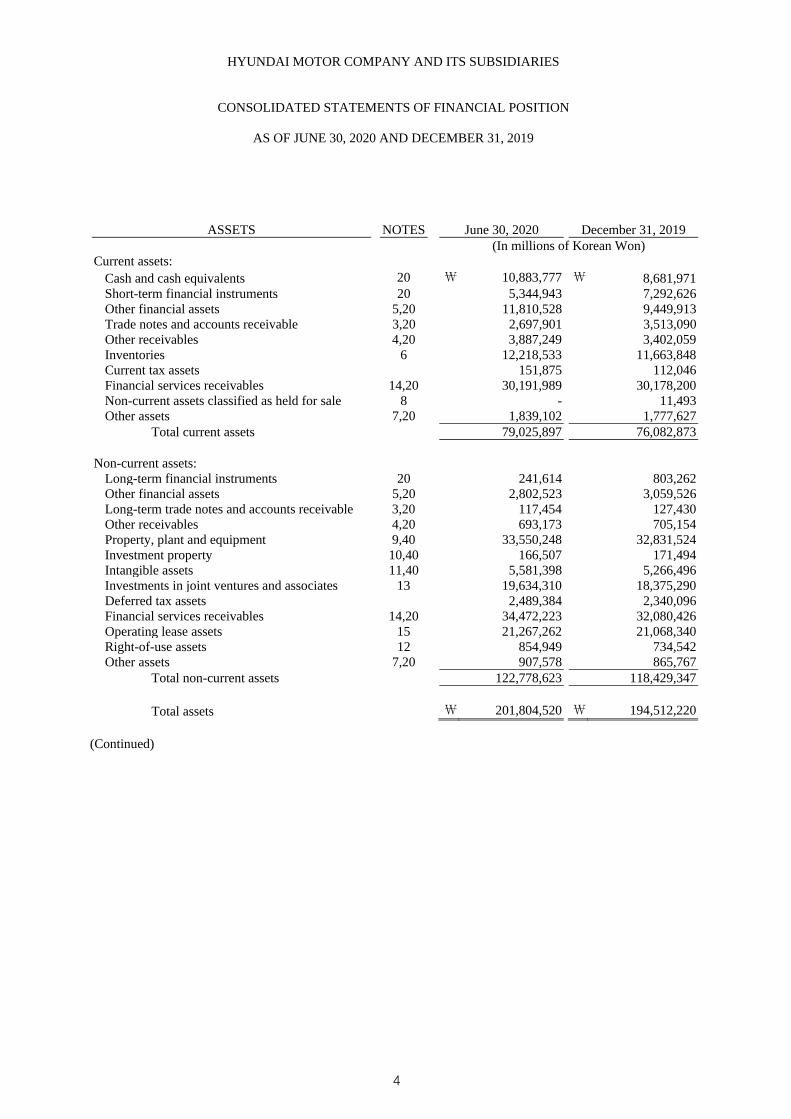
CONSOLIDATED STATEMENTS OF FINANCIAL POSITION
AS OF JUNE 30, 2020 AND DECEMBER 31, 2019
ASSETS NOTES June 30, 2020 December 31, 2019 (In millions of Korean Won)
Current assets: Cash and cash equivalents 20 ₩ 10,883,777 ₩ 8,681,971 Short-term financial instruments 20 5,344,943 7,292,626 Other financial assets 5,20 11,810,528 9,449,913 Trade notes and accounts receivable 3,20 2,697,901 3,513,090 Other receivables 4,20 3,887,249 3,402,059Inventories 6 12,218,533 11,663,848Current tax assets 151,875 112,046 Financial services receivables 14,20 30,191,989 30,178,200 Non-current assets classified as held for sale 8 - 11,493Other assets 7,20 1,839,102 1,777,627
Total current assets 79,025,897 76,082,873
Non-current assets: Long-term financial instruments 20 241,614 803,262 Other financial assets 5,20 2,802,523 3,059,526 Long-term trade notes and accounts receivable 3,20 117,454 127,430 Other receivables 4,20 693,173 705,154 Property, plant and equipment 9,40 33,550,248 32,831,524Investment property 10,40 166,507 171,494Intangible assets 11,40 5,581,398 5,266,496 Investments in joint ventures and associates 13 19,634,310 18,375,290 Deferred tax assets 2,489,384 2,340,096 Financial services receivables 14,20 34,472,223 32,080,426 Operating lease assets 15 21,267,262 21,068,340 Right-of-use assets 12 854,949 734,542 Other assets 7,20 907,578 865,767
Total non-current assets 122,778,623 118,429,347
Total assets ₩ 201,804,520 ₩ 194,512,220
(Continued)
HYUNDAI MOTOR COMPANY AND ITS SUBSIDIARIES
CONSOLIDATED STATEMENTS OF FINANCIAL POSITION
AS OF JUNE 30, 2020 AND DECEMBER 31, 2019
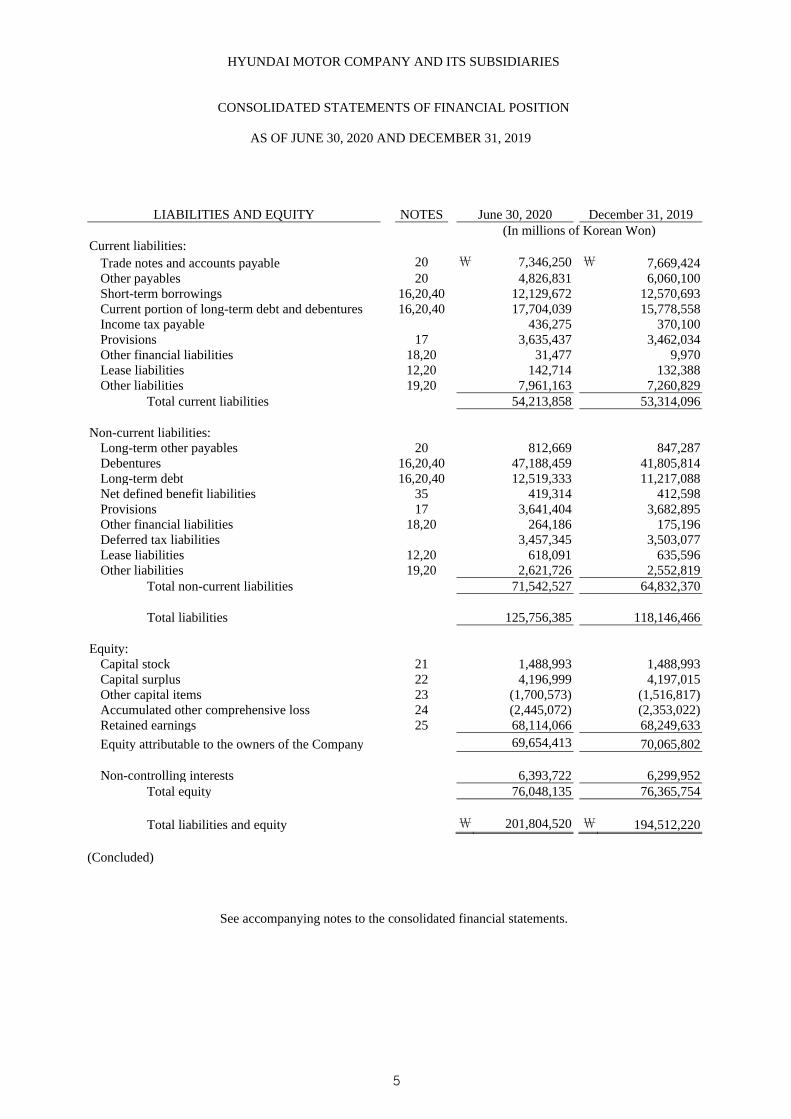
LIABILITIES AND EQUITY NOTES June 30, 2020 December 31, 2019 (In millions of Korean Won)
Current liabilities: Trade notes and accounts payable 20 ₩ 7,346,250 ₩ 7,669,424 Other payables 20 4,826,831 6,060,100Short-term borrowings 16,20,40 12,129,672 12,570,693Current portion of long-term debt and debentures 16,20,40 17,704,039 15,778,558 Income tax payable 436,275 370,100Provisions 17 3,635,437 3,462,034Other financial liabilities 18,20 31,477 9,970 Lease liabilities 12,20 142,714 132,388 Other liabilities 19,20 7,961,163 7,260,829
Total current liabilities 54,213,858 53,314,096
Non-current liabilities: Long-term other payables 20 812,669 847,287Debentures 16,20,40 47,188,459 41,805,814Long-term debt 16,20,40 12,519,333 11,217,088Net defined benefit liabilities 35 419,314 412,598 Provisions 17 3,641,404 3,682,895Other financial liabilities 18,20 264,186 175,196 Deferred tax liabilities 3,457,345 3,503,077 Lease liabilities 12,20 618,091 635,596 Other liabilities 19,20 2,621,726 2,552,819
Total non-current liabilities 71,542,527 64,832,370
Total liabilities 125,756,385 118,146,466
Equity:Capital stock 21 1,488,993 1,488,993 Capital surplus 22 4,196,999 4,197,015 Other capital items 23 (1,700,573) (1,516,817) Accumulated other comprehensive loss 24 (2,445,072) (2,353,022) Retained earnings 25 68,114,066 68,249,633
Equity attributable to the owners of the Company 69,654,413 70,065,802
Non-controlling interests 6,393,722 6,299,952 Total equity 76,048,135 76,365,754
Total liabilities and equity ₩ 201,804,520 ₩ 194,512,220
(Concluded)
See accompanying notes to the consolidated financial statements.
HYUNDAI MOTOR COMPANY AND ITS SUBSIDIARIES
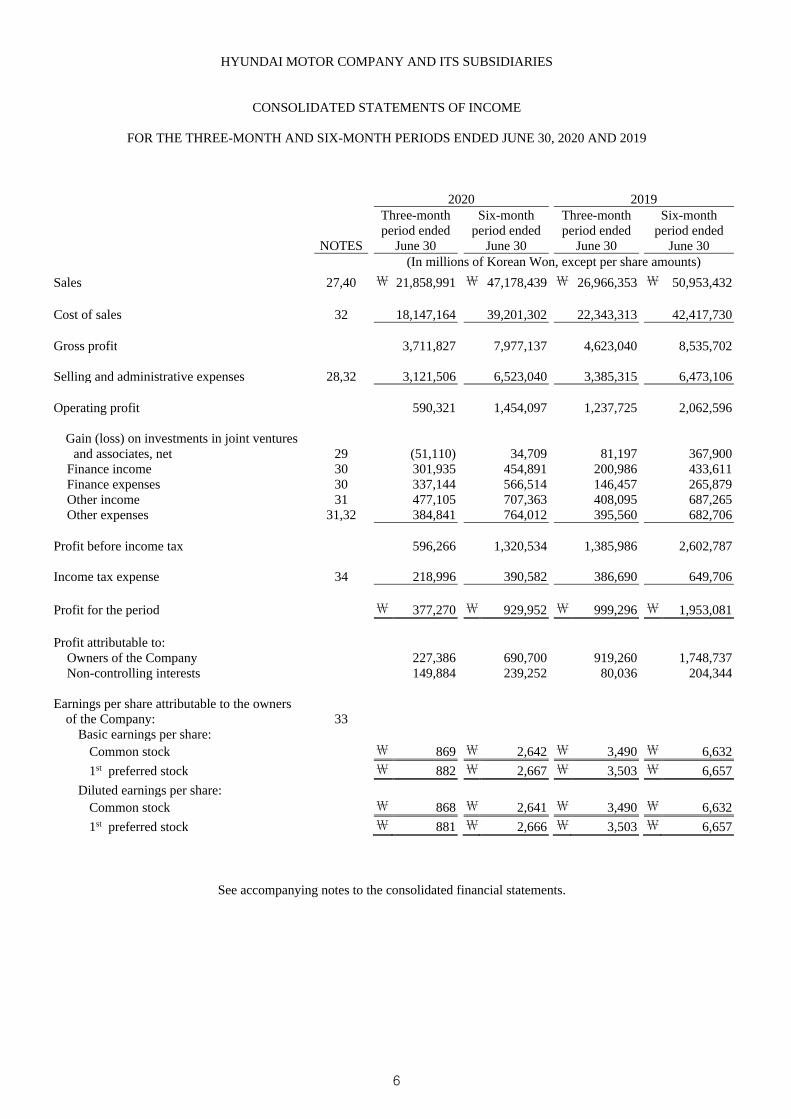
CONSOLIDATED STATEMENTS OF INCOME
FOR THE THREE-MONTH AND SIX-MONTH PERIODS ENDED JUNE 30, 2020 AND 2019
2020 2019
NOTES
Three-month period ended
June 30
Six-month period ended
June 30
Three-month period ended
June 30
Six-month period ended
June 30 (In millions of Korean Won, except per share amounts)
Sales 27,40 ₩ 21,858,991 ₩ 47,178,439 ₩ 26,966,353 ₩ 50,953,432
Cost of sales 32 18,147,164 39,201,302 22,343,313 42,417,730
Gross profit 3,711,827 7,977,137 4,623,040 8,535,702
Selling and administrative expenses 28,32 3,121,506 6,523,040 3,385,315 6,473,106
Operating profit 590,321 1,454,097 1,237,725 2,062,596
Gain (loss) on investments in joint ventures and associates, net 29 (51,110) 34,709 81,197 367,900
Finance income 30 301,935 454,891 200,986 433,611 Finance expenses 30 337,144 566,514 146,457 265,879 Other income 31 477,105 707,363 408,095 687,265 Other expenses 31,32 384,841 764,012 395,560 682,706
Profit before income tax 596,266 1,320,534 1,385,986 2,602,787
Income tax expense 34 218,996 390,582 386,690 649,706
Profit for the period ₩ 377,270 ₩ 929,952 ₩ 999,296 ₩ 1,953,081
Profit attributable to: Owners of the Company 227,386 690,700 919,260 1,748,737 Non-controlling interests 149,884 239,252 80,036 204,344
Earnings per share attributable to the owners of the Company: 33
Basic earnings per share: Common stock ₩ 869 ₩ 2,642 ₩ 3,490 ₩ 6,632
1st preferred stock ₩ 882 ₩ 2,667 ₩ 3,503 ₩ 6,657
Diluted earnings per share: Common stock ₩ 868 ₩ 2,641 ₩ 3,490 ₩ 6,632
1st preferred stock ₩ 881 ₩ 2,666 ₩ 3,503 ₩ 6,657
See accompanying notes to the consolidated financial statements.
HYUNDAI MOTOR COMPANY AND ITS SUBSIDIARIES
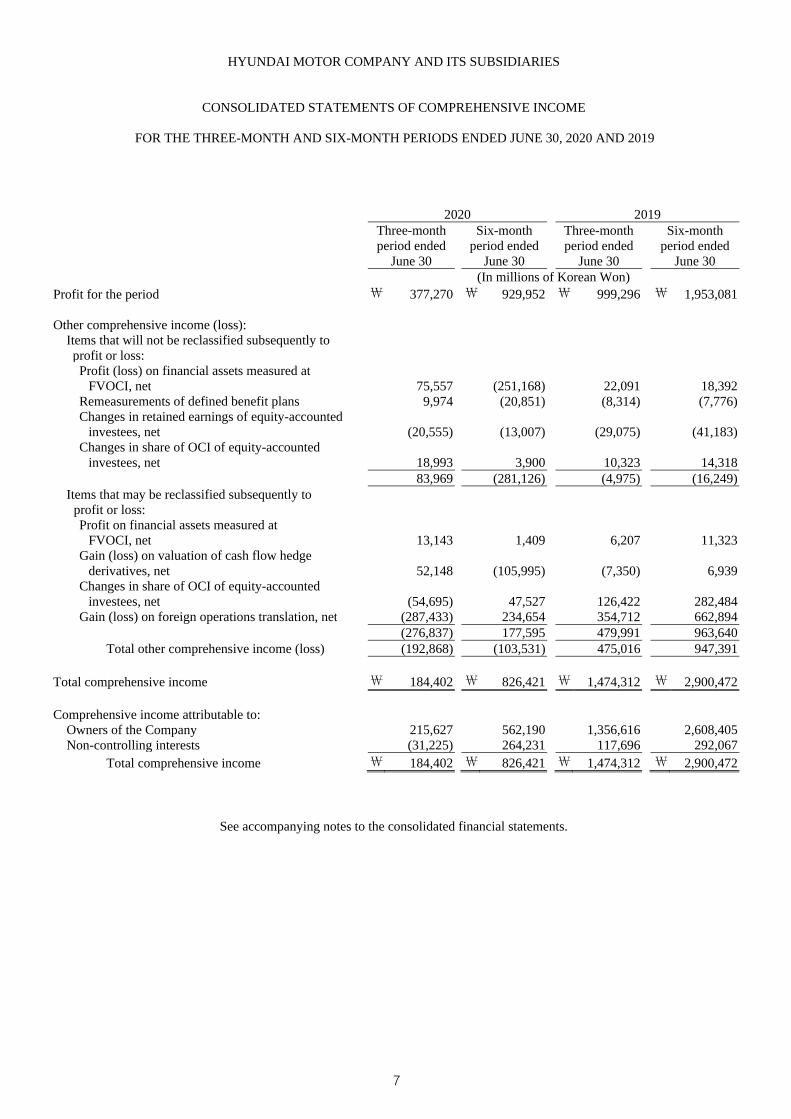
CONSOLIDATED STATEMENTS OF COMPREHENSIVE INCOME
FOR THE THREE-MONTH AND SIX-MONTH PERIODS ENDED JUNE 30, 2020 AND 2019
2020 2019Three-month period ended
June 30
Six-month period ended
June 30
Three-month period ended
June 30
Six-month period ended
June 30 (In millions of Korean Won)
Profit for the period ₩ 377,270 ₩ 929,952 ₩ 999,296 ₩ 1,953,081
Other comprehensive income (loss): Items that will not be reclassified subsequently to profit or loss: Profit (loss) on financial assets measured at
FVOCI, net 75,557 (251,168) 22,091 18,392 Remeasurements of defined benefit plans 9,974 (20,851) (8,314) (7,776) Changes in retained earnings of equity-accounted
investees, net (20,555) (13,007) (29,075) (41,183) Changes in share of OCI of equity-accounted
investees, net 18,993 3,900 10,323 14,318 83,969 (281,126) (4,975) (16,249)
Items that may be reclassified subsequently to profit or loss: Profit on financial assets measured at
FVOCI, net 13,143 1,409 6,207 11,323 Gain (loss) on valuation of cash flow hedge
derivatives, net 52,148 (105,995) (7,350) 6,939 Changes in share of OCI of equity-accounted
investees, net (54,695) 47,527 126,422 282,484 Gain (loss) on foreign operations translation, net (287,433) 234,654 354,712 662,894
(276,837) 177,595 479,991 963,640Total other comprehensive income (loss) (192,868) (103,531) 475,016 947,391
Total comprehensive income ₩ 184,402 ₩ 826,421 ₩ 1,474,312 ₩ 2,900,472
Comprehensive income attributable to: Owners of the Company 215,627 562,190 1,356,616 2,608,405Non-controlling interests (31,225) 264,231 117,696 292,067
Total comprehensive income ₩ 184,402 ₩ 826,421 ₩ 1,474,312 ₩ 2,900,472
See accompanying notes to the consolidated financial statements.
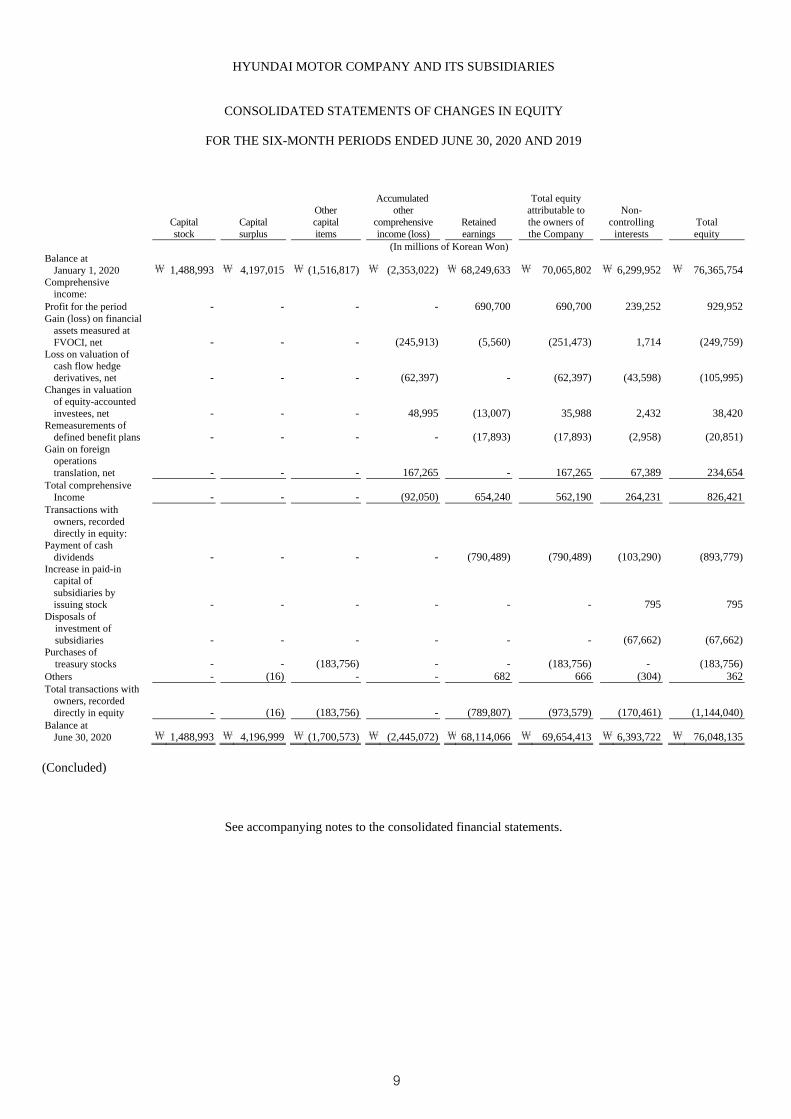
HYUNDAI MOTOR COMPANY AND ITS SUBSIDIARIES
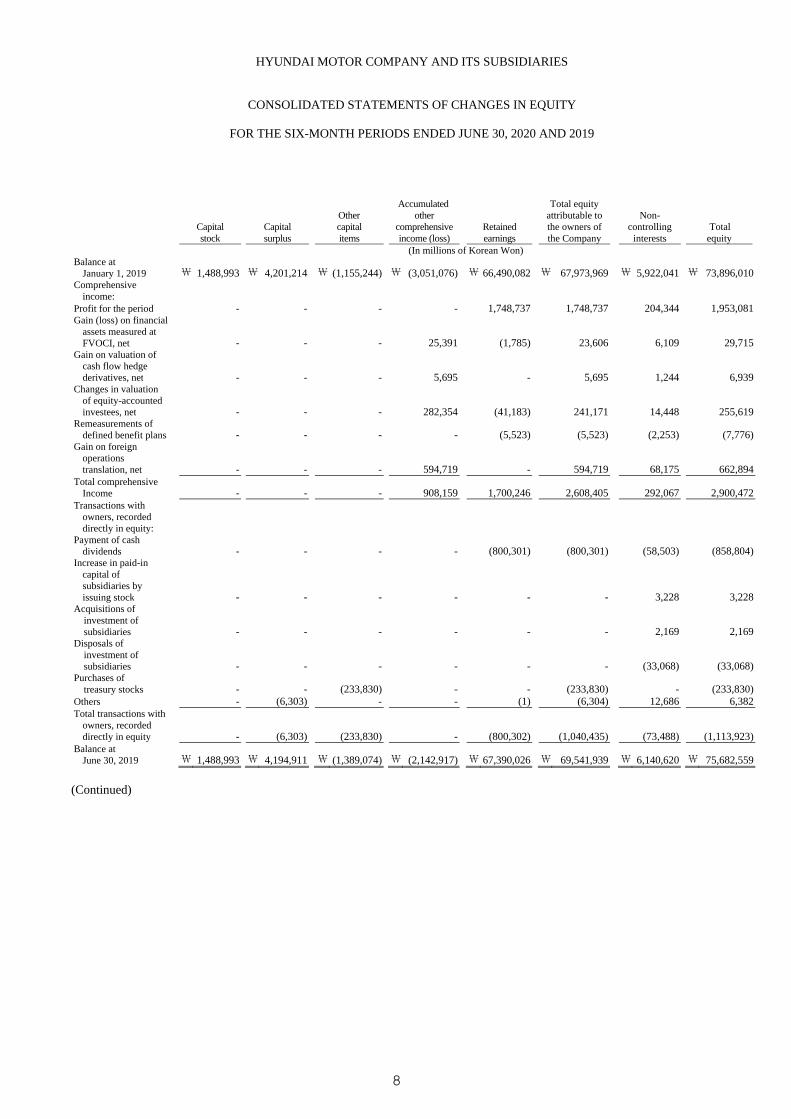
CONSOLIDATED STATEMENTS OF CHANGES IN EQUITY
FOR THE SIX-MONTH PERIODS ENDED JUNE 30, 2020 AND 2019
Capital stock
Capital surplus
Other capital items
Accumulated other
comprehensive income (loss)
Retained earnings
Total equity attributable to the owners of the Company
Non- controlling
interests Total
equity (In millions of Korean Won)
Balance at January 1, 2019 ₩ 1,488,993 ₩ 4,201,214 ₩ (1,155,244) ₩ (3,051,076) ₩ 66,490,082 ₩ 67,973,969 ₩ 5,922,041 ₩ 73,896,010
Comprehensive income:
Profit for the period - - - - 1,748,737 1,748,737 204,344 1,953,081 Gain (loss) on financial
assets measured at FVOCI, net - - - 25,391 (1,785) 23,606 6,109 29,715
Gain on valuation of cash flow hedge derivatives, net - - - 5,695 - 5,695 1,244 6,939
Changes in valuation of equity-accounted investees, net - - - 282,354 (41,183) 241,171 14,448 255,619
Remeasurements of defined benefit plans - - - - (5,523) (5,523) (2,253) (7,776)
Gain on foreign operations translation, net - - - 594,719 - 594,719 68,175 662,894
Total comprehensive Income - - - 908,159 1,700,246 2,608,405 292,067 2,900,472
Transactions with owners, recorded directly in equity:
Payment of cash dividends - - - - (800,301) (800,301) (58,503) (858,804)
Increase in paid-in capital of subsidiaries by issuing stock - - - - - - 3,228 3,228
Acquisitions of investment of subsidiaries - - - - - - 2,169 2,169
Disposals of investment of subsidiaries - - - - - - (33,068) (33,068)
Purchases of treasury stocks - - (233,830) - - (233,830) - (233,830)
Others - (6,303) - - (1) (6,304) 12,686 6,382 Total transactions with
owners, recorded directly in equity - (6,303) (233,830) - (800,302) (1,040,435) (73,488) (1,113,923)
Balance at June 30, 2019 ₩ 1,488,993 ₩ 4,194,911 ₩ (1,389,074) ₩ (2,142,917) ₩ 67,390,026 ₩ 69,541,939 ₩ 6,140,620 ₩ 75,682,559
(Continued)
HYUNDAI MOTOR COMPANY AND ITS SUBSIDIARIES
CONSOLIDATED STATEMENTS OF CHANGES IN EQUITY
FOR THE SIX-MONTH PERIODS ENDED JUNE 30, 2020 AND 2019
Capital stock
Capital surplus
Other capital items
Accumulated other
comprehensive income (loss)
Retained earnings
Total equity attributable to the owners of the Company
Non- controlling
interests Total equity
(In millions of Korean Won) Balance at
January 1, 2020 ₩ 1,488,993 ₩ 4,197,015 ₩ (1,516,817) ₩ (2,353,022) ₩ 68,249,633 ₩ 70,065,802 ₩ 6,299,952 ₩ 76,365,754 Comprehensive
income: Profit for the period - - - - 690,700 690,700 239,252 929,952 Gain (loss) on financial
assets measured at FVOCI, net - - - (245,913) (5,560) (251,473) 1,714 (249,759)
Loss on valuation of cash flow hedge derivatives, net - - - (62,397) - (62,397) (43,598) (105,995)
Changes in valuation of equity-accounted investees, net - - - 48,995 (13,007) 35,988 2,432 38,420
Remeasurements of defined benefit plans - - - - (17,893) (17,893) (2,958) (20,851)
Gain on foreign operations translation, net - - - 167,265 - 167,265 67,389 234,654
Total comprehensive Income - - - (92,050) 654,240 562,190 264,231 826,421
Transactions with owners, recorded directly in equity:
Payment of cash dividends - - - - (790,489) (790,489) (103,290) (893,779)
Increase in paid-in capital of subsidiaries by issuing stock - - - - - - 795 795
Disposals of investment of subsidiaries - - - - - - (67,662) (67,662)
Purchases of treasury stocks - - (183,756) - - (183,756) - (183,756)
Others - (16) - - 682 666 (304) 362Total transactions with
owners, recorded directly in equity - (16) (183,756) - (789,807) (973,579) (170,461) (1,144,040)
Balance at June 30, 2020 ₩ 1,488,993 ₩ 4,196,999 ₩ (1,700,573) ₩ (2,445,072) ₩ 68,114,066 ₩ 69,654,413 ₩ 6,393,722 ₩ 76,048,135
(Concluded)
See accompanying notes to the consolidated financial statements.
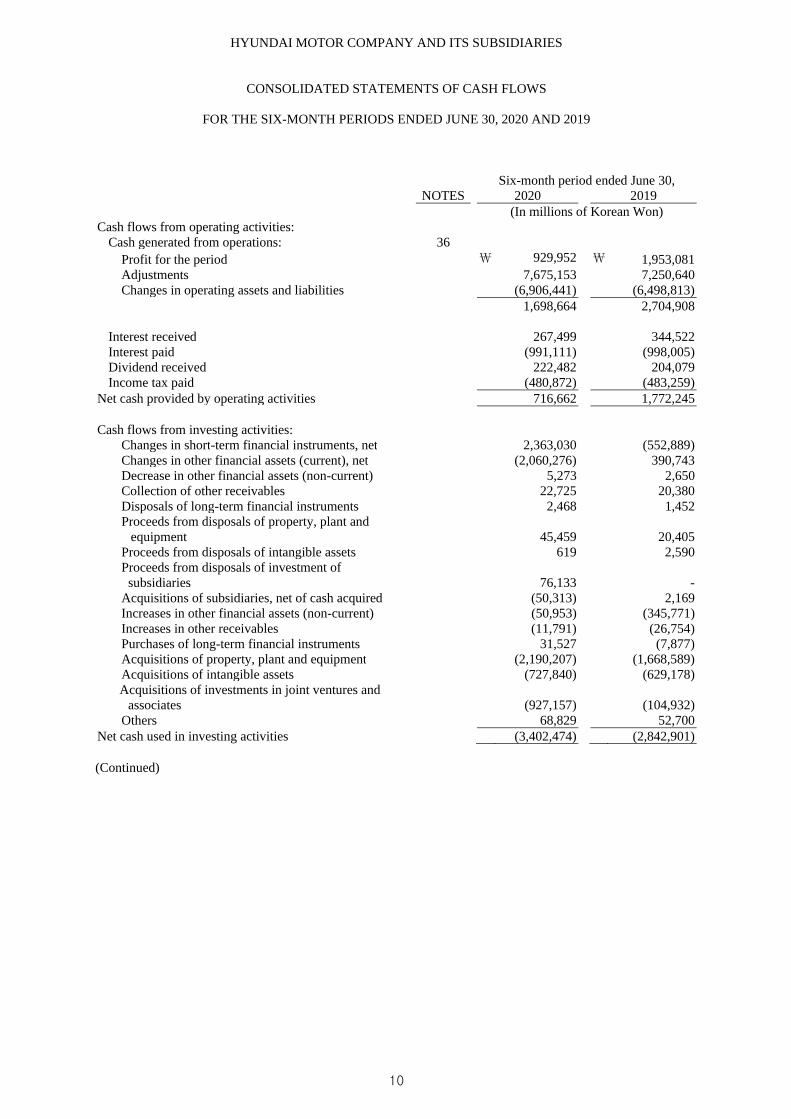
HYUNDAI MOTOR COMPANY AND ITS SUBSIDIARIES
CONSOLIDATED STATEMENTS OF CASH FLOWS
FOR THE SIX-MONTH PERIODS ENDED JUNE 30, 2020 AND 2019
Six-month period ended June 30, NOTES 2020 2019
(In millions of Korean Won) Cash flows from operating activities:
Cash generated from operations: 36 Profit for the period ₩ 929,952 ₩ 1,953,081 Adjustments 7,675,153 7,250,640Changes in operating assets and liabilities (6,906,441) (6,498,813)
1,698,664 2,704,908
Interest received 267,499 344,522Interest paid (991,111) (998,005)Dividend received 222,482 204,079Income tax paid (480,872) (483,259)
Net cash provided by operating activities 716,662 1,772,245
Cash flows from investing activities: Changes in short-term financial instruments, net 2,363,030 (552,889) Changes in other financial assets (current), net (2,060,276) 390,743 Decrease in other financial assets (non-current) 5,273 2,650 Collection of other receivables 22,725 20,380Disposals of long-term financial instruments 2,468 1,452 Proceeds from disposals of property, plant and
equipment 45,459 20,405 Proceeds from disposals of intangible assets 619 2,590 Proceeds from disposals of investment of
subsidiaries 76,133 -Acquisitions of subsidiaries, net of cash acquired (50,313) 2,169 Increases in other financial assets (non-current) (50,953) (345,771) Increases in other receivables (11,791) (26,754) Purchases of long-term financial instruments 31,527 (7,877) Acquisitions of property, plant and equipment (2,190,207) (1,668,589) Acquisitions of intangible assets (727,840) (629,178) Acquisitions of investments in joint ventures and
associates (927,157) (104,932) Others 68,829 52,700
Net cash used in investing activities (3,402,474) (2,842,901)
(Continued)
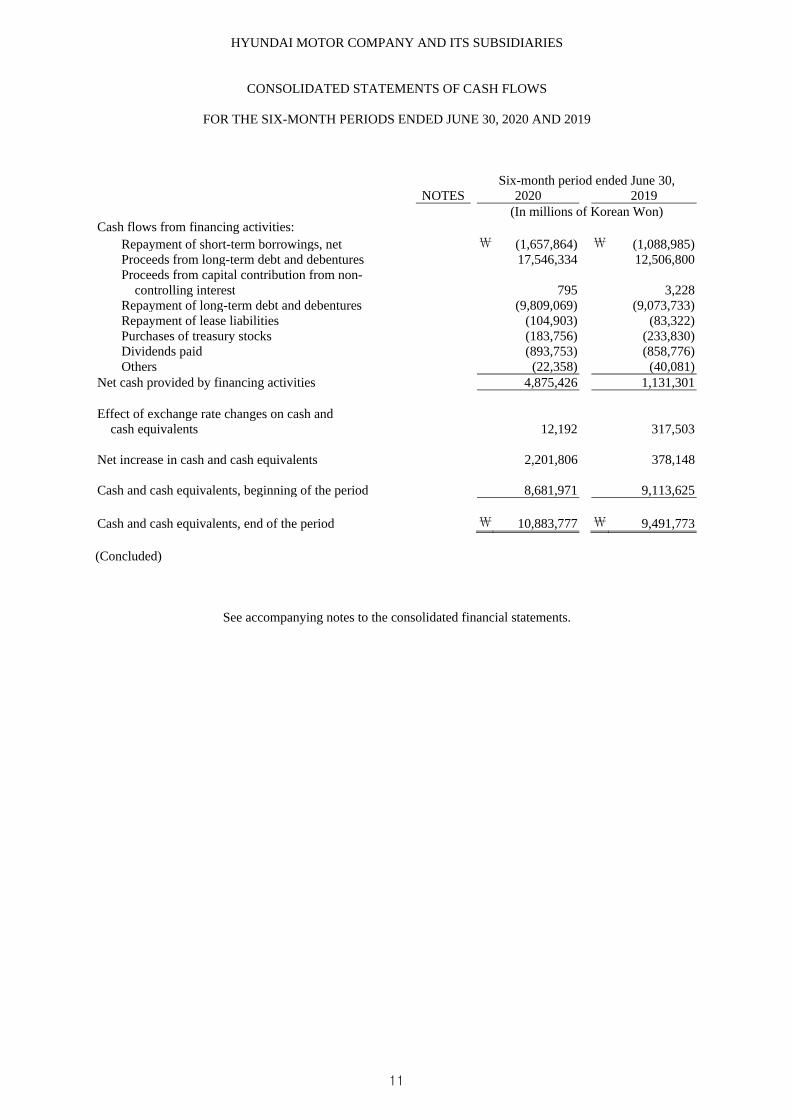
HYUNDAI MOTOR COMPANY AND ITS SUBSIDIARIES
CONSOLIDATED STATEMENTS OF CASH FLOWS
FOR THE SIX-MONTH PERIODS ENDED JUNE 30, 2020 AND 2019
Six-month period ended June 30, NOTES 2020 2019
(In millions of Korean Won) Cash flows from financing activities:
Repayment of short-term borrowings, net ₩ (1,657,864) ₩ (1,088,985) Proceeds from long-term debt and debentures 17,546,334 12,506,800 Proceeds from capital contribution from non-
controlling interest 795 3,228 Repayment of long-term debt and debentures (9,809,069) (9,073,733) Repayment of lease liabilities (104,903) (83,322) Purchases of treasury stocks (183,756) (233,830) Dividends paid (893,753) (858,776) Others (22,358) (40,081)
Net cash provided by financing activities 4,875,426 1,131,301
Effect of exchange rate changes on cash and cash equivalents 12,192 317,503
Net increase in cash and cash equivalents 2,201,806 378,148
Cash and cash equivalents, beginning of the period 8,681,971 9,113,625
Cash and cash equivalents, end of the period ₩ 10,883,777 ₩ 9,491,773
(Concluded)
See accompanying notes to the consolidated financial statements.
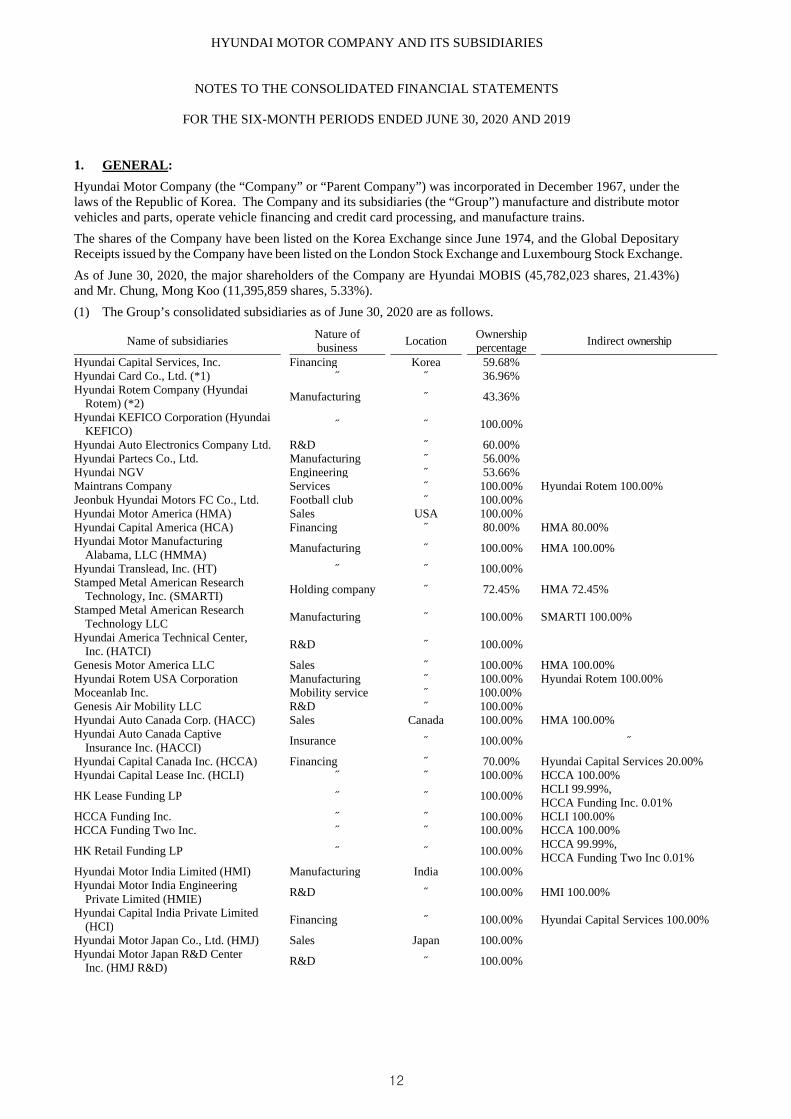
HYUNDAI MOTOR COMPANY AND ITS SUBSIDIARIES
NOTES TO THE CONSOLIDATED FINANCIAL STATEMENTS
FOR THE SIX-MONTH PERIODS ENDED JUNE 30, 2020 AND 2019
1. GENERAL:
Hyundai Motor Company (the “Company” or “Parent Company”) was incorporated in December 1967, under the laws of the Republic of Korea. The Company and its subsidiaries (the “Group”) manufacture and distribute motor vehicles and parts, operate vehicle financing and credit card processing, and manufacture trains.
The shares of the Company have been listed on the Korea Exchange since June 1974, and the Global Depositary Receipts issued by the Company have been listed on the London Stock Exchange and Luxembourg Stock Exchange.
As of June 30, 2020, the major shareholders of the Company are Hyundai MOBIS (45,782,023 shares, 21.43%) and Mr. Chung, Mong Koo (11,395,859 shares, 5.33%).
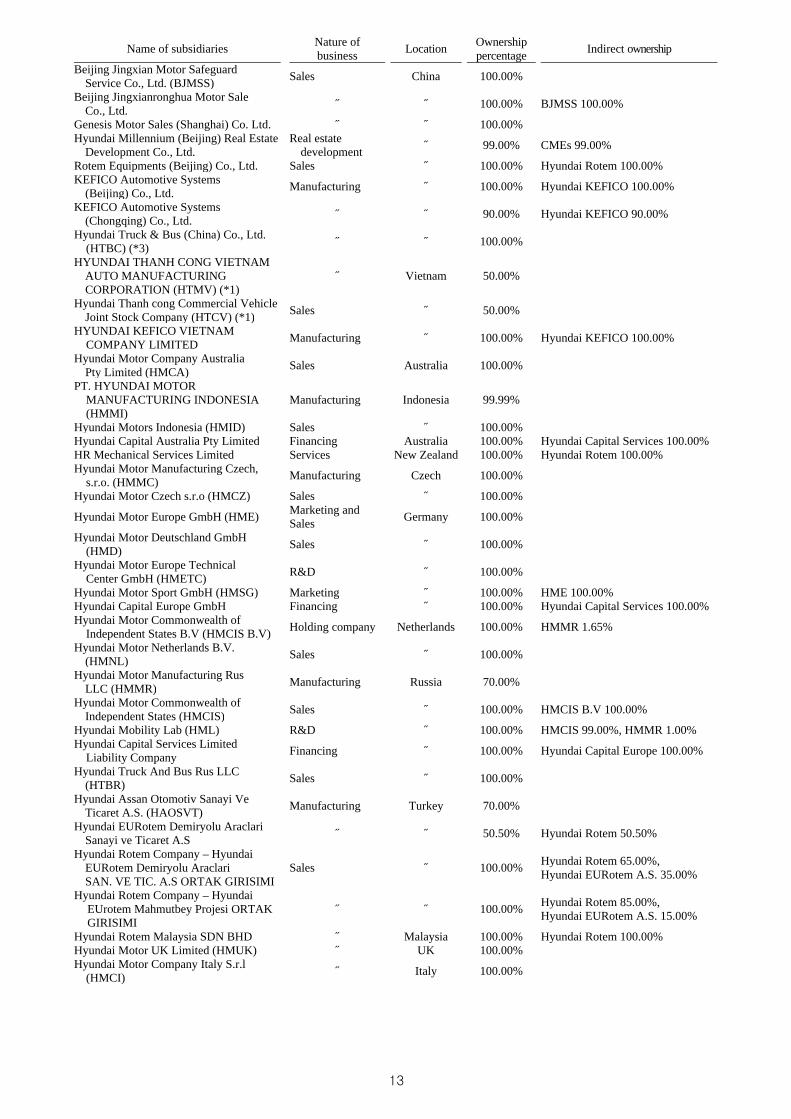
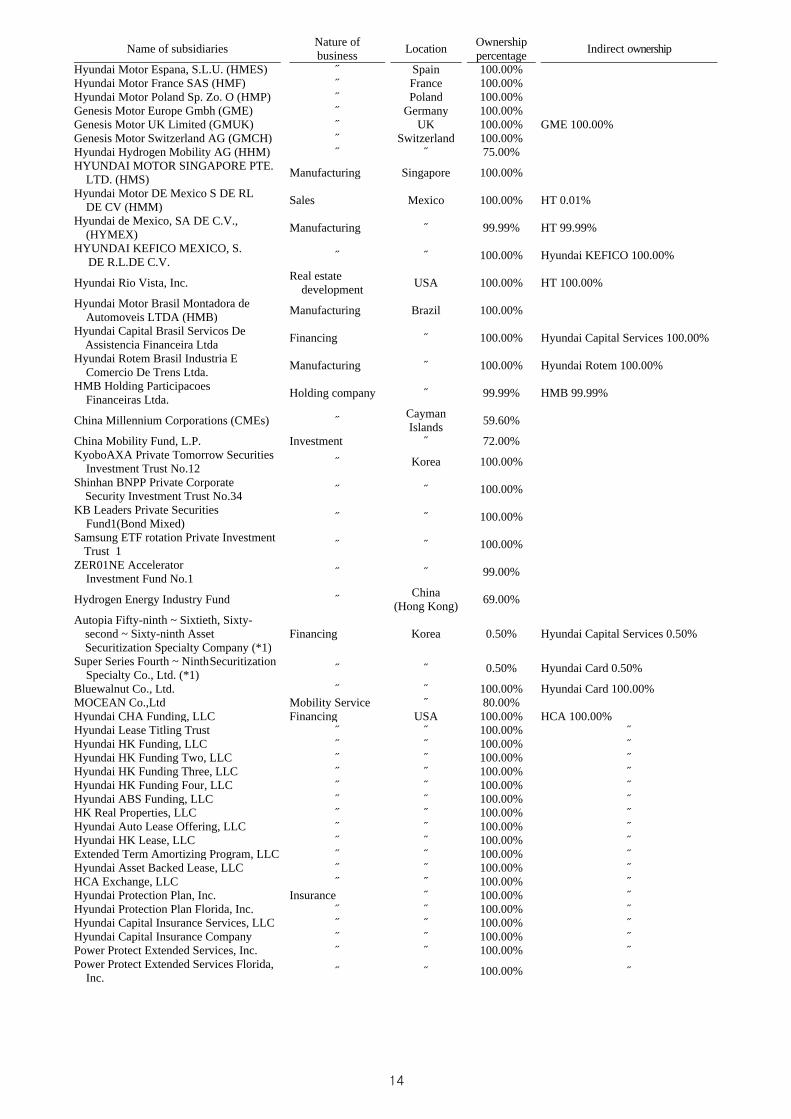
(1) The Group’s consolidated subsidiaries as of June 30, 2020 are as follows.
Name of subsidiaries Nature of business
Location Ownership percentage
Indirect ownership
Hyundai Capital Services, Inc. Financing Korea 59.68%Hyundai Card Co., Ltd. (*1) ˝ ˝ 36.96% Hyundai Rotem Company (Hyundai
Rotem) (*2) Manufacturing ˝ 43.36%
Hyundai KEFICO Corporation (Hyundai KEFICO)
˝ ˝ 100.00%
Hyundai Auto Electronics Company Ltd. R&D ˝ 60.00% Hyundai Partecs Co., Ltd. Manufacturing ˝ 56.00% Hyundai NGV Engineering ˝ 53.66% Maintrans Company Services ˝ 100.00% Hyundai Rotem 100.00% Jeonbuk Hyundai Motors FC Co., Ltd. Football club ˝ 100.00% Hyundai Motor America (HMA) Sales USA 100.00% Hyundai Capital America (HCA) Financing ˝ 80.00% HMA 80.00% Hyundai Motor Manufacturing
Alabama, LLC (HMMA) Manufacturing ˝ 100.00% HMA 100.00%
Hyundai Translead, Inc. (HT) ˝ ˝ 100.00% Stamped Metal American Research
Technology, Inc. (SMARTI) Holding company ˝ 72.45% HMA 72.45%
Stamped Metal American Research Technology LLC
Manufacturing ˝ 100.00% SMARTI 100.00%
Hyundai America Technical Center, Inc. (HATCI)
R&D ˝ 100.00%
Genesis Motor America LLC Sales ˝ 100.00% HMA 100.00% Hyundai Rotem USA Corporation Manufacturing ˝ 100.00% Hyundai Rotem 100.00% Moceanlab Inc. Mobility service ˝ 100.00% Genesis Air Mobility LLC R&D ˝ 100.00% Hyundai Auto Canada Corp. (HACC) Sales Canada 100.00% HMA 100.00% Hyundai Auto Canada Captive
Insurance Inc. (HACCI) Insurance ˝ 100.00% ˝
Hyundai Capital Canada Inc. (HCCA) Financing ˝ 70.00% Hyundai Capital Services 20.00% Hyundai Capital Lease Inc. (HCLI) ˝ ˝ 100.00% HCCA 100.00%
HK Lease Funding LP ˝ ˝ 100.00% HCLI 99.99%, HCCA Funding Inc. 0.01%
HCCA Funding Inc. ˝ ˝ 100.00% HCLI 100.00% HCCA Funding Two Inc. ˝ ˝ 100.00% HCCA 100.00%
HK Retail Funding LP ˝ ˝ 100.00% HCCA 99.99%, HCCA Funding Two Inc 0.01%
Hyundai Motor India Limited (HMI) Manufacturing India 100.00%
Hyundai Motor India Engineering Private Limited (HMIE)
R&D ˝ 100.00% HMI 100.00%
Hyundai Capital India Private Limited (HCI)
Financing ˝ 100.00% Hyundai Capital Services 100.00%
Hyundai Motor Japan Co., Ltd. (HMJ) Sales Japan 100.00% Hyundai Motor Japan R&D Center
Inc. (HMJ R&D) R&D ˝ 100.00%
Name of subsidiaries Nature of business
Location Ownership percentage
Indirect ownership
Beijing Jingxian Motor Safeguard Service Co., Ltd. (BJMSS)
Sales China 100.00%
Beijing Jingxianronghua Motor Sale Co., Ltd.
˝ ˝ 100.00% BJMSS 100.00%
Genesis Motor Sales (Shanghai) Co. Ltd. ˝ ˝ 100.00% Hyundai Millennium (Beijing) Real Estate
Development Co., Ltd. Real estate
development ˝ 99.00% CMEs 99.00%
Rotem Equipments (Beijing) Co., Ltd. Sales ˝ 100.00% Hyundai Rotem 100.00% KEFICO Automotive Systems
(Beijing) Co., Ltd. Manufacturing ˝ 100.00% Hyundai KEFICO 100.00%
KEFICO Automotive Systems (Chongqing) Co., Ltd.
˝ ˝ 90.00% Hyundai KEFICO 90.00%
Hyundai Truck & Bus (China) Co., Ltd. (HTBC) (*3)
˝ ˝ 100.00%
HYUNDAI THANH CONG VIETNAM AUTO MANUFACTURING CORPORATION (HTMV) (*1)
˝ Vietnam 50.00%
Hyundai Thanh cong Commercial Vehicle Joint Stock Company (HTCV) (*1)
Sales ˝ 50.00%
HYUNDAI KEFICO VIETNAM COMPANY LIMITED
Manufacturing ˝ 100.00% Hyundai KEFICO 100.00%
Hyundai Motor Company Australia Pty Limited (HMCA)
Sales Australia 100.00%
PT. HYUNDAI MOTOR MANUFACTURING INDONESIA (HMMI)
Manufacturing Indonesia 99.99%
Hyundai Motors Indonesia (HMID) Sales ˝ 100.00% Hyundai Capital Australia Pty Limited Financing Australia 100.00% Hyundai Capital Services 100.00% HR Mechanical Services Limited Services New Zealand 100.00% Hyundai Rotem 100.00% Hyundai Motor Manufacturing Czech,
s.r.o. (HMMC)Manufacturing Czech 100.00%
Hyundai Motor Czech s.r.o (HMCZ) Sales ˝ 100.00%
Hyundai Motor Europe GmbH (HME) Marketing and Sales
Germany 100.00%
Hyundai Motor Deutschland GmbH (HMD)
Sales ˝ 100.00%
Hyundai Motor Europe Technical Center GmbH (HMETC)
R&D ˝ 100.00%
Hyundai Motor Sport GmbH (HMSG) Marketing ˝ 100.00% HME 100.00% Hyundai Capital Europe GmbH Financing ˝ 100.00% Hyundai Capital Services 100.00% Hyundai Motor Commonwealth of
Independent States B.V (HMCIS B.V) Holding company Netherlands 100.00% HMMR 1.65%
Hyundai Motor Netherlands B.V. (HMNL)
Sales ˝ 100.00%
Hyundai Motor Manufacturing Rus LLC (HMMR)
Manufacturing Russia 70.00%
Hyundai Motor Commonwealth of Independent States (HMCIS)
Sales ˝ 100.00% HMCIS B.V 100.00%
Hyundai Mobility Lab (HML) R&D ˝ 100.00% HMCIS 99.00%, HMMR 1.00% Hyundai Capital Services Limited
Liability Company Financing ˝ 100.00% Hyundai Capital Europe 100.00%
Hyundai Truck And Bus Rus LLC (HTBR)
Sales ˝ 100.00%
Hyundai Assan Otomotiv Sanayi Ve Ticaret A.S. (HAOSVT)
Manufacturing Turkey 70.00%
Hyundai EURotem Demiryolu Araclari Sanayi ve Ticaret A.S
˝ ˝ 50.50% Hyundai Rotem 50.50%
Hyundai Rotem Company – Hyundai EURotem Demiryolu Araclari SAN. VE TIC. A.S ORTAK GIRISIMI
Sales ˝ 100.00% Hyundai Rotem 65.00%, Hyundai EURotem A.S. 35.00%
Hyundai Rotem Company – Hyundai EUrotem Mahmutbey Projesi ORTAK GIRISIMI
˝ ˝ 100.00% Hyundai Rotem 85.00%, Hyundai EURotem A.S. 15.00%
Hyundai Rotem Malaysia SDN BHD ˝ Malaysia 100.00% Hyundai Rotem 100.00% Hyundai Motor UK Limited (HMUK) ˝ UK 100.00% Hyundai Motor Company Italy S.r.l
(HMCI) ˝ Italy 100.00%
Name of subsidiaries Nature of business
Location Ownership percentage
Indirect ownership
Hyundai Motor Espana, S.L.U. (HMES) ˝ Spain 100.00%Hyundai Motor France SAS (HMF) ˝ France 100.00%Hyundai Motor Poland Sp. Zo. O (HMP) ˝ Poland 100.00% Genesis Motor Europe Gmbh (GME) ˝ Germany 100.00% Genesis Motor UK Limited (GMUK) ˝ UK 100.00% GME 100.00% Genesis Motor Switzerland AG (GMCH) ˝ Switzerland 100.00% Hyundai Hydrogen Mobility AG (HHM) ˝ ˝ 75.00% HYUNDAI MOTOR SINGAPORE PTE.
LTD. (HMS) Manufacturing Singapore 100.00%
Hyundai Motor DE Mexico S DE RL DE CV (HMM)
Sales Mexico 100.00% HT 0.01%
Hyundai de Mexico, SA DE C.V., (HYMEX)
Manufacturing ˝ 99.99% HT 99.99%
HYUNDAI KEFICO MEXICO, S. DE R.L.DE C.V.
˝ ˝ 100.00% Hyundai KEFICO 100.00%
Hyundai Rio Vista, Inc. Real estate
development USA 100.00% HT 100.00%
Hyundai Motor Brasil Montadora de Automoveis LTDA (HMB)
Manufacturing Brazil 100.00%
Hyundai Capital Brasil Servicos De Assistencia Financeira Ltda
Financing ˝ 100.00% Hyundai Capital Services 100.00%
Hyundai Rotem Brasil Industria E Comercio De Trens Ltda.
Manufacturing ˝ 100.00% Hyundai Rotem 100.00%
HMB Holding Participacoes Financeiras Ltda.
Holding company ˝ 99.99% HMB 99.99%
China Millennium Corporations (CMEs) ˝ Cayman Islands
59.60%
China Mobility Fund, L.P. Investment ˝ 72.00% KyoboAXA Private Tomorrow Securities
Investment Trust No.12 ˝ Korea 100.00%
Shinhan BNPP Private Corporate Security Investment Trust No.34
˝ ˝ 100.00%
KB Leaders Private Securities Fund1(Bond Mixed)
˝ ˝ 100.00%
Samsung ETF rotation Private Investment Trust 1
˝ ˝ 100.00%
ZER01NE Accelerator Investment Fund No.1
˝ ˝ 99.00%
Hydrogen Energy Industry Fund ˝ China
(Hong Kong) 69.00%
Autopia Fifty-ninth ~ Sixtieth, Sixty-second ~ Sixty-ninth Asset Securitization Specialty Company (*1)
Financing Korea 0.50% Hyundai Capital Services 0.50%
Super Series Fourth ~ Ninth Securitization Specialty Co., Ltd. (*1)
˝ ˝ 0.50% Hyundai Card 0.50%
Bluewalnut Co., Ltd. ˝ ˝ 100.00% Hyundai Card 100.00% MOCEAN Co.,Ltd Mobility Service ˝ 80.00% Hyundai CHA Funding, LLC Financing USA 100.00% HCA 100.00% Hyundai Lease Titling Trust ˝ ˝ 100.00% ˝ Hyundai HK Funding, LLC ˝ ˝ 100.00% ˝ Hyundai HK Funding Two, LLC ˝ ˝ 100.00% ˝ Hyundai HK Funding Three, LLC ˝ ˝ 100.00% ˝ Hyundai HK Funding Four, LLC ˝ ˝ 100.00% ˝ Hyundai ABS Funding, LLC ˝ ˝ 100.00% ˝ HK Real Properties, LLC ˝ ˝ 100.00% ˝ Hyundai Auto Lease Offering, LLC ˝ ˝ 100.00% ˝ Hyundai HK Lease, LLC ˝ ˝ 100.00% ˝ Extended Term Amortizing Program, LLC ˝ ˝ 100.00% ˝ Hyundai Asset Backed Lease, LLC ˝ ˝ 100.00% ˝ HCA Exchange, LLC ˝ ˝ 100.00% ˝ Hyundai Protection Plan, Inc. Insurance ˝ 100.00% ˝ Hyundai Protection Plan Florida, Inc. ˝ ˝ 100.00% ˝ Hyundai Capital Insurance Services, LLC ˝ ˝ 100.00% ˝ Hyundai Capital Insurance Company ˝ ˝ 100.00% ˝ Power Protect Extended Services, Inc. ˝ ˝ 100.00% ˝ Power Protect Extended Services Florida,
Inc. ˝ ˝ 100.00% ˝
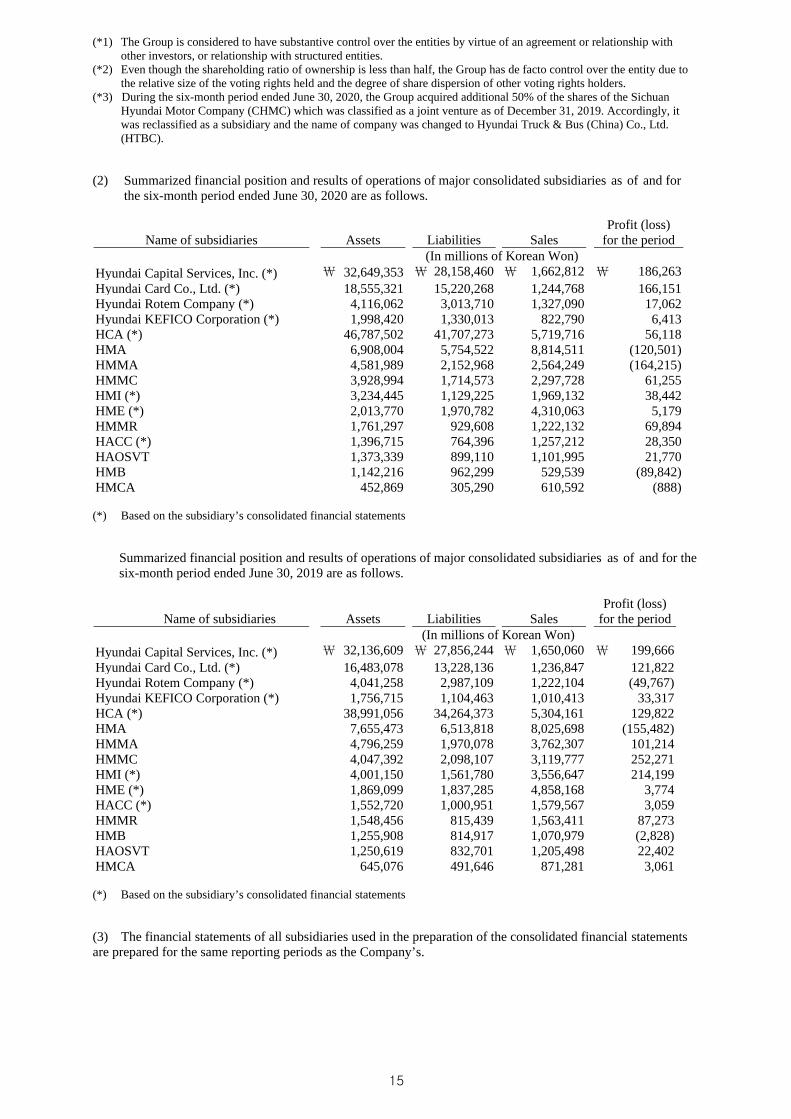
(*1) The Group is considered to have substantive control over the entities by virtue of an agreement or relationship with other investors, or relationship with structured entities.
(*2) Even though the shareholding ratio of ownership is less than half, the Group has de facto control over the entity due to the relative size of the voting rights held and the degree of share dispersion of other voting rights holders.
(*3) During the six-month period ended June 30, 2020, the Group acquired additional 50% of the shares of the Sichuan Hyundai Motor Company (CHMC) which was classified as a joint venture as of December 31, 2019. Accordingly, it was reclassified as a subsidiary and the name of company was changed to Hyundai Truck & Bus (China) Co., Ltd. (HTBC).
(2) Summarized financial position and results of operations of major consolidated subsidiaries as of and forthe six-month period ended June 30, 2020 are as follows.
Name of subsidiaries Assets Liabilities Sales Profit (loss)
for the period (In millions of Korean Won)
Hyundai Capital Services, Inc. (*) ₩ 32,649,353 ₩ 28,158,460 ₩ 1,662,812 ₩ 186,263 Hyundai Card Co., Ltd. (*) 18,555,321 15,220,268 1,244,768 166,151 Hyundai Rotem Company (*) 4,116,062 3,013,710 1,327,090 17,062 Hyundai KEFICO Corporation (*) 1,998,420 1,330,013 822,790 6,413 HCA (*) 46,787,502 41,707,273 5,719,716 56,118 HMA 6,908,004 5,754,522 8,814,511 (120,501) HMMA 4,581,989 2,152,968 2,564,249 (164,215)HMMC 3,928,994 1,714,573 2,297,728 61,255HMI (*) 3,234,445 1,129,225 1,969,132 38,442 HME (*) 2,013,770 1,970,782 4,310,063 5,179 HMMR 1,761,297 929,608 1,222,132 69,894HACC (*) 1,396,715 764,396 1,257,212 28,350 HAOSVT 1,373,339 899,110 1,101,995 21,770HMB 1,142,216 962,299 529,539 (89,842)HMCA 452,869 305,290 610,592 (888)
(*) Based on the subsidiary’s consolidated financial statements
Summarized financial position and results of operations of major consolidated subsidiaries as of and for the six-month period ended June 30, 2019 are as follows.
Name of subsidiaries Assets Liabilities Sales Profit (loss)
for the period (In millions of Korean Won)
Hyundai Capital Services, Inc. (*) ₩ 32,136,609 ₩ 27,856,244 ₩ 1,650,060 ₩ 199,666 Hyundai Card Co., Ltd. (*) 16,483,078 13,228,136 1,236,847 121,822 Hyundai Rotem Company (*) 4,041,258 2,987,109 1,222,104 (49,767) Hyundai KEFICO Corporation (*) 1,756,715 1,104,463 1,010,413 33,317 HCA (*) 38,991,056 34,264,373 5,304,161 129,822 HMA 7,655,473 6,513,818 8,025,698 (155,482) HMMA 4,796,259 1,970,078 3,762,307 101,214 HMMC 4,047,392 2,098,107 3,119,777 252,271 HMI (*) 4,001,150 1,561,780 3,556,647 214,199 HME (*) 1,869,099 1,837,285 4,858,168 3,774 HACC (*) 1,552,720 1,000,951 1,579,567 3,059 HMMR 1,548,456 815,439 1,563,411 87,273 HMB 1,255,908 814,917 1,070,979 (2,828) HAOSVT 1,250,619 832,701 1,205,498 22,402 HMCA 645,076 491,646 871,281 3,061
(*) Based on the subsidiary’s consolidated financial statements
(3) The financial statements of all subsidiaries used in the preparation of the consolidated financial statementsare prepared for the same reporting periods as the Company’s.
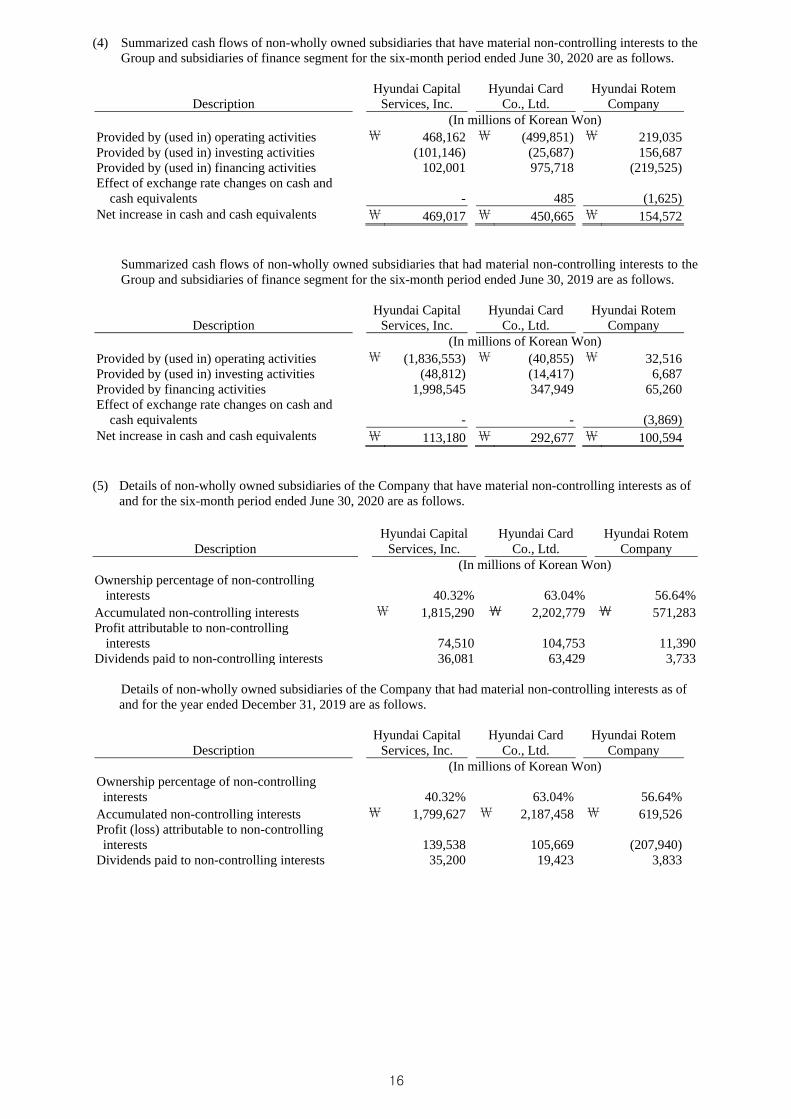
(4) Summarized cash flows of non-wholly owned subsidiaries that have material non-controlling interests to theGroup and subsidiaries of finance segment for the six-month period ended June 30, 2020 are as follows.
Description Hyundai Capital
Services, Inc. Hyundai Card
Co., Ltd. Hyundai Rotem
Company (In millions of Korean Won)
Provided by (used in) operating activities ₩ 468,162 ₩ (499,851) ₩ 219,035 Provided by (used in) investing activities (101,146) (25,687) 156,687 Provided by (used in) financing activities 102,001 975,718 (219,525) Effect of exchange rate changes on cash and
cash equivalents - 485 (1,625)Net increase in cash and cash equivalents ₩ 469,017 ₩ 450,665 ₩ 154,572
Summarized cash flows of non-wholly owned subsidiaries that had material non-controlling interests to the Group and subsidiaries of finance segment for the six-month period ended June 30, 2019 are as follows.
Description Hyundai Capital
Services, Inc. Hyundai Card
Co., Ltd. Hyundai Rotem
Company (In millions of Korean Won)
Provided by (used in) operating activities ₩ (1,836,553) ₩ (40,855) ₩ 32,516 Provided by (used in) investing activities (48,812) (14,417) 6,687 Provided by financing activities 1,998,545 347,949 65,260 Effect of exchange rate changes on cash and
cash equivalents - - (3,869) Net increase in cash and cash equivalents ₩ 113,180 ₩ 292,677 ₩ 100,594
(5) Details of non-wholly owned subsidiaries of the Company that have material non-controlling interests as ofand for the six-month period ended June 30, 2020 are as follows.
Description Hyundai Capital
Services, Inc. Hyundai Card
Co., Ltd. Hyundai Rotem
Company (In millions of Korean Won)
Ownership percentage of non-controlling interests 40.32% 63.04% 56.64%
Accumulated non-controlling interests ₩ 1,815,290 ₩ 2,202,779 ₩ 571,283 Profit attributable to non-controlling
interests 74,510 104,753 11,390 Dividends paid to non-controlling interests 36,081 63,429 3,733
Details of non-wholly owned subsidiaries of the Company that had material non-controlling interests as of and for the year ended December 31, 2019 are as follows.
Description Hyundai Capital
Services, Inc. Hyundai Card
Co., Ltd. Hyundai Rotem
Company (In millions of Korean Won)
Ownership percentage of non-controlling interests 40.32% 63.04% 56.64%
Accumulated non-controlling interests ₩ 1,799,627 ₩ 2,187,458 ₩ 619,526 Profit (loss) attributable to non-controlling interests 139,538 105,669 (207,940)
Dividends paid to non-controlling interests 35,200 19,423 3,833
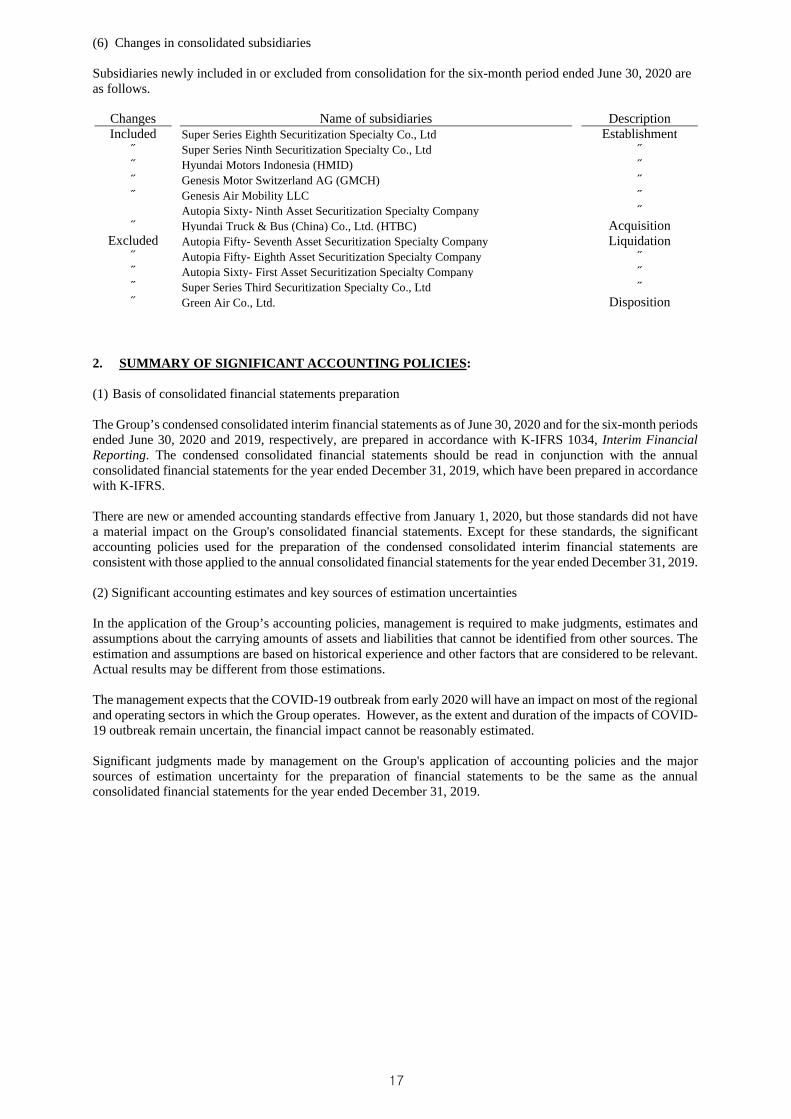
(6) Changes in consolidated subsidiaries
Subsidiaries newly included in or excluded from consolidation for the six-month period ended June 30, 2020 are as follows.
Changes Name of subsidiaries Description Included Super Series Eighth Securitization Specialty Co., Ltd Establishment
˝ Super Series Ninth Securitization Specialty Co., Ltd ˝ ˝ Hyundai Motors Indonesia (HMID) ˝ ˝ Genesis Motor Switzerland AG (GMCH) ˝ ˝ Genesis Air Mobility LLC ˝
Autopia Sixty- Ninth Asset Securitization Specialty Company ˝ ˝ Hyundai Truck & Bus (China) Co., Ltd. (HTBC) Acquisition
Excluded Autopia Fifty- Seventh Asset Securitization Specialty Company Liquidation ˝ Autopia Fifty- Eighth Asset Securitization Specialty Company ˝ ˝ Autopia Sixty- First Asset Securitization Specialty Company ˝ ˝ Super Series Third Securitization Specialty Co., Ltd ˝ ˝ Green Air Co., Ltd. Disposition
2. SUMMARY OF SIGNIFICANT ACCOUNTING POLICIES:
(1) Basis of consolidated financial statements preparation
The Group’s condensed consolidated interim financial statements as of June 30, 2020 and for the six-month periods ended June 30, 2020 and 2019, respectively, are prepared in accordance with K-IFRS 1034, Interim Financial Reporting. The condensed consolidated financial statements should be read in conjunction with the annual consolidated financial statements for the year ended December 31, 2019, which have been prepared in accordance with K-IFRS.
There are new or amended accounting standards effective from January 1, 2020, but those standards did not have a material impact on the Group's consolidated financial statements. Except for these standards, the significant accounting policies used for the preparation of the condensed consolidated interim financial statements are consistent with those applied to the annual consolidated financial statements for the year ended December 31, 2019.
(2) Significant accounting estimates and key sources of estimation uncertainties
In the application of the Group’s accounting policies, management is required to make judgments, estimates and assumptions about the carrying amounts of assets and liabilities that cannot be identified from other sources. The estimation and assumptions are based on historical experience and other factors that are considered to be relevant. Actual results may be different from those estimations.
The management expects that the COVID-19 outbreak from early 2020 will have an impact on most of the regional and operating sectors in which the Group operates. However, as the extent and duration of the impacts of COVID-19 outbreak remain uncertain, the financial impact cannot be reasonably estimated.
Significant judgments made by management on the Group's application of accounting policies and the major sources of estimation uncertainty for the preparation of financial statements to be the same as the annual consolidated financial statements for the year ended December 31, 2019.
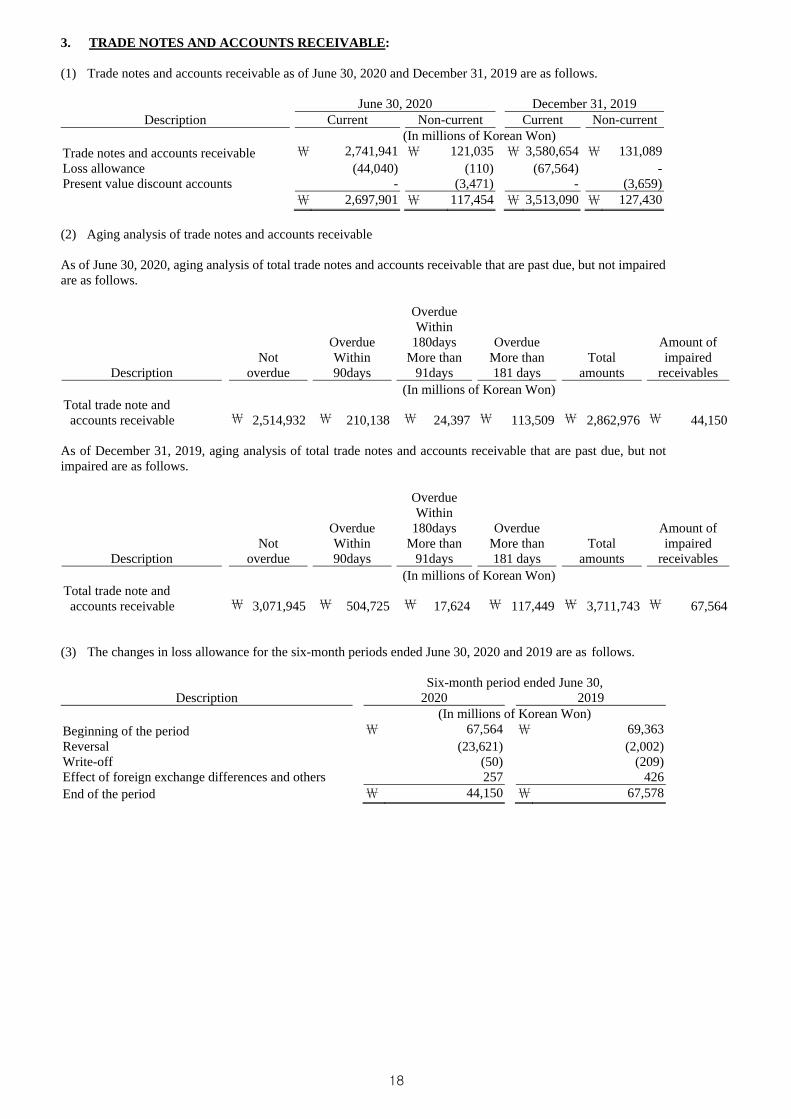
3. TRADE NOTES AND ACCOUNTS RECEIVABLE:
(1) Trade notes and accounts receivable as of June 30, 2020 and December 31, 2019 are as follows.
June 30, 2020 December 31, 2019 Description Current Non-current Current Non-current
(In millions of Korean Won) Trade notes and accounts receivable ₩ 2,741,941 ₩ 121,035 ₩ 3,580,654 ₩ 131,089 Loss allowance (44,040) (110) (67,564) - Present value discount accounts - (3,471) - (3,659)
₩ 2,697,901 ₩ 117,454 ₩ 3,513,090 ₩ 127,430
(2) Aging analysis of trade notes and accounts receivable
As of June 30, 2020, aging analysis of total trade notes and accounts receivable that are past due, but not impaired are as follows.
Description Not
overdue
Overdue Within 90days
Overdue Within
180days More than
91days
Overdue More than 181 days
Total amounts
Amount of impaired
receivables (In millions of Korean Won)
Total trade note and accounts receivable ₩ 2,514,932 ₩ 210,138 ₩ 24,397 ₩ 113,509 ₩ 2,862,976 ₩ 44,150
As of December 31, 2019, aging analysis of total trade notes and accounts receivable that are past due, but not impaired are as follows.
Description Not
overdue
Overdue Within 90days
Overdue Within
180days More than
91days
Overdue More than 181 days
Total amounts
Amount of impaired
receivables (In millions of Korean Won)
Total trade note and accounts receivable ₩ 3,071,945 ₩ 504,725 ₩ 17,624 ₩ 117,449 ₩ 3,711,743 ₩ 67,564
(3) The changes in loss allowance for the six-month periods ended June 30, 2020 and 2019 are as follows.
Six-month period ended June 30, Description 2020 2019
(In millions of Korean Won) Beginning of the period ₩ 67,564 ₩ 69,363 Reversal (23,621) (2,002)Write-off (50) (209)Effect of foreign exchange differences and others 257 426 End of the period ₩ 44,150 ₩ 67,578
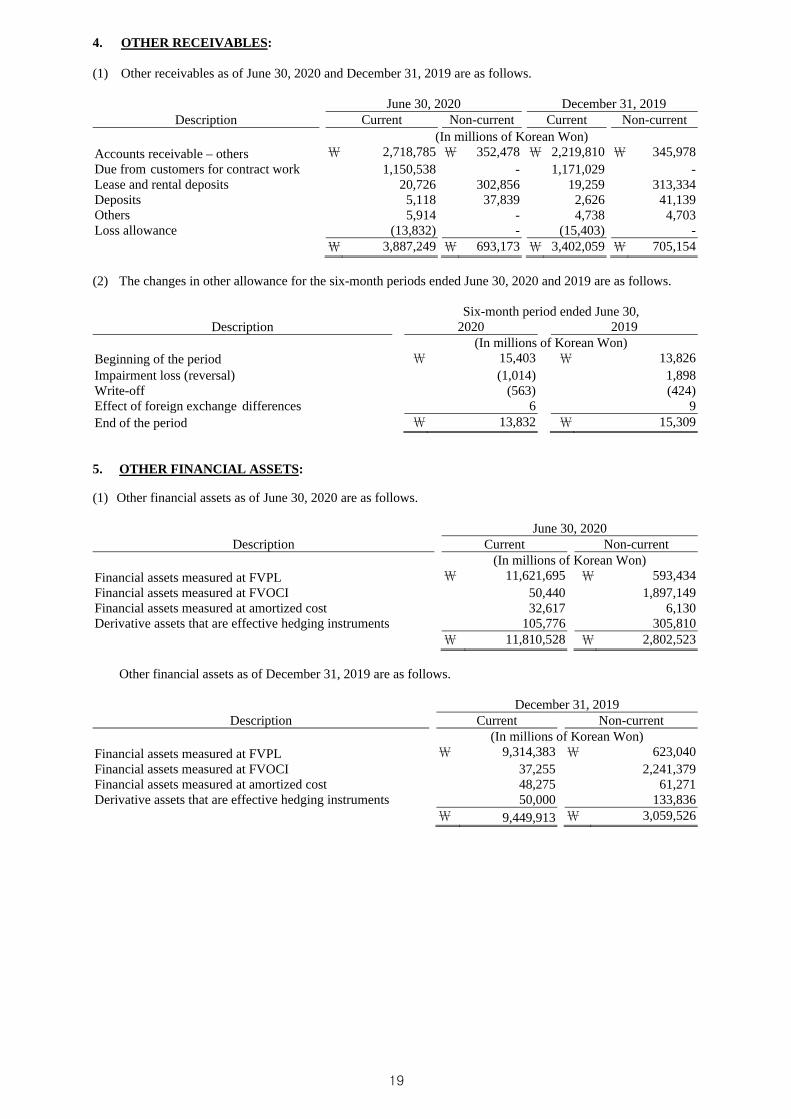
4. OTHER RECEIVABLES:
(1) Other receivables as of June 30, 2020 and December 31, 2019 are as follows.
June 30, 2020 December 31, 2019 Description Current Non-current Current Non-current
(In millions of Korean Won) Accounts receivable – others ₩ 2,718,785 ₩ 352,478 ₩ 2,219,810 ₩ 345,978 Due from customers for contract work 1,150,538 - 1,171,029 - Lease and rental deposits 20,726 302,856 19,259 313,334 Deposits 5,118 37,839 2,626 41,139 Others 5,914 - 4,738 4,703 Loss allowance (13,832) - (15,403) -
₩ 3,887,249 ₩ 693,173 ₩ 3,402,059 ₩ 705,154
(2) The changes in other allowance for the six-month periods ended June 30, 2020 and 2019 are as follows.
Six-month period ended June 30, Description 2020 2019
(In millions of Korean Won) Beginning of the period ₩ 15,403 ₩ 13,826 Impairment loss (reversal) (1,014) 1,898 Write-off (563) (424)Effect of foreign exchange differences 6 9 End of the period ₩ 13,832 ₩ 15,309
5. OTHER FINANCIAL ASSETS:
(1) Other financial assets as of June 30, 2020 are as follows.
June 30, 2020 Description Current Non-current
(In millions of Korean Won) Financial assets measured at FVPL ₩ 11,621,695 ₩ 593,434 Financial assets measured at FVOCI 50,440 1,897,149 Financial assets measured at amortized cost 32,617 6,130 Derivative assets that are effective hedging instruments 105,776 305,810
₩ 11,810,528 ₩ 2,802,523
Other financial assets as of December 31, 2019 are as follows.
December 31, 2019Description Current Non-current
(In millions of Korean Won) Financial assets measured at FVPL ₩ 9,314,383 ₩ 623,040 Financial assets measured at FVOCI 37,255 2,241,379 Financial assets measured at amortized cost 48,275 61,271Derivative assets that are effective hedging instruments 50,000 133,836
₩ 9,449,913 ₩ 3,059,526
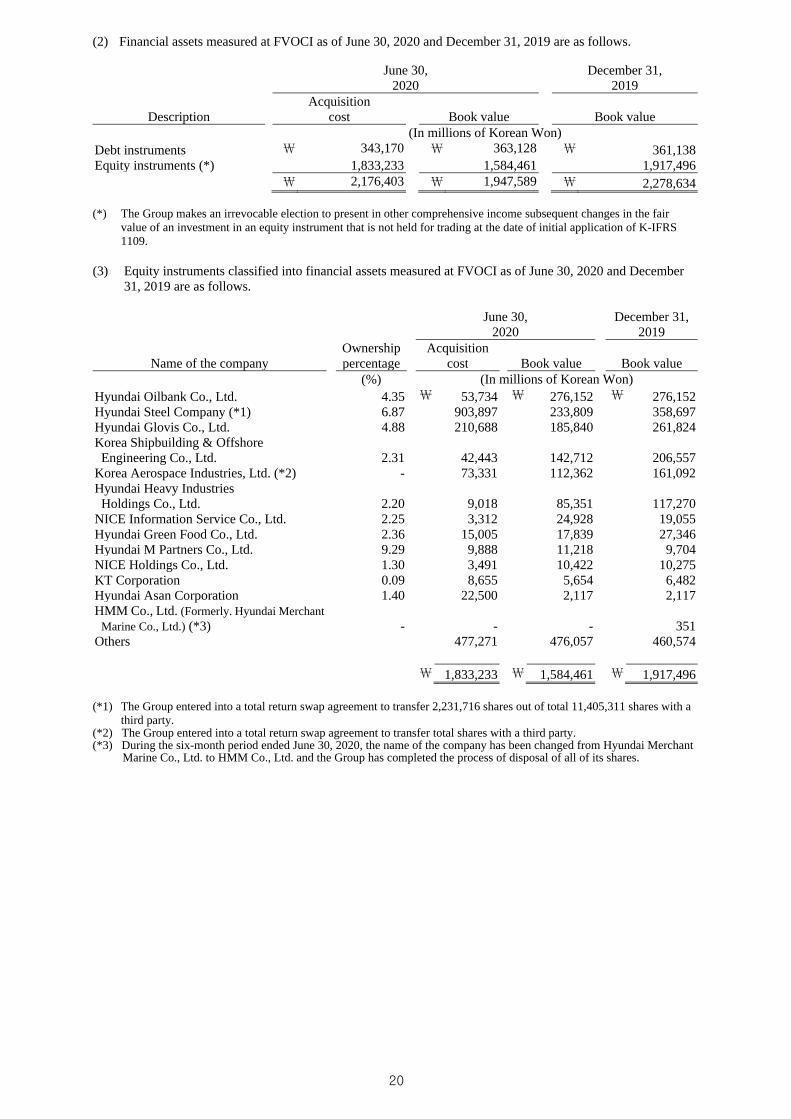
(2) Financial assets measured at FVOCI as of June 30, 2020 and December 31, 2019 are as follows.
June 30, 2020
December 31, 2019
Description Acquisition
cost Book value Book value (In millions of Korean Won)
Debt instruments ₩ 343,170 ₩ 363,128 ₩ 361,138 Equity instruments (*) 1,833,233 1,584,461 1,917,496
₩ 2,176,403 ₩ 1,947,589 ₩ 2,278,634
(*) The Group makes an irrevocable election to present in other comprehensive income subsequent changes in the fair value of an investment in an equity instrument that is not held for trading at the date of initial application of K-IFRS 1109.
(3) Equity instruments classified into financial assets measured at FVOCI as of June 30, 2020 and December31, 2019 are as follows.
June 30,
2020 December 31,
2019
Name of the company Ownership percentage
Acquisition cost Book value Book value
(%) (In millions of Korean Won) Hyundai Oilbank Co., Ltd. 4.35 ₩ 53,734 ₩ 276,152 ₩ 276,152 Hyundai Steel Company (*1) 6.87 903,897 233,809 358,697 Hyundai Glovis Co., Ltd. 4.88 210,688 185,840 261,824 Korea Shipbuilding & Offshore Engineering Co., Ltd. 2.31 42,443 142,712 206,557
Korea Aerospace Industries, Ltd. (*2) - 73,331 112,362 161,092 Hyundai Heavy Industries Holdings Co., Ltd. 2.20 9,018 85,351 117,270
NICE Information Service Co., Ltd. 2.25 3,312 24,928 19,055 Hyundai Green Food Co., Ltd. 2.36 15,005 17,839 27,346 Hyundai M Partners Co., Ltd. 9.29 9,888 11,218 9,704 NICE Holdings Co., Ltd. 1.30 3,491 10,422 10,275 KT Corporation 0.09 8,655 5,654 6,482 Hyundai Asan Corporation 1.40 22,500 2,117 2,117 HMM Co., Ltd. (Formerly. Hyundai Merchant
Marine Co., Ltd.) (*3) - - - 351 Others 477,271 476,057 460,574
₩ 1,833,233 ₩ 1,584,461 ₩ 1,917,496
(*1) The Group entered into a total return swap agreement to transfer 2,231,716 shares out of total 11,405,311 shares with a third party.
(*2) The Group entered into a total return swap agreement to transfer total shares with a third party. (*3) During the six-month period ended June 30, 2020, the name of the company has been changed from Hyundai Merchant
Marine Co., Ltd. to HMM Co., Ltd. and the Group has completed the process of disposal of all of its shares.
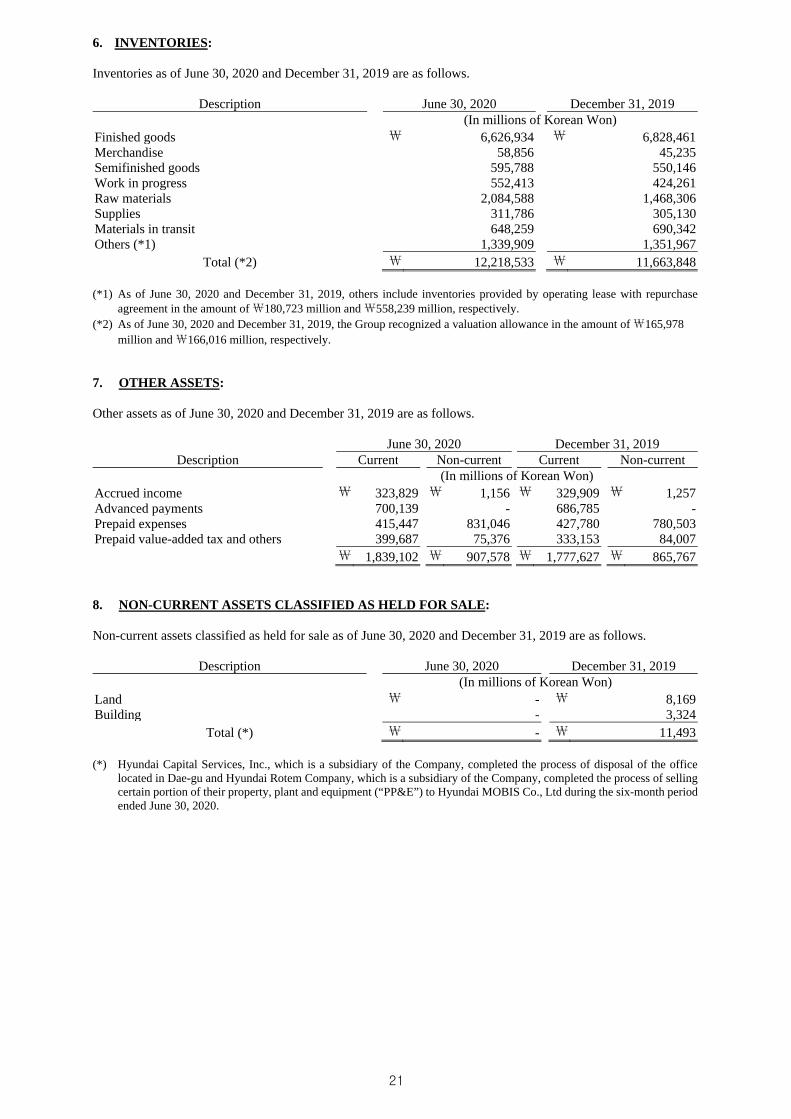
6. INVENTORIES:
Inventories as of June 30, 2020 and December 31, 2019 are as follows.
Description June 30, 2020 December 31, 2019 (In millions of Korean Won)
Finished goods ₩ 6,626,934 ₩ 6,828,461 Merchandise 58,856 45,235 Semifinished goods 595,788 550,146 Work in progress 552,413 424,261 Raw materials 2,084,588 1,468,306 Supplies 311,786 305,130 Materials in transit 648,259 690,342 Others (*1) 1,339,909 1,351,967
Total (*2) ₩ 12,218,533 ₩ 11,663,848
(*1) As of June 30, 2020 and December 31, 2019, others include inventories provided by operating lease with repurchase agreement in the amount of ₩180,723 million and ₩558,239 million, respectively.
(*2) As of June 30, 2020 and December 31, 2019, the Group recognized a valuation allowance in the amount of ₩165,978 million and ₩166,016 million, respectively.
7. OTHER ASSETS:
Other assets as of June 30, 2020 and December 31, 2019 are as follows.
June 30, 2020 December 31, 2019 Description Current Non-current Current Non-current
(In millions of Korean Won) Accrued income ₩ 323,829 ₩ 1,156 ₩ 329,909 ₩ 1,257 Advanced payments 700,139 - 686,785 - Prepaid expenses 415,447 831,046 427,780 780,503 Prepaid value-added tax and others 399,687 75,376 333,153 84,007 ₩ 1,839,102 ₩ 907,578 ₩ 1,777,627 ₩ 865,767
8. NON-CURRENT ASSETS CLASSIFIED AS HELD FOR SALE:
Non-current assets classified as held for sale as of June 30, 2020 and December 31, 2019 are as follows.
Description June 30, 2020 December 31, 2019 (In millions of Korean Won)
Land ₩ - ₩ 8,169 Building - 3,324
Total (*) ₩ - ₩ 11,493
(*) Hyundai Capital Services, Inc., which is a subsidiary of the Company, completed the process of disposal of the office located in Dae-gu and Hyundai Rotem Company, which is a subsidiary of the Company, completed the process of selling certain portion of their property, plant and equipment (“PP&E”) to Hyundai MOBIS Co., Ltd during the six-month period ended June 30, 2020.
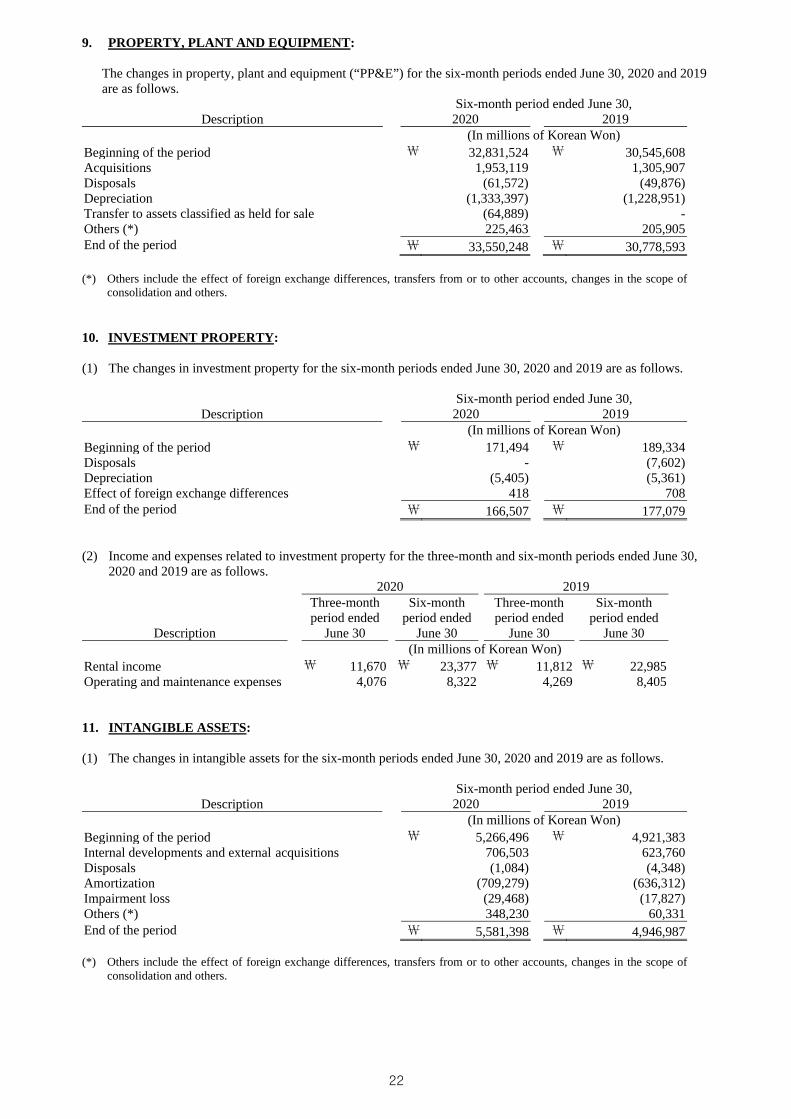
9. PROPERTY, PLANT AND EQUIPMENT:
The changes in property, plant and equipment (“PP&E”) for the six-month periods ended June 30, 2020 and 2019are as follows.
Six-month period ended June 30, Description 2020 2019
(In millions of Korean Won) Beginning of the period ₩ 32,831,524 ₩ 30,545,608 Acquisitions 1,953,119 1,305,907 Disposals (61,572) (49,876) Depreciation (1,333,397) (1,228,951) Transfer to assets classified as held for sale (64,889) - Others (*) 225,463 205,905 End of the period ₩ 33,550,248 ₩ 30,778,593
(*) Others include the effect of foreign exchange differences, transfers from or to other accounts, changes in the scope of consolidation and others.
10. INVESTMENT PROPERTY:
(1) The changes in investment property for the six-month periods ended June 30, 2020 and 2019 are as follows.
Six-month period ended June 30, Description 2020 2019
(In millions of Korean Won) Beginning of the period ₩ 171,494 ₩ 189,334 Disposals - (7,602) Depreciation (5,405) (5,361) Effect of foreign exchange differences 418 708 End of the period ₩ 166,507 ₩ 177,079
(2) Income and expenses related to investment property for the three-month and six-month periods ended June 30,2020 and 2019 are as follows.
2020 2019
Description
Three-month period ended
June 30
Six-month period ended
June 30
Three-month period ended
June 30
Six-month period ended
June 30 (In millions of Korean Won)
Rental income ₩ 11,670 ₩ 23,377 ₩ 11,812 ₩ 22,985 Operating and maintenance expenses 4,076 8,322 4,269 8,405
11. INTANGIBLE ASSETS:
(1) The changes in intangible assets for the six-month periods ended June 30, 2020 and 2019 are as follows.
Six-month period ended June 30, Description 2020 2019
(In millions of Korean Won) Beginning of the period ₩ 5,266,496 ₩ 4,921,383 Internal developments and external acquisitions 706,503 623,760 Disposals (1,084) (4,348) Amortization (709,279) (636,312) Impairment loss (29,468) (17,827) Others (*) 348,230 60,331 End of the period ₩ 5,581,398 ₩ 4,946,987
(*) Others include the effect of foreign exchange differences, transfers from or to other accounts, changes in the scope of consolidation and others.
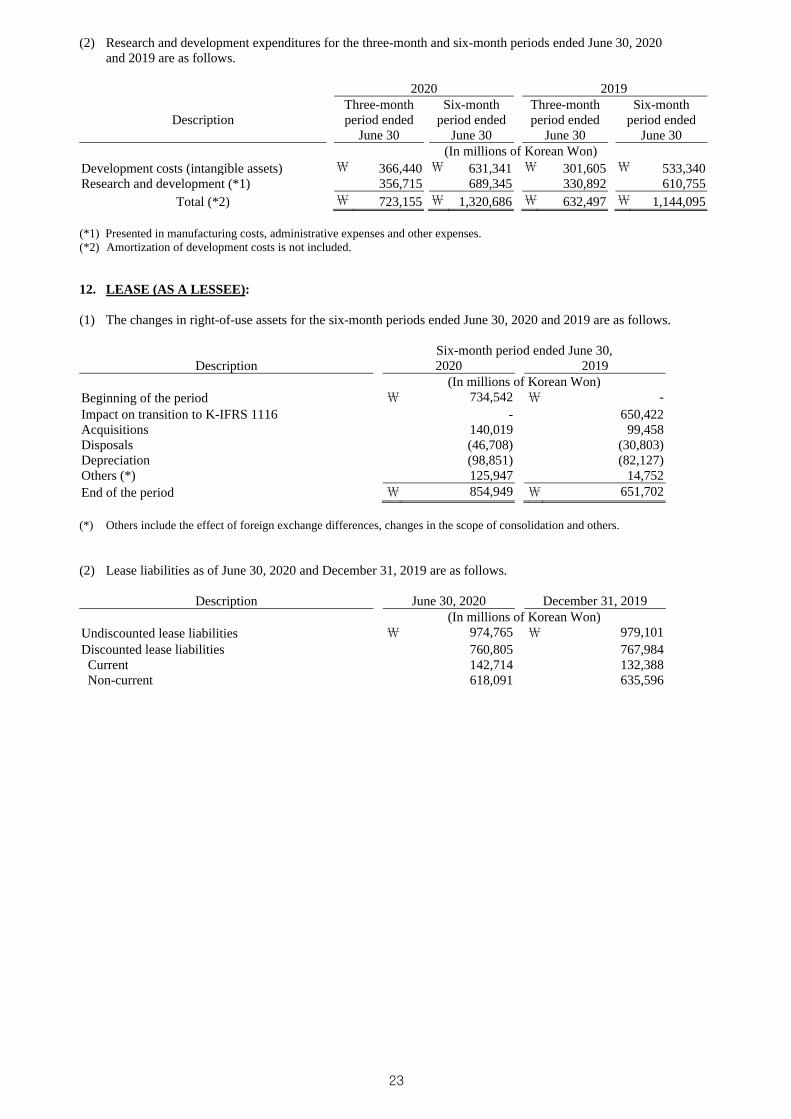
(2) Research and development expenditures for the three-month and six-month periods ended June 30, 2020and 2019 are as follows.
2020 2019
Description Three-month period ended
June 30
Six-month period ended
June 30
Three-month period ended
June 30
Six-month period ended
June 30 (In millions of Korean Won)
Development costs (intangible assets) ₩ 366,440 ₩ 631,341 ₩ 301,605 ₩ 533,340 Research and development (*1) 356,715 689,345 330,892 610,755
Total (*2) ₩ 723,155 ₩ 1,320,686 ₩ 632,497 ₩ 1,144,095
(*1) Presented in manufacturing costs, administrative expenses and other expenses. (*2) Amortization of development costs is not included.
12. LEASE (AS A LESSEE):
(1) The changes in right-of-use assets for the six-month periods ended June 30, 2020 and 2019 are as follows.
Six-month period ended June 30, Description 2020 2019
(In millions of Korean Won) Beginning of the period ₩ 734,542 ₩ - Impact on transition to K-IFRS 1116 - 650,422Acquisitions 140,019 99,458Disposals (46,708) (30,803)Depreciation (98,851) (82,127)Others (*) 125,947 14,752 End of the period ₩ 854,949 ₩ 651,702
(*) Others include the effect of foreign exchange differences, changes in the scope of consolidation and others.
(2) Lease liabilities as of June 30, 2020 and December 31, 2019 are as follows.
Description June 30, 2020 December 31, 2019 (In millions of Korean Won)
Undiscounted lease liabilities ₩ 974,765 ₩ 979,101 Discounted lease liabilities 760,805 767,984 Current 142,714 132,388 Non-current 618,091 635,596
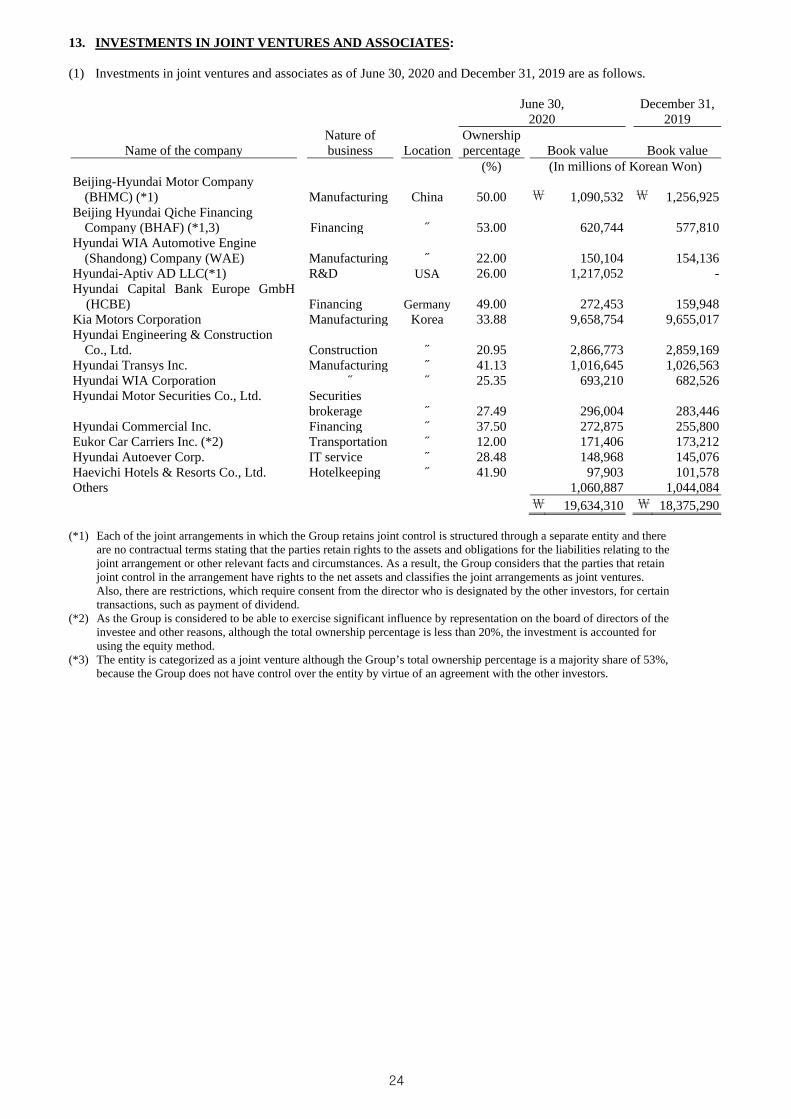
13. INVESTMENTS IN JOINT VENTURES AND ASSOCIATES:
(1) Investments in joint ventures and associates as of June 30, 2020 and December 31, 2019 are as follows.
June 30,
2020 December 31,
2019
Name of the company Nature of business Location
Ownership percentage Book value Book value
(%) (In millions of Korean Won) Beijing-Hyundai Motor Company
(BHMC) (*1) Manufacturing China 50.00 ₩ 1,090,532 ₩ 1,256,925 Beijing Hyundai Qiche Financing
Company (BHAF) (*1,3) Financing ˝ 53.00 620,744 577,810 Hyundai WIA Automotive Engine
(Shandong) Company (WAE) Manufacturing ˝ 22.00 150,104 154,136 Hyundai-Aptiv AD LLC(*1) R&D USA 26.00 1,217,052 - Hyundai Capital Bank Europe GmbH
(HCBE) Financing Germany 49.00 272,453 159,948 Kia Motors Corporation Manufacturing Korea 33.88 9,658,754 9,655,017 Hyundai Engineering & Construction
Co., Ltd. Construction ˝ 20.95 2,866,773 2,859,169 Hyundai Transys Inc. Manufacturing ˝ 41.13 1,016,645 1,026,563 Hyundai WIA Corporation ˝ ˝ 25.35 693,210 682,526 Hyundai Motor Securities Co., Ltd. Securities
brokerage ˝ 27.49 296,004 283,446 Hyundai Commercial Inc. Financing ˝ 37.50 272,875 255,800 Eukor Car Carriers Inc. (*2) Transportation ˝ 12.00 171,406 173,212 Hyundai Autoever Corp. IT service ˝ 28.48 148,968 145,076 Haevichi Hotels & Resorts Co., Ltd. Hotelkeeping ˝ 41.90 97,903 101,578 Others 1,060,887 1,044,084
₩ 19,634,310 ₩ 18,375,290
(*1) Each of the joint arrangements in which the Group retains joint control is structured through a separate entity and there are no contractual terms stating that the parties retain rights to the assets and obligations for the liabilities relating to the joint arrangement or other relevant facts and circumstances. As a result, the Group considers that the parties that retain joint control in the arrangement have rights to the net assets and classifies the joint arrangements as joint ventures. Also, there are restrictions, which require consent from the director who is designated by the other investors, for certain transactions, such as payment of dividend.
(*2) As the Group is considered to be able to exercise significant influence by representation on the board of directors of the investee and other reasons, although the total ownership percentage is less than 20%, the investment is accounted for using the equity method.
(*3) The entity is categorized as a joint venture although the Group’s total ownership percentage is a majority share of 53%, because the Group does not have control over the entity by virtue of an agreement with the other investors.
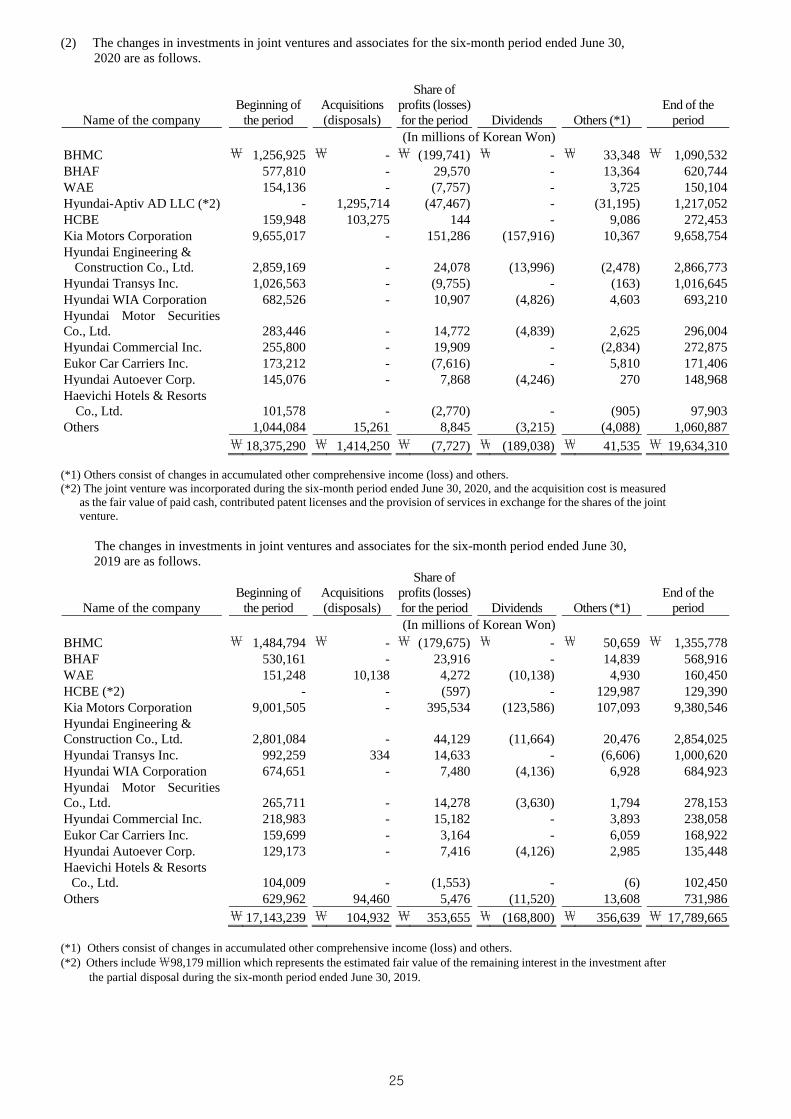
(2) The changes in investments in joint ventures and associates for the six-month period ended June 30,2020 are as follows.
Name of the company Beginning of
the period Acquisitions (disposals)
Share of
profits (losses) for the period Dividends Others (*1)
End of the period
(In millions of Korean Won) BHMC ₩ 1,256,925 ₩ - ₩ (199,741) ₩ - ₩ 33,348 ₩ 1,090,532 BHAF 577,810 - 29,570 - 13,364 620,744 WAE 154,136 - (7,757) - 3,725 150,104 Hyundai-Aptiv AD LLC (*2) - 1,295,714 (47,467) - (31,195) 1,217,052 HCBE 159,948 103,275 144 - 9,086 272,453 Kia Motors Corporation 9,655,017 - 151,286 (157,916) 10,367 9,658,754 Hyundai Engineering &
Construction Co., Ltd. 2,859,169 - 24,078 (13,996) (2,478) 2,866,773 Hyundai Transys Inc. 1,026,563 - (9,755) - (163) 1,016,645 Hyundai WIA Corporation 682,526 - 10,907 (4,826) 4,603 693,210 Hyundai Motor Securities Co., Ltd. 283,446 - 14,772 (4,839) 2,625 296,004 Hyundai Commercial Inc. 255,800 - 19,909 - (2,834) 272,875 Eukor Car Carriers Inc. 173,212 - (7,616) - 5,810 171,406 Hyundai Autoever Corp. 145,076 - 7,868 (4,246) 270 148,968 Haevichi Hotels & Resorts Co., Ltd. 101,578 - (2,770) - (905) 97,903 Others 1,044,084 15,261 8,845 (3,215) (4,088) 1,060,887
₩ 18,375,290 ₩ 1,414,250 ₩ (7,727) ₩ (189,038) ₩ 41,535 ₩ 19,634,310
(*1) Others consist of changes in accumulated other comprehensive income (loss) and others. (*2) The joint venture was incorporated during the six-month period ended June 30, 2020, and the acquisition cost is measured
as the fair value of paid cash, contributed patent licenses and the provision of services in exchange for the shares of the joint venture.
The changes in investments in joint ventures and associates for the six-month period ended June 30, 2019 are as follows.
Name of the company Beginning of
the period Acquisitions (disposals)
Share of
profits (losses) for the period Dividends Others (*1)
End of the period
(In millions of Korean Won) BHMC ₩ 1,484,794 ₩ - ₩ (179,675) ₩ - ₩ 50,659 ₩ 1,355,778 BHAF 530,161 - 23,916 - 14,839 568,916 WAE 151,248 10,138 4,272 (10,138) 4,930 160,450 HCBE (*2) - - (597) - 129,987 129,390 Kia Motors Corporation 9,001,505 - 395,534 (123,586) 107,093 9,380,546 Hyundai Engineering & Construction Co., Ltd. 2,801,084 - 44,129 (11,664) 20,476 2,854,025 Hyundai Transys Inc. 992,259 334 14,633 - (6,606) 1,000,620 Hyundai WIA Corporation 674,651 - 7,480 (4,136) 6,928 684,923 Hyundai Motor Securities Co., Ltd. 265,711 - 14,278 (3,630) 1,794 278,153 Hyundai Commercial Inc. 218,983 - 15,182 - 3,893 238,058 Eukor Car Carriers Inc. 159,699 - 3,164 - 6,059 168,922 Hyundai Autoever Corp. 129,173 - 7,416 (4,126) 2,985 135,448 Haevichi Hotels & Resorts Co., Ltd. 104,009 - (1,553) - (6) 102,450 Others 629,962 94,460 5,476 (11,520) 13,608 731,986
₩ 17,143,239 ₩ 104,932 ₩ 353,655 ₩ (168,800) ₩ 356,639 ₩ 17,789,665
(*1) Others consist of changes in accumulated other comprehensive income (loss) and others. (*2) Others include ₩98,179 million which represents the estimated fair value of the remaining interest in the investment after
the partial disposal during the six-month period ended June 30, 2019.
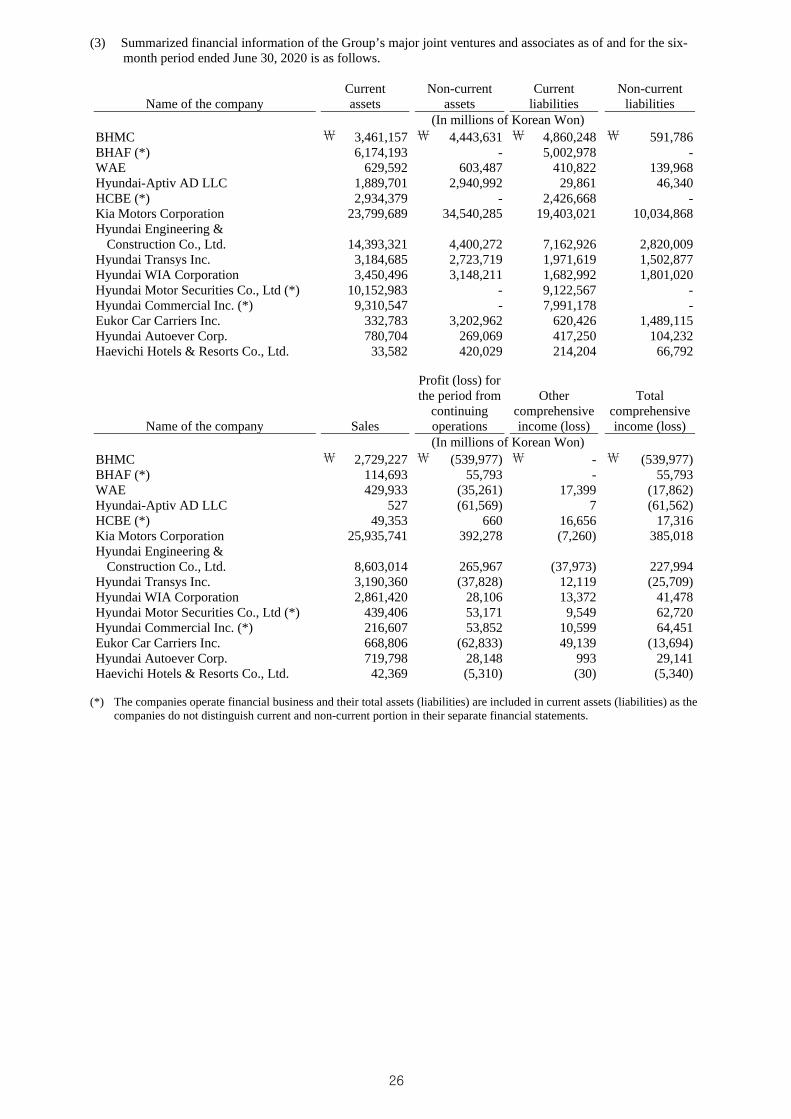
(3) Summarized financial information of the Group’s major joint ventures and associates as of and for the six- month period ended June 30, 2020 is as follows.
Name of the companyCurrent assets
Non-current assets
Current liabilities
Non-current liabilities
(In millions of Korean Won) BHMC ₩ 3,461,157 ₩ 4,443,631 ₩ 4,860,248 ₩ 591,786 BHAF (*) 6,174,193 - 5,002,978 - WAE 629,592 603,487 410,822 139,968 Hyundai-Aptiv AD LLC 1,889,701 2,940,992 29,861 46,340 HCBE (*) 2,934,379 - 2,426,668 - Kia Motors Corporation 23,799,689 34,540,285 19,403,021 10,034,868 Hyundai Engineering &
Construction Co., Ltd. 14,393,321 4,400,272 7,162,926 2,820,009 Hyundai Transys Inc. 3,184,685 2,723,719 1,971,619 1,502,877 Hyundai WIA Corporation 3,450,496 3,148,211 1,682,992 1,801,020 Hyundai Motor Securities Co., Ltd (*) 10,152,983 - 9,122,567 - Hyundai Commercial Inc. (*) 9,310,547 - 7,991,178 - Eukor Car Carriers Inc. 332,783 3,202,962 620,426 1,489,115 Hyundai Autoever Corp. 780,704 269,069 417,250 104,232 Haevichi Hotels & Resorts Co., Ltd. 33,582 420,029 214,204 66,792
Name of the company Sales
Profit (loss) for the period from
continuing operations
Other comprehensive income (loss)
Total comprehensive income (loss)
(In millions of Korean Won) BHMC ₩ 2,729,227 ₩ (539,977) ₩ - ₩ (539,977)BHAF (*) 114,693 55,793 - 55,793WAE 429,933 (35,261) 17,399 (17,862)Hyundai-Aptiv AD LLC 527 (61,569) 7 (61,562)HCBE (*) 49,353 660 16,656 17,316Kia Motors Corporation 25,935,741 392,278 (7,260) 385,018Hyundai Engineering &
Construction Co., Ltd. 8,603,014 265,967 (37,973) 227,994Hyundai Transys Inc. 3,190,360 (37,828) 12,119 (25,709)Hyundai WIA Corporation 2,861,420 28,106 13,372 41,478 Hyundai Motor Securities Co., Ltd (*) 439,406 53,171 9,549 62,720 Hyundai Commercial Inc. (*) 216,607 53,852 10,599 64,451 Eukor Car Carriers Inc. 668,806 (62,833) 49,139 (13,694) Hyundai Autoever Corp. 719,798 28,148 993 29,141 Haevichi Hotels & Resorts Co., Ltd. 42,369 (5,310) (30) (5,340)
(*) The companies operate financial business and their total assets (liabilities) are included in current assets (liabilities) as the companies do not distinguish current and non-current portion in their separate financial statements.
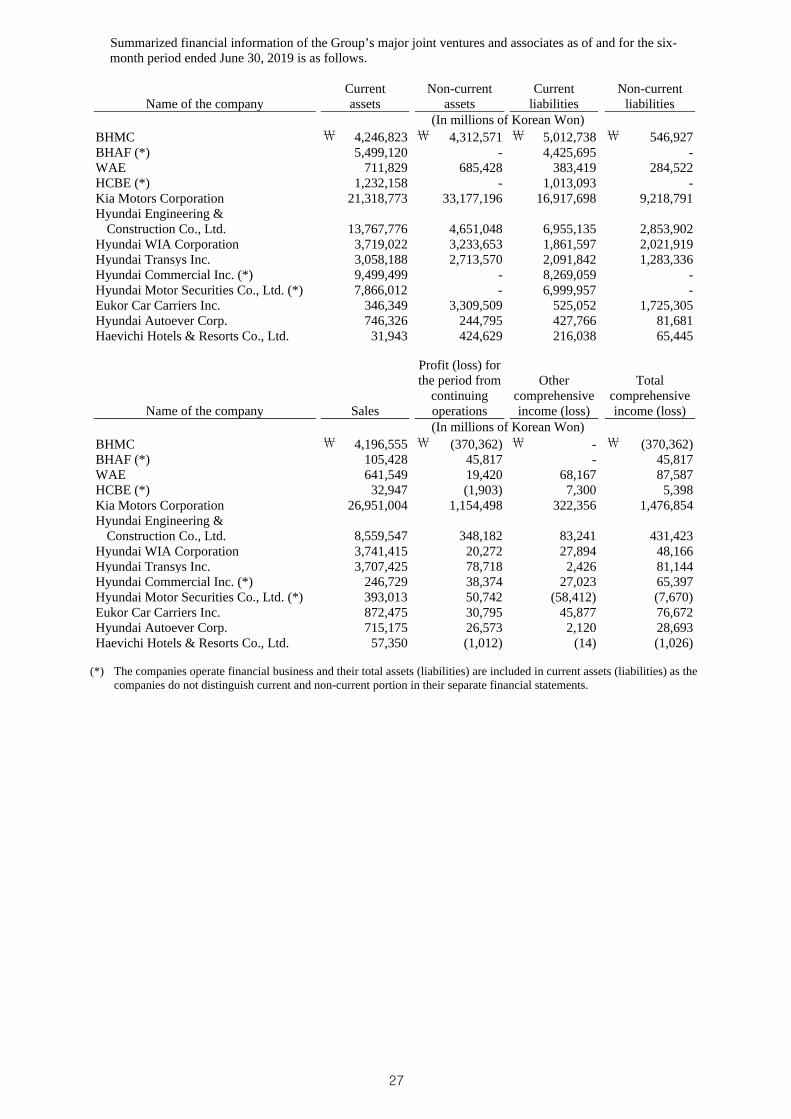
Summarized financial information of the Group’s major joint ventures and associates as of and for the six- month period ended June 30, 2019 is as follows.
Name of the companyCurrent assets
Non-current assets
Current liabilities
Non-current liabilities
(In millions of Korean Won) BHMC ₩ 4,246,823 ₩ 4,312,571 ₩ 5,012,738 ₩ 546,927 BHAF (*) 5,499,120 - 4,425,695 - WAE 711,829 685,428 383,419 284,522 HCBE (*) 1,232,158 - 1,013,093 - Kia Motors Corporation 21,318,773 33,177,196 16,917,698 9,218,791 Hyundai Engineering &
Construction Co., Ltd. 13,767,776 4,651,048 6,955,135 2,853,902 Hyundai WIA Corporation 3,719,022 3,233,653 1,861,597 2,021,919 Hyundai Transys Inc. 3,058,188 2,713,570 2,091,842 1,283,336 Hyundai Commercial Inc. (*) 9,499,499 - 8,269,059 - Hyundai Motor Securities Co., Ltd. (*) 7,866,012 - 6,999,957 - Eukor Car Carriers Inc. 346,349 3,309,509 525,052 1,725,305 Hyundai Autoever Corp. 746,326 244,795 427,766 81,681 Haevichi Hotels & Resorts Co., Ltd. 31,943 424,629 216,038 65,445
Name of the company Sales
Profit (loss) for the period from
continuing operations
Other comprehensive income (loss)
Total comprehensive income (loss)
(In millions of Korean Won) BHMC ₩ 4,196,555 ₩ (370,362) ₩ - ₩ (370,362)BHAF (*) 105,428 45,817 - 45,817WAE 641,549 19,420 68,167 87,587HCBE (*) 32,947 (1,903) 7,300 5,398Kia Motors Corporation 26,951,004 1,154,498 322,356 1,476,854 Hyundai Engineering &
Construction Co., Ltd. 8,559,547 348,182 83,241 431,423 Hyundai WIA Corporation 3,741,415 20,272 27,894 48,166 Hyundai Transys Inc. 3,707,425 78,718 2,426 81,144 Hyundai Commercial Inc. (*) 246,729 38,374 27,023 65,397 Hyundai Motor Securities Co., Ltd. (*) 393,013 50,742 (58,412) (7,670) Eukor Car Carriers Inc. 872,475 30,795 45,877 76,672 Hyundai Autoever Corp. 715,175 26,573 2,120 28,693 Haevichi Hotels & Resorts Co., Ltd. 57,350 (1,012) (14) (1,026)
(*) The companies operate financial business and their total assets (liabilities) are included in current assets (liabilities) as the companies do not distinguish current and non-current portion in their separate financial statements.
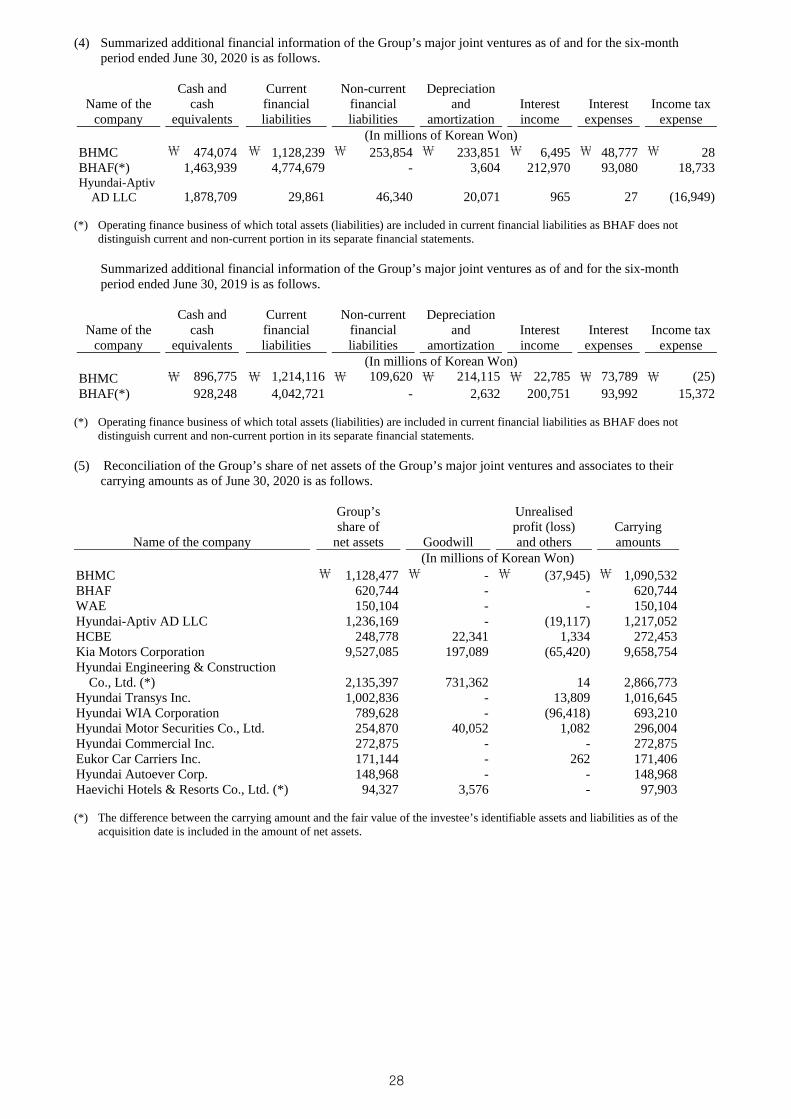
(4) Summarized additional financial information of the Group’s major joint ventures as of and for the six-monthperiod ended June 30, 2020 is as follows.
Name of the company
Cash and cash
equivalents
Current financial liabilities
Non-current financial liabilities
Depreciation and
amortization Interest income
Interest expenses
Income tax expense
(In millions of Korean Won) BHMC ₩ 474,074 ₩ 1,128,239 ₩ 253,854 ₩ 233,851 ₩ 6,495 ₩ 48,777 ₩ 28 BHAF(*) 1,463,939 4,774,679 - 3,604 212,970 93,080 18,733 Hyundai-Aptiv
AD LLC 1,878,709 29,861 46,340 20,071 965 27 (16,949)
(*) Operating finance business of which total assets (liabilities) are included in current financial liabilities as BHAF does not distinguish current and non-current portion in its separate financial statements.
Summarized additional financial information of the Group’s major joint ventures as of and for the six-month period ended June 30, 2019 is as follows.
Name of the company
Cash and cash
equivalents
Current financial liabilities
Non-current financial liabilities
Depreciation and
amortization Interest income
Interest expenses
Income tax expense
(In millions of Korean Won) BHMC ₩ 896,775 ₩ 1,214,116 ₩ 109,620 ₩ 214,115 ₩ 22,785 ₩ 73,789 ₩ (25) BHAF(*) 928,248 4,042,721 - 2,632 200,751 93,992 15,372
(*) Operating finance business of which total assets (liabilities) are included in current financial liabilities as BHAF does not distinguish current and non-current portion in its separate financial statements.
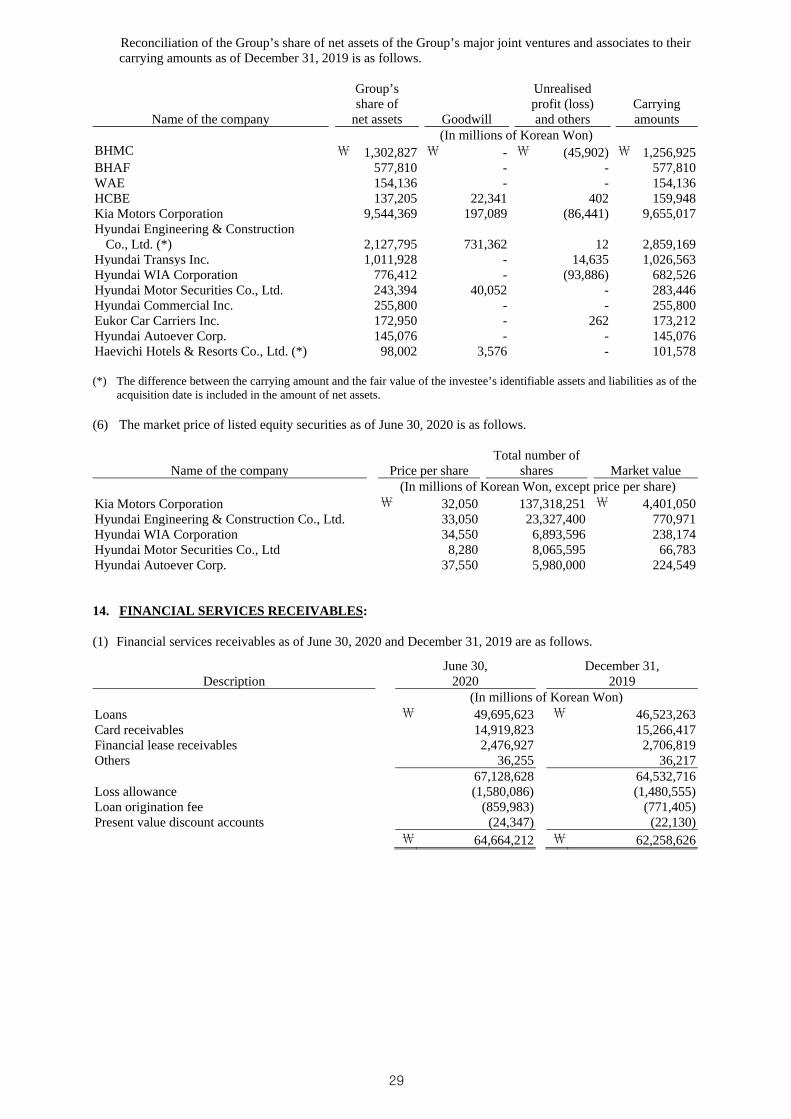
(5) Reconciliation of the Group’s share of net assets of the Group’s major joint ventures and associates to theircarrying amounts as of June 30, 2020 is as follows.
Name of the company
Group’s share of
net assets Goodwill
Unrealised profit (loss) and others
Carrying amounts
(In millions of Korean Won) BHMC ₩ 1,128,477 ₩ - ₩ (37,945) ₩ 1,090,532 BHAF 620,744 - - 620,744 WAE 150,104 - - 150,104 Hyundai-Aptiv AD LLC 1,236,169 - (19,117) 1,217,052 HCBE 248,778 22,341 1,334 272,453 Kia Motors Corporation 9,527,085 197,089 (65,420) 9,658,754 Hyundai Engineering & Construction
Co., Ltd. (*) 2,135,397 731,362 14 2,866,773 Hyundai Transys Inc. 1,002,836 - 13,809 1,016,645 Hyundai WIA Corporation 789,628 - (96,418) 693,210 Hyundai Motor Securities Co., Ltd. 254,870 40,052 1,082 296,004 Hyundai Commercial Inc. 272,875 - - 272,875 Eukor Car Carriers Inc. 171,144 - 262 171,406 Hyundai Autoever Corp. 148,968 - - 148,968 Haevichi Hotels & Resorts Co., Ltd. (*) 94,327 3,576 - 97,903
(*) The difference between the carrying amount and the fair value of the investee’s identifiable assets and liabilities as of the acquisition date is included in the amount of net assets.
Reconciliation of the Group’s share of net assets of the Group’s major joint ventures and associates to their carrying amounts as of December 31, 2019 is as follows.
Name of the company
Group’s share of
net assets Goodwill
Unrealised profit (loss) and others
Carrying amounts
(In millions of Korean Won) BHMC ₩ 1,302,827 ₩ - ₩ (45,902) ₩ 1,256,925 BHAF 577,810 - - 577,810 WAE 154,136 - - 154,136 HCBE 137,205 22,341 402 159,948 Kia Motors Corporation 9,544,369 197,089 (86,441) 9,655,017 Hyundai Engineering & Construction
Co., Ltd. (*) 2,127,795 731,362 12 2,859,169 Hyundai Transys Inc. 1,011,928 - 14,635 1,026,563 Hyundai WIA Corporation 776,412 - (93,886) 682,526 Hyundai Motor Securities Co., Ltd. 243,394 40,052 - 283,446Hyundai Commercial Inc. 255,800 - - 255,800Eukor Car Carriers Inc. 172,950 - 262 173,212Hyundai Autoever Corp. 145,076 - - 145,076Haevichi Hotels & Resorts Co., Ltd. (*) 98,002 3,576 - 101,578
(*) The difference between the carrying amount and the fair value of the investee’s identifiable assets and liabilities as of the acquisition date is included in the amount of net assets.
(6) The market price of listed equity securities as of June 30, 2020 is as follows.
Name of the company Price per share Total number of
shares Market value (In millions of Korean Won, except price per share)
Kia Motors Corporation ₩ 32,050 137,318,251 ₩ 4,401,050 Hyundai Engineering & Construction Co., Ltd. 33,050 23,327,400 770,971 Hyundai WIA Corporation 34,550 6,893,596 238,174 Hyundai Motor Securities Co., Ltd 8,280 8,065,595 66,783Hyundai Autoever Corp. 37,550 5,980,000 224,549
14. FINANCIAL SERVICES RECEIVABLES:
(1) Financial services receivables as of June 30, 2020 and December 31, 2019 are as follows.
DescriptionJune 30,
2020 December 31,
2019 (In millions of Korean Won)
Loans ₩ 49,695,623 ₩ 46,523,263 Card receivables 14,919,823 15,266,417 Financial lease receivables 2,476,927 2,706,819 Others 36,255 36,217
67,128,628 64,532,716Loss allowance (1,580,086) (1,480,555) Loan origination fee (859,983) (771,405) Present value discount accounts (24,347) (22,130)
₩ 64,664,212 ₩ 62,258,626
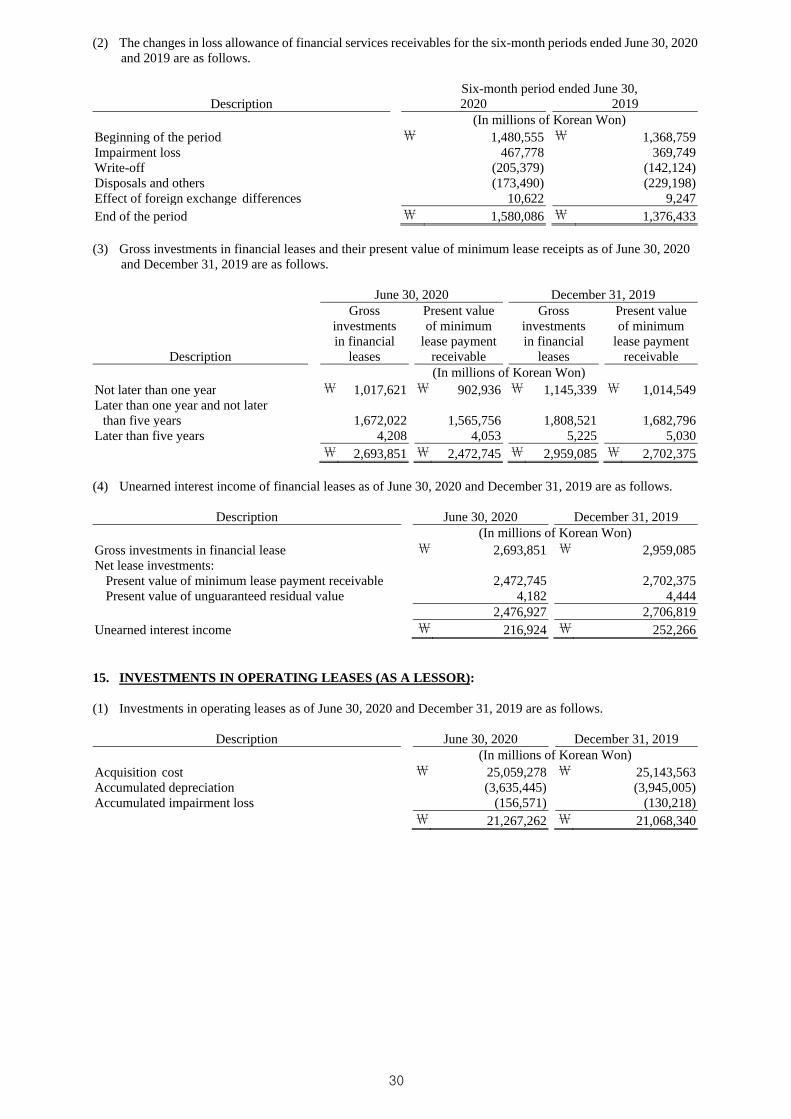
(2) The changes in loss allowance of financial services receivables for the six-month periods ended June 30, 2020and 2019 are as follows.
Six-month period ended June 30, Description 2020 2019
(In millions of Korean Won) Beginning of the period ₩ 1,480,555 ₩ 1,368,759 Impairment loss 467,778 369,749 Write-off (205,379) (142,124) Disposals and others (173,490) (229,198) Effect of foreign exchange differences 10,622 9,247 End of the period ₩ 1,580,086 ₩ 1,376,433
(3) Gross investments in financial leases and their present value of minimum lease receipts as of June 30, 2020and December 31, 2019 are as follows.
June 30, 2020 December 31, 2019
Description
Gross investments in financial
leases
Present value of minimum
lease payment receivable
Gross investments in financial
leases
Present value of minimum
lease payment receivable
(In millions of Korean Won) Not later than one year ₩ 1,017,621 ₩ 902,936 ₩ 1,145,339 ₩ 1,014,549 Later than one year and not later
than five years 1,672,022 1,565,756 1,808,521 1,682,796 Later than five years 4,208 4,053 5,225 5,030 ₩ 2,693,851 ₩ 2,472,745 ₩ 2,959,085 ₩ 2,702,375
(4) Unearned interest income of financial leases as of June 30, 2020 and December 31, 2019 are as follows.
Description June 30, 2020 December 31, 2019 (In millions of Korean Won)
Gross investments in financial lease ₩ 2,693,851 ₩ 2,959,085 Net lease investments:
Present value of minimum lease payment receivable 2,472,745 2,702,375 Present value of unguaranteed residual value 4,182 4,444
2,476,927 2,706,819Unearned interest income ₩ 216,924 ₩ 252,266
15. INVESTMENTS IN OPERATING LEASES (AS A LESSOR):
(1) Investments in operating leases as of June 30, 2020 and December 31, 2019 are as follows.
Description June 30, 2020 December 31, 2019 (In millions of Korean Won)
Acquisition cost ₩ 25,059,278 ₩ 25,143,563 Accumulated depreciation (3,635,445) (3,945,005) Accumulated impairment loss (156,571) (130,218)
₩ 21,267,262 ₩ 21,068,340
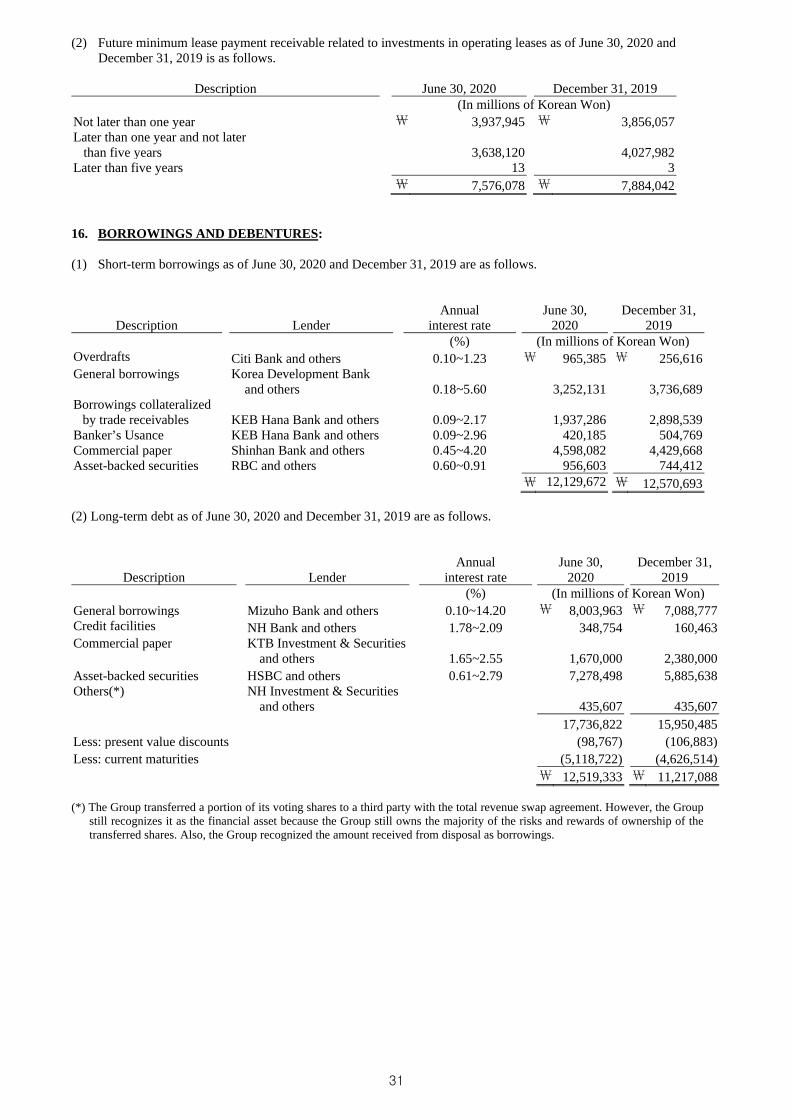
(2) Future minimum lease payment receivable related to investments in operating leases as of June 30, 2020 andDecember 31, 2019 is as follows.
Description June 30, 2020 December 31, 2019 (In millions of Korean Won)
Not later than one year ₩ 3,937,945 ₩ 3,856,057 Later than one year and not later
than five years 3,638,120 4,027,982Later than five years 13 3
₩ 7,576,078 ₩ 7,884,042
16. BORROWINGS AND DEBENTURES:
(1) Short-term borrowings as of June 30, 2020 and December 31, 2019 are as follows.
Annual interest rate Description Lender
June 30, 2020
December 31, 2019
(%) (In millions of Korean Won) Overdrafts Citi Bank and others 0.10~1.23 ₩ 965,385 ₩ 256,616 General borrowings Korea Development Bank
and others 0.18~5.60 3,252,131 3,736,689 Borrowings collateralized
by trade receivables KEB Hana Bank and others 0.09~2.17 1,937,286 2,898,539 Banker’s Usance KEB Hana Bank and others 0.09~2.96 420,185 504,769 Commercial paper Shinhan Bank and others 0.45~4.20 4,598,082 4,429,668 Asset-backed securities RBC and others 0.60~0.91 956,603 744,412
₩ 12,129,672 ₩ 12,570,693
(2) Long-term debt as of June 30, 2020 and December 31, 2019 are as follows.
Annual interest rate Description Lender
June 30, 2020
December 31, 2019
(%) (In millions of Korean Won) General borrowings Mizuho Bank and others 0.10~14.20 ₩ 8,003,963 ₩ 7,088,777 Credit facilities NH Bank and others 1.78~2.09 348,754 160,463 Commercial paper KTB Investment & Securities
and others 1.65~2.55 1,670,000 2,380,000 Asset-backed securities HSBC and others 0.61~2.79 7,278,498 5,885,638 Others(*) NH Investment & Securities
and others 435,607 435,607 17,736,822 15,950,485
Less: present value discounts (98,767) (106,883) Less: current maturities (5,118,722) (4,626,514)
₩ 12,519,333 ₩ 11,217,088
(*) The Group transferred a portion of its voting shares to a third party with the total revenue swap agreement. However, the Group still recognizes it as the financial asset because the Group still owns the majority of the risks and rewards of ownership of the transferred shares. Also, the Group recognized the amount received from disposal as borrowings.
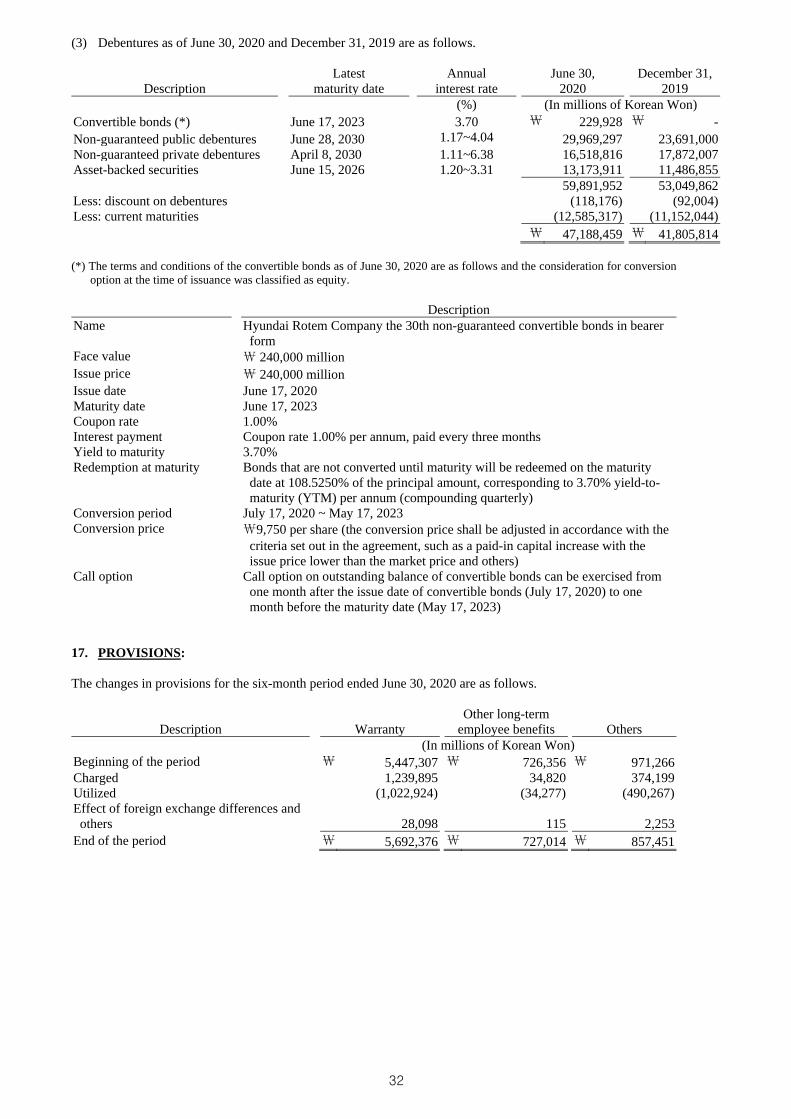
(3) Debentures as of June 30, 2020 and December 31, 2019 are as follows.
Description Latest
maturity date Annual
interest rate June 30,
2020 December 31,
2019 (%) (In millions of Korean Won)
Convertible bonds (*) June 17, 2023 3.70 ₩ 229,928 ₩ - Non-guaranteed public debentures June 28, 2030 1.17~4.04 29,969,297 23,691,000 Non-guaranteed private debentures April 8, 2030 1.11~6.38 16,518,816 17,872,007 Asset-backed securities June 15, 2026 1.20~3.31 13,173,911 11,486,855
59,891,952 53,049,862 Less: discount on debentures (118,176) (92,004) Less: current maturities (12,585,317) (11,152,044)
₩ 47,188,459 ₩ 41,805,814
(*) The terms and conditions of the convertible bonds as of June 30, 2020 are as follows and the consideration for conversion option at the time of issuance was classified as equity.
DescriptionName Hyundai Rotem Company the 30th non-guaranteed convertible bonds in bearer
form Face value ₩ 240,000 million Issue price ₩ 240,000 million Issue date June 17, 2020 Maturity date June 17, 2023 Coupon rate 1.00% Interest payment Coupon rate 1.00% per annum, paid every three months Yield to maturity 3.70% Redemption at maturity Bonds that are not converted until maturity will be redeemed on the maturity
date at 108.5250% of the principal amount, corresponding to 3.70% yield-to-maturity (YTM) per annum (compounding quarterly)
Conversion period July 17, 2020 ~ May 17, 2023 Conversion price ₩9,750 per share (the conversion price shall be adjusted in accordance with the
criteria set out in the agreement, such as a paid-in capital increase with the issue price lower than the market price and others)
Call option Call option on outstanding balance of convertible bonds can be exercised from one month after the issue date of convertible bonds (July 17, 2020) to one month before the maturity date (May 17, 2023)
17. PROVISIONS:
The changes in provisions for the six-month period ended June 30, 2020 are as follows.
Description Warranty Other long-term
employee benefits Others (In millions of Korean Won)
Beginning of the period ₩ 5,447,307 ₩ 726,356 ₩ 971,266 Charged 1,239,895 34,820 374,199 Utilized (1,022,924) (34,277) (490,267) Effect of foreign exchange differences and others 28,098 115 2,253
End of the period ₩ 5,692,376 ₩ 727,014 ₩ 857,451
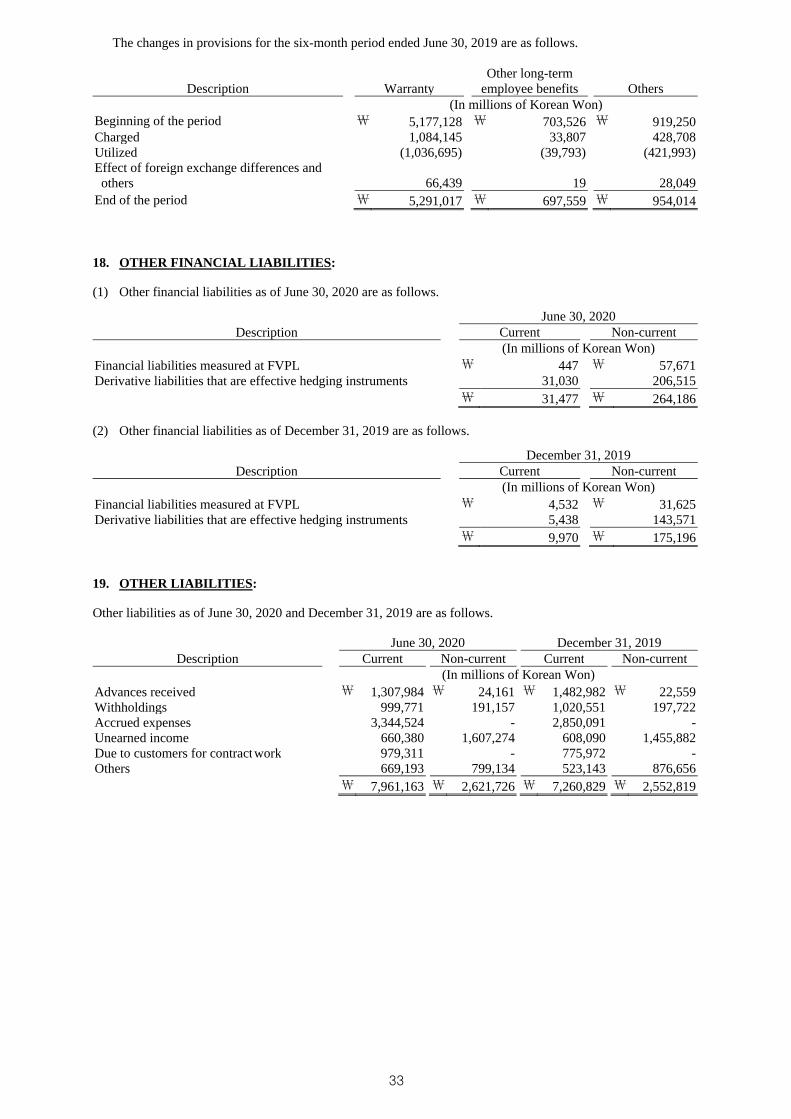
The changes in provisions for the six-month period ended June 30, 2019 are as follows.
Description Warranty Other long-term
employee benefits Others (In millions of Korean Won)
Beginning of the period ₩ 5,177,128 ₩ 703,526 ₩ 919,250 Charged 1,084,145 33,807 428,708Utilized (1,036,695) (39,793) (421,993)Effect of foreign exchange differences and others 66,439 19 28,049
End of the period ₩ 5,291,017 ₩ 697,559 ₩ 954,014
18. OTHER FINANCIAL LIABILITIES:
(1) Other financial liabilities as of June 30, 2020 are as follows.
June 30, 2020 Description Current Non-current
(In millions of Korean Won) Financial liabilities measured at FVPL ₩ 447 ₩ 57,671 Derivative liabilities that are effective hedging instruments 31,030 206,515
₩ 31,477 ₩ 264,186
(2) Other financial liabilities as of December 31, 2019 are as follows.
December 31, 2019 Description Current Non-current
(In millions of Korean Won) Financial liabilities measured at FVPL ₩ 4,532 ₩ 31,625 Derivative liabilities that are effective hedging instruments 5,438 143,571
₩ 9,970 ₩ 175,196
19. OTHER LIABILITIES:
Other liabilities as of June 30, 2020 and December 31, 2019 are as follows.
June 30, 2020 December 31, 2019 Description Current Non-current Current Non-current
(In millions of Korean Won) Advances received ₩ 1,307,984 ₩ 24,161 ₩ 1,482,982 ₩ 22,559 Withholdings 999,771 191,157 1,020,551 197,722 Accrued expenses 3,344,524 - 2,850,091 - Unearned income 660,380 1,607,274 608,090 1,455,882 Due to customers for contract work 979,311 - 775,972 - Others 669,193 799,134 523,143 876,656 ₩ 7,961,163 ₩ 2,621,726 ₩ 7,260,829 ₩ 2,552,819
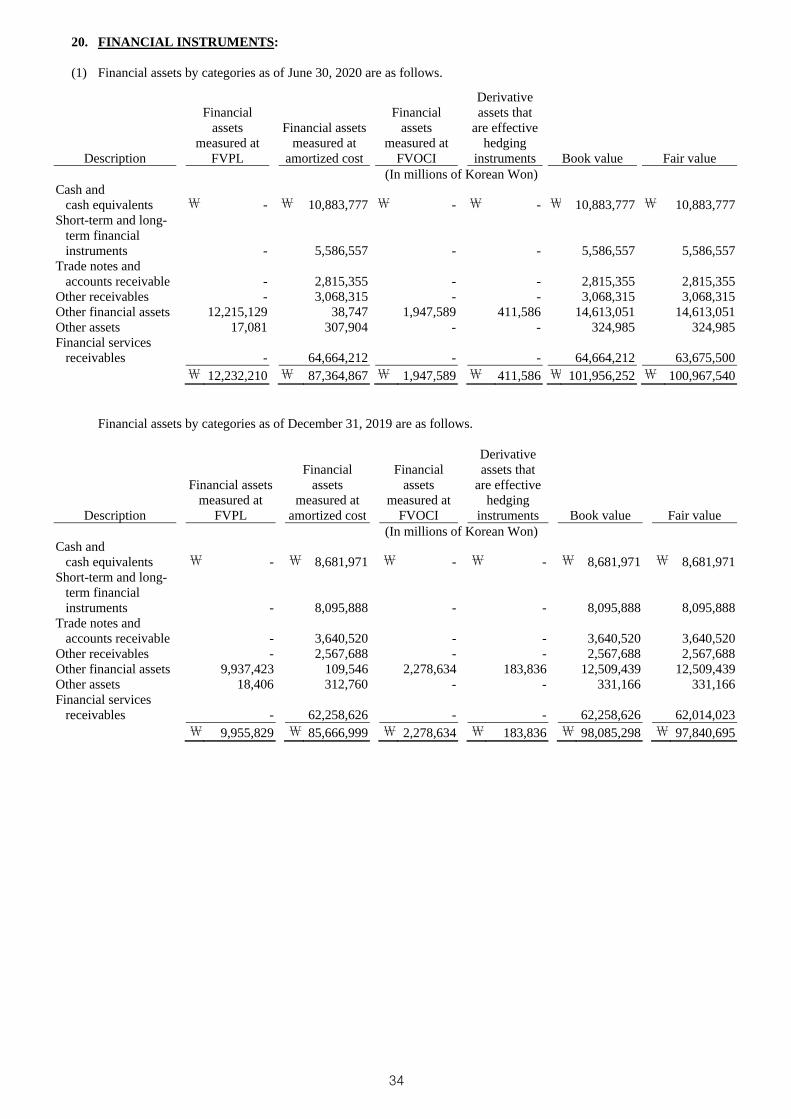
20. FINANCIAL INSTRUMENTS:
(1) Financial assets by categories as of June 30, 2020 are as follows.
Description
Financial assets
measured at FVPL
Financial assets measured at
amortized cost
Financial assets
measured at FVOCI
Derivative assets that
are effective hedging
instruments Book value Fair value (In millions of Korean Won)
Cash and cash equivalents ₩ - ₩ 10,883,777 ₩ - ₩ - ₩ 10,883,777 ₩ 10,883,777
Short-term and long- term financial instruments - 5,586,557 - - 5,586,557 5,586,557
Trade notes and accounts receivable - 2,815,355 - - 2,815,355 2,815,355
Other receivables - 3,068,315 - - 3,068,315 3,068,315 Other financial assets 12,215,129 38,747 1,947,589 411,586 14,613,051 14,613,051 Other assets 17,081 307,904 - - 324,985 324,985 Financial services
receivables - 64,664,212 - - 64,664,212 63,675,500 ₩ 12,232,210 ₩ 87,364,867 ₩ 1,947,589 ₩ 411,586 ₩ 101,956,252 ₩ 100,967,540
Financial assets by categories as of December 31, 2019 are as follows.
Description
Financial assets measured at
FVPL
Financial assets
measured at amortized cost
Financial assets
measured at FVOCI
Derivative assets that
are effective hedging
instruments Book value Fair value (In millions of Korean Won)
Cash and cash equivalents ₩ - ₩ 8,681,971 ₩ - ₩ - ₩ 8,681,971 ₩ 8,681,971
Short-term and long- term financial instruments - 8,095,888 - - 8,095,888 8,095,888
Trade notes and accounts receivable - 3,640,520 - - 3,640,520 3,640,520
Other receivables - 2,567,688 - - 2,567,688 2,567,688 Other financial assets 9,937,423 109,546 2,278,634 183,836 12,509,439 12,509,439 Other assets 18,406 312,760 - - 331,166 331,166 Financial services
receivables - 62,258,626 - - 62,258,626 62,014,023 ₩ 9,955,829 ₩ 85,666,999 ₩ 2,278,634 ₩ 183,836 ₩ 98,085,298 ₩ 97,840,695
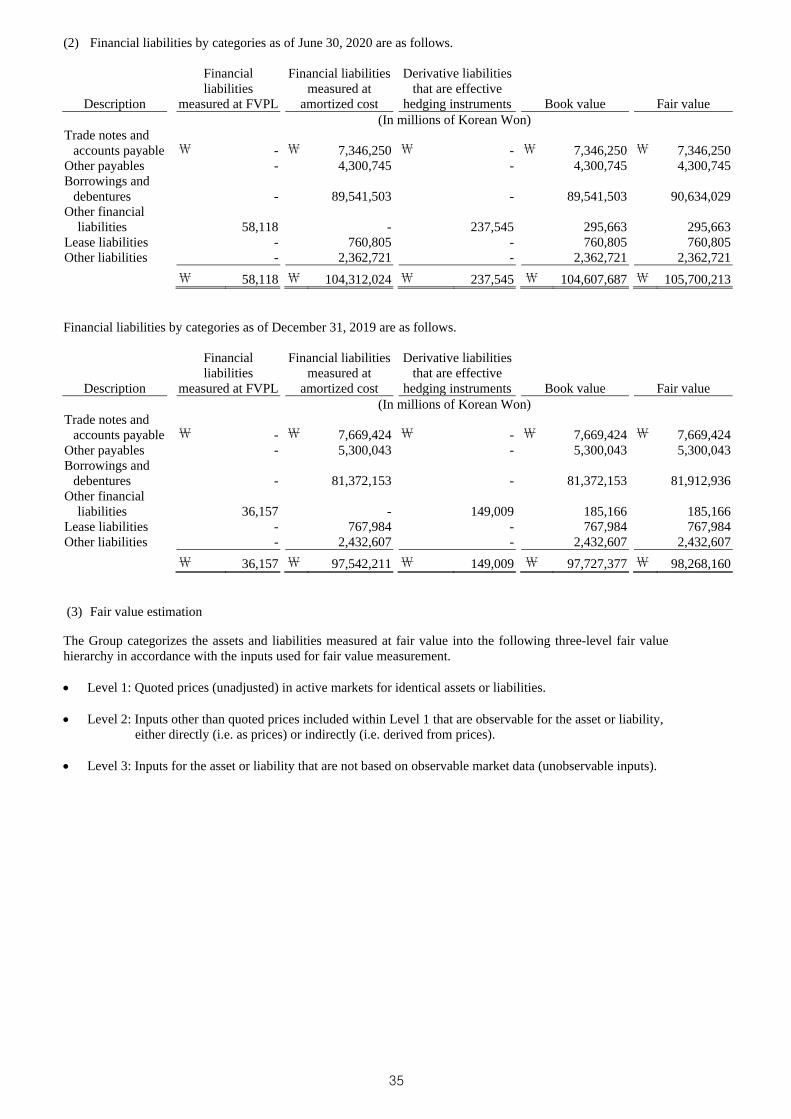
(2) Financial liabilities by categories as of June 30, 2020 are as follows.
Description
Financial liabilities
measured at FVPL
Financial liabilities measured at
amortized cost
Derivative liabilities that are effective
hedging instruments Book value Fair value (In millions of Korean Won)
Trade notes and accounts payable ₩ - ₩ 7,346,250 ₩ - ₩ 7,346,250 ₩ 7,346,250
Other payables - 4,300,745 - 4,300,745 4,300,745 Borrowings and
debentures
- 89,541,503 - 89,541,503 90,634,029 Other financial
liabilities 58,118 - 237,545 295,663 295,663 Lease liabilities - 760,805 - 760,805 760,805 Other liabilities - 2,362,721 - 2,362,721 2,362,721
₩ 58,118 ₩ 104,312,024 ₩ 237,545 ₩ 104,607,687 ₩ 105,700,213
Financial liabilities by categories as of December 31, 2019 are as follows.
Description
Financial liabilities
measured at FVPL
Financial liabilities measured at
amortized cost
Derivative liabilities that are effective
hedging instruments Book value Fair value (In millions of Korean Won)
Trade notes and accounts payable ₩ - ₩ 7,669,424 ₩ - ₩ 7,669,424 ₩ 7,669,424
Other payables - 5,300,043 - 5,300,043 5,300,043 Borrowings and
debentures
- 81,372,153 - 81,372,153 81,912,936 Other financial
liabilities 36,157 - 149,009 185,166 185,166 Lease liabilities - 767,984 - 767,984 767,984 Other liabilities - 2,432,607 - 2,432,607 2,432,607
₩ 36,157 ₩ 97,542,211 ₩ 149,009 ₩ 97,727,377 ₩ 98,268,160
(3) Fair value estimation
The Group categorizes the assets and liabilities measured at fair value into the following three-level fair value hierarchy in accordance with the inputs used for fair value measurement.
Level 1: Quoted prices (unadjusted) in active markets for identical assets or liabilities.
Level 2: Inputs other than quoted prices included within Level 1 that are observable for the asset or liability,either directly (i.e. as prices) or indirectly (i.e. derived from prices).
Level 3: Inputs for the asset or liability that are not based on observable market data (unobservable inputs).
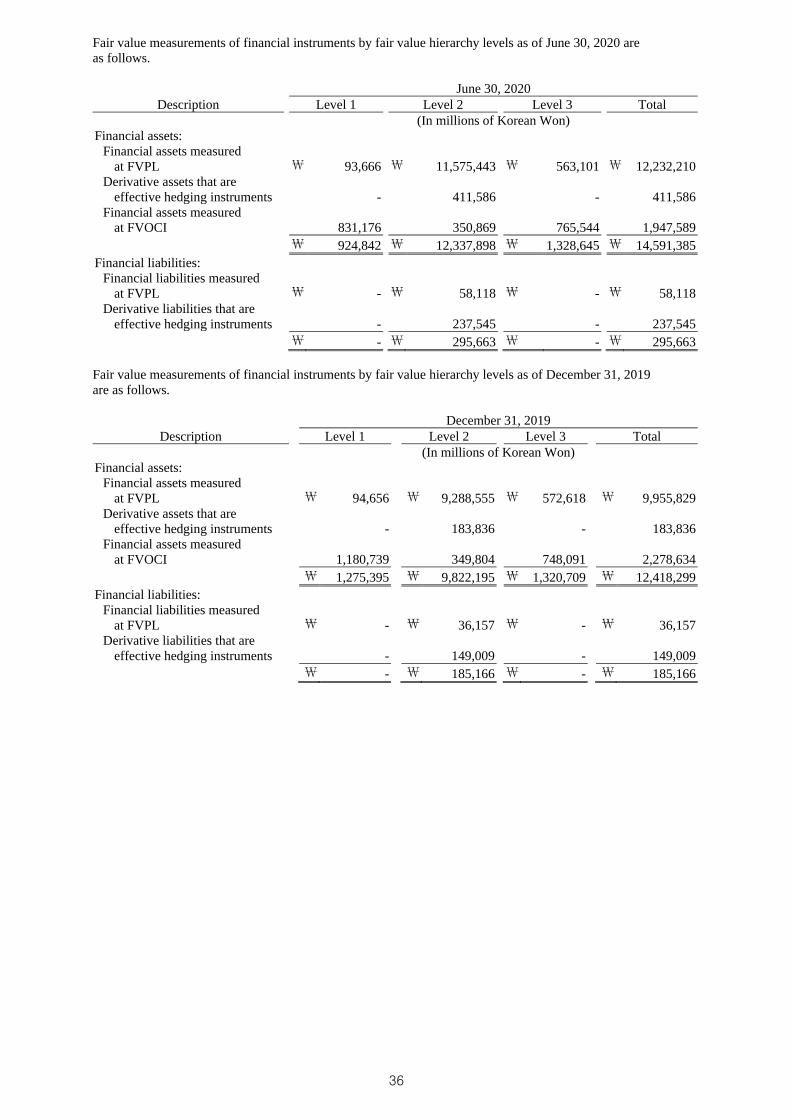
Fair value measurements of financial instruments by fair value hierarchy levels as of June 30, 2020 are as follows.
June 30, 2020 Description Level 1 Level 2 Level 3 Total
(In millions of Korean Won) Financial assets:
Financial assets measured at FVPL ₩ 93,666 ₩ 11,575,443 ₩ 563,101 ₩ 12,232,210
Derivative assets that are effective hedging instruments - 411,586 - 411,586
Financial assets measured at FVOCI 831,176 350,869 765,544 1,947,589
₩ 924,842 ₩ 12,337,898 ₩ 1,328,645 ₩ 14,591,385 Financial liabilities:
Financial liabilities measured at FVPL ₩ - ₩ 58,118 ₩ - ₩ 58,118
Derivative liabilities that are effective hedging instruments - 237,545 - 237,545
₩ - ₩ 295,663 ₩ - ₩ 295,663
Fair value measurements of financial instruments by fair value hierarchy levels as of December 31, 2019 are as follows.
December 31, 2019Description Level 1 Level 2 Level 3 Total
(In millions of Korean Won) Financial assets:
Financial assets measured at FVPL ₩ 94,656 ₩ 9,288,555 ₩ 572,618 ₩ 9,955,829
Derivative assets that are effective hedging instruments - 183,836 - 183,836
Financial assets measured at FVOCI 1,180,739 349,804 748,091 2,278,634
₩ 1,275,395 ₩ 9,822,195 ₩ 1,320,709 ₩ 12,418,299 Financial liabilities:
Financial liabilities measured at FVPL ₩ - ₩ 36,157 ₩ - ₩ 36,157
Derivative liabilities that are effective hedging instruments - 149,009 - 149,009
₩ - ₩ 185,166 ₩ - ₩ 185,166
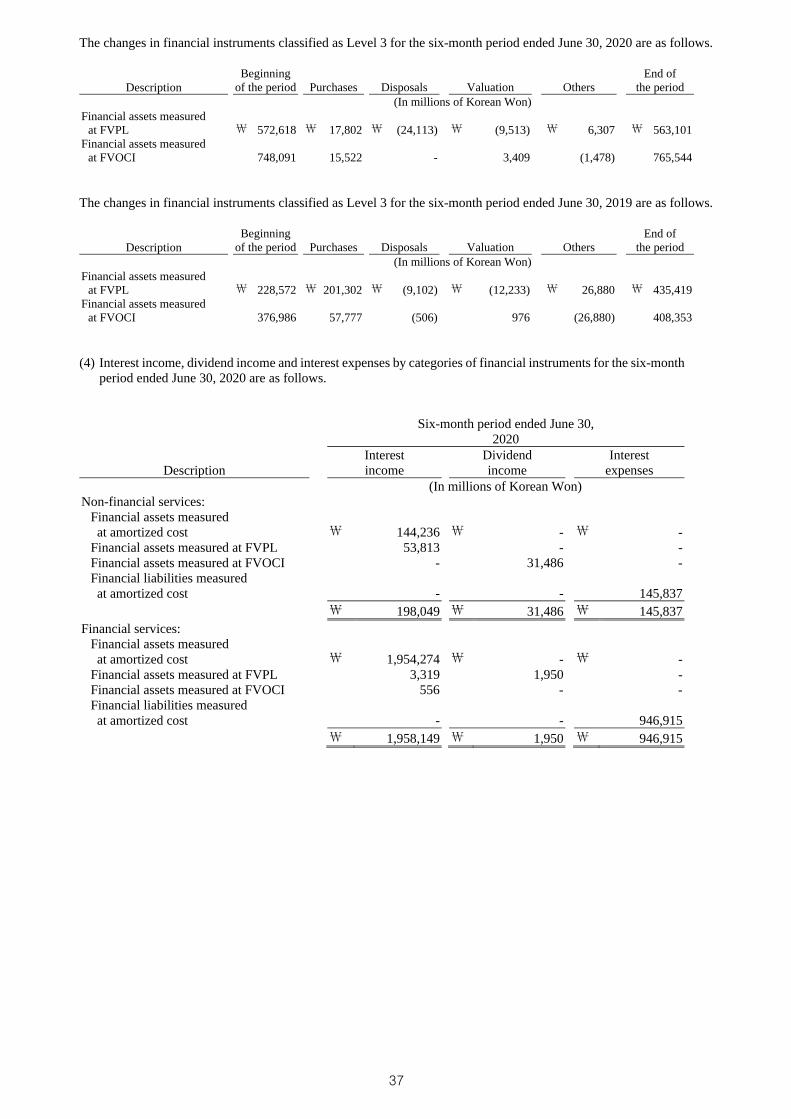
The changes in financial instruments classified as Level 3 for the six-month period ended June 30, 2020 are as follows.
Description
Beginning of the period
Purchases Disposals Valuation Others
End of the period
(In millions of Korean Won) Financial assets measured
at FVPL ₩ 572,618 ₩ 17,802 ₩ (24,113) ₩ (9,513) ₩ 6,307 ₩ 563,101 Financial assets measured
at FVOCI 748,091 15,522 - 3,409 (1,478) 765,544
The changes in financial instruments classified as Level 3 for the six-month period ended June 30, 2019 are as follows.
Description
Beginning of the period
Purchases Disposals Valuation Others
End of the period
(In millions of Korean Won) Financial assets measured
at FVPL ₩ 228,572 ₩ 201,302 ₩ (9,102) ₩ (12,233) ₩ 26,880 ₩ 435,419 Financial assets measured
at FVOCI 376,986 57,777 (506) 976 (26,880) 408,353
(4) Interest income, dividend income and interest expenses by categories of financial instruments for the six-monthperiod ended June 30, 2020 are as follows.
Six-month period ended June 30, 2020
DescriptionInterest income
Dividend income
Interest expenses
(In millions of Korean Won) Non-financial services:
Financial assets measured at amortized cost ₩ 144,236 ₩ - ₩ -
Financial assets measured at FVPL 53,813 - - Financial assets measured at FVOCI - 31,486 - Financial liabilities measured at amortized cost - - 145,837
₩ 198,049 ₩ 31,486 ₩ 145,837 Financial services:
Financial assets measured at amortized cost ₩ 1,954,274 ₩ - ₩ -
Financial assets measured at FVPL 3,319 1,950 - Financial assets measured at FVOCI 556 - - Financial liabilities measured at amortized cost - - 946,915
₩ 1,958,149 ₩ 1,950 ₩ 946,915
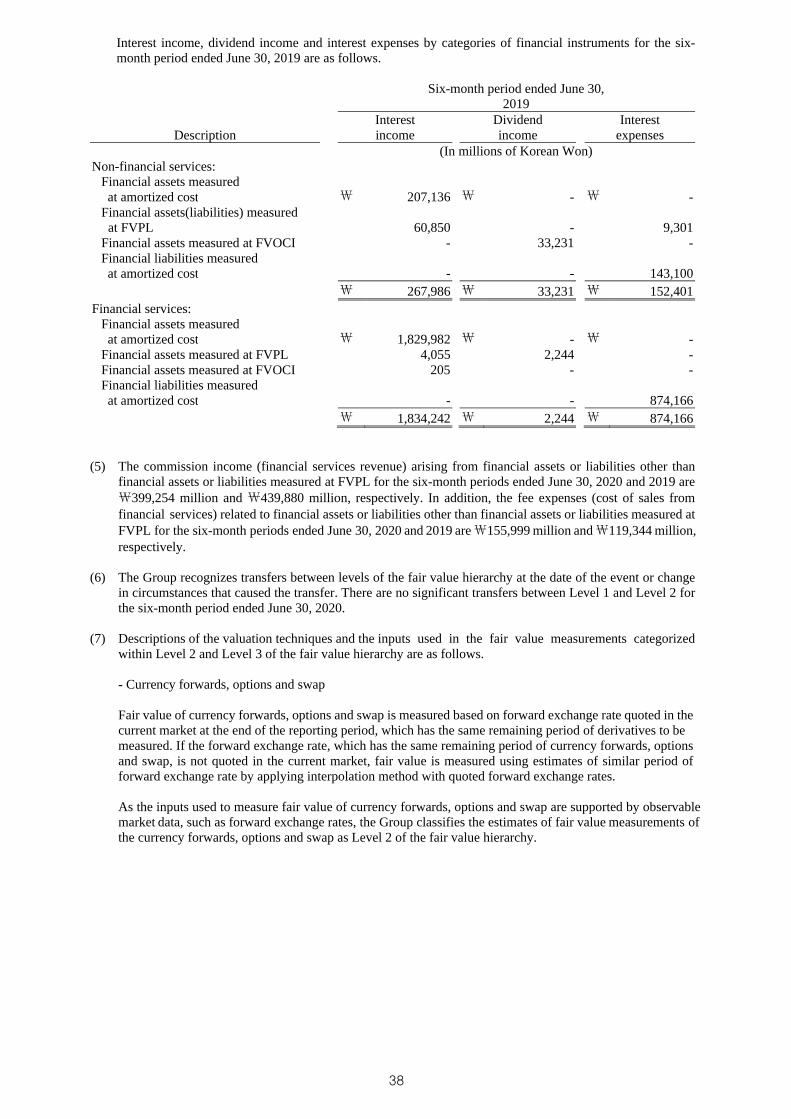
Interest income, dividend income and interest expenses by categories of financial instruments for the six-month period ended June 30, 2019 are as follows.
Six-month period ended June 30, 2019
DescriptionInterest income
Dividend income
Interest expenses
(In millions of Korean Won) Non-financial services:
Financial assets measured at amortized cost ₩ 207,136 ₩ - ₩ -
Financial assets(liabilities) measured at FVPL 60,850 - 9,301
Financial assets measured at FVOCI - 33,231 - Financial liabilities measured at amortized cost - - 143,100
₩ 267,986 ₩ 33,231 ₩ 152,401 Financial services:
Financial assets measured at amortized cost ₩ 1,829,982 ₩ - ₩ -
Financial assets measured at FVPL 4,055 2,244 - Financial assets measured at FVOCI 205 - - Financial liabilities measured at amortized cost - - 874,166
₩ 1,834,242 ₩ 2,244 ₩ 874,166
(5) The commission income (financial services revenue) arising from financial assets or liabilities other thanfinancial assets or liabilities measured at FVPL for the six-month periods ended June 30, 2020 and 2019 are₩399,254 million and ₩439,880 million, respectively. In addition, the fee expenses (cost of sales fromfinancial services) related to financial assets or liabilities other than financial assets or liabilities measured atFVPL for the six-month periods ended June 30, 2020 and 2019 are ₩155,999 million and ₩119,344 million, respectively.
(6) The Group recognizes transfers between levels of the fair value hierarchy at the date of the event or changein circumstances that caused the transfer. There are no significant transfers between Level 1 and Level 2 forthe six-month period ended June 30, 2020.
(7) Descriptions of the valuation techniques and the inputs used in the fair value measurements categorizedwithin Level 2 and Level 3 of the fair value hierarchy are as follows.
- Currency forwards, options and swap
Fair value of currency forwards, options and swap is measured based on forward exchange rate quoted in the current market at the end of the reporting period, which has the same remaining period of derivatives to be measured. If the forward exchange rate, which has the same remaining period of currency forwards, options and swap, is not quoted in the current market, fair value is measured using estimates of similar period of forward exchange rate by applying interpolation method with quoted forward exchange rates.
As the inputs used to measure fair value of currency forwards, options and swap are supported by observable market data, such as forward exchange rates, the Group classifies the estimates of fair value measurements of the currency forwards, options and swap as Level 2 of the fair value hierarchy.
- Interest rate swap
The discount rate and forward interest rate used to measure the fair value of interest rate swap are determined based on an applicable yield curve derived from interest quoted in the current market at the end of the reporting period. The fair value of interest rate swap was measured as a discount on the estimated future cash flows of interest rate swap based on forward interest rates derived from the above method at an appropriate discount rate.
As the inputs used to measure fair value of interest rate swap are supported by observable market data, such as yield curves, the Group classifies the estimates of fair value measurements of the interest rate swap as Level 2 of the fair value hierarchy.
- Debt instruments including corporate bonds
Fair value of debt instruments including corporate bonds is measured applying discounted cash flow method. The rate used to discount cash flows is determined based on swap rate and credit spreads of debt instruments, which have the similar credit rating and period quoted in the current market with those of debt instruments including corporate bonds that should be measured. The Group classifies fair value measurements of debt instruments including corporate bonds as Level 2 of the fair-value hierarchy since the rate, which has significant effects on fair value of debt instruments including corporate bonds, is based on
observable market data.
- Unlisted equity securities
Fair value of unlisted equity securities is measured using discounted cash flow projection and others, and certain assumptions not based on observable market prices or rate, such as sales growth rate, pre-tax operating income ratio and discount rate based on business plan and circumstance of industry are used to estimate the future cash flow. The discount rate used to discount the future cash flows, is calculated by applying the Capital Asset Pricing Model (CAPM), using the data of similar listed companies. The Group determines that the effect of estimation and assumptions referred above affecting fair value of unlisted equity securities is significant and classifies fair value measurements of unlisted securities as Level 3 of the fair value hierarchy.
- Total return swap (Derivatives)
The fair value of total revenue swaps (derivatives) is measured based on the stock price volatility up to the fair value, exercise price, maturity and maturity of the underlying asset, using the binomial option pricing model. The discount rate used in the binomial option pricing model is based on the risk-free interest rate, which corresponds to the remaining maturity, and the stock price volatility up to maturity uses the historical volatility of the financial sector over the past one year. The fair value of the underlying assets is measured using the cash flow discount model. In order to estimate the future cash flows, assumptions reflecting the business plan and current industry such as sales growth rate, pre-tax operating profit margin or discount rates etc. and estimates such as observable market price or rates are partially used. The discount rate used to discount future cash flows was calculated by applying the Capital Asset Pricing Model (CAPM), using data from similar listed companies. The Group classifies the fair value measurement of total revenue swap (derivatives) as Level 3 in the fair value hierarchy based on the assumption that the effect of the above assumptions and estimates on the fair value of the total revenue swap classified.
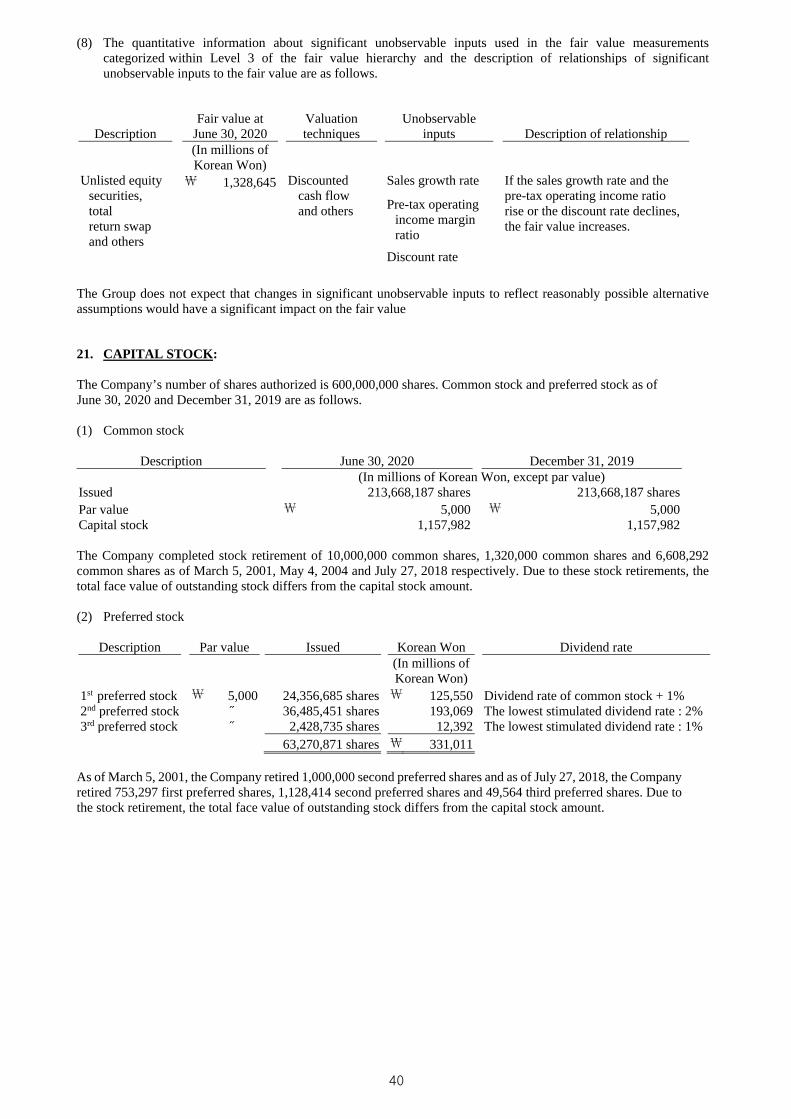
(8) The quantitative information about significant unobservable inputs used in the fair value measurementscategorized within Level 3 of the fair value hierarchy and the description of relationships of significantunobservable inputs to the fair value are as follows.
Description Fair value at
June 30, 2020 Valuation techniques
Unobservable inputs Description of relationship
(In millions of Korean Won)
Unlisted equity securities, total return swap and others
₩ 1,328,645 Discounted cash flow and others
Sales growth rate If the sales growth rate and the pre-tax operating income ratio rise or the discount rate declines, the fair value increases.
Pre-tax operating income margin ratio
Discount rate
The Group does not expect that changes in significant unobservable inputs to reflect reasonably possible alternative assumptions would have a significant impact on the fair value
21. CAPITAL STOCK:
The Company’s number of shares authorized is 600,000,000 shares. Common stock and preferred stock as of June 30, 2020 and December 31, 2019 are as follows.
(1) Common stock
Description June 30, 2020 December 31, 2019(In millions of Korean Won, except par value)
Issued 213,668,187 shares 213,668,187 shares Par value ₩ 5,000 ₩ 5,000 Capital stock 1,157,982 1,157,982
The Company completed stock retirement of 10,000,000 common shares, 1,320,000 common shares and 6,608,292 common shares as of March 5, 2001, May 4, 2004 and July 27, 2018 respectively. Due to these stock retirements, the total face value of outstanding stock differs from the capital stock amount.
(2) Preferred stock
Description Par value Issued Korean Won Dividend rate (In millions of
Korean Won) 1st preferred stock ₩ 5,000 24,356,685 shares ₩ 125,550 Dividend rate of common stock + 1% 2nd preferred stock ˝ 36,485,451 shares 193,069 The lowest stimulated dividend rate : 2% 3rd preferred stock ˝ 2,428,735 shares 12,392 The lowest stimulated dividend rate : 1%
63,270,871 shares ₩ 331,011
As of March 5, 2001, the Company retired 1,000,000 second preferred shares and as of July 27, 2018, the Company retired 753,297 first preferred shares, 1,128,414 second preferred shares and 49,564 third preferred shares. Due to the stock retirement, the total face value of outstanding stock differs from the capital stock amount.
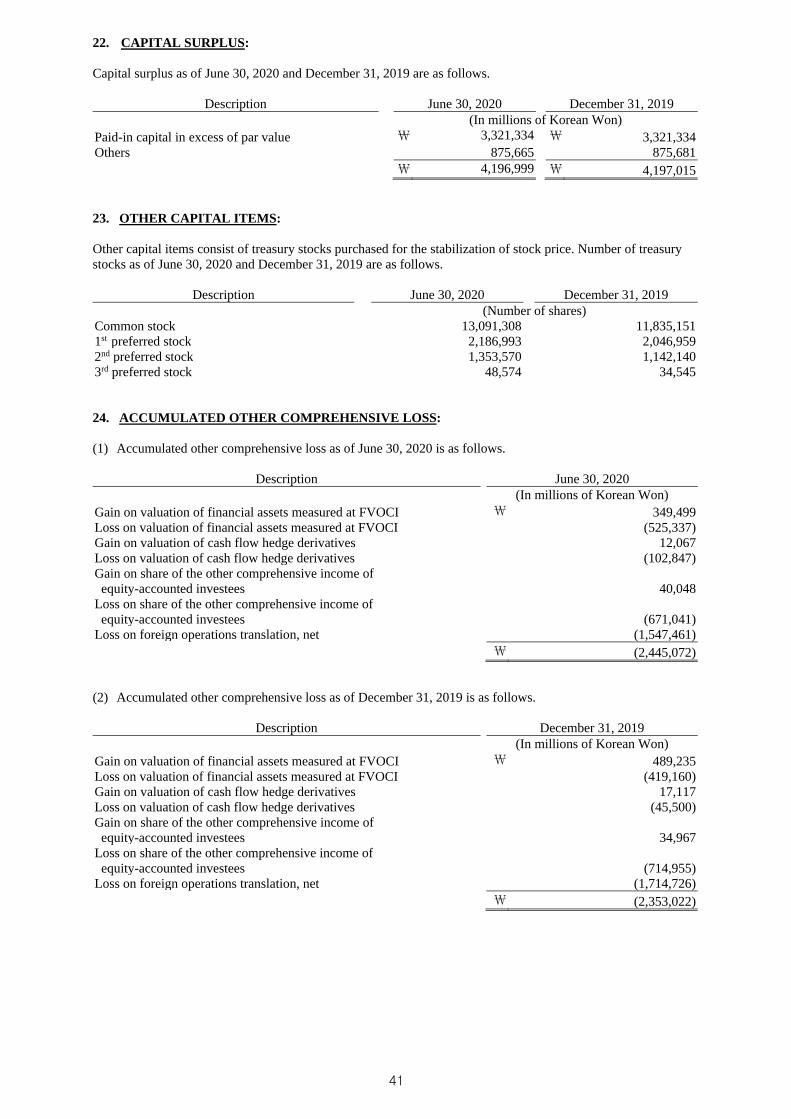
22. CAPITAL SURPLUS:
Capital surplus as of June 30, 2020 and December 31, 2019 are as follows.
Description June 30, 2020 December 31, 2019 (In millions of Korean Won)
Paid-in capital in excess of par value ₩ 3,321,334 ₩ 3,321,334 Others 875,665 875,681
₩ 4,196,999 ₩ 4,197,015
23. OTHER CAPITAL ITEMS:
Other capital items consist of treasury stocks purchased for the stabilization of stock price. Number of treasury stocks as of June 30, 2020 and December 31, 2019 are as follows.
Description June 30, 2020 December 31, 2019 (Number of shares)
Common stock 13,091,308 11,835,1511st preferred stock 2,186,993 2,046,9592nd preferred stock 1,353,570 1,142,1403rd preferred stock 48,574 34,545
24. ACCUMULATED OTHER COMPREHENSIVE LOSS:
(1) Accumulated other comprehensive loss as of June 30, 2020 is as follows.
Description June 30, 2020 (In millions of Korean Won)
Gain on valuation of financial assets measured at FVOCI ₩ 349,499 Loss on valuation of financial assets measured at FVOCI (525,337) Gain on valuation of cash flow hedge derivatives 12,067 Loss on valuation of cash flow hedge derivatives (102,847) Gain on share of the other comprehensive income of equity-accounted investees 40,048
Loss on share of the other comprehensive income of equity-accounted investees (671,041)
Loss on foreign operations translation, net (1,547,461)₩ (2,445,072)
(2) Accumulated other comprehensive loss as of December 31, 2019 is as follows.
Description December 31, 2019(In millions of Korean Won)
Gain on valuation of financial assets measured at FVOCI ₩ 489,235 Loss on valuation of financial assets measured at FVOCI (419,160) Gain on valuation of cash flow hedge derivatives 17,117 Loss on valuation of cash flow hedge derivatives (45,500) Gain on share of the other comprehensive income of equity-accounted investees 34,967
Loss on share of the other comprehensive income of equity-accounted investees (714,955)
Loss on foreign operations translation, net (1,714,726)₩ (2,353,022)
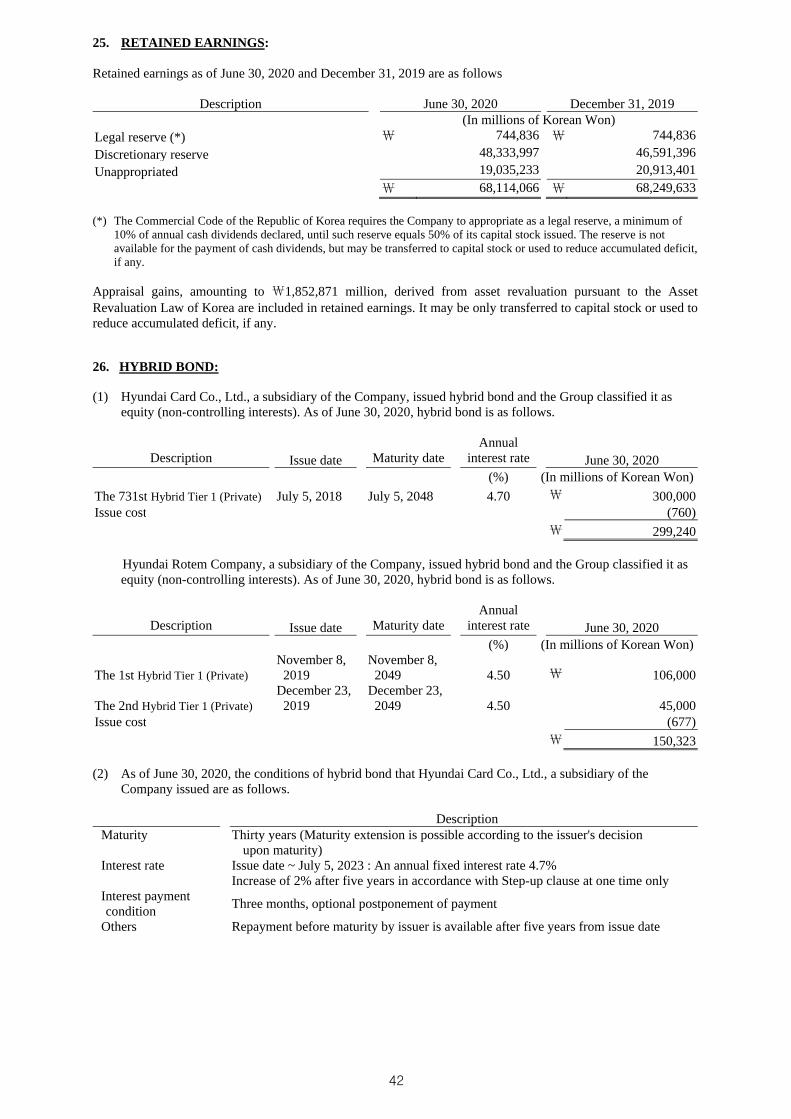
25. RETAINED EARNINGS:
Retained earnings as of June 30, 2020 and December 31, 2019 are as follows
Description June 30, 2020 December 31, 2019 (In millions of Korean Won)
Legal reserve (*) ₩ 744,836 ₩ 744,836
Discretionary reserve 48,333,997 46,591,396
Unappropriated 19,035,233 20,913,401
₩ 68,114,066 ₩ 68,249,633
(*) The Commercial Code of the Republic of Korea requires the Company to appropriate as a legal reserve, a minimum of 10% of annual cash dividends declared, until such reserve equals 50% of its capital stock issued. The reserve is not available for the payment of cash dividends, but may be transferred to capital stock or used to reduce accumulated deficit, if any.
Appraisal gains, amounting to ₩1,852,871 million, derived from asset revaluation pursuant to the Asset Revaluation Law of Korea are included in retained earnings. It may be only transferred to capital stock or used to reduce accumulated deficit, if any.
26. HYBRID BOND:
(1) Hyundai Card Co., Ltd., a subsidiary of the Company, issued hybrid bond and the Group classified it asequity (non-controlling interests). As of June 30, 2020, hybrid bond is as follows.
Description Issue date Maturity date Annual
interest rate June 30, 2020 (%) (In millions of Korean Won)
The 731st Hybrid Tier 1 (Private) July 5, 2018 July 5, 2048 4.70 ₩ 300,000 Issue cost (760)
₩ 299,240
Hyundai Rotem Company, a subsidiary of the Company, issued hybrid bond and the Group classified it as equity (non-controlling interests). As of June 30, 2020, hybrid bond is as follows.
Description Issue date Maturity date Annual
interest rate June 30, 2020 (%) (In millions of Korean Won)
The 1st Hybrid Tier 1 (Private) November 8, 2019
November 8, 2049 4.50 ₩ 106,000
The 2nd Hybrid Tier 1 (Private) December 23, 2019
December 23, 2049 4.50 45,000
Issue cost (677) ₩ 150,323
(2) As of June 30, 2020, the conditions of hybrid bond that Hyundai Card Co., Ltd., a subsidiary of theCompany issued are as follows.
DescriptionMaturity
Thirty years (Maturity extension is possible according to the issuer's decision
upon maturity) Interest rate
Issue date ~ July 5, 2023 : An annual fixed interest rate 4.7% Increase of 2% after five years in accordance with Step-up clause at one time only
Interest payment condition
Three months, optional postponement of payment
Others Repayment before maturity by issuer is available after five years from issue date
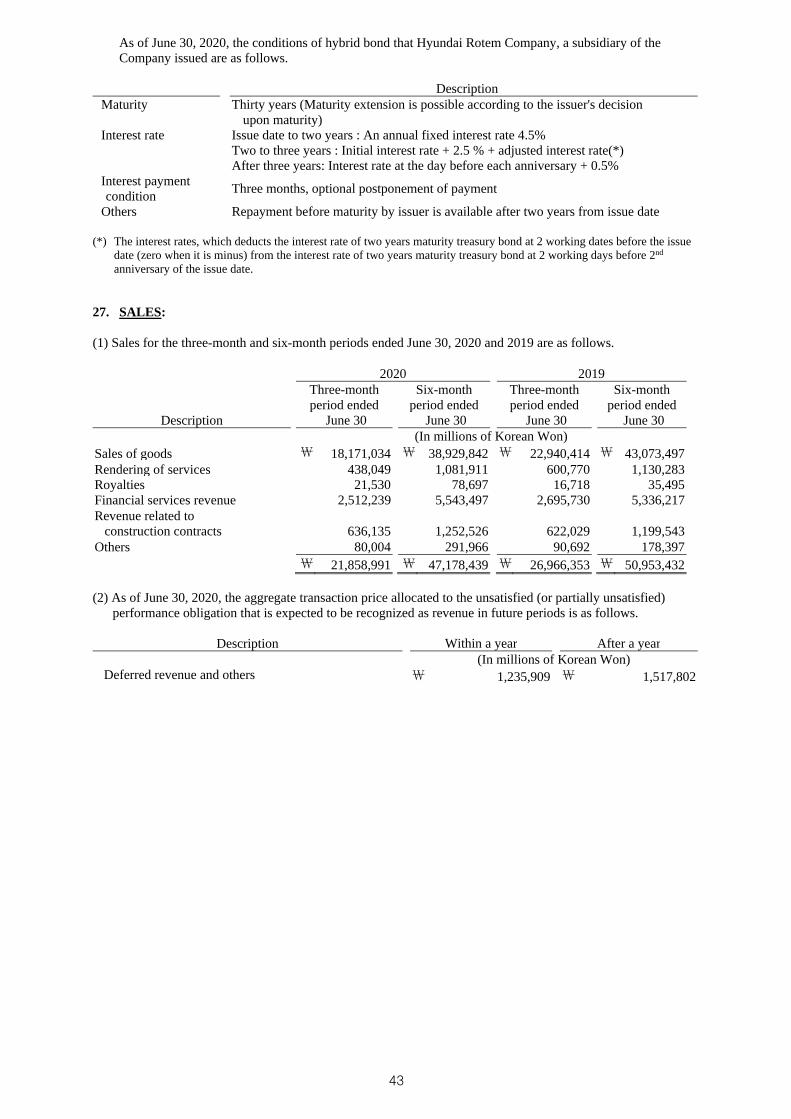
As of June 30, 2020, the conditions of hybrid bond that Hyundai Rotem Company, a subsidiary of the Company issued are as follows.
DescriptionMaturity
Thirty years (Maturity extension is possible according to the issuer's decision
upon maturity) Interest rate
Issue date to two years : An annual fixed interest rate 4.5% Two to three years : Initial interest rate + 2.5 % + adjusted interest rate(*) After three years: Interest rate at the day before each anniversary + 0.5%
Interest payment condition
Three months, optional postponement of payment
Others Repayment before maturity by issuer is available after two years from issue date
(*) The interest rates, which deducts the interest rate of two years maturity treasury bond at 2 working dates before the issue date (zero when it is minus) from the interest rate of two years maturity treasury bond at 2 working days before 2nd
anniversary of the issue date.
27. SALES:
(1) Sales for the three-month and six-month periods ended June 30, 2020 and 2019 are as follows.
2020 2019
Description
Three-month period ended
June 30
Six-month period ended
June 30
Three-month period ended
June 30
Six-month period ended
June 30 (In millions of Korean Won)
Sales of goods ₩ 18,171,034 ₩ 38,929,842 ₩ 22,940,414 ₩ 43,073,497 Rendering of services 438,049 1,081,911 600,770 1,130,283 Royalties 21,530 78,697 16,718 35,495Financial services revenue 2,512,239 5,543,497 2,695,730 5,336,217 Revenue related to
construction contracts 636,135 1,252,526 622,029 1,199,543 Others 80,004 291,966 90,692 178,397
₩ 21,858,991 ₩ 47,178,439 ₩ 26,966,353 ₩ 50,953,432
(2) As of June 30, 2020, the aggregate transaction price allocated to the unsatisfied (or partially unsatisfied)performance obligation that is expected to be recognized as revenue in future periods is as follows.
Description Within a year After a year (In millions of Korean Won)
Deferred revenue and others ₩ 1,235,909 ₩ 1,517,802
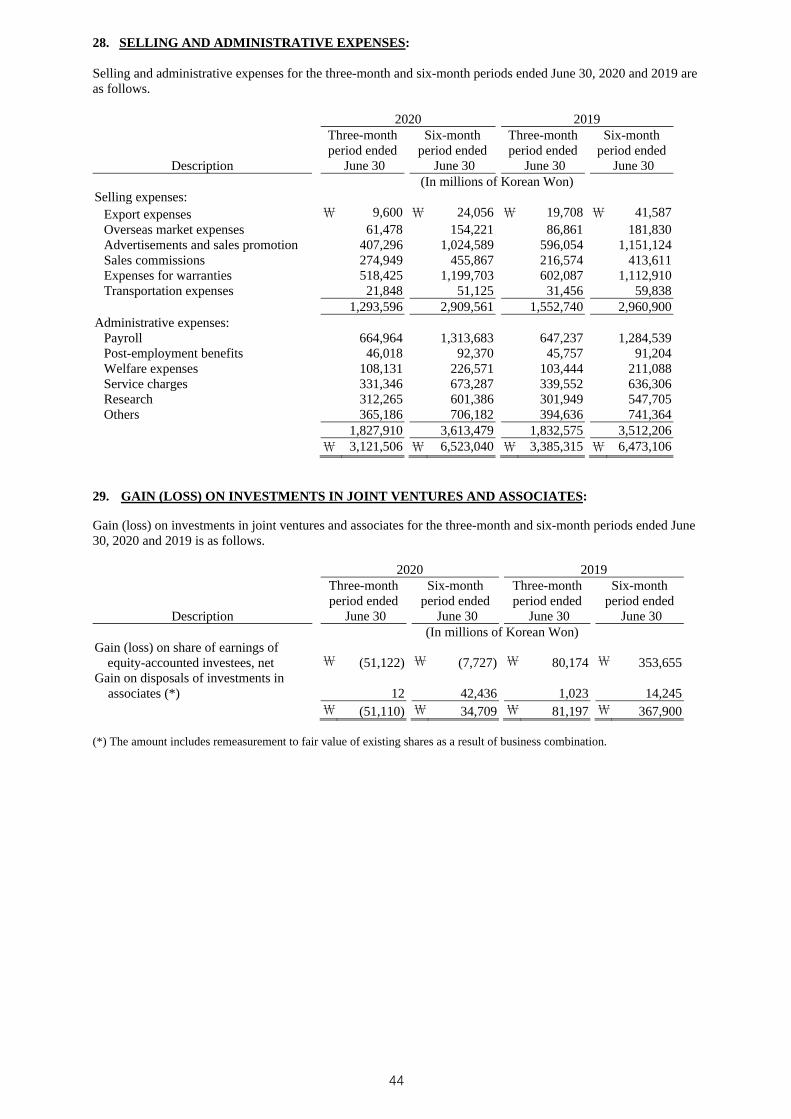
28. SELLING AND ADMINISTRATIVE EXPENSES:
Selling and administrative expenses for the three-month and six-month periods ended June 30, 2020 and 2019 are as follows.
2020 2019
Description
Three-month period ended
June 30
Six-month period ended
June 30
Three-month period ended
June 30
Six-month period ended
June 30 (In millions of Korean Won)
Selling expenses:Export expenses ₩ 9,600 ₩ 24,056 ₩ 19,708 ₩ 41,587 Overseas market expenses 61,478 154,221 86,861 181,830 Advertisements and sales promotion 407,296 1,024,589 596,054 1,151,124 Sales commissions 274,949 455,867 216,574 413,611 Expenses for warranties 518,425 1,199,703 602,087 1,112,910 Transportation expenses 21,848 51,125 31,456 59,838
1,293,596 2,909,561 1,552,740 2,960,900 Administrative expenses:
Payroll 664,964 1,313,683 647,237 1,284,539 Post-employment benefits 46,018 92,370 45,757 91,204 Welfare expenses 108,131 226,571 103,444 211,088 Service charges 331,346 673,287 339,552 636,306 Research 312,265 601,386 301,949 547,705 Others 365,186 706,182 394,636 741,364
1,827,910 3,613,479 1,832,575 3,512,206 ₩ 3,121,506 ₩ 6,523,040 ₩ 3,385,315 ₩ 6,473,106
29. GAIN (LOSS) ON INVESTMENTS IN JOINT VENTURES AND ASSOCIATES:
Gain (loss) on investments in joint ventures and associates for the three-month and six-month periods ended June 30, 2020 and 2019 is as follows.
2020 2019
Description
Three-month period ended
June 30
Six-month period ended
June 30
Three-month period ended
June 30
Six-month period ended
June 30 (In millions of Korean Won)
Gain (loss) on share of earnings of equity-accounted investees, net ₩ (51,122) ₩ (7,727) ₩ 80,174 ₩ 353,655
Gain on disposals of investments in associates (*) 12 42,436 1,023 14,245
₩ (51,110) ₩ 34,709 ₩ 81,197 ₩ 367,900
(*) The amount includes remeasurement to fair value of existing shares as a result of business combination.
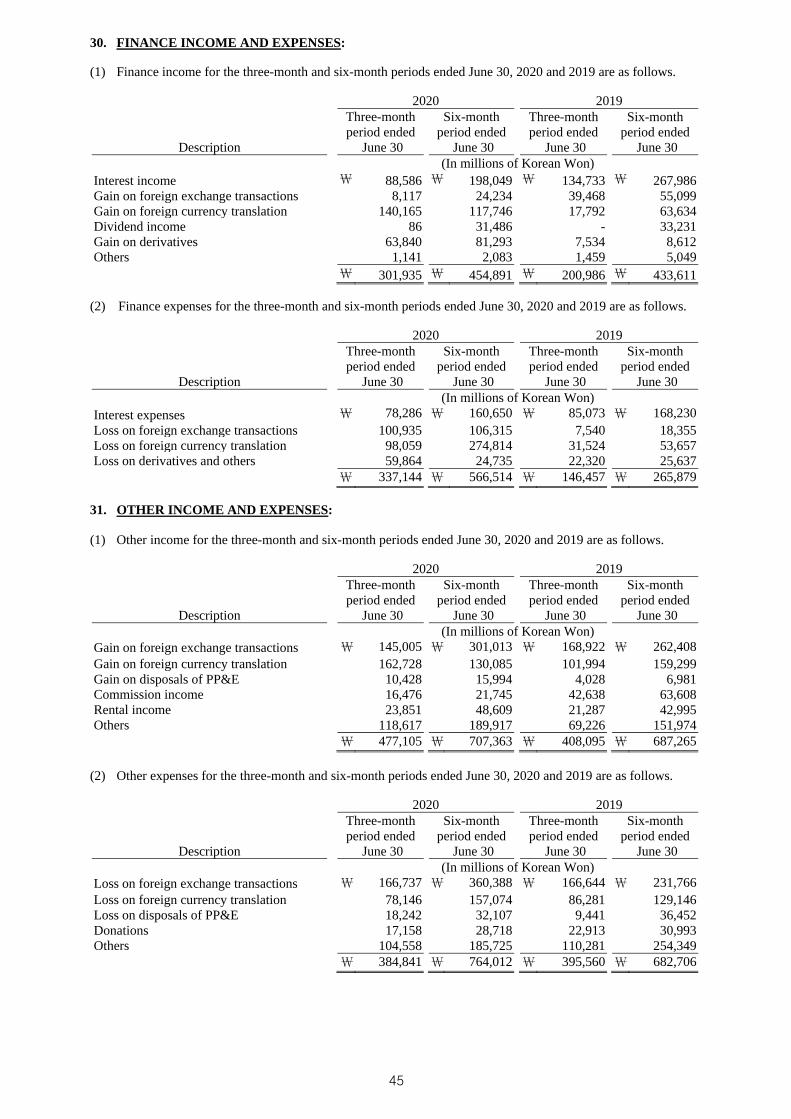
30. FINANCE INCOME AND EXPENSES:
(1) Finance income for the three-month and six-month periods ended June 30, 2020 and 2019 are as follows.
2020 2019
Description
Three-month period ended
June 30
Six-month period ended
June 30
Three-month period ended
June 30
Six-month period ended
June 30 (In millions of Korean Won)
Interest income ₩ 88,586 ₩ 198,049 ₩ 134,733 ₩ 267,986 Gain on foreign exchange transactions 8,117 24,234 39,468 55,099 Gain on foreign currency translation 140,165 117,746 17,792 63,634 Dividend income 86 31,486 - 33,231Gain on derivatives 63,840 81,293 7,534 8,612Others 1,141 2,083 1,459 5,049
₩ 301,935 ₩ 454,891 ₩ 200,986 ₩ 433,611
(2) Finance expenses for the three-month and six-month periods ended June 30, 2020 and 2019 are as follows.
2020 2019
Description
Three-month period ended
June 30
Six-month period ended
June 30
Three-month period ended
June 30
Six-month period ended
June 30 (In millions of Korean Won)
Interest expenses ₩ 78,286 ₩ 160,650 ₩ 85,073 ₩ 168,230 Loss on foreign exchange transactions 100,935 106,315 7,540 18,355 Loss on foreign currency translation 98,059 274,814 31,524 53,657 Loss on derivatives and others 59,864 24,735 22,320 25,637
₩ 337,144 ₩ 566,514 ₩ 146,457 ₩ 265,879
31. OTHER INCOME AND EXPENSES:
(1) Other income for the three-month and six-month periods ended June 30, 2020 and 2019 are as follows.
2020 2019
Description
Three-month period ended
June 30
Six-month period ended
June 30
Three-month period ended
June 30
Six-month period ended
June 30 (In millions of Korean Won)
Gain on foreign exchange transactions ₩ 145,005 ₩ 301,013 ₩ 168,922 ₩ 262,408 Gain on foreign currency translation 162,728 130,085 101,994 159,299 Gain on disposals of PP&E 10,428 15,994 4,028 6,981 Commission income 16,476 21,745 42,638 63,608 Rental income 23,851 48,609 21,287 42,995 Others 118,617 189,917 69,226 151,974
₩ 477,105 ₩ 707,363 ₩ 408,095 ₩ 687,265
(2) Other expenses for the three-month and six-month periods ended June 30, 2020 and 2019 are as follows.
2020 2019
Description
Three-month period ended
June 30
Six-month period ended
June 30
Three-month period ended
June 30
Six-month period ended
June 30 (In millions of Korean Won)
Loss on foreign exchange transactions ₩ 166,737 ₩ 360,388 ₩ 166,644 ₩ 231,766 Loss on foreign currency translation 78,146 157,074 86,281 129,146 Loss on disposals of PP&E 18,242 32,107 9,441 36,452 Donations 17,158 28,718 22,913 30,993 Others 104,558 185,725 110,281 254,349
₩ 384,841 ₩ 764,012 ₩ 395,560 ₩ 682,706
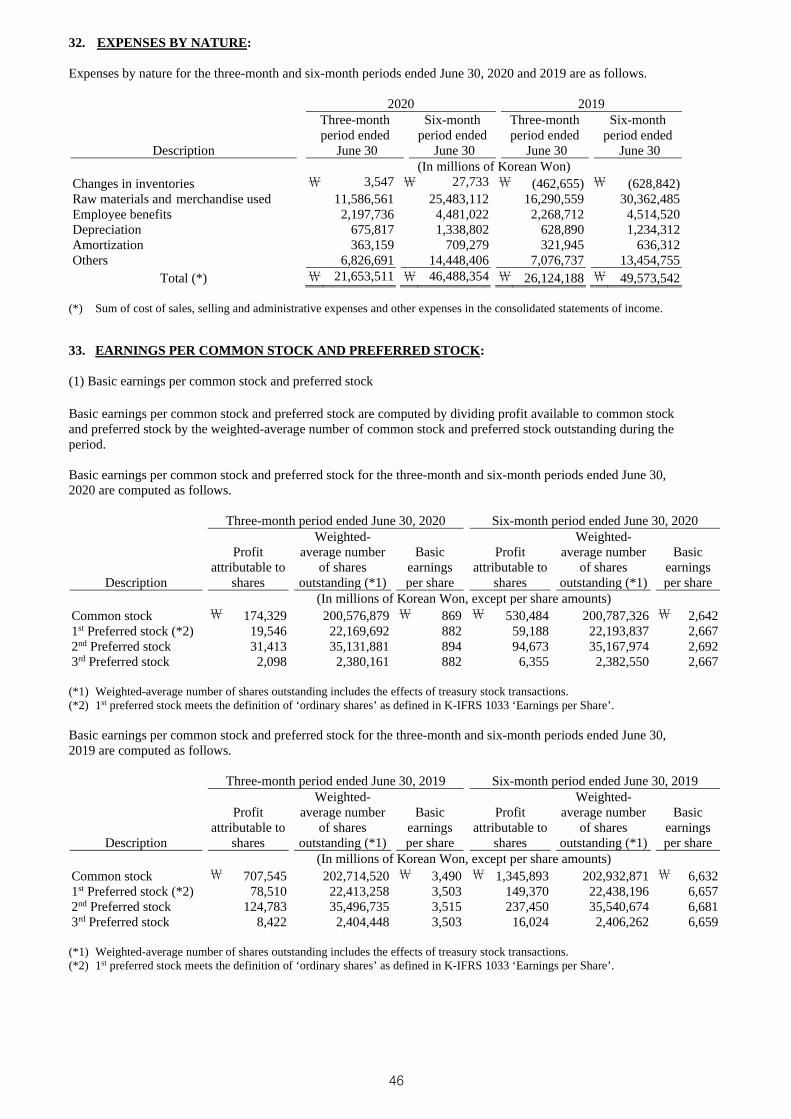
32. EXPENSES BY NATURE:
Expenses by nature for the three-month and six-month periods ended June 30, 2020 and 2019 are as follows.
2020 2019
Description
Three-month period ended
June 30
Six-month period ended
June 30
Three-month period ended
June 30
Six-month period ended
June 30 (In millions of Korean Won)
Changes in inventories ₩ 3,547 ₩ 27,733 ₩ (462,655) ₩ (628,842) Raw materials and merchandise used 11,586,561 25,483,112 16,290,559 30,362,485 Employee benefits 2,197,736 4,481,022 2,268,712 4,514,520 Depreciation 675,817 1,338,802 628,890 1,234,312 Amortization 363,159 709,279 321,945 636,312 Others 6,826,691 14,448,406 7,076,737 13,454,755
Total (*) ₩ 21,653,511 ₩ 46,488,354 ₩ 26,124,188 ₩ 49,573,542
(*) Sum of cost of sales, selling and administrative expenses and other expenses in the consolidated statements of income.
33. EARNINGS PER COMMON STOCK AND PREFERRED STOCK:
(1) Basic earnings per common stock and preferred stock
Basic earnings per common stock and preferred stock are computed by dividing profit available to common stock and preferred stock by the weighted-average number of common stock and preferred stock outstanding during the period.
Basic earnings per common stock and preferred stock for the three-month and six-month periods ended June 30, 2020 are computed as follows.
Three-month period ended June 30, 2020 Six-month period ended June 30, 2020
Description
Profit attributable to
shares
Weighted-average number
of shares outstanding (*1)
Basic earnings per share
Profit attributable to
shares
Weighted-average number
of shares outstanding (*1)
Basic earnings per share
(In millions of Korean Won, except per share amounts) Common stock ₩ 174,329 200,576,879 ₩ 869 ₩ 530,484 200,787,326 ₩ 2,642 1st Preferred stock (*2) 19,546 22,169,692 882 59,188 22,193,837 2,667 2nd Preferred stock 31,413 35,131,881 894 94,673 35,167,974 2,692 3rd Preferred stock 2,098 2,380,161 882 6,355 2,382,550 2,667
(*1) Weighted-average number of shares outstanding includes the effects of treasury stock transactions. (*2) 1st preferred stock meets the definition of ‘ordinary shares’ as defined in K-IFRS 1033 ‘Earnings per Share’.
Basic earnings per common stock and preferred stock for the three-month and six-month periods ended June 30, 2019 are computed as follows.
Three-month period ended June 30, 2019 Six-month period ended June 30, 2019
Description
Profit attributable to
shares
Weighted-average number
of shares outstanding (*1)
Basic earnings per share
Profit attributable to
shares
Weighted-average number
of shares outstanding (*1)
Basic earnings per share
(In millions of Korean Won, except per share amounts) Common stock ₩ 707,545 202,714,520 ₩ 3,490 ₩ 1,345,893 202,932,871 ₩ 6,632 1st Preferred stock (*2) 78,510 22,413,258 3,503 149,370 22,438,196 6,657 2nd Preferred stock 124,783 35,496,735 3,515 237,450 35,540,674 6,681 3rd Preferred stock 8,422 2,404,448 3,503 16,024 2,406,262 6,659
(*1) Weighted-average number of shares outstanding includes the effects of treasury stock transactions. (*2) 1st preferred stock meets the definition of ‘ordinary shares’ as defined in K-IFRS 1033 ‘Earnings per Share’.
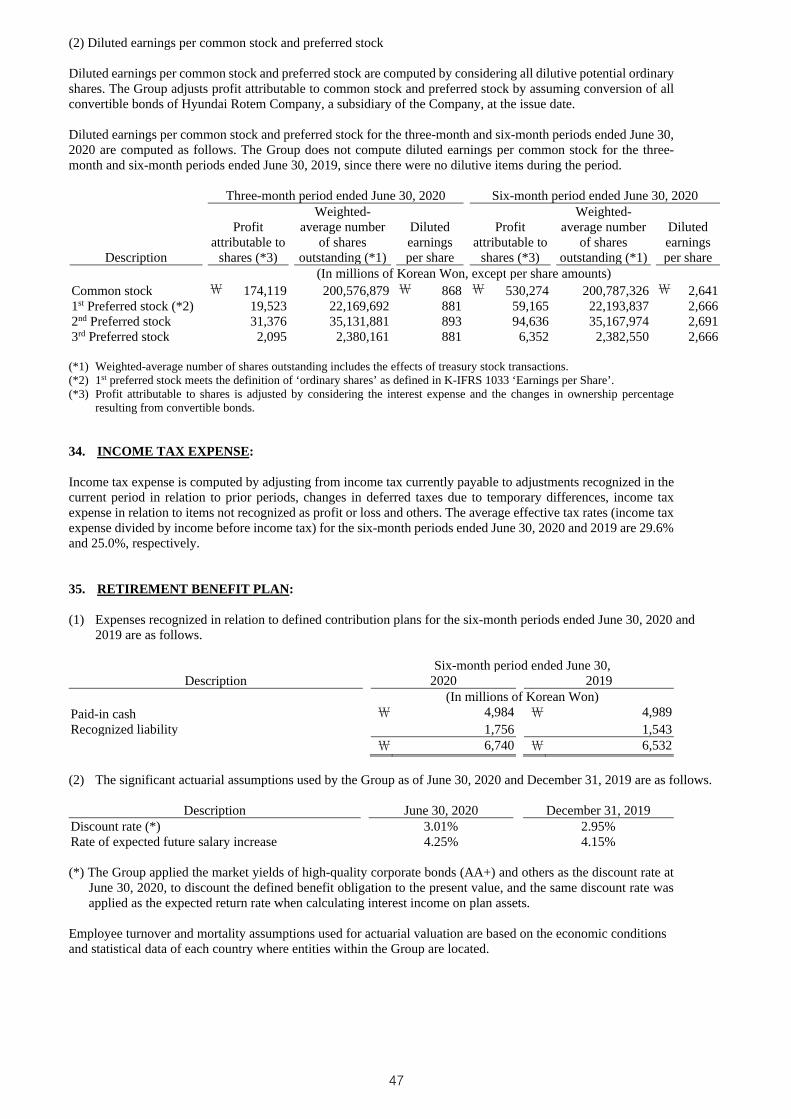
(2) Diluted earnings per common stock and preferred stock
Diluted earnings per common stock and preferred stock are computed by considering all dilutive potential ordinary shares. The Group adjusts profit attributable to common stock and preferred stock by assuming conversion of all convertible bonds of Hyundai Rotem Company, a subsidiary of the Company, at the issue date.
Diluted earnings per common stock and preferred stock for the three-month and six-month periods ended June 30, 2020 are computed as follows. The Group does not compute diluted earnings per common stock for the three-month and six-month periods ended June 30, 2019, since there were no dilutive items during the period.
Three-month period ended June 30, 2020 Six-month period ended June 30, 2020
Description
Profit attributable to
shares (*3)
Weighted-average number
of shares outstanding (*1)
Diluted earnings per share
Profit attributable to
shares (*3)
Weighted-average number
of shares outstanding (*1)
Diluted earnings per share
(In millions of Korean Won, except per share amounts) Common stock ₩ 174,119 200,576,879 ₩ 868 ₩ 530,274 200,787,326 ₩ 2,641 1st Preferred stock (*2) 19,523 22,169,692 881 59,165 22,193,837 2,666 2nd Preferred stock 31,376 35,131,881 893 94,636 35,167,974 2,691 3rd Preferred stock 2,095 2,380,161 881 6,352 2,382,550 2,666
(*1) Weighted-average number of shares outstanding includes the effects of treasury stock transactions. (*2) 1st preferred stock meets the definition of ‘ordinary shares’ as defined in K-IFRS 1033 ‘Earnings per Share’. (*3) Profit attributable to shares is adjusted by considering the interest expense and the changes in ownership percentage
resulting from convertible bonds.
34. INCOME TAX EXPENSE:
Income tax expense is computed by adjusting from income tax currently payable to adjustments recognized in the current period in relation to prior periods, changes in deferred taxes due to temporary differences, income tax expense in relation to items not recognized as profit or loss and others. The average effective tax rates (income tax expense divided by income before income tax) for the six-month periods ended June 30, 2020 and 2019 are 29.6% and 25.0%, respectively.
35. RETIREMENT BENEFIT PLAN:
(1) Expenses recognized in relation to defined contribution plans for the six-month periods ended June 30, 2020 and2019 are as follows.
Six-month period ended June 30, Description 2020 2019
(In millions of Korean Won) Paid-in cash ₩ 4,984 ₩ 4,989 Recognized liability 1,756 1,543
₩ 6,740 ₩ 6,532
(2) The significant actuarial assumptions used by the Group as of June 30, 2020 and December 31, 2019 are as follows.
Description June 30, 2020 December 31, 2019 Discount rate (*) 3.01% 2.95% Rate of expected future salary increase 4.25% 4.15%
(*) The Group applied the market yields of high-quality corporate bonds (AA+) and others as the discount rate at June 30, 2020, to discount the defined benefit obligation to the present value, and the same discount rate was applied as the expected return rate when calculating interest income on plan assets.
Employee turnover and mortality assumptions used for actuarial valuation are based on the economic conditions and statistical data of each country where entities within the Group are located.
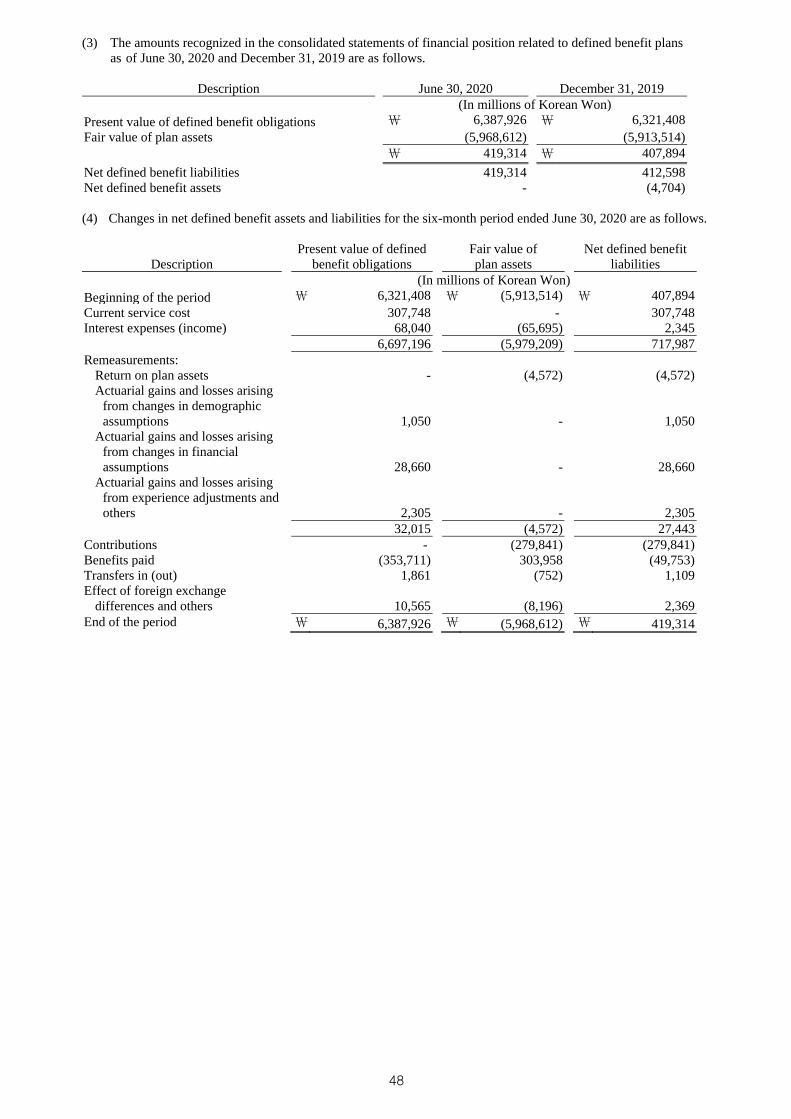
(3) The amounts recognized in the consolidated statements of financial position related to defined benefit plansas of June 30, 2020 and December 31, 2019 are as follows.
Description June 30, 2020 December 31, 2019 (In millions of Korean Won)
Present value of defined benefit obligations ₩ 6,387,926 ₩ 6,321,408 Fair value of plan assets (5,968,612) (5,913,514)
₩ 419,314 ₩ 407,894
Net defined benefit liabilities 419,314 412,598 Net defined benefit assets - (4,704)
(4) Changes in net defined benefit assets and liabilities for the six-month period ended June 30, 2020 are as follows.
Description Present value of defined
benefit obligations Fair value of plan assets
Net defined benefit liabilities
(In millions of Korean Won) Beginning of the period ₩ 6,321,408 ₩ (5,913,514) ₩ 407,894 Current service cost 307,748 - 307,748 Interest expenses (income) 68,040 (65,695) 2,345
6,697,196 (5,979,209) 717,987 Remeasurements:
Return on plan assets - (4,572) (4,572) Actuarial gains and losses arising
from changes in demographic assumptions 1,050 - 1,050
Actuarial gains and losses arising from changes in financial assumptions 28,660 - 28,660
Actuarial gains and losses arising from experience adjustments and others 2,305 - 2,305
32,015 (4,572) 27,443 Contributions - (279,841) (279,841) Benefits paid (353,711) 303,958 (49,753) Transfers in (out) 1,861 (752) 1,109 Effect of foreign exchange
differences and others 10,565 (8,196) 2,369 End of the period ₩ 6,387,926 ₩ (5,968,612) ₩ 419,314
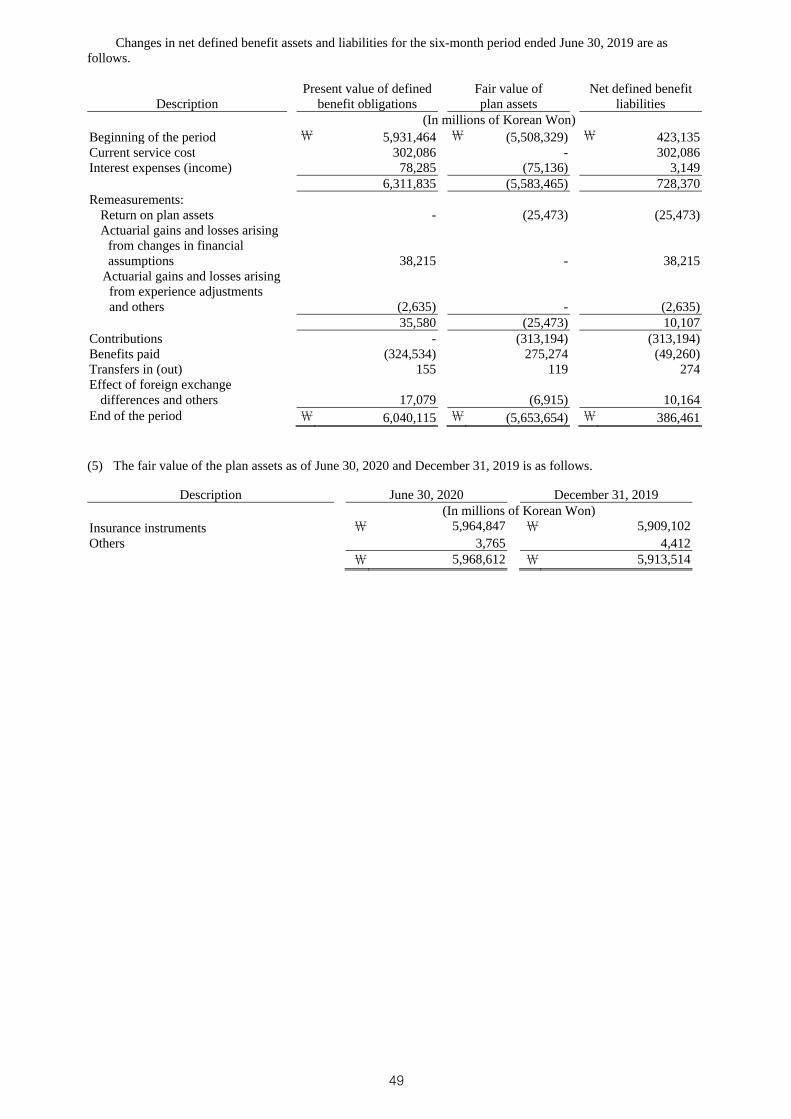
Changes in net defined benefit assets and liabilities for the six-month period ended June 30, 2019 are as follows.
Description Present value of defined
benefit obligations Fair value of plan assets
Net defined benefit liabilities
(In millions of Korean Won) Beginning of the period ₩ 5,931,464 ₩ (5,508,329) ₩ 423,135 Current service cost 302,086 - 302,086 Interest expenses (income) 78,285 (75,136) 3,149
6,311,835 (5,583,465) 728,370 Remeasurements:
Return on plan assets - (25,473) (25,473) Actuarial gains and losses arising
from changes in financial assumptions 38,215 - 38,215
Actuarial gains and losses arising from experience adjustments and others (2,635) - (2,635)
35,580 (25,473) 10,107 Contributions - (313,194) (313,194) Benefits paid (324,534) 275,274 (49,260) Transfers in (out) 155 119 274 Effect of foreign exchange
differences and others 17,079 (6,915) 10,164 End of the period ₩ 6,040,115 ₩ (5,653,654) ₩ 386,461
(5) The fair value of the plan assets as of June 30, 2020 and December 31, 2019 is as follows.
Description June 30, 2020 December 31, 2019 (In millions of Korean Won)
Insurance instruments ₩ 5,964,847 ₩ 5,909,102 Others 3,765 4,412
₩ 5,968,612 ₩ 5,913,514
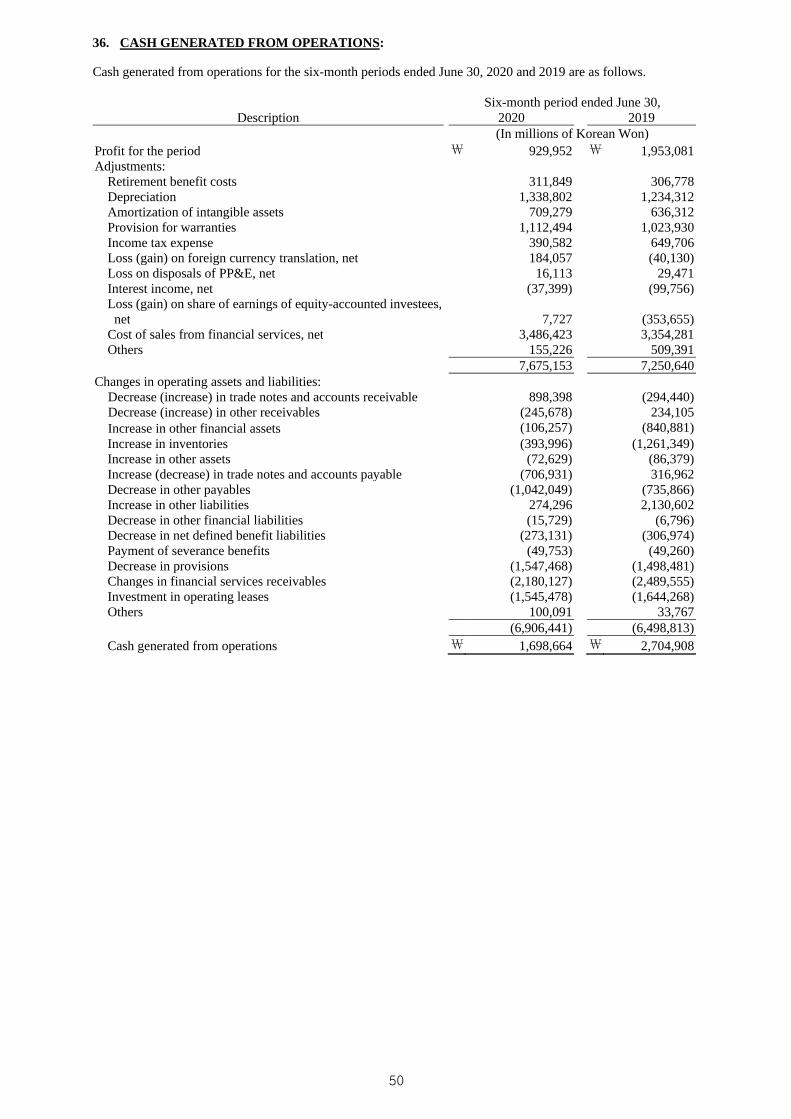
36. CASH GENERATED FROM OPERATIONS:
Cash generated from operations for the six-month periods ended June 30, 2020 and 2019 are as follows.
Six-month period ended June 30, Description 2020 2019
(In millions of Korean Won) Profit for the period ₩ 929,952 ₩ 1,953,081 Adjustments:
Retirement benefit costs 311,849 306,778 Depreciation 1,338,802 1,234,312 Amortization of intangible assets 709,279 636,312 Provision for warranties 1,112,494 1,023,930 Income tax expense 390,582 649,706 Loss (gain) on foreign currency translation, net 184,057 (40,130) Loss on disposals of PP&E, net 16,113 29,471 Interest income, net (37,399) (99,756) Loss (gain) on share of earnings of equity-accounted investees,
net 7,727 (353,655) Cost of sales from financial services, net 3,486,423 3,354,281 Others 155,226 509,391
7,675,153 7,250,640 Changes in operating assets and liabilities:
Decrease (increase) in trade notes and accounts receivable 898,398 (294,440) Decrease (increase) in other receivables (245,678) 234,105 Increase in other financial assets (106,257) (840,881) Increase in inventories (393,996) (1,261,349) Increase in other assets (72,629) (86,379) Increase (decrease) in trade notes and accounts payable (706,931) 316,962 Decrease in other payables (1,042,049) (735,866) Increase in other liabilities 274,296 2,130,602 Decrease in other financial liabilities (15,729) (6,796) Decrease in net defined benefit liabilities (273,131) (306,974) Payment of severance benefits (49,753) (49,260) Decrease in provisions (1,547,468) (1,498,481) Changes in financial services receivables (2,180,127) (2,489,555) Investment in operating leases (1,545,478) (1,644,268) Others 100,091 33,767
(6,906,441) (6,498,813) Cash generated from operations ₩ 1,698,664 ₩ 2,704,908
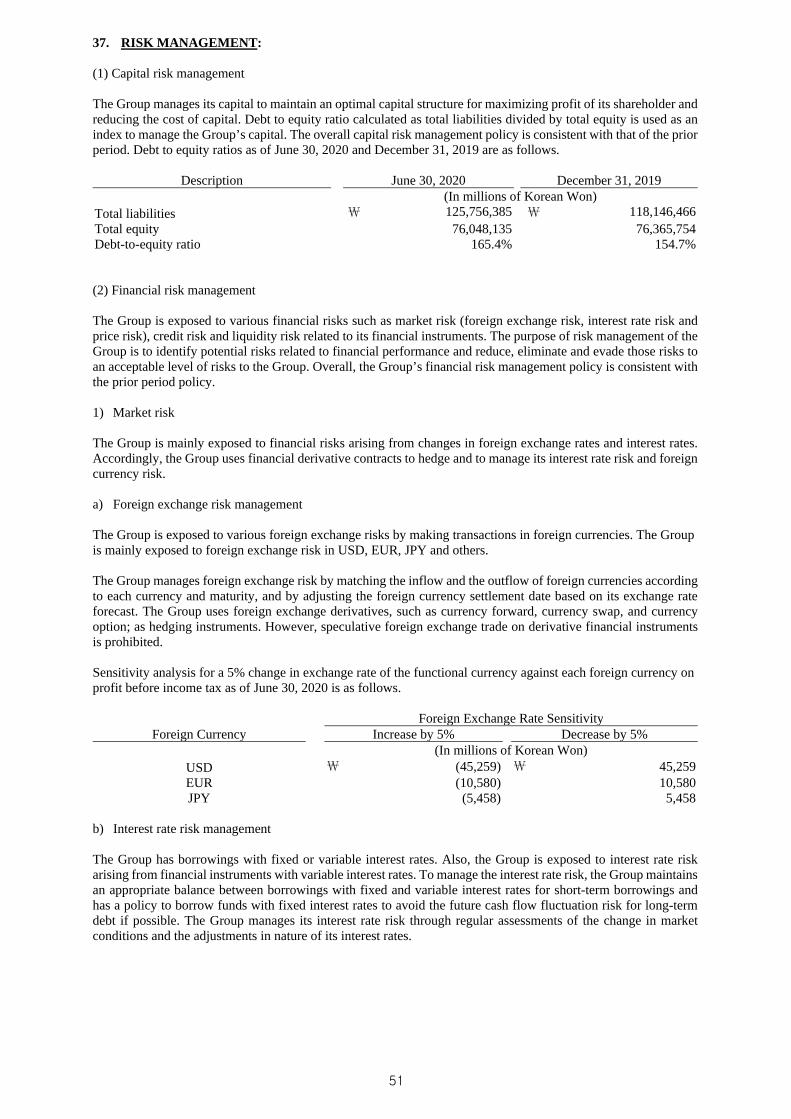
37. RISK MANAGEMENT:
(1) Capital risk management
The Group manages its capital to maintain an optimal capital structure for maximizing profit of its shareholder and reducing the cost of capital. Debt to equity ratio calculated as total liabilities divided by total equity is used as an index to manage the Group’s capital. The overall capital risk management policy is consistent with that of the prior period. Debt to equity ratios as of June 30, 2020 and December 31, 2019 are as follows.
Description June 30, 2020 December 31, 2019(In millions of Korean Won)
Total liabilities ₩ 125,756,385 ₩ 118,146,466 Total equity 76,048,135 76,365,754Debt-to-equity ratio 165.4% 154.7%
(2) Financial risk management
The Group is exposed to various financial risks such as market risk (foreign exchange risk, interest rate risk and price risk), credit risk and liquidity risk related to its financial instruments. The purpose of risk management of the Group is to identify potential risks related to financial performance and reduce, eliminate and evade those risks to an acceptable level of risks to the Group. Overall, the Group’s financial risk management policy is consistent with the prior period policy.
1) Market risk
The Group is mainly exposed to financial risks arising from changes in foreign exchange rates and interest rates. Accordingly, the Group uses financial derivative contracts to hedge and to manage its interest rate risk and foreign currency risk.
a) Foreign exchange risk management
The Group is exposed to various foreign exchange risks by making transactions in foreign currencies. The Group is mainly exposed to foreign exchange risk in USD, EUR, JPY and others.
The Group manages foreign exchange risk by matching the inflow and the outflow of foreign currencies according to each currency and maturity, and by adjusting the foreign currency settlement date based on its exchange rate forecast. The Group uses foreign exchange derivatives, such as currency forward, currency swap, and currency option; as hedging instruments. However, speculative foreign exchange trade on derivative financial instruments is prohibited.
Sensitivity analysis for a 5% change in exchange rate of the functional currency against each foreign currency on profit before income tax as of June 30, 2020 is as follows.
Foreign Exchange Rate Sensitivity Foreign Currency Increase by 5% Decrease by 5%
(In millions of Korean Won) USD ₩ (45,259) ₩ 45,259EUR (10,580) 10,580JPY (5,458) 5,458
b) Interest rate risk management
The Group has borrowings with fixed or variable interest rates. Also, the Group is exposed to interest rate risk arising from financial instruments with variable interest rates. To manage the interest rate risk, the Group maintains an appropriate balance between borrowings with fixed and variable interest rates for short-term borrowings and has a policy to borrow funds with fixed interest rates to avoid the future cash flow fluctuation risk for long-term debt if possible. The Group manages its interest rate risk through regular assessments of the change in market conditions and the adjustments in nature of its interest rates.
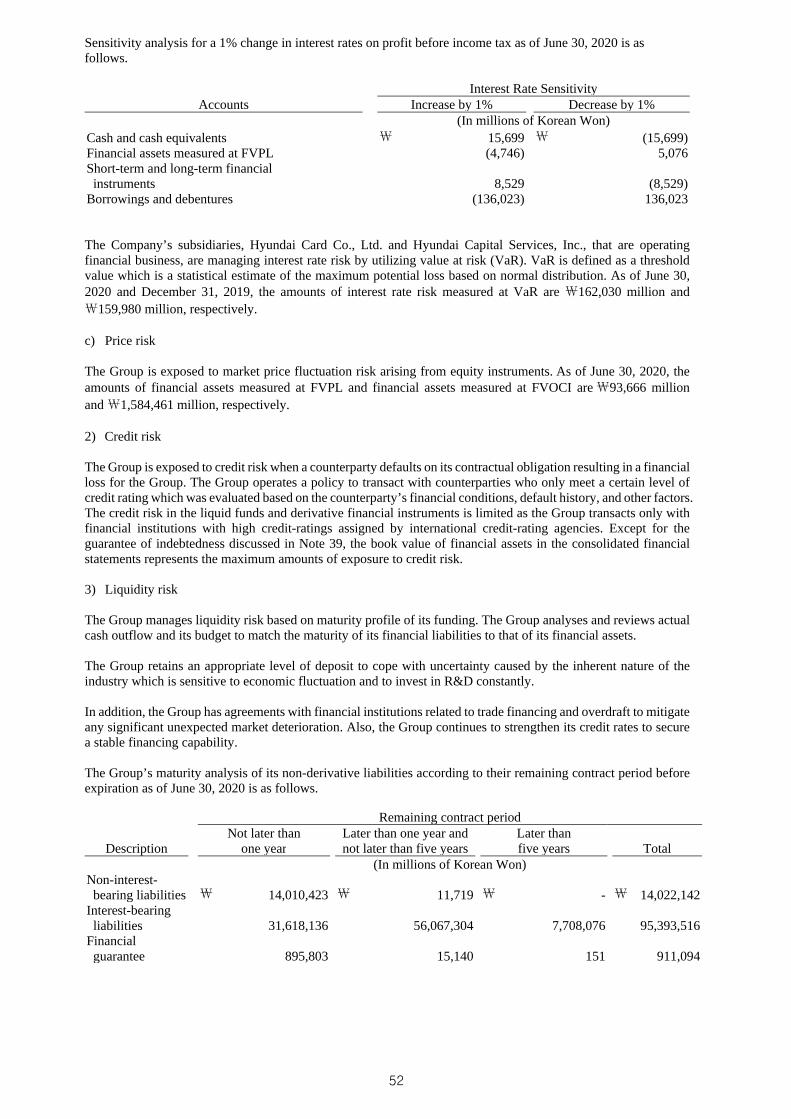
Sensitivity analysis for a 1% change in interest rates on profit before income tax as of June 30, 2020 is as follows.
Interest Rate Sensitivity Accounts Increase by 1% Decrease by 1%
(In millions of Korean Won) Cash and cash equivalents ₩ 15,699 ₩ (15,699) Financial assets measured at FVPL (4,746) 5,076 Short-term and long-term financial instruments 8,529 (8,529)
Borrowings and debentures (136,023) 136,023
The Company’s subsidiaries, Hyundai Card Co., Ltd. and Hyundai Capital Services, Inc., that are operating financial business, are managing interest rate risk by utilizing value at risk (VaR). VaR is defined as a threshold value which is a statistical estimate of the maximum potential loss based on normal distribution. As of June 30, 2020 and December 31, 2019, the amounts of interest rate risk measured at VaR are ₩162,030 million and ₩159,980 million, respectively.
c) Price risk
The Group is exposed to market price fluctuation risk arising from equity instruments. As of June 30, 2020, the amounts of financial assets measured at FVPL and financial assets measured at FVOCI are ₩93,666 million and ₩1,584,461 million, respectively.
2) Credit risk
The Group is exposed to credit risk when a counterparty defaults on its contractual obligation resulting in a financial loss for the Group. The Group operates a policy to transact with counterparties who only meet a certain level of credit rating which was evaluated based on the counterparty’s financial conditions, default history, and other factors. The credit risk in the liquid funds and derivative financial instruments is limited as the Group transacts only with financial institutions with high credit-ratings assigned by international credit-rating agencies. Except for the guarantee of indebtedness discussed in Note 39, the book value of financial assets in the consolidated financial statements represents the maximum amounts of exposure to credit risk.
3) Liquidity risk
The Group manages liquidity risk based on maturity profile of its funding. The Group analyses and reviews actual cash outflow and its budget to match the maturity of its financial liabilities to that of its financial assets.
The Group retains an appropriate level of deposit to cope with uncertainty caused by the inherent nature of the industry which is sensitive to economic fluctuation and to invest in R&D constantly.
In addition, the Group has agreements with financial institutions related to trade financing and overdraft to mitigate any significant unexpected market deterioration. Also, the Group continues to strengthen its credit rates to secure a stable financing capability.
The Group’s maturity analysis of its non-derivative liabilities according to their remaining contract period before expiration as of June 30, 2020 is as follows.
Remaining contract period
Description Not later than
one year Later than one year and not later than five years
Later than five years Total
(In millions of Korean Won) Non-interest-bearing liabilities ₩ 14,010,423 ₩ 11,719 ₩ - ₩ 14,022,142
Interest-bearing liabilities
31,618,136 56,067,304 7,708,076 95,393,516
Financial guarantee 895,803 15,140 151 911,094
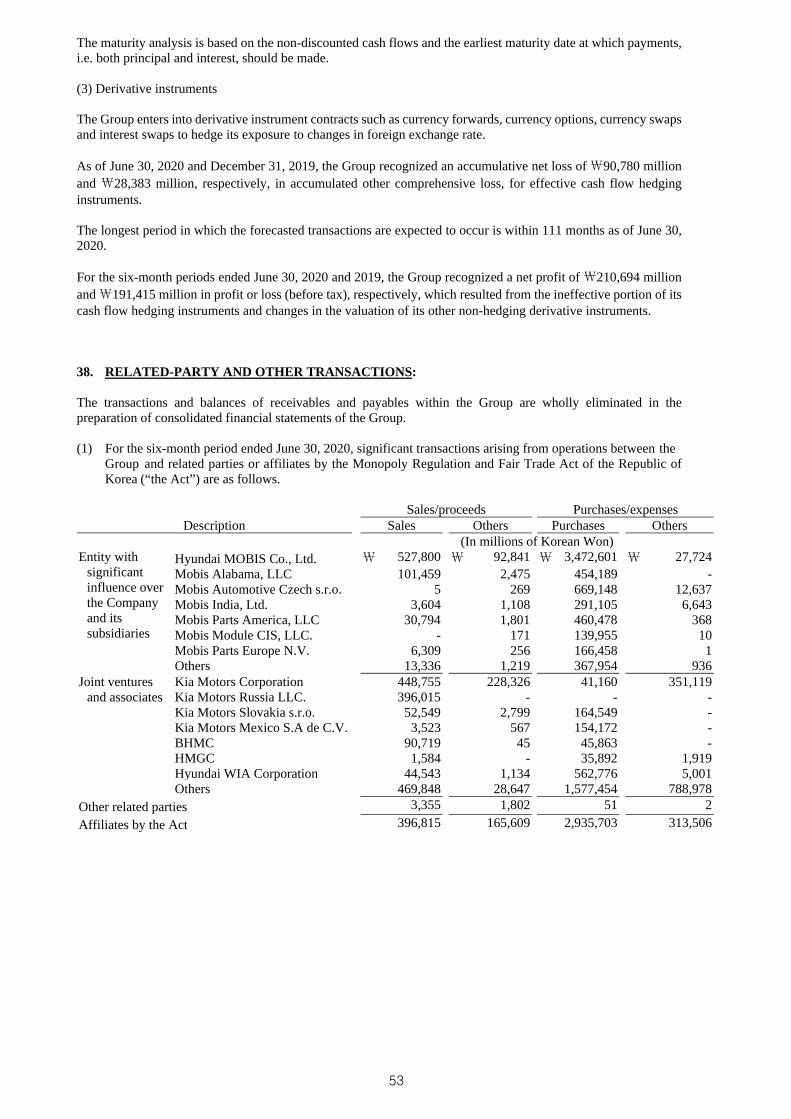
The maturity analysis is based on the non-discounted cash flows and the earliest maturity date at which payments, i.e. both principal and interest, should be made.
(3) Derivative instruments
The Group enters into derivative instrument contracts such as currency forwards, currency options, currency swaps and interest swaps to hedge its exposure to changes in foreign exchange rate.
As of June 30, 2020 and December 31, 2019, the Group recognized an accumulative net loss of ₩90,780 million and ₩28,383 million, respectively, in accumulated other comprehensive loss, for effective cash flow hedging instruments.
The longest period in which the forecasted transactions are expected to occur is within 111 months as of June 30, 2020.
For the six-month periods ended June 30, 2020 and 2019, the Group recognized a net profit of ₩210,694 million and ₩191,415 million in profit or loss (before tax), respectively, which resulted from the ineffective portion of its cash flow hedging instruments and changes in the valuation of its other non-hedging derivative instruments.
38. RELATED-PARTY AND OTHER TRANSACTIONS:
The transactions and balances of receivables and payables within the Group are wholly eliminated in the preparation of consolidated financial statements of the Group.
(1) For the six-month period ended June 30, 2020, significant transactions arising from operations between theGroup and related parties or affiliates by the Monopoly Regulation and Fair Trade Act of the Republic ofKorea (“the Act”) are as follows.
Description Sales/proceeds Purchases/expenses
Sales Others Purchases Others (In millions of Korean Won)
Entity with significant influence over the Company and its subsidiaries
Hyundai MOBIS Co., Ltd. ₩ 527,800 ₩ 92,841 ₩ 3,472,601 ₩ 27,724 Mobis Alabama, LLC 101,459 2,475 454,189 - Mobis Automotive Czech s.r.o. 5 269 669,148 12,637 Mobis India, Ltd. 3,604 1,108 291,105 6,643 Mobis Parts America, LLC 30,794 1,801 460,478 368 Mobis Module CIS, LLC. - 171 139,955 10 Mobis Parts Europe N.V. 6,309 256 166,458 1 Others 13,336 1,219 367,954 936
Joint ventures and associates
Kia Motors Corporation 448,755 228,326 41,160 351,119 Kia Motors Russia LLC. 396,015 - - - Kia Motors Slovakia s.r.o. 52,549 2,799 164,549 - Kia Motors Mexico S.A de C.V. 3,523 567 154,172 - BHMC 90,719 45 45,863 - HMGC 1,584 - 35,892 1,919 Hyundai WIA Corporation 44,543 1,134 562,776 5,001 Others 469,848 28,647 1,577,454 788,978
Other related parties 3,355 1,802 51 2
Affiliates by the Act 396,815 165,609 2,935,703 313,506
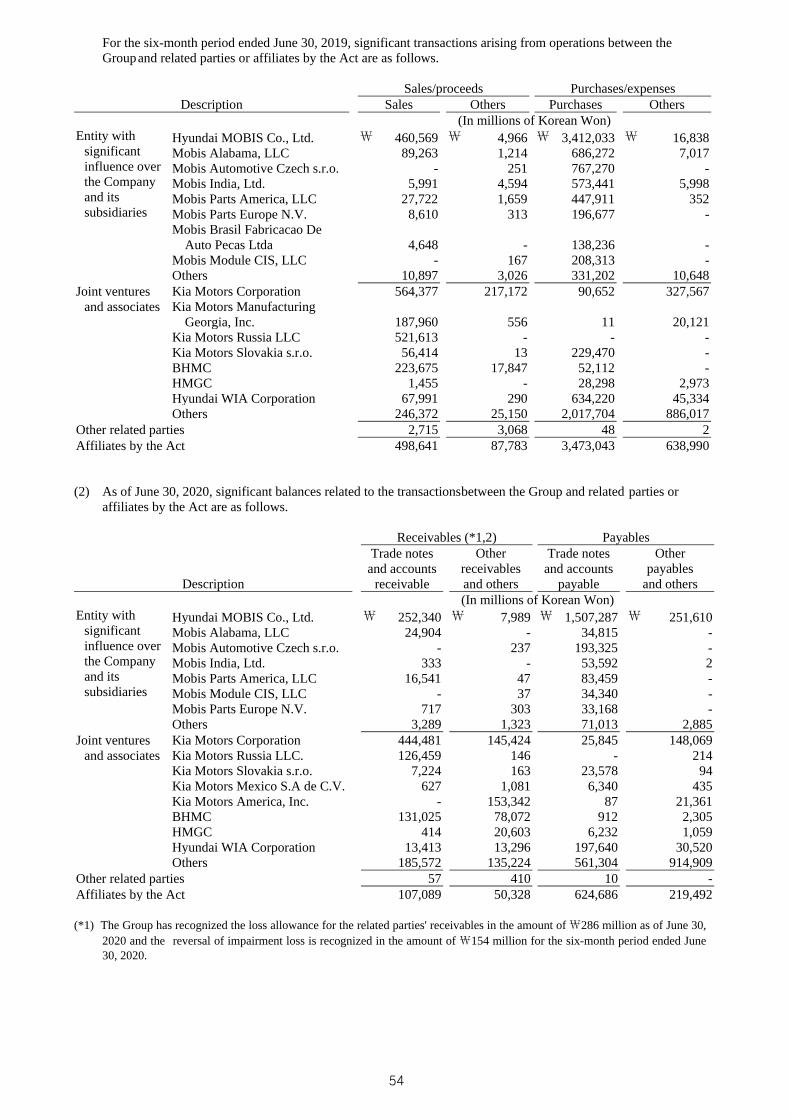
For the six-month period ended June 30, 2019, significant transactions arising from operations between the Group and related parties or affiliates by the Act are as follows.
Description Sales/proceeds Purchases/expenses
Sales Others Purchases Others (In millions of Korean Won)
Entity with significant influence over the Company and its subsidiaries
Hyundai MOBIS Co., Ltd. ₩ 460,569 ₩ 4,966 ₩ 3,412,033 ₩ 16,838 Mobis Alabama, LLC 89,263 1,214 686,272 7,017 Mobis Automotive Czech s.r.o. - 251 767,270 - Mobis India, Ltd. 5,991 4,594 573,441 5,998 Mobis Parts America, LLC 27,722 1,659 447,911 352 Mobis Parts Europe N.V. 8,610 313 196,677 - Mobis Brasil Fabricacao De
Auto Pecas Ltda 4,648 - 138,236 - Mobis Module CIS, LLC - 167 208,313 - Others 10,897 3,026 331,202 10,648
Joint ventures and associates
Kia Motors Corporation 564,377 217,172 90,652 327,567 Kia Motors Manufacturing
Georgia, Inc. 187,960 556 11 20,121 Kia Motors Russia LLC 521,613 - - - Kia Motors Slovakia s.r.o. 56,414 13 229,470 - BHMC 223,675 17,847 52,112 - HMGC 1,455 - 28,298 2,973 Hyundai WIA Corporation 67,991 290 634,220 45,334 Others 246,372 25,150 2,017,704 886,017
Other related parties 2,715 3,068 48 2 Affiliates by the Act 498,641 87,783 3,473,043 638,990
(2) As of June 30, 2020, significant balances related to the transactions between the Group and related parties oraffiliates by the Act are as follows.
Description
Receivables (*1,2) Payables Trade notes
and accounts receivable
Other receivables and others
Trade notes and accounts
payable
Other payables
and others (In millions of Korean Won)
Entity with significant influence over the Company and its subsidiaries
Hyundai MOBIS Co., Ltd. ₩ 252,340 ₩ 7,989 ₩ 1,507,287 ₩ 251,610 Mobis Alabama, LLC 24,904 - 34,815 - Mobis Automotive Czech s.r.o. - 237 193,325 - Mobis India, Ltd. 333 - 53,592 2 Mobis Parts America, LLC 16,541 47 83,459 - Mobis Module CIS, LLC - 37 34,340 - Mobis Parts Europe N.V. 717 303 33,168 - Others 3,289 1,323 71,013 2,885
Joint ventures and associates
Kia Motors Corporation 444,481 145,424 25,845 148,069 Kia Motors Russia LLC. 126,459 146 - 214Kia Motors Slovakia s.r.o. 7,224 163 23,578 94Kia Motors Mexico S.A de C.V. 627 1,081 6,340 435Kia Motors America, Inc. - 153,342 87 21,361 BHMC 131,025 78,072 912 2,305 HMGC 414 20,603 6,232 1,059 Hyundai WIA Corporation 13,413 13,296 197,640 30,520 Others 185,572 135,224 561,304 914,909
Other related parties 57 410 10 - Affiliates by the Act 107,089 50,328 624,686 219,492
(*1) The Group has recognized the loss allowance for the related parties' receivables in the amount of ₩286 million as of June 30, 2020 and the reversal of impairment loss is recognized in the amount of ₩154 million for the six-month period ended June 30, 2020.
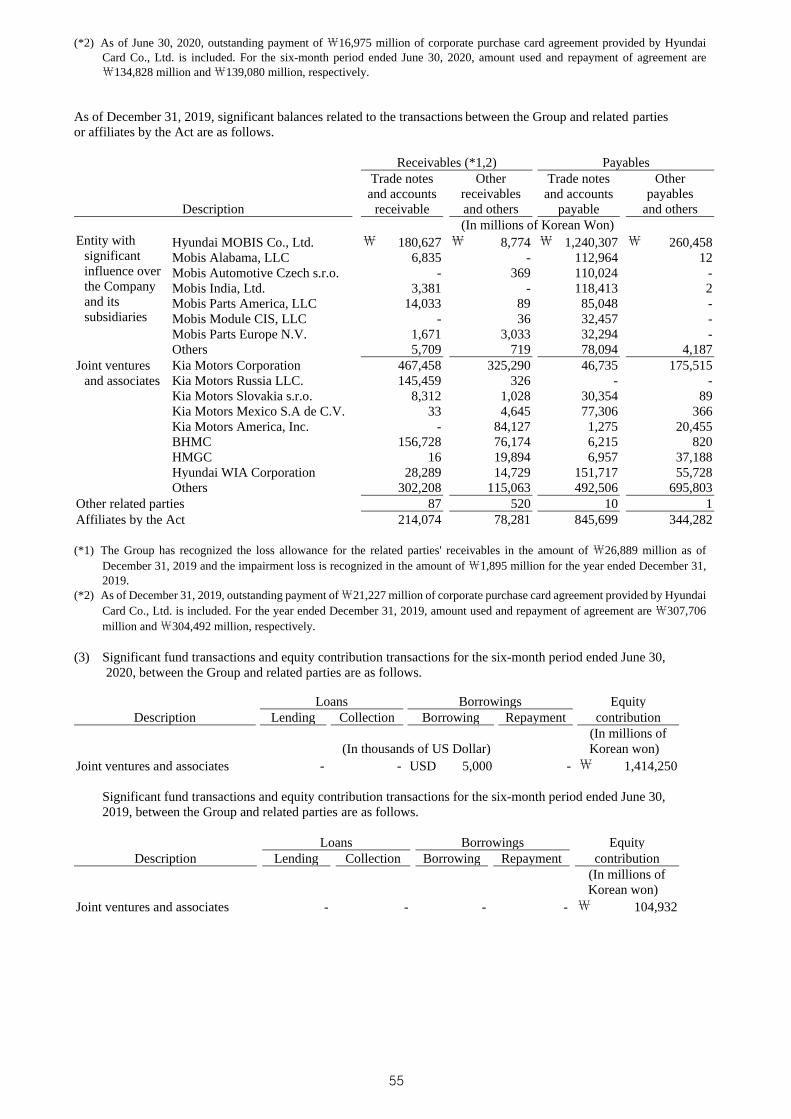
(*2) As of June 30, 2020, outstanding payment of ₩16,975 million of corporate purchase card agreement provided by Hyundai Card Co., Ltd. is included. For the six-month period ended June 30, 2020, amount used and repayment of agreement are ₩134,828 million and ₩139,080 million, respectively.
As of December 31, 2019, significant balances related to the transactions between the Group and related parties or affiliates by the Act are as follows.
Description
Receivables (*1,2) Payables Trade notes
and accounts receivable
Other receivables and others
Trade notes and accounts
payable
Other payables
and others (In millions of Korean Won)
Entity with significant influence over the Company and its subsidiaries
Hyundai MOBIS Co., Ltd. ₩ 180,627 ₩ 8,774 ₩ 1,240,307 ₩ 260,458 Mobis Alabama, LLC 6,835 - 112,964 12 Mobis Automotive Czech s.r.o. - 369 110,024 - Mobis India, Ltd. 3,381 - 118,413 2 Mobis Parts America, LLC 14,033 89 85,048 - Mobis Module CIS, LLC - 36 32,457 - Mobis Parts Europe N.V. 1,671 3,033 32,294 - Others 5,709 719 78,094 4,187
Joint ventures and associates
Kia Motors Corporation 467,458 325,290 46,735 175,515 Kia Motors Russia LLC. 145,459 326 - - Kia Motors Slovakia s.r.o. 8,312 1,028 30,354 89 Kia Motors Mexico S.A de C.V. 33 4,645 77,306 366 Kia Motors America, Inc. - 84,127 1,275 20,455 BHMC 156,728 76,174 6,215 820 HMGC 16 19,894 6,957 37,188 Hyundai WIA Corporation 28,289 14,729 151,717 55,728 Others 302,208 115,063 492,506 695,803
Other related parties 87 520 10 1 Affiliates by the Act 214,074 78,281 845,699 344,282
(*1) The Group has recognized the loss allowance for the related parties' receivables in the amount of ₩26,889 million as of December 31, 2019 and the impairment loss is recognized in the amount of ₩1,895 million for the year ended December 31, 2019.
(*2) As of December 31, 2019, outstanding payment of ₩21,227 million of corporate purchase card agreement provided by Hyundai Card Co., Ltd. is included. For the year ended December 31, 2019, amount used and repayment of agreement are ₩307,706 million and ₩304,492 million, respectively.
(3) Significant fund transactions and equity contribution transactions for the six-month period ended June 30,2020, between the Group and related parties are as follows.
Loans Borrowings Equity Description Lending Collection Borrowing Repayment contribution
(In thousands of US Dollar) (In millions of
Korean won) Joint ventures and associates - - USD 5,000 - ₩ 1,414,250
Significant fund transactions and equity contribution transactions for the six-month period ended June 30, 2019, between the Group and related parties are as follows.
Loans Borrowings Equity Description Lending Collection Borrowing Repayment contribution
(In millions of Korean won)
Joint ventures and associates - - - - ₩ 104,932
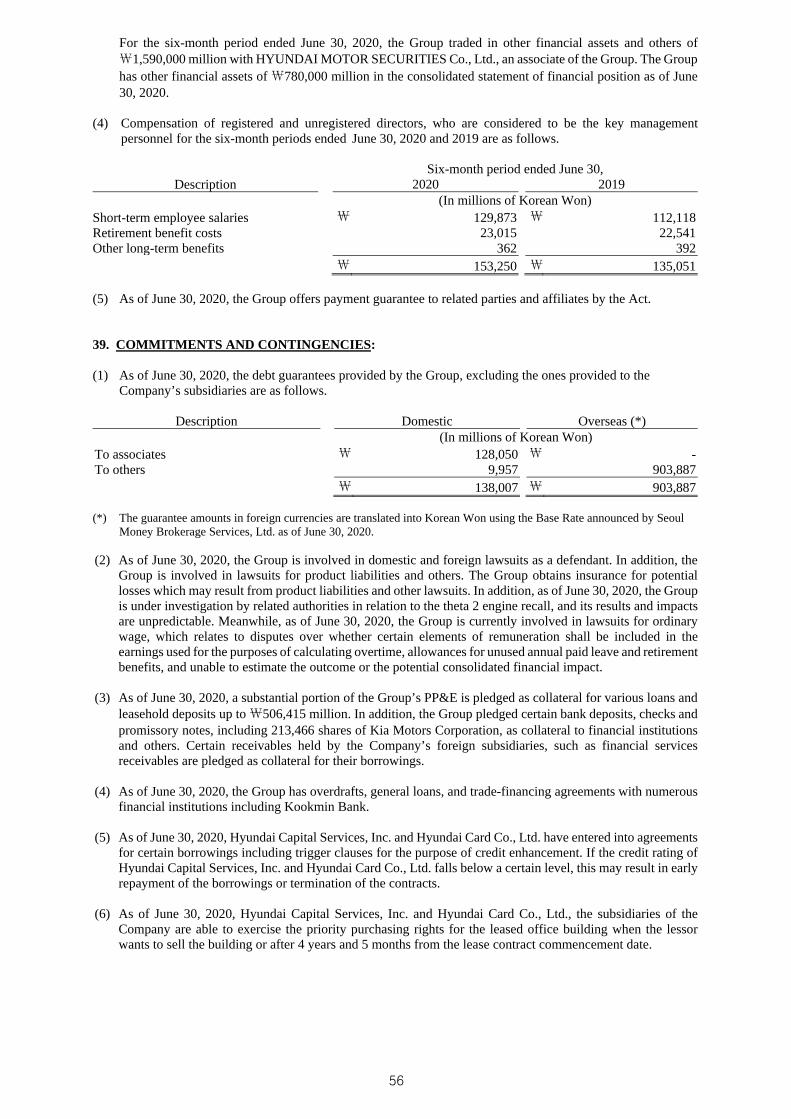
For the six-month period ended June 30, 2020, the Group traded in other financial assets and others of ₩1,590,000 million with HYUNDAI MOTOR SECURITIES Co., Ltd., an associate of the Group. The Group has other financial assets of ₩780,000 million in the consolidated statement of financial position as of June 30, 2020.
(4) Compensation of registered and unregistered directors, who are considered to be the key managementpersonnel for the six-month periods ended June 30, 2020 and 2019 are as follows.
Six-month period ended June 30, Description 2020 2019
(In millions of Korean Won) Short-term employee salaries ₩ 129,873 ₩ 112,118 Retirement benefit costs 23,015 22,541 Other long-term benefits 362 392
₩ 153,250 ₩ 135,051
(5) As of June 30, 2020, the Group offers payment guarantee to related parties and affiliates by the Act.
39. COMMITMENTS AND CONTINGENCIES:
(1) As of June 30, 2020, the debt guarantees provided by the Group, excluding the ones provided to theCompany’s subsidiaries are as follows.
Description Domestic Overseas (*)(In millions of Korean Won)
To associates ₩ 128,050 ₩ - To others 9,957 903,887
₩ 138,007 ₩ 903,887
(*) The guarantee amounts in foreign currencies are translated into Korean Won using the Base Rate announced by Seoul Money Brokerage Services, Ltd. as of June 30, 2020.
(2) As of June 30, 2020, the Group is involved in domestic and foreign lawsuits as a defendant. In addition, theGroup is involved in lawsuits for product liabilities and others. The Group obtains insurance for potentiallosses which may result from product liabilities and other lawsuits. In addition, as of June 30, 2020, the Groupis under investigation by related authorities in relation to the theta 2 engine recall, and its results and impactsare unpredictable. Meanwhile, as of June 30, 2020, the Group is currently involved in lawsuits for ordinarywage, which relates to disputes over whether certain elements of remuneration shall be included in theearnings used for the purposes of calculating overtime, allowances for unused annual paid leave and retirement benefits, and unable to estimate the outcome or the potential consolidated financial impact.
(3) As of June 30, 2020, a substantial portion of the Group’s PP&E is pledged as collateral for various loans andleasehold deposits up to ₩506,415 million. In addition, the Group pledged certain bank deposits, checks andpromissory notes, including 213,466 shares of Kia Motors Corporation, as collateral to financial institutionsand others. Certain receivables held by the Company’s foreign subsidiaries, such as financial servicesreceivables are pledged as collateral for their borrowings.
(4) As of June 30, 2020, the Group has overdrafts, general loans, and trade-financing agreements with numerousfinancial institutions including Kookmin Bank.
(5) As of June 30, 2020, Hyundai Capital Services, Inc. and Hyundai Card Co., Ltd. have entered into agreementsfor certain borrowings including trigger clauses for the purpose of credit enhancement. If the credit rating ofHyundai Capital Services, Inc. and Hyundai Card Co., Ltd. falls below a certain level, this may result in earlyrepayment of the borrowings or termination of the contracts.
(6) As of June 30, 2020, Hyundai Capital Services, Inc. and Hyundai Card Co., Ltd., the subsidiaries of theCompany are able to exercise the priority purchasing rights for the leased office building when the lessorwants to sell the building or after 4 years and 5 months from the lease contract commencement date.
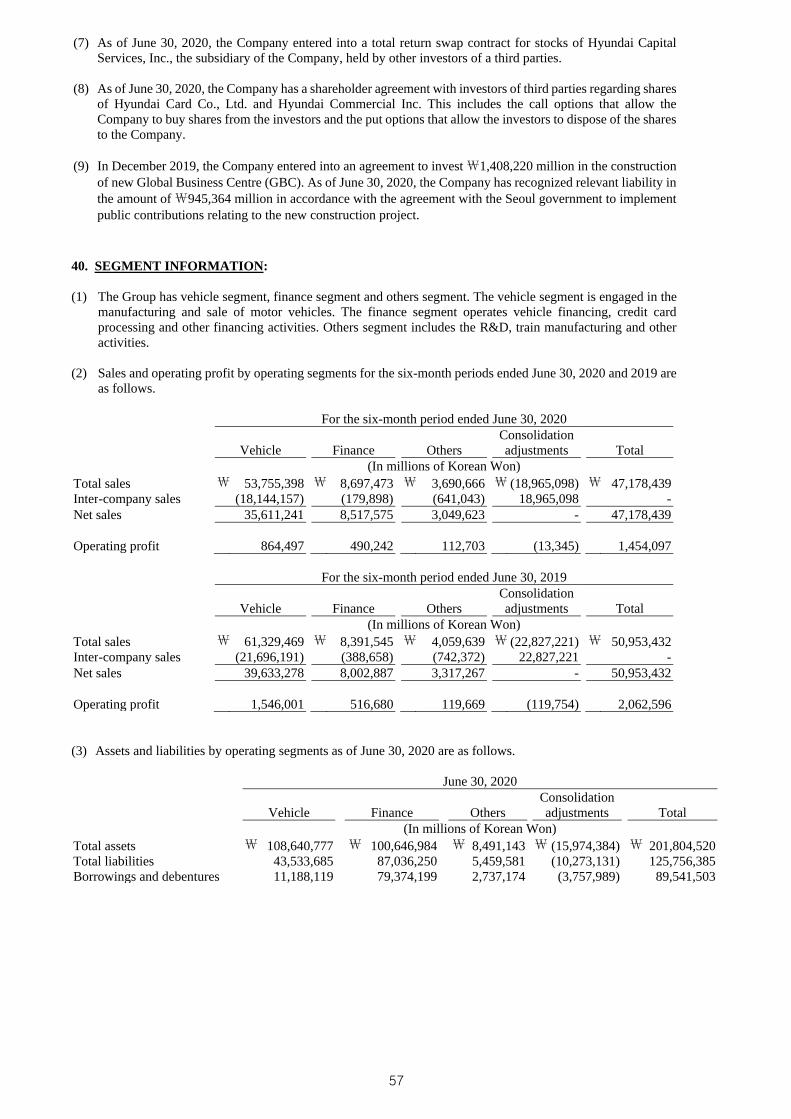
(7) As of June 30, 2020, the Company entered into a total return swap contract for stocks of Hyundai CapitalServices, Inc., the subsidiary of the Company, held by other investors of a third parties.
(8) As of June 30, 2020, the Company has a shareholder agreement with investors of third parties regarding sharesof Hyundai Card Co., Ltd. and Hyundai Commercial Inc. This includes the call options that allow theCompany to buy shares from the investors and the put options that allow the investors to dispose of the sharesto the Company.
(9) In December 2019, the Company entered into an agreement to invest ₩1,408,220 million in the constructionof new Global Business Centre (GBC). As of June 30, 2020, the Company has recognized relevant liability inthe amount of ₩945,364 million in accordance with the agreement with the Seoul government to implementpublic contributions relating to the new construction project.
40. SEGMENT INFORMATION:
(1) The Group has vehicle segment, finance segment and others segment. The vehicle segment is engaged in themanufacturing and sale of motor vehicles. The finance segment operates vehicle financing, credit cardprocessing and other financing activities. Others segment includes the R&D, train manufacturing and otheractivities.
(2) Sales and operating profit by operating segments for the six-month periods ended June 30, 2020 and 2019 areas follows.
For the six-month period ended June 30, 2020
Vehicle Finance Others Consolidation adjustments Total
(In millions of Korean Won) Total sales ₩ 53,755,398 ₩ 8,697,473 ₩ 3,690,666 ₩ (18,965,098) ₩ 47,178,439 Inter-company sales (18,144,157) (179,898) (641,043) 18,965,098 - Net sales 35,611,241 8,517,575 3,049,623 - 47,178,439
Operating profit 864,497 490,242 112,703 (13,345) 1,454,097
For the six-month period ended June 30, 2019
Vehicle Finance Others Consolidation adjustments Total
(In millions of Korean Won) Total sales ₩ 61,329,469 ₩ 8,391,545 ₩ 4,059,639 ₩ (22,827,221) ₩ 50,953,432 Inter-company sales (21,696,191) (388,658) (742,372) 22,827,221 - Net sales 39,633,278 8,002,887 3,317,267 - 50,953,432
Operating profit 1,546,001 516,680 119,669 (119,754) 2,062,596
(3) Assets and liabilities by operating segments as of June 30, 2020 are as follows.
June 30, 2020
Vehicle Finance Others Consolidation adjustments Total
(In millions of Korean Won) Total assets ₩ 108,640,777 ₩ 100,646,984 ₩ 8,491,143 ₩ (15,974,384) ₩ 201,804,520 Total liabilities 43,533,685 87,036,250 5,459,581 (10,273,131) 125,756,385 Borrowings and debentures 11,188,119 79,374,199 2,737,174 (3,757,989) 89,541,503
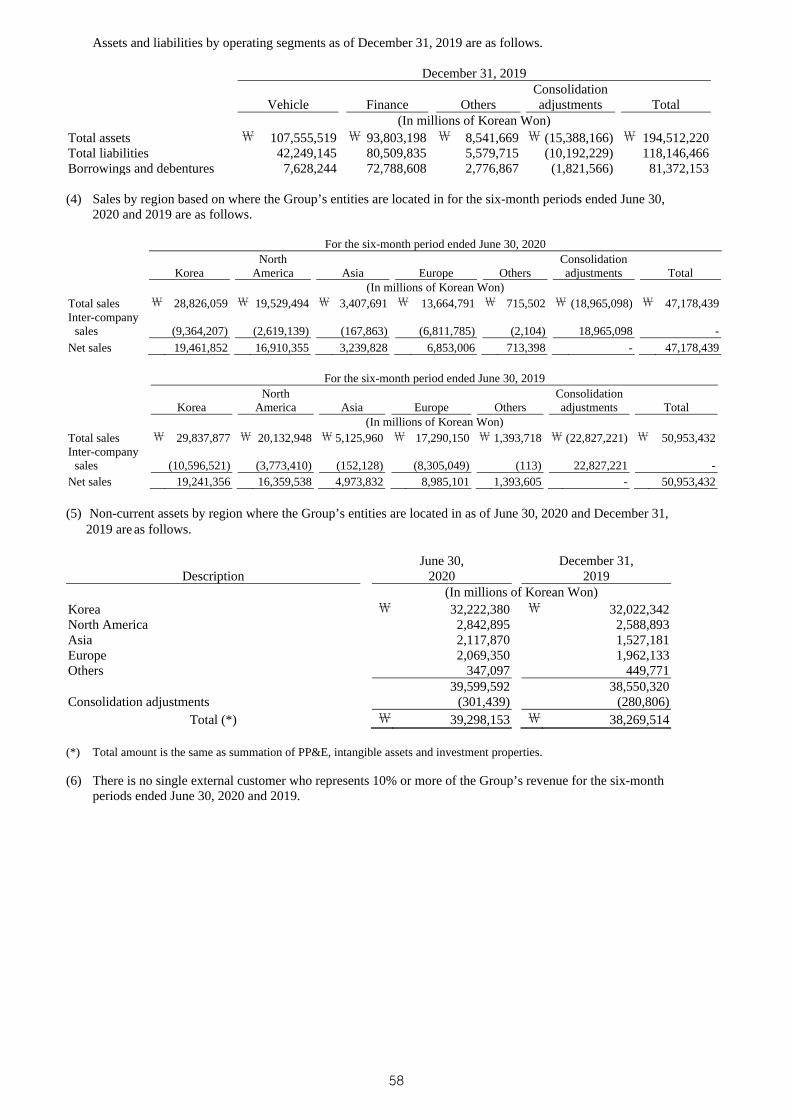
Assets and liabilities by operating segments as of December 31, 2019 are as follows.
December 31, 2019
Vehicle Finance Others Consolidation adjustments Total
(In millions of Korean Won) Total assets ₩ 107,555,519 ₩ 93,803,198 ₩ 8,541,669 ₩ (15,388,166) ₩ 194,512,220 Total liabilities 42,249,145 80,509,835 5,579,715 (10,192,229) 118,146,466 Borrowings and debentures 7,628,244 72,788,608 2,776,867 (1,821,566) 81,372,153
(4) Sales by region based on where the Group’s entities are located in for the six-month periods ended June 30,2020 and 2019 are as follows.
For the six-month period ended June 30, 2020
Korea North
America Asia Europe Others Consolidation adjustments Total
(In millions of Korean Won) Total sales ₩ 28,826,059 ₩ 19,529,494 ₩ 3,407,691 ₩ 13,664,791 ₩ 715,502 ₩ (18,965,098) ₩ 47,178,439 Inter-company
sales (9,364,207) (2,619,139) (167,863) (6,811,785) (2,104) 18,965,098 -
Net sales 19,461,852 16,910,355 3,239,828 6,853,006 713,398 - 47,178,439
For the six-month period ended June 30, 2019
Korea North
America Asia Europe Others Consolidation adjustments Total
(In millions of Korean Won) Total sales ₩ 29,837,877 ₩ 20,132,948 ₩ 5,125,960 ₩ 17,290,150 ₩ 1,393,718 ₩ (22,827,221) ₩ 50,953,432 Inter-company
sales (10,596,521) (3,773,410) (152,128) (8,305,049) (113) 22,827,221 - Net sales 19,241,356 16,359,538 4,973,832 8,985,101 1,393,605 - 50,953,432
(5) Non-current assets by region where the Group’s entities are located in as of June 30, 2020 and December 31,2019 are as follows.
DescriptionJune 30,
2020 December 31,
2019 (In millions of Korean Won)
Korea ₩ 32,222,380 ₩ 32,022,342 North America 2,842,895 2,588,893Asia 2,117,870 1,527,181Europe 2,069,350 1,962,133Others 347,097 449,771
39,599,592 38,550,320Consolidation adjustments (301,439) (280,806)
Total (*) ₩ 39,298,153 ₩ 38,269,514
(*) Total amount is the same as summation of PP&E, intangible assets and investment properties.
(6) There is no single external customer who represents 10% or more of the Group’s revenue for the six-monthperiods ended June 30, 2020 and 2019.
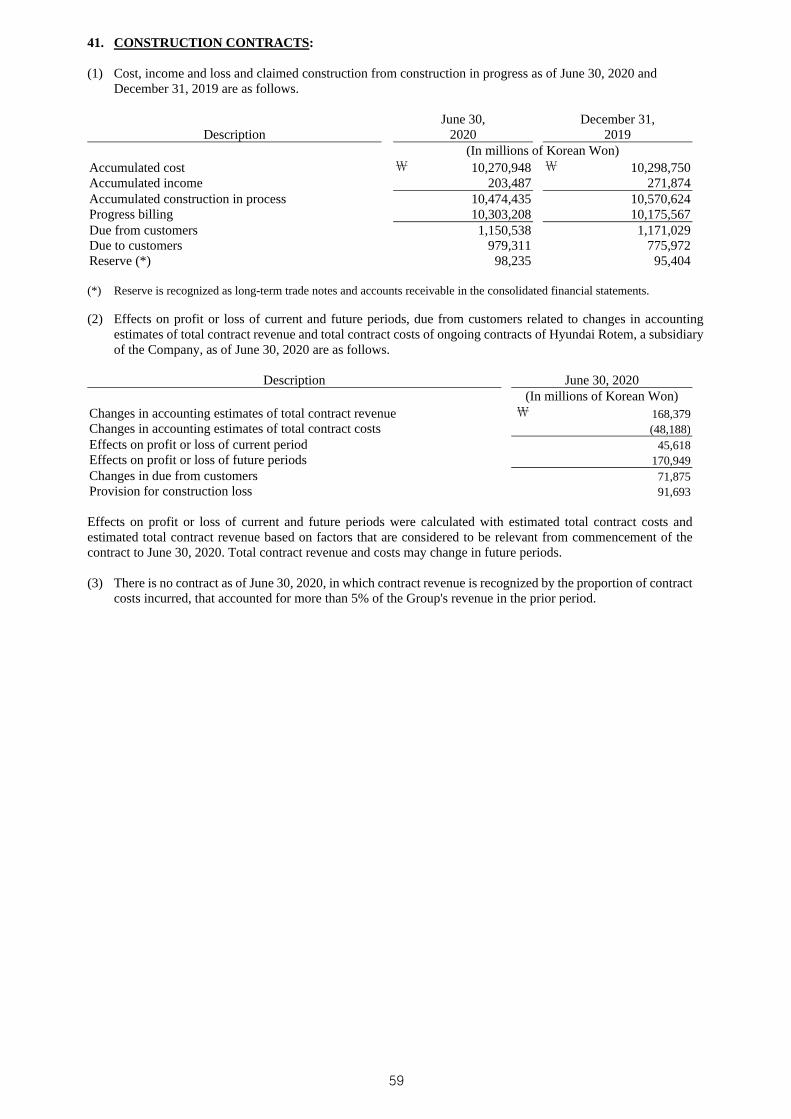
41. CONSTRUCTION CONTRACTS:
(1) Cost, income and loss and claimed construction from construction in progress as of June 30, 2020 andDecember 31, 2019 are as follows.
DescriptionJune 30,
2020 December 31,
2019 (In millions of Korean Won)
Accumulated cost ₩ 10,270,948 ₩ 10,298,750 Accumulated income 203,487 271,874Accumulated construction in process 10,474,435 10,570,624Progress billing 10,303,208 10,175,567Due from customers 1,150,538 1,171,029Due to customers 979,311 775,972Reserve (*) 98,235 95,404
(*) Reserve is recognized as long-term trade notes and accounts receivable in the consolidated financial statements.
(2) Effects on profit or loss of current and future periods, due from customers related to changes in accountingestimates of total contract revenue and total contract costs of ongoing contracts of Hyundai Rotem, a subsidiaryof the Company, as of June 30, 2020 are as follows.
Description June 30, 2020 (In millions of Korean Won) Changes in accounting estimates of total contract revenue ₩ 168,379 Changes in accounting estimates of total contract costs (48,188) Effects on profit or loss of current period 45,618 Effects on profit or loss of future periods 170,949 Changes in due from customers 71,875 Provision for construction loss 91,693
Effects on profit or loss of current and future periods were calculated with estimated total contract costs and estimated total contract revenue based on factors that are considered to be relevant from commencement of the contract to June 30, 2020. Total contract revenue and costs may change in future periods.
(3) There is no contract as of June 30, 2020, in which contract revenue is recognized by the proportion of contractcosts incurred, that accounted for more than 5% of the Group's revenue in the prior period.
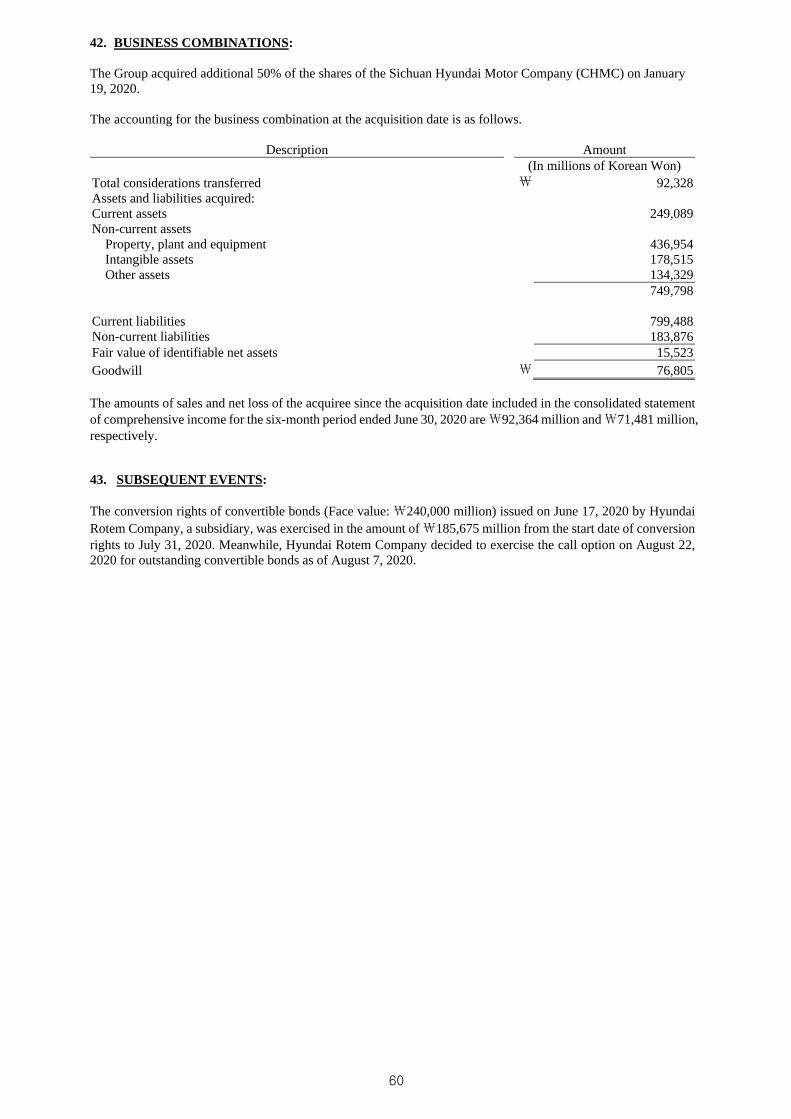
42. BUSINESS COMBINATIONS:
The Group acquired additional 50% of the shares of the Sichuan Hyundai Motor Company (CHMC) on January 19, 2020.
The accounting for the business combination at the acquisition date is as follows.
Description Amount (In millions of Korean Won) Total considerations transferred ₩ 92,328 Assets and liabilities acquired: Current assets 249,089Non-current assets
Property, plant and equipment 436,954Intangible assets 178,515
Other assets 134,329749,798
Current liabilities 799,488Non-current liabilities 183,876Fair value of identifiable net assets 15,523Goodwill ₩ 76,805
The amounts of sales and net loss of the acquiree since the acquisition date included in the consolidated statement of comprehensive income for the six-month period ended June 30, 2020 are ₩92,364 million and ₩71,481 million, respectively.
43. SUBSEQUENT EVENTS:
The conversion rights of convertible bonds (Face value: ₩240,000 million) issued on June 17, 2020 by Hyundai Rotem Company, a subsidiary, was exercised in the amount of ₩185,675 million from the start date of conversion rights to July 31, 2020. Meanwhile, Hyundai Rotem Company decided to exercise the call option on August 22, 2020 for outstanding convertible bonds as of August 7, 2020.