Hypothesis Testing1
33
PRESEN TED BY: ) Hypothesis testing
Transcript of Hypothesis Testing1

8/8/2019 Hypothesis Testing1
http://slidepdf.com/reader/full/hypothesis-testing1 1/33
PRESENTED BY:
)
Hypothesis testing
8/8/2019 Hypothesis Testing1
http://slidepdf.com/reader/full/hypothesis-testing1 2/33
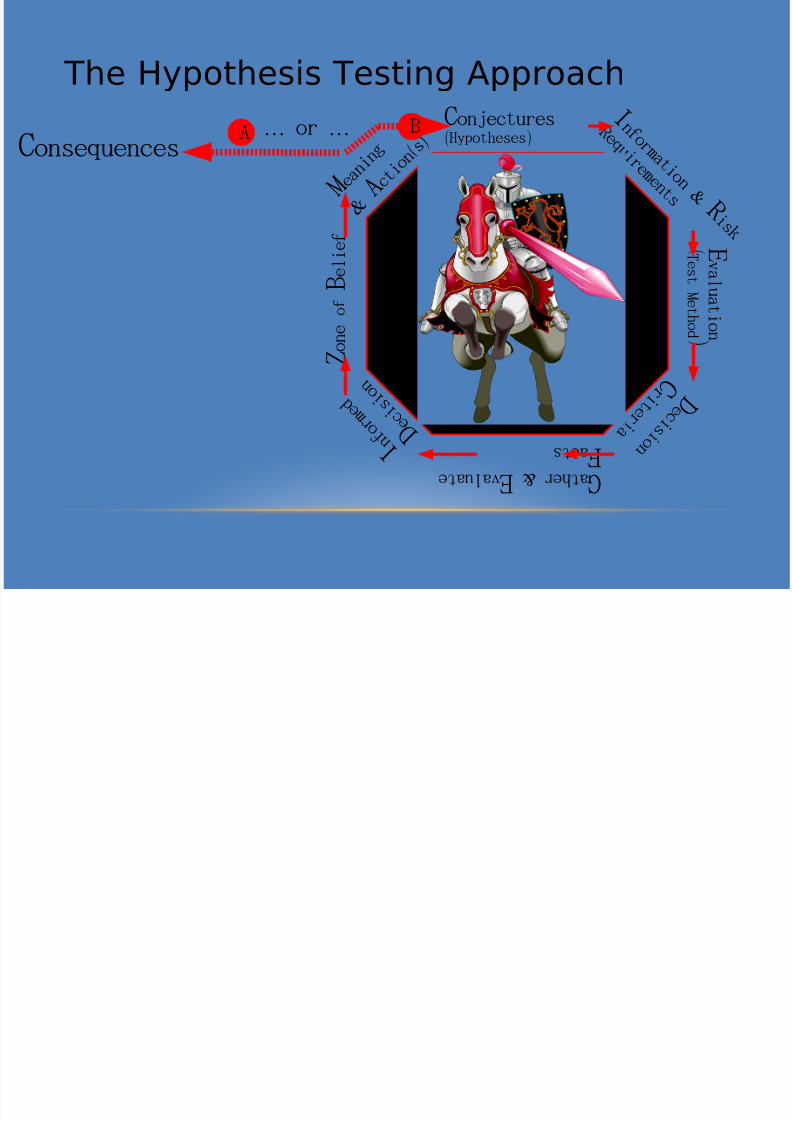
The Hypothesis Testing Approach
C onjectures ( )Hypotheses
I
&
n f o r m a t i o n
R i s k
R e q u i r e m e n t s
E v
a l u a t i o n
( T e
s t
M e t h o d
)
D e c i s i o n
C r i
t e r i a
G & a t h e r E v a l u a t e
F a c t s
M
e a n i
n g
& A
( )
c t i o
ns
I n f o r m e d
D e c i s i o n
Z o
n e
o f
B e
l i
e f
Consequences
AB
… …or

8/8/2019 Hypothesis Testing1
http://slidepdf.com/reader/full/hypothesis-testing1 3/33
What is a Hypothesis?
A hypothesis is an assumption about thepopulation parameter.
o A parameter is a characteristic of the
population, like its mean or variance.o The parameter must be identified before
analysis.•
8/8/2019 Hypothesis Testing1
http://slidepdf.com/reader/full/hypothesis-testing1 4/33
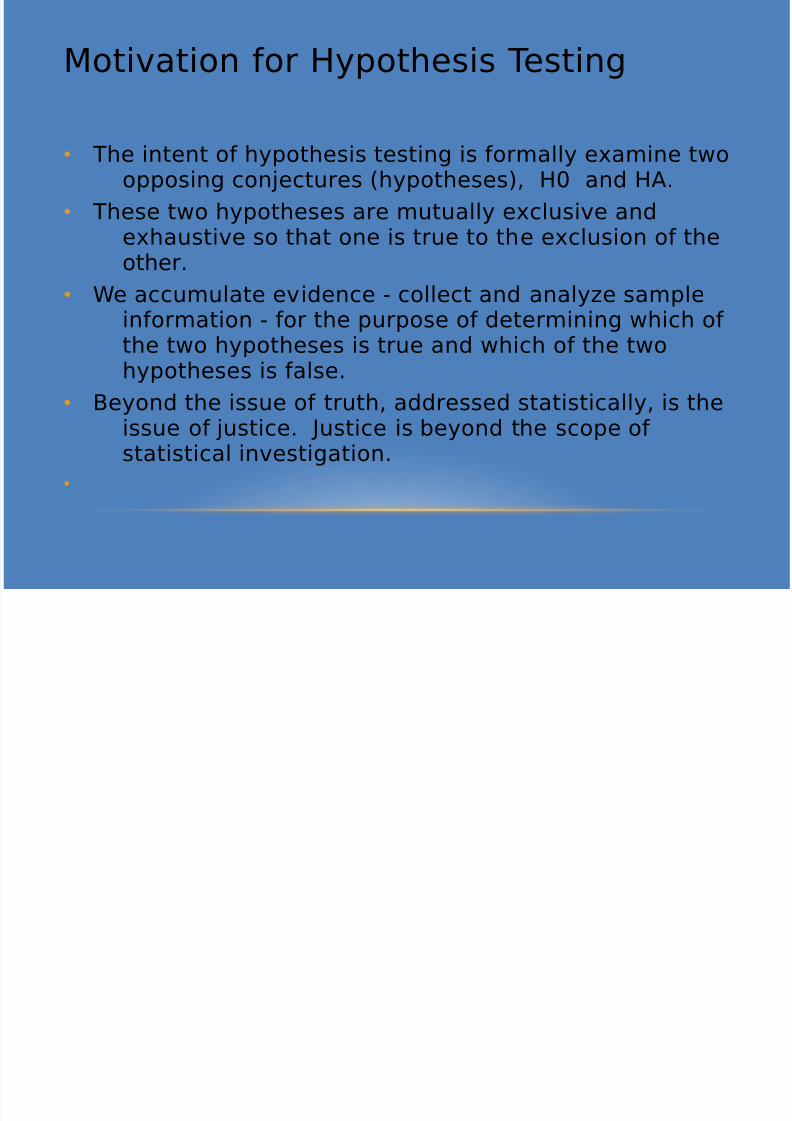
Motivation for Hypothesis Testing
• The intent of hypothesis testing is formally examine twoopposing conjectures (hypotheses), H0 and HA.
• These two hypotheses are mutually exclusive andexhaustive so that one is true to the exclusion of theother.
• We accumulate evidence - collect and analyze sampleinformation - for the purpose of determining which of the two hypotheses is true and which of the twohypotheses is false.
• Beyond the issue of truth, addressed statistically, is theissue of justice. Justice is beyond the scope of statistical investigation.
•
8/8/2019 Hypothesis Testing1
http://slidepdf.com/reader/full/hypothesis-testing1 5/33
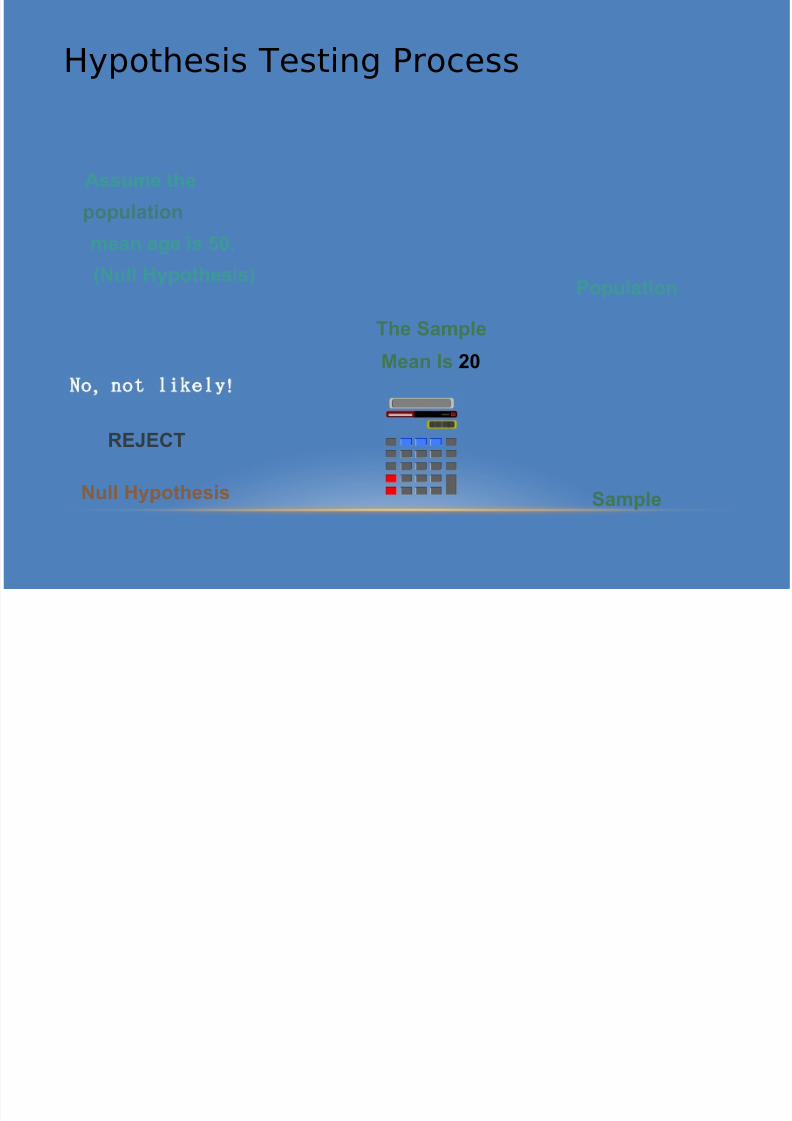
Hypothesis Testing Process
Population
Assume the
population
mean age is 50.
(Null Hypothesis)
REJECT
The Sample
Mean Is 20
SampleNull Hypothesis
, !o not likely
8/8/2019 Hypothesis Testing1
http://slidepdf.com/reader/full/hypothesis-testing1 6/33
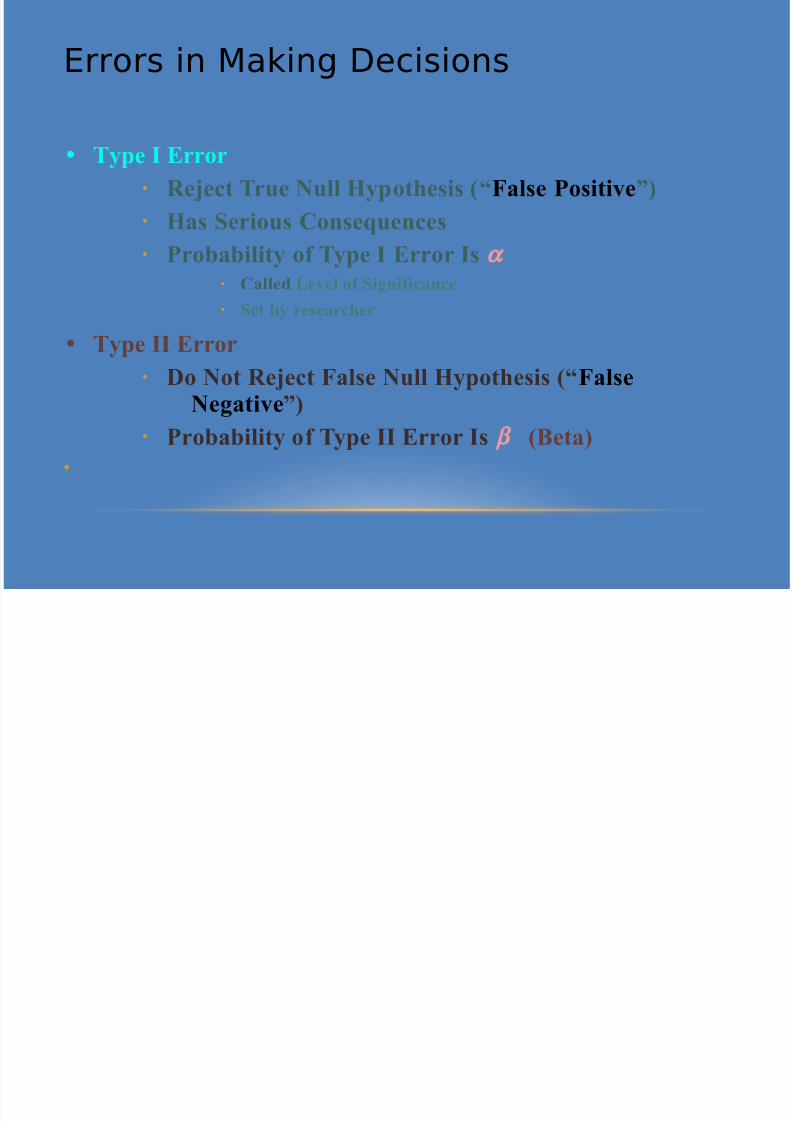
Errors in Making Decisions
• Type I Error
• Reject True Null Hypothesis (“False Positive”)
• Has Serious Consequences
• Probability of Type I Error Is α• Called Level of Significance
• Set by researcher
• Type II Error
• Do Not Reject False Null Hypothesis (“False
Negative”)• Probability of Type II Error Is β (Beta)
•
8/8/2019 Hypothesis Testing1
http://slidepdf.com/reader/full/hypothesis-testing1 7/33
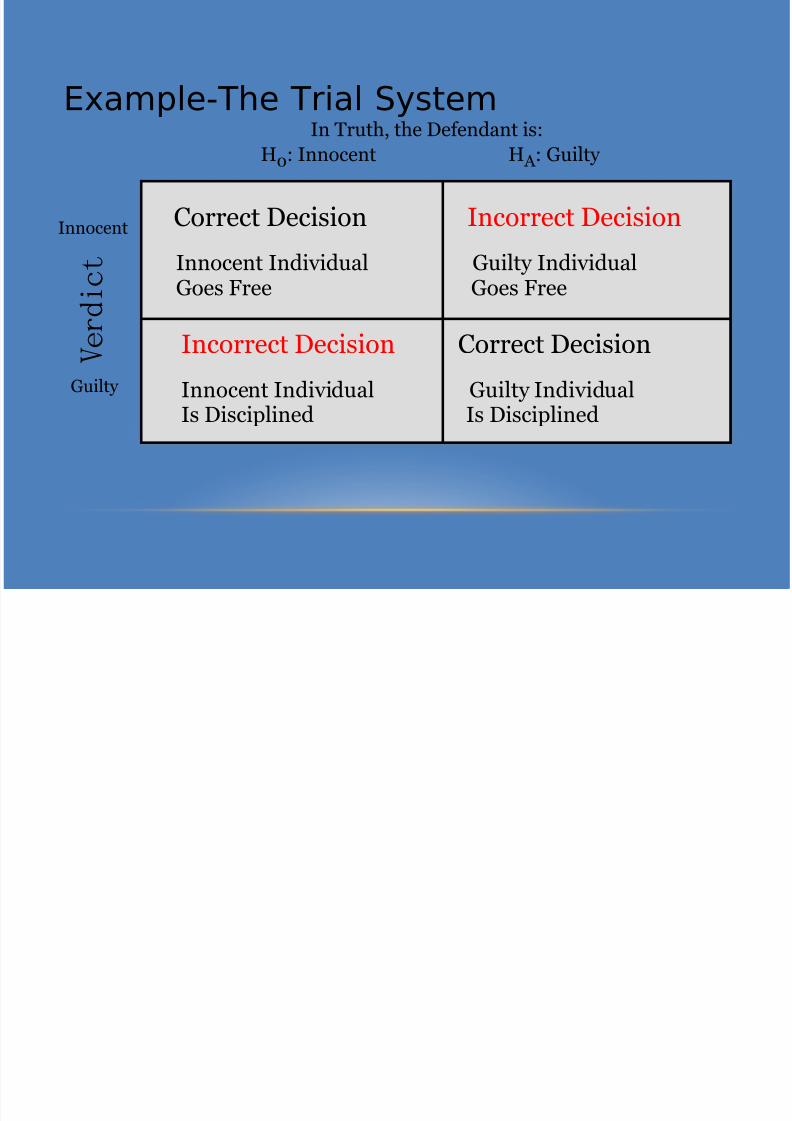
Example-The Trial System
Correct Decision Incorrect Decision
Innocent Individual Guilty IndividualGoes Free Goes Free
Incorrect Decision Correct Decision
Innocent Individual Guilty Individual
Is Disciplined Is Disciplined
Innocent
Guilty
V e
r d i
c
t
In Truth, the Defendant is:H0: Innocent H A : Guilty
8/8/2019 Hypothesis Testing1
http://slidepdf.com/reader/full/hypothesis-testing1 8/33
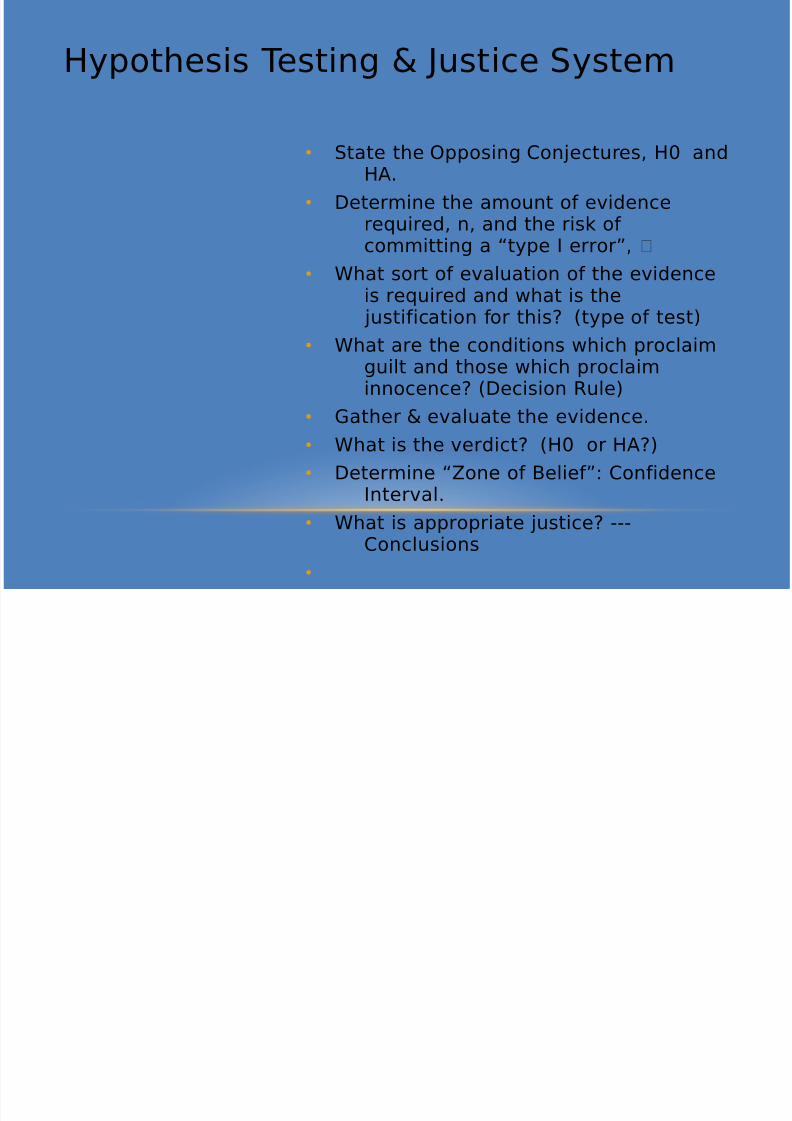
Hypothesis Testing & Justice System
• State the Opposing Conjectures, H0 andHA.
• Determine the amount of evidencerequired, n, and the risk of committing a “type I error”,
• What sort of evaluation of the evidenceis required and what is the justification for this? (type of test)
• What are the conditions which proclaimguilt and those which proclaiminnocence? (Decision Rule)
• Gather & evaluate the evidence.• What is the verdict? (H0 or HA?)
• Determine “Zone of Belief”: ConfidenceInterval.
• What is appropriate justice? ---
Conclusions•
8/8/2019 Hypothesis Testing1
http://slidepdf.com/reader/full/hypothesis-testing1 9/33
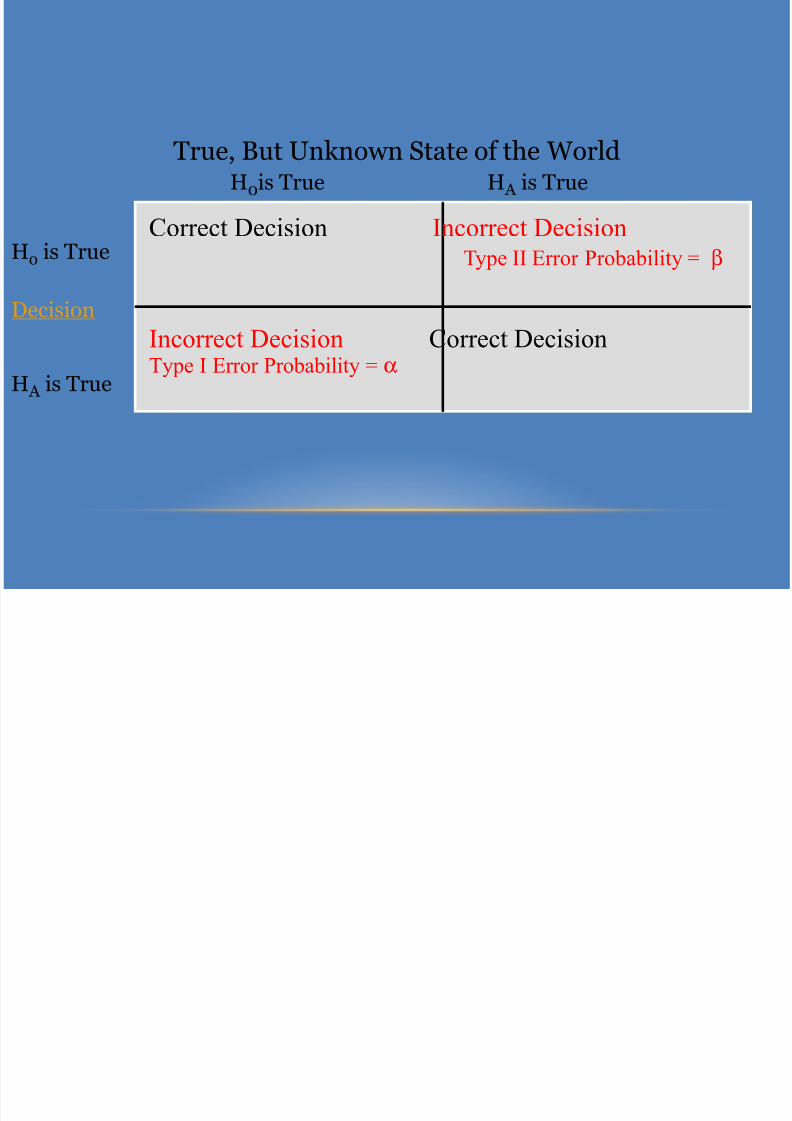
True, But Unknown State of the World
H0is True H A is True
Ho is True
Decision
H A is True
Correct Decision Incorrect Decision Type II Error Probability = β
Incorrect Decision Correct DecisionType I Error Probability = α

8/8/2019 Hypothesis Testing1
http://slidepdf.com/reader/full/hypothesis-testing1 10/33
α & β Have an Inverse Relationship
8/8/2019 Hypothesis Testing1
http://slidepdf.com/reader/full/hypothesis-testing1 11/33
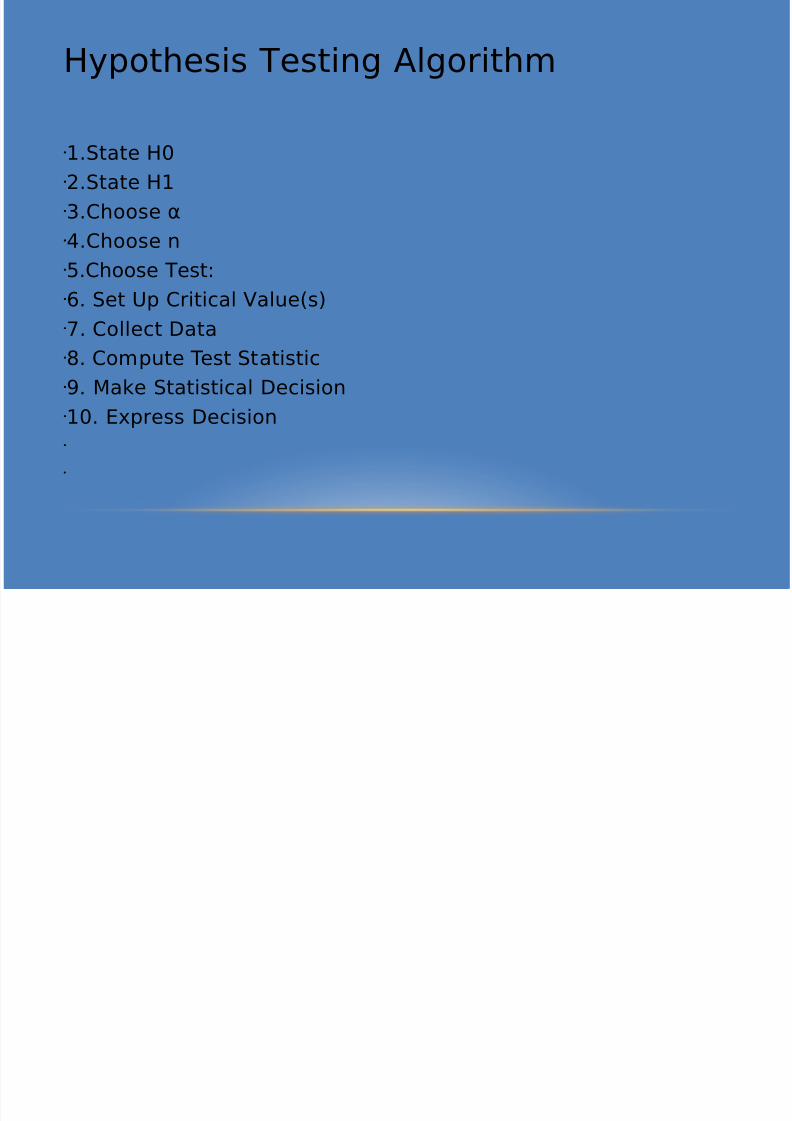
Hypothesis Testing Algorithm
1.State H0
2.State H1
3.Choose α
4.Choose n
5.Choose Test:6. Set Up Critical Value(s)
7. Collect Data
8. Compute Test Statistic
9. Make Statistical Decision
10. Express Decision
8/8/2019 Hypothesis Testing1
http://slidepdf.com/reader/full/hypothesis-testing1 12/33
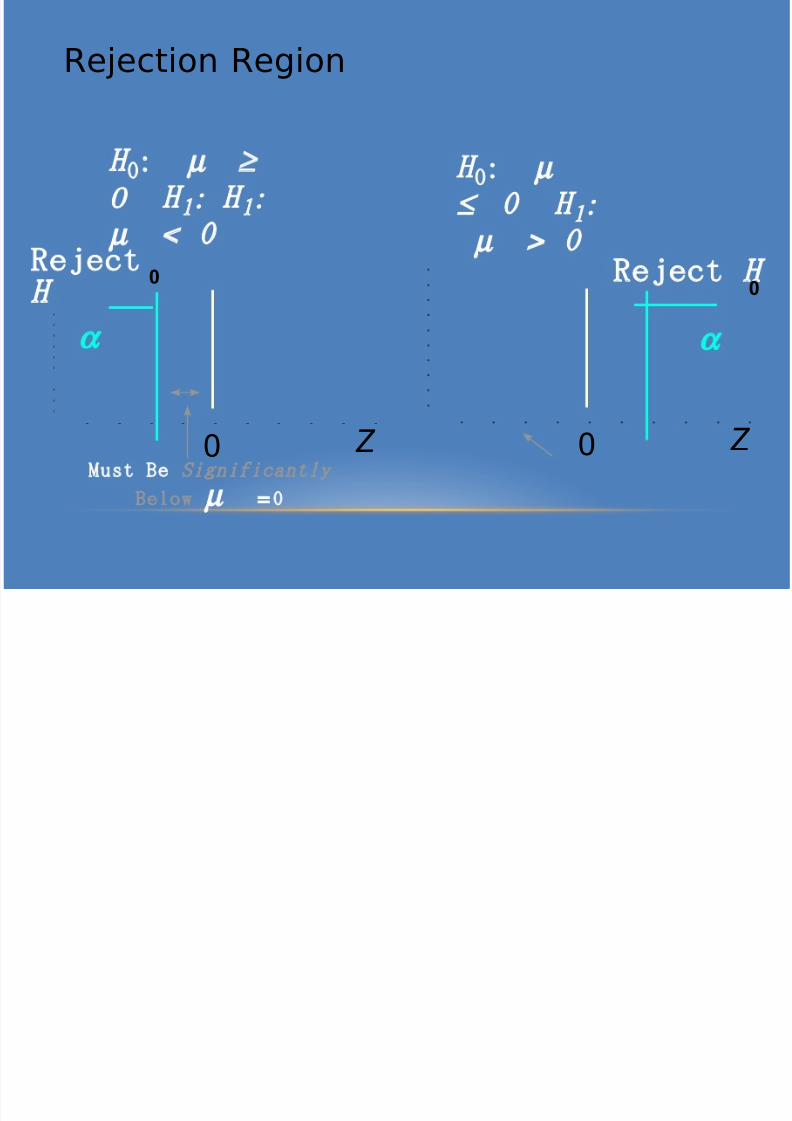
Rejection Region
Z 0
α
eject H0
Z 0
ejectH 0
α
H 0: µ ≥
0 H 1 : H 1 :
µ < 0
H 0: µ
≤ H 1 :
µ > 0
ust Be S i g n i f i c a n t l y
Below µ =0
8/8/2019 Hypothesis Testing1
http://slidepdf.com/reader/full/hypothesis-testing1 13/33
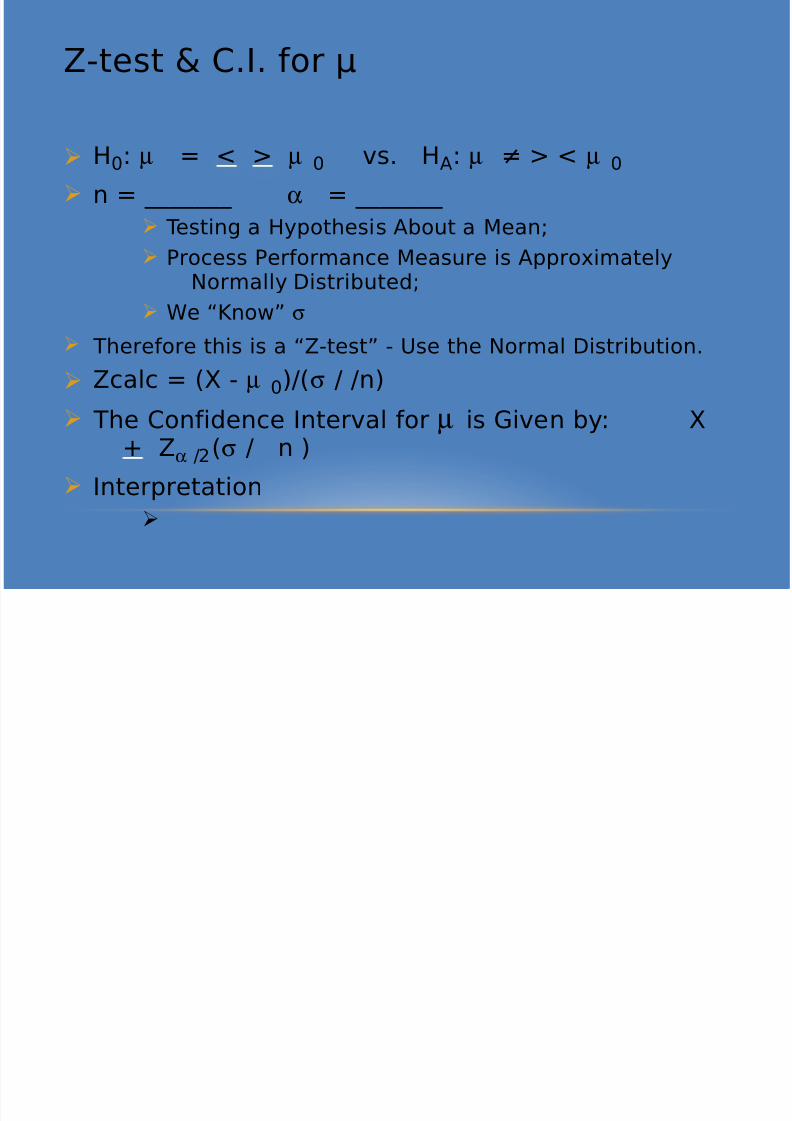
Z-test & C.I. for µ
Ø H0: µ = < > µ 0 vs. HA: µ ≠ > < µ 0
Ø n = _______ α = _______
Ø Testing a Hypothesis About a Mean;
Ø Process Performance Measure is Approximately
Normally Distributed;Ø We “Know” σ
Ø Therefore this is a “Z-test” - Use the Normal Distribution.
Ø Zcalc = (X - µ 0)/(σ / /n)
Ø The Confidence Interval for µ is Given by: X+ Zα /2(σ / n )
Ø Interpretation
Ø
8/8/2019 Hypothesis Testing1
http://slidepdf.com/reader/full/hypothesis-testing1 14/33
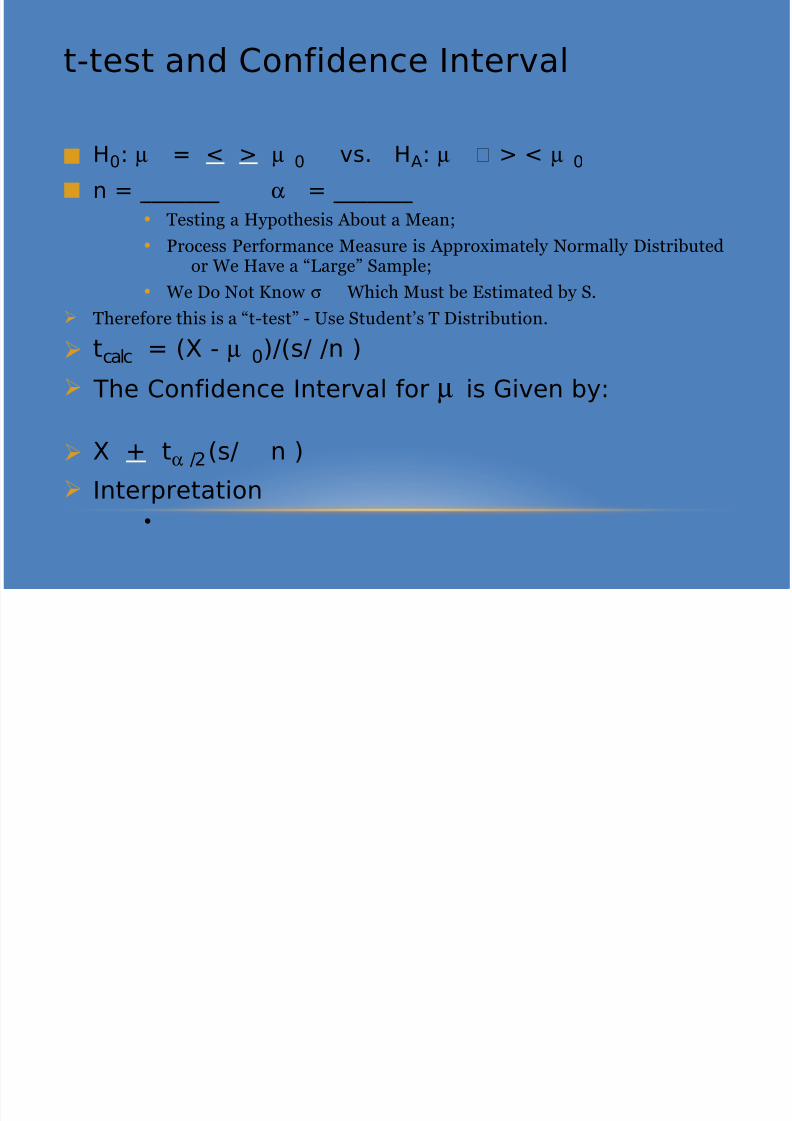
t-test and Confidence Interval
s H0: µ = < > µ 0 vs. HA: µ > < µ 0
s n = _______ α = _______
• Testing a Hypothesis About a Mean;
• Process Performance Measure is Approximately Normally Distributedor We Have a “Large” Sample;
• We Do Not Know σ Which Must be Estimated by S.
Ø Therefore this is a “t-test” - Use Student’s T Distribution.
Ø tcalc = (X - µ 0)/(s/ /n )
Ø The Confidence Interval for µ is Given by:
Ø X + tα /2(s/ n )
Ø Interpretation•
8/8/2019 Hypothesis Testing1
http://slidepdf.com/reader/full/hypothesis-testing1 15/33
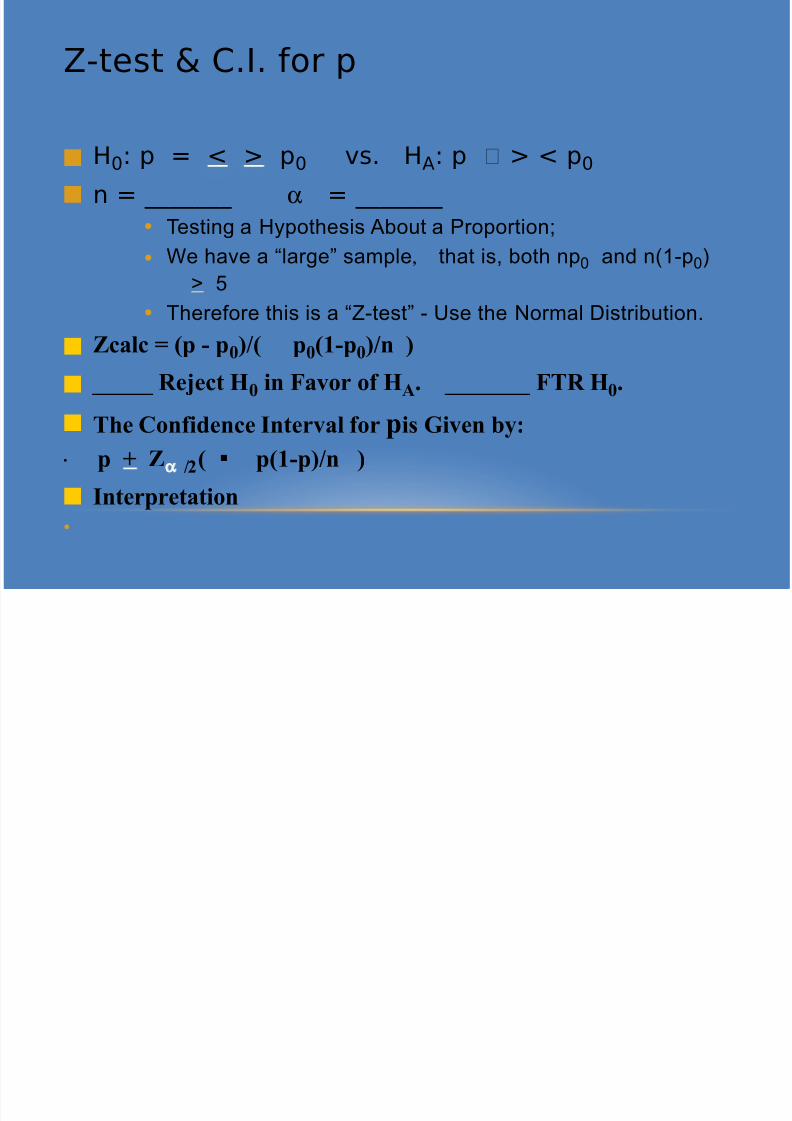
Z-test & C.I. for p
s H0: p = < > p0 vs. HA: p > < p 0
s n = _______ α = _______
• Testing a Hypothesis About a Proportion;
• We have a “large” sample, that is, both np0 and n(1-p0)
> 5• Therefore this is a “Z-test” - Use the Normal Distribution.
s Zcalc = (p - p0)/( p0(1-p0)/n )
s _____ Reject H0 in Favor of HA. _______ FTR H0.
s The Confidence Interval for pis Given by:
p + Zα /2( p(1-p)/n )
s Interpretation
•

8/8/2019 Hypothesis Testing1
http://slidepdf.com/reader/full/hypothesis-testing1 16/33
, .Advance Inc
Integrated CircuitManufacturing
&Methods Materials
8/8/2019 Hypothesis Testing1
http://slidepdf.com/reader/full/hypothesis-testing1 17/33
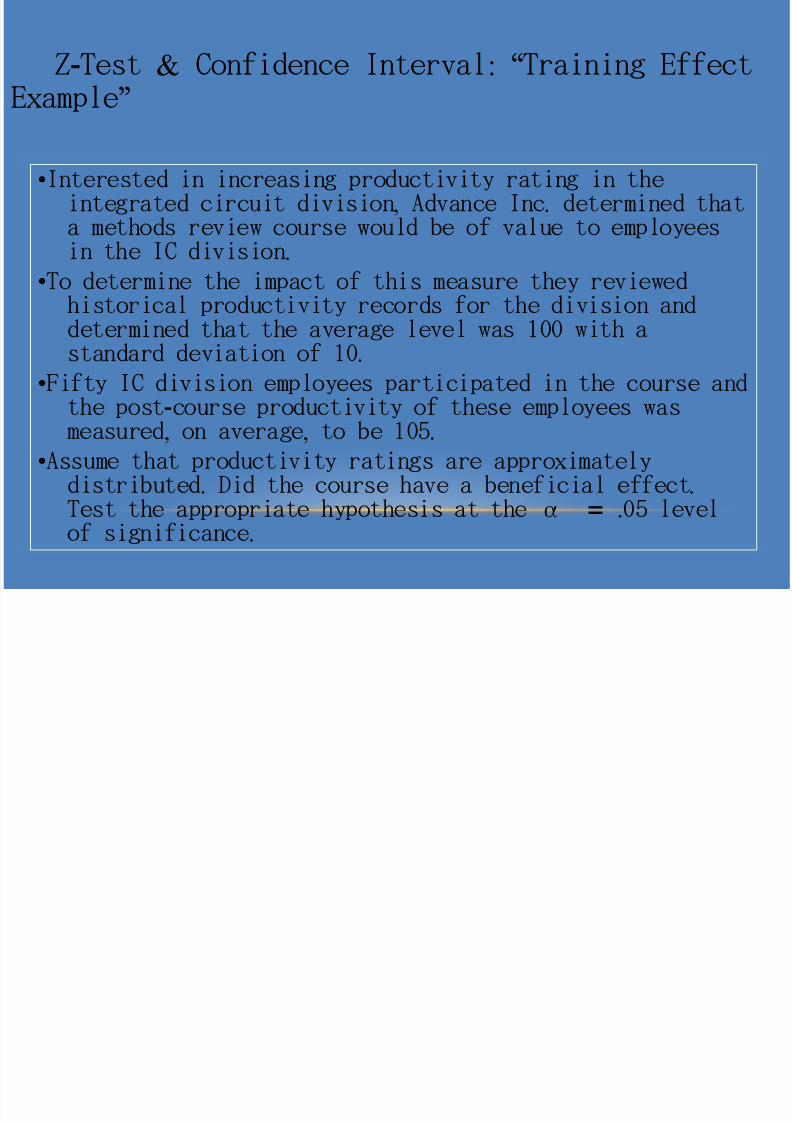
Interested in increasing productivity rating in the
, .integrated circuit division Advance Inc determined that a methods review course would be of value to employees
.in the IC division
To determine the impact of this measure they reviewed historical productivity records for the division and determined that the average level was 100 with a
.standard deviation of 10
Fifty IC division employees participated in the course and
-the post course productivity of these employees was, , .measured on average to be 105
Assume that productivity ratings are approximately. .distributed Did the course have a beneficial effect
Test the appropriate hypothesis at the α = .05 level.of significance
- & : “Z Test Confidence Interval Training Effect”Example
8/8/2019 Hypothesis Testing1
http://slidepdf.com/reader/full/hypothesis-testing1 18/33
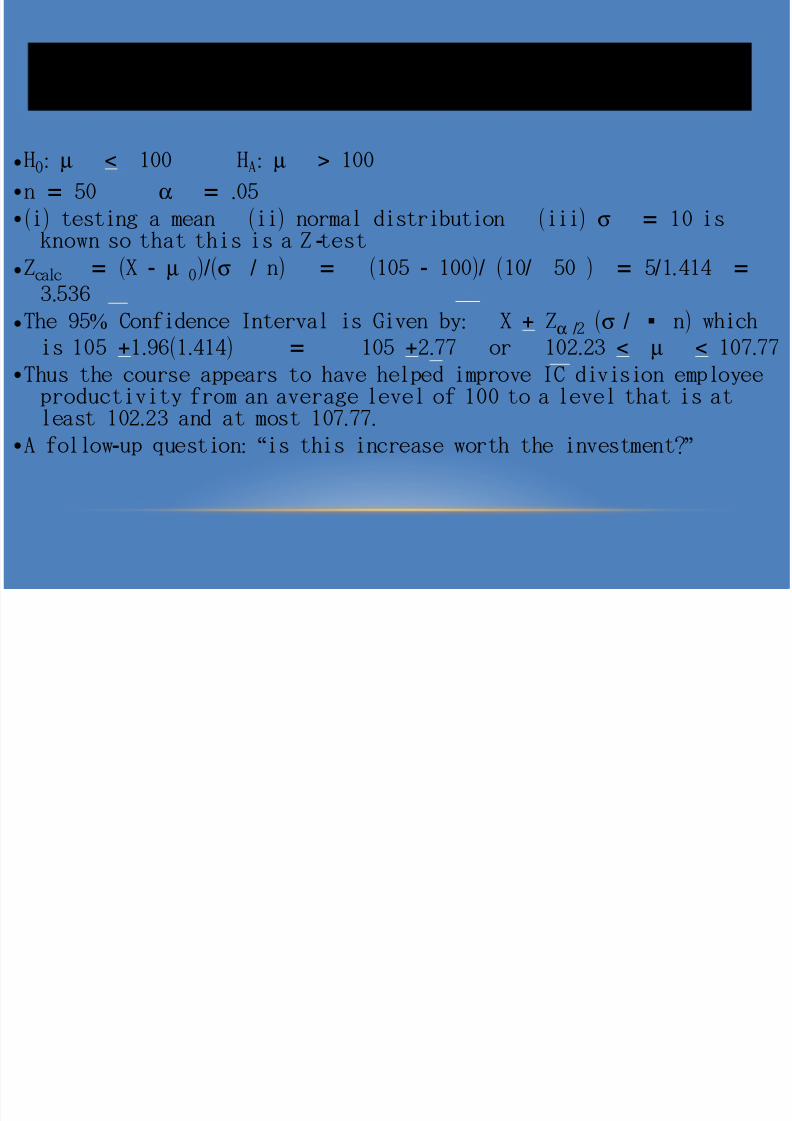
Training Effect Example
•H0: µ < 100 HA: µ > 100
• =n 50 α = .05
•( ) ( ) ( )i testing a mean ii normal distribution iii σ = 10 is-known so that this is a Z test
•Z
calc = ( -X
µ 0)/(σ / ) = ( - )/ ( / ) = / . =n 105 100 10 50 5 1 414
.3 536
• % :The 95 Confidence Interval is Given by X + Zα /2 (σ / )n which is 105 + . ( . ) =1 96 1 414 105 + . .2 77 or 102 23 < µ < .107 77
• Thus the course appears to have helped improve IC division employee productivity from an average level of 100 to a level that is at
. . .least 102 23 and at most 107 77• - : “ ”A follow up question is this increase worth the investment?

8/8/2019 Hypothesis Testing1
http://slidepdf.com/reader/full/hypothesis-testing1 19/33
Loan Application Processing
8/8/2019 Hypothesis Testing1
http://slidepdf.com/reader/full/hypothesis-testing1 20/33
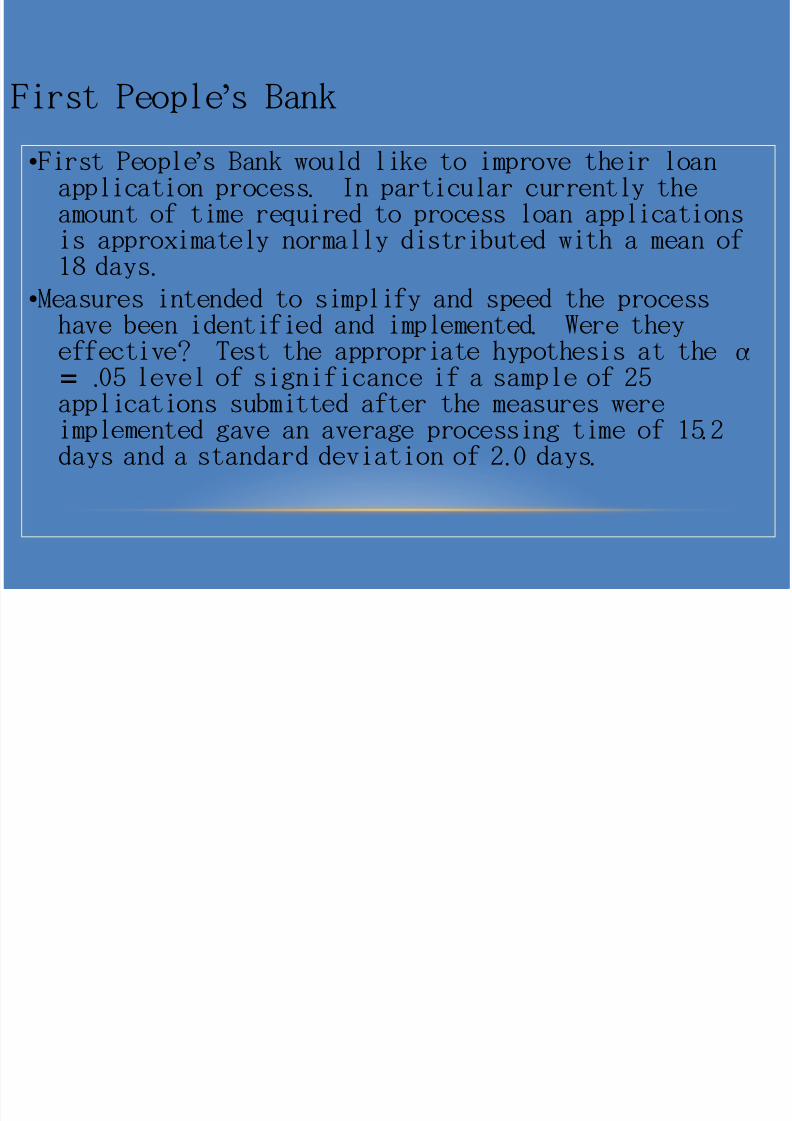
’First People s Bank
’First People s Bank would like to improve their loan.application process In particular currently the
amount of time required to process loan applications is approximately normally distributed with a mean of
.18 days Measures intended to simplify and speed the process.have been identified and implemented Were they
effective? Test the appropriate hypothesis at the α = .05 level of significance if a sample of 25
applications submitted after the measures were
.implemented gave an average processing time of 15 2. .days and a standard deviation of 2 0 days
8/8/2019 Hypothesis Testing1
http://slidepdf.com/reader/full/hypothesis-testing1 21/33
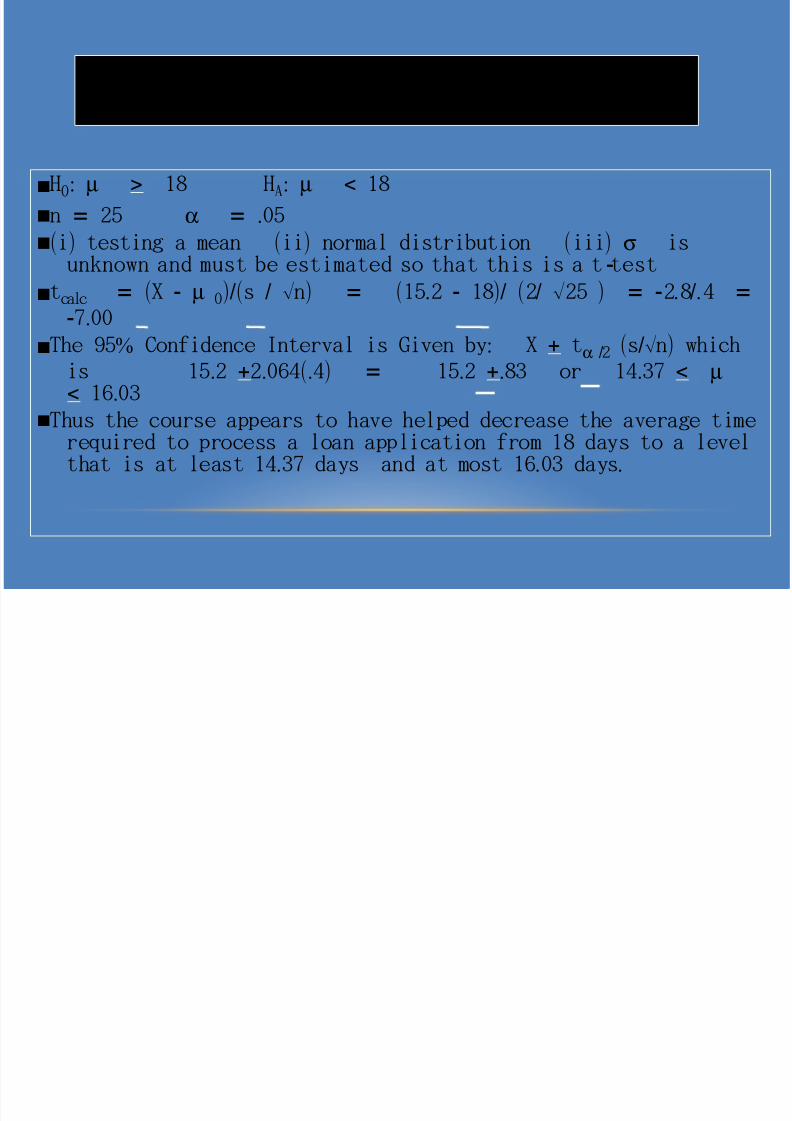
First People’s Bank
sH0: µ > 18 HA: µ < 18
s =n 25 α = .05s( ) ( ) ( )i testing a mean ii normal distribution iii σ is
-unknown and must be estimated so that this is a t test
stcalc = ( -X µ 0)/( / √ ) = ( . - )/ ( / √ ) = - . /. =s n 15 2 18 2 25 2 8 4- .7 00
s % :The 95 Confidence Interval is Given by X + tα /2 ( /√ )s n which.is 15 2 + . (. ) = .2 064 4 15 2 +. .83 or 14 37 < µ
< .16 03
s Thus the course appears to have helped decrease the average time required to process a loan application from 18 days to a level
. . .that is at least 14 37 days and at most 16 03 days
8/8/2019 Hypothesis Testing1
http://slidepdf.com/reader/full/hypothesis-testing1 22/33
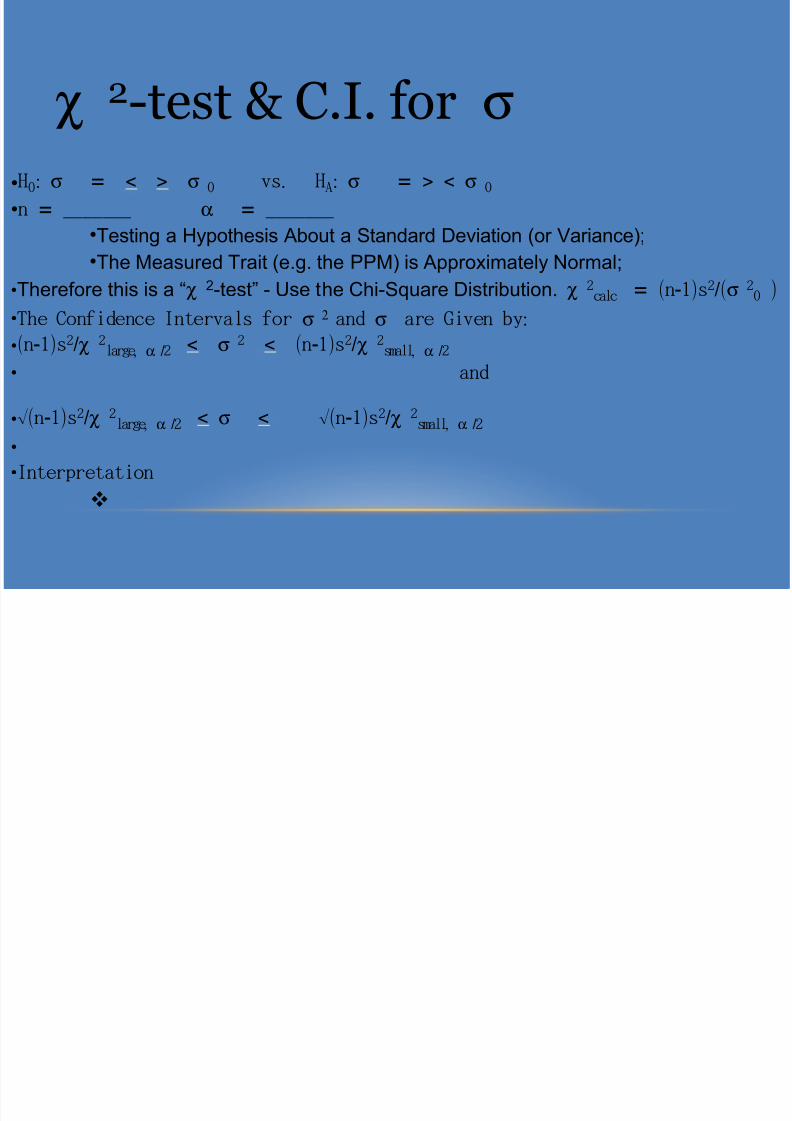
χ 2-test & C.I. for σ H0: σ = < > σ 0 .vs HA: σ = > < σ 0
=n _______ α = _______
Testing a Hypothesis About a Standard Deviation (or Variance);The Measured Trait (e.g. the PPM) is Approximately Normal;
Therefore this is a “χ 2-test” - Use the Chi-Square Distribution. χ 2calc = ( - )n 1 s2/(σ 2
0 )
The Confidence Intervals for σ 2 and σ :are Given by
( - )n 1 s2/χ 2,large α /2 < σ 2 < ( - )n 1 s2/χ 2
,small α /2
and
√( - )n 1 s2/χ 2 ,large α /2 < σ < √( - )n 1 s2/χ 2 ,small α /2
Interpretation
v
8/8/2019 Hypothesis Testing1
http://slidepdf.com/reader/full/hypothesis-testing1 23/33
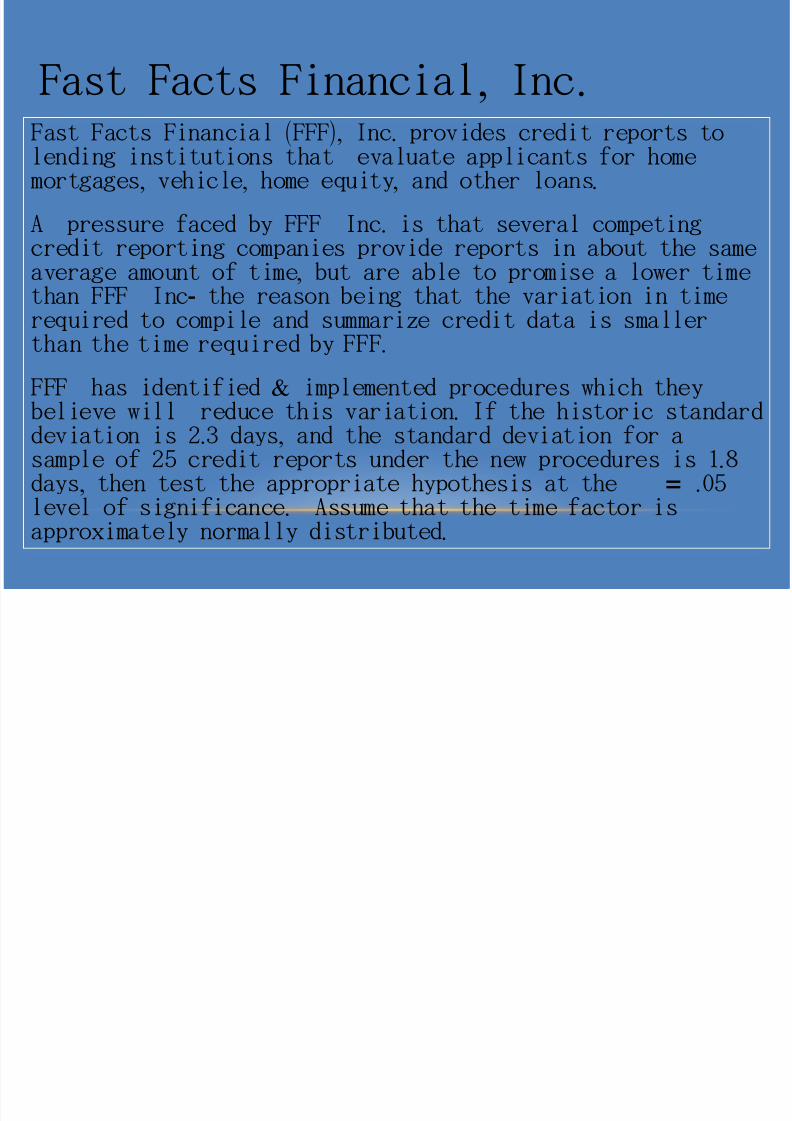
, .Fast Facts Financial Inc
( ), .Fast Facts Financial FFF Inc provides credit reports to lending institutions that evaluate applicants for home, , , .mortgages vehicle home equity and other loans
.A pressure faced by FFF Inc is that several competing credit reporting companies provide reports in about the same
,average amount of time but are able to promise a lower time-than FFF Inc the reason being that the variation in time required to compile and summarize credit data is smaller
.than the time required by FFF
&FFF has identified implemented procedures which they
.believe will reduce this variation If the historic standard. ,deviation is 2 3 days and the standard deviation for a.sample of 25 credit reports under the new procedures is 1 8
, = .days then test the appropriate hypothesis at the 05.level of significance Assume that the time factor is
.approximately normally distributed
8/8/2019 Hypothesis Testing1
http://slidepdf.com/reader/full/hypothesis-testing1 24/33
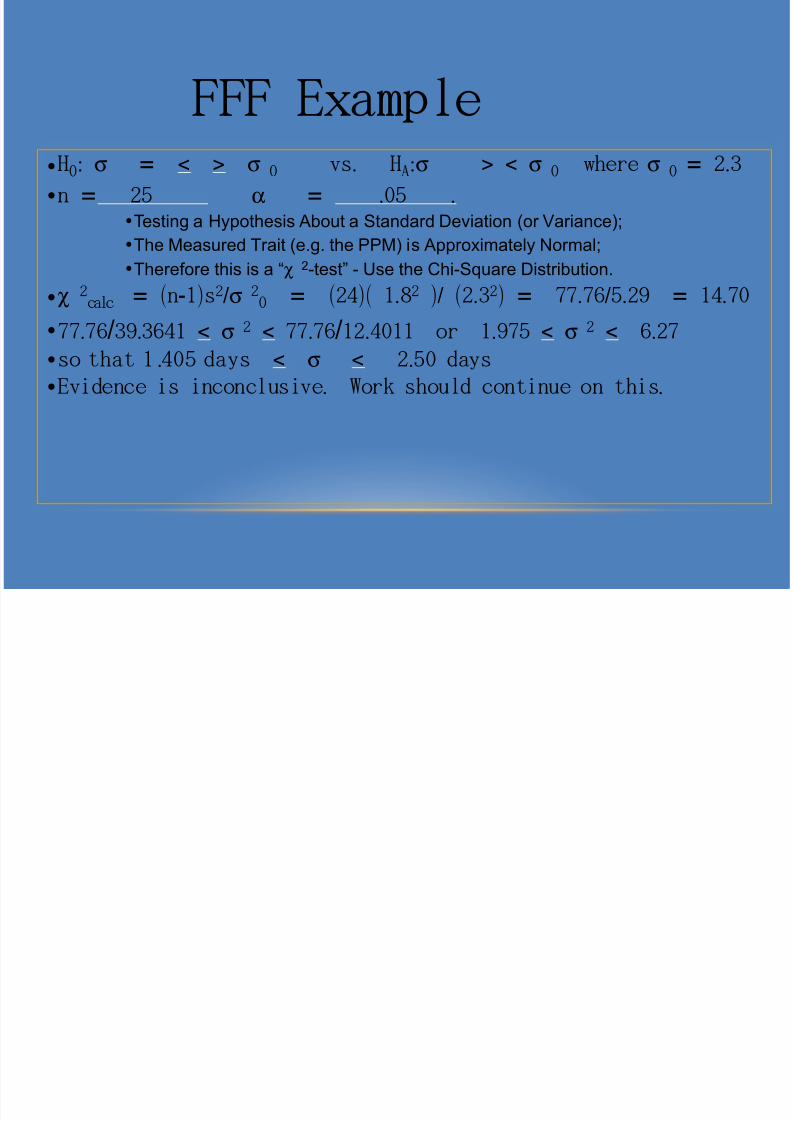
FFF Example•H0: σ = < > σ 0 .vs HA:σ > < σ 0 where σ 0 = .2 3
• =n 25 α = . .05•Testing a Hypothesis About a Standard Deviation (or Variance);•The Measured Trait (e.g. the PPM) is Approximately Normal;•Therefore this is a “χ 2-test” - Use the Chi-Square Distribution.
•χ 2calc = ( - )n 1 s2/σ 2
0 = ( )( .24 1 82 )/ ( .2 32) = . / . = .77 76 5 29 14 70
• .77 76/ .39 3641 < σ 2 < .77 76/ . .12 4011 or 1 975 < σ 2 < .6 27
• .so that 1 405 days < σ < .2 50 days
• . .Evidence is inconclusive Work should continue on this
8/8/2019 Hypothesis Testing1
http://slidepdf.com/reader/full/hypothesis-testing1 25/33
Two Sample Testsand
Confidence Intervals
8/8/2019 Hypothesis Testing1
http://slidepdf.com/reader/full/hypothesis-testing1 26/33
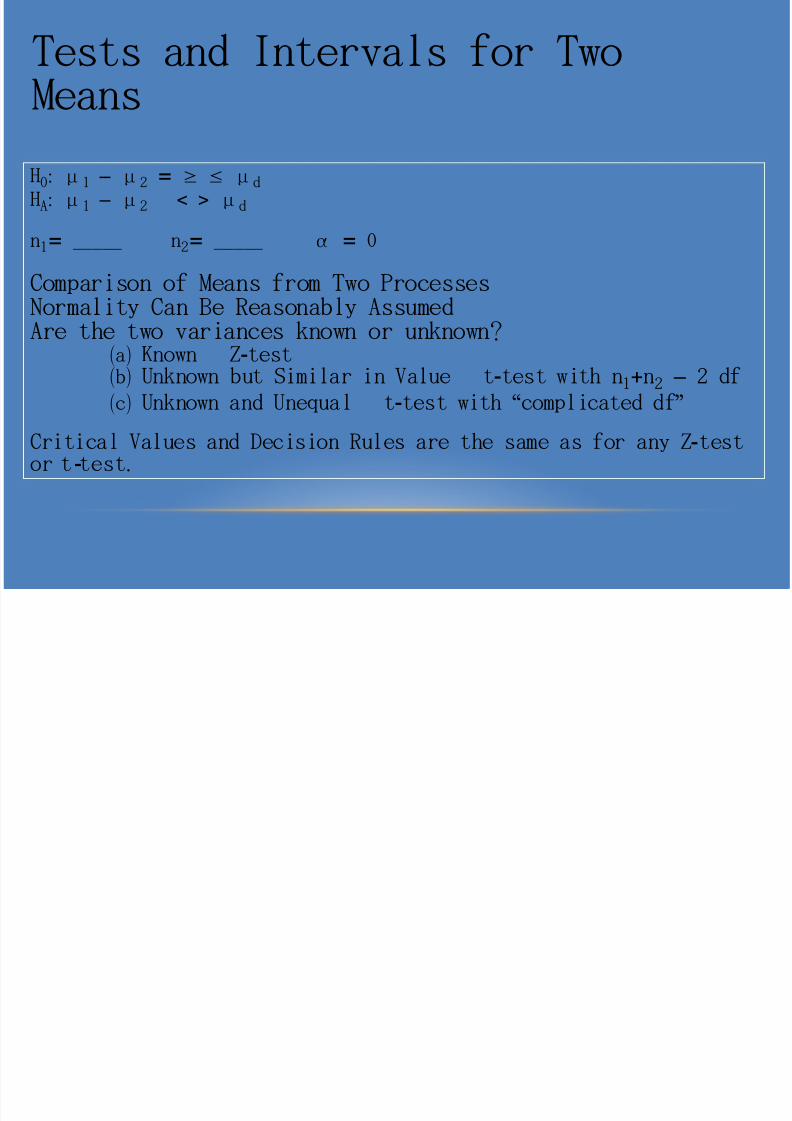
H0: μ1 – μ2 = ≥ ≤ μd
HA: μ1 – μ2 < > μd
n1= _____ n2= =_____ α 0
Comparison of Means from Two Processes Normality Can Be Reasonably Assumed
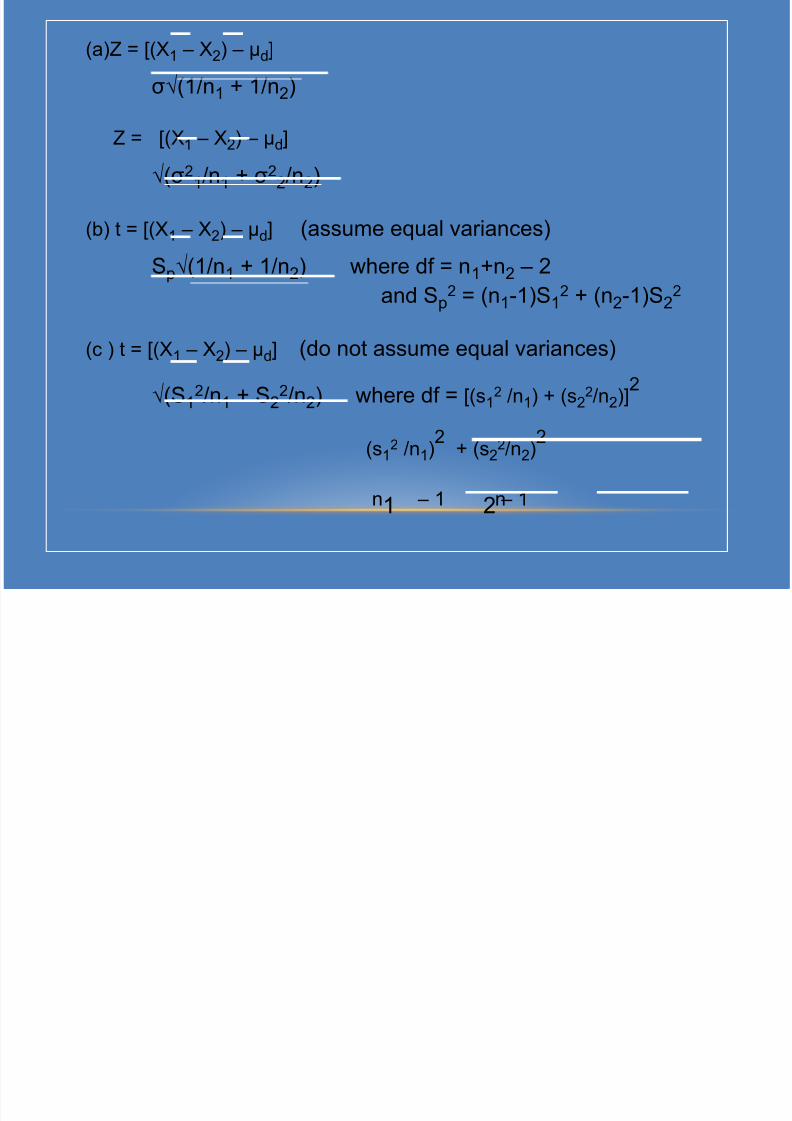
Are the two variances known or unknown?( )a -Known Z test( )b -Unknown but Similar in Value t test with n1+n2 – 2 df( )c - “ ”Unknown and Unequal t test with complicated df
-Critical Values and Decision Rules are the same as for any Z test- .or t test
Tests and Intervals for TwoMeans
8/8/2019 Hypothesis Testing1
http://slidepdf.com/reader/full/hypothesis-testing1 27/33
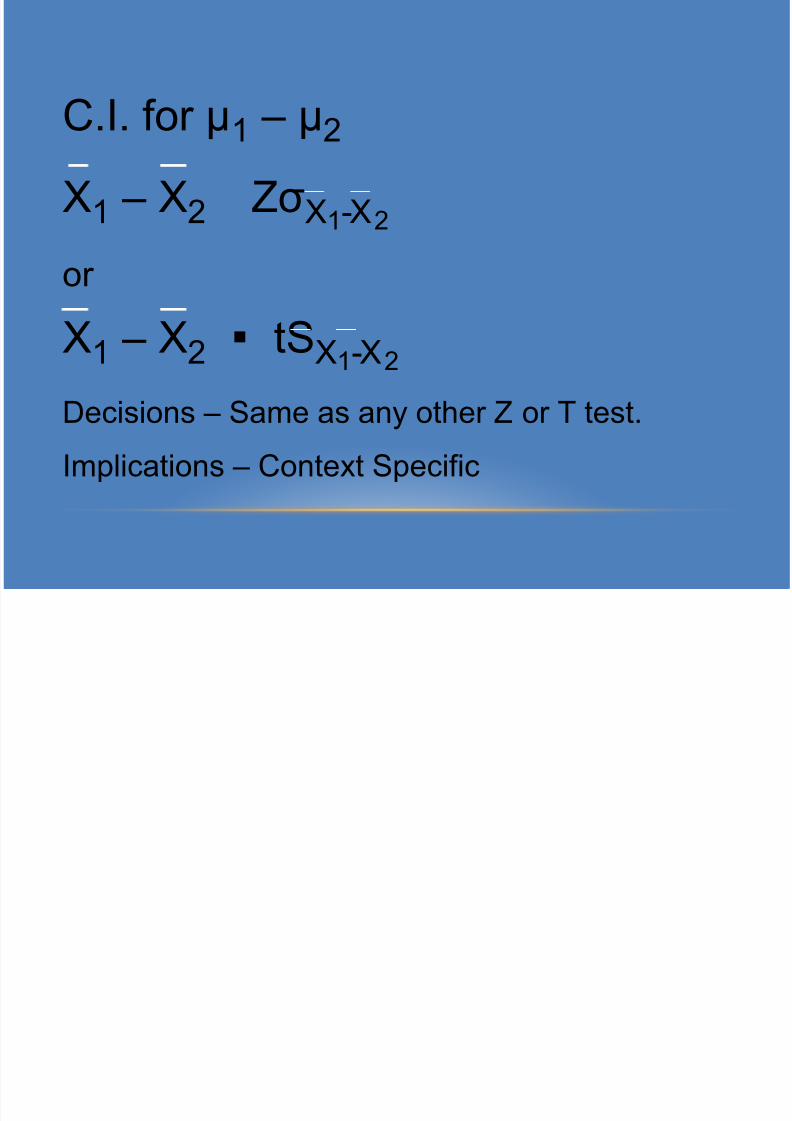
C.I. for μ1
– μ2
X1 – X2 ZσX1-X2
or X1 – X2 tS X1-X2
Decisions – Same as any other Z or T test.Implications – Context Specific
8/8/2019 Hypothesis Testing1
http://slidepdf.com/reader/full/hypothesis-testing1 28/33
(a)Z = [(X1 – X2) – μd]
σ√(1/n1 + 1/n2)
Z = [(X1 – X2) – μd] √(σ2
1/n1 + σ22/n2)
(b) t = [(X1 – X2) – μd] (assume equal variances)
Sp√(1/n
1+ 1/n
2) where df = n
1+n
2– 2
and Sp2 = (n1-1)S1
2 + (n2-1)S22
(c ) t = [(X1 – X2) – μd] (do not assume equal variances)
√(S12/n1 + S2
2/n2) where df = [(s12 /n1) + (s2
2/n2)]2
(s12 /n1)
2+ (s2
2/n2)2
n1 – 1 n2 – 1

8/8/2019 Hypothesis Testing1
http://slidepdf.com/reader/full/hypothesis-testing1 29/33
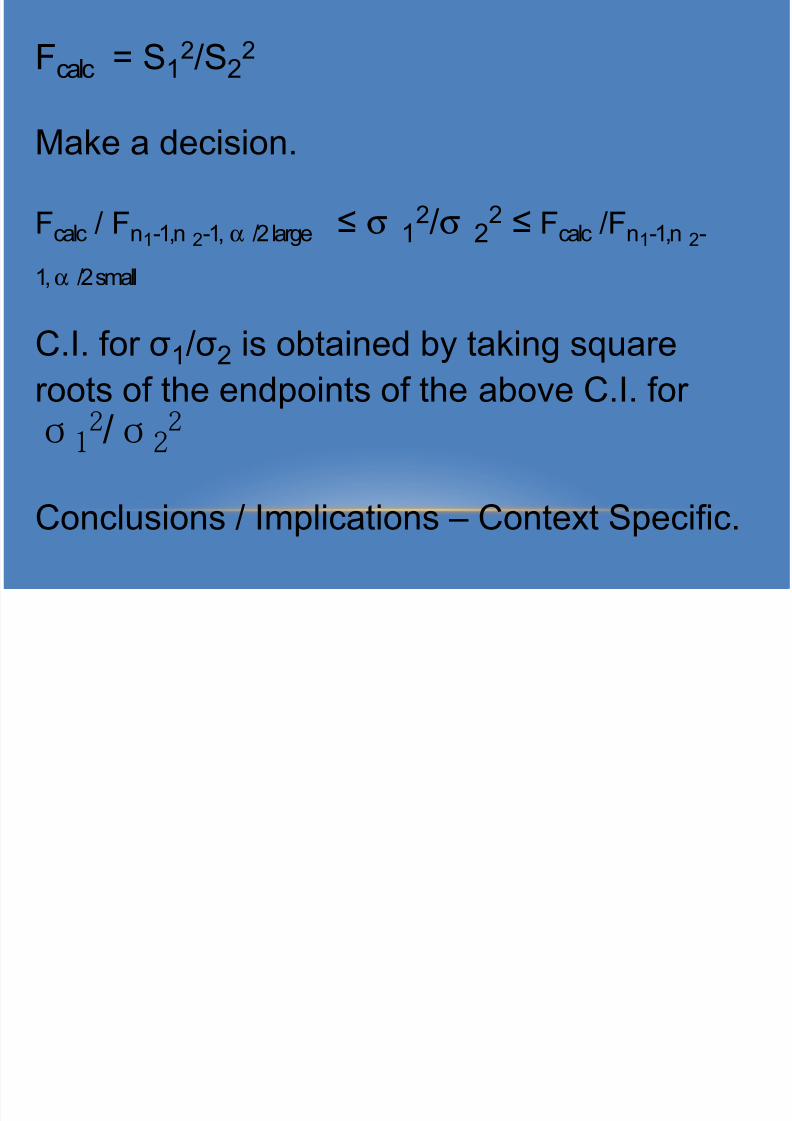
: -Equality of Variances The F Test
H0: σ 1 = ≥ ≤ σ 2 vs. HA: σ 1 < > σ 2
n1= _____ n2= _____ α = _____
Test of equality of variances F-test
8/8/2019 Hypothesis Testing1
http://slidepdf.com/reader/full/hypothesis-testing1 30/33
Fcalc = S12/S2
2
Make a decision.
Fcalc / Fn1-1,n 2-1, α /2 large ≤ σ 12/σ 2
2 ≤ Fcalc /Fn1-1,n 2-
1,α /2 small
C.I. for σ1/σ2 is obtained by taking squareroots of the endpoints of the above C.I. for
σ12/σ22
Conclusions / Implications – Context Specific.
8/8/2019 Hypothesis Testing1
http://slidepdf.com/reader/full/hypothesis-testing1 31/33
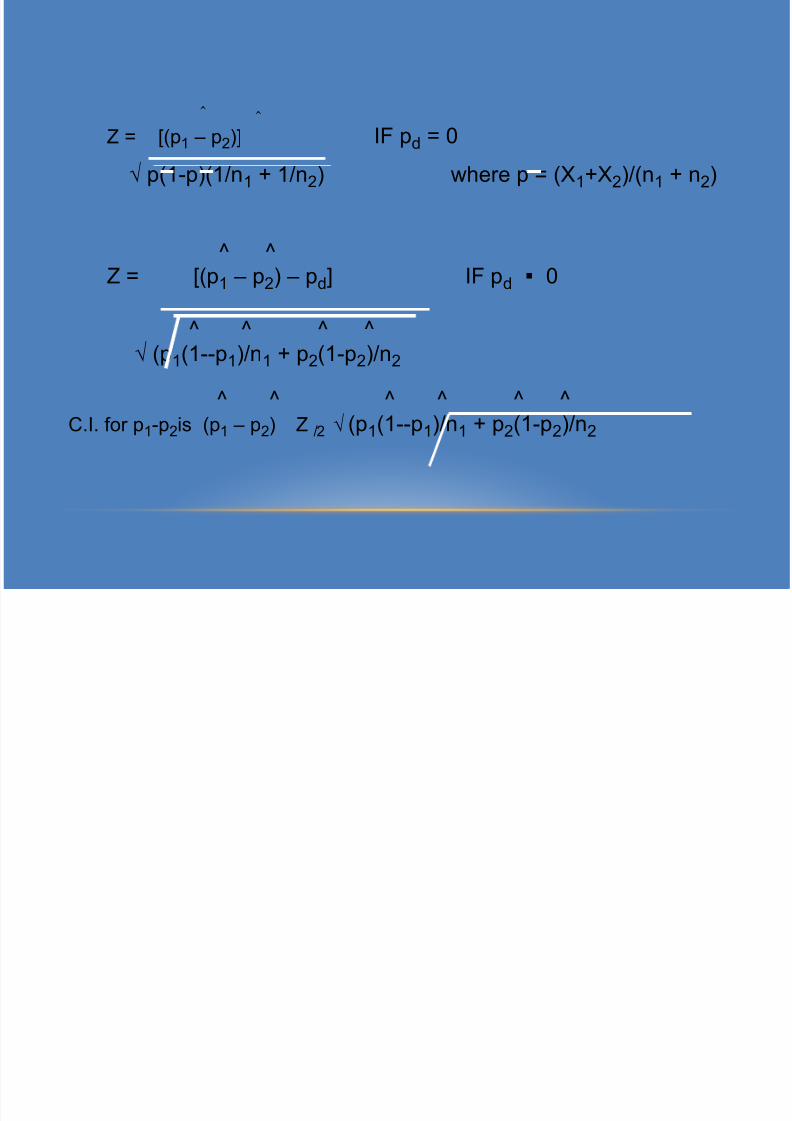
&Tests Intervals for TwoProportions
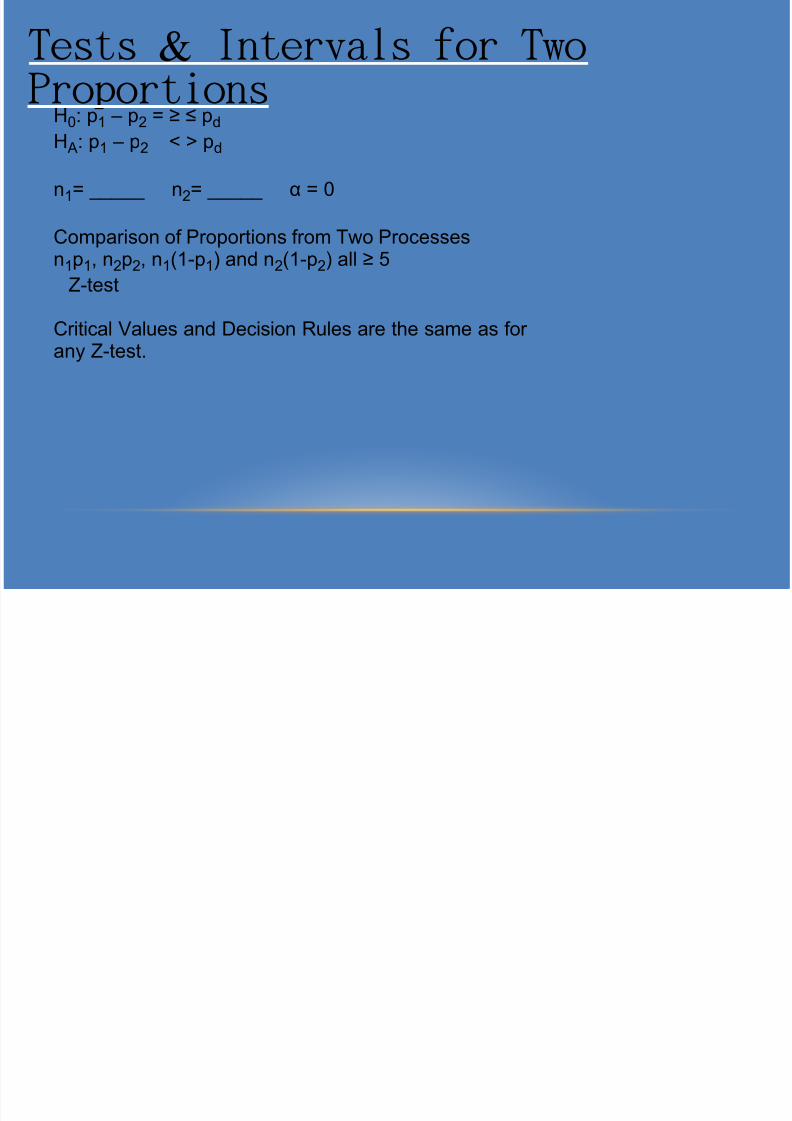
H0: p1 – p2 = ≥ ≤ pd
HA: p1 – p2 < > pd
n1= _____ n2= _____ α = 0
Comparison of Proportions from Two Processesn1p1, n2p2, n1(1-p1) and n2(1-p2) all ≥ 5
Z-test
Critical Values and Decision Rules are the same as for any Z-test.
8/8/2019 Hypothesis Testing1
http://slidepdf.com/reader/full/hypothesis-testing1 32/33
Z = [(p1 – p2)] IF pd = 0 √ p(1-p)(1/n1 + 1/n2) where p = (X1+X2)/(n1 + n2)
^ ^
Z = [(p1 – p2) – pd] IF pd 0
^ ^ ^ ^ √ (p1(1--p1)/n1 + p2(1-p2)/n2
^ ^ ^ ^ ^ ^C.I. for p1-p2is (p1 – p2) Z /2 √ (p1(1--p1)/n1 + p2(1-p2)/n2
^ ^

8/8/2019 Hypothesis Testing1
http://slidepdf.com/reader/full/hypothesis-testing1 33/33
THANK YOU!