HYPOTHESIS TESTING - UWGHYPOTHESIS TESTING STEPS IN HYPOTHESIS TESTING Step 1: State the Hypotheses...
38
HYPOTHESIS TESTING Frances Chumney, PhD
Transcript of HYPOTHESIS TESTING - UWGHYPOTHESIS TESTING STEPS IN HYPOTHESIS TESTING Step 1: State the Hypotheses...
HYPOTHESIS TESTING Frances Chumney, PhD
CONTENT OUTLINE
Logic of Hypothesis Testing
Error & Alpha
Hypothesis Tests
Effect Size
Statistical Power
HYPOTHESIS TESTING 2
HYPOTHESIS TESTING
LOGIC OF HYPOTHESIS TESTING
how we conceptualize hypotheses
3
HYPOTHESIS TESTING
HYPOTHESIS TESTING LOGIC
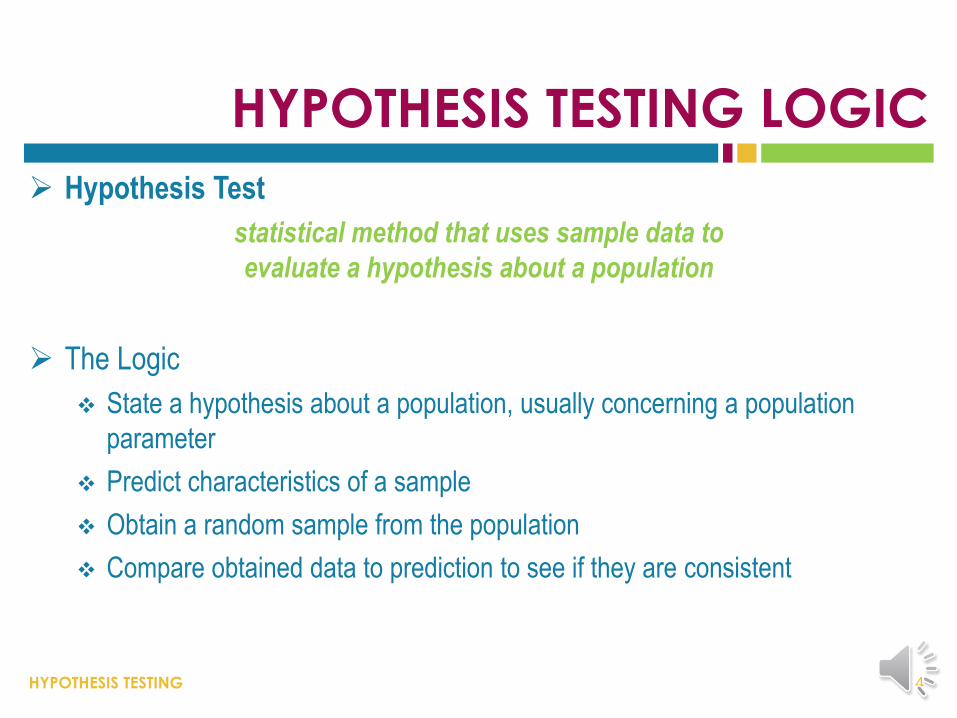
Hypothesis Test
statistical method that uses sample data to
evaluate a hypothesis about a population
The Logic
State a hypothesis about a population, usually concerning a population
parameter
Predict characteristics of a sample
Obtain a random sample from the population
Compare obtained data to prediction to see if they are consistent
4
HYPOTHESIS TESTING
STEPS IN HYPOTHESIS TESTING
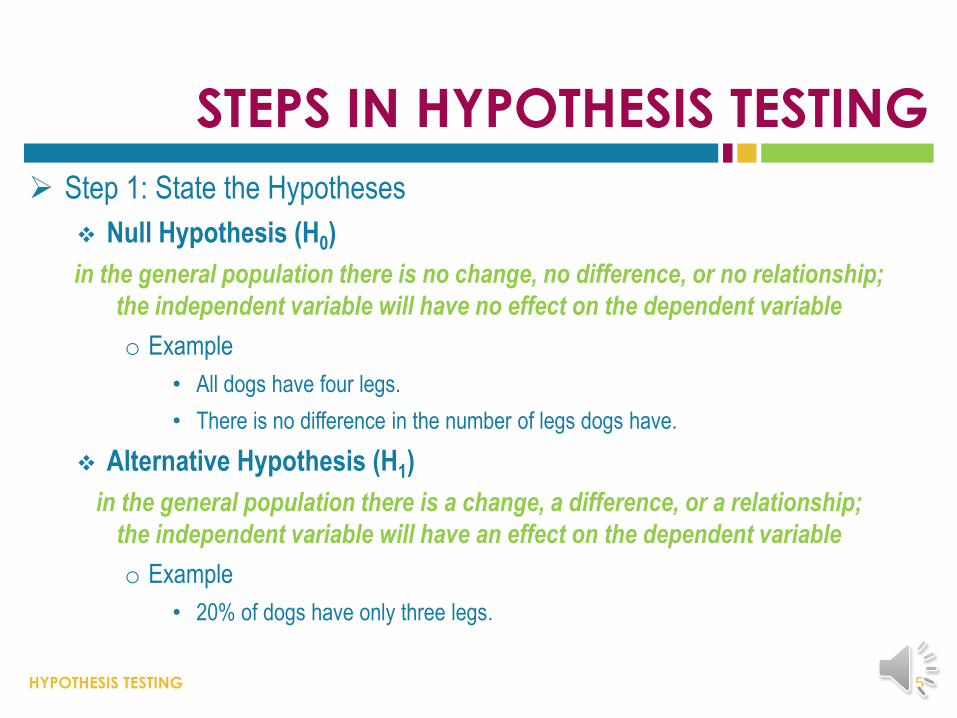
Step 1: State the Hypotheses
Null Hypothesis (H0)
in the general population there is no change, no difference, or no relationship;
the independent variable will have no effect on the dependent variable
o Example
• All dogs have four legs.
• There is no difference in the number of legs dogs have.
Alternative Hypothesis (H1)
in the general population there is a change, a difference, or a relationship;
the independent variable will have an effect on the dependent variable
o Example
• 20% of dogs have only three legs.
5
HYPOTHESIS TESTING
STEP 1: STATE THE HYPOTHESES (EXAMPLE)
Example
6
How to Ace a
Statistics Exam
little known facts about
the positive impact of
alcohol on memory
during “cram” sessions
HYPOTHESIS TESTING
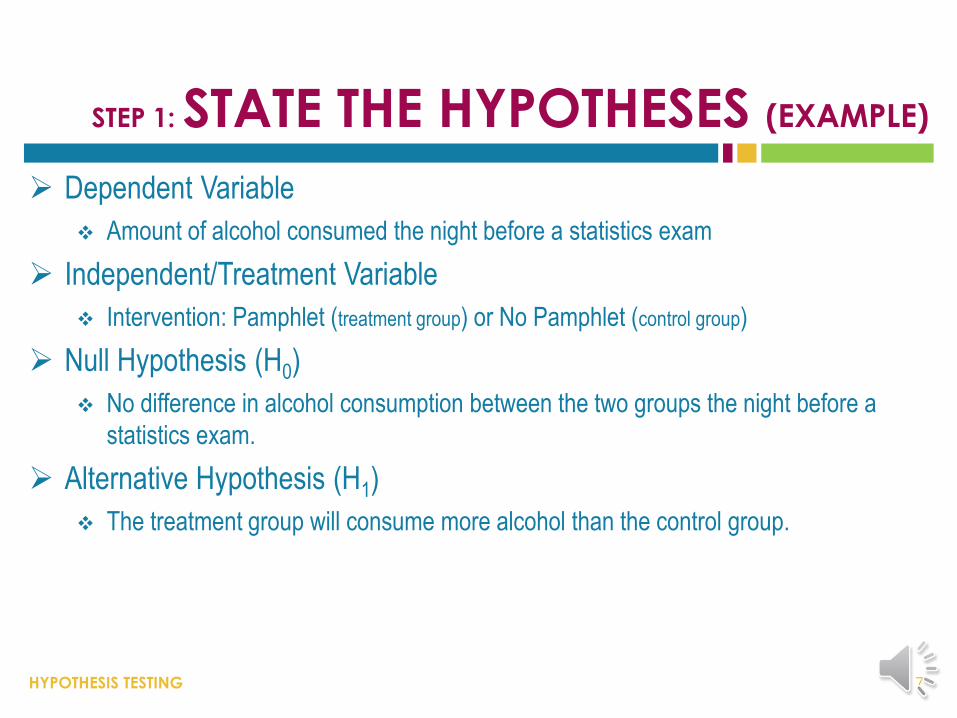
STEP 1: STATE THE HYPOTHESES (EXAMPLE)
Dependent Variable
Amount of alcohol consumed the night before a statistics exam
Independent/Treatment Variable
Intervention: Pamphlet (treatment group) or No Pamphlet (control group)
Null Hypothesis (H0)
No difference in alcohol consumption between the two groups the night before a
statistics exam.
Alternative Hypothesis (H1)
The treatment group will consume more alcohol than the control group.
7
HYPOTHESIS TESTING
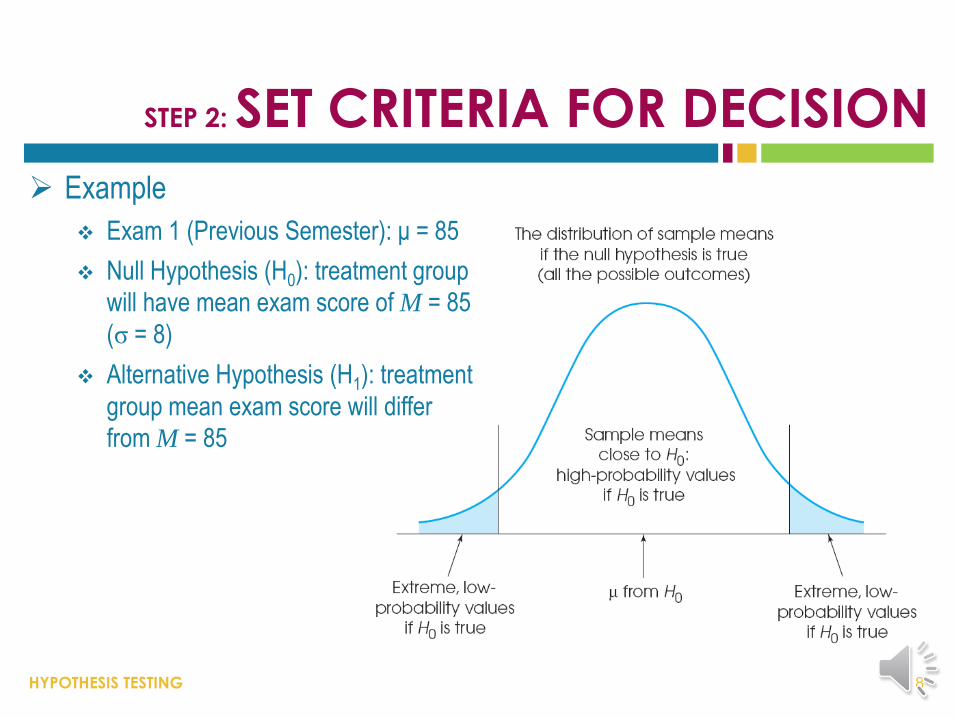
STEP 2: SET CRITERIA FOR DECISION
Example
Exam 1 (Previous Semester): μ = 85
Null Hypothesis (H0): treatment group
will have mean exam score of M = 85
(σ = 8)
Alternative Hypothesis (H1): treatment
group mean exam score will differ
from M = 85
8
HYPOTHESIS TESTING
STEP 2: SET CRITERIA FOR DECISION
Alpha Level/Level of Significance
probability value used to define the (unlikely) sample outcomes
if the null hypothesis is true; e.g., α = .05, α = .01, α = .001
Critical Region
extreme sample values that are very unlikely to be
obtained if the null hypothesis is true
Boundaries determined by alpha level
If sample data falls within this region (the shaded tails), reject the null
hypothesis
9
HYPOTHESIS TESTING
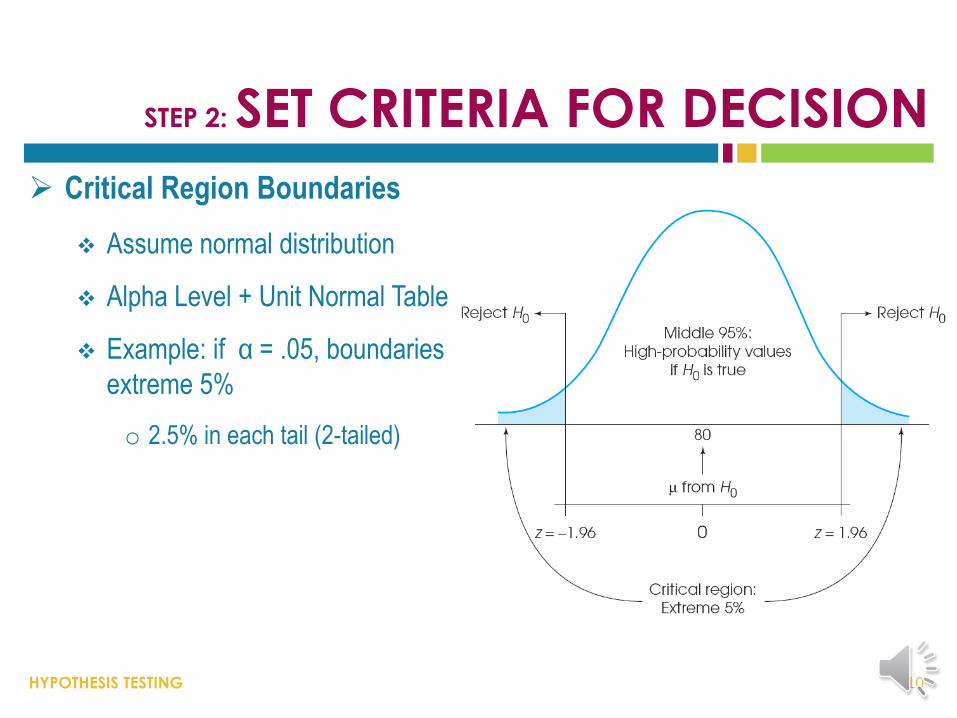
STEP 2: SET CRITERIA FOR DECISION
Critical Region Boundaries
Assume normal distribution
Alpha Level + Unit Normal Table
Example: if α = .05, boundaries of critical region divide middle 95% from
extreme 5%
o 2.5% in each tail (2-tailed)
10
HYPOTHESIS TESTING
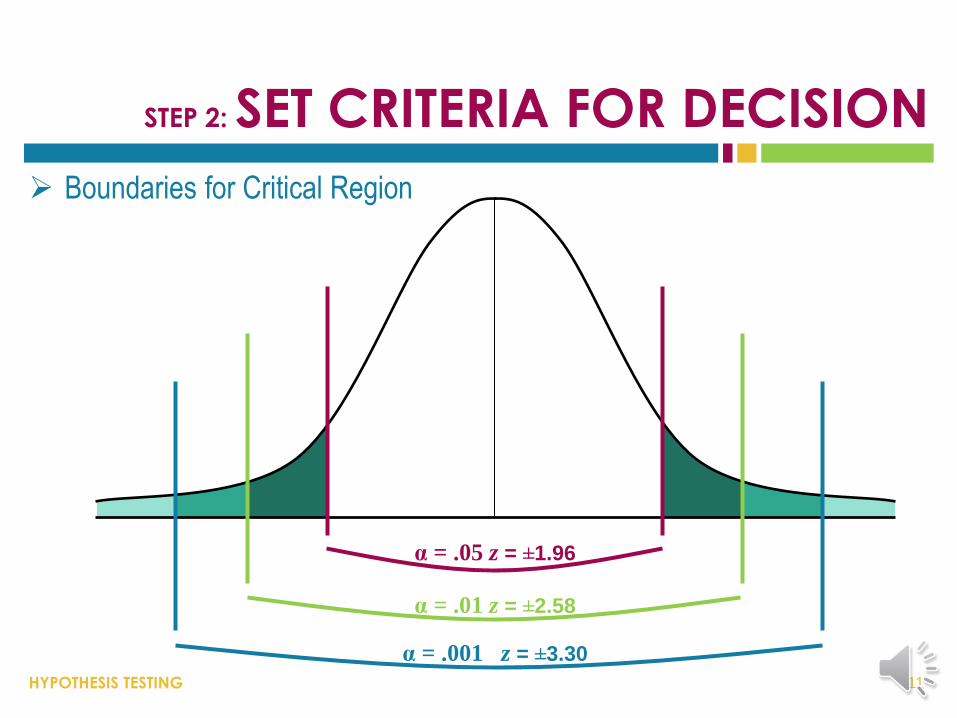
STEP 2: SET CRITERIA FOR DECISION
Boundaries for Critical Region
11
α = .001 z = ±3.30
α = .01 z = ±2.58
α = .05 z = ±1.96
HYPOTHESIS TESTING
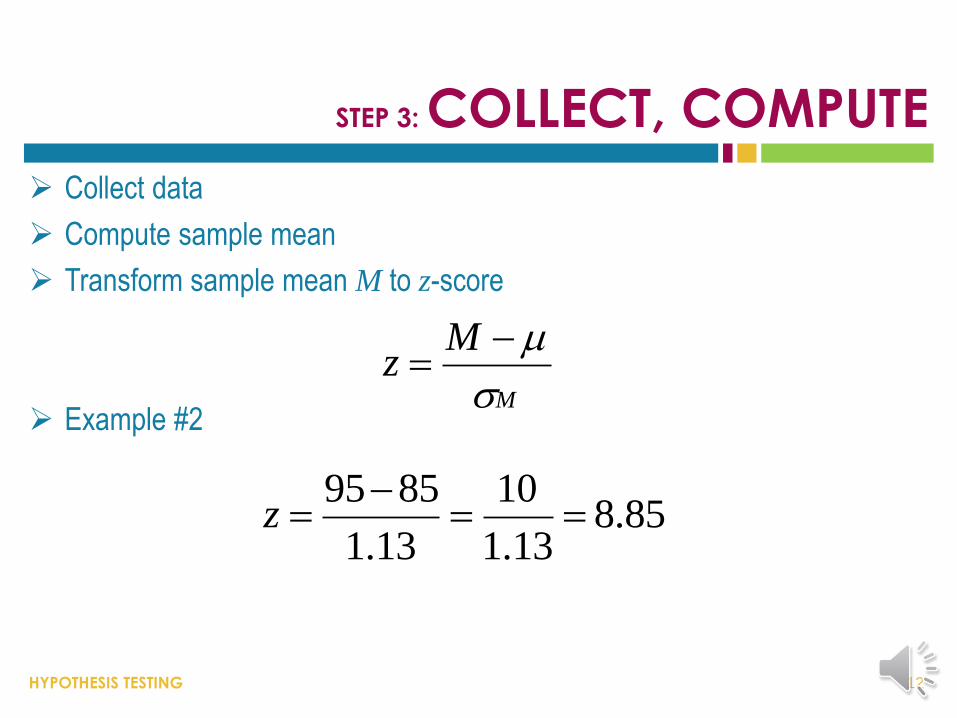
STEP 3: COLLECT, COMPUTE
Collect data
Compute sample mean
Transform sample mean M to z-score
Example #2
12
M
Mz
85.813.1
10
13.1
8595
z
HYPOTHESIS TESTING
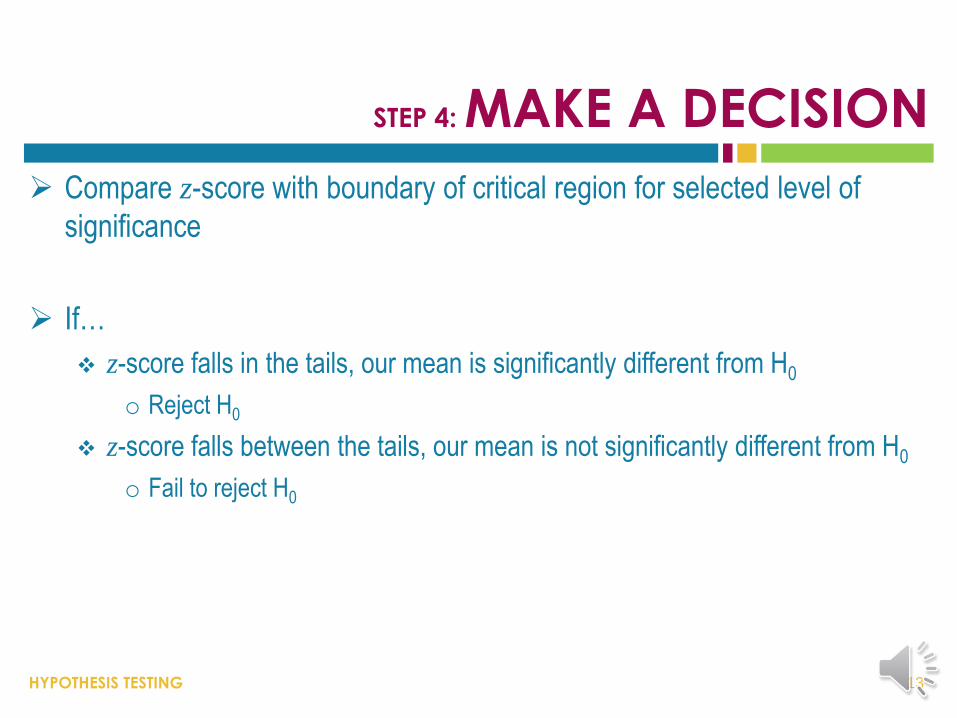
STEP 4: MAKE A DECISION
Compare z-score with boundary of critical region for selected level of
significance
If…
z-score falls in the tails, our mean is significantly different from H0
o Reject H0
z-score falls between the tails, our mean is not significantly different from H0
o Fail to reject H0
13
HYPOTHESIS TESTING
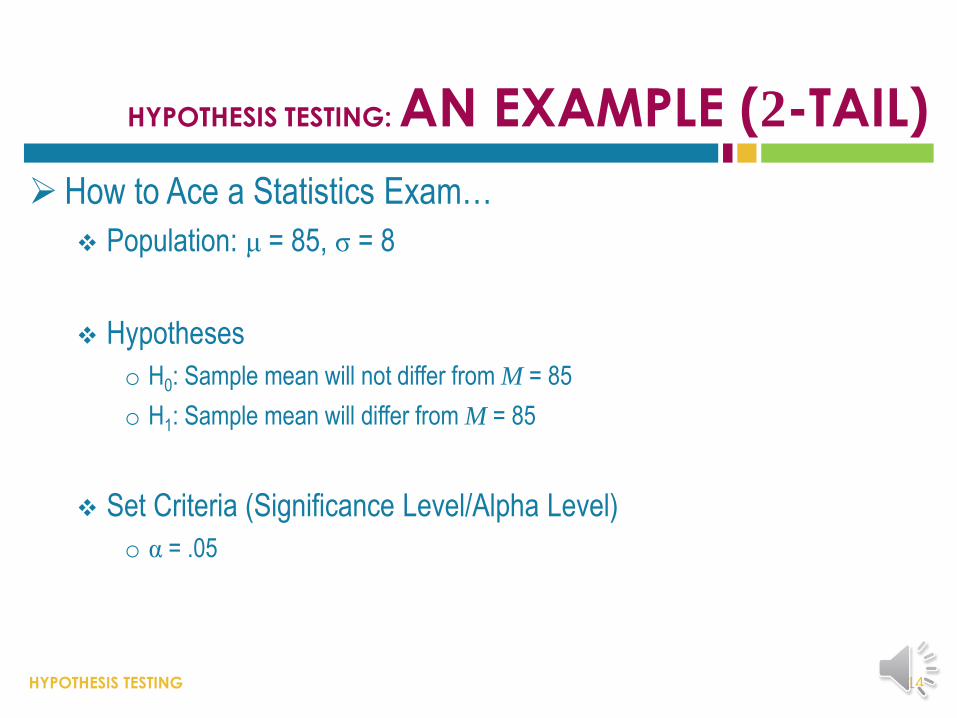
HYPOTHESIS TESTING: AN EXAMPLE (2-TAIL)
How to Ace a Statistics Exam…
Population: μ = 85, σ = 8
Hypotheses
o H0: Sample mean will not differ from M = 85
o H1: Sample mean will differ from M = 85
Set Criteria (Significance Level/Alpha Level)
o α = .05
14
HYPOTHESIS TESTING
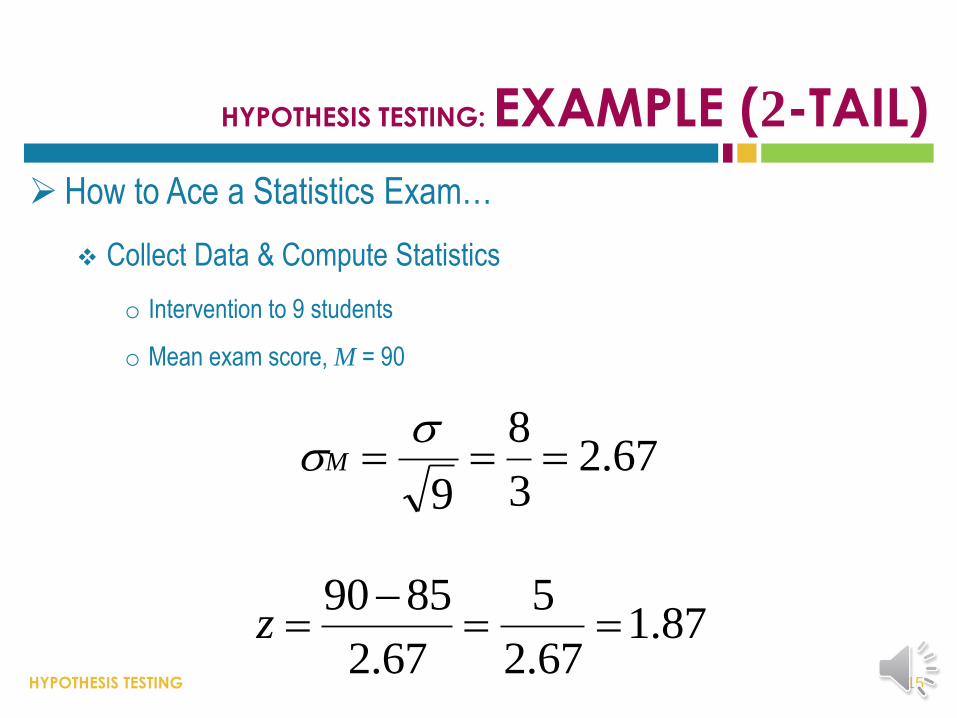
HYPOTHESIS TESTING: EXAMPLE (2-TAIL)
How to Ace a Statistics Exam…
Collect Data & Compute Statistics
o Intervention to 9 students
o Mean exam score, M = 90
15
67.23
8
9
M
87.167.2
5
67.2
8590
z
HYPOTHESIS TESTING
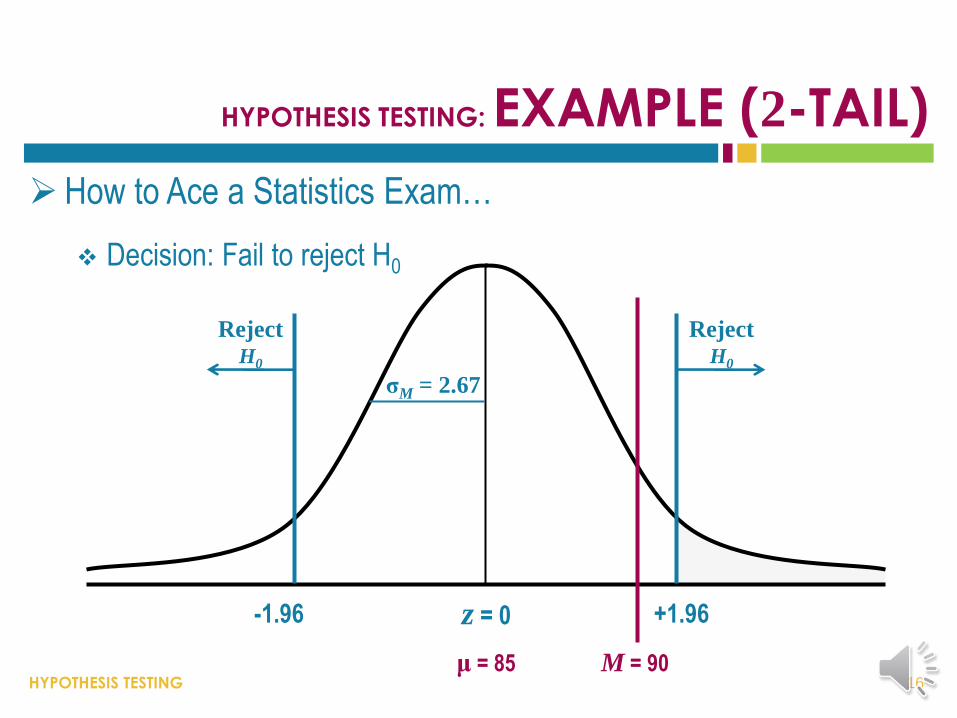
HYPOTHESIS TESTING: EXAMPLE (2-TAIL)
How to Ace a Statistics Exam…
Decision: Fail to reject H0
16
σM = 2.67
μ = 85 M = 90
Reject H0
-1.96 z = 0 +1.96
Reject H0
HYPOTHESIS TESTING
REVISITING Z-SCORE STATISTICS
A Test Statistic
Single, specific statistic
Calculated from the sample data
Used to test H0
Rule of Thumb…
Large values of z
o Sample data pry DID NOT occur by chance – result of IV
Small values of z
o Sample data pry DID occur by chance – not result of IV
17
HYPOTHESIS TESTING
ERROR & ALPHA
uncertainty leads to error
18
HYPOTHESIS TESTING
UNCERTAINTY & ERROR
Hypothesis Testing = Inferential Process
LOTS of room for error
Types of Error
Type I Error
Type II Error
19
HYPOTHESIS TESTING
TYPE 1 ERRORS
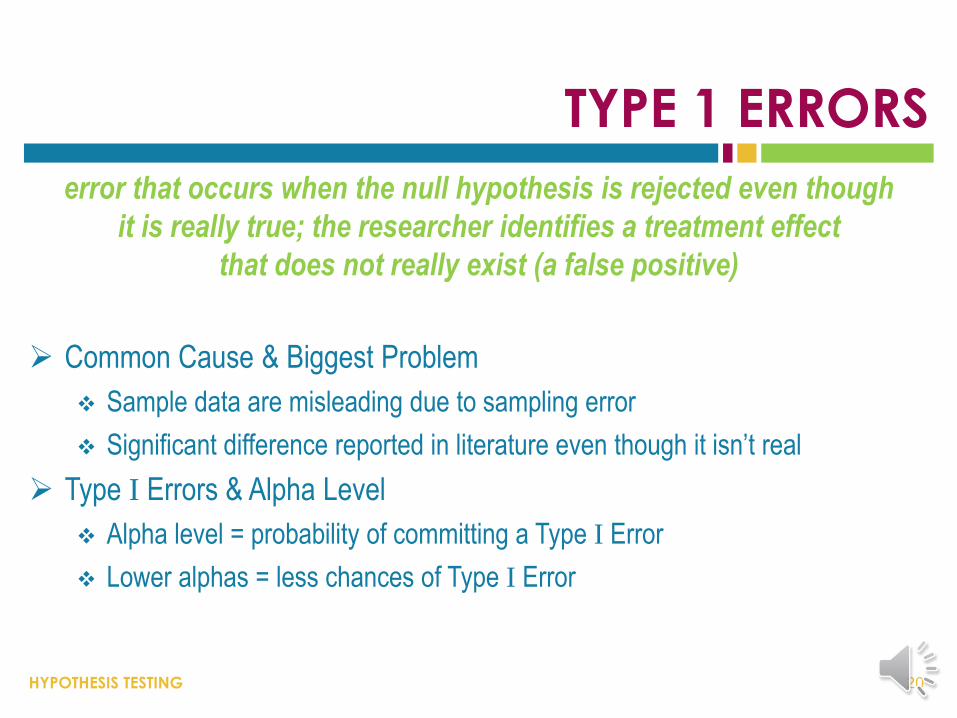
error that occurs when the null hypothesis is rejected even though
it is really true; the researcher identifies a treatment effect
that does not really exist (a false positive)
Common Cause & Biggest Problem
Sample data are misleading due to sampling error
Significant difference reported in literature even though it isn’t real
Type I Errors & Alpha Level
Alpha level = probability of committing a Type I Error
Lower alphas = less chances of Type I Error
20
HYPOTHESIS TESTING
TYPE II ERRORS
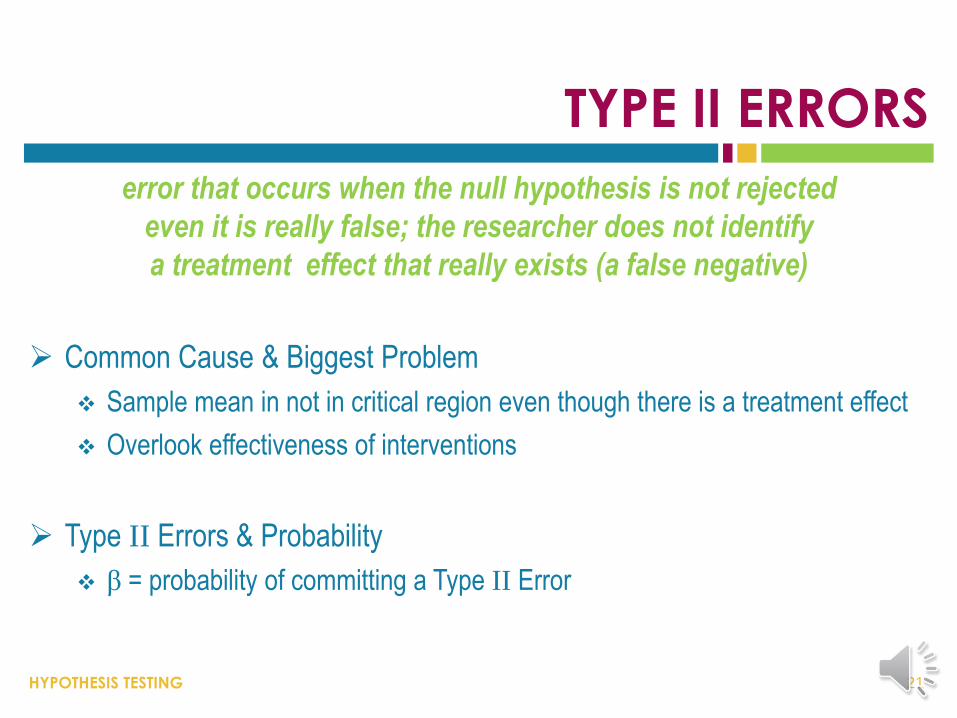
error that occurs when the null hypothesis is not rejected
even it is really false; the researcher does not identify
a treatment effect that really exists (a false negative)
Common Cause & Biggest Problem
Sample mean in not in critical region even though there is a treatment effect
Overlook effectiveness of interventions
Type II Errors & Probability
β = probability of committing a Type II Error
21
HYPOTHESIS TESTING
TYPE I & TYPE II ERRORS
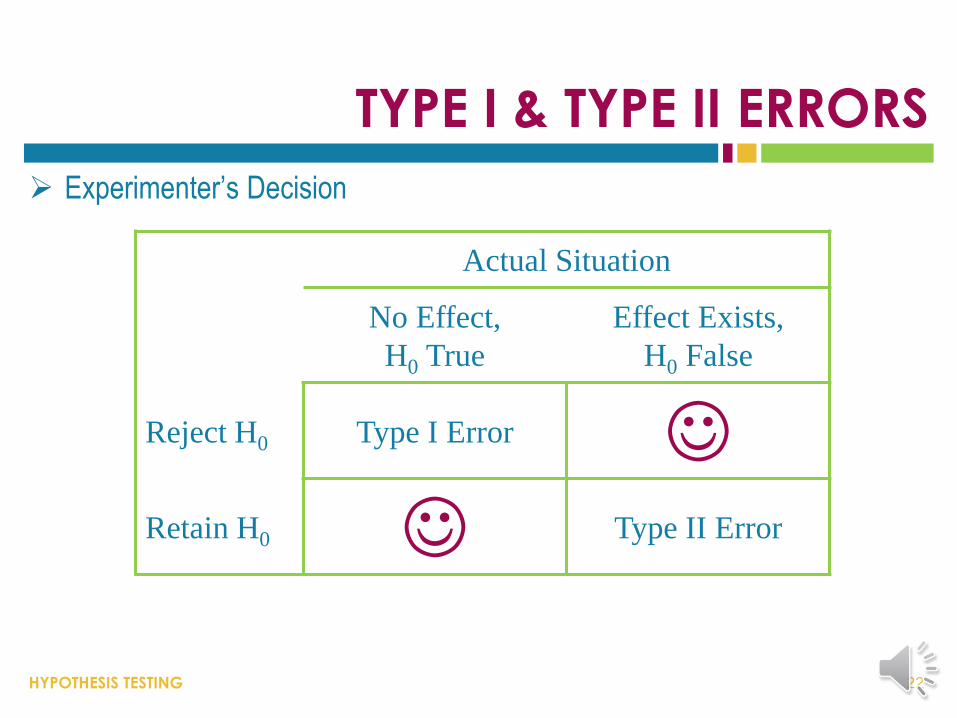
Experimenter’s Decision
22
Actual Situation
No Effect,
H0 True
Effect Exists,
H0 False
Reject H0 Type I Error Retain H0 Type II Error
HYPOTHESIS TESTING
SELECTING AN ALPHA LEVEL
Functions of Alpha Level
Critical region boundaries
Probability of a Type I error
Primary Concern in Alpha Selection
Minimize risk of Type I Error without maximizing risk of Type II Error
Common Alpha Levels
α = .05, α = .01, α = .001
23
HYPOTHESIS TESTING
HYPOTHESIS TESTS
testing null hypotheses
24
HYPOTHESIS TESTING
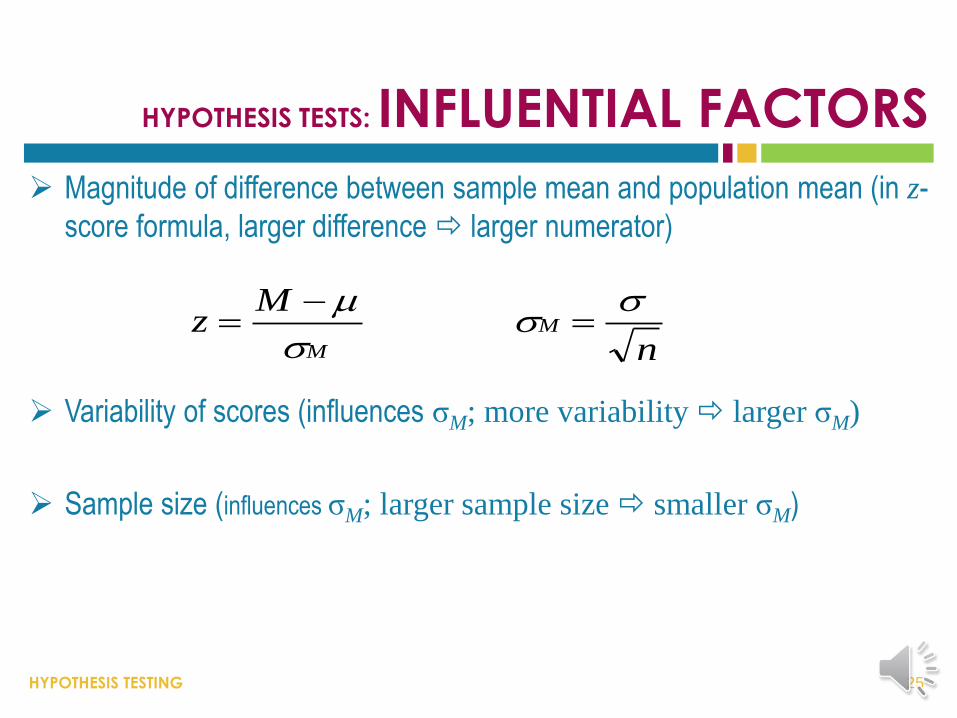
HYPOTHESIS TESTS: INFLUENTIAL FACTORS
Magnitude of difference between sample mean and population mean (in z-
score formula, larger difference larger numerator)
Variability of scores (influences σM; more variability larger σM)
Sample size (influences σM; larger sample size smaller σM)
25
M
Mz
nM
HYPOTHESIS TESTING
HYPOTHESIS TESTS: ASSUMPTIONS
Random Sampling
Independent Observations
Value of σ is Constant
Despite treatment
Normal sampling distribution
26
HYPOTHESIS TESTING
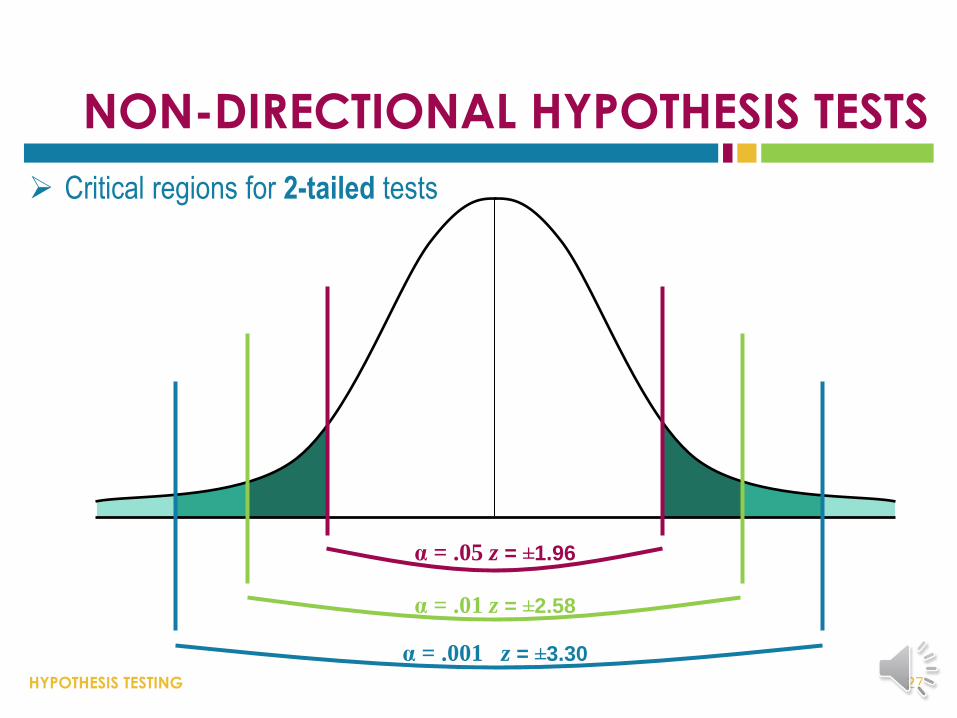
NON-DIRECTIONAL HYPOTHESIS TESTS
Critical regions for 2-tailed tests
27
α = .001 z = ±3.30
α = .01 z = ±2.58
α = .05 z = ±1.96
HYPOTHESIS TESTING
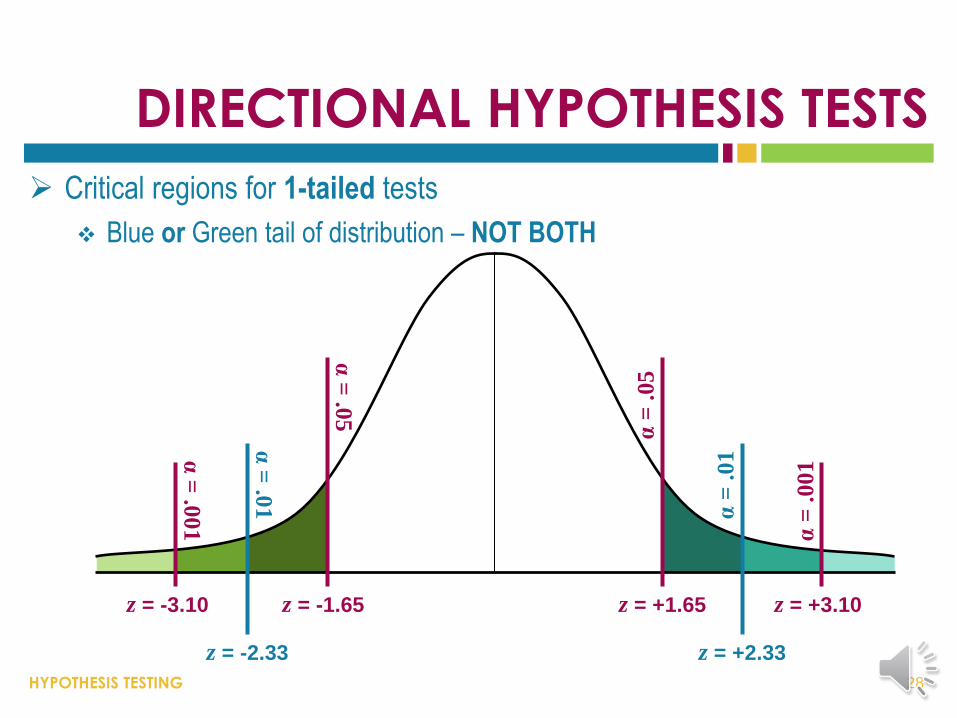
DIRECTIONAL HYPOTHESIS TESTS
Critical regions for 1-tailed tests
Blue or Green tail of distribution – NOT BOTH
28
z = -3.10
α =
.01
α =
.05
α =
.001
z = -1.65
z = -2.33
z = +1.65 z = +3.10
z = +2.33
α =
.01 α
= .
05
α =
.001
HYPOTHESIS TESTING
ALTERNATIVE HYPOTHESES
Alternative Hypotheses for 2-tailed tests
Do not specify direction of difference
Do not hypothesize whether sample mean should be lower or higher than
population mean
Alternative Hypotheses for 1-tailed tests
Specify a difference
Hypothesis specifies whether sample mean should be lower or higher than
population mean
29
HYPOTHESIS TESTING
NULL HYPOTHESES
Null Hypotheses for 2-tailed tests
Specify no difference between sample & population
Null Hypotheses for 1-tailed tests
Specify the opposite of the alternative hypothesis
Example #2
o H0: μ ≤ 85 (There is no increase in test scores.)
o H1: μ > 85 (There is an increase in test scores.)
30
HYPOTHESIS TESTING
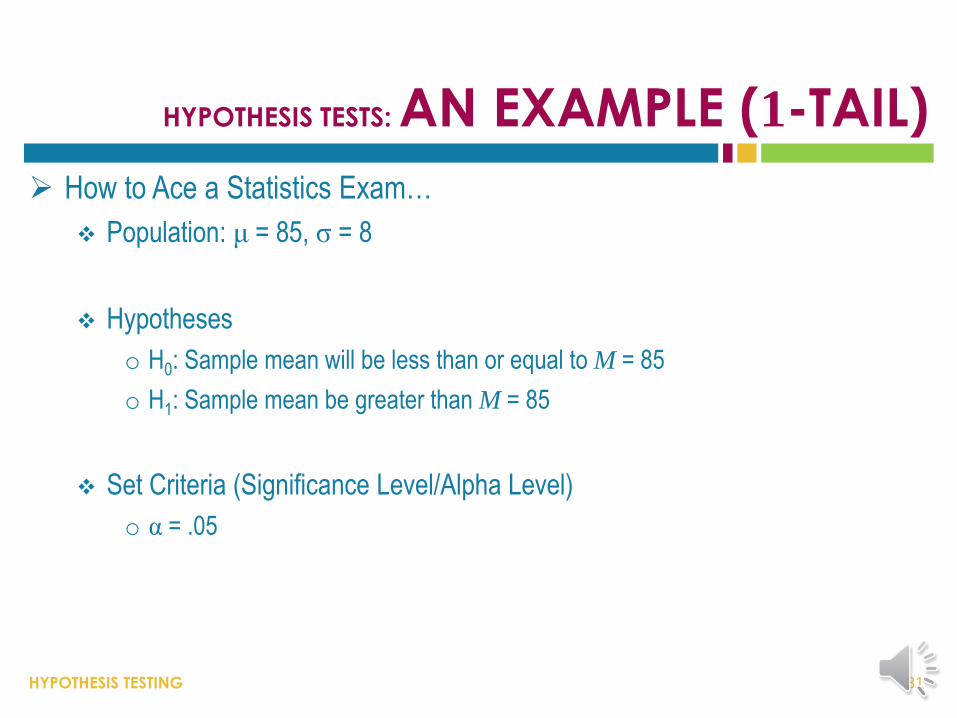
HYPOTHESIS TESTS: AN EXAMPLE (1-TAIL)
How to Ace a Statistics Exam…
Population: μ = 85, σ = 8
Hypotheses
o H0: Sample mean will be less than or equal to M = 85
o H1: Sample mean be greater than M = 85
Set Criteria (Significance Level/Alpha Level)
o α = .05
31
HYPOTHESIS TESTING
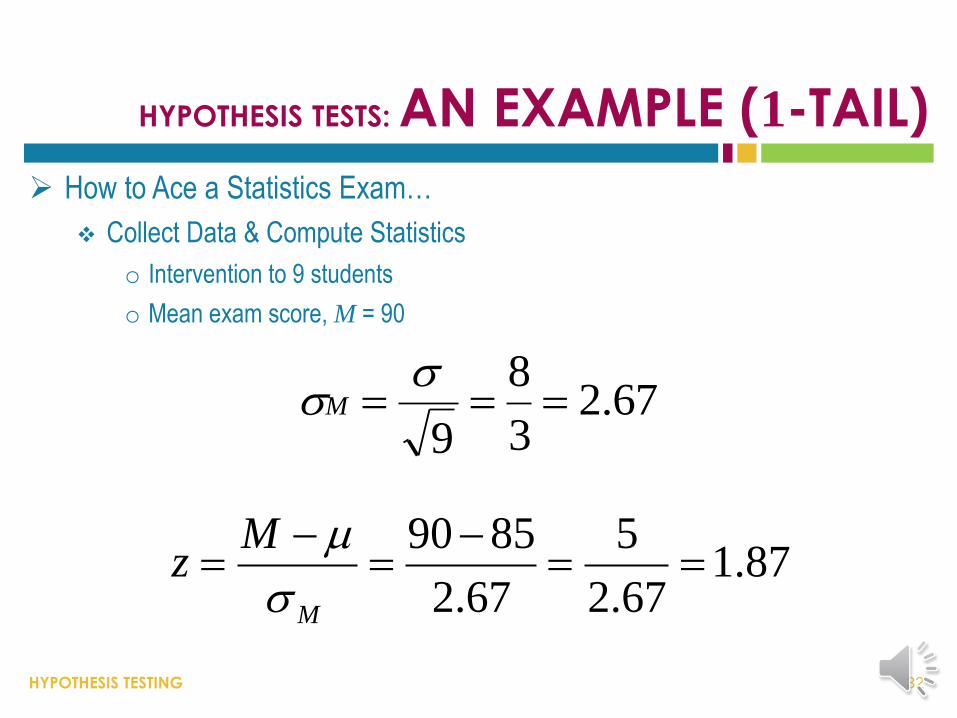
HYPOTHESIS TESTS: AN EXAMPLE (1-TAIL)
How to Ace a Statistics Exam…
Collect Data & Compute Statistics
o Intervention to 9 students
o Mean exam score, M = 90
32
67.23
8
9
M
87.167.2
5
67.2
8590
M
Mz
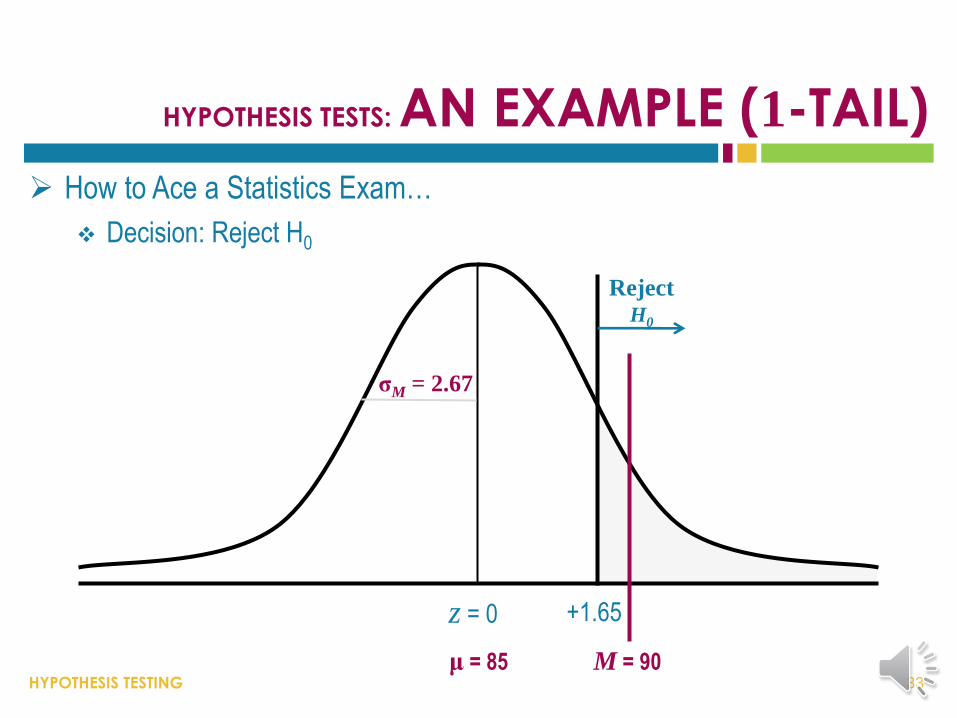
HYPOTHESIS TESTING
HYPOTHESIS TESTS: AN EXAMPLE (1-TAIL)
How to Ace a Statistics Exam…
Decision: Reject H0
33
σM = 2.67
μ = 85 M = 90
z = 0 +1.65
Reject H0
HYPOTHESIS TESTING
EFFECT SIZE
estimating the magnitude of an effect
34
HYPOTHESIS TESTING
EFFECT SIZE
Problem with hypothesis testing
Significance ≠ Meaningful/Important/Big Effect
o Significance is relative comparison: treatment effect compared to standard error
Effect Size
statistic that describes the magnitude of an effect
Measures size of treatment effect in terms of (population) standard
deviation
35
HYPOTHESIS TESTING
EFFECT SIZE: COHEN’S D
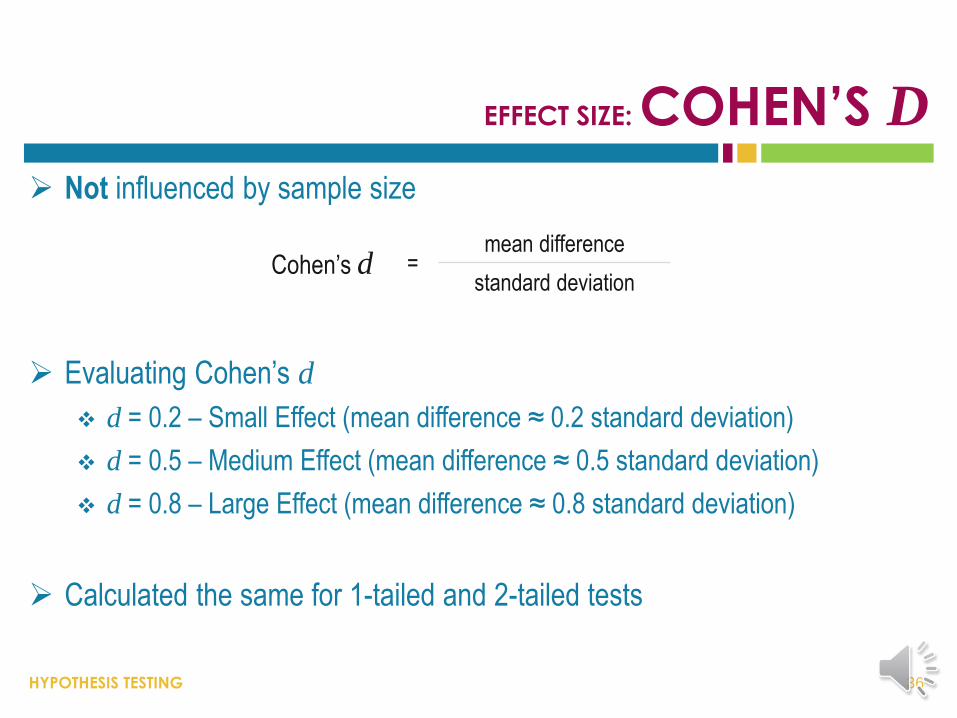
Not influenced by sample size
Evaluating Cohen’s d
d = 0.2 – Small Effect (mean difference ≈ 0.2 standard deviation)
d = 0.5 – Medium Effect (mean difference ≈ 0.5 standard deviation)
d = 0.8 – Large Effect (mean difference ≈ 0.8 standard deviation)
Calculated the same for 1-tailed and 2-tailed tests
36
Cohen’s d = mean difference
standard deviation
HYPOTHESIS TESTING
STATISTICAL POWER
probability of correctly rejecting a false null hypothesis
37
HYPOTHESIS TESTING
STATISTICAL POWER
the probability of correctly rejecting a null hypothesis when it
is not true; the probability that a hypothesis test will identify
a treatment effect when if one really exists
A priori
Calculate power before collecting data
Determine probability of finding treatment effect
Power is influenced by…
Sample size
Expected effect size
Significance level for hypothesis test (α)
38