Hypothesis Testing, part II For the record, this isn’t me. -YM.
29
Hypothesis Testing, part II For the record, this isn’t me. -YM
-
Upload
damian-king -
Category
Documents
-
view
213 -
download
0
Transcript of Hypothesis Testing, part II For the record, this isn’t me. -YM.

Hypothesis Testing, part II
For the record, this isn’t me. -YM

Learning Objectives
By the end of this lecture, you should be able to:– List, from memory, the basic steps in a hypothesis test. – Describe what is meant by a p value– Take a p-value and say whether the result is statistically significant, and
therefore, whether we reject or fail to reject the null hypothesis.– Explain what is meant by the significance level, alpha– Know the difference for a one-tailed v.s. two-tailed test– Calculate a p-value for either one-tailed or two-tailed tests

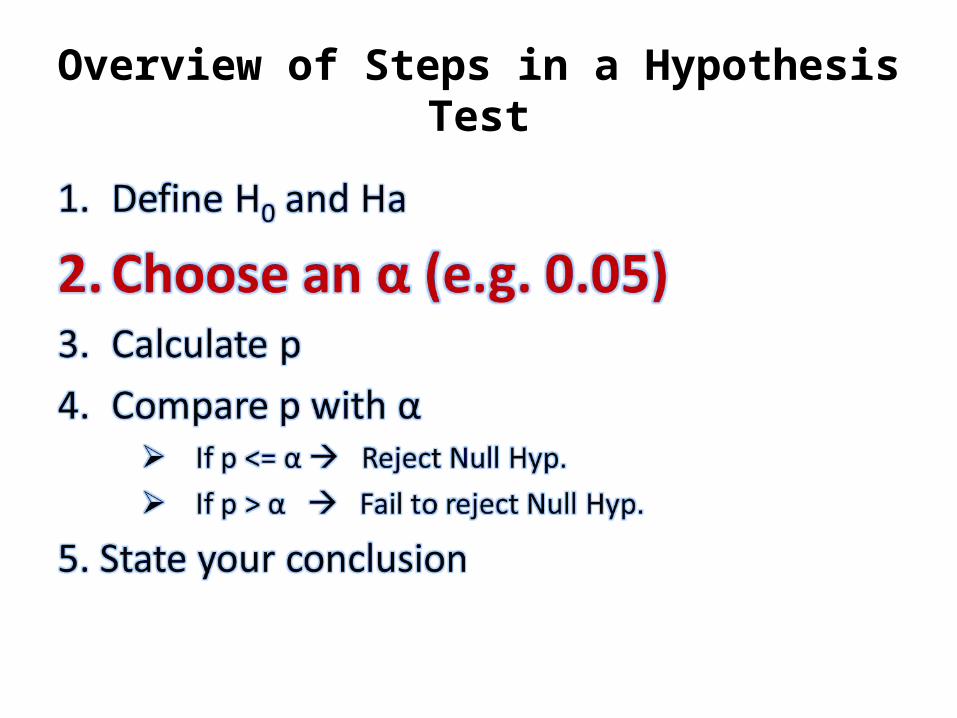
Overview of Steps in a Hypothesis Test

Hypothesis TestThe folllowing is one way of phrasing the key question asked by a hypothesis test:Is the probability high or low that the difference between the mean of one group and the mean of the second group can be explained by sampling variability? •If this difference is NOT likely to be due to sampling variability, then we say the result is statistically significant. •The statistical test we apply to determine if the difference between the two means is statistically significant is called a hypothesis test.
•Restated: In other words, the hypothesis test is a calculation we do to determine whether or not the difference between two values is statistically significant.

The hypothesis test calculation uses our Normal density curve (what else!) to come up with a probability. This probability is called a p-value.
•If the p-value is less than or equal to a predetermined significance level, (usually 0.05), we reject the null hypothesis (and accept our alternate hypothesis).•If the p-value is HIGHER than than our predetermined value, we fail to reject the null-hypothesis. In other words, we say that this sample has not convinced us to change our minds.

YES NO
“Statistically Significant” “Not Statistically Significant”
Reject Null Hypothesis Fail to reject Null Hypothesis
Overview of Steps in a Hypothesis Test

Significance Level ‘α’• The significance level is the value at which we will decide whether or not to call the
result of a hypothesis test “statistically significant” or “not statistically significant”. • We call this significance level ‘alpha’ (α)• Much like the confidence level ‘C’ for confidence intervals must be decided in advance,
we must also decide the significance level (α) in advance.• Much like we commonly choose 95% for ‘C’, there is also a “typical” value for alpha: It
is 0.05.
• That is, if p <= 0.05 we call our result significant• If p>0.05, we call our result not-statistically significant
OPTIONAL DISCUSSION: • Tradeoff: Recall the ‘tradeoff” when choosing a C: The higher the C, we’ll be more
confident, but at the price of a higher margin of error. Things work very similarly, for statistical significance. The main difference is that we want a lower value for α. As with C, it’s up to us to decide what value of α we are “comfortable” with. Typically, we choose 5%. Allowing a lower α is more forgiving, but just as with desiring a higher C, there is a cost. If we choose a very low significance level, we are setting the bar extremely high for rejecting the null hypothesis.

“Statistically Significant”• Recall that the p-value is the calculated result of a hypothesis test.• The smaller this p-value, the more confident we are that the DIFFERENCE between the value obtained by
our sample and the value indicated by our null-hypothesis is not due to chance, i.e. not due to sampling variability.
• Important: The term Signifcant does NOT mean “major” or “important” or “big”. It just means that the DIFFERENCE between the two means is not likely to be due to chance.
• Example: Though we are looking for p<=0.05, is it NOT unusual to see values for p such as p = 0.00000012. However, such a value for p does NOT mean that our null hypothesis is very, very, very false! It simply means that we can reject it.
• In other words, all the p-value is tells us is whether the difference between the mean of the two groups is likely or not to be due to sampling variability.

Example• A p-value that is somewhat high (i.e. the result is not statistically significant) is one of the
MOST COMMON ways in which people mislead (intentionally or otherwise) with statistics. That is, they will report a difference that may appear to be large, but in reality, is not large enough that we can rule out the possibility that it is due to chance.
• Example: The average weight of a random sample of 3 people from Illinois is 163 pounds. The average weight of a random sample of 3 people from California is 287 pounds. There is over a 100 pound difference!! Does this mean that people in Illinois have their weight under much better control than people in California?
• Answer: Of course not… And, in fact, if we did a hypothesis test, we would find that our p-value for this hypothesis test was not even close to being below our 0.05 threshold. In other words, we would say that the results of this test were “not statistically significant”. I hope you recognize that in this case, the flaw is in our very small sample size which means it is very reasonable to believe that this 100+ difference between the two means was due to sampling variability.

Significance Test and p-Value Restated:• “The spirit of a test of significance is to give a clear statement of
the degree of evidence provided by the sample against the null hypothesis.” – Represented by the p-value– As p gets lower, the evidence allowing you to reject the null hypothesis
gets stronger.• If p <= alpha (significance level), we reject the null hypothesis.• If p > alpha (significance level), we fail to reject the null hypothesis.

Example
The packaging process has a known standard deviation = 5 g.
H0 : µ = 227 grams (i.e. package weight = 227 g)
Ha : µ ≠ 227 grams (i.e. package weight not equals 227 g)
The key point: Could sampling variation account for the difference between
the H0 and the sample results?
– A small p-value implies that random variation due to the sampling process is not likely to account for the
observed difference.
– With a small p-value we reject H0. The true property of the population is “significantly” different from
what was stated in H0.

Overview of Steps in a Hypothesis Test

Calculating a p-value – The Z Score
z x n
estimate – hypothesized value
• If your Ha is of the ‘<‘ (i.e. “less than”) variety, your p value is the area to the LEFT of your z-score.
• If your Ha is of the ‘>‘ (i.e. “greater than”) variety, your p value is the area to the RIGHT of your z-score.
• If your Ha is of the ‘≠’ (i.e. “not equal to”) variety, your p value is the area to the left of your negative z-score PLUS the area to the right of your positive z-score.

Calculating a p-value: One-Tail v.s. Two-Tail
• If your Ha refers to ‘<‘, you calculate p by looking at the probability to the left of your calculated z-score.– Thiis is called a “one-tailed” test
• If your Ha refers to ‘>‘, you calculate p by looking at the probability to the right of your calculated z-score.– This is also called a “one-tailed” test.
• If your Ha refers to ‘not equal‘, you calculate p by adding the probabilities to the right AND left of your z-score. – The fastest way to do this, is to calculate the area to the left of your z-
score (right off the table), and double it!– This is called a “two-tailed” test

Does the packaging machine need calibration?
–H0 : µ = 227g (s=5) versus Ha : µ ≠ 227 g
245
227222
n
xz
The area under the standard normal
curve to the left of z= -2, is 0.0228.
However, because our Ha is a ‘not
equals” question, this is a two-tailed
test, so: p = 2 * 0.0228 = 0.0456
4g5 g222 nx
2.28%2.28%
217 222 227 232 237
Sampling distribution
σ/√n = 2.5 g
µ (H0)2
,z
x

Overview of Steps in a Hypothesis Test

Does the packaging machine need calibration?
– H0 : µ = 227g (s=5) versus Ha : µ ≠ 227 g
– Our calculated p was 0.0456
– Our chosen value for alpha was 0.05
• Because p <= alpha, we say our result is statistically significant.
• Therefore, we can REJECT the null hypothesis and state that the
mean weight of a package of tomatoes is NOT 227 grams.
• Conclusion: Our calibration machine needs adjusting!

ExampleA 1999 study looked at a large sample of university students and reported that the mean cholesterol level among women is 168 mg/dl with a standard deviation of 27 mg/dl. A recent study of 71 individuals found a mean level of 173.7 mg/dl. Has the level changed in the intervening years?
– Note: We did NOT ask if the level increased. The question asks whether the levels today have changed from 1999. (Or is the difference too small to rule out being due to chance)?
•Solution:– Ha: cholesterol level today has changed (i.e. is not equal to) choleseterol level in 1999. I.E:
– Ha: 1999 mean cholesterol level ≠2013 mean cholesterol level.
– H0: 1999 mean cholesterol level = 2013 mean cholesterol level– Because no other value was stated, we will choose the “typical” significance level (alpha) of 0.05 as our significance
thereshold.– Calculation:
– z = Est – Hyp / sd estimate – = (173.7 – 168) / 27/ sqrt(71) – = 1.78
•Now this is a positive z-score, and the probability of getting a value >1.78 is 0.0375. •However, because this would only be the ‘>’ situation. However, NOTE that Ha is a “NOT EQUAL” claim. Therefore, we also need to add the ‘<‘ situation. So we could add the probability of Z < -1.78 (which is also 0.0375). Our p-value is, therefore 0.075. •p = 0.075 is NOT less than 0.05, so we “fail to reject the null hypothesis”.
•Conclusion: Based on THIS sample, we can not claim that cholesterol levels have changed.
Define H0 and Ha
Decide on α
Calculate p
Compare p with α
State Conclusion

Example
In a discussion of the average SATM (math SAT) scores of California high school students, an educational expert points out that because only those HS students planning on attending college will take the SAT, there is in fact, a selection bias at work. The person claims that if all California HS students were to take the test, the score would be 450 or even lower. As an experiment, a random sample of 500 students were given the test, and the mean was found to be 461, with a standard deviation of 100. Is our expert’s claim borne out?
Answer: •Define H0 and Ha:
H0: mean score <= 450, Ha: mean score > 450
•Decide α: α = 0.05•Calculate p: Z = (461-450) / (100/sqrt(500)) = 2.46.
–Note that because our Ha claim is of the ‘>’ type, we have a one-sided test.
•Compare p with α: A z>2.46 has a probability of 0.00069. This is well below our threshold of α . Therefore we can reject Ho. •Conclusion: We reject our expert’s claim that the average of all students would be below 450.

Optional…
• The remaining slides are here for your interest/convenience. They include some examples on how these p-values are determined from the Normal curve.
• They also discuss some ‘real-world’ considerations of alpha that were touched on earlier.

Recall that a sampling distribution of sample means follows a Normal pattern. Most samples will give a result that approximates the population (i.e. true) mean. (The number at the center of the distribution). However, some percentage of the time, by complete fluke, we’ll draw a sample that gives a result much higher or lower than the true mean.
These examples (two-tailed tests on left, one-tail tests on right), show that as the likelihood of a sample coming from way out on the sides (i.e. not close to the population value) is smaller, the P value also gets smaller and smaller. We will discuss how to calculate these numbers for P momentarily.
(See note).

P = 0.1711
P = 0.2758
P = 0.0892
P = 0.0735
P = 0.01
P = 0.05
When the shaded area becomes very small, the probability of drawing such a sample at random
gets very slim. Typically, we call a P-value of 0.05 or less significant.
We are saying that the phenomenon observed is unlikely to be a fluke that has resulted from our random sampling.

P-value in one-sided and two-sided tests
To calculate the P-value for a two-sided test, use the symmetry of the normal
curve. Find the P-value for a one-sided test and double it.
One-sided (one-
tailed) test
Two-sided (two-
tailed) test
(null hypothesis value)

The significance level The significance level, α, is the largest P-value tolerated for rejecting
a true null hypothesis!
This value is decided before conducting the test.
– If the P-value is equal to or less than α (P ≤ α), then we reject H0.
– If the P-value is greater than α (P > α), then we fail to reject H0.
Does the packaging machine need revision?
Two-sided test. The P-value is 4.56%.
* If α had been set to 5%, then the P-value would be significant.
* If α had been set to 1%, then the P-value would not be significant.

Choosing the significance level α
Factors often considered:• What are the consequences of rejecting the null hypothesis
(e.g., global warming, convicting a person for life with DNA evidence)?
• Are you conducting a preliminary study? If so, you may want a larger α so that you will be less likely to miss an interesting result.
Some conventions: We typically use the standards of our field of work.
There are no “sharp” cutoffs: e.g., 4.9% versus 5.1 %.
It is the order of magnitude of the p-value that matters: “somewhat significant,”
“significant,” or “very significant.”
Cautions about significance tests

Very, very Important:Failing to reject H0 does NOT mean that Ho is true!
• A lack of significance, that is, if p ends up > alpha, does NOT prove that the null hypothesis is true.
• It just means that the evidence from our particular sample was not compelling enough to say that it is false.

Practical significance
The specific value that you come up with for p has very little practical
significance.
You are ONLY interested in knowing whether or not p is less than 0.05
(or whichever value you chose for alpha).
No matter how high or low the p-value, this value does NOT tell you
about the magnitude of the effect. It ONLY tells you whether the
difference between the two values is or is not likely to be due to chance.

* Don’t ignore lack of significance
There is a tendency to conclude that there is no effect whenever a p-value fails
to attain the alpha standard (e.g. 5%).
Consider this provocative title from the British Medical Journal: “Absence of
evidence is not evidence of absence”.
Having no proof of who committed a murder does not imply that the murder
was not committed.
Indeed, failing to find statistical significance simply means that the particular
sample failed to give sufficient evidence allowing you to reject the null
hypothesis. That does NOT mean that the null hypothesis is true. It only
means that you were not able to prove that it is false.
This is the reasonwe use the admittedly wordy: “fail to reject the null
hypothesis”.