Hyperspectral Modeling of Skin Appearance - NPSG.UW · 31 Hyperspectral Modeling of Skin Appearance...
14
31 Hyperspectral Modeling of Skin Appearance TENN F. CHEN, GLADIMIR V. G. BARANOSKI, BRADLEY W. KIMMEL, and ERIK MIRANDA University of Waterloo Exploration of the hyperspectral domain offers a host of new research and application possibilities involving material appearance modeling. In this ar- ticle, we address these prospects with respect to human skin, one of the most ubiquitous materials portrayed in synthetic imaging. We present the first hyperspectral model designed for the predictive rendering of skin ap- pearance attributes in the ultraviolet, visible, and infrared domains. The proposed model incorporates the intrinsic bio-optical properties of human skin affecting light transport in these spectral regions, including the particle nature and distribution patterns of the main light attenuation agents found within the cutaneous tissues. Accordingly, it accounts for phenomena that significantly affect skin spectral signatures, both within and outside the visi- ble domain, such as detour and sieve effects, that are overlooked by existing skin appearance models. Using a first-principles approach, the proposed model computes the surface and subsurface scattering components of skin reflectance taking into account not only the wavelength and the illumination geometry, but also the positional dependence of the reflected light. Hence, the spectral and spatial distributions of light interacting with human skin can be comprehensively represented in terms of hyperspectral reflectance and BSSRDF, respectively. Categories and Subject Descriptors: I.3.7 [Computer Graphics]: Three- Dimensional Graphics and Realism—Raytracing General Terms: Algorithms Additional Key Words and Phrases: Material appearance modeling, light transport, rendering, hyperspectral imaging, visualization ACM Reference Format: Tenn F. Chen, Gladimir V. G. Baranoski, Bradley W. Kimmel, and Erik Miranda. 2015. Hyperspectral modeling of skin appearance. ACM Trans. Graph. 34, 3. Article 31 (April 2015), 14 pages. DOI: http://dx.doi.org/10.1145/2701416 1. INTRODUCTION Despite significant advances achieved by the computer graphics community with respect to the modeling of material appearance, organic materials such as human skin continue to represent an This research was supported by NSERC Discovery Grant no. 238337 and by scholarships from OGS and the University of Waterloo. Authors’ addresses: T. F. Chen (corresponding author), G. V. G. Baranoski, B. W. Kimmel, and E. Miranda, University of Waterloo, 200 University Av- enue West, Waterloo, ON N2L 3G1, Canada; email: [email protected]. Permission to make digital or hard copies of all or part of this work for personal or classroom use is granted without fee provided that copies are not made or distributed for profit or commercial advantage and that copies bear this notice and the full citation on the first page. Copyrights for components of this work owned by others than ACM must be honored. Abstracting with credit is permitted. To copy otherwise, or republish, to post on servers or to redistribute to lists, requires prior specific permission and/or a fee. 2015 Copyright is held by the owner/author(s). Publication rights licensed to ACM. 0730-0301/2015/04-ART31 $15.00 DOI: http://dx.doi.org/10.1145/2701416 ongoing challenge in this area due to their inherent optical com- plexity. Moreover, to date, the bulk of the work on light and skin in- teractions within the computer graphics field has been aimed at skin imaging in the visible domain. In fact, only recently have computer graphics researchers started to look more closely into the hyper- spectral domain, spanning from the ultraviolet (UV) to the infrared (IR) regions of the light spectrum, in order to broaden the scope of traditional rendering frameworks [Kim et al. 2012]. Accordingly, existing skin appearance models have been primarily employed in image synthesis applications (e.g., Donner et al. [2008] and Jimenez et al. [2010]) as well as in biomedical investigations (e.g., Baranoski et al. [2012a] and Cavalcanti et al. [2013]) centered on the visible appearance attributes of human skin. However, there are relevant avenues of research associated with skin appearance modeling that remain unexplored, notably involving the hyperspectral simulation of light and skin interactions and the modeling of aging and weath- ering phenomena, a forefront topic in the pursuit of realism [Dorsey et al. 2007; M´ erillou and Ghazanfarpour 2008]. For example, many skin appearance changes distinctly noticeable in the visible domain are caused by natural processes, such as tanning [Chedekel 1995], freckling [Fulton 1997], and photoaging [Schroeder et al. 2008] triggered by exposure to UV and IR light. In order to predictively simulate these processes, it is necessary in turn to employ models that can correctly account for light and skin interactions, both within and outside the visible domain. The investigation and rendering of phenomena affecting skin appearance attributes within a broader hyperspectral domain can also lead to a diverse scope of applications in the life and health sciences. For example, the presence of pigmentation irregularities such as freckles, moles, and other forms of melanin clumping is accentuated in the UV domain (Figure 2 (left)). Predictive images depicting this phenomenon can be employed in appearance-based interventions aiming at increasing the willingness of individuals to adopt sun protection measures that can reduce photodamage effects and skin cancer risk [Mahler et al. 2003]. In addition, the modeling of skin hyperspectral responses can be utilized in noninvasive health monitoring procedures of relevance for medical and cosmetics re- search as well as clinical practice. For example, UV responses can be used in the assessment of the intrinsic photoprotective properties of a skin specimen [Nielsen et al. 2004], while IR responses can be used in the assessment of skin hydration [Attas et al. 2002], a key factor contributing to skin health. Hyperspectral modeling of skin appearance also offers a myriad of creative opportunities for aesthetic applications. For example, in the IR region, notably below 1300nm, one can observe a “soft”, more diffuse skin appearance (Figure 2 (right)) that is also less influenced by pigmentation irregularities [Anderson and Parrish 1982; Fredembach et al. 2009]. Unique, artistic images of human subjects can be obtained by eliciting this “ethereal” appearance of skin under IR light [Sandidge 2009]. There is a considerable amount of research on the simulation of light and skin interactions being performed in fields as di- verse as colorimetry (e.g., Tsumura et al. [2000]), remote sens- ing (e.g., Nunez [2009]), and tissue optics (e.g., Prahl [1988]). It is worth noting, however, that the models proposed in these fields are ACM Transactions on Graphics, Vol. 34, No. 3, Article 31, Publication date: April 2015.
Transcript of Hyperspectral Modeling of Skin Appearance - NPSG.UW · 31 Hyperspectral Modeling of Skin Appearance...
31
Hyperspectral Modeling of Skin Appearance
TENN F. CHEN, GLADIMIR V. G. BARANOSKI, BRADLEY W. KIMMEL, and ERIK MIRANDAUniversity of Waterloo
Exploration of the hyperspectral domain offers a host of new research andapplication possibilities involving material appearance modeling. In this ar-ticle, we address these prospects with respect to human skin, one of themost ubiquitous materials portrayed in synthetic imaging. We present thefirst hyperspectral model designed for the predictive rendering of skin ap-pearance attributes in the ultraviolet, visible, and infrared domains. Theproposed model incorporates the intrinsic bio-optical properties of humanskin affecting light transport in these spectral regions, including the particlenature and distribution patterns of the main light attenuation agents foundwithin the cutaneous tissues. Accordingly, it accounts for phenomena thatsignificantly affect skin spectral signatures, both within and outside the visi-ble domain, such as detour and sieve effects, that are overlooked by existingskin appearance models. Using a first-principles approach, the proposedmodel computes the surface and subsurface scattering components of skinreflectance taking into account not only the wavelength and the illuminationgeometry, but also the positional dependence of the reflected light. Hence,the spectral and spatial distributions of light interacting with human skincan be comprehensively represented in terms of hyperspectral reflectanceand BSSRDF, respectively.
Categories and Subject Descriptors: I.3.7 [Computer Graphics]: Three-Dimensional Graphics and Realism—Raytracing
General Terms: Algorithms
Additional Key Words and Phrases: Material appearance modeling, lighttransport, rendering, hyperspectral imaging, visualization
ACM Reference Format:
Tenn F. Chen, Gladimir V. G. Baranoski, Bradley W. Kimmel, and ErikMiranda. 2015. Hyperspectral modeling of skin appearance. ACM Trans.Graph. 34, 3. Article 31 (April 2015), 14 pages.DOI: http://dx.doi.org/10.1145/2701416
1. INTRODUCTION
Despite significant advances achieved by the computer graphicscommunity with respect to the modeling of material appearance,organic materials such as human skin continue to represent an
This research was supported by NSERC Discovery Grant no. 238337 andby scholarships from OGS and the University of Waterloo.Authors’ addresses: T. F. Chen (corresponding author), G. V. G. Baranoski,B. W. Kimmel, and E. Miranda, University of Waterloo, 200 University Av-enue West, Waterloo, ON N2L 3G1, Canada; email: [email protected] to make digital or hard copies of all or part of this work forpersonal or classroom use is granted without fee provided that copies are notmade or distributed for profit or commercial advantage and that copies bearthis notice and the full citation on the first page. Copyrights for componentsof this work owned by others than ACM must be honored. Abstracting withcredit is permitted. To copy otherwise, or republish, to post on servers or toredistribute to lists, requires prior specific permission and/or a fee.2015 Copyright is held by the owner/author(s). Publication rights licensedto ACM. 0730-0301/2015/04-ART31 $15.00DOI: http://dx.doi.org/10.1145/2701416
ongoing challenge in this area due to their inherent optical com-plexity. Moreover, to date, the bulk of the work on light and skin in-teractions within the computer graphics field has been aimed at skinimaging in the visible domain. In fact, only recently have computergraphics researchers started to look more closely into the hyper-spectral domain, spanning from the ultraviolet (UV) to the infrared(IR) regions of the light spectrum, in order to broaden the scope oftraditional rendering frameworks [Kim et al. 2012]. Accordingly,existing skin appearance models have been primarily employed inimage synthesis applications (e.g., Donner et al. [2008] and Jimenezet al. [2010]) as well as in biomedical investigations (e.g., Baranoskiet al. [2012a] and Cavalcanti et al. [2013]) centered on the visibleappearance attributes of human skin. However, there are relevantavenues of research associated with skin appearance modeling thatremain unexplored, notably involving the hyperspectral simulationof light and skin interactions and the modeling of aging and weath-ering phenomena, a forefront topic in the pursuit of realism [Dorseyet al. 2007; Merillou and Ghazanfarpour 2008]. For example, manyskin appearance changes distinctly noticeable in the visible domainare caused by natural processes, such as tanning [Chedekel 1995],freckling [Fulton 1997], and photoaging [Schroeder et al. 2008]triggered by exposure to UV and IR light. In order to predictivelysimulate these processes, it is necessary in turn to employ modelsthat can correctly account for light and skin interactions, both withinand outside the visible domain.
The investigation and rendering of phenomena affecting skinappearance attributes within a broader hyperspectral domain canalso lead to a diverse scope of applications in the life and healthsciences. For example, the presence of pigmentation irregularitiessuch as freckles, moles, and other forms of melanin clumping isaccentuated in the UV domain (Figure 2 (left)). Predictive imagesdepicting this phenomenon can be employed in appearance-basedinterventions aiming at increasing the willingness of individuals toadopt sun protection measures that can reduce photodamage effectsand skin cancer risk [Mahler et al. 2003]. In addition, the modelingof skin hyperspectral responses can be utilized in noninvasive healthmonitoring procedures of relevance for medical and cosmetics re-search as well as clinical practice. For example, UV responses canbe used in the assessment of the intrinsic photoprotective propertiesof a skin specimen [Nielsen et al. 2004], while IR responses can beused in the assessment of skin hydration [Attas et al. 2002], a keyfactor contributing to skin health.
Hyperspectral modeling of skin appearance also offers a myriadof creative opportunities for aesthetic applications. For example, inthe IR region, notably below 1300nm, one can observe a “soft”,more diffuse skin appearance (Figure 2 (right)) that is also lessinfluenced by pigmentation irregularities [Anderson and Parrish1982; Fredembach et al. 2009]. Unique, artistic images of humansubjects can be obtained by eliciting this “ethereal” appearance ofskin under IR light [Sandidge 2009].
There is a considerable amount of research on the simulationof light and skin interactions being performed in fields as di-verse as colorimetry (e.g., Tsumura et al. [2000]), remote sens-ing (e.g., Nunez [2009]), and tissue optics (e.g., Prahl [1988]). It isworth noting, however, that the models proposed in these fields are
ACM Transactions on Graphics, Vol. 34, No. 3, Article 31, Publication date: April 2015.

31:2 • T. F. Chen et al.
Fig. 1. Images showing distinct skin appearance features in the ultraviolet (left), visible (center), and infrared (right) spectral domains. These images wererendered using BSSRDF (top row) and BRDF (bottom row) representations of spatial light distributions provided by the proposed hyperspectral modelHyLIoS (Hyperspectral Light Impingement on Skin) in these domains. Note that HyLIoS can predictively simulate not only the intensification of pigmentationirregularities in the ultraviolet range, but also the “soft”, “ethereal” (more diffuse and less affected by the presence of pigmentation irregularities) appearanceof human skin in the infrared range [Sandidge 2009], notably below 1300nm [Anderson and Parrish 1982]. The ultraviolet and infrared responses (at 365nmand 1100nm, respectively) are depicted using pseudocolor.
Fig. 2. Photos taken with a Nikon D2X camera equipped with differentlight transmitting filters. Left: UV filter. Center: no filter. Right: IR fil-ter. Note the intensification of pigmentation irregularities in the UV range(employed in appearance-based cancer prevention initiatives [Mahler et al.2003; Fulton 1997]), and the more diffuse, “ethereal” skin appearancethat can be obtained in the IR domain (employed in artistic applications[Sandidge 2009]). The UV and IR photos are depicted using pseudocolor.Photos courtesy of Charles Schmitt.
not designed for the comprehensive simulation of material appear-ance within image synthesis frameworks, which involves both thespectral and spatial distributions of light interacting with a givenmaterial [Hunter and Harold 1987]. Instead, these models are pri-marily designed for specialized applications such as the detectionand analysis of skin spectral signatures within specific regions ofthe light spectrum (e.g., Nielsen et al. [2004]).
In this article, we present the first hyperspectral skin appearancemodel, henceforth referred to as HyLIoS (Hyperspectral LightImpingement on Skin), capable of predictively simulating boththe spectral and spatial distributions of light interacting with thiscomplex biological material in the UV, visible, and IR domains,from 250–2500nm. The first-principles approach used in the designof the proposed model takes into account not only the detailedlayered structure of the skin tissues, but also the particle nature of its
main light attenuation agents, namely the melanosomes (spheroidalmelanin-containing organelles [Olson et al. 1973]). Instead of rely-ing on Mie-theory-based approximations in which light attenuationagents are usually represented by uniformly distributed spheres,we probabilistically incorporate the melanosomes’ size, shape,orientation, and distribution into our light transport simulations.These also account for the hyperspectral absorption and scatteringproperties of the remaining light attenuation agents found in eachlayer. As a result, the proposed model can predictively account forphenomena that significantly affect skin spectral responses bothwithin and outside the visible domain, such as light detour andsieve effects [Butler 1964; Latimer 1984], as well as the positionaldependence [Nicodemus et al. 1992] of light interacting with agiven skin specimen.
As highlighted by Greenberg et al. [1997], the evaluation of pre-dictive simulations should involve comparison of their results withphysical measurements whenever such data is available. Accord-ingly, the predictions of the proposed model are primarily evaluatedthrough quantitative comparisons with measured data and qualita-tive comparisons with empirical observations reported in the liter-ature. In addition, images rendered using the proposed model areemployed to further illustrate its predictive capabilities with respectto the simulation of characteristic trends in the variation of skinappearance attributes, both within and outside the visible domain.Finally, practical issues related to its usability and performance arealso examined in this article.
2. RELATED WORK
In this section, we briefly review key developments on the modelingof skin appearance within the computer graphics field. The readerinterested in a more detailed examination of this body of work,
ACM Transactions on Graphics, Vol. 34, No. 3, Article 31, Publication date: April 2015.

Hyperspectral Modeling of Skin Appearance • 31:3
especially outside the computer graphics domain, is referred tocomprehensive texts on this topic [Tuchin 2007; Igarashi et al.2007; Baranoski and Krishnaswamy 2010].
Skin appearance models employed in realistic image synthesiscan be broadly categorized into two groups: deterministic and non-deterministic. Deterministic models (e.g., Stam [2001], Donner andJensen [2006], and Weyrich et al. [2006]) simulate the light andskin interactions using formulations based on analytical approxima-tions to the radiative transfer equation such as the Kubelka-Munktheory, the diffusion theory, and the discrete-ordinate approxima-tion [Igarashi et al. 2007; Baranoski and Krishnaswamy 2010].Nondeterministic models (e.g., Hanrahan and Krueger [1993], Ngand Li [2001], and Krishnaswamy and Baranoski [2004a]) simulatethese interactions using stochastic techniques based on Monte Carlomethods [Prahl 1988].
Deterministic models are faster and amenable to analytical ma-nipulation, which favors their use in real-time applications aimedat generating believable images of virtual characters. However, it isimportant to note that the predictive capabilities of these models arebound by the inherent limitations of the analytical approximationsemployed in their formulations. For example, it has been demon-strated [Hielscher et al. 1995; Chen et al. 2001] that the diffusiontheory approximation fails to accurately describe light propaga-tion in highly absorbing media. In the case of human skin, strongabsorption is verified in the UV, visible (below ≈ 600nm), andIR (above ≈ 1300nm) domains [Anderson and Parrish 1982]. Re-cently, algorithms have been proposed to relax the limitations ofthe diffusion theory approximation [d’Eon and Irving 2011]. Thesealgorithms have been evaluated through comparisons with resultsprovided by general-purpose Monte Carlo simulations [Wang et al.1995] involving the reflectance and transmittance profiles withinsingle- and two-layer homogeneous materials.
Nondeterministic models allow for the proper modeling of com-plex geometries and optical inhomogeneities [Prahl 1988; Hielscheret al. 1995; Wang et al. 1995], thus supporting utilization of first-principles simulation approaches. These approaches in turn applyfundamental principles of physics to a material’s microscopic struc-ture in order to build up the bulk behavior of how it interacts withlight [Dorsey et al. 2007]. Accordingly, depending on the level ofabstraction employed in the characterization of the skin specimens,they can lead to high-fidelity results. These models, however, arebound to incur higher processing times due to their use of MonteCarlo methods. For this reason, parallel processing strategies (e.g.,Krishnaswamy and Baranoski [2004b]) and specialized graphicshardware (e.g., Doronin and Meglinski [2011]) are often employedto improve their performance.
Existing skin appearance models, either deterministic or nonde-terministic, are not designed for providing predictive spectral re-sponses with respect to a broader spectral domain, from UV to IR.For instance, it has been established [Anderson and Parrish 1982;Nielsen et al. 2006] that the effects of melanin on skin color and UVlight attenuation must be related not only to melanin content, butalso to where it is found and how it is dispersed within the cutaneoustissues. None of the existing skin appearance models accounts forthe particle nature and distribution of melanosomes within the dif-ferent epidermal layers, which impairs their predictive capabilitieseven in the visible domain as further discussed in Section 5. Inaddition, to the best of our knowledge, existing models do not ac-count for the presence and distribution of other major contributorsto light attenuation outside the visible domain such as keratin, DNA,urocanic acid, water, and lipids [Young 1997; Yang et al. 2009].
It is worth mentioning that there have been relevant com-puter graphics works involving the measurement of skin spectral
responses and the capture of skin appearance data (e.g., Marschneret al. [1999], Fuchs et al. [2005], Weyrich et al. [2006], Donneret al. [2008], and Ghosh et al. [2008]). These efforts, however, werealso aimed at applications in the visible domain and consequentlyprimarily targeted the acquisition of skin appearance data in thisregion of the light spectrum.
3. BIOPHYSICAL BACKGROUND
In order to predictively model the appearance attributes of humanskin, it is necessary to account for its intrinsic bio-optical properties.Although previous work in this area has examined these properties,for completeness we briefly review it from a hyperspectral perspec-tive in this section.
Human skin is usually described as being composed of three dis-tinct tissues, namely stratum corneum, epidermis, and dermis [Yanget al. 2009]. The stratum corneum and the epidermal layers (stra-tum lucidum, stratum granulosum, stratum spinosum, and stratumbasale, from outermost to innermost) are composed of stratified cellswith a combined thickness that may reach about 1mm [Andersonand Parrish 1982; de Graaff 1995]. Note that the stratum lucidumis a clear layer found only in thick skin regions such as palms andsoles [de Graaff 1995] and for these reasons not further addressedin this work. The dermis can be divided into the outermost papillarydermis and innermost reticular dermis, with a combined thicknessthat may reach up to 4mm [Anderson and Parrish 1982]. Comparedto the reticular dermis, the papillary dermis is relatively thin andcontains smaller-sized structural fibers. The dermis also contains anetwork of blood vessels, with wider vessels being located in thereticular dermis.
Light impinging on the skin surface can be reflected back tothe environment or transmitted into its internal tissues, a processthat can be described in terms of the Fresnel equations [Andersonand Parrish 1982]. Once light is transmitted into the skin tissues, itcan be absorbed or scattered by their constituent materials. In theremainder of this section, we outline the most important of theseattenuation agents contributing to light absorption and scatteringwithin the cutaneous tissues in the UV, visible, and IR domains.
3.1 Light-Absorbing Materials
Relevant light-absorbing materials acting in the UV domain aresituated within the stratum corneum and epidermis [Young 1997].These include DNA, keratin, urocanic acid, and melanin, which mayoccur in two forms within human skin: the dominant brown-blackeumelanin and the yellow-red pheomelanin [Chedekel 1995].
Melanin is also a strong absorber in the visible range [Andersonand Parrish 1982]. It is synthesized by melanocyte cells in the stra-tum basale, where it is preferentially concentrated [de Graaff 1995].As the epidermal cells move upward, it is distributed throughout thefull thickness of the upper layers [Kollias et al. 1991]. Melanin mayoccur in a colloidal form (also known as melanin dust) or clusteredwithin the melanosomes [Pathak 1995], where its content may rangefrom 17.9% to 72.3% [Kollias et al. 1991].
Blood-borne pigments (e.g., oxyhemoglobin, deoxyhemoglobin,carboxyhemoglobin, methemoglobin, sulfhemoglobin, bilirubinand beta-carotene) found in the dermis are also relevant absorbersin the UV and visible domains [Jacquez et al. 1955b]. It is worthnoting that beta-carotene may be also found in the epidermis andstratum corneum [Anderson and Parrish 1982]. Water and lipidsfound throughout the skin dominate the absorption of light in theIR domain [Jacquez et al. 1955a; Cooksey and Allen 2013], notablywithin the thick dermis [Yang et al. 2009].
ACM Transactions on Graphics, Vol. 34, No. 3, Article 31, Publication date: April 2015.

31:4 • T. F. Chen et al.
Fig. 3. Sketches depicting the distribution of melanosomes within the epi-dermal layers of skin specimens with different levels of melanin pigmenta-tion. Left: melanosome complexes found in lightly pigmented specimens.Center: more compact complexes found in moderately pigmented speci-mens. Right: individually dispersed melanosomes found in darkly pigmentedspecimens.
3.2 Light-Scattering Materials
Light is mostly scattered by heterogeneous structures, such as cells,organelles, and fibers, found within the skin tissues [Anderson andParrish 1982]. Among these structures, the melanosomes, whichpredominantly scatter light in the forward direction [Chedekel1995], have a central role in the attenuation of UV and visiblelight [Kollias et al. 1991]. The quantity of melanosomes producedin human skin is determined by genetic factors and sun exposure.In darkly pigmented specimens, the mean epidermal melanosomecontent (volume fraction) may be as high as 10%, while in lightlypigmented specimens may be as low as 1% [Lister 2013].
Melanosomes can be described as particles with the shape of aprolate spheroid [Olson et al. 1973]. In lightly pigmented specimens,they can occur in groups surrounded by a transparent membraneforming melanosome complexes [Szabo et al. 1969; Olson et al.1973], which are characterized as approximately spherical in shape[Szabo et al. 1969; Kollias et al. 1991] (Figure 3 (left and center)).In darkly pigmented specimens, however, they occur as denser andindividually dispersed particles [Szabo et al. 1969; Olson et al.1973] (Figure 3 (right)).
The turbid dermal layers contain dense connective tissue. Lighttraversing these layers is subject to Rayleigh scattering, that maybe caused by the presence of small-scale features, such as collagenfibers and fibrils, in the papillary dermis [Anderson and Parrish1982; Jacques 1996]. Moreover, as light penetrates deeper into thedermal layers, it becomes progressively more diffuse [Jacques et al.1987]. Eventually, the light traversing the dermis may reach thehypodermis. Light remission by large cellular structures in thisadipose tissue can further contribute to an increase in the scatteringof light within the dermis [Yang et al. 2009].
3.3 Detour and Sieve Effects
When light traverses a turbid medium, refractive index differ-ences between pigment-containing structures and the surroundingmedium may cause multiple interactions that increase the light opti-cal path length, a phenomenon known as detour effect [Butler 1964].Conversely, the traversing light may undergo a sieve effect, that is itmay not encounter a pigment-containing structure [Latimer 1984].While the former increases the probability of light absorption bythe pigment of interest, notably in bands of absorption minima, incomparison with a homogeneous solution with equal concentrationof this pigment [Butler 1964], the latter reduces the probabilityof light absorption, particularly in bands of absorption maxima[Latimer 1984]. The net result of these effects depends on the
Fig. 4. Sketch illustrating the different light and skin interaction processessimulated by the proposed hyperspectral model (HyLIoS). From left to right:surface reflection, absorption, transmission, and subsurface reflection. Notethat the distances that may separate light incidence (xi ) and outgoing (xo)points are computed taking into account the physical distances that lighttravels within the cutaneous tissues.
Fig. 5. Diagram showing the skin layers considered by the proposedhyperspectral model (HyLIoS). The main light-absorbing spectral domainsassociated with each layer are identified as UV (UltraViolet), Vis (Visible),and IR (InfraRed).
absorption spectra of the pigments as well as the distributionand volume fraction of the pigment-containing structures (e.g.,melanosomes and melanosome complexes) found in a givenmedium [Butler 1964; Latimer 1984].
4. THE HYLIOS MODEL
The proposed model employs stochastic techniques to simulate theinteractions of light with human skin. Using a first-principles ap-proach, it accounts for the physical distances traveled by light withinthe cutaneous tissues. As a result, the radiometric responses de-rived from the light interaction processes affecting skin appearancecan be quantified in terms of BSSRDF (bidirectional scattering-surface reflectance-distribution function) since the distances thatmay separate the light incidence (xi) and outgoing (xo) points (Fig-ure 4) are provided by the simulations. Alternatively, these radio-metric responses can be quantified in terms of BRDF (bidirectionalreflectance-distribution function) by ignoring this positional param-eter [Nicodemus et al. 1992].
Within the proposed modeling framework, the main cutaneoustissues, namely stratum corneum, stratum granulosum, stratumspinosum, stratum basale, papillary dermis, and reticular dermis,are represented by semi-infinite layers as depicted in Figure 5.These layers are characterized by their thickness refractive indexas well as the presence and optical properties of light attenuationmaterials.
The propagation and attenuation of light within the various skinlayers are simulated through an iterative random walk algorithmwhich is schematically presented in Figure 6. Within this sim-ulation framework, absorbers represent materials that primarily
ACM Transactions on Graphics, Vol. 34, No. 3, Article 31, Publication date: April 2015.
Hyperspectral Modeling of Skin Appearance • 31:5
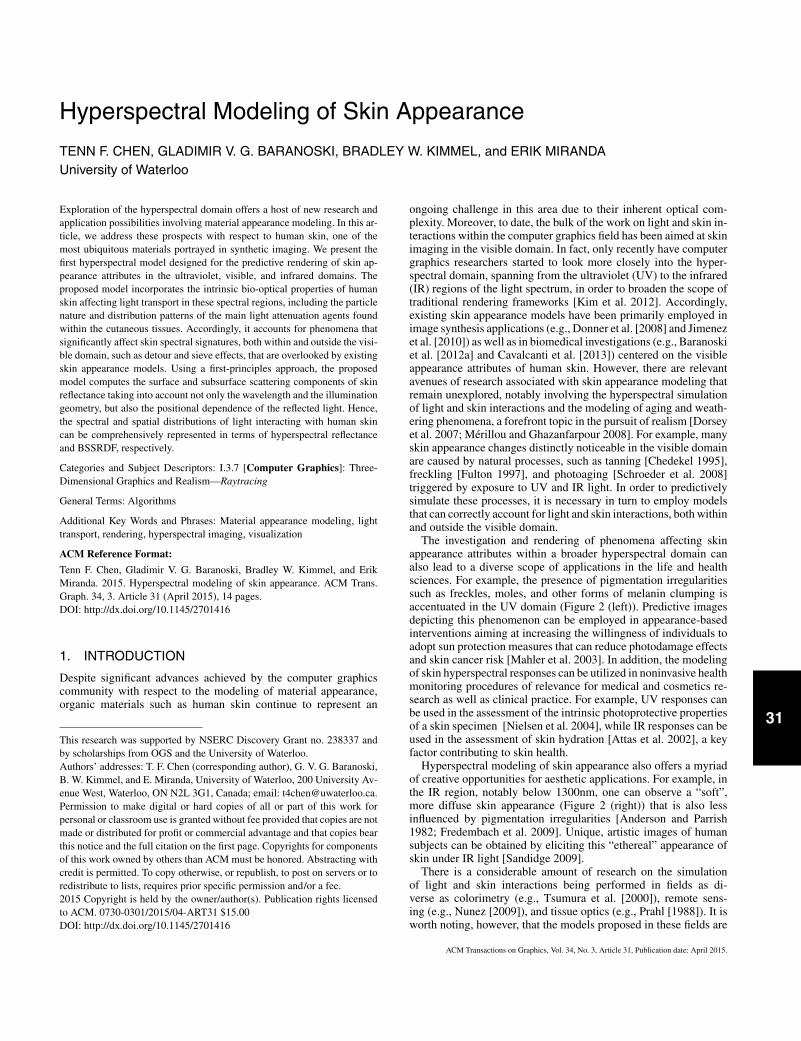
Fig. 6. Flowchart depicting the general structure of the iterative randomwalk algorithm employed by the proposed hyperspectral model (HyLIoS).The distances to the next attenuation events are computed using Eq. (1).
absorb light, while attenuators represent materials that primar-ily scatter light (e.g., connective fibers) as well as materials thatsignificantly contribute to both absorption and scattering of light(e.g., melanosomes). Although light is represented by discrete rays,each one associated with a given wavelength λ, the attenuationevents are probabilistically accounted for using ray optics and,when appropriate, data-driven procedures based on wave opticsobservations.
At the start of each iteration, a Fresnel test is performed whena ray hits a layer interface. If the ray exits the skin, a reflection ortransmission event is recorded and the iteration terminated. Other-wise, the distance to the next attenuation event is probabilisticallycomputed as follows. When a ray travels through a layer, it mayinteract with various absorbers and attenuators. Each of these tissueconstituents may be associated with a different spectral attenuationcoefficient μ(λ). For each relevant μ(λ), we generate a distanced(λ) [Prahl 1988] given by
d(λ) = − 1
μ(λ)ln ξ1, (1)
where ξ1 is a random number uniformly generated from (0, 1]. Theactual distance travelled by the ray to the next attenuation eventcorresponds to the smallest of these generated distances, that is,we advance the ray by this distance. If the ray hits a layer interface,the process reiterates from the Fresnel test; otherwise, three possibleoutcomes may take place (Figure 6). In the case of absorbers, the
ray is terminated. In the case of attenuators that can significantlycontribute to both absorption and scattering, a probabilistic test(Section 4.2.1) is used to determine whether the ray is absorbed. Ifthe test fails, the ray is scattered (Section 4.2.1) and the random walkcontinues; otherwise, the ray is terminated. In the case of attenuatorsthat primarily scatter light, the ray is scattered (Section 4.2.2) andthe random walk proceeds.
In the following sections, we describe how the light attenua-tion contributions of absorbers, attenuators, and large-scale cellularstructures are accounted for in the algorithmic formulation of theproposed model.
4.1 Absorbers
In order to account for the contributions of the absorbers present ina given layer, we compute the spectral volumetric absorption coef-ficient associated with the layer, which corresponds to the weightedsum of the specific spectral absorption coefficients of each ab-sorber. For example, the absorption in the papillary dermis is pri-marily due to water, lipids, and blood pigments. Let the blood-bornepigments oxyhemoglobin, deoxyhemoglobin, carboxyhemoglobin,methemoglobin, sulfhemoglobin, beta-carotene, and bilirubin bedenoted by oh, dh, ch, mh, sh, bc, and bil, respectively. The corre-sponding volumetric absorption coefficient of the papillary dermiscan then be calculated as
μpa (λ) = ζwater (λ)vp
water + ζlipids(λ)vp
lipids
+ (ζoh(λ)vboh + ζdh(λ)vb
dh + ζch(λ)vbsh
+ ζmh(λ)vbmh + ζsh(λ)vb
sh
+ ζbc(λ)vbbc + ζbil(λ)vb
bil)vp
blood , (2)
where ζi , vp
i , and vbi correspond respectively to the specific absorp-
tion coefficient of a given absorber i, its volume fraction within thepapillary dermis, and its volume fraction within whole blood.
Recall that melanin may be found dispersed in a colloidal form orclustered within the melanosomes (Section 3.1). In the former case,its specific absorption coefficients (for eumelanin and pheomelanin)are aggregated to the specific absorption coefficients of the pigmentsfound in a given layer as described earlier. In the latter case, thecomputation of its attenuation coefficient takes into account itsconcentration within each individual melanosome. This coefficientis then employed in the absorption tests performed considering thespecific geometrical and optical characteristics of these melanin-containing organelles (Section 4.2.1).
4.2 Attenuators
Melanosomes and connective fibers are incorporated into the pro-posed model as attenuators. Based on experimental investigations[Latimer 1984], the perturbations caused by these materials on thepropagated light are assumed azimuthally symmetric. Accordingly,the corresponding azimuthal angle of perturbation is uniformly sam-pled from [0, 2π ).
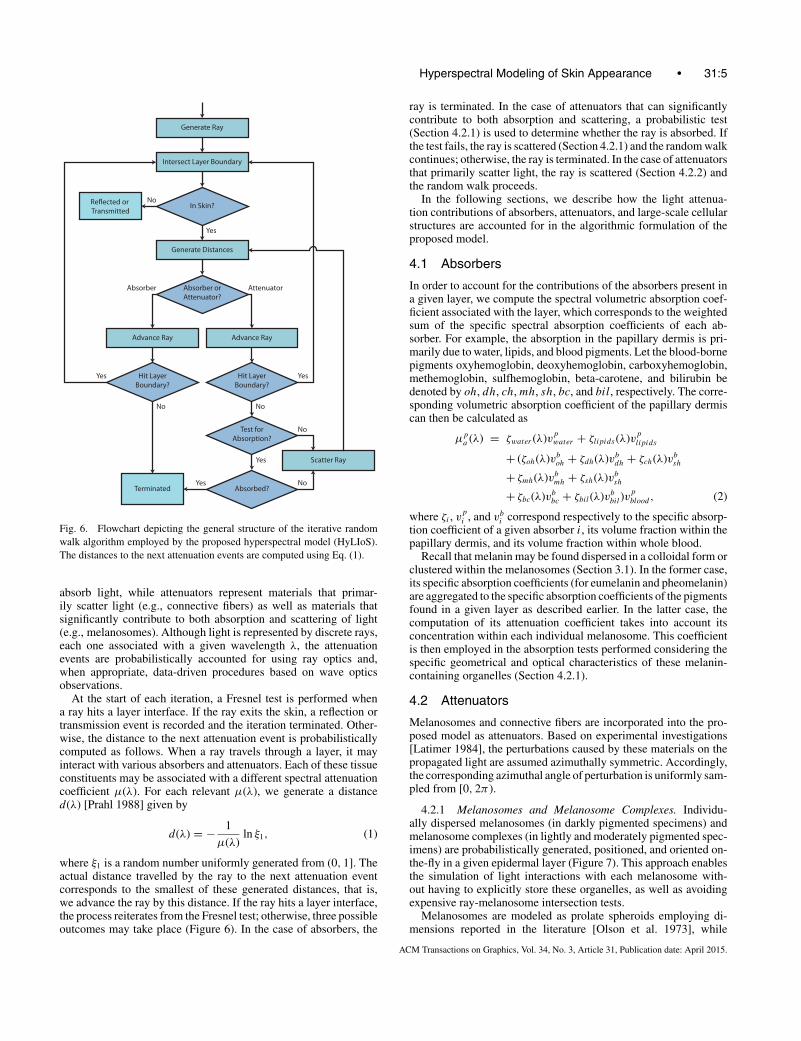
4.2.1 Melanosomes and Melanosome Complexes. Individu-ally dispersed melanosomes (in darkly pigmented specimens) andmelanosome complexes (in lightly and moderately pigmented spec-imens) are probabilistically generated, positioned, and oriented on-the-fly in a given epidermal layer (Figure 7). This approach enablesthe simulation of light interactions with each melanosome with-out having to explicitly store these organelles, as well as avoidingexpensive ray-melanosome intersection tests.
Melanosomes are modeled as prolate spheroids employing di-mensions reported in the literature [Olson et al. 1973], while
ACM Transactions on Graphics, Vol. 34, No. 3, Article 31, Publication date: April 2015.
31:6 • T. F. Chen et al.
Fig. 7. Diagram illustrating a possible path (from left to right) that can be followed by a ray traversing an epidermal layer occupied by individual melanosomes(represented by prolate spheroids). The distance to the next melanosome is probabilistically computed according to a path-length distribution. The orientationof the melanosome as well as a hitting point on its surface are also probabilistically generated. The light interaction with the melanosome is simulated, and theray is either terminated inside the melanosome or scattered. In the latter case, the melanosome is discarded and a new one generated. This process is repeateduntil the ray is either absorbed or scattered outside of the layer. The same stochastic procedure is employed for melanosome complexes.
melanosome complexes are modeled as spheres [Kollias et al. 1991].Based on experimental observations [Szabo et al. 1969], for lightlypigmented specimens the sphere diameter is set to be twice the majoraxis of the spheroids representing the encapsulated melanosomes.Similarly, for moderately pigmented specimens this diameter is setto be equal to the major axis of the spheroids [Szabo et al. 1969].
The attenuation coefficient of a melanosome is given by its geo-metric attenuation coefficient [Kimmel and Baranoski 2007]
μg = S
V
v
4, (3)
where S is the surface area, V the volume, and v the volume fraction.The ratio S/V for a prolate spheroid is calculated as
S
V= 3
2a
(a
b+ arcsin c
c
), (4)
where a and b correspond to the lengths of the semi-minor andsemi-major axes, respectively, and c = √
(1 − a2/b2).Once the distance d is computed by substituting μg into Eq. (1),
the orientation of the prolate spheroid is selected by sampling theProbability Distribution Functions (PDFs) associated with the ori-entation that was considered while generating the distance. ThesePDFs [Yim et al. 2012] are given by
Pm(α) = χ1(1 − | cos α|) + χ2| cos α|χ1 + χ2
, (5)
Pm(β) = 1
2π, (6)
where α and β correspond, respectively, to the polar and azimuthalangles defining the ray direction, and χ1 and χ2 correspond tothe cross-sectional areas of the spheroid associated with its minorand major axes, respectively. Note that if the spheroid overlaps itspredecessor, it is rejected and another one generated. Similarly, thespheroid is also rejected if it crosses a layer boundary. Finally, thehitting point on the spheroid surface is randomly selected amongthe set of points facing the ray, that is, by uniformly selecting arandom point from the spheroid’s projected surface facing the ray.
After the position, orientation, and hitting point are selected,the model simulates the light-melanosome interactions taking intoaccount the dual photon-wave nature of these interactions. As ob-served by Latimer [1984], when light traverses an organelle, thelight waves tend to reach out and interact with parts of the organellethat are geometrically outside their straight-line path, resulting inan absorption enhancement. In order to account for this absorptionenhancement, the ray traversing the melanosome is tested for ab-sorption considering the possibility of multiple internal interactions
as described next. The distance that the ray can travel until the nextattenuation event is computed employing Eq. (1) and using the ag-gregated specific absorption coefficients of eumelanin and pheome-lanin as the corresponding attenuation coefficient (Section 4.1). Ifthis distance does not allow the ray to exit the melanosome, the rayis terminated, otherwise, a Fresnel test is performed to determinewhether the ray is transmitted out of or bounced inside the spheroiddue to the refractive index difference between the clustered melaninand the surrounding medium (epidermal tissue). When the ray isbounced, it is diffusely perturbed to account for the irregular mor-phology of the different melanosome parts [Kollias et al. 1991] sub-jected to the light-organelle interactions [Latimer 1984] mentionedearlier. Accordingly, the polar perturbation angle is sampled from[0, π/2) using a PDF based on the cosine distribution, that is, thepolar perturbation angle is given by arccos(
√1 − ξ2), where ξ2 rep-
resents a random number uniformly sampled from [0,1). Rejectionsampling is employed to guarantee that the perturbed ray, denotedby �rp , remains inside the melanosome, that is, if �rp · �n < 0, where �ncorresponds to the inward normal at the intersection point, the ray isrejected. In this case, another perturbed ray is obtained and the re-jection test repeated. After applying this perturbation procedure, theprocess inside the melanosome reiterates from the absorption test.
In the case of the melanosome complexes, their attenuation co-efficient is also obtained using Eq. (3), with the ratio S/V givenby 3/rs [Kimmel and Baranoski 2007], where rs is the radius ofthe corresponding sphere. When a ray encounters a melanosomecomplex, it interacts with at most nm encapsulated melanosomes,where nm corresponds to the ratio of the diameter of the encap-sulating sphere to the minor axis of the spheroid representing themelanosomes [Szabo et al. 1969]. Each of these interactions willinvolve the melanosome orientation selection and the absorptiontest described before.
If a ray is not absorbed by an individually dispersed melanosomeor a melanosome complex, it is scattered. The forward scatter-ing behavior of the melanosomes [Chedekel 1995] is simulatedusing a data-driven procedure that also follows the dual photon-wave nature of the light-organelle interactions [Latimer 1984] men-tioned earlier. More specifically, the corresponding polar scatter-ing angle θm is sampled from an exponential distribution that hasa mean angle θ◦. This mean angle was selected to be 5◦ basedon wave optics experimental observations on the scattering behav-ior of pigment-containing organelles [Latimer 1984]. Furthermore,since light-melanosome interactions have an increasingly dimin-ished contribution to light attenuation from 780nm–1300nm, beingessentially negligible beyond ≈ 1400nm [Anderson and Parrish1982], we linearly reduce θ◦ to 0 over this region. Accordingly, thepolar angle θm is generated using Algorithm 1, where ξ3 and ξ4
are random numbers uniformly sampled from [0, 1). Similarly, in
ACM Transactions on Graphics, Vol. 34, No. 3, Article 31, Publication date: April 2015.

Hyperspectral Modeling of Skin Appearance • 31:7
the case of a melanosome complex, Algorithm 1 is applied if allencapsulated melanosomes fail the absorption test.
ALGORITHM 1: Exponential perturbation (mean angle θ◦)φ = arctan (θ◦)max = (1/θ◦) × exp (−φ/θ◦) × sin (φ)repeat
ξ3, ξ4 = random[0, 1)θm = πξ3
until max × ξ4 ≤ (1/θ◦) × exp (−θm/θ◦) × sin (θm)return θm
4.2.2 Connective Fibers. It has been proposed [Jacques 1996]that the scattering caused by the thin connective fibers in the pap-illary dermis follows the Rayleigh scattering formulation. Hence,the attenuation coefficient associated with these fibers is calculatedusing the following expression [McCartney 1976] for the Rayleighscattering coefficient:
μRs (λ) = 128π 5r6vf
3λ4
(4
3πr3
)−1 (η2 − 1
η2 + 1
)2
, (7)
where r and vf represent the radius and the volume fraction occu-pied by the connective fibers, respectively, and η corresponds to theratio between the refractive index of these scatterers to the refrac-tive index of their surrounding medium. Based on data providedby Jacques [1996], we consider r = 100nm, η = 1.5/1.33, andvf = 0.22 as default values in our simulations.
The ray direction of propagation is perturbed considering theRayleigh scattering distribution [McCartney 1976]. Accordingly,the polar angle θR is generated using Algorithm 2, where ξ5 andξ6 are random numbers uniformly sampled from [0, 1). Since theattenuation coefficient computed for these materials describes bulkscattering, the contributions of these attenuators are taken into ac-count only once per ray pass through the papillary dermis.
ALGORITHM 2: Rayleigh perturbationrepeat
ξ5, ξ6 = random[0, 1)θR = πξ5
until ξ6 ≤(
3√
68
)(1 + cos2 θR) sin θR
return θR
4.3 Large-Scale Cellular Structures
A portion of the light that interacts with the skin surface (stratumcorneum) cells may be reflected back to the environment followingthe execution of a Fresnel test [Anderson and Parrish 1982]. Toaccount for the influence of the skin surface roughness on the distri-bution of the reflected rays, the surface normals are perturbed usinga procedure based on the Trowbridge-Reitz function [Trowbridgeand Reitz 1975] that represents rough air-cell interfaces using ran-domly curved microareas. Accordingly, when a ray impinges onthe skin surface, the azimuthal angle of the perturbed surface nor-mal is uniformly sampled from [0, 2π ), while the polar angle θs isgenerated using the following distribution:
Ps(θs) = s4
(s2 cos2 θs + sin2 θs)2sin θs, (8)
where s is the roughness parameter associated with the aspect ratioof the stratum corneum cells, that is, the flatter the cells (lowers), the closer the spatial distribution of reflected rays approaches aspecular distribution.
Since the large cellular structures found in the hypodermis reflectmost of the impinging light (Section 3.2), the dermal-hypodermaljunction is set to have a reflectance equal to 1. In addition, con-sidering that light becomes progressively more diffuse as it trav-els further within the dermis [Jacques et al. 1987], the rays re-flected at the dermal-hypodermal junction are diffusely perturbed,that is, the azimuthal perturbation angle is uniformly sampled from[0, 2π ) and the polar perturbation angle is sampled from [0, π/2)using the PDF based on the cosine distribution previously provided(Section 4.2.1).
5. RESULTS AND DISCUSSION
In order to evaluate the predictive capabilities of the proposedmodel, we have compared its results with measured data andexperimental observations reported in the literature. In the absenceof measured skin characterization data for the specimens used inthe actual experiments, the values assigned to the pigmentationparameters employed in the computation of the HyLIoS modeledcurves (Table I) were selected based on the specimens’ originaldescriptions and the corresponding ranges for these parametersprovided in related scientific work [Kollias et al. 1991; Jacques1996; Hennessy et al. 2005; Lister 2013]. In order to account formelanosome degradation in the upper epidermal layers [Nielsenet al. 2006], the axes of the melanosomes located in the stratumspinosum and stratum granulosum were set, respectively, as 50%and 25% of the values (in μm × μm) provided by Olson et al.[1973], namely 0.40 × 0.17 and 0.69 × 0.28 for lightly and darklypigmented specimens, respectively.
For conserving space, the values selected for the remaining modelparameters, such as the thickness, refractive index, and water con-tent associated with each skin layer, are provided in a supplementarydata file [Chen et al. 2014] along with the concentrations and absorp-tion spectra of the absorbers employed in our simulations, whichinclude all those cited in Section 3.1. In addition, we note thatHyLIoS can be run online [Natural Phenomena Simulation Group(NPSG) 2014] via a model distribution system [Baranoski et al.2012] that enables researchers to specify simulation conditions (e.g.,angle of incidence and spectral range), modify specimen character-ization parameters, and obtain modeled directional-hemisphericalreflectance curves including those depicted in the quantitative com-parisons presented in this work. Regarding the rendered images inthe visible domain presented herein, unless otherwise stated, theywere generated considering BSSRDF readings and light sourcesthat approximate a standard D65 illuminant [Hunter and Harold1987].
5.1 Quantitative and Qualitative Comparisons
Existing skin appearance models designed for applications in thevisible domain, such as the diffusion-theory-based model proposedby Donner and Jensen [2006] (henceforth referred to as DJ06) andthe stochastic model proposed by Krishnaswamy and Baranoski[2004a] (known as BioSpec), assume melanin to be uniformly dis-tributed in a single layer representing the epidermis. Moreover,they take into account neither the particle nature nor the distribu-tion patterns of the melanosomes (Section 3.2). These limitationspreclude these models from accounting for detour and sieve effects(Section 3.3), which can lead to prominent discrepancies, notably
ACM Transactions on Graphics, Vol. 34, No. 3, Article 31, Publication date: April 2015.

31:8 • T. F. Chen et al.
Table I. Main HyLIoS Pigmentation Parameters Used to Generate Reflectance Curves for Different Skin SpecimensParameter S1 S2 S3 S4Epidermal Melanosome Content (%) 1.0, 1.0, 1.0 0.00, 0.00, 3.75 0.00, 0.00, 3.0 10.0, 10.0, 10.0Epidermal Colloidal Melanin Content (%) 0.8 1.25 1.35 15.0Melanosome Eumelanin Concentration (mg/mL) 90.0 50.0 32.0 50.0Melanosome Pheomelanin Concentration (mg/mL) 4.0 2.0 2.0 4.0Papillary Dermis Blood Content (%) 0.2 0.7 0.3 2.5Reticular Dermis Blood Content (%) 0.2 0.7 0.3 2.5
The triples given in the top row correspond to values assigned to the three epidermal strata: granulosum, spinosum, and basale, respectively. Note thatthe datasets S1, S2, and S3 correspond to specimens with relative low level of melanin pigmentation [Vrhel et al. 1994; Cooksey and Allen 2013], whiledataset S4 corresponds to a specimen with a high level of melanin pigmentation [Jacquez et al. 1955a, 1955b]. Accordingly, the simulations considerthe melanosomes distributed as complexes (Figure 3 (left)) when using datasets S1, S2, and S3, and as individually dispersed particles (Figure 3 (right))when using dataset S4 [Szabo et al. 1969; Olson et al. 1973].
Fig. 8. Comparisons of modeled spectral curves obtained using DJ06[Donner and Jensen 2006], BioSpec [Baranoski and Krishnaswamy 2010],and HyLIoS models with measured NCSU spectral curves 117 (left) and113 (right) [Vrhel et al. 1994]. The HyLIoS curves on the left and right werecomputed using the pigmentation datasets S1 and S2, respectively (Table I).
in the blue end of the spectrum characterized by higher melaninabsorption. Such discrepancies can be observed in the graphs pre-sented in Figure 8. These graphs show comparisons of modeledresults provided by DJ06, BioSpec, and HyLIoS with measuredresults provided by Vrhel et al. [1994] considering an angle of in-cidence of 45◦, which are made available in a spectra database atthe North Carolina State University (NCSU). In these comparisons,we employed NCSU curves used as references in the original eval-uations of DJ06 and BioSpec. Note that the DJ06 modeled resultsdepicted in Figure 8 were originally computed with the amount ofeumelanin set to zero as reported by Donner and Jensen [2006].Although this can mitigate the absorption-related limitations of thediffusion theory approximation outlined in Section 2, we remarkthat eumelanin is the dominant form of melanin present in humanskin under normal physiological conditions [Anderson and Parrish1982; Chedekel 1995; Hennessy et al. 2005; Kollias et al. 1991].
According to the trichromatic theory of color perception [Hunterand Harold 1987], the human eye’s response to short-wavelengthlight stimulus is significantly less strong than its response tomedium- and long-wavelength light stimuli. Since the previouslymentioned discrepancies are located in the blue end of the visiblespectrum, it is expected that they have a lower impact in the render-ing of believable images of human skin. In order to illustrate thisaspect, we have generated skin swatches using the data presentedin Figure 8 (reflectance from 400–700nm with a resolution of 5nm)in conjunction with a standard XYZ-to-sRGB conversion proce-dure [Stone 2003]. As can be observed in the images depicted inFigures 9 and 10, despite these discrepancies, all three models canbe effectively employed in the rendering of believable skin images.We remark, however, that the parameter values used in the com-putation of the BioSpec and HyLIoS curves depicted in Figure 8were in closer agreement with the biophysical characteristics of skin
Fig. 9. Skin swatches generated using modeled spectral curves providedby DJ06 (left) and HyLIoS (center) models along with a reference swatch(right) generated using measured data (NCSU spectral curve 117) providedby Vrhel et al. [1994]. The respective spectral curves are depicted in Figure 8(left).
Fig. 10. Skin swatches generated using modeled spectral curves providedby BioSpec (left) and HyLIoS (center) models along with a reference swatch(right) generated using measured data (NCSU spectral curve 113) providedby Vrhel et al. [1994]. The respective spectral curves are depicted in Figure 8(right).
specimens under normal physiological conditions, particularly withrespect to eumelanin content.
The first-principles simulation approach employed by HyLIoSaccounts not only for detour and sieve effects, but also for thestrong forward scattering behavior of the epidermal layers, mostnotably in the UV domain [Bruls and van der Leun 1984] as shownin the plot presented in Figure 11. Recall that the particle natureand distribution patterns of the melanosomes have an even strongerinfluence on the skin spectral responses in the UV range [Andersonand Parrish 1982; Chedekel 1995], and the existing spectral models,different from HyLIoS, do not account for these factors. Hence,the simple incorporation of additional absorbers acting in the UVdomain into these models would likely lead to discrepancies similarto those observed in the blue end of the visible spectrum (Figure 8).
In order to demonstrate the predictive capabilities of HyLIoSacross the UV-visible-IR range, we compared modeled curveswith measured curves provided by Cooksey and Allen [2013] andJacquez et al. [1955a, 1955b] obtained for lightly and darkly pig-mented skin specimens considering angles of incidence of 8◦ and16.75◦, respectively. As can be observed in the graphs providedin Figure 12, the relevant hyperspectral features (represented bythe peaks and valleys) and trends are reproduced by the modeled
ACM Transactions on Graphics, Vol. 34, No. 3, Article 31, Publication date: April 2015.

Hyperspectral Modeling of Skin Appearance • 31:9
Fig. 11. Comparison of modeled subsurface scattering data obtained usingHyLIoS with measured subsurface scattering data provided by Bruls andvan der Leun [1984] for the epidermis of a lightly pigmented skin specimenconsidering normal incidence of UV light (at 302nm). The modeled datawas computed using the pigmentation dataset S2 (Table I). The insets depictorthographic projections of the measured and modeled subsurface scatteringdata presented in the graph.
Fig. 12. Comparisons of modeled hyperspectral curves obtained usingHyLIoS with measured curves for a lightly pigmented specimen (top) pro-vided by Cooksey and Allen [2013] and a darkly pigmented specimen (bot-tom) provided by Jacquez et al. [1955a, 1955b]. The HyLIoS curves (from250nm–2500nm) for the lightly and darkly pigmented specimens were com-puted using the pigmentation datasets S3 and S4, respectively (Table I).
curves. For example, for wavelengths longer than ≈1300nm, theabsorption is dominated by the presence of water and lipids insteadof melanin pigmentation [Anderson and Parrish 1982], resulting ina similarity between the measured reflectance spectra in this region.Such a similarity can also be observed between the modeled re-flectance spectra. We note that localized quantitative variations canbe expected across the UV-visible-IR domains since we employed,for both specimens, the same average values [Chen et al. 2014] forkey characterization parameters such as the water content and therefractive index associated with each skin layer. As demonstrated byCooksey and Allen [2013], population variability is the most signif-icant source of uncertainty in the measurement of skin reflectance.We note, however, that our modeled results were obtained usingparameter values within physiologically valid ranges indicated inthe scientific literature.
We also examined the predictions of HyLIoS with respect tothe spatial distribution of light. Although these predictions can berepresented in terms of BSSRDF, we quantified them in terms ofBRDF and integrated the resulting values over the visible domain toobtain BRDF curves that could be compared to the measured BRDF
Fig. 13. Comparison of modeled BRDF curves (H) provided by HyLIoSwith measured BRDF curves (M) provided by Marschner et at. [1999]for a lightly pigmented specimen considering two angles of incidence: 0◦(left) and 60◦ (right). The modeled curves were obtained considering thepigmentation dataset S1 (Table I).
Fig. 14. Scattering plots provided by HyLIoS showing surface (Rs ), sub-surface (Rd ), and total (Rt ) reflectance distributions in the UV (left) and IR(right) domains. Note the more diffuse total reflectance distribution of IRlight (below 1300nm) as reported in the scientific literature [Anderson andParrish 1982; Hansen et al. 2010]. These plots correspond to normalizedbidirectional reflectance values at 365nm (left) and 1100nm (right) mul-tiplied by the cosine of the reflection angle. The bidirectional reflectancevalues were computed considering an angle of incidence of 45◦ and usingthe pigmentation dataset S1 (Table I).
curves provided by Marschner et al. [1999]. As can be observed inthe comparisons depicted in Figure 13, HyLIoS can capture theangular dependency of the spatial distribution of light interactingwith human skin in the visible domain. Moreover, recall that IRlight can penetrate deeper into the cutaneous tissues than can UVlight [Anderson and Parrish 1982], and can reach the dermal layerswhere it becomes progressively more diffuse [Jacques et al. 1987].As a result, the subsurface reflectance has a more dominant rolein the IR domain, and the overall reflected IR light, notably inthe region below 1300nm (less susceptible to water absorption),has a more diffuse distribution than does UV light [Anderson andParrish 1982; Hansen et al. 2010]. The scattering plots presentedin Figure 14 indicate that HyLIoS can capture these distinct spatialdistribution patterns of UV and IR light interacting with humanskin.
The images presented in Figure 1 further demonstrate thatHyLIoS can capture the distinct scattering behaviors of human skinin the hyperspectral domain. For example, the subject’s face showsa more specular (glossier) behavior under UV light and a more dif-fuse behavior under IR light (below 1300nm), which are consistentwith observations reported in the scientific literature [Anderson andParrish 1982; Hansen et al. 2010]. It can also be observed that,although a more compact BRDF representation may be sufficientto capture the scattering profile in the UV domain (Figure 1 (left)),it cannot fully describe the “soft”, more diffuse “ethereal” skin ap-pearance in the IR domain [Fredembach et al. 2009; Sandidge 2009]provided by a BSSRDF representation (Figure 1 (right)).
It has been observed that a progressive increase in the overallepidermal melanin content leads to a fast convergence to low re-flectance values in the UV domain [Fulton 1997]. As demonstratedby the images presented in Figure 15, HyLIoS can reproduce thistrend, moreover, these images are consistent with measurementsshowing practically identical reflectance responses for moderately
ACM Transactions on Graphics, Vol. 34, No. 3, Article 31, Publication date: April 2015.

31:10 • T. F. Chen et al.
Fig. 15. Images showing the effects of increased overall melanin pigmenta-tion on skin UV responses as reported in the scientific literature [Andersonand Parrish 1982; Cooksey and Allen 2013; Fulton 1997; Jacquez et al.1955b; Nielsen et al. 2004]. Left: 1.5%. Center: 7%. Right: 30%. The UVresponses (at 365nm) provided by HyLIoS are depicted in pseudocolor.Polygonal mesh courtesy of XYZ RGB, Inc.
Fig. 16. Images showing the magnifying effects of water loss on skinIR responses as reported in the scientific literature [Anderson and Parrish1982; Attas et al. 2002]. These effects were simulated by reducing thewater content of the cutaneous tissues of a lightly pigmented specimen(1.5% epidermal melanin content) within physiological limits [Blank 1952].Left: no reduction. Center: 20% reduction. Right: 40% reduction. The IRresponses (at 1650nm) provided by HyLIoS are depicted in pseudocolor.Polygonal mesh courtesy of XYZ RGB, Inc.
and darkly pigmented specimens in the UV domain [Jacquez et al.1955b; Cooksey and Allen 2013].
Within the IR domain, the skin spectral responses are primarilydetermined by the absorption bands of water [Cooksey and Allen2013; Jacquez et al. 1955a]. A myriad of physiological and environ-mental factors can alter the barrier activity of skin, thus intensifyingwater loss [Attas et al. 2002]. A reduction of water content in thecutaneous tissues Blank [1952] in turn results in an increase in re-flectance in the IR domain [Anderson and Parrish 1982; Attas et al.2002]. As shown by the images presented in Figure 16, this behavioris also captured by HyLIoS.
The presence of pigmentation irregularities, such as freckles andmoles, is accentuated when a skin specimen is viewed under UVlight due to the strong attenuation properties of melanin in thisspectral domain [Pathak 1995; Fulton 1997]. This phenomenon ispredictively simulated by HyLIoS as depicted in the images ofa lightly pigmented individual (1.5% epidermal melanin content)presented in Figure 1. In these images, it can also be observed thatthe presence of these irregularities is less apparent in the IR domain,which is also consistent with empirical observations reported in theIR imaging literature [Fredembach et al. 2009; Sandidge 2009].
Due to the increasingly diminished contributions of melaninto light attenuation beyond 1100nm, the presence of pigmenta-tion irregularities may become completely undetectable in this re-gion dominated by water absorption [Anderson and Parrish 1982;Jacquez et al. 1955a]. In addition, the subsurface scattering con-tributions to skin reflectance tend to decrease due to the dominantrole of water absorption, resulting in a more specular (glossier) anddarker (lower reflectance) appearance of skin in this domain. As
Fig. 17. Images showing IR responses at 1200nm (left) and 1400nm (right)for a lightly pigmented specimen (1.5% epidermal melanin content). Note asreported in the scientific literature [Anderson and Parrish 1982; Jacquez et al.1955a], the disappearance of pigmentation irregularities that occurs beyond1100nm, as well as the more specular and darker appearance resulting fromreduced subsurface scattering at a wavelength (1400nm) characterized bystrong water absorption. Both (pseudocolor) images had their brightnessincreased for visualization purposes.
Table II. MSI Values Computed Considering the Complete DatasetS3 [Chen et al. 2014] as the Baseline and Its Modified Versions: NoMelanin, No Blood, No DNA, No Keratin, No Water and No Lipids
Removed MaterialsMelanin Blood DNA Keratin Water Lipids
MSI 0.415 0.229 0.135 0.068 0.611 0.026SD Vis Vis UV UV IR IR
MSIH 0.123 0.049 0.018 0.012 0.491 0.022
MSI values were computed for the spectral domain, denoted by “SD”, in which theremoval of each selected material has the highest impact. The MSI values computedconsidering the entire hyperspectral region of interest (250–2500nm), denoted by MSIH ,are also included for reference.
Fig. 18. Comparison of modeled results provided by HyLIoS depictingthe impact of melanin and blood on skin reflectance, obtained consideringthe complete dataset S3 [Chen et al. 2014] as the baseline and two modifiedversions: with no melanin and no blood. Left: reflectance curves in the visibledomain. Right: MSI values for each modified reflectance curve with respectto the baseline curve across the UV, visible, IR, and entire hyperspectralregion of interest (250–2500nm) denoted by “Hyper”.
demonstrated by the images presented Figure 17, these trends arealso predictively reproduced by HyLIoS.
5.2 Input-Sensitivity Analysis
In the previous section, we have illustrated some of the effects thatthe main absorbers found within the cutaneous tissues have on mod-eled skin appearance attributes obtained using HyLIoS. Due to thedifferent roles of these materials in the UV (250–400nm), visible(400–700nm) and IR (700–2500nm) regions of the light spectrum,it is expected that, for applications targeting a specific spectral do-main, the parameters associated with a number of these materialsmay be kept fixed, that is, set to standard (average) values. In orderto assess this possibility, we have performed an input-sensitivity
ACM Transactions on Graphics, Vol. 34, No. 3, Article 31, Publication date: April 2015.
Hyperspectral Modeling of Skin Appearance • 31:11
Fig. 19. Skin swatches illustrating the impact of melanin or blood removalon the visible appearance of human skin considering the complete datasetS3 [Chen et al. 2014] as baseline (left) and two modified versions: with nomelanin (center) and no blood (right).
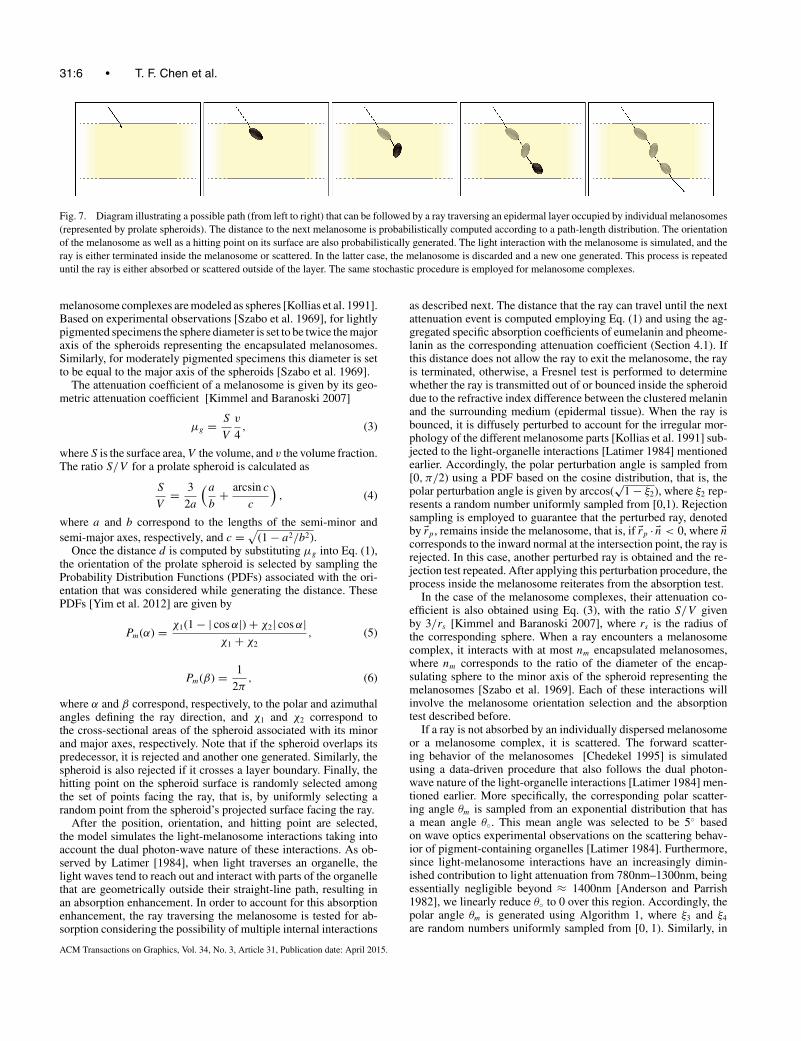
Fig. 20. Comparison of modeled results provided by HyLIoS depictingthe impact of DNA and keratin on skin reflectance, obtained consideringthe complete dataset S3 [Chen et al. 2014] as the baseline and two modifiedversions: with no DNA and no keratin. Left: reflectance curves in the UVdomain. Right: MSI values for each modified reflectance curve with respectto the baseline curve across the UV, visible, IR, and entire hyperspectralregion of interest (250–2500nm) denoted by “Hyper”.
Fig. 21. Skin swatches illustrating the impact of DNA or keratin removalon the UV appearance of human skin considering the complete dataset S3[Chen et al. 2014] as baseline (left) and two modified versions: with noDNA (center) and no keratin (right). The UV responses are depicted inpseudocolor.
analysis Hamby [1994, 1995] in which we compared those ob-tained considering the complete dataset S3 [Chen et al. 2014] withthose computed using modified versions of this dataset. These ver-sions in turn account for the removal of specific materials, namelymelanin, blood, DNA, keratin, water, and lipids. Note that we se-lected, without loss of generality, dataset S3 as baseline since itscorresponding modeled reflectance curve (Figure 12 (top)) coversthe entire hyperspectral region of interest. We also remark that thisdataset is available at the HyLIoS Web site [Natural PhenomenaSimulation Group (NPSG) 2014], which can be used to reproducethe results presented in this section by setting the parameters asso-ciated with a specific material to zero. The impact of each of theselected materials was quantified in terms of the mean sensitivityindex Hamby [1994, 1995] expressed as
MSI = 1
N
N∑i=1
|ρb(λi) − ρm(λi)|max{ρb(λi), ρm(λi)} , (9)
Fig. 22. Comparison of modeled results provided HyLIoS depicting theimpact of water and lipids on skin reflectance, obtained considering thecomplete dataset S3 [Chen et al. 2014] as the baseline and two modifiedversions: with no water and no lipids. Left: reflectance curves in the IRdomain. Right: MSI values for each modified reflectance curve with respectto the baseline curve across the UV, visible, IR, and entire hyperspectralregion of interest (250–2500nm) denoted by “Hyper”.
Fig. 23. Skin swatches illustrating the impact of water or lipids removalon the IR appearance of human skin considering the complete dataset S3[Chen et al. 2014] as baseline (left) and two modified versions: with no water(center) and no lipids (right). The IR responses are depicted in pseudocolor.
Fig. 24. Rendered images illustrating changes in the visible appearanceof human skin considering an increase in epidermal melanin content from1.5% (left) to 7% (right). Note that we employed a back/side light source tomake the translucency effects prominent. Polygonal mesh courtesy of XYZRGB Inc.
where ρb and ρm correspond to the reflectances associated withthe baseline and modified datasets, respectively, and N is the totalnumber of wavelengths sampled with a 5nm resolution.
The overall results of our analysis presented in Table II showthat melanin and water have the largest impact on the modeledreflectances. It is necessary to consider, however, that although agiven material may not have a large impact in a certain spectral do-main, it can still have a significant effect in the model’s predictions.In order to demonstrate this aspect, we also present the results ofour analysis grouped by materials that have their greatest impactin the visible, UV, and IR domains, respectively. These results inturn are further illustrated by skin swatches rendered using the cor-responding modeled reflectances. The swatches depicting visibletraits (Figure 19) were generated using the same approach employedin the rendering of the swatches depicted in Figures 9 and 10. Thecolors of the swatches in the UV and IR domains (Figures 20 and22) were obtained by integrating the respective reflectance values
ACM Transactions on Graphics, Vol. 34, No. 3, Article 31, Publication date: April 2015.

31:12 • T. F. Chen et al.
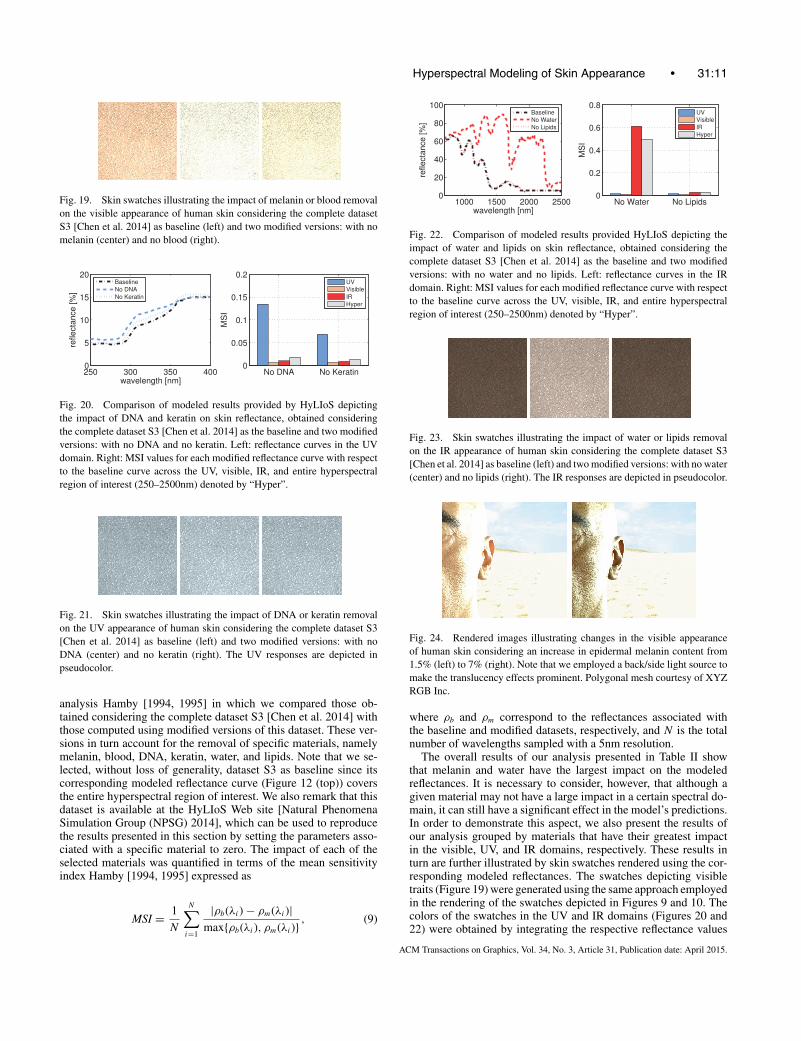
Fig. 25. Images illustrating rendering applications of HyLIoS in the UV (left), visible (center), and IR (right) spectral domains. The scene depicts an upper,back/shoulder (epidermal melanin content equal to 1.5%) with sunscreen and water in an outdoor beach setting. The UV and IR responses (at 365nm and1650nm, respectively) are depicted using pseudocolor. The dark appearance of sunscreen and water outside the visible domain are attributed to their strongabsorptive behavior in the UV and IR regions, respectively. Note that we have positioned the light source high above the subject in order to mimic a typicaloutdoor beach setting.
over the relevant spectral region and applying a tinted grayscalefilter to the resulting values.
As can be observed in Figure 18 (left), the contributions ofmelanin and blood to skin appearance are prominent in the visi-ble domain as the removal of either material significantly increasesskin reflectance. Also, note that the characteristic omega shape ob-served in 500–600nm range vanishes with the removal of blood.These effects are reflected in the skin swatches (Figure 19), whichdepict a lighter appearance associated with the modified datasets.In addition, these materials have a significant impact outside thevisible domain (Figure 18 (right)). Note that the baseline datasetcorresponds to a lightly pigmented specimen, while specimens withhigher melanin pigmentation levels, the dominant role of melanin isexpected to be even more pronounced [Anderson and Parrish 1982].
Besides melanin and blood, other materials also have an impact,albeit not as pronounced, in the UV domain. For example, the re-moval of DNA or keratin yields higher reflectance (Figure 20 (left)),and results in a lighter UV appearance of skin (Figure 21). Althoughthe removal of these materials affects other spectral regions, its ef-fect is more significant in the UV domain (Figure 20 (right)).
The presence of water and lipids primarily affects the skin re-flectance in the IR region, with water being the more dominantmaterial (Figure 22 (left)). Accordingly, after water removal, skinappears significantly brighter in the IR domain (Figure 23). On theother hand, these materials have comparably negligible impact inthe UV and visible domains (Figure 22 (left)).
In summary, for simulations aimed at believable rendering ap-plications (Figures 24 and 25), the results presented in this sectionindicate that only the HyLIoS parameters associated with specificmaterials need to be modified in order to generate images of skinspecimens with distinct appearance traits in a selected spectral re-gion. For example, in the case of the visible domain dominated bymelanin and blood, Table I provides the subset of parameters thatcan lead to the most significant skin appearance variations in this re-gion. We note, however, that the HyLIoS detailed parameter spaceenables experimentation with a wider range of those biophysicalfactors associated with different physiological conditions affectingskin appearance. Such a capability is an asset for simulations aimedat broader applications in the life and health sciences.
5.3 Performance Issues
We observe that the current (CPU-based) implementation ofHyLIoS is not particularly suitable for those real-time applications
in the visible domain that demand results on the order of mil-liseconds. For example, it took ≈30s on a dual 6-core 2.66GHzIntel Xeon machine to obtain the 5nm resolution curves depicted inFigure 8 using 105 sample rays. Since several factors (e.g., imageresolution, spectral sampling, and geometry) affect rendering time,it may take minutes or hours to generate an image, however, thereare several hardware and software strategies that can be exploredto enhance performance. For example, appearance attributes can becomputed offline and quickly accessed on demand during the imagegeneration process. We intend to explore such alternatives in ourfuture work, as outlined in the next section.
6. CONCLUSION AND FUTURE WORK
In this article, we have described the first skin appearance modeldesigned for the comprehensive simulation of spectral and spatialdistributions of light interacting with human skin in the hyperspec-tral domain, from 250–2500nm. The proposed model represents thelayered structure of the cutaneous tissues in more detail in compar-ison with existing skin appearance models, notably incorporatingthe particle nature and the different distribution patterns of themelanin-containing organelles. These features enable it to appro-priately account for the positional dependence of skin reflectanceas well as sieve and detour effects affecting light absorption withinthe cutaneous tissues.
By addressing the predictive modeling of skin appearance at-tributes in the hyperspectral domain, we aimed to contribute notonly to the realistic rendering of human skin for entertainment,aesthetic, and educational purposes, but also for potential interdis-ciplinary applications such as the investigation of adverse effects ofUV exposure and water loss on skin appearance. Accordingly, thepredictive capabilities of the proposed model were evaluated pri-marily through comparisons with measured data and experimentalobservations reported in the scientific literature.
As future work, we plan to examine strategies for incorporat-ing the proposed model into real-time rendering frameworks byexploiting specialized graphics hardware and numerical reconstruc-tion approaches based on the use of principal component analy-sis and regression methods. In addition, we intend to address thesimulation of phenomena such as skin fluorescence, in which theenergy of different wavelengths is not decoupled (as opposed tothe energy decoupling assumption traditionally employed in imagesynthesis).
ACM Transactions on Graphics, Vol. 34, No. 3, Article 31, Publication date: April 2015.

Hyperspectral Modeling of Skin Appearance • 31:13
ELECTRONIC APPENDIX
The electronic appendix to this article can be accessed in the ACMDigital Library.
REFERENCES
R. Anderson and J. Parrish. 1982. Optical properties of human skin. In TheScience of Photomedicine, J. Regan and J. Parrish, Eds., Plenum Press,147–194.
M. Attas, T. Posthumus, B. Schattka, M. Sowa, H. Mantsch, and S. Zhang.2002. Long-wavelength near-infrared spectroscopic imaging for in-vivoskin hydration measurements. Vibrat. Spectroscopy 28, 37–43.
G. V. G. Baranoski, T. F. Chen, B. W. Kimmel, E. Miranda, and D. Yim.2012. On the noninvasive optical monitoring and differentiation of methe-moglobinemia and sulfhemoglobinemia. J. Biomed. Optics 17, 9, 097005–1–14.
G. V. G. Baranoski, T. Dimson, T. F. Chen, B. Kimmel, D. Yim, and E.Miranda. 2012. Rapid dissemination of light transport models on theWeb. IEEE Comput. Graph. Appl. 32, 10–15.
G. V. G. Baranoski and A. Krishnaswamy. 2010. Light and Skin Interactions:Simulations for Computer Graphics Applications. Morgan Kaufmann/Elsevier.
I. Blank. 1952. Factors which influence the water content of the stratumcorneum. J. Investigat. Dermatol. 18, 6, 433–440.
W. G. Bruls and J. Van Der Leun. 1984. Forward scattering properties ofhuman epidermal layers. Photochem. Photobiol. 40, 2, 231–242.
W. Butler. 1964. Absorption spectroscopy in vivo: Theory and application.Ann. Rev. Plant Phys. 15, 451–470.
P. G. Cavalcanti, J. Scharcanski, and G. V. G. Baranoski. 2013. A two-stage approach for discriminating melanocytic skin lesions using standardcameras. Expert. Syst. Appl. 40, 10, 4054–4064.
M. Chedekel. 1995. Photophysics and photochemistry of melanin. InMelanin: Its Role in Human Photoprotection, M. C. L. Zeise and T.Fitzpatrick, Eds., Valdenmar, 11–22.
B. Chen, K. Stamnes, and J. Stamnes. 2001. Validity of the diffusion ap-proximation in bio-optical imaging. Appl. Optics 40, 34, 6356–6336.
T. F. Chen, G. V. G. Baranoski, B. W. Kimmel, and E. Miranda. 2014.Supplementary data for the hyperspectral modeling of skin appearance.NPSG, University of Waterloo, Canada.
C. Cooksey and D. Allen. 2013. Reflectance measurements of human skinfrom the ultraviolet to the shortwave infrared (250 nm to 2500 nm). InProceedings of the SPIE Conference on Active and Passive Signatures(SPIE’13). Vol. 8734.
K. V. De Graaff. 1995. Human Anatomy, 4th Ed. W. C. Brown Publishers.
E. D’eon and G. Irving. 2011. A quantized-diffusion model for renderingtranslucent materials. ACM Trans. Graph. 30, 4, 56:1–13.
C. Donner and H. W. Jensen. 2006. A spectral bssrdf for shading humanskin. In Proceedings of the 17th Eurographics Workshop on RenderingTechniques (EGSR’06). 409–418.
C. Donner, T. Weyrich, E. D’eon, R. Ramamoorthi, and S. Rusinkiewicz.2008. A layered, heterogeneous reflectance model for acquiring and ren-dering human skin. ACM Trans. Graph. 27, 5, 140:1–12.
A. Doronin and I. Meglinski. 2011. Online object oriented monte carlocomputational tool for needs of the biomedical optics. Biomed. OpticsExpress 2, 9, 2461–2469.
J. Dorsey, H. Rushmeier, and F. Sillion. 2007. Digital Modeling of MaterialAppearance. Morgan Kaufmann/Elsevier, Burlington, MA.
C. Fredembach, N. Barbuscla, and S. Susstrunk. 2009. Combining visibleand near-infrared images for realistic skin smoothing. In Proceedings ofthe 17th Color and Imaging Conference (CIC’09). 242–247.
M. Fuchs, V. Blanz, H. Lensch, and H. Seidel. 2005. Reflectance fromimages: A model-based approach for human faces. IEEE Trans. Visual.Comput. Graph. 11, 3, 296–305.
J. Fulton. 1997. Utilizing the ultraviolet (uv detect) camera to enhance theappearance of photodamage and other skin conditions. Dermatol. Surgery23, 163–169.
A. Ghosh, T. Hawkins, P. Peers, S. Frederiksen, and P. Debevec. 2008.Practical modeling and acquisition of layered facial reflectance. ACMTrans. Graph. 27, 5, 139:1–10.
D. Greenberg, J. Arvo, E. Lafortune, K. Torrance, J. Ferwerda, B. Walter,B. Trumbore, P. Shirley, S. Pattanaik, and S. Foo. 1997. A framework forrealistic image synthesis. In Proceedings of the 24th Annual Conference onComputer Graphics and Interactive Techniques (SIGGRAPH’97). 477–494.
D. Hamby. 1994. A review of techniques for parameter sensitivity analysisof environmental models. Environ. Monitor. Assess. 32, 2, 135–154.
D. Hamby. 1995. A comparison of sensitivity analysis techniques. HealthPhys. 68, 195–204.
P. Hanrahan and W. Krueger. 1993. Reflection from layered surfaces due tosubsurface scattering. In Proceedings of the 20th Annual Conference onComputer Graphics and Interactive Techniques (SIGGRAPH’93). 165–174.
M. Hansen, G. Atkinson, L. Smith, and M. Smith. 2010. 3D face recon-structions from photometric stereo using near infrared and visible light.Comput. Vis. Image Understand. 114, 942–951.
A. Hennessy, C. Oh, B. Diffey, K. Wakamatsu, S. Ito, and J. Rees. 2005.Eumelanin and pheomelanin concentrations in human epidermis beforeand after uvb irradiation. Pigment Cell Res. 18, 220–223.
A. Hielscher, S. Jacques, L. Wang, and F. Tittel. 1995. The influence ofboundary conditions on the accuracy of diffusion theory in time-resolvedreflectance spectroscopy of biological tissues. Phys. Med. Biol. 40, 1957–1975.
R. Hunter and R. Harold. 1987. The Measurement of Appearance, 2nd ed.John Wiley and Sons.
T. Igarashi, K. Nishino, and S. K. Nayar. 2007. The appearance of humanskin: A survey. Foundat. Trends. Comput. Graph. Vis. 3, 1, 1–95.
S. L. Jacques. 1996. Origins of tissue optical properties in the uva, visible,and nir regions. OSA TOPS Adv. Optical Imag. Photon Migrat. 2, 364–369.
S. L. Jacques, C. A. Alter, and S. A. Prahl. 1987. Angular dependenceof HeNe laser light scattering by human dermis. Lasers Life Sci. 1,309–333.
J. Jacquez, J. Huss, W. Mckeehan, J. Dimitroff, and H. Kuppenhein. 1955a.Spectral reflectance of human skin in the region 0.7-2.6 μ. J. Appl. Physiol.8, 297–299.
J. Jacquez, J. Huss, W. Mckeehan, J. Dimitroff, and H. Kuppenhein. 1955b.Spectral reflectance of human skin in the region 235–700 mμ. J. Appl.Physiol. 8, 212–214.
J. Jimenez, T. Scully, N. Barbosa, C. Donner, X. Alvarez, T. Vieira, P. Matts,V. Orvalho, D. Gutierrez, and T. Weyrich. 2010. A practical appearancemodel for dynamic facial color. ACM Trans. Graph. 29, 6, 141:1–10.
M. H. Kim, T. A. Harvey, D. S. Kittle, H. Rushmeier, J. Dorsey, R. Prum, andD. Brady. 2012. 3D Imaging spectroscopy for measuring hyperspectralpatterns on solid objects. ACM Trans. Graph. 31, 4, 38:1–11.
B. W. Kimmel and G. V. G. Baranoski. 2007. A novel approach for sim-ulating light interaction with particulate materials: Application to themodeling of sand spectral properties. Optics Express 15, 15, 9755–9777.
N. Kollias, R. M. Sayre, L. Zeise, and M. R. Chedekel. 1991. Photoprotectionby melanin. J. Photochem. Photobiol. B9, 2, 135–60.
ACM Transactions on Graphics, Vol. 34, No. 3, Article 31, Publication date: April 2015.

31:14 • T. F. Chen et al.
A. Krishnaswamy and G. V. G. Baranoski. 2004a. A biophysically-basedspectral model of light interaction with human skin. Comput. Graph.Forum 23, 3, 331–340.
A. Krishnaswamy and G. V. G. Baranoski. 2004b. Combining a shared-memory high performance computer and a heterogeneous cluster for thesimulation of light interaction with human skin. In Proceedings of the16th International Symposium on Computer Architecture and High Per-formance Computing (SBAC-PAD’04). P. N. J. Gaudiot, M. L. Pilla, andS. Song, Eds, IEEE Computer Society, 166–171.
P. Latimer. 1984. A wave-optics effect which enhances light absorption bychlorophyll in vivo. Photochem. Photobiol. 40, 2, 193–199.
T. S. Lister. 2013. Simulating the color of port wine stain skin.Ph.D. thesis, University of Southampton, UK http://eprints.soton.ac.uk/352088/1.hasCoversheetVersion/Lister.pdf.
H. Mahler, J. Kulik, F. Gibbons, M. Gerrad, and J. Harrel. 2003. Effectsof appearance-based interventions on sun protection intentions and self-reported behaviors. Health Psychol. 22, 2, 199–209.
S. Marschner, S. H. Westin, E. Lafortune, K. Torrance, and D. Greenberg.1999. Reflectance measurements of human skin. Tech. rep. PCG-99-2,Program of Computer Graphics, Cornell University.
E. J. Mccartney. 1976. Optics of the Atmosphere: Scattering by Moleculesand Particles. John Wiley and Sons, New York.
S. Merillou and D. Ghazanfarpour. 2008. A survey of aging and weatheringphenomena in computer graphics. Comput. Graph. 32, 2, 159–174.
Natural Phenomena Simulation Group (NPSG). 2014. Run hylios online.School of Computer Science, University of Waterloo, Ontario, Canada.http://www.npsg.uwaterloo.ca/models/hylios.php.
C. Ng and L. Li. 2001. A multi-layered reflection model of natural humanskin. In Proceedings of the Computer Graphics International Conference(CGI’01). 249–256.
F. Nicodemus, J. Richmond, J. Hsia, I. Ginsberg, and T. Limperis. 1992.Geometrical considerations and nomenclature for reflectance. In Physics-Based Vision Principles and Practice: Radiometry, L. Wolff, S. Shafer,and G. Healey, Eds. Jones and Bartlett, Boston, 94–145.
K. Nielsen, L. Zhao, J. Stamnes, K. Stamnes, and J. Moan. 2004. Reflectancespectra of pigmented and nonpigmented skin in the uv spectral region.Photochem. Photobiol. 80, 450–455.
K. P. Nielsen, L. Zhao, J. J. Stamnes, K. Stamnes, and J. Moan. 2006. Theimportance of the depth distribution of melanin in skin for DNA protectionand other photobiological processes. J. Photochem. Photobio. B. 82, 3,194–198.
A. S. Nunez. 2009. A physical model of human skin and its applicationfor search and rescue. Ph.D. thesis, Air Force Institute of Technology,Wright-Patterson Air Force Base, Ohio.
R. L. Olson, J. Gaylor, and M. A. Everett. 1973. Skin color, melanin, anderythema. Arch. Dermatol. 108, 4, 541–544.
M. Pathak. 1995. Functions of melanin and protection by melanin. InMelanin: Its Role in Human Photoprotection, M. C. L. Zeise and T.Fitzpatrick, Eds, Valdenmar, 125–134.
S. Prahl. 1988. Light transport in tissue. Ph.D. thesis, The University ofTexas at Austin. http://omlc.org/∼prahl/pubs/pdf/prahl88.pdf.
D. Sandidge. 2009. Digital Infrared Photography Photo Workshop.Wiley.
P. Schroeder, J. Haendeler, and J. Krutmann. 2008. The role of infraredradiation in photoaging of skin. Experimen. Gerontol. 43, 629–632.
J. Stam. 2001. An illumination model for a skin layer bounded by roughsurfaces. In Proceedings of the 12th Eurographics Workshop on RenderingTechniques (Eurographics’01). Springer, 39–52.
M. Stone. 2003. A Field Guide to Digital Color. AK Peters, Natick, MA.G. Szabo, A. Gerald, M. Pathak, and T. B. Fitzpatrick. 1969. Racial differ-
ences in the fate of melanosomes in human epidermis. Nature 222, 5198,1081–1082.
T. S. Trowbridge and K. P. Reitz. 1975. Average irregularity representa-tion of a rough surface for ray reflection. J. Optical Soc. Amer. 65, 5,531–536.
N. Tsumura, M. Kawabuchi, H. Haneishi, and Y. Miyabe. 2000. Mappingpigmentation in human skin by multi- visible-spectral imaging by inverseoptical scattering technique. In Proceedings of the 8th IS&T/SID ColorImaging Conference (CIC’00). 81–84.
V. Tuchin. 2007. Tissue Optics: Light Scattering Methods and Instrumentsfor Medical Diagnosis. SPIE.
M. Vrhel, R. Gershon, and L. Iwan. 1994. Measurement and analysis ofobject reflectance spectra. Color Res. Appl. 19, 1, 4–9.
L. Wang, S. Jacques, and L. Zheng. 1995. MCML – Monte Carlo modellingof light transport in multi-layered tissues. Comput. Methods Prog. Biomed.47, 131–146.
T. Weyrich, W. Matusik, H. Pfister, B. Bickel, C. Donner, C. Tu, J. Mcandless,J. Lee, A. Ngan, H. W. Jensen, and M. Gross. 2006. Analysis of humanfaces using a measurement-based skin reflectance model. In Proceedingsof the 33rd International Conference and Exhibition on Computer Graph-ics and Interactive Techniques (SIGGRAPH’06). ACM Press, New York,1013–1024.
M. Yang, V. Tuchin, and A. Yaroslavsky. 2009. Principles of light-skininteractions. In Light-Based Therapies for Skin of Color, E. Baron, Ed.,Springer, 1–44.
D. Yim, G. V. G. Baranoski, B. W. Kimmel, T. F. Chen, and E. Miranda.2012. A cell-based light interaction model for human blood. Comput.Graph. Forum 31, 2, 845–854.
A. R. Young. 1997. Chromophores in human skin. Phys. Med. Biol. 42, 5,789.
Received October 2014; accepted December 2014
ACM Transactions on Graphics, Vol. 34, No. 3, Article 31, Publication date: April 2015.