HyetosR: An R package for temporal stochastic simulation ... · PDF file1. Abstract A complete...
13
HyetosR: An R package for temporal stochastic simulation of rainfall at fine time scales P. Kossieris (1) , D. Koutsoyiannis (1) , C. Onof (2) , H. Tyralis (1) , and A. Efstratiadis (1) (1) Department of Water Resources and Environmental Engineering, National Technical University of Athens (NTUA) (2) Department of Civil and Environmental Engineering, Faculty of Engineering, Imperial College, London European Geosciences Union General Assembly 2012 Vienna, Austria, 22-27 April 2012 Session HS7.5/NP8.3: Hydroclimaticstochastics
Transcript of HyetosR: An R package for temporal stochastic simulation ... · PDF file1. Abstract A complete...
HyetosR: An R package for temporalstochastic simulation of rainfall at fine time scales
P. Kossieris(1), D. Koutsoyiannis(1), C. Onof(2), H. Tyralis(1), and A.
Efstratiadis(1)
(1) Department of Water Resources and Environmental
Engineering, National Technical University of Athens (NTUA)
(2) Department of Civil and Environmental Engineering, Faculty of Engineering, Imperial College, London
European Geosciences Union General Assembly 2012
Vienna, Austria, 22-27 April 2012
Session HS7.5/NP8.3: Hydroclimatic stochastics
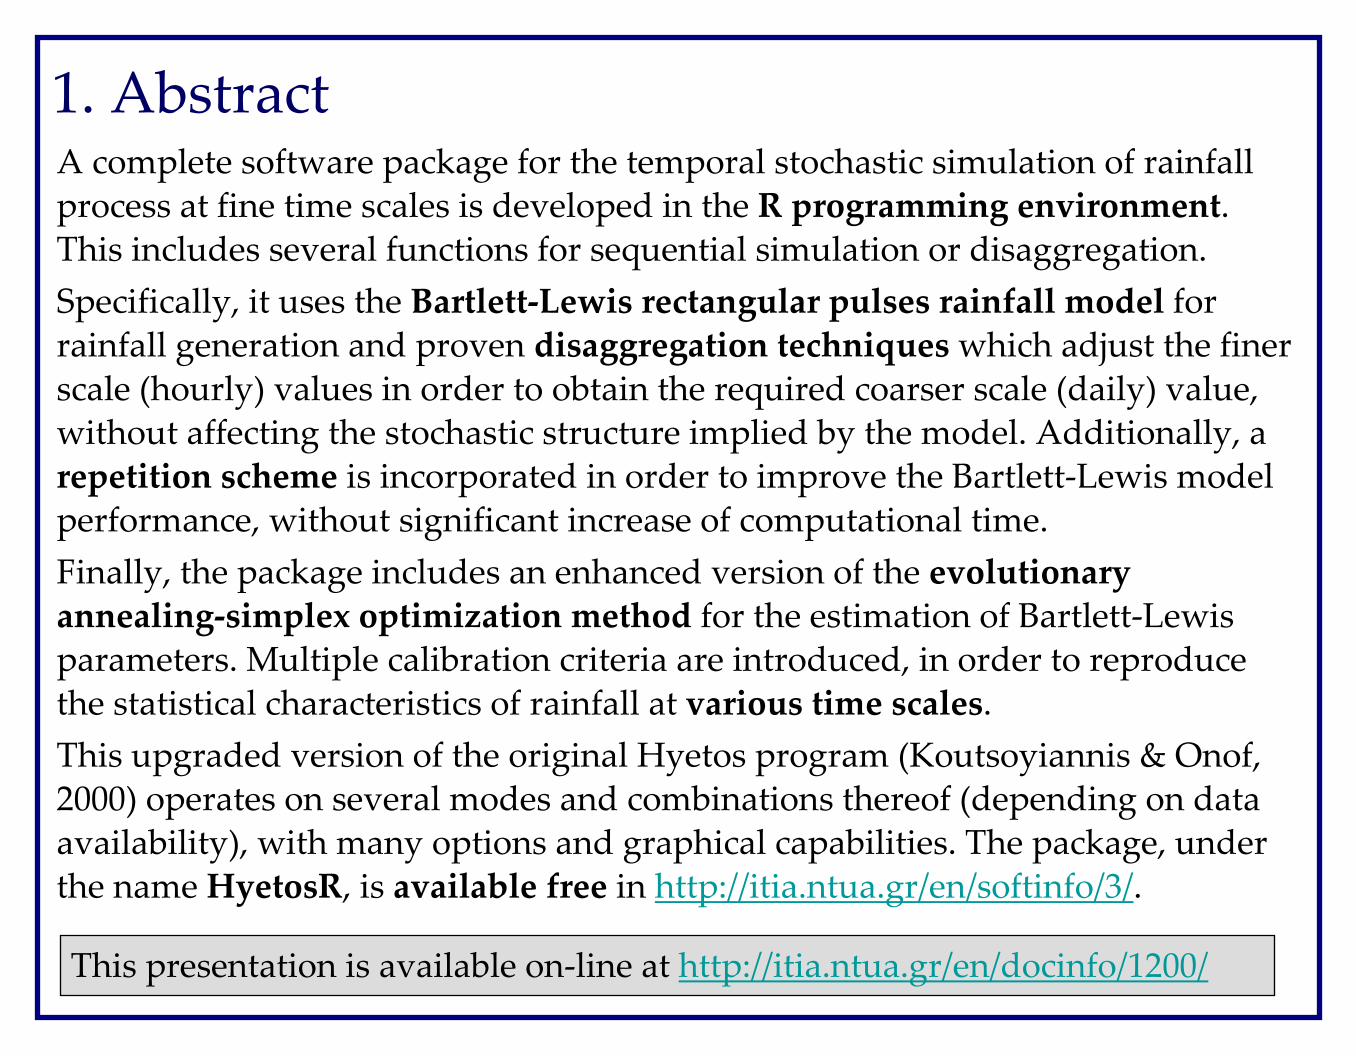
1. AbstractA complete software package for the temporal stochastic simulation of rainfall
process at fine time scales is developed in the R programming environment.
This includes several functions for sequential simulation or disaggregation.
Specifically, it uses the Bartlett-Lewis rectangular pulses rainfall model for
rainfall generation and proven disaggregation techniques which adjust the finer
scale (hourly) values in order to obtain the required coarser scale (daily) value,
without affecting the stochastic structure implied by the model. Additionally, a
repetition scheme is incorporated in order to improve the Bartlett-Lewis model
performance, without significant increase of computational time.
Finally, the package includes an enhanced version of the evolutionary
annealing-simplex optimization method for the estimation of Bartlett-Lewis
parameters. Multiple calibration criteria are introduced, in order to reproduce
the statistical characteristics of rainfall at various time scales.
This upgraded version of the original Hyetos program (Koutsoyiannis & Onof, 2000) operates on several modes and combinations thereof (depending on data
availability), with many options and graphical capabilities. The package, under
the name HyetosR, is available free in http://itia.ntua.gr/en/softinfo/3/.
This presentation is available on-line at http://itia.ntua.gr/en/docinfo/1200/
2. Rainfall generation via Bartlett-Lewis model
t
t1 ≅ t11 t2≅ t21t11 t12 t3 ≅ t31
tc11 tc12 tc31
v1 v2 v3
x11x12 x21
x31
x22
w11 w12 w21
w22 w31
t
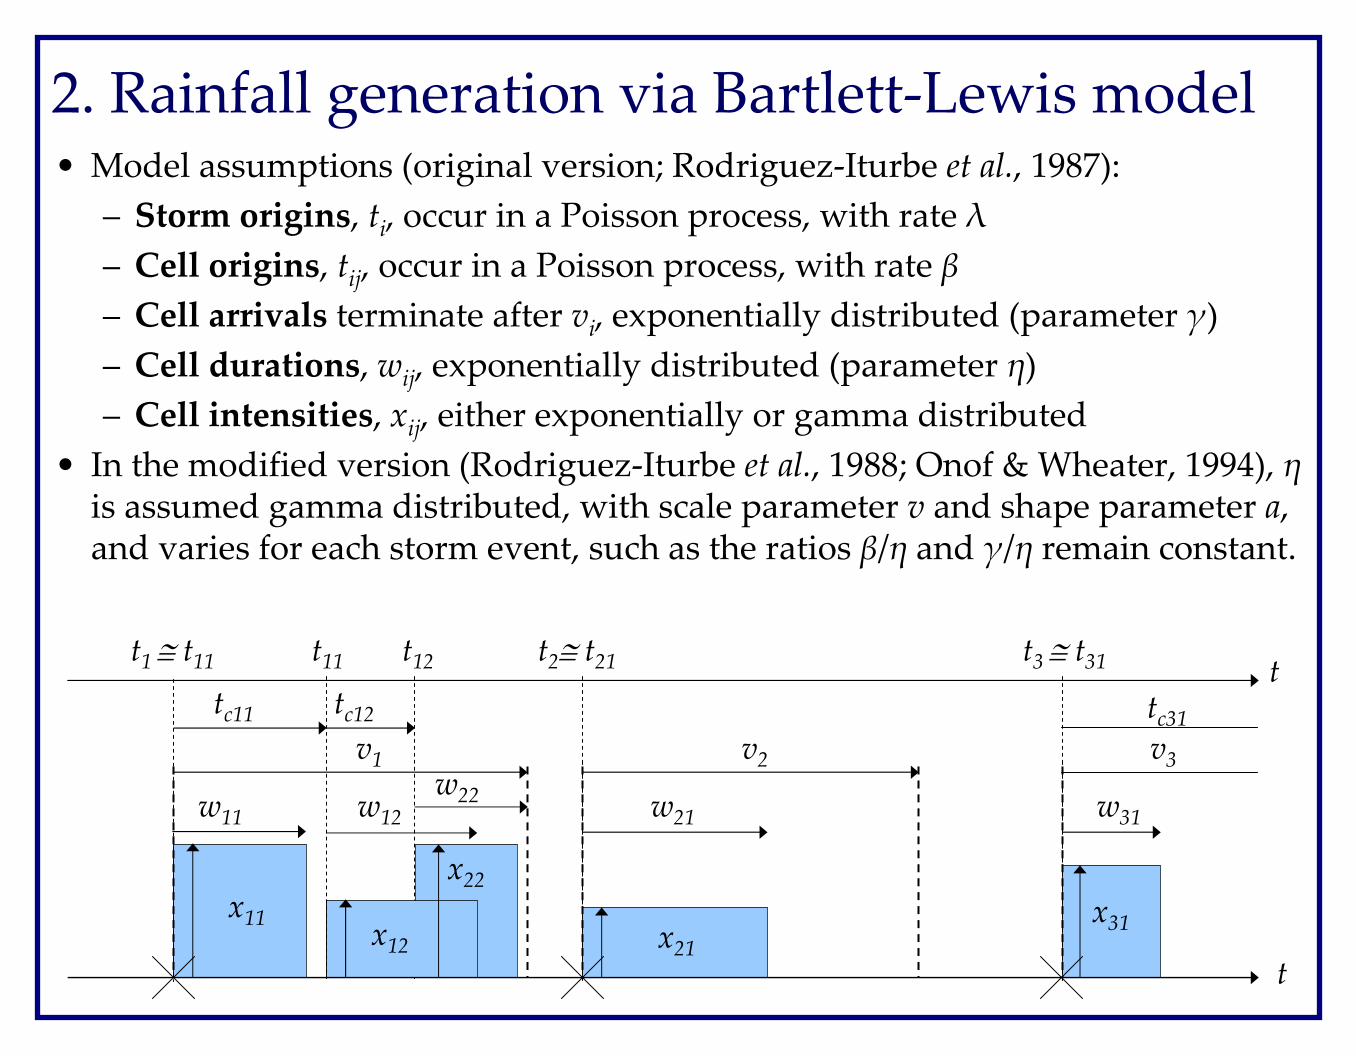
• Model assumptions (original version; Rodriguez-Iturbe et al., 1987):
– Storm origins, ti, occur in a Poisson process, with rate λ
– Cell origins, tij, occur in a Poisson process, with rate β
– Cell arrivals terminate after vi, exponentially distributed (parameter γ)
– Cell durations, wij, exponentially distributed (parameter η)
– Cell intensities, xij, either exponentially or gamma distributed
• In the modified version (Rodriguez-Iturbe et al., 1988; Onof & Wheater, 1994), ηis assumed gamma distributed, with scale parameter v and shape parameter a, and varies for each storm event, such as the ratios β/η and γ/η remain constant.
• The chosen sequence is adjusted to become fully consistent with the given sequence, according to the proportional adjusting procedure:
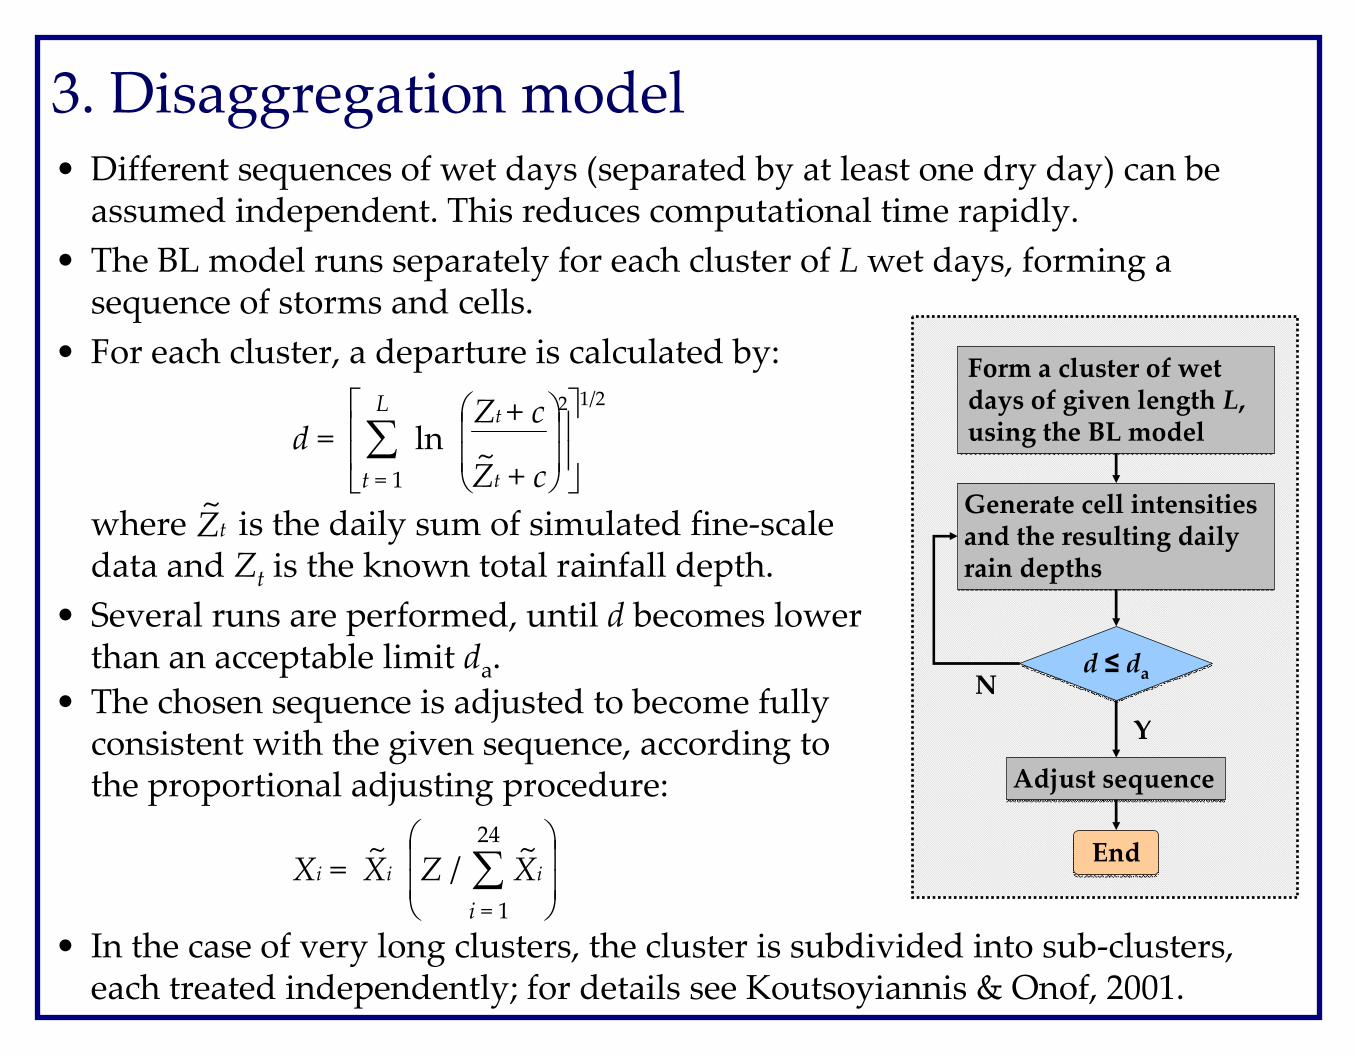
3. Disaggregation model• Different sequences of wet days (separated by at least one dry day) can be
assumed independent. This reduces computational time rapidly.
• The BL model runs separately for each cluster of L wet days, forming a sequence of storms and cells.
• For each cluster, a departure is calculated by:
Y
Form a cluster of wet days of given length L, using the BL model
Form a cluster of wet days of given length L, using the BL model
Generate cell intensitiesand the resulting daily rain depths
Generate cell intensitiesand the resulting daily rain depths
d ≤ dad ≤ da
Adjust sequenceAdjust sequence
EndEnd
N
where is the daily sum of simulated fine-scale data and Zt is the known total rainfall depth.
• Several runs are performed, until d becomes lower than an acceptable limit da.
• In the case of very long clusters, the cluster is subdivided into sub-clusters, each treated independently; for details see Koutsoyiannis & Onof, 2001.
Xi = Xi~
Z / ∑i = 1
24
Xi~
d =
∑t = 1
L
ln
Zt + c
Zt~
+ c
2 1/2
Zt~
4. Parameter estimation• The modified version of the BL model contains 6 or 7 parameters.
• For given parameter values, some of the most important theoretical statistical characteristics of rainfall (mean, variance, covariance, probability dry) can be analytically computed.
• On the other hand, the inverse procedure (i.e. the estimation of model parameters for given statistical characteristics) has no analytical solution.
• This is handled through calibration, seeking to minimize the “distance”between the theoretical and the observed statistics.
• The calibration problem is inherently multiobjective, although it is typically treated as single-objective.
• In the formulation of the objective function, a number of questions arise:
– Which are the statistical characteristics to preserve and for which time scales?
– Which distance metric is the most consistent, for the specific statistical parameter?
– How are the different metrics combined (e.g. in terms of weighting coefficients) to provide a unique performance measure, i.e. a scalar objective function?
• Additional uncertainties are due to the highly non-convex response surface, which makes essential to use advanced optimization algorithms to obtain a robust parameter set, with reasonable computational effort.
• Usually, a huge number of almost equivalent local optima exist.
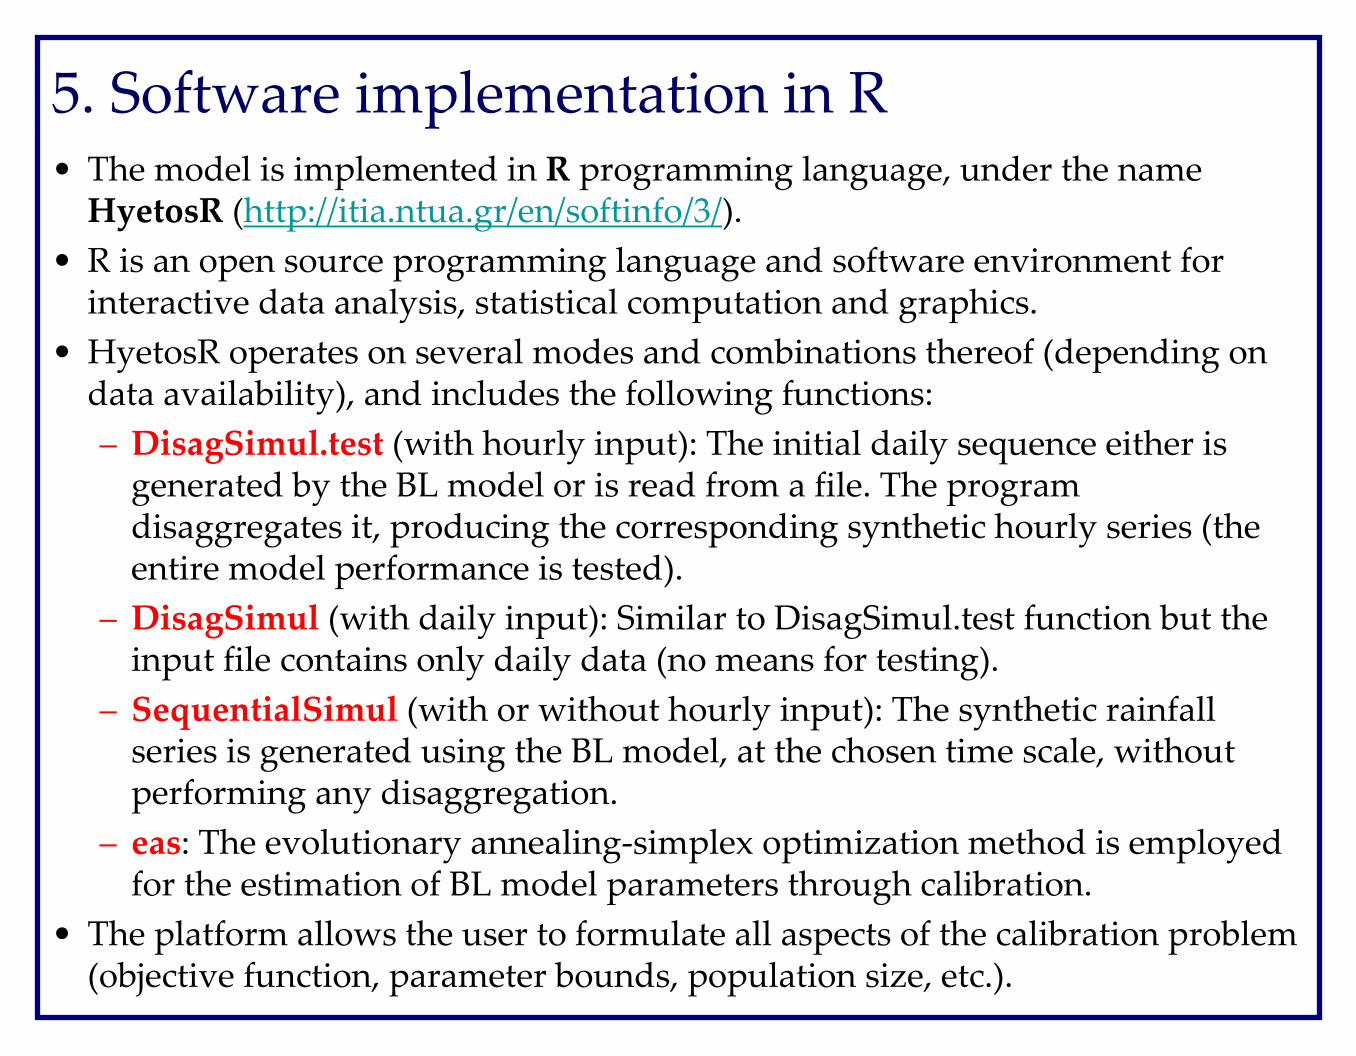
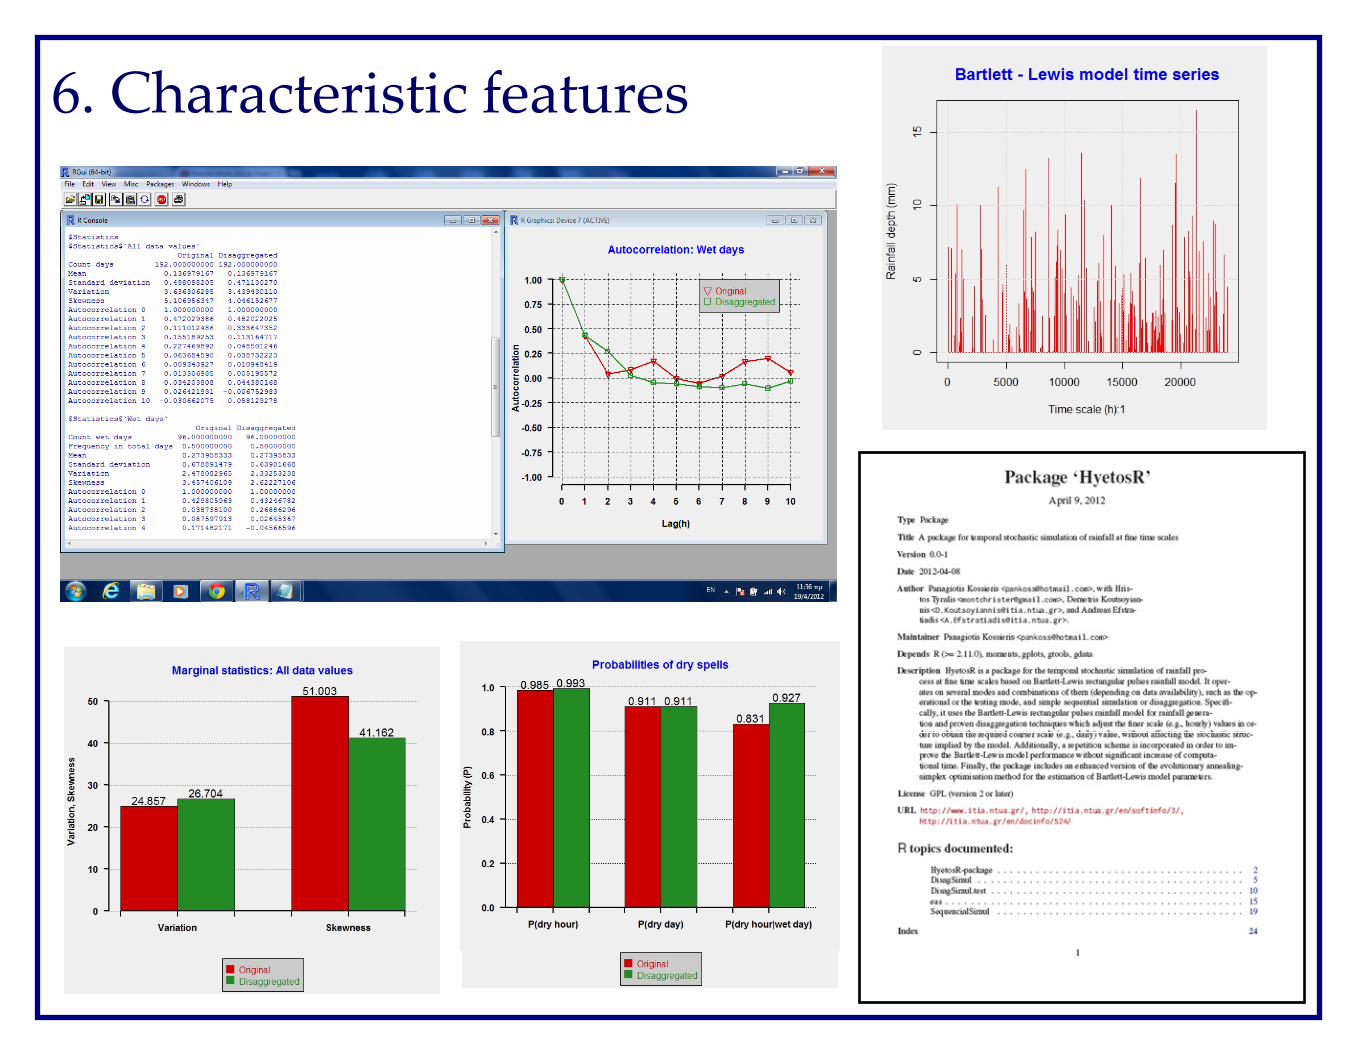
5. Software implementation in R• The model is implemented in R programming language, under the name
HyetosR (http://itia.ntua.gr/en/softinfo/3/).
• R is an open source programming language and software environment for interactive data analysis, statistical computation and graphics.
• HyetosR operates on several modes and combinations thereof (depending on data availability), and includes the following functions:
– DisagSimul.test (with hourly input): The initial daily sequence either is generated by the BL model or is read from a file. The program disaggregates it, producing the corresponding synthetic hourly series (the entire model performance is tested).
– DisagSimul (with daily input): Similar to DisagSimul.test function but the input file contains only daily data (no means for testing).
– SequentialSimul (with or without hourly input): The synthetic rainfall series is generated using the BL model, at the chosen time scale, without performing any disaggregation.
– eas: The evolutionary annealing-simplex optimization method is employed for the estimation of BL model parameters through calibration.
• The platform allows the user to formulate all aspects of the calibration problem (objective function, parameter bounds, population size, etc.).
6. Characteristic features
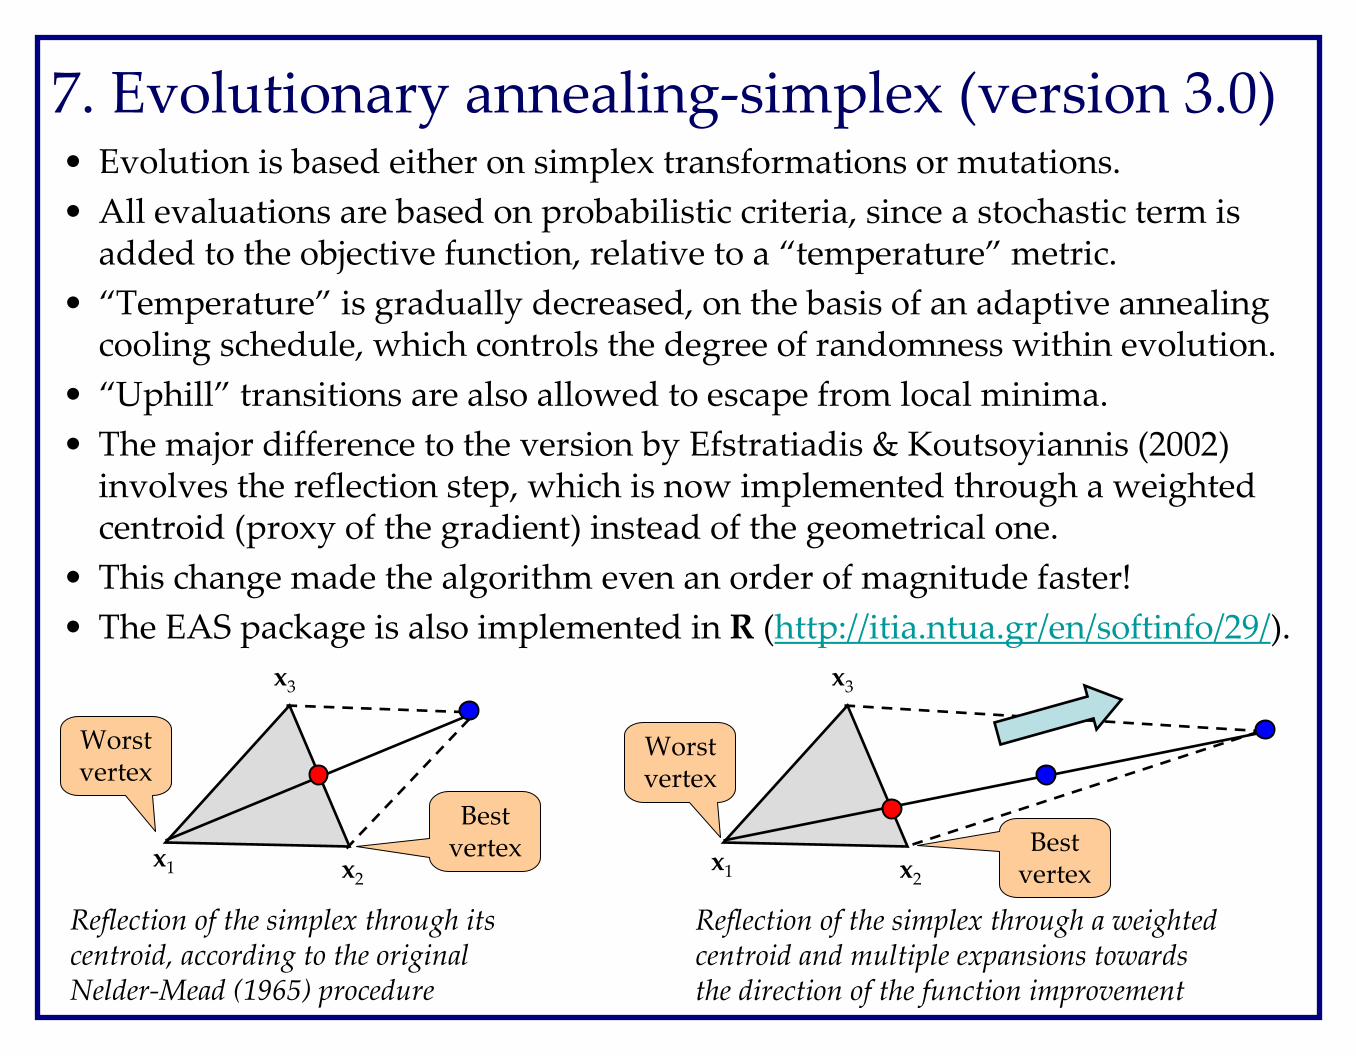
7. Evolutionary annealing-simplex (version 3.0)• Evolution is based either on simplex transformations or mutations.
• All evaluations are based on probabilistic criteria, since a stochastic term is added to the objective function, relative to a “temperature” metric.
• “Temperature” is gradually decreased, on the basis of an adaptive annealing cooling schedule, which controls the degree of randomness within evolution.
• “Uphill” transitions are also allowed to escape from local minima.
• The major difference to the version by Efstratiadis & Koutsoyiannis (2002) involves the reflection step, which is now implemented through a weighted centroid (proxy of the gradient) instead of the geometrical one.
• This change made the algorithm even an order of magnitude faster!
• The EAS package is also implemented in R (http://itia.ntua.gr/en/softinfo/29/).
x1 x2
x3
x1 x2
x3
Reflection of the simplex through its centroid, according to the original Nelder-Mead (1965) procedure
Reflection of the simplex through a weighted centroid and multiple expansions towards the direction of the function improvement
Worst vertex
Best vertex Best
vertex
Worst vertex
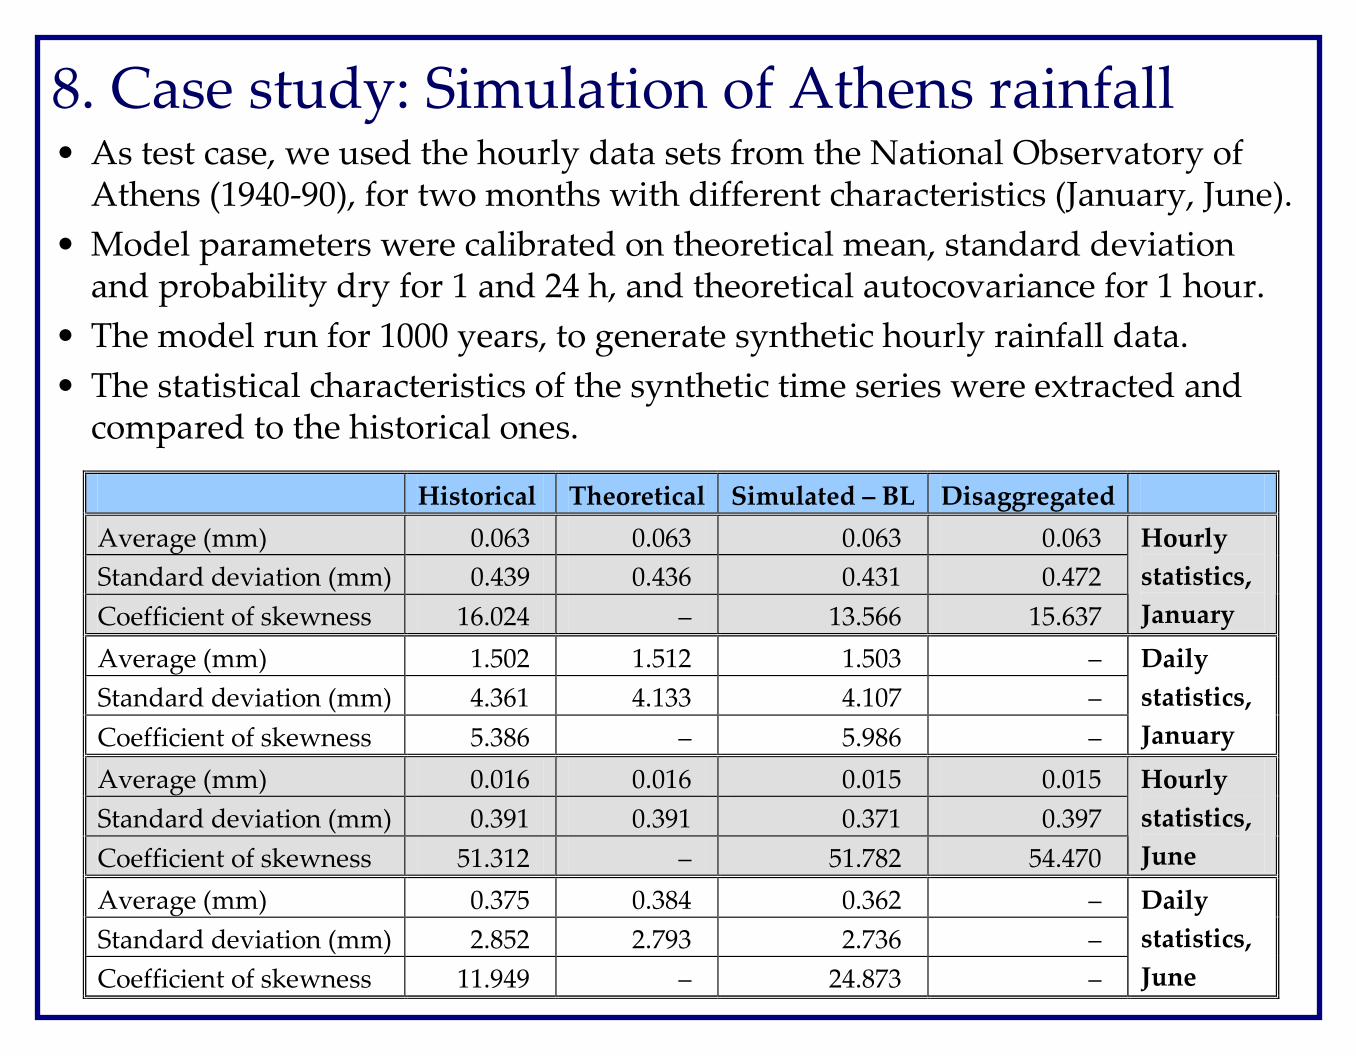
8. Case study: Simulation of Athens rainfall • As test case, we used the hourly data sets from the National Observatory of
Athens (1940-90), for two months with different characteristics (January, June).
• Model parameters were calibrated on theoretical mean, standard deviation and probability dry for 1 and 24 h, and theoretical autocovariance for 1 hour.
• The model run for 1000 years, to generate synthetic hourly rainfall data.
• The statistical characteristics of the synthetic time series were extracted and compared to the historical ones.
Historical Theoretical Simulated – BL Disaggregated
Average (mm) 0.063 0.063 0.063 0.063
Standard deviation (mm) 0.439 0.436 0.431 0.472
Coefficient of skewness 16.024 – 13.566 15.637
Hourly
statistics,
January
Average (mm) 1.502 1.512 1.503 –
Standard deviation (mm) 4.361 4.133 4.107 –
Coefficient of skewness 5.386 – 5.986 –
Daily
statistics,
January
Average (mm) 0.016 0.016 0.015 0.015
Standard deviation (mm) 0.391 0.391 0.371 0.397
Coefficient of skewness 51.312 – 51.782 54.470
Hourly
statistics,
June
Average (mm) 0.375 0.384 0.362 –
Standard deviation (mm) 2.852 2.793 2.736 –
Coefficient of skewness 11.949 – 24.873 –
Daily
statistics,
June
0.0
0.2
0.4
0.6
0.8
1.0
P(dry hour) P(dry day) P(dry hour-wet
day)
Pro
ba
bil
ity
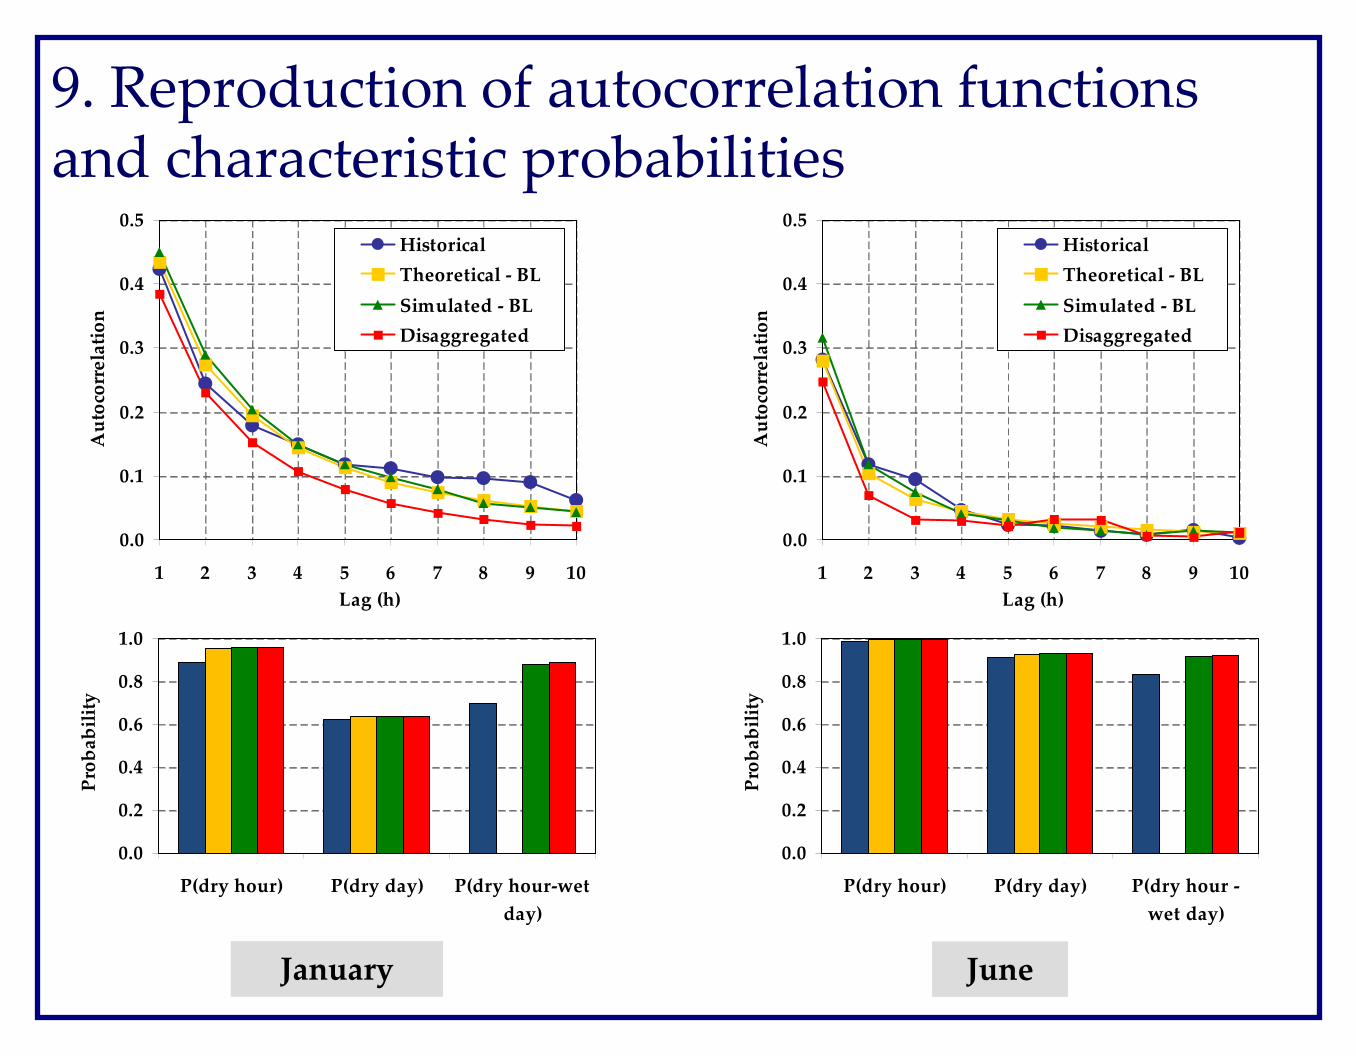
9. Reproduction of autocorrelation functions and characteristic probabilities
0.0
0.2
0.4
0.6
0.8
1.0
P(dry hour) P(dry day) P(dry hour -
wet day)
Pro
ba
bil
ity
January June
0.0
0.1
0.2
0.3
0.4
0.5
1 2 3 4 5 6 7 8 9 10
Lag (h)
Au
toco
rre
lati
on
Historical
Theoretical - BL
Simulated - BL
Disaggregated
0.0
0.1
0.2
0.3
0.4
0.5
1 2 3 4 5 6 7 8 9 10
Lag (h)
Au
toco
rre
lati
on
Historical
Theoretical - BL
Simulated - BL
Disaggregated
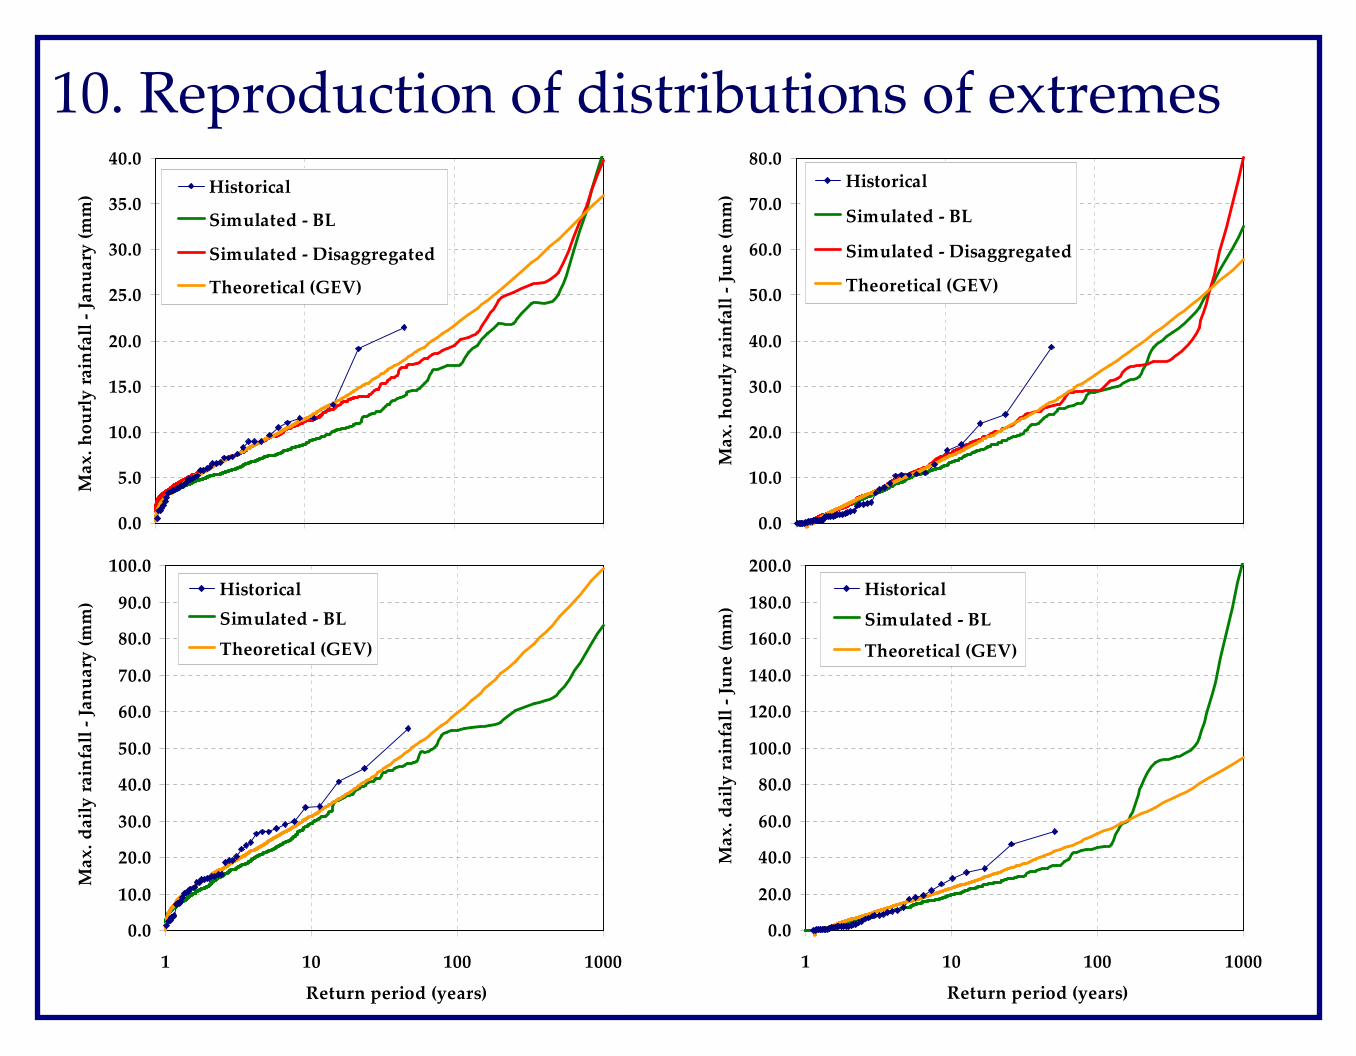
10. Reproduction of distributions of extremes
0.0
5.0
10.0
15.0
20.0
25.0
30.0
35.0
40.0
1 10 100 1000
Return period
Ma
x.
ho
url
y r
ain
fall
- J
an
ua
ry (
mm
) Historical
Simulated - BL
Simulated - Disaggregated
Theoretical (GEV)
0.0
10.0
20.0
30.0
40.0
50.0
60.0
70.0
80.0
1 10 100 1000
Return period
Ma
x.
ho
url
y r
ain
fall
- J
un
e (
mm
)
Historical
Simulated - BL
Simulated - Disaggregated
Theoretical (GEV)
0.0
10.0
20.0
30.0
40.0
50.0
60.0
70.0
80.0
90.0
100.0
1 10 100 1000
Return period (years)
Ma
x.
da
ily
ra
infa
ll -
Ja
nu
ary
(m
m)
Historical
Simulated - BL
Theoretical (GEV)
0.0
20.0
40.0
60.0
80.0
100.0
120.0
140.0
160.0
180.0
200.0
1 10 100 1000
Return period (years)
Ma
x.
da
ily
ra
infa
ll -
Ju
ne
(m
m)
Historical
Simulated - BL
Theoretical (GEV)
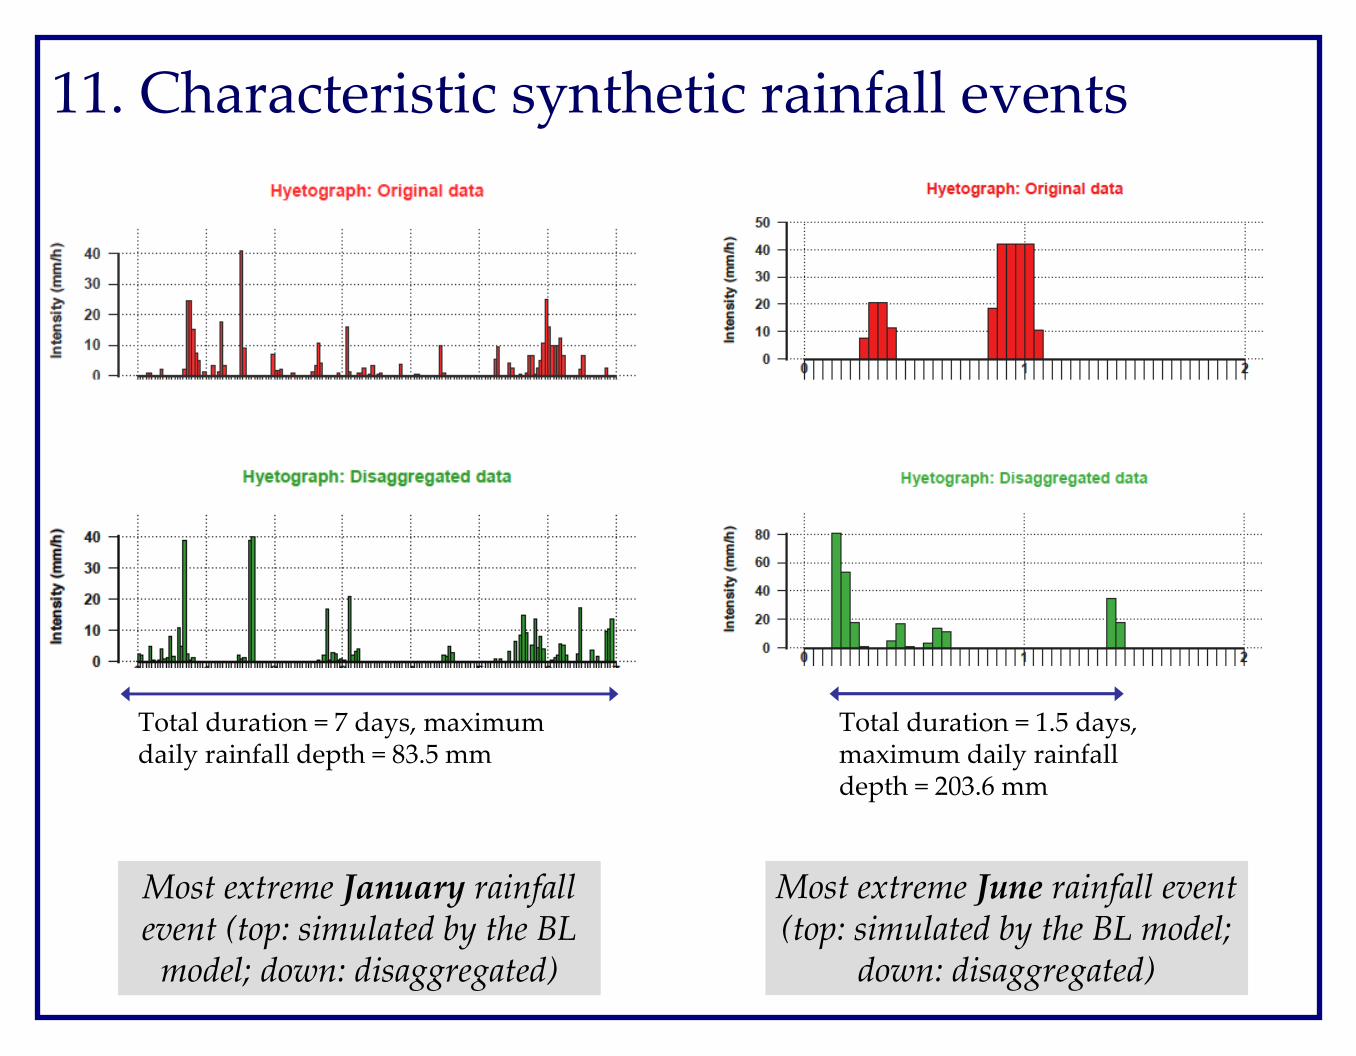
11. Characteristic synthetic rainfall events
Most extreme January rainfall event (top: simulated by the BL
model; down: disaggregated)
Most extreme June rainfall event (top: simulated by the BL model;
down: disaggregated)
Total duration = 7 days, maximum daily rainfall depth = 83.5 mm
Total duration = 1.5 days, maximum daily rainfall depth = 203.6 mm
12. Conclusions • The HyetosR program is a fully operational program, used for reconstructing
past hourly rainfall on the basis of known daily data (through disaggregation), or for generating synthetic rainfall data at fine time scales.
• In our case study, the model reproduced almost all the essential statistical characteristics of the observed data, at both the daily and hourly time scales; it also reproduced the hourly autocorrelations and the dry probabilities.
• The stochastic approach is validated by comparing the empirical pdf of the synthetic extremes to a theoretical distribution (i.e. the GEV, with κ = 0.15).
• The empirical pdf of disaggregated extremes fits well the GEV model; thus HyetosR is appropriate for generating design storms in flood studies.
• Further improvement of the parameter estimation problem, towards a multiobjective calibration framework, is possible.
REFERENCES
Efstratiadis, A. & D. Koutsoyiannis, An evolutionary annealing-simplex algorithm for global optimisation of water resource systems, Proceedings of the Fifth International Conference on Hydroinformatics, Cardiff, UK, 1423-1428, International Water Association, 2002.
Koutsoyiannis, D., & C. Onof, Rainfall disaggregation using adjusting procedures on a Poisson cluster model, J. Hydrol., 246, 109-122, 2001.
Koutsoyiannis, D., & C. Onof, A computer program for temporal rainfall disaggregation using adjusting procedures (HYETOS), XXV General Assembly of European Geophysical Society, Nice, Geophysical Research Abstracts, 2, 2000.
Nelder, J. A., & R. Mead, A simplex method for function minimization, Comput. J., 7(4), 308-313, 1965.
Rodriguez-Iturbe I., D.R. Cox, & V. Isham, Some models for rainfall based on stochastic point processes, Proc. R. Soc. Lond., A410, 269-288, 1987.
Rodriguez-Iturbe I., D.R. Cox, and V. Isham, A point process model for rainfall: Further developments, Proc. R. Soc. Lond., A417, 283-298, 1988.
Onof, C. and H. S. Wheater, Improvements to the modelling of British rainfall using a modified random parameter Bartlett-Lewis rectangular pulse model, J. Hydrol., 157, 177-195, 1994.