Hydropower Modernization Initiative Assessment of ... · Hydropower Modernization Initiative...
155
U.S. Department of the Interior Bureau of Reclamation Sacramento, California FINAL - October 2010 Hydropower Modernization Initiative Assessment of Potential Capacity Increases at Existing Hydropower Plants
Transcript of Hydropower Modernization Initiative Assessment of ... · Hydropower Modernization Initiative...

U.S. Department of the Interior Bureau of Reclamation Sacramento, California FINAL - October 2010
Hydropower Modernization Initiative
Assessment of Potential Capacity Increases at Existing Hydropower Plants

Mission Statements The mission of the Department of the Interior is to protect and provide access to our Nation’s natural and cultural heritage and honor our trust responsibilities to Indian Tribes and our commitments to island communities.
The mission of the Bureau of Reclamation is to manage, develop, and protect water and related resources in an environmentally and economically sound manner in the interest of the American public.

Assessment of Potential Capacity Increases at Existing Hydropower Plants Hydropower Modernization Initiative Prepared for United States Department of the Interior Bureau of Reclamation Prepared by
U.S. Department of the Interior Bureau of Reclamation Denver, Colorado FINAL - October 2010

This page left blank intentionally.

2353 - 130th Avenue NE
Suite 200 520 Corporate Center Bellevue, Washington 98005 United States
TEL +1 425 896 6900 FAX +1 425 602 4020
www.mwhglobal.com
October 26, 2010 U.S. Bureau of Reclamation Denver Federal Center Bldg. 67 (86-61600) P.O. Box 25007 Denver, CO 80225-0007 Attn: Mr. Michael Pulskamp Subject: Final Report on Assessment of Capacity Increases at Existing Hydroelectric
Plants Ref: USACE Contract No. W9127N-10-D-0004, MWH Americas, Inc., Task Order
0002 Dear Michael, Enclosed is our final report assessing capacity gains at existing United States Bureau of Reclamation (Reclamation) hydroelectric plants. This work was performed under Task 2 of our IDIQ contract with the US Army Corps of Engineers (USACE) for the Hydropower Modernization Initiative, Bureau of Reclamation. The report presents the results from creating energy simulation models at Reclamation hydropower plants, and developing a comprehensive valuation of benefits from potential capacity increases at all plants. The primary authors of the report were John Haapala and Jill Gray. MWH appreciates the opportunity to work with Reclamation on this interesting assignment. We hope this document provides useful results regarding potential capacity additions and will help direct future investigation efforts toward the plants that have the most potential. We enjoyed our collaboration with both Reclamation and USACE on this study and look forward to additional opportunities to be of service Thank you.
(for) Nancy Walker Project Manager MWH Americas, Inc.
encl: Final Report

This page left blank intentionally.

Disclaimer
FINAL - October 2010
Disclaimer The findings, interpretations of data, recommendations, specifications or professional opinions presented in this report are based upon available information at the time the report was prepared. Studies described in this report were conducted in accordance with generally accepted professional engineering and geological practice, and in accordance with the requirements of the Client. There is no other warranty, either expressed or implied.
The findings of this report are based on the readily available data and information obtained from public and private sources. MWH relied on this information provided by others and did not verify the applicability, accuracy or completeness of the data. Additional studies (at greater cost) may or may not disclose information that may significantly modify the findings of this report. MWH accepts no liability for completeness or accuracy of the information presented and/or provided to us, or for any conclusions and decisions that may be made by the Client or others regarding the subject site or project.
The cost estimates developed for the report are prepared in accordance with the cost estimate classes defined by the Association for the Advancement of Cost Engineering. MWH has no control over costs of labor, materials, competitive bidding environments and procedures, unidentified field conditions, financial and/or market conditions, or other factors likely to affect the cost estimates contained herein, all of which are, and will unavoidably remain, in a state of change, especially in light of the high volatility of the market attributable to market events beyond the control of the parties. These estimates are a “snapshot in time” and the reliability of these cost estimates will inherently degrade over time. MWH cannot and does not make any warranty, promise, guarantee, or representation, either express or implied, that proposals, bids, project construction costs, or cost of operation or maintenance will not vary substantially from MWH’s good faith Class 5 cost estimate.
This report was prepared solely for the benefit of the Client. No other entity or person shall use or rely upon this report or any of MWH's work product unless expressly authorized by MWH. Any use of or reliance upon MWH's work product by any party, other than the Client, shall be solely at the risk of such party.

This page left blank intentionally.

Executive Summary
Executive Summary There has recently been a considerable resurgence of interest in hydropower in the USA. The current interest in hydropower has been primarily directed at developing incremental hydropower where an existing dam, or an existing dam and powerhouse can be utilized. Incremental hydropower can be developed through efficiency increases in existing units and/or by the addition of capacity to utilize flow for generation that would be otherwise spilled at existing dams. One of the driving forces behind the increased interest in electricity generation from hydropower plants is that greenhouse gas (GHG) emissions from hydropower are virtually zero when compared to thermal generation from fossil fuels. Additional clean hydropower generation would offset or reduce GHG emissions from fossil fuel-fired generation.
Reclamation has 58 existing hydroelectric plants with a total installed capacity of about 15,000,000 kilowatts (kW) (15,000 megawatts [MW]). This report assesses the potential for capacity increases at the 58 existing hydroelectric plants that could potentially generate additional power. Also included in the report is an estimated quantification of incremental energy increases from efficiency gains that would result from replacement of older turbine runners with new runners of modern design. A final task involves the estimation of potential GHG offsets that could be credited to the incremental energy increases or the avoidance of outages at the existing plants.
Due to the large number of plants involved, these studies were performed at the planning-level (reconnaissance-level)) for purposes of screening between plants. Additional more detailed feasibility-level studies of individual plants would be needed to make final investment decisions at those specific plants that show promise for capacity additions in this study.
Because the “best” capacity addition from an economic standpoint was not known in advance, five capacity additions of different sizes were tested for each plant. The capacity additions tested at each plant were 10%, 20%, 30%, 40%, and 50% of the existing combined nameplate capacities (the installed capacity). For each of the alternative capacity additions, a benefit to cost ratio (BCR) and a net present value (NPV) were determined. The preferred capacity addition would have either the maximum benefit to cost ratio (if it was greater than 1.00) or the maximum net present value (if positive).
The determination of benefits from a capacity addition requires the estimation of the average incremental energy generation, which is developed with a hydroelectric energy simulation model. An energy model was developed that could simulate up to 30 years of daily energy generation at each of the 58 existing plants. Plant specific input data to the energy model was supplied by Reclamation that included reservoir outflows and elevations, and many
ES-1 FINAL – October 2010

Hydropower Modernization Initiative Assessment of Potential Capacity Increases at Existing Hydropower Plants
characteristics of the existing hydroelectric plants. Results generally showed reasonable agreement between the simulated and recorded generation, which satisfactorily validates the model.
In addition to the energy generation in megawatt-hours (MWh), the value of energy ($/MWh) and capacity ($/kW-yr) must be known to determine the total benefits of a capacity addition. The value of energy was developed on a regional basis for each of the plants based on information obtained from the Energy Information Administration, Department of Energy. The value of energy was separated into on-peak and off-peak hours. The value of capacity was also developed based on information obtained from the Energy Information Administration, Department of Energy and is a variable function of the relative amount of energy associated with each capacity addition, so the more incremental energy, the higher the capacity value.
An estimate of the costs associated with each plant capacity addition was necessary to evaluate the benefit to cost ratios and net present values. The cost estimates included construction, mitigation, and operation and maintenance costs. The cost estimating methodology was taken from a 2007 Federal report (U.S. Department of the Interior, et al, 2007), known as the 1834 study, on potential hydroelectric development at existing Federal facilities. Notably, the 1834 study excluded the 58 existing Reclamation plants that are studied herein because it was thought at that time that with few exceptions, the existing plants were either originally constructed or had already been uprated so that they were then currently sized to the available flow.
Results of this study show that only 10 of the 58 plants have potential capacity additions of any size with positive NPVs, which corresponds to a BCR greater than 1.00 and is an indicator of economic feasibility. The 10 plants that show initial promise for capacity additions (Table ES-1) are mostly among the smallest of the 58 plants. Selecting the capacity addition at each of the 10 plants that has the highest benefit to cost ratio would result in a total capacity addition of about 67 MW. The additional 67 MW capacity would represent less than one-half of one percent of the existing total nameplate capacity of the 58 plants. If maximum NPV was the criterion for selecting the capacity addition (Table ES-2), the economic capacity addition would rise to about 143 MW, still less than one percent of the existing total nameplate capacity. The Palisades hydropower plant has the highest net present value.
ES-2 FINAL – October 2010

Executive Summary
ES-3 FINAL – October 2010
Rank 1 Plant Region
(MW) (MW) ($M)1 Shoshone Great Plains 3.0 50% 50% 1.5 3.50 $12.22 Black Canyon Pacific Northwest 10 50% 50% 5.1 2.52 $19.63 Boise Diversion Pacific Northwest 3.5 40% 50% 1.4 2.48 $7.84 Palisades Pacific Northwest 177 20% 50% 35 2.28 $1235 Canyon Ferry Great Plains 50 10% 40% 5.0 1.53 $13.46 Guernsey Great Plains 6.4 50% 50% 3.2 1.52 $4.67 Nimbus Mid-Pacific 13.5 20% 50% 2.7 1.39 $5.88 Minidoka Pacific Northwest 28 10% 20% 2.8 1.21 $2.69 Deer Creek Upper Colorado 5.0 10% 20% 0.5 1.04 $0.110 Crystal Upper Colorado 31.5 30% 30% 9.5 1.00 $0.1
Notes1 Plants are ranked based on the capacity addition increment with the highest BCR for each plant .BCR - Benefit to Cost RatioNPV - Net Present Value
Existing Installed Capacity
Maximum BCR
Percent Increase
Maximum NPV
Percent Increase
Maximum BCR Capacity
Increase
Maximum BCR
Maximum NPV
Table ES-1. Capacity Opportunities – Ranked by Benefit to Cost Ratio
Rank 1 Plant Region
(MW) (MW) ($M)1 Palisades Pacific Northwest 177 20% 50% 88 2.28 $1232 Black Canyon Pacific Northwest 10 50% 50% 5.1 2.52 $19.63 Canyon Ferry Great Plains 50 10% 40% 20 1.53 $13.44 Shoshone Great Plains 3.0 50% 50% 1.5 3.50 $12.25 Boise Diversion Pacific Northwest 3.5 40% 50% 1.7 2.48 $7.86 Nimbus Mid-Pacific 14 20% 50% 6.8 1.39 $5.87 Guernsey Great Plains 6.4 50% 50% 3.2 1.52 $4.68 Minidoka Pacific Northwest 27.7 10% 20% 5.5 1.21 $2.69 Deer Creek Upper Colorado 5.0 10% 20% 1.0 1.04 $0.1
10 Crystal Upper Colorado 32 30% 30% 9.5 1.00 $0.1Notes1 Plants are ranked based on the capacity addition increment with the highest NPV for each plant .BCR - Benefit to Cost RatioNPV - Net Present Value
Existing Installed
Maximum BCR
Maximum NPV
Maximum NPV Capacity
ase
Maximum BCR
Maximum NPVCapacity Percent
IncreasePercent Increase
Incre
Table ES-2. Capacity Opportunities – Ranked by Net Present Value
It can be concluded that 10 of the 58 plants show some promise for capacity additions that could be investigated in more detail in future studies. But it must also be concluded that if the capacity additions were implemented in the sizes indicated by this planning-level study, the resulting additions would increase the total capacity of the 58 existing Reclamation plants by less than 1%. This conclusion generally supports the assertion in the 2007 Federal study that the
ld
existing Reclamation hydroelectric plants are with few exceptions currently economically sized to the available flow.
Additional results presented in detail in subsequent chapters of this report show substantial potential for generation increases from efficiency gains that wouresult in substantial offsets of greenhouse gasses (GHGs) from fossil fuel-fired

Hydropower Modernization Initiative Assessment of Potential Capacity Increases at Existing Hydropower Plants
ES-4 FINAL – October 2010
Rank 1 Plant Region
generation. Table ES-3 shows the ten plants with the largest opportunities foannual generation increases due to efficien
(MW) (MWh/yr) (MWh/yr) (%)1 Hungry Horse Pacific Northwest 428 930,345 49,272 5.2 Spring Creek Mid-Pacific 180 590,037 36,681 6.3 Trinity
32
Mid-Pacific 140 517,251 31,209 6.04 New Melones Mid-Pacific 382 470,677 29,916 6.45 Keswick Mid-Pacific 117 461,014 25,762 5.66 Canyon Ferry Great Plains 50 380,509 25,391 6.77 Palisades Pacific Northwest 177 706,936 22,716 3.28 San Luis 2 Mid-Pacific 424 304,679 20,490 6.79 Morrow Point Upper Colorado 173 363,625 19,421 5.310 Flatiron 3 Great Plains 94.5 241,042 14,436 6.0
Notes
2 Installed capacity of 424 MW for San Luis includes the Federal and CA shares. The Federal share is 202 MW.3 Installed capacity at Flatiron is 94.5 MW. Only Units 1 and 2 (81.3 MW) were included in the modeling.
1 Plants are ranked based on the percent of additional generation from efficiency improvements over their existing annual (simulated) generation.
CapacityInstalled Annual Average
Existing Generation
Incremental Generation from Efficiency Improvements
r cy improvements at the existing
units, provided the potential efficiency improvements are at least 3%. One plant
Table ES-3. LIncreases
In addition to generation increases, three potential ways of achieving GHG offsets were determined. Table ES-4 shows the total GHG offset opportunities for each of the five regions. GHG offsets from efficiency improvements and from capacity increases are based on the capacity addition increment from each plant that yielded the highest BCR. GHG offsets from avoided outages is a concept that was developed as part of the asset investment planning process. Results for individual plants are also presented in Chapter 9, Summary of Results.
in the Pacific Northwest Region, Hungry Horse, and a few plants in the Mid-Pacific Region top the list. A total of 36 plants could potentially increase their annual generation by more than 3%.
argest Efficiency Gain Opportunities – Plants with >3% Potential

Executive Summary
ES-5 FINAL – October 2010
gion
(MWh/yr)metric tons
CO2e/yr (MWh/yr)metric tons
CO2e/yr (MWh/yr)metric tons
CO2e/yrid-Pacific 186,818 84,961 187,735 69,129 527,348 243,476pper Colorado 81,627 63,134 116,853 67,246 473,221 373,756
er Colorado 141,191 79,612 30,833 15,993 77,649 43,783acific Northwest 193,491 106,405 142,011 63,803 398,253 215,777reat Plains 144,159 77,825 105,692 45,683 584,088 302,024
Notes
T
Re
MULowPG
1 Incremental GHG offsets are based on the summation of the hydraulic capacity increase increment for each plant with the highest BCR.
GHG - Greenhouse Gas
ak hours depending on whether the
GHG Offsets from Incremental Generation from Efficiency
Improvements
GHG Offsets from Incremental Generation from Hydraulic
Capacity Increases 1GHG Offsets from Avoided
Energy Losses 2
2 GHG offsets from avoided energy losses are based on a generic split between on-peak and off-peplant is operated as a peaking, base load or intermediate plant.
able ES-4. Potential GHG Reduction Opportunities by Region
Costs and economic benefits were not assigned to the efficiency gains or greenhouse gas offsets in this study. A cost/benefit analysis was not performed for potential efficiency gains because this more detailed level of analysis is performed in the Asset Investment Planning Tool that is included in a separate task under the current overall contract. GHG offsets were not assigned dollar values because there is currently a great deal of uncertainty regarding their future valuation.

This page left blank intentionally.

Contents
Contents
Page
Chapter 1 Introduction ......................................................................................................... 1-1 Scope ....................................................................................................................................... 1-1 Objectives ................................................................................................................................. 1-2 Limitations ................................................................................................................................ 1-3
Chapter 2 Summary of Reclamation Existing Hydroelectric Facilities ........................... 2-1
Existing Hydroelectric Facilities ............................................................................................... 2-1 Reclamation Uprating Program ................................................................................................ 2-4
Chapter 3 Energy Model ....................................................................................................... 3-1
Objectives of PLEESM ............................................................................................................. 3-1 Methodology ............................................................................................................................. 3-1 Model Input ............................................................................................................................... 3-3 Model Output ............................................................................................................................ 3-3 Interface with AIP Tool ............................................................................................................ 3-6 Simulation Accuracy ................................................................................................................. 3-6
Chapter 4 Economics ............................................................................................................. 4-1
Definitions................................................................................................................................. 4-1 Economic Parameters ................................................................................................................ 4-2 Costs and Benefits..................................................................................................................... 4-2 Example Economic Results Description ................................................................................... 4-3
Chapter 5 Energy and Capacity Benefits ............................................................................ 5-1
Energy Benefits ......................................................................................................................... 5-1 Capacity Benefits ...................................................................................................................... 5-6
Chapter 6 Capacity Addition Cost Estimates ..................................................................... 6-1 Chapter 7 Environmental and Climate Change Benefits .................................................. 7-1
Hydropower and Greenhouse Gasses ....................................................................................... 7-1 Opportunities for Climate Change Benefits .............................................................................. 7-2 GHG Reduction Quantification ................................................................................................ 7-2 Greenhouse Gas Equivalents .................................................................................................... 7-5
Chapter 8 Plant Data Ratings ............................................................................................... 8-1 Chapter 9 Summary of Results ............................................................................................ 9-1
Capacity Additions.................................................................................................................... 9-1
i FINAL – October 2010

Hydropower Modernization Initiative Assessment of Potential Capacity Increases at Existing Hydropower Plants
Mid-Pacific Region .......................................................................................................... 9-2 Upper Colorado Region ................................................................................................... 9-3 Great Plains Region ......................................................................................................... 9-4 Pacific Northwest Region ................................................................................................ 9-5 Lower Colorado Region ................................................................................................... 9-6 Summary of Capacity Addition Results .......................................................................... 9-6
Efficiency Gains........................................................................................................................ 9-8 Mid-Pacific Region .......................................................................................................... 9-8 Upper Colorado Region ................................................................................................... 9-9 Great Plains Region ....................................................................................................... 9-10 Pacific Northwest Region .............................................................................................. 9-11 Lower Colorado Region ................................................................................................. 9-12 Summary of Efficiency Gains Results ........................................................................... 9-12
Greenhouse Gas Reduction Opportunities .............................................................................. 9-14 Mid-Pacific Region ........................................................................................................ 9-14 Upper Colorado Region ................................................................................................. 9-15 Pacific Northwest Region .............................................................................................. 9-17 Lower Colorado Region ................................................................................................. 9-18 Summary of Greenhouse Gas Reduction Opportunities Results ................................... 9-19
Chapter 10 Conclusions ........................................................................................................ 10-1 Chapter 11 References .......................................................................................................... 11-1 Chapter 12 List of Preparers ................................................................................................ 12-1
ii FINAL – October 2010

Contents
Tables Table 2-1. Reclamation Existing Hydroelectric Plants ................................................................ 2-3 Table 2-2. Reclamation Unit Uprates .......................................................................................... 2-6 Table 2-3. Reclamation Unit Rewinds ......................................................................................... 2-7 Table 3-1. Summary of Simulation Accuracy ............................................................................. 3-7 Table 7-1. 100-Year Global Warming Potential Values .............................................................. 7-3 Table 7-2. Year 2005 GHG Annual Output Emission Rates ....................................................... 7-4 Table 8-1. Plant Data Ratings Summary ...................................................................................... 8-2 Table 8-2. Individual Plant Data Ratings ..................................................................................... 8-3 Table 9-1. Capacity Addition Results - Mid-Pacific Region ....................................................... 9-3 Table 9-2. Capacity Addition Results - Upper Colorado Region ................................................ 9-4 Table 9-3. Capacity Addition Results - Great Plains Region ...................................................... 9-5 Table 9-4. Capacity Addition Results - Pacific Northwest Region ............................................. 9-6 Table 9-5. Capacity Addition Results - Lower Colorado Region ................................................ 9-6 Table 9-6. Summary - Capacity Addition Opportunities Ranked by BCR .................................. 9-7 Table 9-7. Summary - Capacity Addition Opportunities Ranked by NPV .................................. 9-7 Table 9-8. Efficiency Gain Results - Mid-Pacific Region ........................................................... 9-9 Table 9-9. Efficiency Gain Results - Upper Colorado Region .................................................. 9-10 Table 9-10. Efficiency Gain Results - Great Plains Region ...................................................... 9-11 Table 9-11. Efficiency Gain Results - Pacific Northwest Region ............................................. 9-12 Table 9-12. Efficiency Gain Results - Lower Colorado Region ................................................ 9-12 Table 9-13. Summary - Efficiency Gain Opportunities >3% .................................................... 9-13 Table 9-14. GHG Reduction Results - Mid-Pacific Region ...................................................... 9-15 Table 9-15. GHG Reduction Results - Upper Colorado Region ............................................... 9-16 Table 9-16. GHG Reduction Results - Great Plains Region ...................................................... 9-17 Table 9-17. GHG Reduction Results - Pacific Northwest Region ............................................. 9-18 Table 9-18. GHG Reduction Results - Lower Colorado Region ............................................... 9-18 Table 9-19. Cumulative GHG Reduction Results by Region .................................................... 9-19
Figures Figure 2-1. Reclamation Regions ............................................................................................... 2-1 Figure 2-2. Reclamation Existing Hydroelectric Plant Locations ............................................... 2-2 Figure 3-1. Flow Thru Existing Keswick Units and Potential Capacity Additions ..................... 3-4
iii FINAL – October 2010

Hydropower Modernization Initiative Assessment of Potential Capacity Increases at Existing Hydropower Plants
Figure 3-2. Keswick Average Monthly Energy Distribution ....................................................... 3-5 Figure 3-3. Keswick Simulated and Actual Monthly Generation................................................ 3-5 Figure 3-4. Simulated and Actual Keswick Daily Generation .................................................... 3-6 Figure 3-5. Palisades Simulated and Actual Monthly Generation ............................................... 3-8 Figure 3-6. Minidoka Simulated and Actual Monthly Generation .............................................. 3-9 Figure 4-1. Example Economic Details Results - 4.375% Discount Rate ................................... 4-4 Figure 4-2. Example Economic Details Results - 8% Discount Rate .......................................... 4-5 Figure 4-3. Example Economic Details Results - 12% Discount Rate ........................................ 4-6 Figure 5-1. Electricity Market Module Regions .......................................................................... 5-2 Figure 5-2. Real and Nominal Energy Values for the Northwest Power Pool ............................ 5-4 Figure 5-3. Real and Nominal Energy Values for the Rocky Mountain Power Area ................. 5-5 Figure 5-4. Real and Nominal Energy Values for California ...................................................... 5-5 Figure 5-5. Capacity Value as a Function of Incremental Capacity Factor ................................. 5-7 Figure 6-1. Construction, Mitigation, and Capacity Costs as a Function of Added MW ............ 6-2 Figure 7-1. eGrid Subregions ....................................................................................................... 7-4
Appendices Appendix A. Capacity Addition Detailed Economic Results
iv FINAL – October 2010

Contents
v FINAL – October 2010
Abbreviations and Acronyms % percent $/kW dollars per kilowatt $/kW-yr dollars per kilowatt per year $/MWh dollars per megawatt hour AIP Asset Investment Planning BCR or B/C benefit to cost ratio cfs cubic feet per second CH4 methane CO2 carbon dioxide CO2e carbon dioxide equivalents CO2e/yr carbon dioxide equivalents per year DO dissolved oxygen EIA Energy Information Administration EMM Electricity Market Module FERC Federal Energy Regulatory Commission GHG greenhouse gas GWh gigawatt hour HMI Hydropower Modernization Initiative INEEL Idaho National Engineering and Environmental Laboratory kW kilowatt lb/MWh pounds per megawatt-hour MB megabyte MW megawatt MWh megawatt hour N2O nitrous oxide NERC North American Electric Reliability Corporation NPV net present value O&M operations and maintenance PLEESM Planning Level Energy and Economics Study Model Reclamation United States Department of the Interior, Bureau of
Reclamation TPUD Trinity Public Utilities District U.S. United States USACE U.S. Army Corps of Engineers

This page left blank intentionally.

Chapter 1 Introduction
Chapter 1 Introduction
The United States Department of the Interior, Bureau of Reclamation (Reclamation) has been tasked by the Secretary of Interior and the Commissioner of Reclamation to determine the potential for generator uprating and turbine efficiency gains at all Reclamation hydropower projects. In conversations with the U.S. Army Corps of Engineers (USACE), it came to the attention of the Power Resources Office that there was an ongoing effort to not only quantify this potential at USACE projects, but to assess the investment needs of 54 USACE projects and to develop a tool to provide ongoing analysis. The USACE has contracted with MWH Americas to conduct this study.
Reclamation has partnered with the USACE Hydropower Modernization Initiative (HMI) effort to assess the investment needs of all Reclamation hydropower projects, and as a part of this effort, to quantify the uprating and efficiency gains that can be made at these facilities. The work covers 58 Reclamation hydropower projects in five Regions. This study was authorized as a part of USACE Contract No. W9127N-10-D-0004 with MWH Americas, Task Order No. 2, Hydropower Modernization Initiative, Bureau of Reclamation.
Scope
The scope of work for this study is contained in the following tasks outlined as a part of Task No. 2, Hydropower Modernization Initiative, Bureau of Reclamation:
Task 5: Implement Analytical Model to Assess Capacity and Efficiency Gain Opportunities. This resource assessment should quantify Reclamation’s potential capacity and efficiency gains through equipment upgrades within existing environmental, water delivery, and other regulatory constraints for (initially) 58 Reclamation power plants. All opportunities must include a benefit/cost ratio and must be ranked according to greatest benefit. The results of this modeling will be reported independently (Reference Task 7) and incorporated into the Investment Plans.
Task 6: Develop Environmental and Climate Change Benefits. The Contractor shall develop environmental criteria including quantitative and qualitative criteria related to climate change, greenhouse gas (GHG) reduction, and other site specific environmental benefits and/or impacts to habitat, water quality or recreational activities. Climate change benefits are to be based on energy production estimates of each project. The environmental and climate change
1-1 FINAL – October 2010

Hydropower Modernization Initiative Assessment of Potential Capacity Increases at Existing Hydropower Plants
benefits estimates shall be integrated into the Analytic Model development task (Reference Task 5).
Task 7: Prepare a Final Report on Capacity and Efficiency Gain Opportunities. The Contractor shall prepare a final report which describes the methodologies used, the data quality measures taken, the analytical models developed, the capacity/efficiency gains that can be made at Reclamation facilities, the benefit/cost ratio of those opportunities, and the environmental and climate change benefits.
Objectives
The objectives of the potential capacity and efficiency gains study can be briefly summarized as follows:
• Assess the potential for capacity additions at each of 58 Reclamation plants with existing hydropower;
• Estimate costs for the capacity additions;
• Present capacity addition results in terms of benefit to cost ratios (BCR) and net present values (NPV);
• Provide quantitative results for potential GHG reductions;
• Estimate energy gains through efficiency increases;
• Summarize the methodology and results in a report.
Because the optimum capacity addition at each plant was not known in advance, results for a range of capacity additions were developed at each plant. A number of major steps were required to arrive at the final BCR and NPV results, which included:
• Determine the energy associated with each increment of capacity addition at each plant;
• Develop energy values ($/MWh) and capacity values ($/kW-yr) by region over the economic period of analysis;
• Develop construction, mitigation, and operation and maintenance (O&M) costs for each increment of capacity addition;
• Develop an economic methodology and parameters that will provide the final BCR and NPV results;
• Quantify GHG reduction opportunities from capacity increases, efficiency gains, outage reductions;
• Develop a data quality rating for each plant as a measure of the quality and completeness of the data input to the energy model;
1-2 FINAL – October 2010

Chapter 1 Introduction
1-3 FINAL – October 2010
Each of these major steps and the final results are presented in the following chapters of the report.
Limitations
Due to the large number of plants involved, these studies were performed at the planning-level (screening or reconnaissance-level), not at the feasibility-level. Future studies could refine the results for individual plants that showed promise for capacity additions. This study is suitable for evaluating, screening and prioritizing across the group of 58 Reclamation plants. Future studies of specific plants would be required to evaluate the final feasibility of specific capacity additions and/or efficiency improvements at specific plants.
No site visits to the existing hydroelectric plants were made within the scope of this study. Site specific investigations of the physical or operational potential to add capacity were not conducted for this study, but could be the focus of future more detailed studies at selected plants. Physical and operational limitations could preclude capacity additions at some plants.
Ongoing plans and plant rehabilitation activities at various facilities at Reclamation have not been included in this report. This report is based on the currently available completed capacities at the existing plants.
Cost estimates were based on parametric equations, which is an appropriate method for a planning-level study.
The few pumped-storage units at the existing plants were simulated as conventional hydro units. Full consideration of the hourly operation and special economics of pumped storage units would essentially require a separate study that is beyond the scope of this study.

This page left blank intentionally.

Chapter 2 Summary of Reclamation Existing Hydroelectric Facilities
Chapter 2 Summary of Reclamation Existing Hydroelectric Facilities
Existing Hydroelectric Facilities
This chapter provides background information on the existing Reclamation hydroelectric plants included in this study. Much of the information in this chapter was either supplied by Reclamation personnel or obtained from the Reclamation web site. The Reclamation facilities and operations are divided into five regions, as shown on Figure 2-1.
Figure 2-1. Reclamation Regions
Of the 58 Reclamation facilities with existing hydropower plants included in this report, 21 are in the Great Plains Region, 3 are in the Lower Colorado Region, 12 are in the Mid-Pacific Region, 10 are in the Pacific Northwest Region, and 12 are in the Upper Colorado Region. The 58 hydropower plants have a total of 194 units that have a combined total of 14,966,186 kW (14,966 MW) of capacity.
Of the 58 existing hydropower plants, Grand Coulee alone has about 45% of the total generating capacity. Grand Coulee includes 27 conventional hydro units
2-1 FINAL – October 2010

Hydropower Modernization Initiative Assessment of Potential Capacity Increases at Existing Hydropower Plants
and 6 pump-generating units. About 68% of the total Reclamation generating capacity is contained in three plants, which are Hoover, Glen Canyon, and Grand Coulee. The location of the existing plants is shown on Figure 2-2.Table 2-1 presents a summary of data for the 58 existing Reclamation hydropower plants.
Figure 2-2. Reclamation Existing Hydroelectric Plant Locations
2-2 FINAL – October 2010

Chapter 2 Summary of Reclamation Existing Hydroelectric Facilities
2-3 FINAL – October 2010
PlantNumber
USBR RegionName
ProjectName
SiteName Location In Service
DateNumberof Units
Total NameplateCapacity (kW)
1 Great Plains Kendrick Alcova Alcova, WY Jul-55 2 41,4002 Great Plains Colorado-Big Thompson Big Thompson Loveland, CO Apr-59 1 4,5003 Great Plains Pick-Sloan Mo. Basin Boysen Thermopolis, WY Aug-52 2 15,0004 Great Plains Pick-Sloan Mo. Basin Buffalo Bill Cody, WY Jul-92 3 18,0005 Great Plains Pick-Sloan Mo. Basin Canyon Ferry Helena, MT Dec-53 3 50,0006 Great Plains Colorado-Big Thompson Estes Estes Park, CO Sep-50 3 45,0007 Great Plains Colorado-Big Thompson Flatiron Loveland, CO Jan-54 3 94,5008 Great Plains Pick-Sloan Mo. Basin Fremont Canyon Alcova, WY Dec-60 2 66,8009 Great Plains Pick-Sloan Mo. Basin Glendo Glendo, WY Dec-58 2 38,00010 Great Plains Colorado-Big Thompson Green Mountain Kremmling, CO May-43 2 26,00011 Great Plains North Platte Guernsey Guernsey, WY Jul-10 2 6,40012 Great Plains Shoshone Heart Mountain Cody, WY Dec-48 1 5,00013 Great Plains Pick-Sloan Mo. Basin Kortes Sinclair, WY Jun-50 3 36,00014 Great Plains Colorado-Big Thompson Marys Lake Estes Park, CO May-51 1 8,10015 Great Plains Fryingpan-Arkansas Mt. Elbert Twin Lakes, CO Jun-81 2 200,00016 Great Plains Pick-Sloan Mo. Basin Pilot Butte Morton, WY Jan-10 2 1,60017 Great Plains Colorado-Big Thompson Pole Hill Loveland, CO Jan-54 1 38,23818 Great Plains Kendrick Seminoe Sinclair, WY Aug-39 3 51,75019 Great Plains Pick-Sloan Mo. Basin Shoshone Cody, WY Jun-92 1 3,00020 Great Plains Pick-Sloan Mo. Basin Spirit Mountain Cody, WY Oct-94 1 4,50021 Great Plains Pick-Sloan Mo. Basin Yellowtail Hardin, MT Aug-66 4 250,00022 Lower Colorado Parker-Davis Davis Bullhead City, AZ Jan-51 5 255,00023 Lower Colorado Boulder Canyon Hoover Boulder City, NV Sep-36 19 2,078,80024 Lower Colorado Parker-Davis Parker Parker Dam, AZ Dec-42 4 120,00025 Mid-Pacific Central Valley Folsom Folsom, CA May-55 3 207,00026 Mid-Pacific Central Valley Judge Francis Carr French Gulch, CA May-63 2 154,40027 Mid-Pacific Central Valley Keswick Redding, CA Oct-49 3 117,00028 Mid-Pacific Central Valley Lewiston Lewiston, CA Feb-64 1 35029 Mid-Pacific Central Valley New Melones Jamestown, CA Jun-79 2 382,00030 Mid-Pacific Central Valley Nimbus Folsom, CA May-55 2 13,50031 Mid-Pacific Central Valley O'Neill Los Banos, CA Nov-67 6 25,20032 Mid-Pacific Central Valley San Luis (1) Los Banos, CA Mar-68 8 202,00033 Mid-Pacific Central Valley Shasta Redding, CA Jun-44 7 714,00034 Mid-Pacific Central Valley Spring Creek Redding, CA Jan-64 2 180,00035 Mid-Pacific Washoe Stampede Truckee, CA Jan-88 2 3,65036 Mid-Pacific Central Valley Trinity Redding, CA Feb-64 2 140,00037 Pacific Northwest Boise Anderson Ranch Mountain Home, ID Dec-50 2 40,00038 Pacific Northwest Boise Black Canyon Emmet, ID Dec-10 2 10,20039 Pacific Northwest Boise Boise River Diversion Boise, ID May-10 3 3,45040 Pacific Northwest Yakima Chandler Benton City, WA Feb-56 2 12,00041 Pacific Northwest Columbia Basin Grand Coulee Grand Coulee, WA Mar-41 33 6,809,00042 Pacific Northwest Rogue River Basin Green Springs Ashland, OR May-60 1 17,29043 Pacific Northwest Hungry Horse Hungry Horse Columbia Falls, MT Oct-52 4 428,00044 Pacific Northwest Minidoka Minidoka Rupert, ID May-10 4 27,70045 Pacific Northwest Palisades Palisades Palisades, ID Feb-57 4 176,56446 Pacific Northwest Yakima Roza Yakima, WA Aug-58 1 12,93747 Upper Colorado Colorado River Storage Blue Mesa Gunnison, CO Sep-67 2 86,40048 Upper Colorado Colorado River Storage Crystal Montrose, CO Jun-78 1 31,50049 Upper Colorado Provo River Deer Creek Heber, UT Feb-58 2 4,95050 Upper Colorado Rio Grande Elephant Butte Truth or Consequences, NM Nov-40 3 27,94551 Upper Colorado Colorado River Storage Flaming Gorge Dutch John UT Nov-63 3 151,95052 Upper Colorado Seedskadee Fontenelle La Barge, WY May-68 1 10,00053 Upper Colorado Colorado River Storage Glen Canyon Page, AZ Sep-64 8 1,320,00054 Upper Colorado Collbran Lower Molina Molina, CO Dec-62 1 4,86055 Upper Colorado Dolores McPhee Cortez, CO Dec-92 1 1,28356 Upper Colorado Colorado River Storage Morrow Point Montrose, CO Dec-70 2 173,33457 Upper Colorado Dolores Towaoc Cortez, CO May-93 1 11,49558 Upper Colorado Collbran Upper Molina Molina, CO Dec-62 1 8,640
Totals 194 14,966,186
Note (1): For San Luis, 202,000 kW represents the Federal share of the 424,000 kW installed capacity. The plant is operated by the State of California.
Table 2-1. Reclamation Existing Hydroelectric Plants

Hydropower Modernization Initiative Assessment of Potential Capacity Increases at Existing Hydropower Plants
Reclamation Uprating Program
Following the 1973 oil embargo, a review was made of Reclamation's powerplants to determine if they could be uprated to a higher capacity and to produce more energy. Uprating existing hydroelectric powerplants to fully utilize the available water resource for additional energy and peaking capacity was recognized as one of the better long range additions that could be made to help solve the energy problem. In 1978, the Bureau of Reclamation and the Department of the Interior established, as one of their major program goals, the investigating and implementing of all viable opportunities to improve existing plants by modernizing and uprating the generating equipment. Since 1978, Reclamation initiated a power uprating program to increase the capacity of Reclamation facilities as funding and unit availability allowed. In addition, there have been a number of generator rewinds where no appreciable uprate potential existed but winding condition was poor.
Uprating hydroelectric generator and turbine units at existing power plants are one of the most immediate, cost effective, and environmentally acceptable means for developing additional electrical power. As a result of the uprating program, the generating capacity of over one-third of Reclamation's hydroelectric generators has been increased, with almost a 50 percent average increase in generating capacity of each unit.
An uprate normally involves an increase in rating of more than 15 percent, which in turn necessitates a review of the capability and limits of all of the power equipment, from the penstock through the turbine, generator, bus, switchgear, transformer, and transmission system. These systems can then either be retained, modified or replaced in order to develop and accommodate the selected uprate level.
A good indicator for considering uprating a generator is when the turbine capability substantially exceeds the generator capability at normal operating heads. Most Reclamation turbines are designed to provide rated output (or nameplate capacity) at rated head. Since the rated head was chosen far enough below the maximum operating head to ensure the generator overload capacity could be utilized, reservoirs often operate at heads much higher than rated and the turbine is usually capable of more mechanical output than the generator can convert to electrical energy. In these and other situations, increased rating and efficiency can be obtained by runner replacement. For pre-1960 turbines, it is frequently possible to obtain output increases as high as 30 percent and efficiency increases of 1.5 percent in comparison to new original equipment by replacing existing runners with runners of modern design. A summary of the unit uprates performed by Reclamation to date is presented in Table 2-2. Uprate projects that are currently in-progress are not included in Table 2-2.
2-4 FINAL – October 2010

Chapter 2 Summary of Reclamation Existing Hydroelectric Facilities
Between the original sizing of the hydroelectric plants and the uprating program, Reclamation regional staff has previously indicated that they believe there is little or no surplus water at existing Reclamation hydroelectric plants to warrant additional units. In the recent study, Potential Hydroelectric Development at Existing Federal Facilities (U.S. Department of the Interior, et al, 2007) that is commonly known as the 1834 Study, it was stated that with few exceptions, the existing Reclamation generation facilities have been sized to their available hydrology, many over 30 years ago. There was such confidence in this statement that all of the existing Reclamation hydroelectric facilities were completely excluded from the 1834 study, a planning-level study of potential hydroelectric development at existing Federal facilities.
The current studies described in this report began and were performed with no pre-conceived conclusions on the potential for, or viability of, capacity additions at the existing Reclamation hydroelectric plants.
2-5 FINAL – October 2010

Hydropower Modernization Initiative Assessment of Potential Capacity Increases at Existing Hydropower Plants
2-6 FINAL – October 2010
Each Unit Each Unit YearOld Rating New Percent Added kW Uprate
(kW) (kW) Increase Plant CompletedAnde on Ranch 2 13,500 20,000 48.1% 13,000 1983
Black Canyon 2 4,000 5,100 27.5% 2,200 1995Bl Mesa 2 30,000 43,200 44.0% 26,400 1995
Boise River Diversion 3 500 1,150 130.0% 1,950 2005ystal 1 28,000 35,000 25.0% 7,000 2004
Flam g Gorge 3 36,000 50,495 40.3% 43,485 1992F iron 2 31,500 43,020 36.6% 23,040 1983
Frem t Canyon 2 24,000 33,400 39.2% 18,800 1989Glen Canyon 2 118,750 165,000 38.9% 92,500 1987Glen Canyon 3 118,750 165,000 38.9% 138,750 2006Glen Canyon 3 118,750 165,000 38.9% 138,750 2009
endo 2 12,000 19,000 58.3% 14,000 1983over 2 82,500 127,000 53.9% 89,000 1989
Hoover 12 82,500 130,000 57.6% 570,000 1992over 1 95,000 130,000 36.8% 35,000 1992
Hoover 1 40,000 61,500 53.8% 21,500 1992over 1 50,000 68,500 37.0% 18,500 1992
Hun ry Horse 4 71,250 107,000 50.2% 143,000 1993Judge rancis Carr 2 70,722 77,200 9.2% 12,956 2010
K swick 3 25,000 39,000 56.0% 42,000 1991Minidoka 1 2,400 3,000 25.0% 600 1996
Mo w Point 2 60,000 86,667 44.4% 53,334 1993Pa isades 2 28,500 44,141 54.9% 31,282 1994P sades 2 30,875 44,141 43.0% 26,532 1995
ta 2 75,000 142,000 89.3% 134,000 2008Shasta 3 75,000 142,000 89.3% 201,000 2005
inity 2 50,000 70,000 40.0% 40,000 1984Totals 67 3,875,094 5,813,673 48.4% 1,938,579
ant Units
Table 2-2. Reclamation Unit Uprates
rs
ue
Crinlat
on
GlHo
Ho
Hog
Fe
rrol
aliShas
Tr
Pl
Generator rewinds can increase the nameplate capacity of the units. Many of the older Reclamation generators were purchased with a continuous overload capability of 15 percent above rated output (“nameplate rating”), which was the effective standard for rating generators at that time. When “rewinding" a generator, the new winding is purchased with a base rating equal to or greater than 115 percent of the original generator nameplate rating, using the appropriate allowable temperature rise consistent with the insulation class of the new winding. If the new winding is capable of operation at levels higher than 115% of the original nameplate rating, the machine would typically still be limited to operation at its new base rating level, unless the mechanical and

Chapter 2 Summary of Reclamation Existing Hydroelectric Facilities
2-7 FINAL – October 2010
Plant Units Year kW AddedAlcova 2 2001-2002 5,400Davis 5 1974-2003 30,000
Elephant Butte 3 1990-2002 3,645Flatiron 2 1978-96 1,660Folsom 3 1962-72 36,720
Grand Coulee 18 1968-2004 306,000Green Mountain 2 1982 2,400Green Springs 1 2005 1,290
Guernsey 2 1993 1,600Pole Hill 1 1987 4,988Seminoe 3 1978-80 19,350
Spring Creek 2 1981-82 30,000Total 44 443,053
structural characteristics of the generator were confirmed to be capable of higher loads. Ratings of the bus, unit breakers, transformer, etc. are examined for capability to accommodate the new generator rated capacity, and detailed studies and selected replacements are performed as required to accommodate the new output capacity.
Table 2-3 presents a summary of the unit rewinds to date of Reclamation generators where the new base rating of the generators was 115% of their original nameplate rating. Note that, in these cases, only the nameplate rating changed; the actual generating capacity did not increase.
Table 2-3. Reclamation Unit Rewinds
So, from the above tables, 67 units have had increased nameplate capacity and increased actual generating capacity, and an additional 44 units have had increased nameplate capacity without any increase in actual generating capacity. A total of 111 of the 194 units (57%) have had an uprate or a rewind.

This page left blank intentionally.

Chapter 3 Energy Model
Chapter 3 Energy Model
An energy model is the fundamental tool used to determine the increased energy output, and therefore the benefit, that is available from a capacity addition. An energy model can also be called a power study model or an operation model. This chapter details the energy model used to simulate the 58 existing Reclamation hydroelectric plants and the capacity additions.
Objectives of PLEESM
The energy model used in this study is called the Planning Level Energy and Economics Study Model (PLEESM). PLEESM is a new model designed specifically for the objective of performing planning-level simulation of the energy production of a large number of hydroelectric plants in a relatively short amount of time. The model has also been directed at the task of investigating several alternative capacity additions at each plant in a single run. The determination of benefit/cost ratios and net present values is done within PLEESM for each capacity addition alternative. PLEESM was also designed to provide results for input to the Asset Investment Planning (AIP) tool. As a planning level model, PLEESM was intended to find the more promising of many alternatives. It was not intended to simulate energy production in the ultimate detail that would need to be incorporated into feasibility or final design studies.
Methodology
PLEESM is a sequential streamflow simulation model that operates on a daily time increment. PLEESM is an Excel© spreadsheet based model that was designed to simulate the daily energy generation at multiple hydroelectric plants for a period of up to 30 years. A key simplification of the PLEESM model is that total reservoir outflow is an input to the model, whereas reservoir inflow is input to some other power study models and outflow is determined by the model. Using reservoir outflow as model input is made possible in this study because all of the reservoirs have existed for many years. Using historic reservoir outflows as input data also implies that future reservoir operation will be essentially the same as historical/existing reservoir operation.
PLEESM includes provision for the modeling of up to eight separate existing turbine-generator units that may have varying capacities. PLEESM allocates flow to units in order, such that the hydraulic capacity of Unit 1 is completely utilized on a given day before any flow is allocated to Unit 2, with a similar
3-1 FINAL – October 2010
Hydropower Modernization Initiative Assessment of Potential Capacity Increases at Existing Hydropower Plants
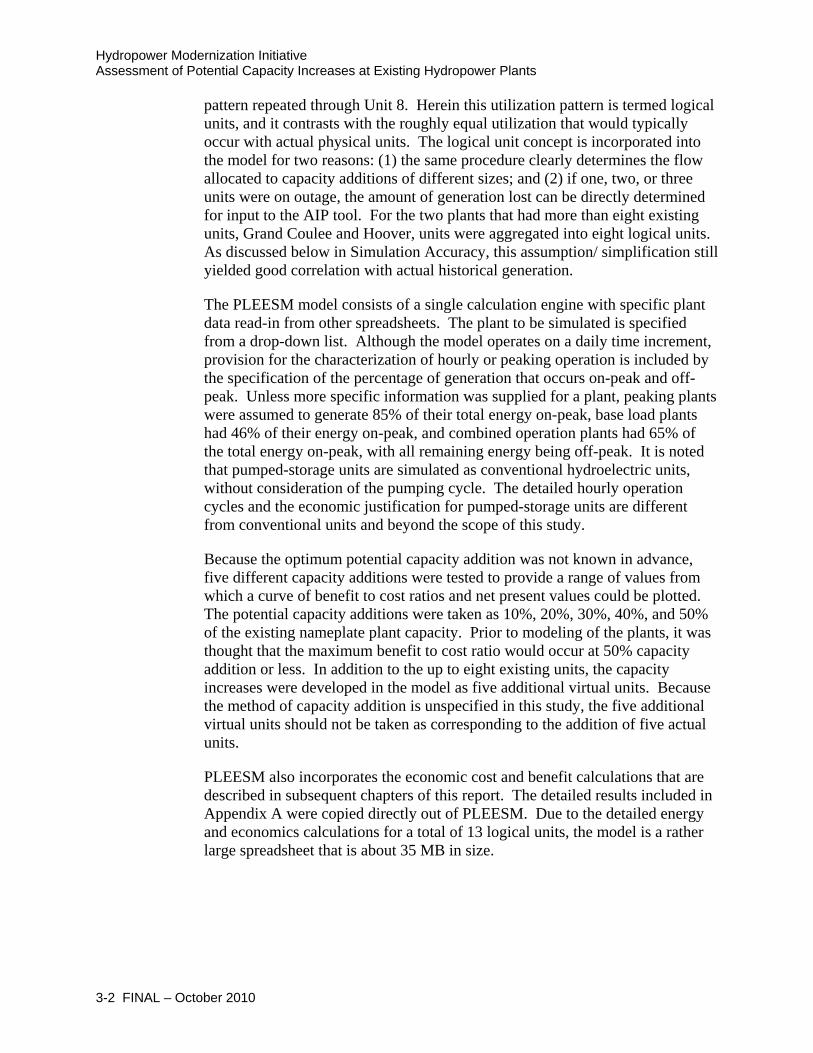
pattern repeated through Unit 8. Herein this utilization pattern is termed logical units, and it contrasts with the roughly equal utilization that would typically occur with actual physical units. The logical unit concept is incorporated into the model for two reasons: (1) the same procedure clearly determines the flow allocated to capacity additions of different sizes; and (2) if one, two, or three units were on outage, the amount of generation lost can be directly determined for input to the AIP tool. For the two plants that had more than eight existing units, Grand Coulee and Hoover, units were aggregated into eight logical units. As discussed below in Simulation Accuracy, this assumption/ simplification still yielded good correlation with actual historical generation.
The PLEESM model consists of a single calculation engine with specific plant data read-in from other spreadsheets. The plant to be simulated is specified from a drop-down list. Although the model operates on a daily time increment, provision for the characterization of hourly or peaking operation is included by the specification of the percentage of generation that occurs on-peak and off-peak. Unless more specific information was supplied for a plant, peaking plants were assumed to generate 85% of their total energy on-peak, base load plants had 46% of their energy on-peak, and combined operation plants had 65% of the total energy on-peak, with all remaining energy being off-peak. It is noted that pumped-storage units are simulated as conventional hydroelectric units, without consideration of the pumping cycle. The detailed hourly operation cycles and the economic justification for pumped-storage units are different from conventional units and beyond the scope of this study.
Because the optimum potential capacity addition was not known in advance, five different capacity additions were tested to provide a range of values from which a curve of benefit to cost ratios and net present values could be plotted. The potential capacity additions were taken as 10%, 20%, 30%, 40%, and 50% of the existing nameplate plant capacity. Prior to modeling of the plants, it was thought that the maximum benefit to cost ratio would occur at 50% capacity addition or less. In addition to the up to eight existing units, the capacity increases were developed in the model as five additional virtual units. Because the method of capacity addition is unspecified in this study, the five additional virtual units should not be taken as corresponding to the addition of five actual units.
PLEESM also incorporates the economic cost and benefit calculations that are described in subsequent chapters of this report. The detailed results included in Appendix A were copied directly out of PLEESM. Due to the detailed energy and economics calculations for a total of 13 logical units, the model is a rather large spreadsheet that is about 35 MB in size.
3-2 FINAL – October 2010
Chapter 3 Energy Model
Model Input
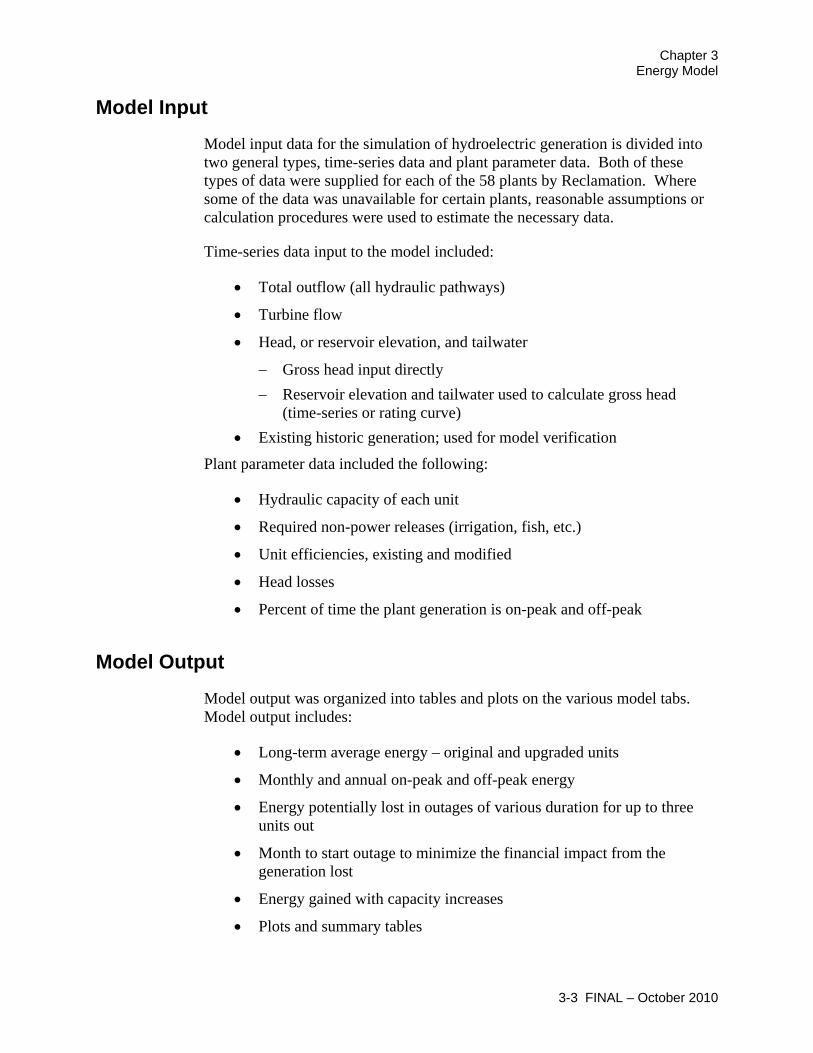
Model input data for the simulation of hydroelectric generation is divided into two general types, time-series data and plant parameter data. Both of these types of data were supplied for each of the 58 plants by Reclamation. Where some of the data was unavailable for certain plants, reasonable assumptions or calculation procedures were used to estimate the necessary data.
Time-series data input to the model included:
• Total outflow (all hydraulic pathways)
• Turbine flow
• Head, or reservoir elevation, and tailwater
− Gross head input directly − Reservoir elevation and tailwater used to calculate gross head
(time-series or rating curve) • Existing historic generation; used for model verification
Plant parameter data included the following:
• Hydraulic capacity of each unit
• Required non-power releases (irrigation, fish, etc.)
• Unit efficiencies, existing and modified
• Head losses
• Percent of time the plant generation is on-peak and off-peak
Model Output
Model output was organized into tables and plots on the various model tabs. Model output includes:
• Long-term average energy – original and upgraded units
• Monthly and annual on-peak and off-peak energy
• Energy potentially lost in outages of various duration for up to three units out
• Month to start outage to minimize the financial impact from the generation lost
• Energy gained with capacity increases
• Plots and summary tables
3-3 FINAL – October 2010

Hydropower Modernization Initiative Assessment of Potential Capacity Increases at Existing Hydropower Plants
• Sheet with tabulated parameters for import to the AIP tool
• Economics
Figures 3-1 through 3-4 are examples of plots for Keswick that are automatically developed within PLEESM for each plant. Figure 3-1 is a plot of flow duration through each unit and for five potential capacity additions. Keswick has three existing units (Units 1-3) and Figure 3-1 shows that the great majority of the available flow can by utilized by the existing units. The five smaller color bands (virtual Units 9-13) are the flow that could be utilized by the five potential increments of additional capacity. Figure 3-2 shows the monthly distribution of flow through each of the existing units and potential capacity addition increments. Figures 3-3 and 3-4 show typically good agreement between simulated and actual generation for monthly and daily generation, respectively. Figure 3-4 displays daily generation developed from monthly data by making all daily data input equal to the monthly average.
0
10,000
20,000
30,000
40,000
50,000
60,000
70,000
80,000
90,000
0% 10% 20% 30% 40% 50% 60% 70% 80% 90% 100%
Flow
(cfs
)
Percent of Time Flow is Equaled or Exceeded
Spill Unit 13
Unit 12
Unit 11
Unit 10
Unit 9
Unit 3
Unit 2
Unit 1
Required Non-Power Releases
Figure 3-1. Flow Thru Existing Keswick Units and Potential Capacity Additions
3-4 FINAL – October 2010

Chapter 3 Energy Model
0
10,000
20,000
30,000
40,000
50,000
60,000
70,000
Jan Feb Mar Apr May Jun Jul Aug Sep Oct Nov Dec
Mon
thly
Gen
erat
ion
(MW
h
Unit 13
Unit 12)
Unit 11
Unit 10
Unit 9
Unit 3
Unit 2
Unit 1
0
10,000
20,000
30,000
40,000
50,000
60,000
70,000
80,000
1/19
809/19
805/19
811/19
829/19
825/19
831/19
849/19
845/19
851/19
869/19
865/19
871/19
889/19
885/19
891/19
909/19
905/19
911/19
929/19
925/19
931/19
949/19
945/19
951/19
969/19
965/19
971/19
989/19
985/19
991/20
009/20
005/20
011/20
029/20
025/20
031/20
049/20
045/20
051/20
069/20
065/20
071/20
089/20
085/20
09
Mon
thly
Gen
erat
ion
(MW
h)
Simulated Existing NET Generation
Actual NET Generation
Figure 3-2. Keswick Average Monthly Energy Distribution
Figure 3-3. Keswick Simulated and Actual Monthly Generation
3-5 FINAL – October 2010

Hydropower Modernization Initiative Assessment of Potential Capacity Increases at Existing Hydropower Plants
0
500
1,000
1,500
2,000
2,500
3,000
10/2
8/19
95
7/4/
1996
3/11
/199
7
11/1
6/19
97
7/24
/199
8
3/31
/199
9
12/6
/199
9
8/12
/200
0
4/19
/200
1
12/2
5/20
01
9/1/
2002
5/9/
2003
1/14
/200
4
9/20
/200
4
5/28
/200
5
2/2/
2006
10/1
0/20
06
6/17
/200
7
2/22
/200
8
10/2
9/20
08
7/6/
2009
Dai
ly G
ener
atio
n (M
Wh)
Existing Units Simulated Net Generation
Existing Recorded Generation
Figure 3-4. Simulated and Actual Keswick Daily Generation
Interface with AIP Tool
PLEESM was designed to provide results for input to the AIP tool. The AIP tool incorporates risk management principles to guide hydroelectric equipment investments to maximize the return on investment for a given level of service. Parameters determined in PLEESM and transferred to the AIP tool include:
• Existing and upgraded unit on-peak and off-peak average monthly energy in logical unit order
• Upgraded unit on-peak and off-peak average monthly energy corresponding to a selected capacity increase
• For outages having durations of one to twelve months, the month when the outage should be scheduled to start to minimize financial losses is determined.
Simulation Accuracy
Simulation accuracy is a measure of the agreement between the simulated and recorded generation. Reasonable agreement between simulated and actual generation validates the data input and the modeling procedure. With few
3-6 FINAL – October 2010

Chapter 3 Energy Model
3-7 FINAL – October 2010
% Difference between Simulated and Actual Generation
Number of Plants % of Total
Cumulative % of Total
+
exceptions, the simulation accuracy was generally good. Simulated generation was usually higher than actual generation for at least three reasons. First, simulation of the existing units assumed the efficiencies would correspond to new, original condition. This was due to the required interface with the AIP tool which performs the unit degradation with age. Second, uprates have occurred over time such that simulated generation based on the current capacity will show greater generation than actual data based on the pre-uprate recorded generation. And finally third, historic outages were not directly simulated. The simulation accuracy is summarized in Table 3-1.
0 - 5% 21 37% 37%+ 5 - 10% 19 33% 70%+ 10 - 15% 8 14% 84%+ 15 - 20% 4 7% 91%+ 20 - 25% 4 7% 98%+ 25 - 30% 1 2% 100%+ > 30% 0 0% -
Table 3-1. Summary of Simulation Accuracy
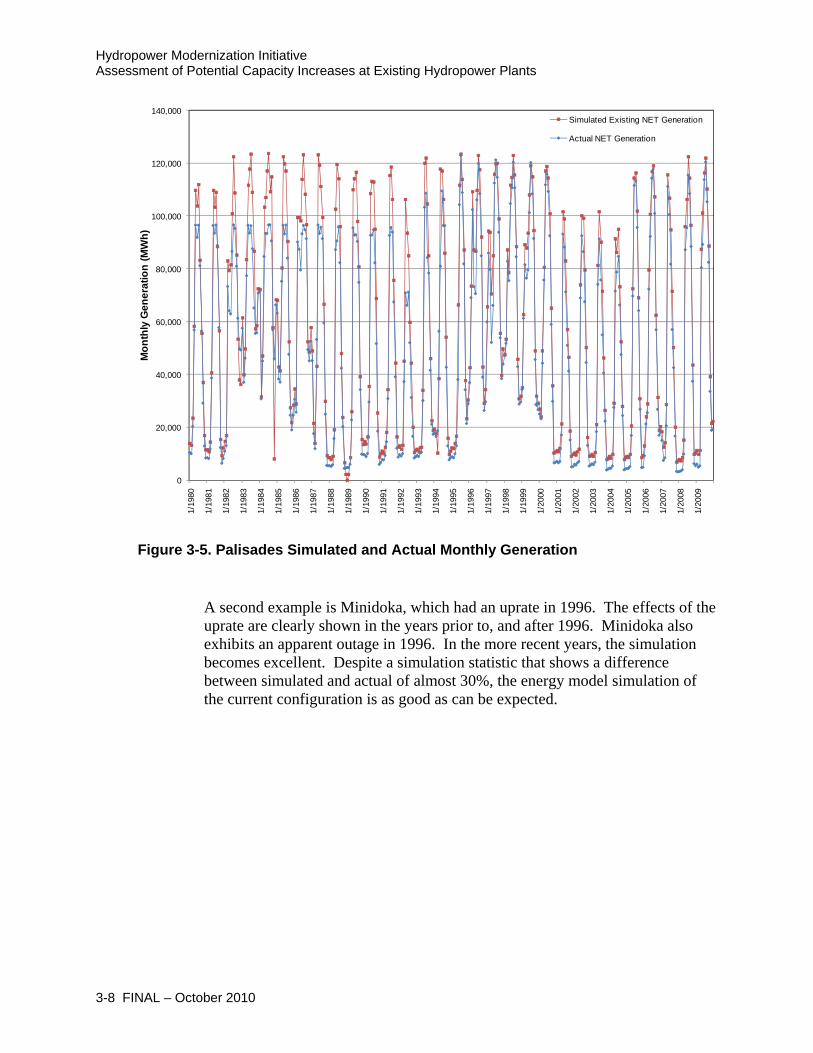
An example of how uprates affect the simulation accuracy is shown on Figure 3-5 for Palisades, which was uprated in 1994-95. For the months with the highest generation prior to 1995, the existing generation was substantially less than the simulated generation. This is because the model includes the current uprated capacity for the entire period of the simulation. For 1995 and later, the simulation is excellent, even though the simulation accuracy shows a 12% difference between simulated and actual generation.
Hydropower Modernization Initiative Assessment of Potential Capacity Increases at Existing Hydropower Plants
0
20,000
40,000
60,000
80,000
100,000
120,000
140,000
1/19
80
1/19
81
1/19
82
1/19
83
1/19
84
1/19
85
1/19
86
1/19
87
1/19
88
1/19
89
1/19
90
1/19
91
1/19
92
1/19
93
1/19
94
1/19
95
1/19
96
1/19
97
1/19
98
1/19
99
1/20
00
1/20
01
1/20
02
1/20
03
1/20
04
1/20
05
1/20
06
1/20
07
1/20
08
1/20
09
Mon
thly
Gen
erat
ion
(MW
h)
Simulated Existing NET Generation
Actual NET Generation
Figure 3-5. Palisades Simulated and Actual Monthly Generation
A second example is Minidoka, which had an uprate in 1996. The effects of the uprate are clearly shown in the years prior to, and after 1996. Minidoka also exhibits an apparent outage in 1996. In the more recent years, the simulation becomes excellent. Despite a simulation statistic that shows a difference between simulated and actual of almost 30%, the energy model simulation of the current configuration is as good as can be expected.
3-8 FINAL – October 2010

Chapter 3 Energy Model
3-9 FINAL – October 2010
0
5,000
10,000
15,000
20,000
25,000
1/19
82
1/19
83
1/19
84
1/19
85
1/19
86
1/19
87
1/19
88
1/19
89
1/19
90
1/19
91
1/19
92
1/19
93
1/19
94
1/19
95
1/19
96
1/19
97
1/19
98
1/19
99
1/20
00
1/20
01
1/20
02
1/20
03
1/20
04
1/20
05
1/20
06
1/20
07
1/20
08
1/20
09
Mon
thly
Gen
erat
ion
(MW
h)Simulated Existing NET Generation
Actual NET Generation
Figure 3-6. Minidoka Simulated and Actual Monthly Generation

This page left blank intentionally.

Chapter 4 Economics
Chapter 4 Economics
This chapter provides the economic parameters, methodology, and example calculation details of the costs and benefits associated with the capacity additions for each plant. The economic analysis defines the capacity addition amounts that would be most beneficial from a purely economic viewpoint. This is usually determined by selecting the alternative having the maximum NPV, or the highest BCR. The BCR and NPV values can also be used as a means to rank the most beneficial capacity additions among the 58 plants.
Definitions
The following definitions define terms as they are used in this study:
• Benefit to Cost Ratio (BCR or B/C) – The present value of total benefits divided by the present value of total costs
• Discount Rate – Time value of money used to convert or aggregate costs and benefits occurring at various times to a common point in time.
• Net Present Value (NPV) – The present value of the total benefits minus the present value of the total costs.
• Nominal Values (nominal dollars, nominal discount rate) – Includes the effects of expected or historic inflation. Costs expressed in nominal dollars are in terms of the cost in the year spent. Benefits expressed in nominal dollars are in terms of the benefit in the year realized.
• Present Value – The present value provides a means to determine and compare total costs or benefits over time. A series of annual values in nominal dollars should not be totaled in an economic analysis as the dollar values are not equivalent. The discount rate is used to adjust dollar values over time to current dollar values.
• Real (or Constant Dollar) Values – Values adjusted to eliminate the effects of expected or historic inflation.
• Levelized capital cost – Represents the present value of the total capital cost and fixed O&M costs of building and operating a generating plant over its financial life, amortized to equal annual payments.
The economic analysis for this study uses nominal values.
4-1 FINAL – October 2010

Hydropower Modernization Initiative Assessment of Potential Capacity Increases at Existing Hydropower Plants
Economic Parameters
The economic analysis was performed using several basic economic parameters and assumptions as summarized below:
• Period of economic analysis – 50 years; 2015 through 2064
• On-line date for all alternatives – 2015
• Discount rate – 4.375%. Applicable to Federal water resources planning and reflects Federal ownership (Federal Register, 2010).
• Inflation rate – 1.8%. Based on the differential between a long-term (30-year) real interest rate of 2.7% (OMB 2009) and the nominal interest rate of 4.5%, an inflation rate of 1.8% is implied.
• Energy value escalation – includes a variable annual real escalation plus 1.8% per year for inflation.
• Capacity escalation – Capacity values are constant in nominal dollars as they are assumed to represent levelized capital costs
• O&M escalation rate – 2.3% (consisting of 1.8% inflation plus 0.5% real escalation)
• Annual costs and benefits – expressed in nominal dollars
• Present value year – 2010
• Interest rate – not applicable as the construction and mitigation costs are included as a single capital cost and are not amortized
Because ownership and funding for the capacity additions is expected to be Federal, a 4.375% discount rate is applicable (OMB 2009). If private ownership and financing were involved, the discount rate would be higher and use of a different interest rate for amortization may be necessary. Depending on the ownership and financing source, the applicable discount rate could range from 4.375% to about 12%. For example, a typical discount rate used by a large investor owned utility could be about 8.0%. Because of the sensitivity of the results to the selected discount rate, examples of varying the discount rate are shown in Example Economic Results Description.
Costs and Benefits
Costs and benefits include several components that are discussed in more detail in subsequent chapters. Cost components include:
• Initial construction cost
• Mitigation costs
• Fixed and variable annual O&M costs
4-2 FINAL – October 2010

Chapter 4 Economics
Benefits include annual values for:
• On-peak energy (MWh) times the annual value of on-peak energy ($/MWh)
• Off-peak energy (MWh) times the annual value of off-peak energy ($/MWh)
• Capacity ($/kW-year), which is a variable depending on the incremental capacity factor of the added capacity times the added capacity (kW)
Example Economic Results Description
Because the optimal capacity addition for any plant is not known in advance, economic results were determined for capacity additions in five increments of 10%, 20%, 30%, 40%, and 50% of the existing installed capacity. It was thought that the most beneficial capacity additions would in most cases be less than 50% of the existing installed capacity. Plotting curves of the economic results for the various capacity additions can enhance comprehension of the results.
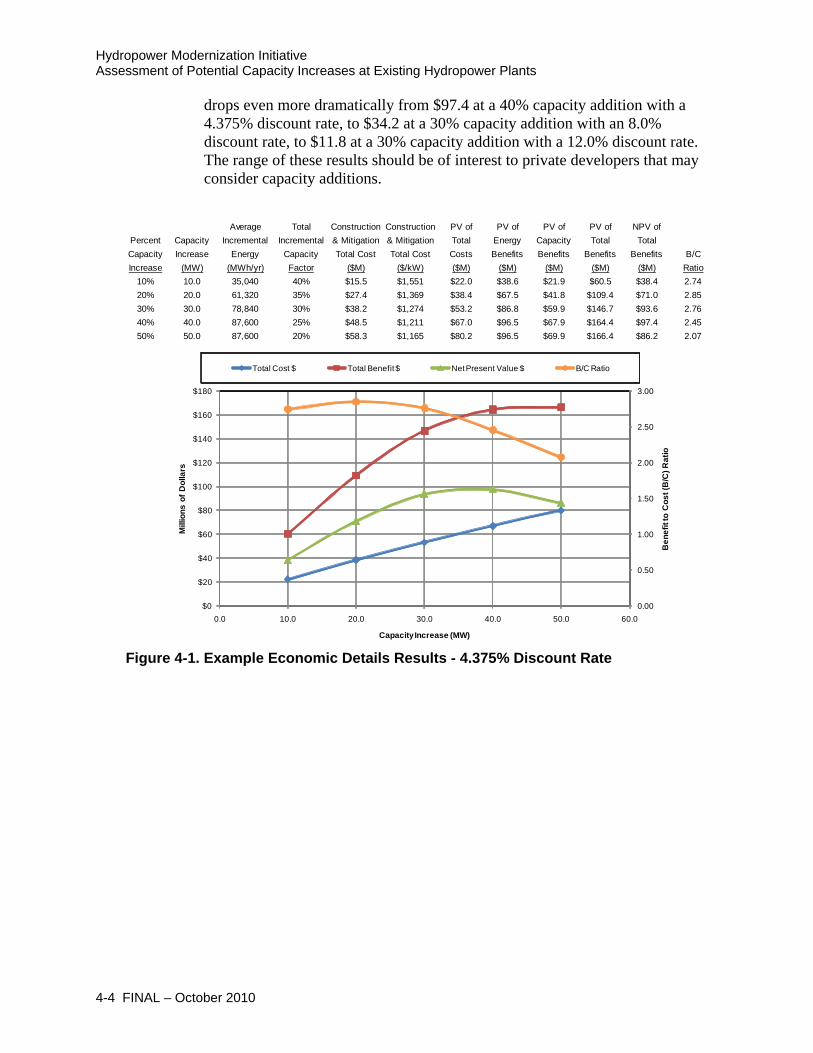
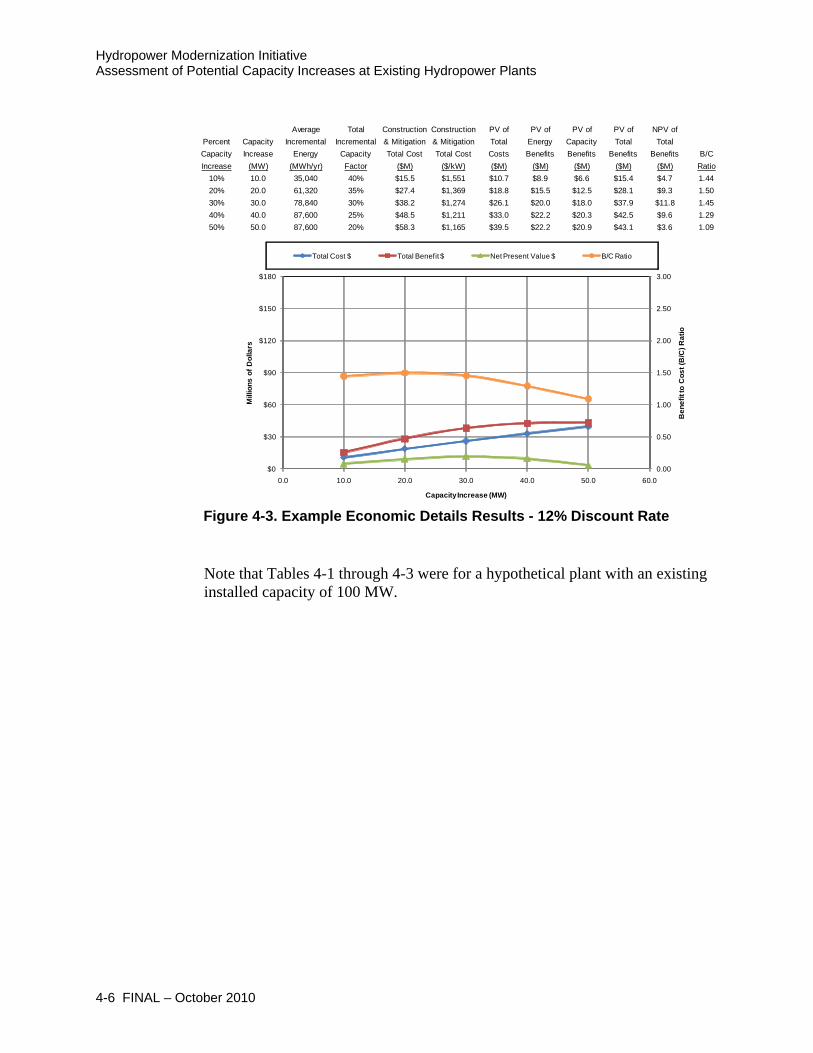
Examples of the detailed economic results, which are provided for each of the 58 plants in Appendix A, are presented in the following figures for a hypothetical plant with an existing installed capacity of 100 MW. To show the sensitivity of the results to the range of potential discount rates, Figures 4-1, 4-2, and 4-3 have identical input except for discount rates of 4.375%, 8.0% and 12.0%. The hypothetical plant used for the figures is capable of generating substantial additional energy as shown by the total incremental capacity factor. Capacity factor is a ratio (or percent) that represents the actual generation divided by the generation that could be obtained if the incremental capacity was run at full output for the entire year. For example, 40 MW of capacity could potentially generate 350,400 MWh (40 MW times 8,760 hours in a year). If the actual annual average generation was 87,600 MWh, the capacity factor would be 25% (87,600/350,400 – times 100 to convert to a percentage).
Numerical values plotted on the following figures are tabulated above the figures. The construction and mitigation total cost represents the initial capital investment. The construction and mitigation cost is also shown in the table above the figures in terms of $/kW as a reference value. The maximum BCR ratio and the maximum net present value typically do not occur at the same capacity addition value as shown in the example.
The results show that while the maximum BCR always occurs for a 20% capacity addition, the maximum benefit to cost ratio drops from 2.85 with a discount rate of 4.375%, to 2.02 with a discount rate of 8%, to 1.50 with a discount rate of 12.0%. The maximum net present value (in millions of dollars)
4-3 FINAL – October 2010
Hydropower Modernization Initiative Assessment of Potential Capacity Increases at Existing Hydropower Plants
4-4 FINAL – October 2010
Average Total Construction Construction PV of PV of PV of PV of NPV ofPercent Capaci Incremental Incremental & Mitigation & Mitigation Total Energy Capacity Total TotalCapacity Increas Energy Capacity Total Cost Total Cost Costs Benefits Benefits Benefits Benefits B/CIncrease
drops even more dramatically from $97.4 at a 40% capacity addition with a 4.375% discount rate, to $34.2 at a 30% capacity addition with an 8.0% discount rate, to $11.8 at a 30% capacity addition with a 12.0% discount rate. The range of these results should be of interest to private developers that may consider capacity additions.
tye
(MW) (MWh/yr) Factor ($M) ($/kW) ($M) ($M) ($M) ($M) ($M) Ratio10% 10.0 35,040 40% $15.5 $1,551 $22.0 $38.6 $21.9 $60.5 $38.4 2.7420% 20.0 61,320 35% $27.4 $1,369 $38.4 $67.5 $41.8 $109.4 $71.0 2.8530% 30.0 78,840 30% $38.2 $1,274 $53.2 $86.8 $59.9 $146.7 $93.6 2.7640% 40.0 87,600 25% $48.5 $1,211 $67.0 $96.5 $67.9 $164.4 $97.4 2.4550% 50.0 87,600 20% $58.3 $1,165 $80.2 $96.5 $69.9 $166.4 $86.2 2.07
Total Cost $
0.00
0.50
1.00
1.50
2.00
2.50
3.00
$0
$20
$40
$60
$80
$100
$120
$140
$160
$180
0.0 10.0 20.0 30.0 40.0 50.0 60.0
Ben
efit
to C
ost (
B/C
) Rat
io
Mill
ions
of D
olla
rs
Capacity Increase (MW)
Total Benefit $ Net Present Value $ B/C Ratio
Figure 4-1. Example Economic Details Results - 4.375% Discount Rate

Chapter 4 Economics
4-5 FINAL – October 2010
Average Total Construction Construction PV of PV of PV of PV of NPV ofrcent Capacity Incremental Incremental & Mitigation & Mitigation Total Energy Capacity Total Total
Capacity Increase Energy Capacity Total Cost Total Cost Costs Benefits Benefits Benefits Benefits B/Cease
Pe (MW) (MWh/yr) Factor ($M) ($/kW) ($M) ($M) ($M) ($M) ($M) RatioIncr 10% 10.0 35,040 40% $15.5 $1,551 $14.7 $17.2 $11.4 $28.6 $13.9 1.95
20% 20.0 61,320 35% $27.4 $1,369 $25.6 $30.1 $21.8 $51.8 $26.2 2.0230.0 78,840 30% $38.2 $1,274 $35.6 $38.7 $31.1 $69.8 $34.2 1.9640.0 87,600 25% $48.5 $1,211 $44.9 $43.0 $35.3 $78.3 $33.3 1.74
50% 50.0 87,600 20% $58.3 $1,165 $53.9 $43.0 $36.3 $79.3 $25.5 1.47
30%40%
Total Cost $
0.00
0.50
1.00
1.50
2.00
2.50
3.00
$0
$30
$60
$90
$120
$150
$180
0.0 10.0 20.0 30.0 40.0 50.0 60.0
Ben
efit
to C
ost (
B/C
) Rat
io
Mill
ions
of D
olla
rs
Capacity Increase (MW)
Total Benefit $ Net Present Value $ B/C Ratio
Figure 4-2. Example Economic Details Results - 8% Discount Rate
Hydropower Modernization Initiative Assessment of Potential Capacity Increases at Existing Hydropower Plants
4-6 FINAL – October 2010
Average Total Construction Construction PV of PV of PV of PV of NPV ofrcent Capacity Incremental Incremental & Mitigation & Mitigation Total Energy Capacity Total Total
Capacity Increase Energy Capacity Total Cost Total Cost Costs Benefits Benefits Benefits Benefits B/Crease
Pe (MW) (MWh/yr) Factor ($M) ($/kW) ($M) ($M) ($M) ($M) ($M) RatioInc 10% 10.0 35,040 40% $15.5 $1,551 $10.7 $8.9 $6.6 $15.4 $4.7 1.44
20% 20.0 61,320 35% $27.4 $1,369 $18.8 $15.5 $12.5 $28.1 $9.3 1.50% 30.0 78,840 30% $38.2 $1,274 $26.1 $20.0 $18.0 $37.9 $11.8 1.45
0% 40.0 87,600 25% $48.5 $1,211 $33.0 $22.2 $20.3 $42.5 $9.6 1.2950% 50.0 87,600 20% $58.3 $1,165 $39.5 $22.2 $20.9 $43.1 $3.6 1.09
304
Total Cost $
0.00
0.50
1.00
1.50
2.00
2.50
3.00
$0
$30
$60
$90
$120
$150
$180
0.0 10.0 20.0 30.0 40.0 50.0 60.0
Ben
efit
to C
ost (
B/C
) Rat
io
Mill
ions
of D
olla
rs
Capacity Increase (MW)
Total Benefit $ Net Present Value $ B/C Ratio
Figure 4-3. Example Economic Details Results - 12% Discount Rate
Note that Tables 4-1 through 4-3 were for a hypothetical plant with an existing installed capacity of 100 MW.

Chapter 5 Energy and Capacity Benefits
Chapter 5 Energy and Capacity Benefits
The benefits from capacity additions at the 58 plants are based on the costs of an equivalent increment of an alternative thermal plant that would be offset by the additional hydropower. Benefits are developed in more detail in the following chapters, but in a simplified and approximate manner, benefits can be expressed in the following alternative terms:
Benefits = capacity + on-peak and off-peak energy
= fixed costs + variable costs
= capital costs + operating costs
= (construction costs + fixed O&M) + (fuel costs + variable O&M)
Energy Benefits
The Energy Information Administration has developed a system to provide 25 year forecasts and analyses of energy-related activities, including electricity prices as a component of the Annual Energy Outlook (EIA 2010a). The Electricity Market Module (EMM) represents the capacity planning, generation, transmission, and pricing of electricity. Energy values ($/MWh) for this study were developed for the appropriate EMM region. Average annual energy values were then distributed to monthly values on a regional basis to account for the seasonal timing of the additional capacity generation (EIA 2010c). EMM regions were defined by the Energy Information Administration (EIA 2010a) as shown on Figure 5-1. All of the 58 Reclamation plants in this study are in regions 11, 12, or 13.
5-1 FINAL – October 2010

Hydropower Modernization Initiative Assessment of Potential Capacity Increases at Existing Hydropower Plants
1 East Central Area Reliability Coordination Agreement (ECAR) 8 Florida Reliability Coordinating Council (FL)Electric Reliability Council of Texas (ERCOT) 9 Southeastern Electric Reliability Council (SERC)Mid-Atlantic Area Council (MAAC) 10 Southwest Power Pool (SPP)
4 Mid-American Interconnected Network (MAN) 11 Northwest Power Pool (NPP)Mid-Continent Area Power Pool (MAPP) 12 Rocky Mountain Power Area, Arizona,New York (NY) New Mexico, and Southern Nevada (RA)
7 New England (NE) 13 California (CA)
Figure 5-1. Electricity Market Module Regions
Benefits were separated into on-peak and off-peak energy values and capacity
y, 10).
http://www.eia.doe.gov/oiaf/aeo/supplement/sup_elec.xls
The relevant base information is contained in Tables 82, 83, and 84 of the above
After a review of a number of possibilities, it was determined that energy values
.
Energy value = fuel costs + variable operating costs
Variable operating costs = 20% of fuel costs
On-peak energy fuel = gas
23
56
values. To provide market prices for energy and capacity, values were developed based on information available from the Department of EnergEnergy Information Administration (EIA), Annual Energy Outlook (EIA, 20The specific data used to develop the energy and capacity values is contained in a spreadsheet available on the Internet at the following location:
referenced spreadsheet for Electric Power Projections for Regions 11, 12, and 13. The energy values used in this study do not appear directly in the EIA tables, but are calculated from information in the table.
based on the average of two methods would be most appropriate. In the first method, on-peak energy values are based on the value of gas-fired generation,while off-peak generation values are based on the value of coal-fired generationThe general formulas used in the energy value calculations are as follows:
5-2 FINAL – October 2010

Chapter 5 Energy and Capacity Benefits
Off-peak energy fuel = coal
ormula is based on the particular fuel type. Generation in the following f
$
$ 1.2
In the second method, regional information obtained from Federal Energy Regulatory Commission (F 714 (Annual Electric Balancing ERC Form
he ambda”
st of n
peak energy analysis for the Northwest Power Pool area (Region 11 on Figure n
her ing in
ded growth rate for the last 10 years of the DOE projected horizon, 2025 to 2035. This
is s
h
)Authority Area and Planning Authority Area Report) is used to determine ton-peak and off-peak energy values. On FERC Form 714, the system “lis reported for each hour of the year, where “lambda” represents the marginal cost of electricity for the given hour. From these values, the ratio of the marginal cost of energy during on-peak and off-peak hours can be determined as a ratio to the 24-hour average marginal cost of energy. The average cothermal generation for the EMM region as determined from the EIA data is theadjusted by these ratios. The on-peak and off-peak energy values used for eachregion are taken as the average of the two methods. On-peak is the 16-hour period generally from 6 am to 10pm (more specifically, the 16 hour period with the highest values); other hours are off peak.
Figure 5-2 shows the results for real and nominal values of on-peak and off-
5-1). Up to 2035, real escalation was as determined from the EIA data, and aannual inflation rate of 1.8% was added. For years 2045 and beyond, a real escalation rate of 0.5% was assumed, which was less than the average real escalation rate up to 2035. In the period from 2036 to 2044, annual real escalation rates were estimated that would smoothly transition from the higreal escalation rates prior to 2035 to the lower real escalation rates beginn2045. An annual inflation rate of 1.8% was added for all years. For 2045 and beyond, the effective energy value annual escalation rate is 2.3%.
The projections beyond 2035 are based on the calculated compoun
growth rate is generally applied to extrapolate values to 2064. However, in some cases, the rate is high, resulting in unreasonable out-year values. A limiting growth rate of 0.5% was specified. If the calculated 2025 to 2035 growth rate is less than the limiting growth rate, the calculated growth rateapplied from 2036 and beyond. If the calculated 2025 to 2035 growth rate igreater than the limiting growth rate, the calculated rate is reduced linearly eacyear from 2036 to 2045, and the limiting growth rate is used thereafter.
5-3 FINAL – October 2010

Hydropower Modernization Initiative Assessment of Potential Capacity Increases at Existing Hydropower Plants
0
20
40
60
80
100
120
140
160
180
200
2010 2020 2030 2040 2050 2060 2070
Ener
gy V
alue
($
/MW
h)On-Peak Nominal $
On-Peak Real $
Off-Peak Nominal $
Off-Peak Real $
Western Energy Coordinating CouncilNorthwest Power Pool (NPP)
igure 5-2. Real and Nominal Energy Values for the Northwest Power Pool
In a similar manner, Figure 5-3 shows the results for real and nominal values of on-peak and off-peak energy analysis for the Rocky Mountain Power Area
F
(Region 12 on Figure 5-1), and Figure 5-4 shows the energy values for California (Region 13 on Figure 5-1).
5-4 FINAL – October 2010

Chapter 5 Energy and Capacity Benefits
0
50
100
150
200
250
2010 2020 2030 2040 2050 2060 2070
En V
a/M
Rocky Mountain Power Area, Arizona,New Mexico, and Southern Nevada (RA)
On-Peak Nominal $
On-Peak Real $ Off-Peak Nominal $
Off-Peak Real $
Wh)
lue
($
ergy
300
0
50
100
150
200
250
2010 2020 2030 2040 2050 2060 2070
rgy
e (
h)En
e V
alu
$/M
W
On-Peak Nominal $
On-Peak Real $
Off-Peak Nominal $
Off-Peak Real $
Western Energy Coordinating CouncilCalifornia (CA)
Figure 5-3. Real and Nominal Energy Values for the Rocky Mountain Power Area
Figure 5-4. Real and Nominal Energy Values for California
5-5 FINAL – October 2010

Hydropower Modernization Initiative Assessment of Potential Capacity Increases at Existing Hydropower Plants
Capacity Be
The capacity value represents the per kilowatt annualized capital cost and other associated with the alternative thermal plant. Capacity values have
watt per year ($/kW-yr). In some studies, benefits
ity
tial to
lue in
2010 (EIA 2010b). A $/kW-yr capacity value can be derived dditions and EIA estimates of capital
d ut
nefits
fixed coststhe units of dollars per kiloare developed solely from “all-in” energy values in which capacity benefits are included as a component of the energy value. In many other studies (this one included), benefits are developed from separate annual capacity and energy values. It was known in advance that many of the Reclamation plants would develop little or no additional energy as a result of the potential capacity additions. If there was zero additional energy associated with a capacity increase, the “all-in” energy values would result in zero benefits for the capacincrease. At a minimum, because the existing Reclamation plants have upstream regulating reservoirs, the added capacity would have some potenoccasionally move some energy from off-peak hours to higher-valued on-peak hours. Additionally, added hydropower capacity may have increasing vathe future for integration of renewable energy, such as wind power. Including separate capacity and energy values in the structure of the economic analysis provides for the explicit variable inclusion of capacity valuation, and for the future capability to adjust the value of added capacity for cases with little or noadded energy.
The capacity values were developed from a note associated with the Annual Energy Outlookby using EIA projections of capacity acosts. Because the EIA data is based on U.S. average levelized values, the capacity values were constant for all regions in all years. The EIA estimates a conventional combined cycle generation resource entering service in 2016 anoperating at a capacity factor of 87 percent carries a annual fixed cost of abo200 $/kW/yr, and a conventional combustion turbine entering service in 2016 operating at a capacity factor of 30% carries an annual cost of 120 $/kW/yr. At0% capacity factor, the capacity value was estimated to be about 10% of the 30% capacity factor value, or 12 $/kW-yr. The resulting incremental capacity values as a function of capacity factor is shown on Figure 5-5.
5-6 FINAL – October 2010

Chapter 5 Energy and Capacity Benefits
0
50
100
150
200
250
0% 10% 20% 30% 40% 50% 60% 70% 80% 90% 100%
Inen
Ca
y Ve
(-y
Incremental Capacity Factor
ear)
$/kW
alu
paci
t
tal
crem
Figure 5-5. Capacity Value as a Function of Incremental Capacity Factor
It should be noted that the useful life of most thermal alternatives is 30 years, rather than the 50 to 100-year life assumed for hydro plants. It is assumed that, should the alternative thermal plant be constructed, it would be replaced by an identical plant at appropriate intervals through the hydro project’s life (30, 60, and 90 years). As long as the thermal plant cost increases over this period are limited to those resulting from general inflation, the amortized present value of the fixed costs for the series of identical thermal plants over 100 years (adjusted to remove the effects of general inflation) will be identical to the amortized present value of the initial thermal plant amortized over its 30-year life. As a result, capacity values are normally computed simply on the basis of the initial thermal plant’s 30-year life. It is very likely that the replacement plants will not be identical to the initial plant, but it is difficult to predict 30 years in advance if the replacement plant will be more or less expensive (in today’s dollars) than the initial plant. Because of the uncertainty about future inflation and because the present value of the future replacement plants is relatively small, basing capacity values on the initial thermal plant’s service life is considered to be reasonable (USACE 1985). Therefore, the capacity values shown on Figure 5-3 were assumed to remain constant over the 50-year economic life.
To be allocated economic benefits, the capacity should be dependable capacity. While procedures for determining dependable capacity can vary by region, dependable capacity essentially means that the capacity will be available with a high reliability when needed, at least for short periods of time. Because most of
5-7 FINAL – October 2010

Hydropower Modernization Initiative Assessment of Potential Capacity Increases at Existing Hydropower Plants
5-8 FINAL – October 2010
the Reclamation plants have storage reservoirs associated with them, it has been assumed in this planning-level study that the capacity would be available on demand. To the extent that site specific operating limitations restrict the ability to use the additional capacity when needed, the capacity benefits could be reduced. More detailed future feasibility studies could refine the estimate of dependable capacity.

Chapter 6 Capacity Addition Cost Estimates
Chapter 6 Capacity Addition Cost Estimates
A cost estimating methodology was needed that would be applicable to potential capacity additions at all 58 existing hydropower sites and which could be developed quickly for five capacity additions at each plant. The Idaho National Engineering and Environmental Laboratory (INEEL) has developed such a methodology under contract to the U.S. Department of Energy (INEEL 2003). A collection of sources of historical hydroelectric plant data was used by INEEL to create cost estimating equations. Costs are not based on site specific conditions at the individual plants, which would be the subject of future studies.
Because it was determined that the various costs correlated with plant capacity, cost estimating equations were developed as a function of installed capacity. The cost estimating equations developed for existing dams with existing hydropower plants were used in this study. These cost estimating equations were also used in a more recent study of potential hydroelectric development at existing Federal facilities (U.S. Department of the Interior, et al, 2007) that is commonly known as the 1834 Study.
The following are the formulas for each cost category, where MW is the additional installed capacity in megawatts (expressed in 2002 dollars):
• Construction cost = 1,400,000*MW0.81
• Fish and wildlife mitigation cost = 83,000*MW0.96
• Recreation mitigation cost = 63,000*MW0.97
• Historical and archaeological mitigation cost = 63,000*MW0.72
• Water quality monitoring cost = 70,000*MW0.44
• Fixed annual O&M = 24,000*MW0.75
• Variable annual O&M = 24,000*MW0.80
It is noted that in the 1834 Study, the coefficient for the annual O&M costs is apparently incorrectly shown as 240,000.
Construction costs were adjusted from 2002 dollars to the anticipated online date using the Reclamation construction cost index for powerplants up to 2010 (Reclamation 2010) and the U.S. Army Corps of Engineers civil works construction cost index system (USACE 2010) from 2010 to the assumed online date in 2015. Mitigation costs were escalated to 2015 using the general annual inflation rate of 1.8%. Operation and maintenance costs were escalated at 2.3% per year.
6-1 FINAL – October 2010

Hydropower Modernization Initiative Assessment of Potential Capacity Increases at Existing Hydropower Plants
6-2 FINAL – October 2010
$0
$200
$400
$600
$800
$1,000
$1,200
$1,400
$1,600
$1,800
$0
$10
$20
$30
$40
$50
$60
$70
$80
$90
0 10 20 30 40 50 60 70 80 90 100
Dol
lars
per
Inst
alle
d K
W
Mill
ions
of D
olla
rs
MW of Capacity Addition
Construction Costs
Mitigation Costs
Capacity $/KW
Figure 6-1 provides a graphical summary of the construction and mitigation costs for capacity additions up to 100 MW. Construction and mitigation costs were totaled to form an initial development cost, which was then divided by the installed capacity to form the commonly used index of initial capacity cost in dollars per kilowatt. As shown on Figure 6-1, 10 MW of capacity addition costs about $1,550/kW, while the cost of 100 MW of capacity addition would be reduced to about $1,040/kW.
Figure 6-1. Construction, Mitigation, and Capacity Costs as a Function of Added MW

Chapter 7 Environmental and Climate Change Benefits
Chapter 7 Environmental and Climate Change Benefits
This chapter provides quantitative and qualitative information related to the environmental and climate change benefits of hydroelectric capacity additions. Environmental and climate change benefits from hydroelectric plants primarily result from the replacement (offset) of fossil fuel generation and its associated GHG emissions, with emission-free hydroelectric generation. Additional environmental benefits can be associated with turbine and runner replacement, which can result in uprating or capacity addition at a hydroelectric plant. In addition to GHG offsets, potential environmental benefits from capacity addition or turbine replacement projects include:
• Offsets of criteria pollutant emissions and other air toxics emissions.
• Elimination of grease contamination to the river by installing greaseless wicket gate bushings when the turbine runners are replaced.
• Improve water quality by increasing dissolved oxygen (DO) levels with the installation of aerating-type turbine runners.
Though environmental benefits have intrinsic value, monetary valuation of these benefits is complicated and currently there is no established, stable, generally accepted market value. In contrast, the quantification of GHG reductions has well established procedures and is therefore used in this project to demonstrate and rank environmental benefits.
Hydropower and Greenhouse Gasses
In the United States (U.S.), carbon dioxide accounts for 85 percent (%) of GHG emissions, with about 34% of the carbon dioxide emissions originating from electricity generation, which is more than from any other single source. Energy-related GHG emissions, mainly from fossil fuel combustion are projected to rise by over 50% by 2030 (IPCC 2007b). This makes reductions of GHG from electricity generation an imperative.
In 2004, hydroelectric systems provided 16% of global electricity and 90% of global renewable energy (IPCC 2007b). In the United States, hydropower accounted for nearly 9% of the U.S. total electric generating capacity (EPRI 2007) and about 7% of the annual electric energy output (EIA 2008). Existing conventional hydropower generation represents 75% of the U.S. renewable energy generation, averaging about 270,000 GWh per year (EPRI 2007). In the United States in 2006, hydropower capacity was about 96,000 MW, split between about 75,000 MW of conventional capacity and 21,000 MW of
7-1 FINAL – October 2010

Hydropower Modernization Initiative Assessment of Potential Capacity Increases at Existing Hydropower Plants
pumped storage capacity. The 75,000 MW of conventional hydropower capacity was split almost equally between federal projects (~37,500 MW) and non-federal projects that are subject to FERC jurisdiction over licensing and regulatory structure (Hall and Reeves 2006). This means that federal hydropower projects provide a significant opportunity for GHG reductions.
Between 1980 and 2006, average annual hydroelectric energy generation in the United States remained almost constant, while thermal electric energy generation increased by about 70% (EIA 2008). Therefore, with consideration given to GHG offsets available from green hydropower production, incremental hydropower generation increases should be implemented when justified, and existing hydropower capacity should be maintained and rehabilitated as needed.
Opportunities for Climate Change Benefits
GHG reductions that will result from hydroelectric capacity additions or investments are accounted for in three different ways in this study:
• Capacity additions result in increased hydroelectric energy output by increasing the hydraulic capacity of the turbines and generating with flow that would be otherwise spilled and not flow through a turbine.
• Turbine runner replacement will result in improvement of the runner condition (elimination of deterioration and surface irregularities) that improves efficiency and increases energy generation. Turbine runner replacement may also result in a modern runner shape that is inherently more efficient (1.5%) than the older runner was in new condition.
• Planned turbine replacements will reduce the risk of longer unplanned outage durations and therefore result in reduced generation losses. Depending on the system or type of equipment, outage durations can vary significantly. A one year incremental outage of one unit at each plant was used as an index value to account for the reduced generation losses and GHG offsets that could potentially result from planned turbine replacements.
GHG Reduction Quantification
Environmental benefits in the form of GHG emission reductions will be achieved though incremental energy increases due to improved efficiency, increased hydraulic capacity, and reduced outages. Hydropower generation increases resulting from these equipment improvements were determined for each plant on an annual average basis. The annual average incremental generation increase at the plant was used to calculate annual average GHG reductions.
7-2 FINAL – October 2010

Chapter 7 Environmental and Climate Change Benefits
7-3 FINAL – October 2010
Carbon Dioxide
(CO2)
Methane
(CH4)
Nitrous Oxide
(N2O)
PCC Second Assesment eport Values 1 21 310
Greenhouse Gas
GHG reductions are quantified in terms of metric tons of carbon dioxide (CO2) or carbon dioxide equivalents (CO2e). In this evaluation of hydropower capacity addition projects, CO2e incorporates the global warming potential of methane (CH4) and nitrous oxide (N2O), the other two primary GHG emissions that result from burning fossil fuels. Table 7-1 shows the relative 100-year global warming potential values (per lb CO2) for CO2, CH4 and N2O that are based on the Intergovernmental Panel on Climate Change’s Second Assessment Report (IPCC, 2007a).
IR
Table 7-1. 100-Year Global Warming Potential Values
GHG reductions were estimated using GHG emission rates based on the regional electricity generation resource mix and the 100-year global warming potential values for CO2, CH4 and N2O to determine the total CO2e offsets. The values were taken from the U.S. Environmental Protection Agency’s (USEPA) Office of Atmospheric Programs’ eGRID2007 (Version 1.1) database (USEPA 2008). eGrid (Emissions & Generation Resource Integrated Database) is an inventory of environmental attributes of electric power systems in the U.S., and was compiled based on information from USEPA, the Energy Information Administration, FERC, and the North American Electric Reliability Corporation (NERC) (USEPA, 2008). The regional GHG emission rates for each plant were determined based on the eGrid subregion, shown in Figure 7-1.

Hydropower Modernization Initiative Assessment of Potential Capacity Increases at Existing Hydropower Plants
7-4 FINAL – October 2010
Carbon dioxide (lb/MWh)
Methane (lb/MWh)
Nitrous oxide (lb/MWh)
Carbon dioxide (lb/MWh)
Methane (lb/MWh)
Nitrous oxide (lb/MWh)
AZNM WECC Southwest 1311.05 0.0175 0.0179 1201.44 0.0208 0.0085CAMX WECC California 724.12 0.0302 0.0081 1083.02 0.0392 0.0056NWPP WECC Northwest 902.24 0.0191 0.0149 1333.64 0.0493 0.0187RMPA WECC Rockies 1883.08 0.0229 0.028
Figure 7-1. eGrid Subregions
Annual GHG output emission rates, based on the existing generation mix in each geographic area, are shown on Table 7-2 in pounds per megawatt-hour (lb/MWh) for CO2, CH4 and N2O, for the regions encompassing the locations of the 58 plants. The annual output emission rates are used to calculate GHG reductions from baseload, or off-peak, generation, and the non-baseload emission rates are used to calculate GHG reductions from non-baseload, or on-peak, generation.
8 1617.71 0.0224 0.0201
Annual output emission rates Annual non‐baseload output emission rates eGRID subregionacronym
eGRID Subregion Name
Table 7-2. Year 2005 GHG Annual Output Emission Rates
GHG reductions are quantified in terms of metric tons of CO2e offset. The GHG offsets are based on the megawatt-hours of incremental generation that result from hydroelectric capacity increases, efficiency increases, or reduced outages. Efficiency increases from turbine runner replacement were based on

Chapter 7 Environmental and Climate Change Benefits
7-5 FINAL – October 2010
the expected degradation of the turbine runners as a function of age plus increase due to modern design if the runners were older than 15 years. Because outage durations vary depending on the system or equipment affected, GHG offsets from outages are given as an index value based on an assumed one year incremental outage of one unit at each plant.
Greenhouse Gas Equivalents
The quantification of GHG offsets in metric tons of a gas and carbon dioxide equivalents are new terms for most people. Another way GHG reductions can be presented is in terms of CO2e equivalents, which describe these abstract concepts in everyday terms. While it may be difficult to picture how much a metric ton of gas is, it is easier to understand that one metric ton of CO2e is equivalent to the CO2 emissions from consuming 114 gallons of gasoline (USEPA 2009). In comparison to generation from fossil fuel sources, 100,000 MWh of hydropower generation would offset:
• 71,816 metric tons of carbon dioxide equivalent (CO2e)
• 13,732 passenger vehicles taken off the road/year
• 8,078,332 gallons of gasoline consumed
• 167,015 barrels of oil consumed
• 8,716 homes electricity use for 1 year
• 6,112 homes total energy use for 1 year
• 0.02 coal fired power plant for 1 year

This page left blank intentionally.

Chapter 8 Plant Data Ratings
Chapter 8 Plant Data Ratings
As requested by Reclamation, a plant data rating was developed to provide a measure of the quality and completeness of the data input to the energy model. Data quality ratings were input and displayed in the energy model, but were not used to modify the results. Ratings are unrelated to plant condition or operation.
Input data was given a score on a four point scale based on the descriptions provided below:
Rating 1 – The data was essentially complete with no significant omissions. Daily total outflow and head data, in the form of daily headwater elevations and daily tailwater elevations or a tailwater rating curve, were provided for at least 10 years. Where some parameter data was missing, relatively reliable fallback data sources were provided by Reclamation. Actual generation, either daily or monthly, was provided for the same period as the flow data.
Rating 2 – The data was mostly complete with some significant omissions. Significant omissions include data sets for plants with less than 10 years of daily total outflow and head data; at a low head plants, data sets that included daily reservoir elevations without a tailwater rating curve, and either a constant tailwater or an estimated tailwater rating curve had to be used; data sets that did not include required releases that are unavailable for generation increases, etc. Some actual generation, either daily or monthly, was provided.
Rating 3 – The data had major shortcomings. Major shortcomings include data sets for plants that had only monthly total outflow and head data; plants that only provided generation outflow; plants with less than 5 years of daily total outflow and head data, etc. Several parameters may have been missing for which no reliable fallback data sources were available. No generation data were provided.
Rating 4 – The data was insufficient to perform the energy model analysis. An example would be a plant where no flow data or no head data of any type was provided by Reclamation.
Table 8-1 provides a summary of the plant data ratings.
8-1 FINAL – October 2010

Hydropower Modernization Initiative Assessment of Potential Capacity Increases at Existing Hydropower Plants
8-2 FINAL – October 2010
1 2 3 4Great Plains 8 5 8 0
Lower Colorado 3 0 0 0Mid-Pacific 9 1 1 0
Pacific Northwest 5 2 3 0Upper Colorado 0 8 4 0
Total Plants 25 16 16 0
Region Number of Plants with each Rating
Table 8-1. Plant Data Ratings Summary
Table 8-2 provides the data ratings for the individual plants.

Chapter 8 Plant Data Ratings
8-3 FINAL – October 2010
Plant Region Data Quality Rating
Alcova Great Plains 1Anderson Ranch Pacific Northwest 1Big Thompson Great Plains 2Black Canyon Pacific Northwest 1
Blue Mesa Upper Colorado 2Boise Diversion Pacific Northwest 3
Boysen Great Plains 1Buffalo Bill Great Plains 3
Canyon Ferry Great Plains 1Chandler Pacific Northwest 3Crystal Upper Colorado 2Davis Lower Colorado 1
Deer Creek Upper Colorado 2Elephant Butte Upper Colorado 3
Estes Great Plains 3Flaming Gorge Upper Colorado 2
Flatiron Great Plains 3Folsom Mid-Pacific 1
Fontenelle Upper Colorado 2Fremont Canyon Great Plains 3
Glen Canyon Upper Colorado 2Glendo Great Plains 1
Grand Coulee Pacific Northwest 1Green Mountain Great Plains 2Green Springs Pacific Northwest 2
Guernsey Great Plains 1Heart Mountain Great Plains 3
Hoover Lower Colorado 1Hungry Horse Pacific Northwest 2
Judge Francis Carr Mid-Pacific 3Keswick Mid-Pacific 1Kortes Great Plains 1
Lower Molina Upper Colorado 3Marys Lake Great Plains 2
McPhee Upper Colorado 2Minidoka Pacific Northwest 1
Morrow Point Upper Colorado 2Mount Elbert Great Plains 3New Melones Mid-Pacific 1
Nimbus Mid-Pacific 1O'Neill Mid-Pacific 1
Palisades Pacific Northwest 1Parker Lower Colorado 1
Pilot Butte Great Plains 2Pole Hill Great Plains 2
Roza Pacific Northwest 3San Luis Mid-Pacific 1Seminoe Great Plains 1Shasta Mid-Pacific 1
Shoshone Great Plains 3Spirit Mountain Great Plains 3Spring Creek Mid-Pacific 1
Stampede Mid-Pacific 2Towaoc Upper Colorado 3Trinity Mid-Pacific 1
Upper Molina Upper Colorado 3Yellowtail Great Plains 1
Table 8-2. Individual Plant Data Ratings

This page left blank intentionally.

Chapter 9 Summary of Results
Chapter 9 Summary of Results
The results from the energy model include the economic calculations, the incremental generation from the existing units due to capacity increases or efficiency gains, and the avoided generation loss from outages. These results are used to determine the GHG offsets. The results for the capacity addition opportunities, additional generation and GHG offsets are shown by region for each of the plants and the top potential capacity increase opportunities are discussed in this chapter.
Capacity Additions
A brief review of the steps in the determination of capacity addition results is summarized as follows:
• Based on the plant nameplate capacity, determine the 10%, 20%, 30%, 40%, and 50% capacity additions in MW
• From the capacity additions in MW, determine the corresponding hydraulic capacity increases in cubic feet per second (cfs)
• For each of the hydraulic capacity increases, determine the incremental energy with PLEESM (Chapter 3 of this report)
• Determine the energy benefits from the energy values ($/MWh) as presented in Chapter 5 and the average monthly incremental energy (MWh)
• From the incremental energy increases, determine the capacity factor
• Determine the incremental capacity value ($/kW-yr) from the capacity factor and Figure 5-5
• Determine the capacity benefits from the incremental capacity value ($/kW-yr)and the capacity additions (kW)
• Develop the total costs as presented in Chapter 6 of this report
• Using the economic parameters and methodology presented in Chapter 4, determine the present values of the total costs and the total benefits (energy plus capacity)
• Determine the NPV, which is the present value of benefits minus present value of costs; and the BCR, which is the present value of benefits minus the present value of costs.
9-1 FINAL – October 2010

Hydropower Modernization Initiative Assessment of Potential Capacity Increases at Existing Hydropower Plants
• From the five capacity addition increments, select the capacity addition with the maximum BCR and the one with the maximum NPV, which can result in the selection of two different capacity increments.
It must be emphasized that selecting a capacity addition with the maximum NPV or BCR is not necessarily an indication of economic viability. Only capacity additions with benefit to cost ratios greater than 1.00 and positive net present values provide indications of economic feasibility.
For plants that have zero or negligible incremental energy associated with the capacity additions, the BCR values will maximize at the largest (50%) capacity addition because the cost per installed kilowatt decreases with size (Fig. 6-1) and the capacity benefit per installed kilowatt is constant when the capacity factor is zero (Fig. 5-5). For example, Grand Coulee has its maximum BCR of 0.27 at the 50% capacity increase of 3,247.5 MW, which should not be interpreted to mean that the recommended capacity addition is over 3,000 MW. The bottom line message for Grand Coulee (and other plants with similar results) would be that no capacity addition shows economic feasibility based on the methodologies employed in this report.
The capacity addition results are shown by region in Tables 9-1 through 9-5 for each of the five Reclamation regions and are summarized below. The plants are ranked in each region based on the maximum BCR from the five capacity addition increments included in the analysis. For each plant, the existing installed capacity, maximum BCR and NPV, the capacity increase increment associated with the maximum BCR and NPV are shown in the table. The capacity increase and the incremental capacity factor associated with the maximum BCR are also shown.
Mid-Pacific Region Of the 11 plants in the Mid-Pacific region, the only plant with have both BCRs equal to or greater than one and positive NPVs is Nimbus (Table 9-1). The maximum BCR for Nimbus of 1.39 occurs at a capacity increase of 20% over the existing installed capacity, which corresponds to a 2.7 MW capacity increase. The incremental capacity factor for a 2.7 MW capacity increase at Nimbus is 26% indicating that the potential incremental generation is about a quarter of the generation that could be obtained if the additional capacity was run continuously at full output. Since the remaining plants in the Mid-Pacific region have BCRs less than 1.0 and negative NPVs, capacity additions at these plants would not be economically beneficial.
A Lease of Power Privilege Agreement for the Lewiston Hydroelectric Project (Agreement) was signed in June 2009 between Reclamation and the Trinity Public Utilities District (TPUD). The Agreement calls for complete replacement of the existing 350 kW hydroelectric unit with a new unit capable of generating up to 2,000 kW. The TPUD generation share from the new unit would be all generation in excess of that for the 350 kW unit if it operated at a
9-2 FINAL – October 2010

Chapter 9 Summary of Results
90.1% capacity factor. Because the Lewiston capacity addition will be (or has been) determined by TPUD within the limits of the Agreement, it would not be productive to include Lewiston in the current studies. Therefore, no results are presented for Lewiston.
Rank 1 Plant
(MW) (MW) (MWh/yr) ($M)1 Nimbus 13.5 20% 50% 2.7 6,104 26% 1.39 $5.82 Folsom 207 30% 20% 62 32,607 6.0% 0.97 -$2.33 Shasta 714 30% 10% 214 73,426 3.9% 0.86 -$23.84 Stampede 3.65 30% 10% 1.1 1,669 17% 0.85 -$0.35 Keswick 117 40% 10% 47 26,278 6.4% 0.66 -$10.16 Trinity 140 20% 10% 28 17,625 7.2% 0.57 -$13.77 Judge Francis Carr 154 10% 10% 15 4,476 3.3% 0.45 -$17.08 Spring Creek 180 20% 10% 36 12,180 3.9% 0.21 -$28.09 San Luis 3 424 50% 10% 212 5,289 0.3% 0.16 -$61.7
10 New Melones 382 50% 10% 191 7,830 0.5% 0.16 -$56.911 O'Neill 25 10% 10% 2.5 251 1.1% 0.12 -$6.5
Notes1 Plants are ranked based on the capacity addition increment with the highest BCR for each plant .2 Incremental generation shown is for the capacity addition with the highest BCR.3 Installed capacity of 424 MW for San Luis includes the Federal and CA shares. The Federal share is 202 MW.BCR - Benefit to Cost RatioNPV - Net Present Value
Maximum BCR
Maximum NPV
Existing Installed Capacity
Incremental Generation from
Capacity Addition 2
Maximum BCR
Percent Increase
Capacity Increase
Incremental Capacity Factor
Maximum NPV
Percent Increase
Table 9-1. Capacity Addition Results - Mid-Pacific Region
Upper Colorado Region Of the 12 plants in the Upper Colorado region, two plants, Deer Creek and Crystal, both have BCRs equal to or greater than one and positive NPVs (Table 9-2). The maximum BCR for Deer Creek of 1.04 occurs at a capacity increase of 10% over the existing installed capacity, which corresponds to a 495 kW capacity increase. The incremental capacity factor for the 495 kW capacity increase at Deer Creek is 24%. The maximum BCR for Crystal of 1.00 occurs at a capacity increase of 30% over the existing installed capacity which corresponds to a 9.5 MW capacity increase. The incremental capacity factor for the 9.5 MW capacity increase at Crystal is 13%. The remaining plants in the Upper Colorado region have BCRs less than or equal to one and negative NPVs, or no NPV in the case of McPhee; thus, capacity additions at these plants would not be economically beneficial.
9-3 FINAL – October 2010

Hydropower Modernization Initiative Assessment of Potential Capacity Increases at Existing Hydropower Plants
Table 9-2. Capacity Addition Results - Upper Colorado Region
Rank 1 Plant
(MW) (MW) (MWh/yr) ($M)1 Deer Creek 5.0 10% 20% 0.5 1,023 24% 1.04 $0.12 Crystal 32 30% 30% 9.5 10,950 13% 1.00 $0.13 McPhee 1.3 10% 10% 0.1 413 37% 1.00 $0.04 Fontenelle 10 50% 10% 5.0 4,774 11% 0.57 -$1.95 Glen Canyon 1,320 30% 10% 396 71,082 2.0% 0.51 -$1036 Towaoc 11 10% 10% 1.1 1,120 11% 0.41 -$2.37 Flaming Gorge 152 50% 10% 76 13,495 2.0% 0.35 -$20.28 Blue Mesa 86 40% 10% 35 3,219 1.1% 0.23 -$15.49 Morrow Point 173 50% 10% 87 10,279 1.4% 0.20 -$28.4
10 Elephant Butte 28 10% 10% 2.8 357 1.5% 0.15 -$6.811 Lower Molina 4.9 50% 10% 2.4 133 0.6% 0.10 -$1.812 Upper Molina 8.6 50% 10% 4.3 8 0% 0.08 -$3.0
Notes1 Plants are ranked based on the capacity addition increment with the highest BCR for each plant .2 Incremental generation shown is for the capacity addition with the highest BCR.BCR - Benefit to Cost RatioNPV - Net Present Value
Existing Installed Capacity
Maximum BCR
Percent Increase
Maximum NPV
Percent Increase
Capacity Increase
Incremental Generation from
Capacity Addition 2
Incremental Capacity Factor
Maximum BCR
Maximum NPV
Great Plains Region Of the 21 plants in the Great Plains region, three plants, Shoshone, Canyon Ferry, and Guernsey, have both BCRs equal to or greater than one and positive NPVs (Table 9-3). The maximum BCR for Shoshone of 3.50 occurs at a capacity increase of 50% over the existing installed capacity, which corresponds to a 1.5 MW capacity increase. The incremental capacity factor for the 1.5 MW capacity increase at Shoshone is 94%. However, the simulated generation for Shoshone was in the range of 20 - 25% higher than the actual recorded generation, which indicates a moderate degree of uncertainty in the results for this plant.
The maximum BCR for Canyon Ferry of 1.53 occurs at a capacity increase of 10% over the existing installed capacity which corresponds to a 5.0 MW capacity increase and an incremental capacity factor of 40%. The maximum BCR for Guernsey of 1.52 occurs at a capacity increase of 50% over the existing installed capacity which corresponds to a 3.2 MW capacity increase and an incremental capacity factor at Guernsey of 32%. The remaining plants in the Great Plains region have BCRs less than one and negative NPVs; thus, capacity additions at these plants would not be economically beneficial.
9-4 FINAL – October 2010

Chapter 9 Summary of Results
Rank 1 Plant
(MW) (MW) (MWh/yr) ($M)1 Shoshone 3.0 50% 50% 1.5 12,347 94% 3.50 $12.22 Canyon Ferry 50 10% 40% 5.0 17,576 40% 1.53 $13.43 Guernsey 6.4 50% 50% 3.2 8,887 32% 1.52 $4.64 Pilot Butte 1.6 50% 50% 0.8 1,800 26% 0.96 -$0.15 Buffalo Bill 18 10% 10% 1.8 3,985 25% 0.81 -$1.16 Glendo 38 20% 10% 7.6 8,726 13% 0.73 -$2.87 Fremont Canyon 67 10% 10% 6.7 9,238 16% 0.62 -$6.08 Boysen 15 40% 10% 6.0 5,322 10% 0.56 -$2.29 Kortes 36 50% 10% 18 4,594 2.9% 0.33 -$6.9
10 Big Thompson 4.5 10% 10% 0.5 494 13% 0.30 -$1.311 Alcova 41 20% 10% 8.3 2,003 2.8% 0.27 -$8.012 Seminoe 52 30% 10% 16 5,592 4.1% 0.27 -$9.913 Yellowtail 250 30% 10% 75 8,526 1.3% 0.27 -$34.814 Green Mountain 26 50% 10% 13 2,065 1.8% 0.23 -$6.015 Mount Elbert 200 50% 10% 100 3,965 0.5% 0.14 -$34.416 Flatiron 3 94.5 50% 10% 41 4,153 1.2% 0.12 -$17.017 Estes 45 50% 10% 23 1,854 0.9% 0.11 -$10.718 Pole Hill 38 50% 10% 19 3,173 1.9% 0.10 -$9.519 Heart Mountain 5.0 50% 10% 2.5 481 2.2% 0.09 -$1.920 Marys Lake 8.1 50% 10% 4.1 687 1.9% 0.08 -$2.821 Spirit Mountain 4.5 50% 10% 2.3 220 1.1% 0.07 -$1.8
Notes1 Plants are ranked based on the capacity addition increment with the highest BCR for each plant .2 Incremental generation shown is for the capacity addition with the highest BCR.3 Installed capacity at Flatiron is 94.5 MW. Only Units 1 and 2 (81.3 MW) were included in the modeling.BCR - Benefit to Cost RatioNPV - Net Present Value
Existing Installed Capacity
Maximum BCR
Percent Increase
Maximum NPV
Percent Increase
Capacity Increase
Incremental Generation from
Capacity Addition 2
Incremental Capacity Factor
Maximum BCR
Maximum NPV
Table 9-3. Capacity Addition Results - Great Plains Region
Pacific Northwest Region Of the ten plants in the Pacific Northwest region, four plants, Black Canyon, Boise Diversion, Palisades, and Minidoka, have both BCRs equal to or greater than one and positive NPVs (Table 9-4). The maximum BCR for Black Canyon of 2.52 occurs at a capacity increase of 50% over the existing installed capacity, which corresponds to a 5.1 MW capacity increase and an incremental capacity factor of 43%. The maximum BCR for Boise Diversion of 2.48 occurs at a capacity increase of 40% over the existing installed capacity, which corresponds to a 1.4 MW capacity increase and an incremental capacity factor at Boise Diversion of 52%. The simulated generation for Boise Diversion was in the range of 20 - 25% higher than the actual recorded generation, which indicates a moderate degree of uncertainty in the results for this plant.
The maximum BCR for Palisades of 2.28 occurs at a capacity increase of 20% over the existing installed capacity which corresponds to a 35 MW capacity increase. The incremental capacity factor for the 35 MW capacity increase at Palisades is 24%. The maximum BCR for Minidoka of 1.21 occurs at a capacity increase of 10% over the existing installed capacity which corresponds to a 2.8 MW capacity increase. The incremental capacity factor for the 2.8 MW capacity increase at Minidoka is 13%. The remaining plants in the Pacific Northwest region have BCRs less than one and negative NPVs; thus, capacity additions at these plants would not be economically beneficial.
9-5 FINAL – October 2010

Hydropower Modernization Initiative Assessment of Potential Capacity Increases at Existing Hydropower Plants
Table 9-4. Capacity Addition Results - Pacific Northwest Region
Rank 1 Plant
(MW) (MW) (MWh/yr) ($M)1 Black Canyon 10 50% 50% 5.1 19,026 43% 2.52 $19.62 Boise Diversion 3.5 40% 50% 1.4 6,231 52% 2.48 $7.83 Palisades 177 20% 50% 35 72,778 24% 2.28 $1234 Minidoka 28 10% 20% 2.8 3,098 13% 1.21 $2.65 Anderson Ranch 40 50% 10% 20 19,805 11% 0.91 -$3.26 Chandler 12 10% 10% 1.2 594 5.6% 0.32 -$2.87 Grand Coulee 6,495 50% 10% 3,248 141 0.0% 0.27 -$5108 Hungry Horse 428 50% 10% 214 19,275 1.0% 0.19 -$59.99 Green Springs 17 50% 10% 8.6 0.0 0.0% 0.09 -$5.1
10 Roza 13 50% 10% 6.5 1,062 1.9% 0.08 -$4.1Notes1 Plants are ranked based on the capacity addition increment with the highest BCR for each plant .2 Incremental generation shown is for the capacity addition with the highest BCR.BCR - Benefit to Cost RatioNPV - Net Present Value
Existing Installed Capacity
Maximum BCR
Percent Increase
Maximum NPV
Percent Increase
Capacity Increase
Incremental Generation from
Capacity Addition 2
Incremental Capacity Factor
Maximum BCR
Maximum NPV
Lower Colorado Region None of the plants in the Lower Colorado regionhave both BCRs equal to or greater than one and positive NPVs (Table 9-5). Therefore, capacity additions at the plants in the Lower Colorado region would not be economically beneficial.
Rank 1 Plant
(MW) (MW) (MWh/yr) ($M)1 Davis 255 10% 10% 26 15,784 7.1% 0.76 -$11.13 Parker 120 20% 10% 24 15,049 7.2% 0.76 -$7.12 Hoover 2,079 50% 10% 1,039 0 0% 0.22 -$212
Notes1 Plants are ranked based on the capacity addition increment with the highest BCR for each plant .2 Incremental generation shown is for the capacity addition with the highest BCR.BCR - Benefit to Co RatioNPV - Net Present lue
Existing Installed Capacity
Maximum BCR
Percent Increase
Maximum NPV
Percent Increase
Capacity Increase
Incremental Generation from
Capacity Addition 2
Incremental Capacity Factor
Maximum BCR
Maximum NPV
Table 9-5. Capacity Addition Results - Lower Colorado Region
st Va
Summary of Capacity Addition Results Of the 58 plants included in the assessment, ten plants have both BCRs equal to or greater than one and positive NPVs. These ten opportunities for capacity additions based on BCRs are summarized in Table 9-6. Three of these plants are located in the Great Plains region, four plants are located in the Pacific Northwest region, two plants are located in the Upper Colorado region, and one plant is located in the Mid-Pacific region. The plant with the highest BCR of 3.50 is Shoshone in the Great Plains region. Shoshone also has the highest incremental capacity factor of 94%. The plant with the largest potential
9-6 FINAL – October 2010

Chapter 9 Summary of Results
9-7 FINAL – October 2010
Rank 1 Plant Region
capacity increase of 35 MW is Palisades in the Pacific Northwest region which ranked fourth overall based on BCR.
(MW) (MW) (MWh/yr) ($M)1 Shoshone Great Plains 3.0 50% 50% 1.5 12,347 94% 3.50 $12.22 Black Canyon Pacific Northwest 10 50% 50% 5.1 19,026 43% 2.52 $19.63 Boise Diversion Pacific Northwest 3.5 40% 50% 1.4 6,231 52% 2.48 $7.84 Palisades Pacific Northwest 177 20% 50% 35 72,778 24% 2.28 $1235 Canyon Ferry Great Plains 50 10% 40% 5.0 17,576 40% 1.53 $13.46 Guernsey Great Plains 6.4 50% 50% 3.2 8,887 32% 1.52 $4.67 Nimbus Mid-Pacific 13.5 20% 50% 2.7 6,104 26% 1.39 $5.88 Minidoka Pacific Northwest 28 10% 20% 2.8 3,098 13% 1.21 $2.69 Deer Creek Upper Colorado 5.0 10% 20% 0.5 1,023 24% 1.04 $0.110 Crystal Upper Colorado 31.5 30% 30% 9.5 10,950 13% 1.00 $0.1
Notes1 Plants are ranked based on the capacity addition increment with the highest BCR for each plant .2 Incremental generation shown is for the capacity addition with the highest BCR.BCR - Benefit to Cost RatioNPV - Net Present Value
Existing Installed Capacity
Maximum BCR
Percent Increase
Maximum NPV
Percent Increase
Maximum BCR Capacity
Increase
Incremental Generation
from Capacity Addition 2
Incremental Capacity Factor
Maximum BCR
Maximum NPV
Table 9-6. Summary - Capacity Addition Opportunities Ranked by BCR
Rank
(MW) (MW) (MWh/yr)
1 Plant Region
($M)1 Palisades Pacific Northwest 177 20% 50% 88 129,245 17% 2.28 $1232 Black Canyon Pacific Northwest 10 50% 50% 5.1 19,026 43% 2.52 $19.63 Canyon Ferry Great Plains 50 10% 40% 20 35,538 20% 1.53 $13.44 Shoshone Great Plains 3.0 50% 50% 1.5 12,347 94% 3.50 $12.25 Boise Diversion Pacific Northwest 3.5 40% 50% 1.7 7,234 48% 2.48 $7.86 Nimbus Mid-Pacific 14 20% 50% 6.8 11,041 19% 1.39 $5.87 Guernsey Great Plains 6.4 50% 50% 3.2 8,887 32% 1.52 $4.68 Minidoka Pacific Northwest 27.7 10% 20% 5.5 6,595 14% 1.21 $2.69 Deer Creek Upper Colorado 5.0 10% 20% 1.0 1,816 21% 1.04 $0.1
10 Crystal Upper Colorado 32 30% 30% 9.5 10,950 13% 1.00 $0.1Notes1 Plants are ranked based on the capacity addition increment with the highest NPV for each plant .2 Incremental generation shown is for the capacity addition with the highest BCR.BCR - Benefit to Cost RatioNPV - Net Present Value
Existing Installed
Maximum BCR
Percent
Maximum NPV
Percent
Maximum NPV Capacity
Incremental Generation
from Capacity
Incremental Capacity
actor
Maximum BCR
Maximum NPVCapacity Increase Increase Increase
Addition 2F
The opportunities for capacity additions based on NPV are shown in Table 9-7. The same ten plants that represented the top opportunities for capacity additions based on BCR are the plants with the top opportunities for capacity additions
r 1.5
Table 9-7. S ed by NPV
based on NPV, but with a shift in the ranking order. Palisades has the highest NPV for a capacity addition of $123 million which corresponds to a 50% increase over the existing installed capacity and an actual increase of 88 MW. However, the incremental capacity factor for the 88 MW capacity increase at Palisades is only 17%. At an 88 MW capacity increase, Palisades has the largest capacity increase potential of all the plants with a positive NPV. The plant with the highest incremental capacity factor based on NPV of 94% is Shoshone with a capacity increase 50% greater than its existing capacity, oMW, which is unchanged from the BCR rankings.
ummary - Capacity Addition Opportunities Rank

Hydropower Modernization Initiative Assessment of Potential Capacity Increases at Existing Hydropower Plants
Efficiency Gains
al generation from efficiency improvements can be gained in two ese are by rehabilitating the turbine to improve its condition such that
a
r he
han about 2%, it is an indication that f at
efficiency gains
ranked in each region based on the maximum BCR from the five capacity
was om
Mid-Pacific Rest potential incremental generation increase from
efficiency improvements in the Mid-Pacific region is Spring Creek with a gain of 36,681 MWh/yr (Table 9-8). The additional generation at Spring Creek corresponds to a 6.2% increase over its existing annual generation. The plants
Additionways. Thit operates similar to a new turbine of the original vintage in its original condition, or by replacing an older turbine runner and appurtenant parts with new components of modern design. The incremental generation from efficiencyimprovements shown in the results tables is the potential additional generation based on both the generation gain from the efficiency deterioration of the existing turbine due to its age and the generation gain from replacing the existing turbine with a new, modern turbine design. Turbines that have been replaced within the past 15 years were assumed to have been replaced withmodern design at that time and thus would not achieve the 1.5% efficiency increase. The age of the turbine was used to determine the efficiency deterioration up to a maximum of 5%, but this particular study did not considethe actual condition of the turbine in estimating performance degradation. Tcondition will be incorporated in the upcoming Asset Investment Planning (AIP) program and the potential additional generation from turbine upgrades will be refined in the AIP tool.
Where results in the tables show incremental generation increases from efficiency improvements of less timprovements have been made in recent years. Where efficiency gains oleast 3% can be made, this represents a potential opportunity.
Costs and economic benefits were not assigned to the efficiency gains in this study. A cost/benefit analysis was not performed for potentialbecause this more detailed level of analysis is performed in the AIP program. .
The efficiency gain results are shown by region in Tables 9-8 through 9-12 for each of the five Reclamation regions and summarized below. The plants are
addition increments included in the analysis. For each plant, the existing installed capacity, the average annual existing generation from the energy model simulation and the potential incremental are shown in the table. The generation percent increase over the simulated average annual existing generation is also shown. The energy model simulated existing generationused because it provides a more uniform long-term average for generation frthe current existing installed capacity among the 58 plants than recorded generation, which has been subject shifts from upgrades at various points in time for the 58 plants.
gion The plant with the highe
9-8 FINAL – October 2010
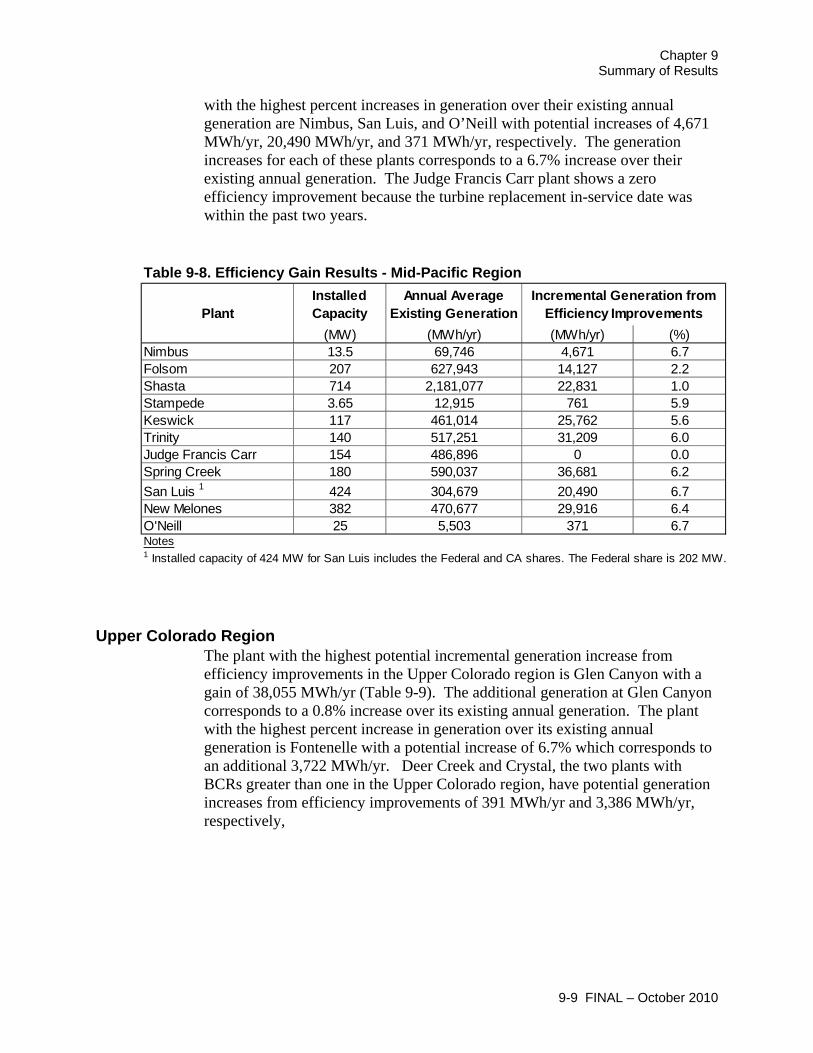
Chapter 9 Summary of Results
with th
Plant(MW) (MWh/yr) (MWh/yr) (%)
Nimbus 13.5 69,746 4,671 6.714,127 2.2
Shasta 714 2,181,077 22,831 1.0Stampede 3.65 12,915 761 5.9Keswick 117 461,014 25,762 5.6Trinity 140 517,251 31,209 6.0Judge Francis Carr 154 486,896 0 0.0Spring Creek 180 590,037 36,681 6.2San Luis 1 424 304,679 20,490 6.7New Melones 382 470,677 29,916 6.4O'Neill 25 5,503 371 6.7Notes
Folsom 207 627,943
1 Installed capacity of 424 MW for San Luis includes the Federal and CA shares. The Federal share is 202 MW.
Existing Generation
Efficiency ImprovementsInstalled Capacity
Annual Average Incremental Generation from
e highest percent increases in generation over their existing annual ,671
s
Table 9-8
Upper Colorado Region The plant with the highest potential incremental generation increase from efficiency improvements in the Upper Colorado region is Glen Canyon with a gain of 38,055 MWh/yr (Table 9-9). The additional generation at Glen Canyon corresponds to a 0.8% increase over its existing annual generation. The plant
est percent increase in generation over its existing annual ds to
generation are Nimbus, San Luis, and O’Neill with potential increases of 4MWh/yr, 20,490 MWh/yr, and 371 MWh/yr, respectively. The generation increases for each of these plants corresponds to a 6.7% increase over their existing annual generation. The Judge Francis Carr plant shows a zero efficiency improvement because the turbine replacement in-service date wawithin the past two years.
. Efficiency Gain Results - Mid-Pacific Region
with the highgeneration is Fontenelle with a potential increase of 6.7% which corresponan additional 3,722 MWh/yr. Deer Creek and Crystal, the two plants with BCRs greater than one in the Upper Colorado region, have potential generation increases from efficiency improvements of 391 MWh/yr and 3,386 MWh/yr, respectively,
9-9 FINAL – October 2010

Hydropower Modernization Initiative Assessment of Potential Capacity Increases at Existing Hydropower Plants
T
Plant
(MW) (MWh/yr) (MWh/yr) (%)1.41.8
McPhe 1.3 5,679 301 5.3Fontenelle 10 55,444 3,722 6.7Glen C nyon 1,320 4,982,479 38,055 0.8Towao 11 19,381 1,014 5.2Flaming Gorge 152 509,422 3,891 0.8Blue M a 86 265,164 8,673 3.3Morrow Point 173 363,625 19,421 5.3Elephant Butte 28 116,635 2,374 2.0Lower Molina 4.9 19,003 250 1.3Upper Molina 8.6 32,284 150 0.5
Installed Capacity
Annual Average Existing
Generation
Incremental Generation from Efficiency Improvements
Deer Creek 5.0 26,968 391Crysta 32 187,173 3,386l
e
ac
es
able 9-9. Efficiency Gain Results - Upper Colorado Region
Great Plains Region The plant with the highest potential incremental generation increase from efficiency improvements in the Great Plains region is Canyon Ferry with a gain of 25,391 MWh/yr (Table 9-10). The additional generation at Canyon Ferry orresponds to a 6.7% increase over its existing annual generation. The other
plants with generation increases corresponding to 6.7% over their existing eneration, the highest potential percent increase in generation from
in,
r,
c
annual gefficiency improvements, are Big Thompson, Boysen, Estes, Heart MountaMarys Lake, and Pilot Butte, which have potential generation increases ranging from 269 MWh/yr at Pilot Butte to 7,232 MWh/yr at Estes. In addition to Canyon Ferry, the other plants with BCRs greater than one in the Great Plains region were Shoshone and Guernsey which have potential increases in generation from efficiency improvements of 1,374 MWh/yr and 934 MWh/yrespectively, that correspond to 5.4% and 4.6% increases over their existing annual generation, respectively.
9-10 FINAL – October 2010

Chapter 9 Summary of Results
Plant(MW) (MWh/yr) (MWh/yr) (%)
Shoshone 3.0 25,487 1,374 5.4Canyon Ferry 50 380,509 25,391 6.7Guernsey 6.4 20,194 934 4.6Pilot Butte 1.6 4,013 269 6.7
4,268 5.8Glendo 38 65,902 4,130 6.3Fremont Canyon 67 247,405 14,075 5.7Boysen 15 71,996 4,825 6.7Kortes 36 147,781 1,943 1.3Big Thompson 4.5 12,248 824 6.7Alcova 41 118,203 2,406 2.0Seminoe 52 141,940 8,288 5.8Yellowtail 250 818,027 21,612 2.6Green Mount in 26 64,728 2,037 3.1Mount Elbert 200 226,803 14,379 6.3Flatiron 1 94.5 241,042 14,436 6.0Estes 45 107,555 7,232 6.7Pole Hill 38 184,741 10,906 5.9Heart Mount n 5.0 21,782 1,465 6.7Marys Lake 8.1 40,514 2,713 6.7Spirit Mounta 4.5 12,570 652 5.2Notes
Buffalo Bill 18 74,174
a
ai
in
1 Installed capacity at Flatiron is 94.5 MW. Only Units 1 and 2 (81.3 MW) were included in the modeling.
Installed Capacity
Annual Average Existing Generation
Incremental Generation from Efficiency Improvements
Table 9-10. Efficiency Gain Results - Great Plains Region
Pacific Northwhe plant with the highest potential incremental generation increase from fficiency improvements in the Pacific Northwest region is Grand Coulee with a ain of 101,669 MWh/yr (Table 9-11). The additional generation at Grand
Coulee is only a 0.5% increase over its existing annual generation. The magnitude of the incremental generation is likely due to the fact that there are 3 units at the plant and not that the units have undergone significant efficiency
deterioration due to age. The plant with the highest percent increase in r its existing annual generation is Anderson Ranch with a
/yr.
in r,
est Region Teg
3
generation ovepotential increase of 6.2% which corresponds to an additional 9,215 MWhThe plants with BCRs greater than one in the Pacific Northwest region, Black Canyon, Boise Diversion, Palisades, and Minidoka, have potential increasesgeneration from efficiency improvements of 2,211 MWh/yr, 104 MWh/y22,716 MWh/yr, and 2,403 MWh/yr, respectively. These increases in generation represent 3.3%, 0.7%, 3.2%, and 1.7% increases over their existing annual generation, respectively.
9-11 FINAL – October 2010

Hydropower Modernization Initiative Assessment of Potential Capacity Increases at Existing Hydropower Plants
Plant
(MW) (MWh/yr) (MWh/yr) (%)Black Canyon 10 67,078 2,211 3.3Boise Diversion 3.5
Installed Capacity
Annual Average Existing
Generation
Incremental Generation froEfficiency Improvem
15,247 104 0.7Palisades 177 706,936 22,716 3.2
1.76.2
handler 12 60,349 461 0.8Grand Coulee 6,495 21,850,471 101,669 0.5
ungry Horse 428 930,345 49,272 5.3Green Springs 17 63,822 1,686 2.6
oza 13 61,990 3,753 6.1
m ents
Minidoka 28 137,585 2,403Anderson Ranch 40 148,136 9,215C
H
R
Table 9-11. Efficiency Gain Results - Pacific Northwest Region
Plant
(MW) (MWh/yr) (MWh/yr) (%)Davis 255 1,300,376 26,471 2.0Parker
Installed Capacity
Annual Average Existing
Generation
Incremental Generation from Efficiency Improvements
120 566,182 7,445 1.3Hoover 2,079 5,269,763 107,275 2.0
Lower Colorado Region ighest potential incremental generation increase from
fficiency improvements in the Lower Colorado region is Hoover with a gain or 07,275 MWh/yr (Table 9-12). The additional generation at Hoover orresponds to a 2.0% increase over its existing annual generation. Like Grand oulee, the magnitude of the incremental generation is likely due to the fact that
at the units have undergone significant efficiency deterioration due to age. The other two plants in the Lower Colorado region, Davis and Parker, have potential incremental generation increases of
Wh/yr, respectively, which correspond to
Summary of Efficiency Gains Results on increases from efficiency improves
xist at the Reclamation plants based on this screening level assessment. As was previously described, the efficiency improvements are based on a
The plant with the he1cCthere are 19 units at the plant and not th
26,471 MWh/yr and 7,445 Mrelatively small increases over their existing annual generation of 2.0% and1.3%, respectively.
Table 9-12. Efficiency Gain Results - Lower Colorado Region
Significant potential for annual generatie
9-12 FINAL – October 2010

Chapter 9 Summary of Results
standardized efficiency degradation curve that considers the age of the units and assumes replacement with a modern turbine design. A total of 36 plants could otentially increase their annual generation by greater than 3%. The plants are
generation over the simulated annual eneration (Table 9-13). The plant with largest potential generation increase
the Pacific Northwest. Several of the
Table 9-13.
pranked based on the percent increase ingfrom efficiency gains is Hungry Horse in plants in the Mid-Pacific Region also have potential gains from efficiency related opportunities. The plant with the largest potential percent increase overits existing annual generation is O’Neill in the Mid-Pacific region.
Summary - Efficiency Gain Opportunities >3%
lant Region(MW) (MWh/yr) (MWh/yr) (%)
Mid-Pacific 25 5,503 371 6.7mpson Great Plains 4.5 12,248 824 6.7ountain Great Plains 5.0 21,782 1,465 6.7is 2 Mid-Pacific 424 304,679 20,490 6.7
Rank 1 P
1 O'Neill2 Big Tho3 Heart M4 San Lu5 Estes Great Plains 45 107,555 7,232 6.76 Fontenelle Upper Colorado 10 55,444 3,722 6.77 Boysen Great Plains 15 71,996 4,825 6.7
6.7671 6.7
10 Marys Lake Great Plains 8.1 40,514 2,713 6.711 Canyon Ferry Great Plains 50 380,509 25,391 6.712 New Melones Mid-Pacific 382 470,677 29,916 6.413 Mount Elbert Great Plains 200 226,803 14,379 6.314 Glendo Great Plains 38 65,902 4,130 6.315 Anderson Ranch Pacific Northwest 40 148,136 9,215 6.216 Spring Creek Mid-Pacific 180 590,037 36,681 6.217 Roza Pacific Northwest 13 61,990 3,753 6.118 Trinity Mid-Pacific 140 517,251 31,209 6.019 Flatiron 3 Great Plains 94.5 241,042 14,436 6.020 Pole Hill Great Plains 38 184,741 10,906 5.921 Stampede Mid-Pacific 3.65 12,915 761 5.922 Seminoe Great Plains 52 141,940 8,288 5.823 Buffalo Bill Great Plains 18 74,174 4,268 5.824 Fremont Canyon Great Plains 67 247,405 14,075 5.725 Keswick Mid-Pacific 117 461,014 25,762 5.626 Shoshone Great Plains 3.0 25,487 1,374 5.427 Morrow Point Upper Colorado 173 363,625 19,421 5.328 Hungry Horse Pacific Northwest 428 930,345 49,272 5.329 McPhee Upper Colorado 1.3 5,679 301 5.330 Towaoc Upper Colorado 11 19,381 1,014 5.231 Spirit Mountain Great Plains 4.5 12,570 652 5.232 Guernsey Great Plains 6.4 20,194 934 4.633 Black Canyon Pacific Northwest 10.2 67,078 2,211 3.334 Blue Mesa Upper Colorado 86.4 265,164 8,673 3.335 Palisades Pacific Northwest 176.6 706,936 22,716 3.236 Green Mountain Great Plains 26.0 64,728 2,037 3.1
Notes
Incremental Generation from Efficiency Improvements
Installed Capacity
Annual Average Existing
Generation
8 Pilot Butte Great Plains 1.6 4,013 2699 Nimbus Mid-Pacific 13.5 69,746 4,
2 Installed capacity of 424 MW for San Luis includes the Federal and CA shares. The Federal share is 202 MW.3 Installed capacity at Flatiron is 94.5 MW. Only Units 1 and 2 (81.3 MW) were included in the modeling.
1 Plants are ranked based on the percent of additional generation from efficiency improvements over their existing annual (simulated) generation.
9-13 FINAL – October 2010

Hydropower Modernization Initiative Assessment of Potential Capacity Increases at Existing Hydropower Plants
Greenhouse Gas Reduction Opportunities
Three potential opportunities for GHG reduction have been determined in this assessment. These reduction opportunities, or offsets, are from efficiency improvements, capacity additions, and avoided outage losses, Since GHG offsets are directly related to generation, the incremental generation, or avoided lost generation for outages, and the GHG offsets are shown in the results tables. The GHG offsets are summarized by region in Tables 9-14 through 9-18 for each of the five Reclamation regions and the plants are ranked within each region based on the maximum BCR from the five capacity addition increments included in the analysis. Economic benefits were not assigned to greenhouse gas offsets in this study. GHG offsets were not assigned dollar values because there is currently a great deal of uncertainty regarding their future valuation. The energy and economics model does include an input placeholder for potential valuation of GHG offsets in future studies. Individual state Green Energy incentives are generally not applicable to Federal projects and also contain restrictions on incremental capacity size and run-of-river operation that would preclude application to the capacity addition alternatives considered in this report.
The GHG offsets for efficiency improvements are based on generation increases from an upgrade to a new, modern turbine, which corresponds to 1.5% efficiency increase for plants that have not been rehabilitated in the last 15 years, and the increase in generation from rehabilitating a turbine to its original condition from its current state where the efficiency deterioration is a function of the age. The additional generation and GHG offsets shown for capacity additions correspond to the capacity addition increment with the highest BCR. The GHG offsets from an avoided outage of a unit on an annual basis are shown for the generation potentially lost from the final logical unit. For the majority of plants, the largest opportunity for GHG offsets is from an avoided outage of a unit, which supports investment in Reclamation’s assets to minimize risk of failure based on the potential risk of generation lost and GHG emissions.
Mid-Pacific Region The GHG offsets and associated generation for each of the 11 plants in the Mid- Pacific region are presented in Table 9-14.
9-14 FINAL – October 2010

Chapter 9 Summary of Results
Plant
NimbusFolsomShasta 10,684 73,426 24,380 64,233 30,058Stampede 761 308 1,669 514 7,983 3,230KeswickTrinityJudge Francis CarrSpring CreekSan LuisNew MelonesO'NeillNotes
(MWh/yr)metric tons
CO2e/yr (MWh/yr)metric tons
CO2e/yr (MWh/yr)metric tons
CO2e/yr4,671 1,890 6,104 2,068 21,275 8,60714,127 6,611 32,607 11,034 59,560 27,87122,831
25,762 11,239 26,278 9,419 44,802 19,54531,209 14,604 17,625 8,038 106,815 49,984
0 0 4,476 2,095 129,142 60,43136,681 17,165 12,180 5,662 88,337 41,33720,490 8,289 5,289 2,140 326 13229,916 13,999 7,830 3,664 4,568 2,138
371 173 251 117 306 143
1 Incremental GHG offs
GHG - Greenhouse Gas
2 GHG offsets from avoiplant is operated as a p
ets are based on the hydraulic capacity increase increment with the highest BCR.ded energy losses are based on a generic split between on-peak and off-peak hours depending on whether the eaking, base load or intermediate plant.
GHG Offsets from Incremental Generation from Efficiency
Improvements
GHG Offsets from Incremental Generation from Hydraulic
Capacity Increases 1GHG Offsets from Avoided
Energy Losses 2
Table 9-14. GHG
ements for three of the plants, New Melones, O’Neill, and San Luis.
the final logical nit at Judge Francis Carr which would equate to a generation loss of 129,142
MWh/yr and 60,431 metric tons of CO2e/yr from an alternate generation source the region.
Upper Colorado Region The GHG offsets and associated generation for each of the 12 plants in the
pper Colorado region are presented in Table 9-15. The largest potential GHG e from efficiency an installed capacity increase for only one plant in
e region, Glen Canyon. For the rest of the plants, the largest opportunity for GHG offsets comes from a year-long avoided outage of the final logical unit. Overall, the largest GHG offset opportunity results from a year-long avoided outage of the final logical unit at Crystal which would result in 187,173 MWh/yr of additional generation and 150,177 metric tons of CO2e/yr offset from generation of other energy sources in the region.
Reduction Results - Mid-Pacific Region
The largest potential GHG offsets shown in Table 9-14 come from efficiency improvThe largest opportunity for GHG offsets for the remaining plants comes from a year-long avoided outage of the final logical unit. Overall, the largest GHG offset opportunity results from a year-long avoided outage ofu
in
Uoffsets comth
9-15 FINAL – October 2010

Hydropower Modernization Initiative Assessment of Potential Capacity Increases at Existing Hydropower Plants
9-16 FINAL – October 2010
Plant
(MWh/yr)metric tons
CO2e/yr (MWh/yr)metric tons
CO2e/yr (MWh/yr)metric tons
CO2e/yrDeer Creek 391 304 1,023 796 9,380 7,304Crystal 3,386 2,716 10,950 6,308 187,173 150,177McPhee 301 227 413 312 5,771 4,357Fontenelle 3,722 2,987 4,774 2,605 56,394 45,248Glen Canyon 38,055 29,631 71,082 39,686 46,093 35,890Towaoc 1,014 814 1,120 899 19,704 15,809Flaming Gorge 3,891 3,030 13,495 7,302 41,896 32,622Blue Mesa 8,673 6,547 3,219 1,929 24,308 18,351Morrow Point 19,421 14,662 10,279 7,052 20,681 15,613Elephant Butte 2,374 1,905 357 287 10,535 8,452Lower Molina 250 195 133 64 19,003 14,797Upper Molina 150 117 8 6 32,284 25,137Notes
Table 9-15. GHG Reduction Results - Upper Colorad
1 Incremental GHG offsets are based on the hydraulic capacity increase increment with the highest BCR.
GHG - Greenh use Gas
2 GHG offsets from avoided energy losses are based on a generic split between on-peak and off-peak hours depending on whether the plant is operated as a peaking, base load or intermediate plant.
GHG Offsets from Incremental Generation from Efficiency
Improvements
GHG Offsets from Incremental Generation from Hydraulic
Capacity Increases 1GHG Offsets from Avoided
Energy Losses 2
o
o Region
he GHG offsets and associated generation for each of the 21 plants in the Great Plains region are presented in Table 9-16. The largest potential GHG
ffsets come from efficiency improvements at five plants in the region, Estes, Flatiron, Mount Elbert, Seminoe, and Yellowtail. The largest opportunity for
f a
T
o
GHG offsets for the remaining plants comes from a year-long avoided outage othe final logical unit. Overall, the largest GHG offset opportunity results fromyear-long avoided outage of the final logical unit at Pole Hill which would equate to a generation loss of 187,914 MWh/yr and 98,135 metric tons of CO2e/yr from an alternate generation source in the region.

Chapter 9 Summary of Results
Plant
(MWh/yr)metric tons
CO2e/yr (MWh/yr)metric tons
CO2e/yr (MWh/yr)metric tons
CO2e/yrShoshone 1,374 734 12,347 4,055 25,922 13,514Canyon Ferry 25,391 12,742 17,576 8,820 72,993 36,630Guernsey 934 489 8,887 2,580 9,928 4,624Pilot Butte 269 133 1,800 518 1,947 926Buffalo Bill 4,268 2,277 3,985 2,077 15,231 7,941Glendo 4,130 2,146 8,726 3,126 27,946 13,020Fremont Canyon 14,075 7,588 9,238 4,960 64,793 34,789Boysen 4,825 2,583 5,322 2,176 16,163 8,423Kortes 1,943 1,124 4,594 1,625 13,075 6,845Big Thompson 824 432 494 237 12,460 5,979Alcova 2,406 1,392 2,003 944 23,517 12,583Seminoe 8,288 4,451 5,592 2,486 7,507 3,978Yellowtail 21,612 12,502 8,526 3,370 21,586 11,498Green Mountain 2,037 1,100 2,065 725 6,331 3,243Mount Elbert 14,379 8,434 3,965 2,410 0 0Flatiron 3 14,436 7,762 4,153 2,207 625 332Estes 7,232 3,909 1,854 1,005 0 0Pole Hill 10,906 5,538 3,173 1,657 187,914 98,135Heart Mountain 1,465 778 481 227 22,158 11,150Marys Lake 2,713 1,389 687 372 41,201 22,326Spirit Mountain 652 321 220 105 12,790 6,090Notes1 Inc .
3 Only Units 1 and 2 (81.3 MW) at Flatiron were included in the modeling.GHG - Greenhouse as
2 GHG offsets from oided energy losses are based on a generic split between on-peak and off-peak hours depending on whether the plant is operated as peaking, base load or intermediate plant.
GHG Offsets from Incremental Generation from Efficiency
Improvements
GHG Offsets from Incremental Generation from Hydraulic
Capacity Increases 1GHG Offsets from Avoided
Energy Losses 2
remental GHG offsets are based on the hydraulic capacity increase increment with the highest BCR av a
G
Table 9-16. GHG Reduction Results - Great Plains Region
Pacific Northwest Region he GHG offsets and associated generation for each of the ten plants in the acific Northwest region are presented in Table 9-17. The largest potential HG offsets come from efficiency improvements at two plants in the region, rand Coulee and Hungry Horse. The largest potential GHG offsets come from
apacity additions for one plant in the Pacific Northwest, Boise Diversion. The rgest opportunity for GHG offsets for the remaining plants comes from a year-
unit. Overall, the largest GHG offset pportunity results from a year-long avoided outage of the final logical unit at
Palisades which would equate to a generation loss of 112,976 MWh/yr and 1,024 metric tons of CO2e/yr from an alternate generation source in the region.
TPGGclalong avoided outage of the final logical o
6
9-17 FINAL – October 2010
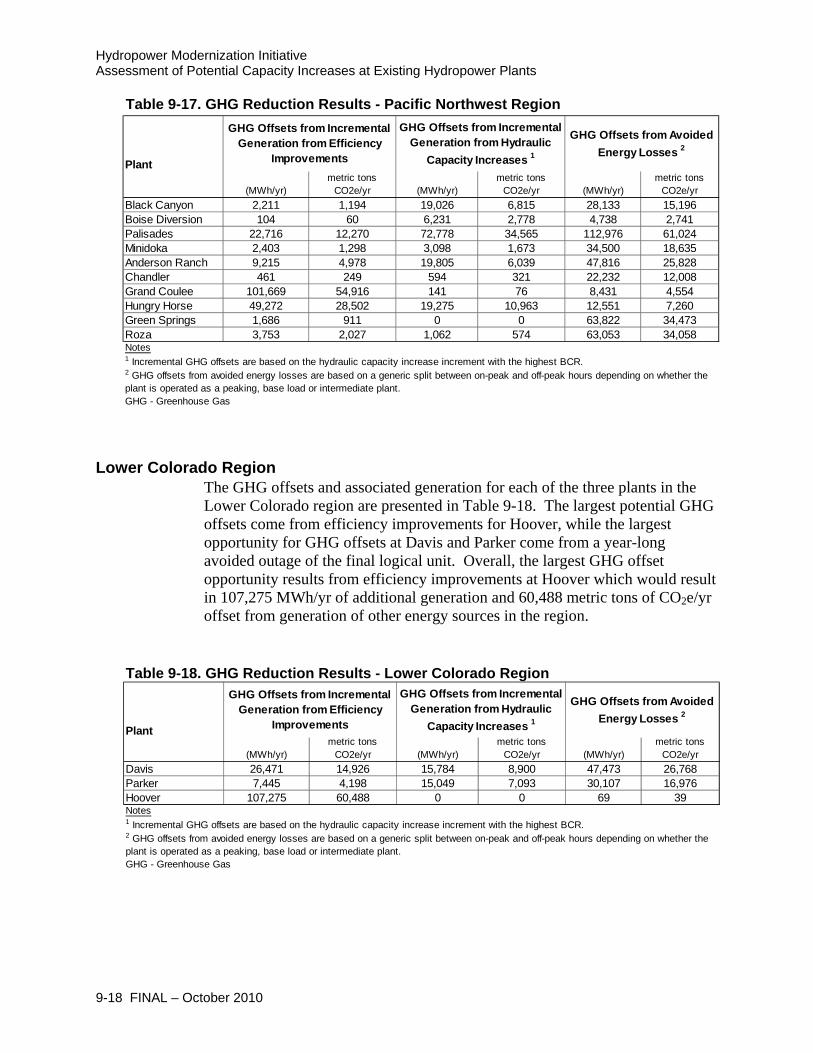
Hydropower Modernization Initiative Assessment of Potential Capacity Increases at Existing Hydropower Plants
Plantons /yr
Black CanyonBoise Diversion 4,738 2,741Palisades 22,716 12,270 72,778 34,565 112,976 61,024Minidoka 2,403 1,298 3,098 1,673 34,500 18,635Anderson Ranch 9,215 4,978 19,805 6,039 47,816 25,828Chandler 461 249 594 321 22,232 12,008Grand Coulee 101,669 54,916 141 76 8,431 4,554Hungry Horse 49,272 28,502 19,275 10,963 12,551 7,260Green Springs 1,686 911 0 0 63,822 34,473Roza 3,753 2,027 1,062 574 63,053 34,058Notes
GHG Offsets from Incremental Generation from Efficiency
Improvements
GHG Offsets from Incremental Generation from Hydraulic
Capacity Increases 1GHG Offsets from Avoided
Energy Losses 2
(MWh/yr)metric tons
CO2e/yr (MWh/yr)metric tons
CO2e/yr (MWh/yr)metric t
CO2e2,211 1,194 19,026 6,815 28,133 15,196104 60 6,231 2,778
1 Incremental GH ffsets are based on the hydraulic capacity increase increment with the highest BCR.
GHG - Greenhouse Gas
2 GHG offsets from voided energy losses are based on a generic split between on-peak and off-peak hours depending on whether the plant is operated a peaking, base load or intermediate plant.
G o a
as
Plant
(MWh/yr)metric tons
CO2e/yr (MWh/yr)metric tons
CO2e/yr (MWh/yr)metric tons
CO2e/yrDavis 26,471 14,926 15,784 8,900 47,473 26,768Parker 7,445 4,198 15,049 7,093 30,107 16,976Hoover 107,275 60,488 0 0 69 39Notes1 Incremental GHG offsets are based on the hydraulic capacity increase increment with the highest BCR.
GHG - Greenhouse Gas
2 GHG offsets from avoided energy losses are based on a generic split between on-peak and off-peak hours depending on whether the plant is operated as a peaking, base load or intermediate plant.
GHG Offsets from Incremental Generation from Efficiency
Improvements
GHG Offsets from Incremental Generation from Hydraulic
Capacity Increases 1GHG Offsets from Avoided
Energy Losses 2
Table 9-17.
Lower Colorado Region he GHG offsets and associated generation for each of the three plants in the
Lower Colorado region are presented in Table 9-18. The largest potential GHG offsets come from efficiency improvements for Hoover, while the largest opportunity for GHG offsets at Davis and Parker come from a year-long avoided outage of the final logical unit. Overall, the largest GHG offset opportunity results from efficiency improvements at Hoover which would result in 107,275 MWh/yr of additional generation and 60,488 metric tons of CO2e/yr offset from generation of other energy sources in the region.
Table 9-18. GHG Reduction Results - Lower Colorado Region
GHG Reduction Results - Pacific Northwest Region
T
9-18 FINAL – October 2010

Chapter 9 Summary of Results
9-19 FINAL – October 2010
Region
(MWh/yr)metric tons
CO2e/yr (MWh/yr)metric tons
CO2e/yr (MWh/yr)metric tons
CO2e/yrMid Pacific 186,818 84,961 187,735 69,129 527,348 243,476Upper Colorado 81,627 63,134 116,853 67,246 473,221 373,756Lower Colorado 141,191 79,612 30,833 15,993 77,649 43,783Pacific Northwes 193,491 106,405 142,011 63,803 398,253 215,777Great Plains 144,159 77,825 105,692 45,683 584,088 302,024Notes
t
1 Incremental GHG ffsets are based on the summation of the hydraulic capacity increase increment for each plant with the highest BCR.
GHG - Greenhous as
GHG Offsets from Incremental Generation from Efficiency
Improvements
GHG Offsets from Incremental Generation from Hydraulic
Capacity Increases 1GHG Offsets from Avoided
Energy Losses 2
2 GHG offsets from avoided energy losses are based on a generic split between on-peak and off-peak hours depending on whether the plant is operated a peaking, base load or intermediate plant.
o
e Gs a
Su esults The potential GHG reduction opportunities and associated generation increases for each of the five Reclamation regions is summarized in Table 9-19. The largest potential GHG offsets and the largest annual generation increases from efficiency improvements is in the Pacific Northwest region. The largest potential GHG offsets and associated generation increases from capacity additions is in the Mid-Pacific region. The largest opportunity for GHG offsets from avoided outages lasting a year is in the Upper Colorado region. However the largest opportunity for avoided energy loss from outages lasting a year is in Great Plains Region. The difference in regions for GHG offsets and avoided energy loss opportunities associated with avoided outages can be explained by the regional mix of GHG emission sources that contribute to the GHG emission rates. Overall, the largest GHG offset opportunity results from a year-long avoided outage of the final logical unit for 4 of the 5 regions; the exception being Lower Colorado which has the largest GHG offset opportunity attributed to efficiency improvements. The results for the Lower Colorado region are primarily driven by Hoover which is the majority of the capacity in that region.
Table 9-19. Cumulative GHG Reduction Results by Region
mmary of Greenhouse Gas Reduction Opportunities R

This page left blank intentionally.

Chapter 10 Conclusions
10-1 FINAL – October 2010
Chapter 10 Conclusions
Based on the results of this planning-level study, the following conclusions can be made:
1. There is no indication of economically feasible capacity additions at over 80% of the existing Reclamation hydropower plants. This is generally a confirmation of an indication that excluded the existing Reclamation plants from a 2007 Federal study of potential hydropower development at Federal facilities. Most of the original plants that showed promise for capacity additions have been studied and capacity additions already completed in a power uprating program initiated by Reclamation in 1978.
2. Results show economically feasible potential capacity additions at 10 of the 58 plants. The 10 plants that show initial promise for capacity additions are mostly among the smallest of the 58 plants. Based on the highest benefit to cost ratio, the Shoshone plant is the highest ranked for capacity addition. Based on maximum net present value, the Palisa e 10 plants would be candidates for more detailed feasibility studies of capacity addition.
3. Selecting the capacity addition at each of the 10 plants that has the highest benefit to cost ratio would result in a total capacity addition of about 67 megawatts across the Reclamation power system. The 67 megawatt capacity addition would represent less than one-half of one percent of the existing total nameplate capacity of the 58 plants. If maximum net present value was the criterion for selecting the capacity addition, the economic capacity addition would rise to about 143 megawatts, still less than one percent of the existing total nameplate capacity. The Palisades plant alone has over 50% of the potentially economically feasible capacity addition.
4. There is substantial potential for generation increases from efficiency gains and substantial offsets of greenhouse gasses from fossil fuel-fired generation. Costs and benefits were not assigned to the efficiency gains or greenhouse gas offsets in this study.
des plant is the highest ranked. Thes

This page left blank intentionally.

Chapter 11 References
Chapter 11 References
Electric Power Research Institute (EPRI), 2007. Assessment of Waterpower Potential and Development Needs, report 1014762.
Hall, D.G., and K.S. Reeves, 2006. A Study of United States Hydroelectric Plant Ownership, Idaho National Laboratory, Idaho Falls, ID, report INL/Ext-06-11519.
Intergovernmental Panel on Climate Change (IPCC), 2007a. Climate Change 2007: The Physical Science Basis. Contribution of Working Group I to the Fourth Assessment Report of the Intergovernmental Panel on Climate Change [Solomon, S., D. Qin, M. Manning, Z. Chen, M. Marquis, K.B. Averyt, M. Tignor and H.L. Miller (eds.)]. Cambridge University Press, Cambridge, United Kingdom and New York, NY, USA. 996 pp.
Intergovernme ), 2007b. Climate Change 2007: Mitigation of Climate Change. orking Group III to the Fourth Assessment Report of the Intergovernmental Panel on Climate Change [Metz., B., O. Davidson, P. Bosch, R. Dave, L. Meyer (eds.)]. Cambridge University Press, Cambridge, United Kingdom and New York, NY, USA. 851 pp.
Energy Information Administration (EIA), 2010a. Annual Energy Outlook 2010, with Projections to 2035, Department of Energy, April.
Energy Information Administration (EIA), 2010b. “2016 Levelized Cost of New Generation Resources from the Annual Energy Outlook 2010”.
Energy Information Administration (EIA), 2010c. “Short-Term Energy Outlook”, Table 7c – U.S. Regional Electricity Prices, accessed at: http://www.eia.doe.gov/emeu/steo/pub/xls/STEO_m.xls
Federal Register, February 23, 2010. “Change in Discount Rate for Water Resources Planning”, DOCID: fr23fe10-106, Federal Register Volume 75, Number 35.
Hall, Douglas G., Richard T. Hunt, Kelly S. Reeves, and Greg R. Carroll, 2003. Estimation of Economic Parameters of U.S. Hydropower Resources. Idaho National Engineering and Environmental Laboratory. Prepared for the U.S. Department of Energy, Contract DE-AC07-99ID13727.
ntal Panel on Climate Change (IPCC Contribution of W
11-1 FINAL – October 2010

Shasta Lake Water Resources Investigation Plan Formulation Report
11-2 FINAL REPORT – October 2010
Office of Management and Budget (OMB), December 8, 2009. “2010 Discount Rates for OMB Circular No. A-94”, memorandum from Peter R. Orszag, Director.
U.S. Army Corps of Engineers (USACE), December 31, 1985. Hydropower, EM-1110-2-1701.
U.S. Army Corps of Engineers (USACE), March 31, 2010. Civil Works Construction Cost Index System, EM-1110-2-1304.
U.S. Bureau of Reclamation (Reclamation), 2010. “Construction Cost Trends”, Web site http://www.usbr.gov/pmts/estimate/cost_trend.html, accessed on August 12, 2010.
U.S. Department of the Interior, U.S. Army Corps of Engineers, and U.S. Department of Energy, May 2007. Potential Hydroelectric Development at Existing Federal Facilities, for Section 1834 of the Energy Policy Act of 2005.
U.S. Environmental Protection Agency (USEPA), 2008. The Emission & Generation Resource Integrated Database for 2007 – (eGRID2007) Technical Support Document. Office of Atmospheric Programs. September.

Chapter 12 List of Preparers
Chapter 12 List of Preparers
MWH AMERICAS, INC.
Sustainable Development; B.S. Geology, California State University; M.S. Geology, University of Reno,
ala, P.E. – Energy model prototype, economics, and report author; Hydrologic/Hydraulic Engineer; B.S. and M.S., Civil Engineering, University
Patrick Hartel, P.E. – Energy and capacity value development, and report
t;
Eric Wooden – Energy model data preparation and initial runs; Mechanical
Nancy Walker – Project Manager; Climate Change/
Mackay School of Mines
John Haap
of Washington.
Jill Gray – Energy model development, initial and final energy model runs, andreport author; Professional Environmental Scientist; B.S. Environmental Science and Economics, Rensselaer Polytechnic Institute.
reviewer; Hydroelectric Systems Planning Specialist; B.S., Civil Engineering, Bradley University; M.S., Civil Engineering, Colorado State University.
Stanley Hayes, P.E. – Unit efficiencies and report reviewer; Vice-PresidenB.S. Mechanical Engineering, University of Illinois.
Engineer; B.S. Mechanical Engineering, University of Missouri, Rolla.
RECLAMATION AND USACE
MWH wishes to acknowledge the constructive comments and coordinatioefforts from Michael Pulskamp of Reclamation and Michael BergerUSACE Hydroelectric Design Center. We also wish to acknowledgof Reclamation personnel in each Region to respond to our extensive data
n of the e the efforts
requests in a timely manner.
12-1 FINAL – October 2010

This page left blank intentionally.

APPENDIX A
Capacity Addition Detailed Economic Results

This page left blank intentionally.

Hydropower Modernization InitiativeAssessment of Potential Capacity Increases at Existing Hydropower Plants
Summary of Capacity Increase Benefits and CostsAlcova
Percent Capacity
Capacity Increase
Average Incremental
Energy
Total Incremental
Capacity
Construction & Mitigation Total Cost
Construction & Mitigation Total Cost
PV of Total Costs
PV of Energy
Benefits
PV of Capacity Benefits
PV of Total
Benefits
NPV of Total
Benefits B/CIncrease (MW) (MWh/yr) Factor ($M) ($/kW) ($M) ($M) ($M) ($M) ($M) Ratio
10% 4.1 1,162 3% $7.5 $1,823 $10.9 $1.3 $1.6 $2.9 -$8.0 0.2620% 8.3 2,003 3% $13.3 $1,605 $18.9 $2.2 $3.0 $5.2 -$13.7 0.2730% 12.4 2,647 2% $18.5 $1,491 $26.2 $2.9 $4.3 $7.2 -$19.0 0.2740% 16.6 3,186 2% $23.4 $1,416 $33.0 $3.5 $5.5 $8.9 -$24.1 0.2750% 20.7 3,662 2% $28.2 $1,361 $39.5 $4.0 $6.6 $10.6 -$28.9 0.27
0.25
0.30
$30.0
$40.0
$50.0
Ratio
s
Total Cost $ Total Benefit $ Net Present Value B/C Ratio
0.00
0.05
0.10
0.15
0.20
0.25
0.30
‐$40.0
‐$30.0
‐$20.0
‐$10.0
$0.0
$10.0
$20.0
$30.0
$40.0
$50.0
0.0 5.0 10.0 15.0 20.0 25.0
Bene
fit to
Cost (B/C) Ratio
Millions of D
ollars
Capacity Increase (MW)
Total Cost $ Total Benefit $ Net Present Value B/C Ratio
A-1 FINAL - October 2010

Hydropower Modernization InitiativeAssessment of Potential Capacity Increases at Existing Hydropower Plants
Summary of Capacity Increase Benefits and CostsAnderson Ranch
Percent Capacity
Capacity Increase
Average Incremental
Energy
Total Incremental
Capacity
Construction & Mitigation Total Cost
Construction & Mitigation Total Cost
PV of Total Costs
PV of Energy
Benefits
PV of Capacity Benefits
PV of Total
Benefits
NPV of Total
Benefits B/CIncrease (MW) (MWh/yr) Factor ($M) ($/kW) ($M) ($M) ($M) ($M) ($M) Ratio
10% 4.0 3,701 11% $7.3 $1,835 $10.6 $4.1 $3.3 $7.4 -$3.2 0.7020% 8.0 6,108 9% $12.9 $1,615 $18.4 $6.8 $5.8 $12.5 -$5.9 0.6830% 12.0 8,595 8% $18.0 $1,500 $25.5 $9.5 $8.3 $17.8 -$7.7 0.7040% 16.0 14,201 10% $22.8 $1,425 $32.1 $15.7 $12.9 $28.6 -$3.5 0.8950% 20.0 17,220 10% $27.4 $1,369 $38.4 $19.0 $15.8 $34.8 -$3.6 0.91
0.70
0.80
0.90
1.00
$30.0
$40.0
$50.0
Ratio
s
Total Cost $ Total Benefit $ Net Present Value B/C Ratio
0.00
0.10
0.20
0.30
0.40
0.50
0.60
0.70
0.80
0.90
1.00
‐$20.0
‐$10.0
$0.0
$10.0
$20.0
$30.0
$40.0
$50.0
0.0 5.0 10.0 15.0 20.0 25.0 Bene
fit to
Cost (B/C) Ratio
Millions of D
ollars
Capacity Increase (MW)
Total Cost $ Total Benefit $ Net Present Value B/C Ratio
A-2 FINAL - October 2010
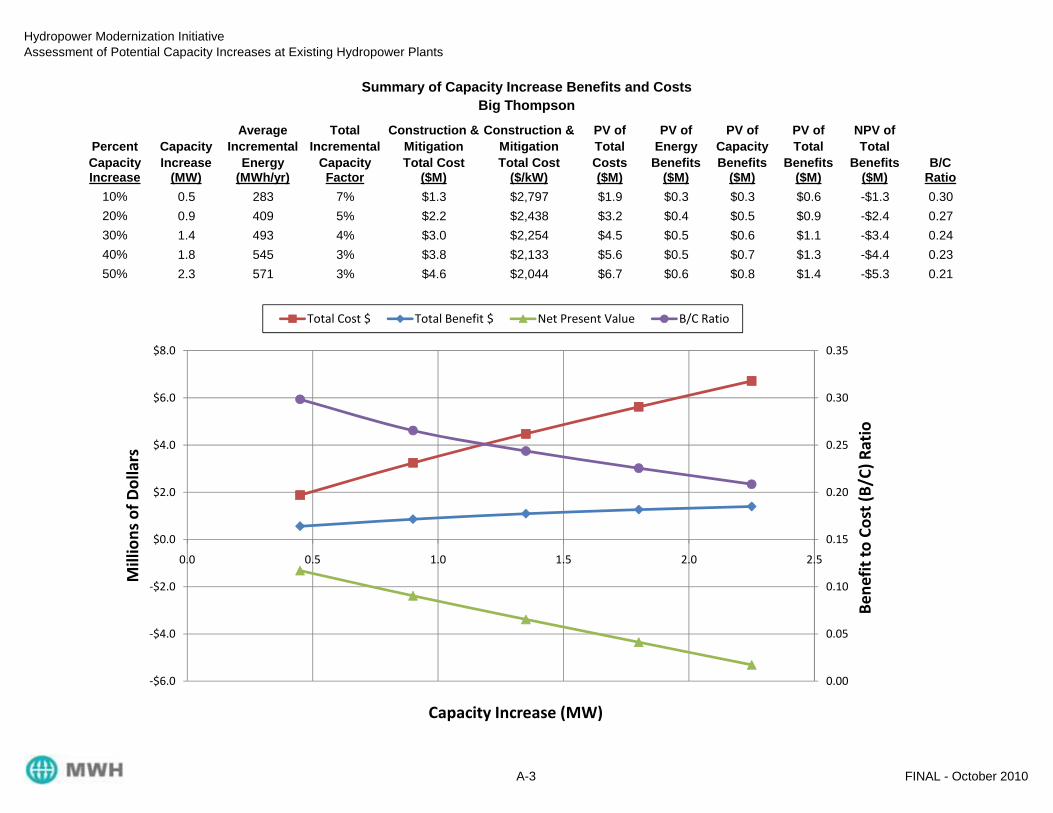
Hydropower Modernization InitiativeAssessment of Potential Capacity Increases at Existing Hydropower Plants
Summary of Capacity Increase Benefits and CostsBig Thompson
Percent Capacity
Capacity Increase
Average Incremental
Energy
Total Incremental
Capacity
Construction & Mitigation Total Cost
Construction & Mitigation Total Cost
PV of Total Costs
PV of Energy
Benefits
PV of Capacity Benefits
PV of Total
Benefits
NPV of Total
Benefits B/CIncrease (MW) (MWh/yr) Factor ($M) ($/kW) ($M) ($M) ($M) ($M) ($M) Ratio
10% 0.5 283 7% $1.3 $2,797 $1.9 $0.3 $0.3 $0.6 -$1.3 0.3020% 0.9 409 5% $2.2 $2,438 $3.2 $0.4 $0.5 $0.9 -$2.4 0.2730% 1.4 493 4% $3.0 $2,254 $4.5 $0.5 $0.6 $1.1 -$3.4 0.2440% 1.8 545 3% $3.8 $2,133 $5.6 $0.5 $0.7 $1.3 -$4.4 0.2350% 2.3 571 3% $4.6 $2,044 $6.7 $0.6 $0.8 $1.4 -$5.3 0.21
0.25
0.30
0.35
$4.0
$6.0
$8.0
Ratio
s
Total Cost $ Total Benefit $ Net Present Value B/C Ratio
0.00
0.05
0.10
0.15
0.20
0.25
0.30
0.35
‐$6.0
‐$4.0
‐$2.0
$0.0
$2.0
$4.0
$6.0
$8.0
0.0 0.5 1.0 1.5 2.0 2.5
Bene
fit to
Cost (B/C) Ratio
Millions of D
ollars
Capacity Increase (MW)
Total Cost $ Total Benefit $ Net Present Value B/C Ratio
A-3 FINAL - October 2010

Hydropower Modernization InitiativeAssessment of Potential Capacity Increases at Existing Hydropower Plants
Summary of Capacity Increase Benefits and CostsBlack Canyon
Percent Capacity
Capacity Increase
Average Incremental
Energy
Total Incremental
Capacity
Construction & Mitigation Total Cost
Construction & Mitigation Total Cost
PV of Total Costs
PV of Energy
Benefits
PV of Capacity Benefits
PV of Total
Benefits
NPV of Total
Benefits B/CIncrease (MW) (MWh/yr) Factor ($M) ($/kW) ($M) ($M) ($M) ($M) ($M) Ratio
10% 1.0 4,022 45% $2.4 $2,379 $3.6 $4.4 $2.3 $6.8 $3.2 1.8920% 2.0 8,529 48% $4.2 $2,082 $6.2 $9.4 $4.8 $14.2 $8.0 2.2930% 3.1 12,616 47% $5.9 $1,929 $8.6 $13.9 $7.1 $21.0 $12.5 2.4640% 4.1 16,027 45% $7.5 $1,828 $10.8 $17.7 $9.3 $27.0 $16.2 2.5150% 5.1 19,026 43% $8.9 $1,754 $12.9 $21.0 $11.4 $32.4 $19.6 2.52
2.50
3.00
$25.0
$30.0
$35.0
Ratio
s
Total Cost $ Total Benefit $ Net Present Value B/C Ratio
0.00
0.50
1.00
1.50
2.00
2.50
3.00
$0.0
$5.0
$10.0
$15.0
$20.0
$25.0
$30.0
$35.0
0.0 1.0 2.0 3.0 4.0 5.0 6.0
Bene
fit to
Cost (B/C) Ratio
Millions of D
ollars
Capacity Increase (MW)
Total Cost $ Total Benefit $ Net Present Value B/C Ratio
A-4 FINAL - October 2010

Hydropower Modernization InitiativeAssessment of Potential Capacity Increases at Existing Hydropower Plants
Summary of Capacity Increase Benefits and CostsBlue Mesa
Percent Capacity
Capacity Increase
Average Incremental
Energy
Total Incremental
Capacity
Construction & Mitigation Total Cost
Construction & Mitigation Total Cost
PV of Total Costs
PV of Energy
Benefits
PV of Capacity Benefits
PV of Total
Benefits
NPV of Total
Benefits B/CIncrease (MW) (MWh/yr) Factor ($M) ($/kW) ($M) ($M) ($M) ($M) ($M) Ratio
10% 8.6 1,188 2% $13.8 $1,592 $19.6 $1.7 $2.5 $4.2 -$15.4 0.2120% 17.3 2,073 1% $24.3 $1,405 $34.1 $2.9 $4.9 $7.8 -$26.4 0.2330% 25.9 2,735 1% $33.9 $1,307 $47.3 $3.9 $7.0 $10.9 -$36.4 0.2340% 34.6 3,286 1% $43.0 $1,243 $59.6 $4.6 $9.1 $13.8 -$45.8 0.2350% 43.2 3,739 1% $51.6 $1,195 $71.3 $5.3 $11.2 $16.5 -$54.8 0.23
0.20
0.25
$40.0
$60.0
$80.0
Ratio
s
Total Cost $ Total Benefit $ Net Present Value B/C Ratio
0.00
0.05
0.10
0.15
0.20
0.25
‐$80.0
‐$60.0
‐$40.0
‐$20.0
$0.0
$20.0
$40.0
$60.0
$80.0
0.0 5.0 10.0 15.0 20.0 25.0 30.0 35.0 40.0 45.0 50.0
Bene
fit to
Cost (B/C) Ratio
Millions of D
ollars
Capacity Increase (MW)
Total Cost $ Total Benefit $ Net Present Value B/C Ratio
A-5 FINAL - October 2010

Hydropower Modernization InitiativeAssessment of Potential Capacity Increases at Existing Hydropower Plants
Summary of Capacity Increase Benefits and CostsBoise Diversion
Percent Capacity
Capacity Increase
Average Incremental
Energy
Total Incremental
Capacity
Construction & Mitigation Total Cost
Construction & Mitigation Total Cost
PV of Total Costs
PV of Energy
Benefits
PV of Capacity Benefits
PV of Total
Benefits
NPV of Total
Benefits B/CIncrease (MW) (MWh/yr) Factor ($M) ($/kW) ($M) ($M) ($M) ($M) ($M) Ratio
10% 0.3 1,825 60% $1.0 $2,951 $1.5 $2.3 $0.9 $3.2 $1.7 2.0920% 0.7 3,527 58% $1.8 $2,569 $2.6 $4.4 $1.7 $6.2 $3.5 2.3530% 1.0 5,062 56% $2.5 $2,373 $3.6 $6.3 $2.6 $8.9 $5.3 2.4640% 1.4 6,327 52% $3.1 $2,244 $4.6 $7.9 $3.3 $11.3 $6.7 2.4850% 1.7 7,330 49% $3.7 $2,150 $5.4 $9.2 $4.1 $13.2 $7.8 2.44
2.50
3.00
$10.0
$12.0
$14.0
Ratio
s
Total Cost $ Total Benefit $ Net Present Value B/C Ratio
0.00
0.50
1.00
1.50
2.00
2.50
3.00
$0.0
$2.0
$4.0
$6.0
$8.0
$10.0
$12.0
$14.0
0.0 0.2 0.4 0.6 0.8 1.0 1.2 1.4 1.6 1.8 2.0
Bene
fit to
Cost (B/C) Ratio
Millions of D
ollars
Capacity Increase (MW)
Total Cost $ Total Benefit $ Net Present Value B/C Ratio
A-6 FINAL - October 2010

Hydropower Modernization InitiativeAssessment of Potential Capacity Increases at Existing Hydropower Plants
Summary of Capacity Increase Benefits and CostsBoysen
Percent Capacity
Capacity Increase
Average Incremental
Energy
Total Incremental
Capacity
Construction & Mitigation Total Cost
Construction & Mitigation Total Cost
PV of Total Costs
PV of Energy
Benefits
PV of Capacity Benefits
PV of Total
Benefits
NPV of Total
Benefits B/CIncrease (MW) (MWh/yr) Factor ($M) ($/kW) ($M) ($M) ($M) ($M) ($M) Ratio
10% 1.5 1,366 10% $3.3 $2,208 $4.9 $1.4 $1.2 $2.6 -$2.2 0.5420% 3.0 2,360 9% $5.8 $1,936 $8.4 $2.4 $2.2 $4.6 -$3.8 0.5530% 4.5 3,267 8% $8.1 $1,795 $11.6 $3.4 $3.1 $6.5 -$5.1 0.5640% 6.0 4,097 8% $10.2 $1,702 $14.6 $4.2 $4.0 $8.2 -$6.4 0.5650% 7.5 4,776 7% $12.3 $1,634 $17.5 $4.9 $4.8 $9.7 -$7.8 0.55
0.50
0.60
$15.0
$20.0
Ratio
s
Total Cost $ Total Benefit $ Net Present Value B/C Ratio
0.00
0.10
0.20
0.30
0.40
0.50
0.60
‐$10.0
‐$5.0
$0.0
$5.0
$10.0
$15.0
$20.0
0.0 1.0 2.0 3.0 4.0 5.0 6.0 7.0 8.0
Bene
fit to
Cost (B/C) Ratio
Millions of D
ollars
Capacity Increase (MW)
Total Cost $ Total Benefit $ Net Present Value B/C Ratio
A-7 FINAL - October 2010

Hydropower Modernization InitiativeAssessment of Potential Capacity Increases at Existing Hydropower Plants
Summary of Capacity Increase Benefits and CostsBuffalo Bill
Percent Capacity
Capacity Increase
Average Incremental
Energy
Total Incremental
Capacity
Construction & Mitigation Total Cost
Construction & Mitigation Total Cost
PV of Total Costs
PV of Energy
Benefits
PV of Capacity Benefits
PV of Total
Benefits
NPV of Total
Benefits B/CIncrease (MW) (MWh/yr) Factor ($M) ($/kW) ($M) ($M) ($M) ($M) ($M) Ratio
10% 1.8 2,452 16% $3.8 $2,133 $5.6 $2.5 $2.0 $4.6 -$1.1 0.8120% 3.6 3,920 12% $6.7 $1,871 $9.7 $4.0 $3.4 $7.4 -$2.3 0.7630% 5.4 5,174 11% $9.4 $1,736 $13.5 $5.3 $4.6 $10.0 -$3.5 0.7440% 7.2 6,392 10% $11.9 $1,646 $16.9 $6.6 $5.8 $12.4 -$4.5 0.7350% 9.0 7,579 10% $14.2 $1,581 $20.3 $7.8 $7.0 $14.8 -$5.5 0.73
0.70
0.80
0.90
$15.0
$20.0
$25.0
Ratio
s
Total Cost $ Total Benefit $ Net Present Value B/C Ratio
0.00
0.10
0.20
0.30
0.40
0.50
0.60
0.70
0.80
0.90
‐$10.0
‐$5.0
$0.0
$5.0
$10.0
$15.0
$20.0
$25.0
0.0 1.0 2.0 3.0 4.0 5.0 6.0 7.0 8.0 9.0 10.0 Bene
fit to
Cost (B/C) Ratio
Millions of D
ollars
Capacity Increase (MW)
Total Cost $ Total Benefit $ Net Present Value B/C Ratio
A-8 FINAL - October 2010

Hydropower Modernization InitiativeAssessment of Potential Capacity Increases at Existing Hydropower Plants
Summary of Capacity Increase Benefits and CostsCanyon Ferry
Percent Capacity
Capacity Increase
Average Incremental
Energy
Total Incremental
Capacity
Construction & Mitigation Total Cost
Construction & Mitigation Total Cost
PV of Total Costs
PV of Energy
Benefits
PV of Capacity Benefits
PV of Total
Benefits
NPV of Total
Benefits B/CIncrease (MW) (MWh/yr) Factor ($M) ($/kW) ($M) ($M) ($M) ($M) ($M) Ratio
10% 5.0 11,211 26% $8.8 $1,760 $12.7 $10.7 $8.7 $19.4 $6.7 1.5320% 10.0 18,956 22% $15.5 $1,551 $22.0 $18.1 $15.0 $33.1 $11.0 1.5030% 15.0 24,524 19% $21.6 $1,441 $30.5 $23.4 $19.8 $43.2 $12.7 1.4240% 20.0 29,173 17% $27.4 $1,369 $38.4 $27.9 $23.9 $51.8 $13.4 1.3550% 25.0 32,781 15% $32.9 $1,316 $45.9 $31.3 $27.4 $58.7 $12.8 1.28
1.40
1.60
1.80
$50.0
$60.0
$70.0
Ratio
s
Total Cost $ Total Benefit $ Net Present Value B/C Ratio
0.00
0.20
0.40
0.60
0.80
1.00
1.20
1.40
1.60
1.80
$0.0
$10.0
$20.0
$30.0
$40.0
$50.0
$60.0
$70.0
0.0 5.0 10.0 15.0 20.0 25.0 30.0
Bene
fit to
Cost (B/C) Ratio
Millions of D
ollars
Capacity Increase (MW)
Total Cost $ Total Benefit $ Net Present Value B/C Ratio
A-9 FINAL - October 2010

Hydropower Modernization InitiativeAssessment of Potential Capacity Increases at Existing Hydropower Plants
Summary of Capacity Increase Benefits and CostsChandler
Percent Capacity
Capacity Increase
Average Incremental
Energy
Total Incremental
Capacity
Construction & Mitigation Total Cost
Construction & Mitigation Total Cost
PV of Total Costs
PV of Energy
Benefits
PV of Capacity Benefits
PV of Total
Benefits
NPV of Total
Benefits B/CIncrease (MW) (MWh/yr) Factor ($M) ($/kW) ($M) ($M) ($M) ($M) ($M) Ratio
10% 1.2 594 6% $2.8 $2,305 $4.1 $0.7 $0.6 $1.3 -$2.8 0.3220% 2.4 606 3% $4.8 $2,019 $7.1 $0.7 $0.9 $1.6 -$5.5 0.2230% 3.6 606 2% $6.7 $1,871 $9.7 $0.7 $1.1 $1.8 -$7.9 0.1840% 4.8 606 1% $8.5 $1,774 $12.3 $0.7 $1.4 $2.0 -$10.2 0.1750% 6.0 606 1% $10.2 $1,702 $14.6 $0.7 $1.6 $2.3 -$12.4 0.16
0.25
0.30
0.35
$10.0
$15.0
$20.0
Ratio
s
Total Cost $ Total Benefit $ Net Present Value B/C Ratio
0.00
0.05
0.10
0.15
0.20
0.25
0.30
0.35
‐$15.0
‐$10.0
‐$5.0
$0.0
$5.0
$10.0
$15.0
$20.0
0.0 1.0 2.0 3.0 4.0 5.0 6.0 7.0
Bene
fit to
Cost (B/C) Ratio
Millions of D
ollars
Capacity Increase (MW)
Total Cost $ Total Benefit $ Net Present Value B/C Ratio
A-10 FINAL - October 2010

Hydropower Modernization InitiativeAssessment of Potential Capacity Increases at Existing Hydropower Plants
Summary of Capacity Increase Benefits and CostsCrystal
Percent Capacity
Capacity Increase
Average Incremental
Energy
Total Incremental
Capacity
Construction & Mitigation Total Cost
Construction & Mitigation Total Cost
PV of Total Costs
PV of Energy
Benefits
PV of Capacity Benefits
PV of Total
Benefits
NPV of Total
Benefits B/CIncrease (MW) (MWh/yr) Factor ($M) ($/kW) ($M) ($M) ($M) ($M) ($M) Ratio
10% 3.2 4,306 16% $6.0 $1,918 $8.8 $4.6 $3.6 $8.2 -$0.6 0.9420% 6.3 7,862 14% $10.6 $1,687 $15.2 $8.5 $6.6 $15.1 -$0.1 0.9930% 9.5 10,950 13% $14.8 $1,567 $21.1 $11.8 $9.4 $21.2 $0.1 1.0040% 12.6 13,378 12% $18.7 $1,487 $26.5 $14.4 $11.7 $26.1 -$0.4 0.9850% 15.8 15,466 11% $22.5 $1,429 $31.7 $16.6 $13.7 $30.4 -$1.3 0.96
1.00
1.20
$25.0
$30.0
$35.0
Ratio
s
Total Cost $ Total Benefit $ Net Present Value B/C Ratio
0.00
0.20
0.40
0.60
0.80
1.00
1.20
‐$5.0
$0.0
$5.0
$10.0
$15.0
$20.0
$25.0
$30.0
$35.0
0.0 2.0 4.0 6.0 8.0 10.0 12.0 14.0 16.0 18.0
Bene
fit to
Cost (B/C) Ratio
Millions of D
ollars
Capacity Increase (MW)
Total Cost $ Total Benefit $ Net Present Value B/C Ratio
A-11 FINAL - October 2010

Hydropower Modernization InitiativeAssessment of Potential Capacity Increases at Existing Hydropower Plants
Summary of Capacity Increase Benefits and CostsDavis
Percent Capacity
Capacity Increase
Average Incremental
Energy
Total Incremental
Capacity
Construction & Mitigation Total Cost
Construction & Mitigation Total Cost
PV of Total Costs
PV of Energy
Benefits
PV of Capacity Benefits
PV of Total
Benefits
NPV of Total
Benefits B/CIncrease (MW) (MWh/yr) Factor ($M) ($/kW) ($M) ($M) ($M) ($M) ($M) Ratio
10% 25.5 15,784 7% $33.4 $1,311 $46.7 $19.6 $15.9 $35.5 -$11.1 0.7620% 51.0 24,770 6% $59.2 $1,161 $81.5 $30.8 $27.1 $57.9 -$23.6 0.7130% 76.5 30,034 4% $82.8 $1,082 $113.0 $37.3 $35.8 $73.2 -$39.8 0.6540% 102.0 34,096 4% $105.1 $1,030 $142.5 $42.4 $43.7 $86.1 -$56.4 0.6050% 127.5 36,470 3% $126.5 $992 $170.7 $45.4 $50.4 $95.7 -$74.9 0.56
0.60
0.70
0.80
$150.0
$200.0
Ratio
s
Total Cost $ Total Benefit $ Net Present Value B/C Ratio
0.00
0.10
0.20
0.30
0.40
0.50
0.60
0.70
0.80
‐$100.0
‐$50.0
$0.0
$50.0
$100.0
$150.0
$200.0
0.0 20.0 40.0 60.0 80.0 100.0 120.0 140.0
Bene
fit to
Cost (B/C) Ratio
Millions of D
ollars
Capacity Increase (MW)
Total Cost $ Total Benefit $ Net Present Value B/C Ratio
A-12 FINAL - October 2010

Hydropower Modernization InitiativeAssessment of Potential Capacity Increases at Existing Hydropower Plants
Summary of Capacity Increase Benefits and CostsDeer Creek
Percent Capacity
Capacity Increase
Average Incremental
Energy
Total Incremental
Capacity
Construction & Mitigation Total Cost
Construction & Mitigation Total Cost
PV of Total Costs
PV of Energy
Benefits
PV of Capacity Benefits
PV of Total
Benefits
NPV of Total
Benefits B/CIncrease (MW) (MWh/yr) Factor ($M) ($/kW) ($M) ($M) ($M) ($M) ($M) Ratio
10% 0.5 1,120 26% $1.4 $2,744 $2.0 $1.2 $0.9 $2.1 $0.1 1.0420% 1.0 1,913 22% $2.4 $2,393 $3.5 $2.1 $1.5 $3.6 $0.1 1.0330% 1.5 2,507 19% $3.3 $2,213 $4.8 $2.8 $2.0 $4.8 $0.0 0.9940% 2.0 2,981 17% $4.1 $2,094 $6.1 $3.3 $2.4 $5.7 -$0.3 0.9550% 2.5 3,372 16% $5.0 $2,008 $7.2 $3.7 $2.8 $6.5 -$0.7 0.90
1.00
1.20
$5.0
$6.0
$7.0
$8.0
Ratio
s
Total Cost $ Total Benefit $ Net Present Value B/C Ratio
0.00
0.20
0.40
0.60
0.80
1.00
1.20
‐$2.0
‐$1.0
$0.0
$1.0
$2.0
$3.0
$4.0
$5.0
$6.0
$7.0
$8.0
0.0 0.5 1.0 1.5 2.0 2.5 3.0
Bene
fit to
Cost (B/C) Ratio
Millions of D
ollars
Capacity Increase (MW)
Total Cost $ Total Benefit $ Net Present Value B/C Ratio
A-13 FINAL - October 2010
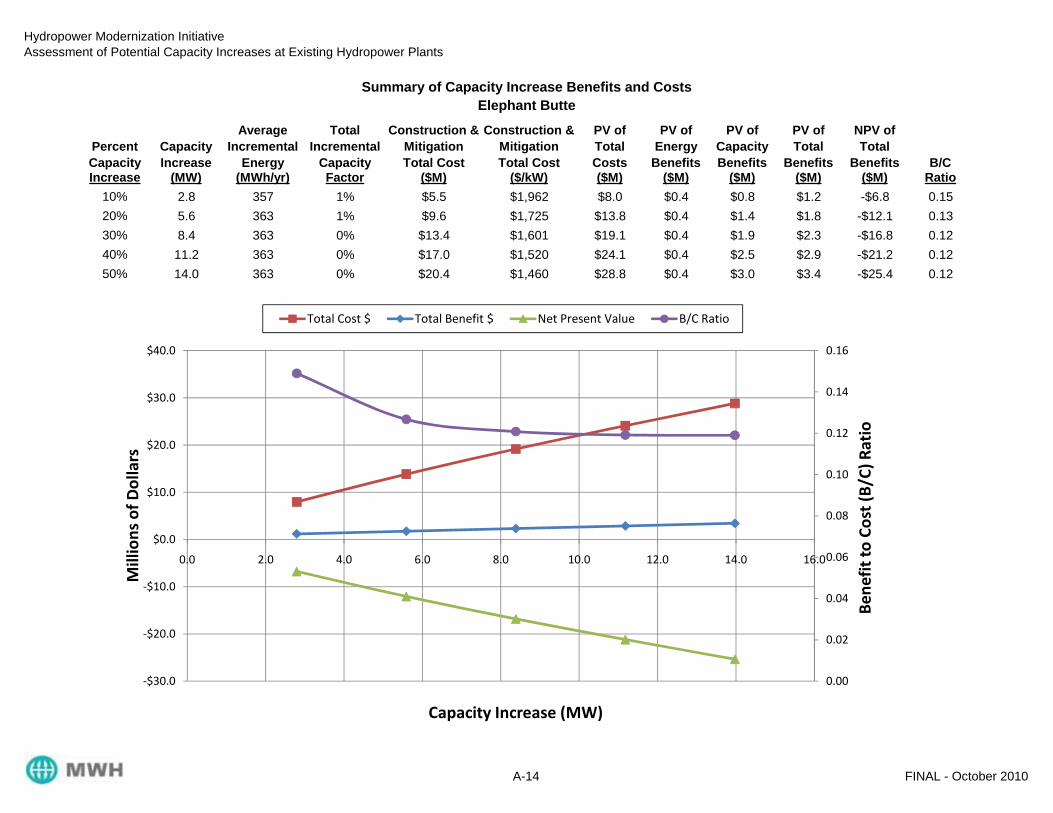
Hydropower Modernization InitiativeAssessment of Potential Capacity Increases at Existing Hydropower Plants
Summary of Capacity Increase Benefits and CostsElephant Butte
Percent Capacity
Capacity Increase
Average Incremental
Energy
Total Incremental
Capacity
Construction & Mitigation Total Cost
Construction & Mitigation Total Cost
PV of Total Costs
PV of Energy
Benefits
PV of Capacity Benefits
PV of Total
Benefits
NPV of Total
Benefits B/CIncrease (MW) (MWh/yr) Factor ($M) ($/kW) ($M) ($M) ($M) ($M) ($M) Ratio
10% 2.8 357 1% $5.5 $1,962 $8.0 $0.4 $0.8 $1.2 -$6.8 0.1520% 5.6 363 1% $9.6 $1,725 $13.8 $0.4 $1.4 $1.8 -$12.1 0.1330% 8.4 363 0% $13.4 $1,601 $19.1 $0.4 $1.9 $2.3 -$16.8 0.1240% 11.2 363 0% $17.0 $1,520 $24.1 $0.4 $2.5 $2.9 -$21.2 0.1250% 14.0 363 0% $20.4 $1,460 $28.8 $0.4 $3.0 $3.4 -$25.4 0.12
0.12
0.14
0.16
$20.0
$30.0
$40.0
Ratio
s
Total Cost $ Total Benefit $ Net Present Value B/C Ratio
0.00
0.02
0.04
0.06
0.08
0.10
0.12
0.14
0.16
‐$30.0
‐$20.0
‐$10.0
$0.0
$10.0
$20.0
$30.0
$40.0
0.0 2.0 4.0 6.0 8.0 10.0 12.0 14.0 16.0
Bene
fit to
Cost (B/C) Ratio
Millions of D
ollars
Capacity Increase (MW)
Total Cost $ Total Benefit $ Net Present Value B/C Ratio
A-14 FINAL - October 2010
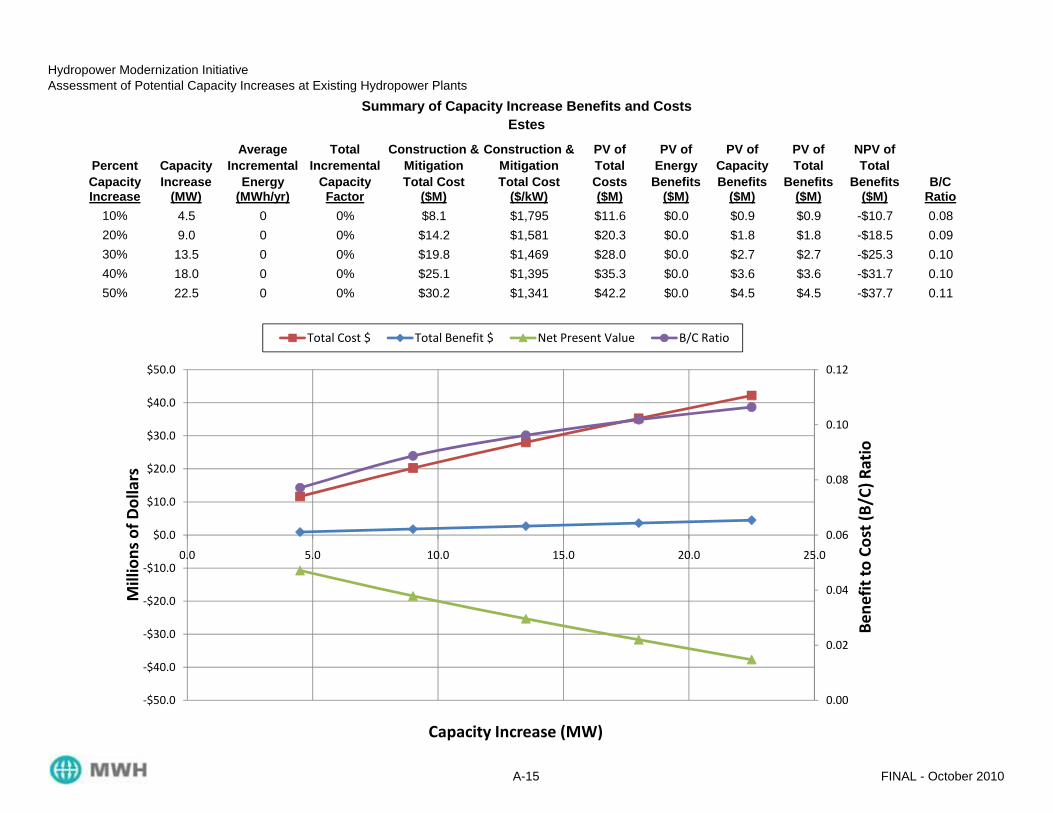
Hydropower Modernization InitiativeAssessment of Potential Capacity Increases at Existing Hydropower Plants
Summary of Capacity Increase Benefits and CostsEstes
Percent Capacity
Capacity Increase
Average Incremental
Energy
Total Incremental
Capacity
Construction & Mitigation Total Cost
Construction & Mitigation Total Cost
PV of Total Costs
PV of Energy
Benefits
PV of Capacity Benefits
PV of Total
Benefits
NPV of Total
Benefits B/CIncrease (MW) (MWh/yr) Factor ($M) ($/kW) ($M) ($M) ($M) ($M) ($M) Ratio
10% 4.5 0 0% $8.1 $1,795 $11.6 $0.0 $0.9 $0.9 -$10.7 0.0820% 9.0 0 0% $14.2 $1,581 $20.3 $0.0 $1.8 $1.8 -$18.5 0.0930% 13.5 0 0% $19.8 $1,469 $28.0 $0.0 $2.7 $2.7 -$25.3 0.1040% 18.0 0 0% $25.1 $1,395 $35.3 $0.0 $3.6 $3.6 -$31.7 0.1050% 22.5 0 0% $30.2 $1,341 $42.2 $0.0 $4.5 $4.5 -$37.7 0.11
0.08
0.10
0.12
$20.0
$30.0
$40.0
$50.0
) Ratio
ars
Total Cost $ Total Benefit $ Net Present Value B/C Ratio
0.00
0.02
0.04
0.06
0.08
0.10
0.12
‐$50.0
‐$40.0
‐$30.0
‐$20.0
‐$10.0
$0.0
$10.0
$20.0
$30.0
$40.0
$50.0
0.0 5.0 10.0 15.0 20.0 25.0
Bene
fit to
Cost (B/C) Ratio
Millions of D
ollars
Capacity Increase (MW)
Total Cost $ Total Benefit $ Net Present Value B/C Ratio
A-15 FINAL - October 2010

Hydropower Modernization InitiativeAssessment of Potential Capacity Increases at Existing Hydropower Plants
Summary of Capacity Increase Benefits and CostsFlaming Gorge
Percent Capacity
Capacity Increase
Average Incremental
Energy
Total Incremental
Capacity
Construction & Mitigation Total Cost
Construction & Mitigation Total Cost
PV of Total Costs
PV of Energy
Benefits
PV of Capacity Benefits
PV of Total
Benefits
NPV of Total
Benefits B/CIncrease (MW) (MWh/yr) Factor ($M) ($/kW) ($M) ($M) ($M) ($M) ($M) Ratio
10% 15.2 4,211 3% $21.8 $1,438 $30.8 $4.7 $5.9 $10.6 -$20.2 0.3420% 30.4 6,881 3% $38.6 $1,271 $53.7 $7.6 $10.8 $18.4 -$35.3 0.3430% 45.6 9,378 2% $54.0 $1,184 $74.4 $10.4 $15.5 $25.9 -$48.6 0.3540% 60.8 11,526 2% $68.5 $1,126 $93.8 $12.7 $20.0 $32.8 -$61.1 0.3550% 76.0 13,495 2% $82.3 $1,084 $112.3 $14.9 $24.4 $39.3 -$73.0 0.35
0.30
0.35
0.40
$100.0
$150.0
) Ratio
ars
Total Cost $ Total Benefit $ Net Present Value B/C Ratio
0.00
0.05
0.10
0.15
0.20
0.25
0.30
0.35
0.40
‐$100.0
‐$50.0
$0.0
$50.0
$100.0
$150.0
0.0 10.0 20.0 30.0 40.0 50.0 60.0 70.0 80.0
Bene
fit to
Cost (B/C) Ratio
Millions of D
ollars
Capacity Increase (MW)
Total Cost $ Total Benefit $ Net Present Value B/C Ratio
A-16 FINAL - October 2010

Hydropower Modernization InitiativeAssessment of Potential Capacity Increases at Existing Hydropower Plants
Summary of Capacity Increase Benefits and CostsFlatiron
Percent Capacity
Capacity Increase
Average Incremental
Energy
Total Incremental
Capacity
Construction & Mitigation Total Cost
Construction & Mitigation Total Cost
PV of Total Costs
PV of Energy
Benefits
PV of Capacity Benefits
PV of Total
Benefits
NPV of Total
Benefits B/CIncrease (MW) (MWh/yr) Factor ($M) ($/kW) ($M) ($M) ($M) ($M) ($M) Ratio
10% 8.1 0 0% $13.1 $1,610 $18.7 $0.0 $1.6 $1.6 -$17.0 0.0920% 16.3 0 0% $23.1 $1,421 $32.5 $0.0 $3.2 $3.2 -$29.3 0.1030% 24.4 0 0% $32.2 $1,322 $45.0 $0.0 $4.9 $4.9 -$40.1 0.1140% 32.5 0 0% $40.8 $1,256 $56.7 $0.0 $6.5 $6.5 -$50.2 0.1150% 40.6 0 0% $49.1 $1,208 $67.9 $0.0 $8.1 $8.1 -$59.7 0.12
0.10
0.12
0.14
$40.0
$60.0
$80.0
) Ratio
ars
Total Cost $ Total Benefit $ Net Present Value B/C Ratio
0.00
0.02
0.04
0.06
0.08
0.10
0.12
0.14
‐$80.0
‐$60.0
‐$40.0
‐$20.0
$0.0
$20.0
$40.0
$60.0
$80.0
0.0 5.0 10.0 15.0 20.0 25.0 30.0 35.0 40.0 45.0
Bene
fit to
Cost (B/C) Ratio
Millions of D
ollars
Capacity Increase (MW)
Total Cost $ Total Benefit $ Net Present Value B/C Ratio
A-17 FINAL - October 2010

Hydropower Modernization InitiativeAssessment of Potential Capacity Increases at Existing Hydropower Plants
Summary of Capacity Increase Benefits and CostsFolsom
Percent Capacity
Capacity Increase
Average Incremental
Energy
Total Incremental
Capacity
Construction & Mitigation Total Cost
Construction & Mitigation Total Cost
PV of Total Costs
PV of Energy
Benefits
PV of Capacity Benefits
PV of Total
Benefits
NPV of Total
Benefits B/CIncrease (MW) (MWh/yr) Factor ($M) ($/kW) ($M) ($M) ($M) ($M) ($M) Ratio
10% 20.7 12,591 7% $28.2 $1,361 $39.5 $22.5 $12.7 $35.3 -$4.2 0.8920% 41.4 23,579 7% $49.8 $1,204 $68.9 $42.2 $24.4 $66.6 -$2.3 0.9730% 62.1 32,607 6% $69.7 $1,122 $95.5 $58.4 $34.7 $93.1 -$2.4 0.9740% 82.8 40,555 6% $88.4 $1,068 $120.4 $72.6 $44.3 $116.8 -$3.6 0.9750% 103.5 47,195 5% $106.4 $1,028 $144.2 $84.5 $52.9 $137.4 -$6.8 0.95
0.80
1.00
1.20
$100.0
$120.0
$140.0
$160.0
) Ratio
ars
Total Cost $ Total Benefit $ Net Present Value B/C Ratio
0.00
0.20
0.40
0.60
0.80
1.00
1.20
‐$20.0
$0.0
$20.0
$40.0
$60.0
$80.0
$100.0
$120.0
$140.0
$160.0
0.0 20.0 40.0 60.0 80.0 100.0 120.0
Bene
fit to
Cost (B/C) Ratio
Millions of D
ollars
Capacity Increase (MW)
Total Cost $ Total Benefit $ Net Present Value B/C Ratio
A-18 FINAL - October 2010

Hydropower Modernization InitiativeAssessment of Potential Capacity Increases at Existing Hydropower Plants
Summary of Capacity Increase Benefits and CostsFontenelle
Percent Capacity
Capacity Increase
Average Incremental
Energy
Total Incremental
Capacity
Construction & Mitigation Total Cost
Construction & Mitigation Total Cost
PV of Total Costs
PV of Energy
Benefits
PV of Capacity Benefits
PV of Total
Benefits
NPV of Total
Benefits B/CIncrease (MW) (MWh/yr) Factor ($M) ($/kW) ($M) ($M) ($M) ($M) ($M) Ratio
10% 1.0 884 10% $2.4 $2,388 $3.5 $0.8 $0.8 $1.6 -$1.9 0.4720% 2.0 1,595 9% $4.2 $2,090 $6.1 $1.5 $1.5 $3.0 -$3.1 0.4930% 3.0 2,296 9% $5.8 $1,936 $8.4 $2.2 $2.2 $4.4 -$4.1 0.5240% 4.0 3,050 9% $7.3 $1,835 $10.6 $2.9 $2.9 $5.8 -$4.8 0.5550% 5.0 3,824 9% $8.8 $1,760 $12.7 $3.7 $3.6 $7.3 -$5.4 0.57
0.50
0.60
0.70
$6 0
$8.0
$10.0
$12.0
$14.0
) Ratio
ars
Total Cost $ Total Benefit $ Net Present Value B/C Ratio
0.00
0.10
0.20
0.30
0.40
0.50
0.60
0.70
‐$8.0
‐$6.0
‐$4.0
‐$2.0
$0.0
$2.0
$4.0
$6.0
$8.0
$10.0
$12.0
$14.0
0.0 1.0 2.0 3.0 4.0 5.0 6.0
Bene
fit to
Cost (B/C) Ratio
Millions of D
ollars
Capacity Increase (MW)
Total Cost $ Total Benefit $ Net Present Value B/C Ratio
A-19 FINAL - October 2010
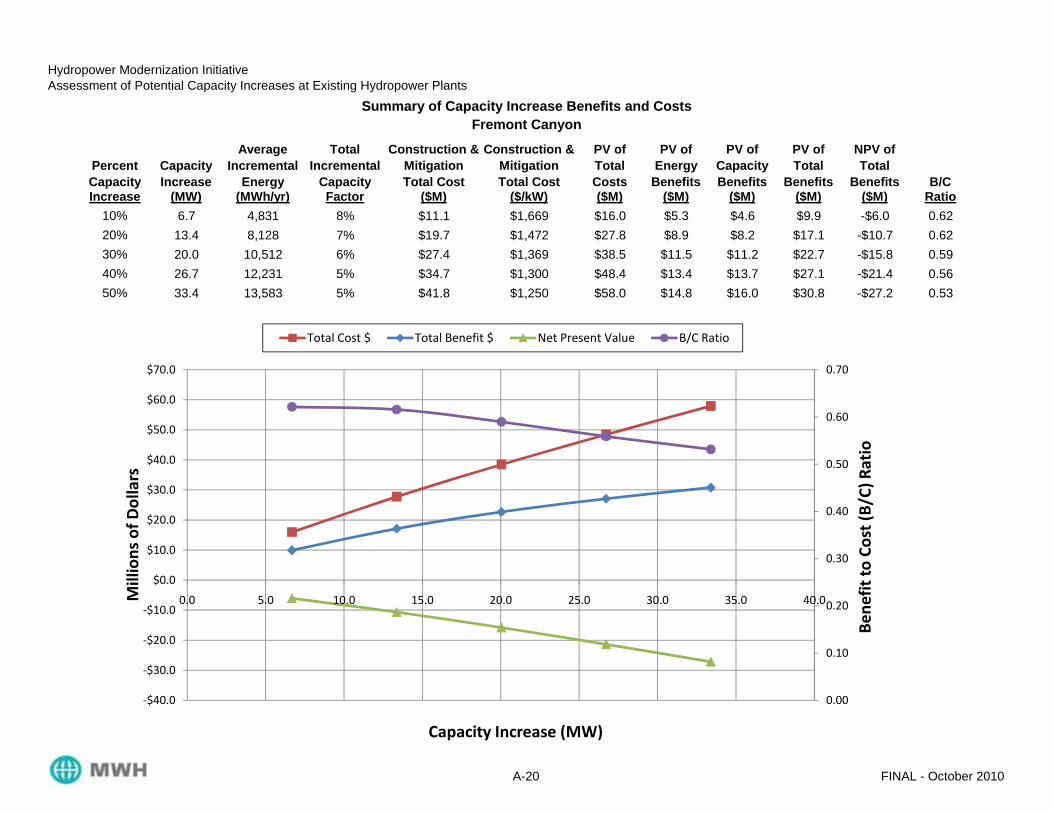
Hydropower Modernization InitiativeAssessment of Potential Capacity Increases at Existing Hydropower Plants
Summary of Capacity Increase Benefits and CostsFremont Canyon
Percent Capacity
Capacity Increase
Average Incremental
Energy
Total Incremental
Capacity
Construction & Mitigation Total Cost
Construction & Mitigation Total Cost
PV of Total Costs
PV of Energy
Benefits
PV of Capacity Benefits
PV of Total
Benefits
NPV of Total
Benefits B/CIncrease (MW) (MWh/yr) Factor ($M) ($/kW) ($M) ($M) ($M) ($M) ($M) Ratio
10% 6.7 4,831 8% $11.1 $1,669 $16.0 $5.3 $4.6 $9.9 -$6.0 0.6220% 13.4 8,128 7% $19.7 $1,472 $27.8 $8.9 $8.2 $17.1 -$10.7 0.6230% 20.0 10,512 6% $27.4 $1,369 $38.5 $11.5 $11.2 $22.7 -$15.8 0.5940% 26.7 12,231 5% $34.7 $1,300 $48.4 $13.4 $13.7 $27.1 -$21.4 0.5650% 33.4 13,583 5% $41.8 $1,250 $58.0 $14.8 $16.0 $30.8 -$27.2 0.53
0.50
0.60
0.70
$30 0
$40.0
$50.0
$60.0
$70.0
) Ratio
ars
Total Cost $ Total Benefit $ Net Present Value B/C Ratio
0.00
0.10
0.20
0.30
0.40
0.50
0.60
0.70
‐$40.0
‐$30.0
‐$20.0
‐$10.0
$0.0
$10.0
$20.0
$30.0
$40.0
$50.0
$60.0
$70.0
0.0 5.0 10.0 15.0 20.0 25.0 30.0 35.0 40.0
Bene
fit to
Cost (B/C) Ratio
Millions of D
ollars
Capacity Increase (MW)
Total Cost $ Total Benefit $ Net Present Value B/C Ratio
A-20 FINAL - October 2010

Hydropower Modernization InitiativeAssessment of Potential Capacity Increases at Existing Hydropower Plants
Summary of Capacity Increase Benefits and CostsGlen Canyon
Percent Capacity
Capacity Increase
Average Incremental
Energy
Total Incremental
Capacity
Construction & Mitigation Total Cost
Construction & Mitigation Total Cost
PV of Total Costs
PV of Energy
Benefits
PV of Capacity Benefits
PV of Total
Benefits
NPV of Total
Benefits B/CIncrease (MW) (MWh/yr) Factor ($M) ($/kW) ($M) ($M) ($M) ($M) ($M) Ratio
10% 132.0 23,719 2% $130.2 $986 $175.5 $29.5 $42.6 $72.1 -$103.4 0.4120% 264.0 50,969 2% $231.7 $878 $307.7 $63.4 $87.5 $150.9 -$156.7 0.4930% 396.0 71,082 2% $324.9 $820 $427.6 $88.4 $127.6 $216.0 -$211.5 0.5140% 528.0 86,174 2% $413.2 $783 $540.3 $107.2 $164.3 $271.5 -$268.8 0.5050% 660.0 94,012 2% $498.0 $755 $647.9 $116.9 $196.0 $312.9 -$334.9 0.48
0.40
0.50
0.60
$400.0
$600.0
$800.0
) Ratio
ars
Total Cost $ Total Benefit $ Net Present Value B/C Ratio
0.00
0.10
0.20
0.30
0.40
0.50
0.60
‐$400.0
‐$200.0
$0.0
$200.0
$400.0
$600.0
$800.0
0.0 100.0 200.0 300.0 400.0 500.0 600.0 700.0
Bene
fit to
Cost (B/C) Ratio
Millions of D
ollars
Capacity Increase (MW)
Total Cost $ Total Benefit $ Net Present Value B/C Ratio
A-21 FINAL - October 2010

Hydropower Modernization InitiativeAssessment of Potential Capacity Increases at Existing Hydropower Plants
Summary of Capacity Increase Benefits and CostsGlendo
Percent Capacity
Capacity Increase
Average Incremental
Energy
Total Incremental
Capacity
Construction & Mitigation Total Cost
Construction & Mitigation Total Cost
PV of Total Costs
PV of Energy
Benefits
PV of Capacity Benefits
PV of Total
Benefits
NPV of Total
Benefits B/CIncrease (MW) (MWh/yr) Factor ($M) ($/kW) ($M) ($M) ($M) ($M) ($M) Ratio
10% 3.8 4,425 13% $7.0 $1,852 $10.2 $3.6 $3.8 $7.4 -$2.8 0.7320% 7.6 7,585 11% $12.4 $1,630 $17.7 $6.2 $6.7 $12.9 -$4.8 0.7330% 11.4 9,144 9% $17.3 $1,514 $24.5 $7.5 $8.5 $16.0 -$8.5 0.6540% 15.2 10,169 8% $21.9 $1,438 $30.8 $8.3 $10.0 $18.3 -$12.5 0.5950% 19.0 11,105 7% $26.2 $1,382 $36.8 $9.1 $11.4 $20.5 -$16.4 0.56
0.60
0.70
0.80
$20.0
$30.0
$40.0
) Ratio
ars
Total Cost $ Total Benefit $ Net Present Value B/C Ratio
0.00
0.10
0.20
0.30
0.40
0.50
0.60
0.70
0.80
‐$20.0
‐$10.0
$0.0
$10.0
$20.0
$30.0
$40.0
0.0 2.0 4.0 6.0 8.0 10.0 12.0 14.0 16.0 18.0 20.0
Bene
fit to
Cost (B/C) Ratio
Millions of D
ollars
Capacity Increase (MW)
Total Cost $ Total Benefit $ Net Present Value B/C Ratio
A-22 FINAL - October 2010
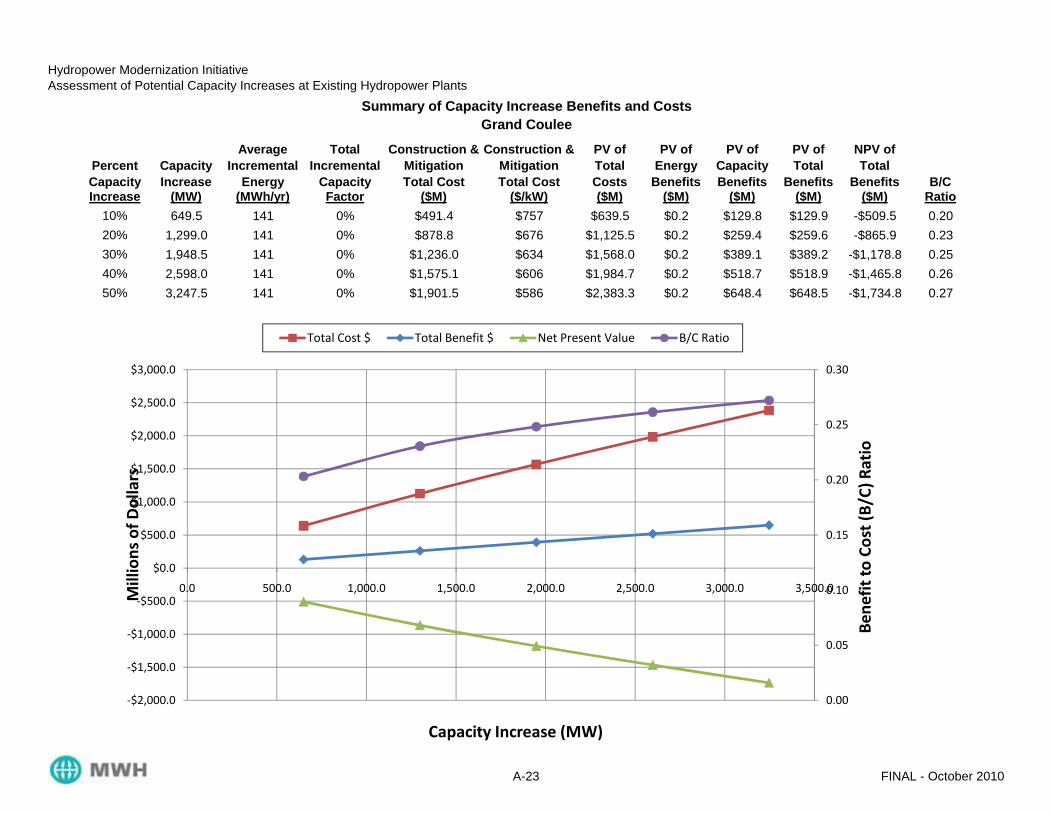
Hydropower Modernization InitiativeAssessment of Potential Capacity Increases at Existing Hydropower Plants
Summary of Capacity Increase Benefits and CostsGrand Coulee
Percent Capacity
Capacity Increase
Average Incremental
Energy
Total Incremental
Capacity
Construction & Mitigation Total Cost
Construction & Mitigation Total Cost
PV of Total Costs
PV of Energy
Benefits
PV of Capacity Benefits
PV of Total
Benefits
NPV of Total
Benefits B/CIncrease (MW) (MWh/yr) Factor ($M) ($/kW) ($M) ($M) ($M) ($M) ($M) Ratio
10% 649.5 141 0% $491.4 $757 $639.5 $0.2 $129.8 $129.9 -$509.5 0.2020% 1,299.0 141 0% $878.8 $676 $1,125.5 $0.2 $259.4 $259.6 -$865.9 0.2330% 1,948.5 141 0% $1,236.0 $634 $1,568.0 $0.2 $389.1 $389.2 -$1,178.8 0.2540% 2,598.0 141 0% $1,575.1 $606 $1,984.7 $0.2 $518.7 $518.9 -$1,465.8 0.2650% 3,247.5 141 0% $1,901.5 $586 $2,383.3 $0.2 $648.4 $648.5 -$1,734.8 0.27
0.20
0.25
0.30
$1,500.0
$2,000.0
$2,500.0
$3,000.0
) Ratio
ars
Total Cost $ Total Benefit $ Net Present Value B/C Ratio
0.00
0.05
0.10
0.15
0.20
0.25
0.30
‐$2,000.0
‐$1,500.0
‐$1,000.0
‐$500.0
$0.0
$500.0
$1,000.0
$1,500.0
$2,000.0
$2,500.0
$3,000.0
0.0 500.0 1,000.0 1,500.0 2,000.0 2,500.0 3,000.0 3,500.0
Bene
fit to
Cost (B/C) Ratio
Millions of D
ollars
Capacity Increase (MW)
Total Cost $ Total Benefit $ Net Present Value B/C Ratio
A-23 FINAL - October 2010

Hydropower Modernization InitiativeAssessment of Potential Capacity Increases at Existing Hydropower Plants
Summary of Capacity Increase Benefits and CostsGreen Mountain
Percent Capacity
Capacity Increase
Average Incremental
Energy
Total Incremental
Capacity
Construction & Mitigation Total Cost
Construction & Mitigation Total Cost
PV of Total Costs
PV of Energy
Benefits
PV of Capacity Benefits
PV of Total
Benefits
NPV of Total
Benefits B/CIncrease (MW) (MWh/yr) Factor ($M) ($/kW) ($M) ($M) ($M) ($M) ($M) Ratio
10% 2.6 540 2% $5.2 $1,989 $7.5 $0.6 $0.9 $1.5 -$6.0 0.2020% 5.2 1,003 2% $9.1 $1,748 $13.1 $1.1 $1.7 $2.8 -$10.2 0.2230% 7.8 1,415 2% $12.7 $1,622 $18.1 $1.6 $2.5 $4.1 -$14.0 0.2340% 10.4 1,762 2% $16.0 $1,540 $22.7 $2.0 $3.3 $5.3 -$17.5 0.2350% 13.0 2,065 2% $19.2 $1,479 $27.2 $2.3 $4.0 $6.3 -$20.9 0.23
0.20
0.25
$10.0
$20.0
$30.0
) Ratio
ars
Total Cost $ Total Benefit $ Net Present Value B/C Ratio
0.00
0.05
0.10
0.15
0.20
0.25
‐$30.0
‐$20.0
‐$10.0
$0.0
$10.0
$20.0
$30.0
0.0 2.0 4.0 6.0 8.0 10.0 12.0 14.0
Bene
fit to
Cost (B/C) Ratio
Millions of D
ollars
Capacity Increase (MW)
Total Cost $ Total Benefit $ Net Present Value B/C Ratio
A-24 FINAL - October 2010

Hydropower Modernization InitiativeAssessment of Potential Capacity Increases at Existing Hydropower Plants
Summary of Capacity Increase Benefits and CostsGreen Springs
Percent Capacity
Capacity Increase
Average Incremental
Energy
Total Incremental
Capacity
Construction & Mitigation Total Cost
Construction & Mitigation Total Cost
PV of Total Costs
PV of Energy
Benefits
PV of Capacity Benefits
PV of Total
Benefits
NPV of Total
Benefits B/CIncrease (MW) (MWh/yr) Factor ($M) ($/kW) ($M) ($M) ($M) ($M) ($M) Ratio
10% 1.7 0 0% $3.7 $2,149 $5.4 $0.0 $0.3 $0.3 -$5.1 0.0620% 3.5 0 0% $6.5 $1,885 $9.4 $0.0 $0.7 $0.7 -$8.8 0.0730% 5.2 0 0% $9.1 $1,748 $13.0 $0.0 $1.0 $1.0 -$12.0 0.0840% 6.9 0 0% $11.5 $1,658 $16.4 $0.0 $1.4 $1.4 -$15.0 0.0850% 8.6 0 0% $13.8 $1,592 $19.6 $0.0 $1.7 $1.7 -$17.9 0.09
0.07
0.08
0.09
0.10
$10.0
$15.0
$20.0
$25.0
) Ratio
ars
Total Cost $ Total Benefit $ Net Present Value B/C Ratio
0.00
0.01
0.02
0.03
0.04
0.05
0.06
0.07
0.08
0.09
0.10
‐$20.0
‐$15.0
‐$10.0
‐$5.0
$0.0
$5.0
$10.0
$15.0
$20.0
$25.0
0.0 1.0 2.0 3.0 4.0 5.0 6.0 7.0 8.0 9.0 10.0
Bene
fit to
Cost (B/C) Ratio
Millions of D
ollars
Capacity Increase (MW)
Total Cost $ Total Benefit $ Net Present Value B/C Ratio
A-25 FINAL - October 2010

Hydropower Modernization InitiativeAssessment of Potential Capacity Increases at Existing Hydropower Plants
Summary of Capacity Increase Benefits and CostsGuernsey
Percent Capacity
Capacity Increase
Average Incremental
Energy
Total Incremental
Capacity
Construction & Mitigation Total Cost
Construction & Mitigation Total Cost
PV of Total Costs
PV of Energy
Benefits
PV of Capacity Benefits
PV of Total
Benefits
NPV of Total
Benefits B/CIncrease (MW) (MWh/yr) Factor ($M) ($/kW) ($M) ($M) ($M) ($M) ($M) Ratio
10% 0.6 1,830 33% $1.7 $2,607 $2.5 $1.5 $1.3 $2.8 $0.3 1.1320% 1.3 3,599 32% $2.9 $2,277 $4.3 $2.9 $2.6 $5.5 $1.3 1.2930% 1.9 5,325 32% $4.0 $2,107 $5.9 $4.3 $3.9 $8.2 $2.3 1.3940% 2.6 7,011 31% $5.1 $1,995 $7.4 $5.7 $5.2 $10.9 $3.5 1.4750% 3.2 8,673 31% $6.1 $1,913 $8.9 $7.1 $6.4 $13.5 $4.6 1.52
1.20
1.40
1.60
$12.0
$14.0
$16.0
) Ratio
ars
Total Cost $ Total Benefit $ Net Present Value B/C Ratio
0.00
0.20
0.40
0.60
0.80
1.00
1.20
1.40
1.60
$0.0
$2.0
$4.0
$6.0
$8.0
$10.0
$12.0
$14.0
$16.0
0.0 0.5 1.0 1.5 2.0 2.5 3.0 3.5
Bene
fit to
Cost (B/C) Ratio
Millions of D
ollars
Capacity Increase (MW)
Total Cost $ Total Benefit $ Net Present Value B/C Ratio
A-26 FINAL - October 2010
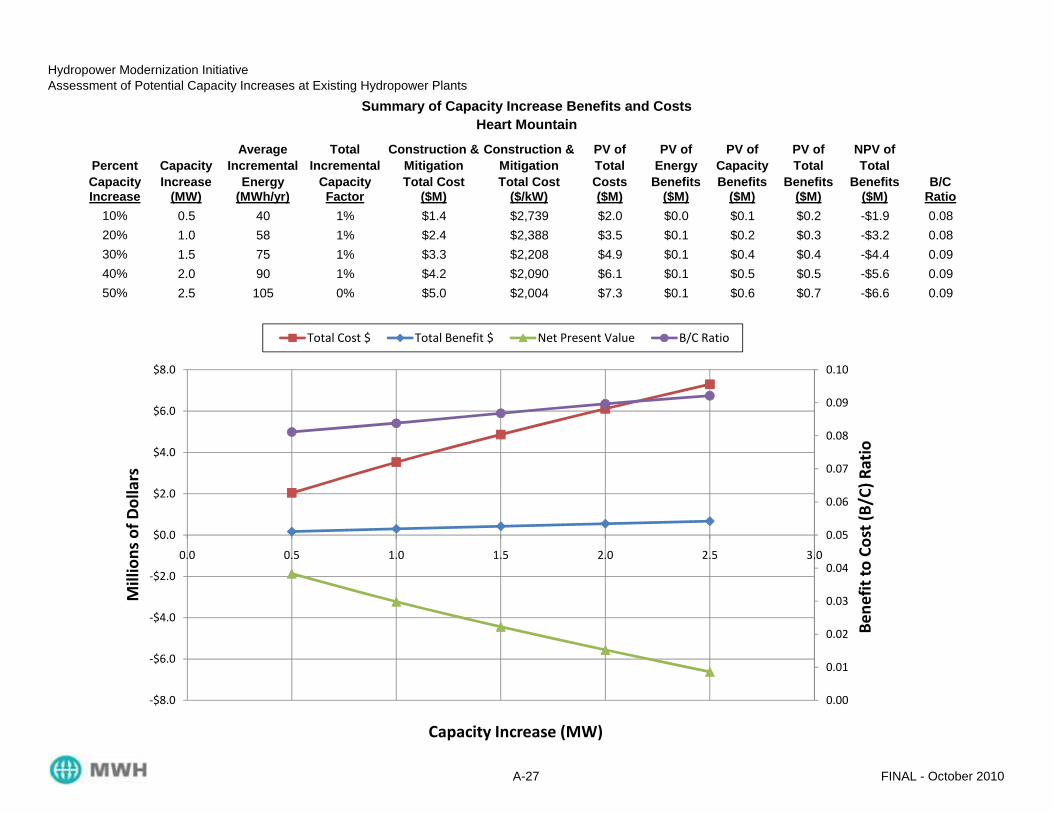
Hydropower Modernization InitiativeAssessment of Potential Capacity Increases at Existing Hydropower Plants
Summary of Capacity Increase Benefits and CostsHeart Mountain
Percent Capacity
Capacity Increase
Average Incremental
Energy
Total Incremental
Capacity
Construction & Mitigation Total Cost
Construction & Mitigation Total Cost
PV of Total Costs
PV of Energy
Benefits
PV of Capacity Benefits
PV of Total
Benefits
NPV of Total
Benefits B/CIncrease (MW) (MWh/yr) Factor ($M) ($/kW) ($M) ($M) ($M) ($M) ($M) Ratio
10% 0.5 40 1% $1.4 $2,739 $2.0 $0.0 $0.1 $0.2 -$1.9 0.0820% 1.0 58 1% $2.4 $2,388 $3.5 $0.1 $0.2 $0.3 -$3.2 0.0830% 1.5 75 1% $3.3 $2,208 $4.9 $0.1 $0.4 $0.4 -$4.4 0.0940% 2.0 90 1% $4.2 $2,090 $6.1 $0.1 $0.5 $0.5 -$5.6 0.0950% 2.5 105 0% $5.0 $2,004 $7.3 $0.1 $0.6 $0.7 -$6.6 0.09
0.07
0.08
0.09
0.10
$4.0
$6.0
$8.0
) Ratio
ars
Total Cost $ Total Benefit $ Net Present Value B/C Ratio
0.00
0.01
0.02
0.03
0.04
0.05
0.06
0.07
0.08
0.09
0.10
‐$8.0
‐$6.0
‐$4.0
‐$2.0
$0.0
$2.0
$4.0
$6.0
$8.0
0.0 0.5 1.0 1.5 2.0 2.5 3.0
Bene
fit to
Cost (B/C) Ratio
Millions of D
ollars
Capacity Increase (MW)
Total Cost $ Total Benefit $ Net Present Value B/C Ratio
A-27 FINAL - October 2010

Hydropower Modernization InitiativeAssessment of Potential Capacity Increases at Existing Hydropower Plants
Summary of Capacity Increase Benefits and CostsHoover
Percent Capacity
Capacity Increase
Average Incremental
Energy
Total Incremental
Capacity
Construction & Mitigation Total Cost
Construction & Mitigation Total Cost
PV of Total Costs
PV of Energy
Benefits
PV of Capacity Benefits
PV of Total
Benefits
NPV of Total
Benefits B/CIncrease (MW) (MWh/yr) Factor ($M) ($/kW) ($M) ($M) ($M) ($M) ($M) Ratio
10% 207.9 0 0% $189.9 $913 $253.5 $0.0 $41.5 $41.5 -$212.0 0.1620% 415.8 0 0% $338.4 $814 $444.8 $0.0 $83.0 $83.0 -$361.8 0.1930% 623.6 0 0% $474.9 $762 $618.6 $0.0 $124.5 $124.5 -$494.2 0.2040% 831.5 0 0% $604.3 $727 $782.0 $0.0 $166.0 $166.0 -$616.0 0.2150% 1,039.4 0 0% $728.7 $701 $938.2 $0.0 $207.5 $207.5 -$730.7 0.22
0.20
0.25
$400 0
$600.0
$800.0
$1,000.0
$1,200.0
) Ratio
ars
Total Cost $ Total Benefit $ Net Present Value B/C Ratio
0.00
0.05
0.10
0.15
0.20
0.25
‐$1,000.0
‐$800.0
‐$600.0
‐$400.0
‐$200.0
$0.0
$200.0
$400.0
$600.0
$800.0
$1,000.0
$1,200.0
0.0 200.0 400.0 600.0 800.0 1,000.0 1,200.0
Bene
fit to
Cost (B/C) Ratio
Millions of D
ollars
Capacity Increase (MW)
Total Cost $ Total Benefit $ Net Present Value B/C Ratio
A-28 FINAL - October 2010

Hydropower Modernization InitiativeAssessment of Potential Capacity Increases at Existing Hydropower Plants
Summary of Capacity Increase Benefits and CostsHungry Horse
Percent Capacity
Capacity Increase
Average Incremental
Energy
Total Incremental
Capacity
Construction & Mitigation Total Cost
Construction & Mitigation Total Cost
PV of Total Costs
PV of Energy
Benefits
PV of Capacity Benefits
PV of Total
Benefits
NPV of Total
Benefits B/CIncrease (MW) (MWh/yr) Factor ($M) ($/kW) ($M) ($M) ($M) ($M) ($M) Ratio
10% 42.8 1,198 0% $51.2 $1,197 $70.7 $1.5 $9.4 $10.9 -$59.9 0.1520% 85.6 2,103 0% $90.9 $1,062 $123.7 $2.6 $18.5 $21.2 -$102.5 0.1730% 128.4 2,850 0% $127.2 $991 $171.6 $3.6 $27.6 $31.2 -$140.5 0.1840% 171.2 3,173 0% $161.5 $944 $216.6 $4.0 $36.3 $40.3 -$176.3 0.1950% 214.0 3,173 0% $194.5 $909 $259.5 $4.0 $44.9 $48.9 -$210.6 0.19
0.14
0.16
0.18
0.20
$100.0
$200.0
$300.0
) Ratio
ars
Total Cost $ Total Benefit $ Net Present Value B/C Ratio
0.00
0.02
0.04
0.06
0.08
0.10
0.12
0.14
0.16
0.18
0.20
‐$300.0
‐$200.0
‐$100.0
$0.0
$100.0
$200.0
$300.0
0.0 50.0 100.0 150.0 200.0 250.0
Bene
fit to
Cost (B/C) Ratio
Millions of D
ollars
Capacity Increase (MW)
Total Cost $ Total Benefit $ Net Present Value B/C Ratio
A-29 FINAL - October 2010

Hydropower Modernization InitiativeAssessment of Potential Capacity Increases at Existing Hydropower Plants
Summary of Capacity Increase Benefits and CostsJudge Francis Carr
Percent Capacity
Capacity Increase
Average Incremental
Energy
Total Incremental
Capacity
Construction & Mitigation Total Cost
Construction & Mitigation Total Cost
PV of Total Costs
PV of Energy
Benefits
PV of Capacity Benefits
PV of Total
Benefits
NPV of Total
Benefits B/CIncrease (MW) (MWh/yr) Factor ($M) ($/kW) ($M) ($M) ($M) ($M) ($M) Ratio
10% 15.4 4,476 3% $22.1 $1,434 $31.2 $8.0 $6.1 $14.2 -$17.0 0.4520% 30.9 5,028 2% $39.1 $1,268 $54.4 $9.0 $9.6 $18.6 -$35.8 0.3430% 46.3 5,054 1% $54.7 $1,181 $75.4 $9.0 $12.7 $21.7 -$53.6 0.2940% 61.8 5,054 1% $69.4 $1,123 $95.1 $9.0 $15.8 $24.8 -$70.2 0.2650% 77.2 5,054 1% $83.4 $1,081 $113.8 $9.0 $18.9 $27.9 -$85.9 0.25
0.35
0.40
0.45
0.50
$100.0
$150.0
) Ratio
ars
Total Cost $ Total Benefit $ Net Present Value B/C Ratio
0.00
0.05
0.10
0.15
0.20
0.25
0.30
0.35
0.40
0.45
0.50
‐$100.0
‐$50.0
$0.0
$50.0
$100.0
$150.0
0.0 10.0 20.0 30.0 40.0 50.0 60.0 70.0 80.0 90.0
Bene
fit to
Cost (B/C) Ratio
Millions of D
ollars
Capacity Increase (MW)
Total Cost $ Total Benefit $ Net Present Value B/C Ratio
A-30 FINAL - October 2010
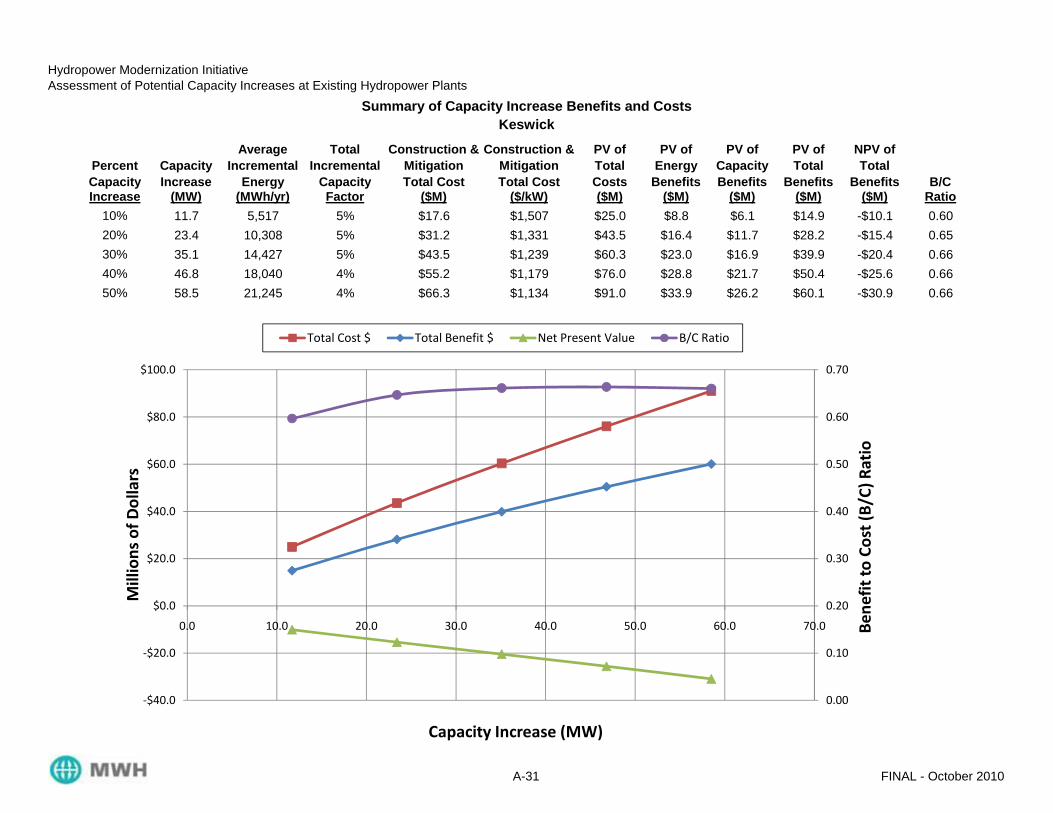
Hydropower Modernization InitiativeAssessment of Potential Capacity Increases at Existing Hydropower Plants
Summary of Capacity Increase Benefits and CostsKeswick
Percent Capacity
Capacity Increase
Average Incremental
Energy
Total Incremental
Capacity
Construction & Mitigation Total Cost
Construction & Mitigation Total Cost
PV of Total Costs
PV of Energy
Benefits
PV of Capacity Benefits
PV of Total
Benefits
NPV of Total
Benefits B/CIncrease (MW) (MWh/yr) Factor ($M) ($/kW) ($M) ($M) ($M) ($M) ($M) Ratio
10% 11.7 5,517 5% $17.6 $1,507 $25.0 $8.8 $6.1 $14.9 -$10.1 0.6020% 23.4 10,308 5% $31.2 $1,331 $43.5 $16.4 $11.7 $28.2 -$15.4 0.6530% 35.1 14,427 5% $43.5 $1,239 $60.3 $23.0 $16.9 $39.9 -$20.4 0.6640% 46.8 18,040 4% $55.2 $1,179 $76.0 $28.8 $21.7 $50.4 -$25.6 0.6650% 58.5 21,245 4% $66.3 $1,134 $91.0 $33.9 $26.2 $60.1 -$30.9 0.66
0.50
0.60
0.70
$60.0
$80.0
$100.0
) Ratio
ars
Total Cost $ Total Benefit $ Net Present Value B/C Ratio
0.00
0.10
0.20
0.30
0.40
0.50
0.60
0.70
‐$40.0
‐$20.0
$0.0
$20.0
$40.0
$60.0
$80.0
$100.0
0.0 10.0 20.0 30.0 40.0 50.0 60.0 70.0 Bene
fit to
Cost (B/C) Ratio
Millions of D
ollars
Capacity Increase (MW)
Total Cost $ Total Benefit $ Net Present Value B/C Ratio
A-31 FINAL - October 2010

Hydropower Modernization InitiativeAssessment of Potential Capacity Increases at Existing Hydropower Plants
Summary of Capacity Increase Benefits and CostsKortes
Percent Capacity
Capacity Increase
Average Incremental
Energy
Total Incremental
Capacity
Construction & Mitigation Total Cost
Construction & Mitigation Total Cost
PV of Total Costs
PV of Energy
Benefits
PV of Capacity Benefits
PV of Total
Benefits
NPV of Total
Benefits B/CIncrease (MW) (MWh/yr) Factor ($M) ($/kW) ($M) ($M) ($M) ($M) ($M) Ratio
10% 3.6 1,236 4% $6.7 $1,871 $9.7 $1.3 $1.6 $2.8 -$6.9 0.2920% 7.2 2,248 4% $11.9 $1,646 $16.9 $2.3 $3.0 $5.3 -$11.6 0.3130% 10.8 3,104 3% $16.5 $1,529 $23.4 $3.2 $4.3 $7.5 -$15.9 0.3240% 14.4 3,864 3% $20.9 $1,452 $29.5 $4.0 $5.5 $9.5 -$20.0 0.3250% 18.0 4,594 3% $25.1 $1,395 $35.3 $4.8 $6.7 $11.5 -$23.8 0.33
0.25
0.30
0.35
$20.0
$30.0
$40.0
) Ratio
ars
Total Cost $ Total Benefit $ Net Present Value B/C Ratio
0.00
0.05
0.10
0.15
0.20
0.25
0.30
0.35
‐$30.0
‐$20.0
‐$10.0
$0.0
$10.0
$20.0
$30.0
$40.0
0.0 2.0 4.0 6.0 8.0 10.0 12.0 14.0 16.0 18.0 20.0
Bene
fit to
Cost (B/C) Ratio
Millions of D
ollars
Capacity Increase (MW)
Total Cost $ Total Benefit $ Net Present Value B/C Ratio
A-32 FINAL - October 2010

Hydropower Modernization InitiativeAssessment of Potential Capacity Increases at Existing Hydropower Plants
Summary of Capacity Increase Benefits and CostsLower Molina
Percent Capacity
Capacity Increase
Average Incremental
Energy
Total Incremental
Capacity
Construction & Mitigation Total Cost
Construction & Mitigation Total Cost
PV of Total Costs
PV of Energy
Benefits
PV of Capacity Benefits
PV of Total
Benefits
NPV of Total
Benefits B/CIncrease (MW) (MWh/yr) Factor ($M) ($/kW) ($M) ($M) ($M) ($M) ($M) Ratio
10% 0.5 31 1% $1.3 $2,754 $2.0 $0.0 $0.1 $0.2 -$1.8 0.0820% 1.0 57 1% $2.3 $2,402 $3.4 $0.1 $0.2 $0.3 -$3.1 0.0930% 1.5 83 1% $3.2 $2,220 $4.8 $0.1 $0.3 $0.5 -$4.3 0.0940% 1.9 108 1% $4.1 $2,102 $6.0 $0.1 $0.5 $0.6 -$5.4 0.1050% 2.4 133 1% $4.9 $2,014 $7.1 $0.2 $0.6 $0.7 -$6.4 0.10
0.08
0.10
0.12
$4.0
$6.0
$8.0
) Ratio
ars
Total Cost $ Total Benefit $ Net Present Value B/C Ratio
0.00
0.02
0.04
0.06
0.08
0.10
0.12
‐$8.0
‐$6.0
‐$4.0
‐$2.0
$0.0
$2.0
$4.0
$6.0
$8.0
0.0 0.5 1.0 1.5 2.0 2.5 3.0
Bene
fit to
Cost (B/C) Ratio
Millions of D
ollars
Capacity Increase (MW)
Total Cost $ Total Benefit $ Net Present Value B/C Ratio
A-33 FINAL - October 2010
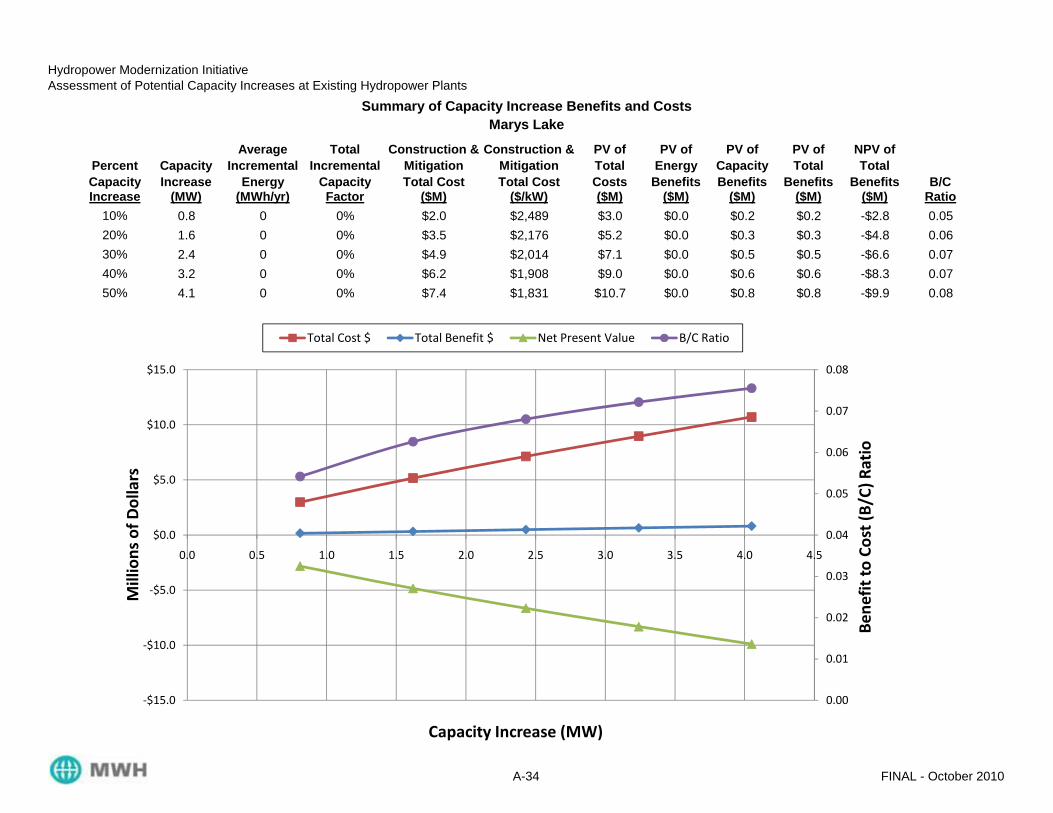
Hydropower Modernization InitiativeAssessment of Potential Capacity Increases at Existing Hydropower Plants
Summary of Capacity Increase Benefits and CostsMarys Lake
Percent Capacity
Capacity Increase
Average Incremental
Energy
Total Incremental
Capacity
Construction & Mitigation Total Cost
Construction & Mitigation Total Cost
PV of Total Costs
PV of Energy
Benefits
PV of Capacity Benefits
PV of Total
Benefits
NPV of Total
Benefits B/CIncrease (MW) (MWh/yr) Factor ($M) ($/kW) ($M) ($M) ($M) ($M) ($M) Ratio
10% 0.8 0 0% $2.0 $2,489 $3.0 $0.0 $0.2 $0.2 -$2.8 0.0520% 1.6 0 0% $3.5 $2,176 $5.2 $0.0 $0.3 $0.3 -$4.8 0.0630% 2.4 0 0% $4.9 $2,014 $7.1 $0.0 $0.5 $0.5 -$6.6 0.0740% 3.2 0 0% $6.2 $1,908 $9.0 $0.0 $0.6 $0.6 -$8.3 0.0750% 4.1 0 0% $7.4 $1,831 $10.7 $0.0 $0.8 $0.8 -$9.9 0.08
0.06
0.07
0.08
$5.0
$10.0
$15.0
) Ratio
ars
Total Cost $ Total Benefit $ Net Present Value B/C Ratio
0.00
0.01
0.02
0.03
0.04
0.05
0.06
0.07
0.08
‐$15.0
‐$10.0
‐$5.0
$0.0
$5.0
$10.0
$15.0
0.0 0.5 1.0 1.5 2.0 2.5 3.0 3.5 4.0 4.5
Bene
fit to
Cost (B/C) Ratio
Millions of D
ollars
Capacity Increase (MW)
Total Cost $ Total Benefit $ Net Present Value B/C Ratio
A-34 FINAL - October 2010

Hydropower Modernization InitiativeAssessment of Potential Capacity Increases at Existing Hydropower Plants
Summary of Capacity Increase Benefits and CostsMcPhee
Percent Capacity
Capacity Increase
Average Incremental
Energy
Total Incremental
Capacity
Construction & Mitigation Total Cost
Construction & Mitigation Total Cost
PV of Total Costs
PV of Energy
Benefits
PV of Capacity Benefits
PV of Total
Benefits
NPV of Total
Benefits B/CIncrease (MW) (MWh/yr) Factor ($M) ($/kW) ($M) ($M) ($M) ($M) ($M) Ratio
10% 0.1 322 29% $0.5 $3,627 $0.7 $0.5 $0.2 $0.7 $0.0 1.0020% 0.3 539 24% $0.8 $3,136 $1.2 $0.8 $0.4 $1.2 $0.0 0.9830% 0.4 724 21% $1.1 $2,887 $1.7 $1.0 $0.6 $1.6 -$0.1 0.9640% 0.5 897 20% $1.4 $2,724 $2.1 $1.3 $0.7 $2.0 -$0.1 0.9550% 0.6 1,051 19% $1.7 $2,606 $2.5 $1.5 $0.8 $2.3 -$0.2 0.94
0.80
1.00
1.20
$2.0
$2.5
$3.0
) Ratio
ars
Total Cost $ Total Benefit $ Net Present Value B/C Ratio
0.00
0.20
0.40
0.60
0.80
1.00
1.20
‐$0.5
$0.0
$0.5
$1.0
$1.5
$2.0
$2.5
$3.0
0.0 0.1 0.2 0.3 0.4 0.5 0.6 0.7
Bene
fit to
Cost (B/C) Ratio
Millions of D
ollars
Capacity Increase (MW)
Total Cost $ Total Benefit $ Net Present Value B/C Ratio
A-35 FINAL - October 2010

Hydropower Modernization InitiativeAssessment of Potential Capacity Increases at Existing Hydropower Plants
Summary of Capacity Increase Benefits and CostsMinidoka
Percent Capacity
Capacity Increase
Average Incremental
Energy
Total Incremental
Capacity
Construction & Mitigation Total Cost
Construction & Mitigation Total Cost
PV of Total Costs
PV of Energy
Benefits
PV of Capacity Benefits
PV of Total
Benefits
NPV of Total
Benefits B/CIncrease (MW) (MWh/yr) Factor ($M) ($/kW) ($M) ($M) ($M) ($M) ($M) Ratio
10% 2.8 5,025 21% $5.4 $1,965 $7.9 $5.6 $4.0 $9.5 $1.6 1.2120% 5.5 8,523 18% $9.6 $1,727 $13.7 $9.4 $6.9 $16.4 $2.6 1.1930% 8.3 11,009 15% $13.3 $1,604 $19.0 $12.2 $9.2 $21.4 $2.4 1.1240% 11.1 13,040 13% $16.9 $1,522 $23.9 $14.4 $11.1 $25.5 $1.6 1.0750% 13.9 14,807 12% $20.2 $1,462 $28.6 $16.4 $12.9 $29.3 $0.7 1.02
1.00
1.20
1.40
$25.0
$30.0
$35.0
) Ratio
ars
Total Cost $ Total Benefit $ Net Present Value B/C Ratio
0.00
0.20
0.40
0.60
0.80
1.00
1.20
1.40
$0.0
$5.0
$10.0
$15.0
$20.0
$25.0
$30.0
$35.0
0.0 2.0 4.0 6.0 8.0 10.0 12.0 14.0 16.0
Bene
fit to
Cost (B/C) Ratio
Millions of D
ollars
Capacity Increase (MW)
Total Cost $ Total Benefit $ Net Present Value B/C Ratio
A-36 FINAL - October 2010

Hydropower Modernization InitiativeAssessment of Potential Capacity Increases at Existing Hydropower Plants
Summary of Capacity Increase Benefits and CostsMorrow Point
Percent Capacity
Capacity Increase
Average Incremental
Energy
Total Incremental
Capacity
Construction & Mitigation Total Cost
Construction & Mitigation Total Cost
PV of Total Costs
PV of Energy
Benefits
PV of Capacity Benefits
PV of Total
Benefits
NPV of Total
Benefits B/CIncrease (MW) (MWh/yr) Factor ($M) ($/kW) ($M) ($M) ($M) ($M) ($M) Ratio
10% 17.3 1,152 1% $24.3 $1,404 $34.2 $1.6 $4.2 $5.9 -$28.4 0.1720% 34.7 2,139 1% $43.1 $1,242 $59.7 $3.0 $8.4 $11.4 -$48.3 0.1930% 52.0 2,884 1% $60.2 $1,157 $82.8 $4.1 $12.4 $16.4 -$66.3 0.2040% 69.3 3,401 1% $76.3 $1,101 $104.3 $4.8 $16.2 $21.0 -$83.4 0.2050% 86.7 3,823 1% $91.8 $1,059 $124.9 $5.4 $19.9 $25.3 -$99.6 0.20
0.20
0.25
$50.0
$100.0
$150.0
) Ratio
ars
Total Cost $ Total Benefit $ Net Present Value B/C Ratio
0.00
0.05
0.10
0.15
0.20
0.25
‐$150.0
‐$100.0
‐$50.0
$0.0
$50.0
$100.0
$150.0
0.0 10.0 20.0 30.0 40.0 50.0 60.0 70.0 80.0 90.0 100.0
Bene
fit to
Cost (B/C) Ratio
Millions of D
ollars
Capacity Increase (MW)
Total Cost $ Total Benefit $ Net Present Value B/C Ratio
A-37 FINAL - October 2010

Hydropower Modernization InitiativeAssessment of Potential Capacity Increases at Existing Hydropower Plants
Summary of Capacity Increase Benefits and CostsMount Elbert
Percent Capacity
Capacity Increase
Average Incremental
Energy
Total Incremental
Capacity
Construction & Mitigation Total Cost
Construction & Mitigation Total Cost
PV of Total Costs
PV of Energy
Benefits
PV of Capacity Benefits
PV of Total
Benefits
NPV of Total
Benefits B/CIncrease (MW) (MWh/yr) Factor ($M) ($/kW) ($M) ($M) ($M) ($M) ($M) Ratio
10% 20.0 0 0% $27.4 $1,369 $38.4 $0.0 $4.0 $4.0 -$34.4 0.1020% 40.0 0 0% $48.5 $1,211 $67.0 $0.0 $8.0 $8.0 -$59.0 0.1230% 60.0 0 0% $67.7 $1,129 $92.9 $0.0 $12.0 $12.0 -$80.9 0.1340% 80.0 0 0% $85.9 $1,074 $117.1 $0.0 $16.0 $16.0 -$101.1 0.1450% 100.0 0 0% $103.4 $1,034 $140.2 $0.0 $20.0 $20.0 -$120.3 0.14
0.12
0.14
0.16
$100.0
$150.0
$200.0
) Ratio
ars
Total Cost $ Total Benefit $ Net Present Value B/C Ratio
0.00
0.02
0.04
0.06
0.08
0.10
0.12
0.14
0.16
‐$150.0
‐$100.0
‐$50.0
$0.0
$50.0
$100.0
$150.0
$200.0
0.0 20.0 40.0 60.0 80.0 100.0 120.0
Bene
fit to
Cost (B/C) Ratio
Millions of D
ollars
Capacity Increase (MW)
Total Cost $ Total Benefit $ Net Present Value B/C Ratio
A-38 FINAL - October 2010

Hydropower Modernization InitiativeAssessment of Potential Capacity Increases at Existing Hydropower Plants
Summary of Capacity Increase Benefits and CostsNew Melones
Percent Capacity
Capacity Increase
Average Incremental
Energy
Total Incremental
Capacity
Construction & Mitigation Total Cost
Construction & Mitigation Total Cost
PV of Total Costs
PV of Energy
Benefits
PV of Capacity Benefits
PV of Total
Benefits
NPV of Total
Benefits B/CIncrease (MW) (MWh/yr) Factor ($M) ($/kW) ($M) ($M) ($M) ($M) ($M) Ratio
10% 38.2 0 0% $46.6 $1,221 $64.6 $0.0 $7.6 $7.6 -$56.9 0.1220% 76.4 0 0% $82.7 $1,083 $112.8 $0.0 $15.3 $15.3 -$97.6 0.1430% 114.6 0 0% $115.8 $1,010 $156.6 $0.0 $22.9 $22.9 -$133.7 0.1540% 152.8 0 0% $147.0 $962 $197.6 $0.0 $30.5 $30.5 -$167.1 0.1550% 191.0 0 0% $176.9 $926 $236.7 $0.0 $38.1 $38.1 -$198.5 0.16
0.12
0.14
0.16
0.18
$100 0
$150.0
$200.0
$250.0
$300.0
) Ratio
ars
Total Cost $ Total Benefit $ Net Present Value B/C Ratio
0.00
0.02
0.04
0.06
0.08
0.10
0.12
0.14
0.16
0.18
‐$250.0
‐$200.0
‐$150.0
‐$100.0
‐$50.0
$0.0
$50.0
$100.0
$150.0
$200.0
$250.0
$300.0
0.0 50.0 100.0 150.0 200.0 250.0
Bene
fit to
Cost (B/C) Ratio
Millions of D
ollars
Capacity Increase (MW)
Total Cost $ Total Benefit $ Net Present Value B/C Ratio
A-39 FINAL - October 2010
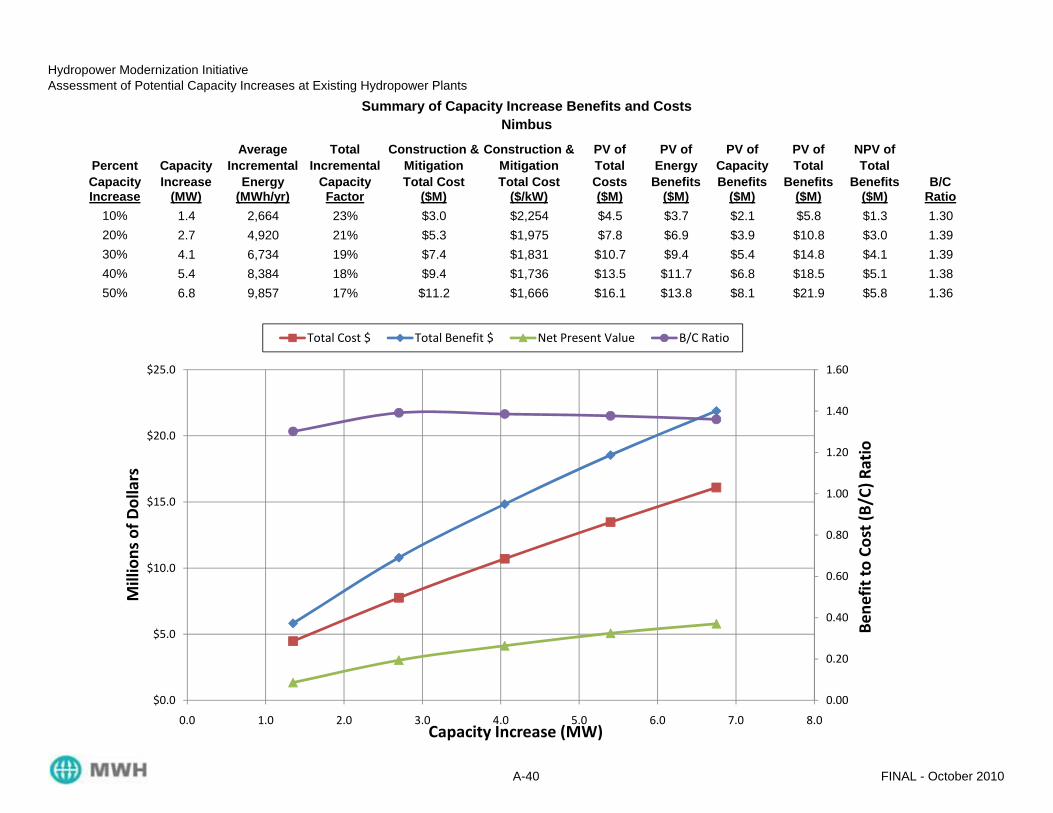
Hydropower Modernization InitiativeAssessment of Potential Capacity Increases at Existing Hydropower Plants
Summary of Capacity Increase Benefits and CostsNimbus
Percent Capacity
Capacity Increase
Average Incremental
Energy
Total Incremental
Capacity
Construction & Mitigation Total Cost
Construction & Mitigation Total Cost
PV of Total Costs
PV of Energy
Benefits
PV of Capacity Benefits
PV of Total
Benefits
NPV of Total
Benefits B/CIncrease (MW) (MWh/yr) Factor ($M) ($/kW) ($M) ($M) ($M) ($M) ($M) Ratio
10% 1.4 2,664 23% $3.0 $2,254 $4.5 $3.7 $2.1 $5.8 $1.3 1.3020% 2.7 4,920 21% $5.3 $1,975 $7.8 $6.9 $3.9 $10.8 $3.0 1.3930% 4.1 6,734 19% $7.4 $1,831 $10.7 $9.4 $5.4 $14.8 $4.1 1.3940% 5.4 8,384 18% $9.4 $1,736 $13.5 $11.7 $6.8 $18.5 $5.1 1.3850% 6.8 9,857 17% $11.2 $1,666 $16.1 $13.8 $8.1 $21.9 $5.8 1.36
1.20
1.40
1.60
$20.0
$25.0
) Ratio
ars
Total Cost $ Total Benefit $ Net Present Value B/C Ratio
0.00
0.20
0.40
0.60
0.80
1.00
1.20
1.40
1.60
$0.0
$5.0
$10.0
$15.0
$20.0
$25.0
0.0 1.0 2.0 3.0 4.0 5.0 6.0 7.0 8.0
Bene
fit to
Cost (B/C) Ratio
Millions of D
ollars
Capacity Increase (MW)
Total Cost $ Total Benefit $ Net Present Value B/C Ratio
A-40 FINAL - October 2010

Hydropower Modernization InitiativeAssessment of Potential Capacity Increases at Existing Hydropower Plants
Summary of Capacity Increase Benefits and CostsONeill
Percent Capacity
Capacity Increase
Average Incremental
Energy
Total Incremental
Capacity
Construction & Mitigation Total Cost
Construction & Mitigation Total Cost
PV of Total Costs
PV of Energy
Benefits
PV of Capacity Benefits
PV of Total
Benefits
NPV of Total
Benefits B/CIncrease (MW) (MWh/yr) Factor ($M) ($/kW) ($M) ($M) ($M) ($M) ($M) Ratio
10% 2.5 155 1% $5.0 $2,001 $7.3 $0.3 $0.6 $0.9 -$6.5 0.1220% 5.0 158 0% $8.9 $1,758 $12.7 $0.3 $1.1 $1.4 -$11.3 0.1130% 7.6 158 0% $12.3 $1,632 $17.6 $0.3 $1.6 $1.9 -$15.7 0.1140% 10.1 158 0% $15.6 $1,548 $22.2 $0.3 $2.1 $2.4 -$19.8 0.1150% 12.6 158 0% $18.7 $1,487 $26.5 $0.3 $2.6 $2.9 -$23.6 0.11
0.10
0.12
0.14
$10.0
$20.0
$30.0
) Ratio
ars
Total Cost $ Total Benefit $ Net Present Value B/C Ratio
0.00
0.02
0.04
0.06
0.08
0.10
0.12
0.14
‐$30.0
‐$20.0
‐$10.0
$0.0
$10.0
$20.0
$30.0
0.0 2.0 4.0 6.0 8.0 10.0 12.0 14.0
Bene
fit to
Cost (B/C) Ratio
Millions of D
ollars
Capacity Increase (MW)
Total Cost $ Total Benefit $ Net Present Value B/C Ratio
A-41 FINAL - October 2010

Hydropower Modernization InitiativeAssessment of Potential Capacity Increases at Existing Hydropower Plants
Summary of Capacity Increase Benefits and CostsPalisades
Percent Capacity
Capacity Increase
Average Incremental
Energy
Total Incremental
Capacity
Construction & Mitigation Total Cost
Construction & Mitigation Total Cost
PV of Total Costs
PV of Energy
Benefits
PV of Capacity Benefits
PV of Total
Benefits
NPV of Total
Benefits B/CIncrease (MW) (MWh/yr) Factor ($M) ($/kW) ($M) ($M) ($M) ($M) ($M) Ratio
10% 17.7 39,931 26% $24.7 $1,400 $34.7 $44.1 $30.8 $75.0 $40.2 2.1620% 35.3 73,362 24% $43.7 $1,238 $60.6 $81.1 $57.2 $138.3 $77.7 2.2830% 53.0 99,993 22% $61.1 $1,153 $84.0 $110.5 $78.9 $189.5 $105.5 2.2640% 70.6 118,090 19% $77.5 $1,097 $105.9 $130.5 $94.8 $225.4 $119.4 2.1350% 88.3 129,829 17% $93.2 $1,056 $126.8 $143.5 $106.4 $249.9 $123.1 1.97
2.00
2.50
$200.0
$250.0
$300.0
) Ratio
ars
Total Cost $ Total Benefit $ Net Present Value B/C Ratio
0.00
0.50
1.00
1.50
2.00
2.50
$0.0
$50.0
$100.0
$150.0
$200.0
$250.0
$300.0
0.0 10.0 20.0 30.0 40.0 50.0 60.0 70.0 80.0 90.0 100.0
Bene
fit to
Cost (B/C) Ratio
Millions of D
ollars
Capacity Increase (MW)
Total Cost $ Total Benefit $ Net Present Value B/C Ratio
A-42 FINAL - October 2010

Hydropower Modernization InitiativeAssessment of Potential Capacity Increases at Existing Hydropower Plants
Summary of Capacity Increase Benefits and CostsParker
Percent Capacity
Capacity Increase
Average Incremental
Energy
Total Incremental
Capacity
Construction & Mitigation Total Cost
Construction & Mitigation Total Cost
PV of Total Costs
PV of Energy
Benefits
PV of Capacity Benefits
PV of Total
Benefits
NPV of Total
Benefits B/CIncrease (MW) (MWh/yr) Factor ($M) ($/kW) ($M) ($M) ($M) ($M) ($M) Ratio
10% 12.0 8,289 8% $18.0 $1,500 $25.5 $10.3 $8.1 $18.4 -$7.1 0.7220% 24.0 15,049 7% $31.8 $1,325 $44.4 $18.7 $15.1 $33.8 -$10.6 0.7630% 36.0 19,454 6% $44.4 $1,234 $61.6 $24.2 $20.5 $44.7 -$16.9 0.7340% 48.0 20,113 5% $56.3 $1,173 $77.6 $25.0 $23.3 $48.3 -$29.2 0.6250% 60.0 19,365 4% $67.7 $1,129 $92.9 $24.1 $25.2 $49.3 -$43.6 0.53
0.60
0.70
0.80
$60.0
$80.0
$100.0
) Ratio
ars
Total Cost $ Total Benefit $ Net Present Value B/C Ratio
0.00
0.10
0.20
0.30
0.40
0.50
0.60
0.70
0.80
‐$60.0
‐$40.0
‐$20.0
$0.0
$20.0
$40.0
$60.0
$80.0
$100.0
0.0 10.0 20.0 30.0 40.0 50.0 60.0 70.0
Bene
fit to
Cost (B/C) Ratio
Millions of D
ollars
Capacity Increase (MW)
Total Cost $ Total Benefit $ Net Present Value B/C Ratio
A-43 FINAL - October 2010

Hydropower Modernization InitiativeAssessment of Potential Capacity Increases at Existing Hydropower Plants
Summary of Capacity Increase Benefits and CostsPilot Butte
Percent Capacity
Capacity Increase
Average Incremental
Energy
Total Incremental
Capacity
Construction & Mitigation Total Cost
Construction & Mitigation Total Cost
PV of Total Costs
PV of Energy
Benefits
PV of Capacity Benefits
PV of Total
Benefits
NPV of Total
Benefits B/CIncrease (MW) (MWh/yr) Factor ($M) ($/kW) ($M) ($M) ($M) ($M) ($M) Ratio
10% 0.2 342 24% $0.6 $3,460 $0.8 $0.3 $0.3 $0.6 -$0.3 0.6720% 0.3 679 24% $1.0 $2,997 $1.4 $0.6 $0.5 $1.1 -$0.3 0.7730% 0.5 1,021 24% $1.3 $2,761 $2.0 $0.9 $0.8 $1.7 -$0.3 0.8440% 0.6 1,368 24% $1.7 $2,607 $2.5 $1.2 $1.1 $2.2 -$0.2 0.9050% 0.8 1,732 25% $2.0 $2,495 $3.0 $1.5 $1.3 $2.8 -$0.1 0.96
0.80
1.00
1.20
$2.5
$3.0
$3.5
) Ratio
ars
Total Cost $ Total Benefit $ Net Present Value B/C Ratio
0.00
0.20
0.40
0.60
0.80
1.00
1.20
‐$0.5
$0.0
$0.5
$1.0
$1.5
$2.0
$2.5
$3.0
$3.5
0.0 0.1 0.2 0.3 0.4 0.5 0.6 0.7 0.8 0.9
Bene
fit to
Cost (B/C) Ratio
Millions of D
ollars
Capacity Increase (MW)
Total Cost $ Total Benefit $ Net Present Value B/C Ratio
A-44 FINAL - October 2010

Hydropower Modernization InitiativeAssessment of Potential Capacity Increases at Existing Hydropower Plants
Summary of Capacity Increase Benefits and CostsPole Hill
Percent Capacity
Capacity Increase
Average Incremental
Energy
Total Incremental
Capacity
Construction & Mitigation Total Cost
Construction & Mitigation Total Cost
PV of Total Costs
PV of Energy
Benefits
PV of Capacity Benefits
PV of Total
Benefits
NPV of Total
Benefits B/CIncrease (MW) (MWh/yr) Factor ($M) ($/kW) ($M) ($M) ($M) ($M) ($M) Ratio
10% 3.8 0 0% $7.1 $1,850 $10.2 $0.0 $0.8 $0.8 -$9.5 0.0720% 7.6 0 0% $12.5 $1,628 $17.8 $0.0 $1.5 $1.5 -$16.3 0.0930% 11.5 0 0% $17.4 $1,513 $24.6 $0.0 $2.3 $2.3 -$22.3 0.0940% 15.3 0 0% $22.0 $1,436 $31.0 $0.0 $3.1 $3.1 -$27.9 0.1050% 19.1 0 0% $26.4 $1,380 $37.0 $0.0 $3.8 $3.8 -$33.2 0.10
0.08
0.10
0.12
$20.0
$30.0
$40.0
$50.0
) Ratio
ars
Total Cost $ Total Benefit $ Net Present Value B/C Ratio
0.00
0.02
0.04
0.06
0.08
0.10
0.12
‐$40.0
‐$30.0
‐$20.0
‐$10.0
$0.0
$10.0
$20.0
$30.0
$40.0
$50.0
0.0 5.0 10.0 15.0 20.0 25.0
Bene
fit to
Cost (B/C) Ratio
Millions of D
ollars
Capacity Increase (MW)
Total Cost $ Total Benefit $ Net Present Value B/C Ratio
A-45 FINAL - October 2010

Hydropower Modernization InitiativeAssessment of Potential Capacity Increases at Existing Hydropower Plants
Summary of Capacity Increase Benefits and CostsRoza
Percent Capacity
Capacity Increase
Average Incremental
Energy
Total Incremental
Capacity
Construction & Mitigation Total Cost
Construction & Mitigation Total Cost
PV of Total Costs
PV of Energy
Benefits
PV of Capacity Benefits
PV of Total
Benefits
NPV of Total
Benefits B/CIncrease (MW) (MWh/yr) Factor ($M) ($/kW) ($M) ($M) ($M) ($M) ($M) Ratio
10% 1.3 0 0% $2.9 $2,272 $4.3 $0.0 $0.3 $0.3 -$4.1 0.0620% 2.6 0 0% $5.2 $1,991 $7.5 $0.0 $0.5 $0.5 -$7.0 0.0730% 3.9 0 0% $7.2 $1,845 $10.3 $0.0 $0.8 $0.8 -$9.6 0.0740% 5.2 0 0% $9.1 $1,749 $13.0 $0.0 $1.0 $1.0 -$12.0 0.0850% 6.5 0 0% $10.9 $1,679 $15.6 $0.0 $1.3 $1.3 -$14.3 0.08
0.06
0.07
0.08
0.09
$10.0
$15.0
$20.0
) Ratio
ars
Total Cost $ Total Benefit $ Net Present Value B/C Ratio
0.00
0.01
0.02
0.03
0.04
0.05
0.06
0.07
0.08
0.09
‐$20.0
‐$15.0
‐$10.0
‐$5.0
$0.0
$5.0
$10.0
$15.0
$20.0
0.0 1.0 2.0 3.0 4.0 5.0 6.0 7.0
Bene
fit to
Cost (B/C) Ratio
Millions of D
ollars
Capacity Increase (MW)
Total Cost $ Total Benefit $ Net Present Value B/C Ratio
A-46 FINAL - October 2010

Hydropower Modernization InitiativeAssessment of Potential Capacity Increases at Existing Hydropower Plants
Summary of Capacity Increase Benefits and CostsSan Luis
Percent Capacity
Capacity Increase
Average Incremental
Energy
Total Incremental
Capacity
Construction & Mitigation Total Cost
Construction & Mitigation Total Cost
PV of Total Costs
PV of Energy
Benefits
PV of Capacity Benefits
PV of Total
Benefits
NPV of Total
Benefits B/CIncrease (MW) (MWh/yr) Factor ($M) ($/kW) ($M) ($M) ($M) ($M) ($M) Ratio
10% 42.4 33 0% $50.8 $1,199 $70.2 $0.0 $8.5 $8.5 -$61.7 0.1220% 84.8 33 0% $90.2 $1,063 $122.8 $0.0 $17.0 $17.0 -$105.8 0.1430% 127.2 33 0% $126.2 $992 $170.3 $0.0 $25.4 $25.5 -$144.9 0.1540% 169.6 33 0% $160.3 $945 $215.0 $0.0 $33.9 $33.9 -$181.0 0.1650% 212.0 33 0% $193.0 $910 $257.5 $0.0 $42.3 $42.4 -$215.2 0.16
0.12
0.14
0.16
0.18
$100.0
$200.0
$300.0
) Ratio
ars
Total Cost $ Total Benefit $ Net Present Value B/C Ratio
0.00
0.02
0.04
0.06
0.08
0.10
0.12
0.14
0.16
0.18
‐$300.0
‐$200.0
‐$100.0
$0.0
$100.0
$200.0
$300.0
0.0 50.0 100.0 150.0 200.0 250.0
Bene
fit to
Cost (B/C) Ratio
Millions of D
ollars
Capacity Increase (MW)
Total Cost $ Total Benefit $ Net Present Value B/C Ratio
A-47 FINAL - October 2010

Hydropower Modernization InitiativeAssessment of Potential Capacity Increases at Existing Hydropower Plants
Summary of Capacity Increase Benefits and CostsSeminoe
Percent Capacity
Capacity Increase
Average Incremental
Energy
Total Incremental
Capacity
Construction & Mitigation Total Cost
Construction & Mitigation Total Cost
PV of Total Costs
PV of Energy
Benefits
PV of Capacity Benefits
PV of Total
Benefits
NPV of Total
Benefits B/CIncrease (MW) (MWh/yr) Factor ($M) ($/kW) ($M) ($M) ($M) ($M) ($M) Ratio
10% 5.2 1,174 3% $9.1 $1,749 $13.0 $1.3 $1.8 $3.1 -$9.9 0.2420% 10.4 2,222 2% $15.9 $1,541 $22.6 $2.4 $3.6 $6.0 -$16.7 0.2630% 15.5 3,123 2% $22.2 $1,432 $31.3 $3.3 $5.2 $8.6 -$22.8 0.2740% 20.7 3,788 2% $28.2 $1,361 $39.5 $4.0 $6.7 $10.8 -$28.7 0.2750% 25.9 4,224 2% $33.8 $1,308 $47.2 $4.5 $8.1 $12.6 -$34.7 0.27
0.20
0.25
0.30
$30.0
$40.0
$50.0
$60.0
) Ratio
ars
Total Cost $ Total Benefit $ Net Present Value B/C Ratio
0.00
0.05
0.10
0.15
0.20
0.25
0.30
‐$40.0
‐$30.0
‐$20.0
‐$10.0
$0.0
$10.0
$20.0
$30.0
$40.0
$50.0
$60.0
0.0 5.0 10.0 15.0 20.0 25.0 30.0
Bene
fit to
Cost (B/C) Ratio
Millions of D
ollars
Capacity Increase (MW)
Total Cost $ Total Benefit $ Net Present Value B/C Ratio
A-48 FINAL - October 2010

Hydropower Modernization InitiativeAssessment of Potential Capacity Increases at Existing Hydropower Plants
Summary of Capacity Increase Benefits and CostsShasta
Percent Capacity
Capacity Increase
Average Incremental
Energy
Total Incremental
Capacity
Construction & Mitigation Total Cost
Construction & Mitigation Total Cost
PV of Total Costs
PV of Energy
Benefits
PV of Capacity Benefits
PV of Total
Benefits
NPV of Total
Benefits B/CIncrease (MW) (MWh/yr) Factor ($M) ($/kW) ($M) ($M) ($M) ($M) ($M) Ratio
10% 71.4 27,813 4% $78.2 $1,095 $106.8 $49.8 $33.3 $83.1 -$23.8 0.7820% 142.8 52,099 4% $138.9 $973 $187.0 $93.3 $64.1 $157.4 -$29.7 0.8430% 214.2 73,426 4% $194.6 $909 $259.7 $131.4 $93.0 $224.4 -$35.3 0.8640% 285.6 90,794 4% $247.4 $866 $327.9 $162.5 $119.1 $281.6 -$46.3 0.8650% 357.0 103,991 3% $298.0 $835 $393.0 $186.1 $142.4 $328.5 -$64.5 0.84
0.70
0.80
0.90
1.00
$300.0
$400.0
$500.0
) Ratio
ars
Total Cost $ Total Benefit $ Net Present Value B/C Ratio
0.00
0.10
0.20
0.30
0.40
0.50
0.60
0.70
0.80
0.90
1.00
‐$100.0
$0.0
$100.0
$200.0
$300.0
$400.0
$500.0
0.0 50.0 100.0 150.0 200.0 250.0 300.0 350.0 400.0
Bene
fit to
Cost (B/C) Ratio
Millions of D
ollars
Capacity Increase (MW)
Total Cost $ Total Benefit $ Net Present Value B/C Ratio
A-49 FINAL - October 2010

Hydropower Modernization InitiativeAssessment of Potential Capacity Increases at Existing Hydropower Plants
Summary of Capacity Increase Benefits and CostsShoshone
Percent Capacity
Capacity Increase
Average Incremental
Energy
Total Incremental
Capacity
Construction & Mitigation Total Cost
Construction & Mitigation Total Cost
PV of Total Costs
PV of Energy
Benefits
PV of Capacity Benefits
PV of Total
Benefits
NPV of Total
Benefits B/CIncrease (MW) (MWh/yr) Factor ($M) ($/kW) ($M) ($M) ($M) ($M) ($M) Ratio
10% 0.3 2,502 95% $0.9 $3,037 $1.4 $2.6 $1.0 $3.6 $2.2 2.6020% 0.6 4,980 95% $1.6 $2,641 $2.4 $5.1 $1.9 $7.1 $4.7 3.0030% 0.9 7,343 93% $2.2 $2,438 $3.2 $7.6 $2.9 $10.5 $7.2 3.2240% 1.2 9,653 92% $2.8 $2,305 $4.1 $10.0 $3.8 $13.8 $9.7 3.3850% 1.5 11,913 91% $3.3 $2,208 $4.9 $12.3 $4.7 $17.0 $12.2 3.50
3.00
3.50
4.00
$12.0
$14.0
$16.0
$18.0
) Ratio
ars
Total Cost $ Total Benefit $ Net Present Value B/C Ratio
0.00
0.50
1.00
1.50
2.00
2.50
3.00
3.50
4.00
$0.0
$2.0
$4.0
$6.0
$8.0
$10.0
$12.0
$14.0
$16.0
$18.0
0.0 0.2 0.4 0.6 0.8 1.0 1.2 1.4 1.6
Bene
fit to
Cost (B/C) Ratio
Millions of D
ollars
Capacity Increase (MW)
Total Cost $ Total Benefit $ Net Present Value B/C Ratio
A-50 FINAL - October 2010

Hydropower Modernization InitiativeAssessment of Potential Capacity Increases at Existing Hydropower Plants
Summary of Capacity Increase Benefits and CostsSpirit Mountain
Percent Capacity
Capacity Increase
Average Incremental
Energy
Total Incremental
Capacity
Construction & Mitigation Total Cost
Construction & Mitigation Total Cost
PV of Total Costs
PV of Energy
Benefits
PV of Capacity Benefits
PV of Total
Benefits
NPV of Total
Benefits B/CIncrease (MW) (MWh/yr) Factor ($M) ($/kW) ($M) ($M) ($M) ($M) ($M) Ratio
10% 0.5 0 0% $1.3 $2,797 $1.9 $0.0 $0.1 $0.1 -$1.8 0.0520% 0.9 0 0% $2.2 $2,438 $3.2 $0.0 $0.2 $0.2 -$3.1 0.0630% 1.4 0 0% $3.0 $2,254 $4.5 $0.0 $0.3 $0.3 -$4.2 0.0640% 1.8 0 0% $3.8 $2,133 $5.6 $0.0 $0.4 $0.4 -$5.3 0.0650% 2.3 0 0% $4.6 $2,044 $6.7 $0.0 $0.4 $0.4 -$6.3 0.07
0.06
0.07
0.08
$4.0
$6.0
$8.0
) Ratio
ars
Total Cost $ Total Benefit $ Net Present Value B/C Ratio
0.00
0.01
0.02
0.03
0.04
0.05
0.06
0.07
0.08
‐$8.0
‐$6.0
‐$4.0
‐$2.0
$0.0
$2.0
$4.0
$6.0
$8.0
0.0 0.5 1.0 1.5 2.0 2.5
Bene
fit to
Cost (B/C) Ratio
Millions of D
ollars
Capacity Increase (MW)
Total Cost $ Total Benefit $ Net Present Value B/C Ratio
A-51 FINAL - October 2010

Hydropower Modernization InitiativeAssessment of Potential Capacity Increases at Existing Hydropower Plants
Summary of Capacity Increase Benefits and CostsSpring Creek
Percent Capacity
Capacity Increase
Average Incremental
Energy
Total Incremental
Capacity
Construction & Mitigation Total Cost
Construction & Mitigation Total Cost
PV of Total Costs
PV of Energy
Benefits
PV of Capacity Benefits
PV of Total
Benefits
NPV of Total
Benefits B/CIncrease (MW) (MWh/yr) Factor ($M) ($/kW) ($M) ($M) ($M) ($M) ($M) Ratio
10% 18.0 1,499 1% $25.1 $1,395 $35.3 $2.7 $4.6 $7.3 -$28.0 0.2120% 36.0 2,260 1% $44.4 $1,234 $61.6 $4.0 $8.7 $12.8 -$48.8 0.2130% 54.0 2,783 1% $62.1 $1,150 $85.3 $5.0 $12.7 $17.7 -$67.6 0.2140% 72.0 3,173 1% $78.8 $1,094 $107.6 $5.7 $16.5 $22.2 -$85.4 0.2150% 90.0 3,450 0% $94.7 $1,053 $128.8 $6.2 $20.3 $26.5 -$102.3 0.21
0.20
0.25
$50.0
$100.0
$150.0
) Ratio
ars
Total Cost $ Total Benefit $ Net Present Value B/C Ratio
0.00
0.05
0.10
0.15
0.20
0.25
‐$150.0
‐$100.0
‐$50.0
$0.0
$50.0
$100.0
$150.0
0.0 10.0 20.0 30.0 40.0 50.0 60.0 70.0 80.0 90.0 100.0
Bene
fit to
Cost (B/C) Ratio
Millions of D
ollars
Capacity Increase (MW)
Total Cost $ Total Benefit $ Net Present Value B/C Ratio
A-52 FINAL - October 2010
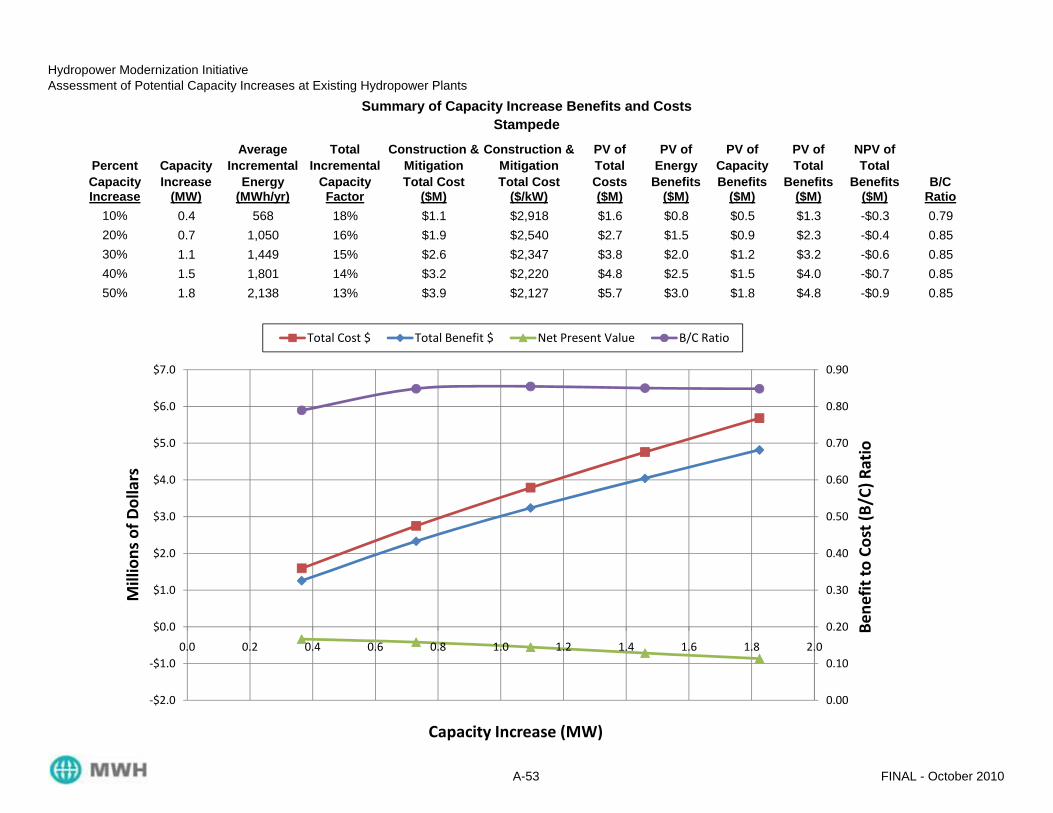
Hydropower Modernization InitiativeAssessment of Potential Capacity Increases at Existing Hydropower Plants
Summary of Capacity Increase Benefits and CostsStampede
Percent Capacity
Capacity Increase
Average Incremental
Energy
Total Incremental
Capacity
Construction & Mitigation Total Cost
Construction & Mitigation Total Cost
PV of Total Costs
PV of Energy
Benefits
PV of Capacity Benefits
PV of Total
Benefits
NPV of Total
Benefits B/CIncrease (MW) (MWh/yr) Factor ($M) ($/kW) ($M) ($M) ($M) ($M) ($M) Ratio
10% 0.4 568 18% $1.1 $2,918 $1.6 $0.8 $0.5 $1.3 -$0.3 0.7920% 0.7 1,050 16% $1.9 $2,540 $2.7 $1.5 $0.9 $2.3 -$0.4 0.8530% 1.1 1,449 15% $2.6 $2,347 $3.8 $2.0 $1.2 $3.2 -$0.6 0.8540% 1.5 1,801 14% $3.2 $2,220 $4.8 $2.5 $1.5 $4.0 -$0.7 0.8550% 1.8 2,138 13% $3.9 $2,127 $5.7 $3.0 $1.8 $4.8 -$0.9 0.85
0.60
0.70
0.80
0.90
$4.0
$5.0
$6.0
$7.0
) Ratio
ars
Total Cost $ Total Benefit $ Net Present Value B/C Ratio
0.00
0.10
0.20
0.30
0.40
0.50
0.60
0.70
0.80
0.90
‐$2.0
‐$1.0
$0.0
$1.0
$2.0
$3.0
$4.0
$5.0
$6.0
$7.0
0.0 0.2 0.4 0.6 0.8 1.0 1.2 1.4 1.6 1.8 2.0
Bene
fit to
Cost (B/C) Ratio
Millions of D
ollars
Capacity Increase (MW)
Total Cost $ Total Benefit $ Net Present Value B/C Ratio
A-53 FINAL - October 2010

Hydropower Modernization InitiativeAssessment of Potential Capacity Increases at Existing Hydropower Plants
Summary of Capacity Increase Benefits and CostsTowaoc
Percent Capacity
Capacity Increase
Average Incremental
Energy
Total Incremental
Capacity
Construction & Mitigation Total Cost
Construction & Mitigation Total Cost
PV of Total Costs
PV of Energy
Benefits
PV of Capacity Benefits
PV of Total
Benefits
NPV of Total
Benefits B/CIncrease (MW) (MWh/yr) Factor ($M) ($/kW) ($M) ($M) ($M) ($M) ($M) Ratio
10% 1.1 797 8% $2.7 $2,325 $3.9 $0.9 $0.8 $1.6 -$2.3 0.4120% 2.3 1,300 6% $4.7 $2,036 $6.8 $1.4 $1.3 $2.7 -$4.1 0.4030% 3.4 1,715 6% $6.5 $1,886 $9.4 $1.8 $1.9 $3.7 -$5.7 0.3940% 4.6 1,922 5% $8.2 $1,788 $11.8 $2.1 $2.2 $4.3 -$7.5 0.3650% 5.7 1,925 4% $9.9 $1,716 $14.2 $2.1 $2.5 $4.5 -$9.6 0.32
0.30
0.35
0.40
0.45
$10.0
$15.0
$20.0
) Ratio
ars
Total Cost $ Total Benefit $ Net Present Value B/C Ratio
0.00
0.05
0.10
0.15
0.20
0.25
0.30
0.35
0.40
0.45
‐$15.0
‐$10.0
‐$5.0
$0.0
$5.0
$10.0
$15.0
$20.0
0.0 1.0 2.0 3.0 4.0 5.0 6.0 7.0
Bene
fit to
Cost (B/C) Ratio
Millions of D
ollars
Capacity Increase (MW)
Total Cost $ Total Benefit $ Net Present Value B/C Ratio
A-54 FINAL - October 2010

Hydropower Modernization InitiativeAssessment of Potential Capacity Increases at Existing Hydropower Plants
Summary of Capacity Increase Benefits and CostsTrinity
Percent Capacity
Capacity Increase
Average Incremental
Energy
Total Incremental
Capacity
Construction & Mitigation Total Cost
Construction & Mitigation Total Cost
PV of Total Costs
PV of Energy
Benefits
PV of Capacity Benefits
PV of Total
Benefits
NPV of Total
Benefits B/CIncrease (MW) (MWh/yr) Factor ($M) ($/kW) ($M) ($M) ($M) ($M) ($M) Ratio
10% 14.0 4,999 4% $20.4 $1,459 $28.8 $8.9 $6.2 $15.2 -$13.7 0.5320% 28.0 9,229 4% $36.1 $1,290 $50.3 $16.5 $11.9 $28.4 -$21.9 0.5730% 42.0 12,066 3% $50.4 $1,201 $69.7 $21.6 $16.6 $38.2 -$31.5 0.5540% 56.0 14,002 3% $64.0 $1,142 $87.8 $25.1 $20.8 $45.8 -$42.0 0.5250% 70.0 15,384 3% $76.9 $1,099 $105.2 $27.5 $24.5 $52.0 -$53.1 0.49
0.40
0.50
0.60
$60.0
$80.0
$100.0
$120.0
) Ratio
ars
Total Cost $ Total Benefit $ Net Present Value B/C Ratio
0.00
0.10
0.20
0.30
0.40
0.50
0.60
‐$80.0
‐$60.0
‐$40.0
‐$20.0
$0.0
$20.0
$40.0
$60.0
$80.0
$100.0
$120.0
0.0 10.0 20.0 30.0 40.0 50.0 60.0 70.0 80.0
Bene
fit to
Cost (B/C) Ratio
Millions of D
ollars
Capacity Increase (MW)
Total Cost $ Total Benefit $ Net Present Value B/C Ratio
A-55 FINAL - October 2010

Hydropower Modernization InitiativeAssessment of Potential Capacity Increases at Existing Hydropower Plants
Summary of Capacity Increase Benefits and CostsUpper Molina
Percent Capacity
Capacity Increase
Average Incremental
Energy
Total Incremental
Capacity
Construction & Mitigation Total Cost
Construction & Mitigation Total Cost
PV of Total Costs
PV of Energy
Benefits
PV of Capacity Benefits
PV of Total
Benefits
NPV of Total
Benefits B/CIncrease (MW) (MWh/yr) Factor ($M) ($/kW) ($M) ($M) ($M) ($M) ($M) Ratio
10% 0.9 8 0% $2.1 $2,458 $3.1 $0.0 $0.2 $0.2 -$3.0 0.0620% 1.7 8 0% $3.7 $2,149 $5.4 $0.0 $0.4 $0.4 -$5.1 0.0730% 2.6 8 0% $5.2 $1,990 $7.5 $0.0 $0.5 $0.5 -$7.0 0.0740% 3.5 8 0% $6.5 $1,885 $9.4 $0.0 $0.7 $0.7 -$8.7 0.0750% 4.3 8 0% $7.8 $1,809 $11.3 $0.0 $0.9 $0.9 -$10.4 0.08
0.06
0.07
0.08
0.09
$5.0
$10.0
$15.0
) Ratio
ars
Total Cost $ Total Benefit $ Net Present Value B/C Ratio
0.00
0.01
0.02
0.03
0.04
0.05
0.06
0.07
0.08
0.09
‐$15.0
‐$10.0
‐$5.0
$0.0
$5.0
$10.0
$15.0
0.0 0.5 1.0 1.5 2.0 2.5 3.0 3.5 4.0 4.5 5.0
Bene
fit to
Cost (B/C) Ratio
Millions of D
ollars
Capacity Increase (MW)
Total Cost $ Total Benefit $ Net Present Value B/C Ratio
A-56 FINAL - October 2010

Hydropower Modernization InitiativeAssessment of Potential Capacity Increases at Existing Hydropower Plants
Summary of Capacity Increase Benefits and CostsYellowtail
Percent Capacity
Capacity Increase
Average Incremental
Energy
Total Incremental
Capacity
Construction & Mitigation Total Cost
Construction & Mitigation Total Cost
PV of Total Costs
PV of Energy
Benefits
PV of Capacity Benefits
PV of Total
Benefits
NPV of Total
Benefits B/CIncrease (MW) (MWh/yr) Factor ($M) ($/kW) ($M) ($M) ($M) ($M) ($M) Ratio
10% 25.0 3,458 2% $32.9 $1,316 $45.9 $3.7 $7.4 $11.1 -$34.8 0.2420% 50.0 6,327 1% $58.3 $1,165 $80.2 $6.8 $14.3 $21.1 -$59.1 0.2630% 75.0 8,526 1% $81.5 $1,086 $111.2 $9.2 $20.8 $30.0 -$81.2 0.2740% 100.0 10,049 1% $103.4 $1,034 $140.2 $10.8 $26.8 $37.6 -$102.6 0.2750% 125.0 11,286 1% $124.4 $995 $167.9 $12.1 $32.7 $44.8 -$123.1 0.27
0.20
0.25
0.30
$100.0
$150.0
$200.0
) Ratio
ars
Total Cost $ Total Benefit $ Net Present Value B/C Ratio
0.00
0.05
0.10
0.15
0.20
0.25
0.30
‐$150.0
‐$100.0
‐$50.0
$0.0
$50.0
$100.0
$150.0
$200.0
0.0 20.0 40.0 60.0 80.0 100.0 120.0 140.0
Bene
fit to
Cost (B/C) Ratio
Millions of D
ollars
Capacity Increase (MW)
Total Cost $ Total Benefit $ Net Present Value B/C Ratio
A-57 FINAL - October 2010

This page left blank intentionally.

U.S. Department of the Interior Bureau of Reclamation Denver, Colorado