Hydrometeorology Testbed (HMT) Roundup - … Testbed (HMT) Roundup Allen White 1, Marty Ralph , Rob...
52
Hydrometeorology Testbed (HMT) Roundup Allen White 1 , Marty Ralph 1 , Rob Cifelli 1 , Dave Reynolds 1,2 , Lynn Johnson 1,3 , Tim Schneider 4 , Zoltan Toth 1 , Ligia Bernardet 1,2 , Seth Gutman 1 , Dave Novak 5 , and Rich Lataitis 1 1 NOAA Earth System Research Laboratory, Boulder, CO 2 Cooperative Institute for Research in Environmental Sciences, U. of Colorado, Boulder, CO 3 Cooperative Institute for Research in the Atmosphere, Colorado State U., Ft. Collins, CO 4 NOAA National Weather Service Office of Hydrologic Development, Silver Spring, MD 5 NOAA National Weather Service Weather Prediction Center, College Park, MD NOAA Testbed Workshop, 2-4 April 2013, College, Park, MD
Transcript of Hydrometeorology Testbed (HMT) Roundup - … Testbed (HMT) Roundup Allen White 1, Marty Ralph , Rob...
Hydrometeorology Testbed (HMT) Roundup
Allen White1, Marty Ralph1, Rob Cifelli1, Dave Reynolds1,2, Lynn Johnson1,3, Tim Schneider4, Zoltan Toth1, Ligia Bernardet1,2,
Seth Gutman1, Dave Novak5, and Rich Lataitis1
1NOAA Earth System Research Laboratory, Boulder, CO 2Cooperative Institute for Research in Environmental Sciences, U. of Colorado, Boulder, CO
3Cooperative Institute for Research in the Atmosphere, Colorado State U., Ft. Collins, CO 4NOAA National Weather Service Office of Hydrologic Development, Silver Spring, MD
5NOAA National Weather Service Weather Prediction Center, College Park, MD
NOAA Testbed Workshop, 2-4 April 2013, College, Park, MD

• HMT Overview • Mission and organization • Why HMT? Ex: QPF skill in extreme events • HMT experiment locations
• HMT-West • Atmospheric Rivers and the ARRFEX • California’s HMT-Legacy Project
• Observations • NWP
• HMT-Northwest: The Howard A. Hanson Dam Flood Risk Management Crisis
• CalWater • Atmospheric Rivers and Aerosols
• Collaborations with the Sonoma County Water Agency • Quantitative Precipitation Information (QPI) • Heat/Frost Information
• HMT Southeast Pilot Study (HMT-SEPS) • HMT publications • Future work
Outline

The Hydrometerology Testbed (HMT) conducts research on precipitation and weather conditions that can lead to flooding, and fosters transition of scientific advances and new tools into forecasting operations. HMT's outputs support efforts to balance water resource demands and flood control in a changing climate. HMT aims to: • accelerate the development and prototyping of advanced hydrometeorological
observations, models, and physical process understanding
• foster infusion of these advances into operations of the National Weather Service (NWS) and the National Water Center (NWC)
• support the broader needs for 21st Century precipitation information for flood control, water management, and other applications
NOAA Hydrometeorology Testbed (HMT)
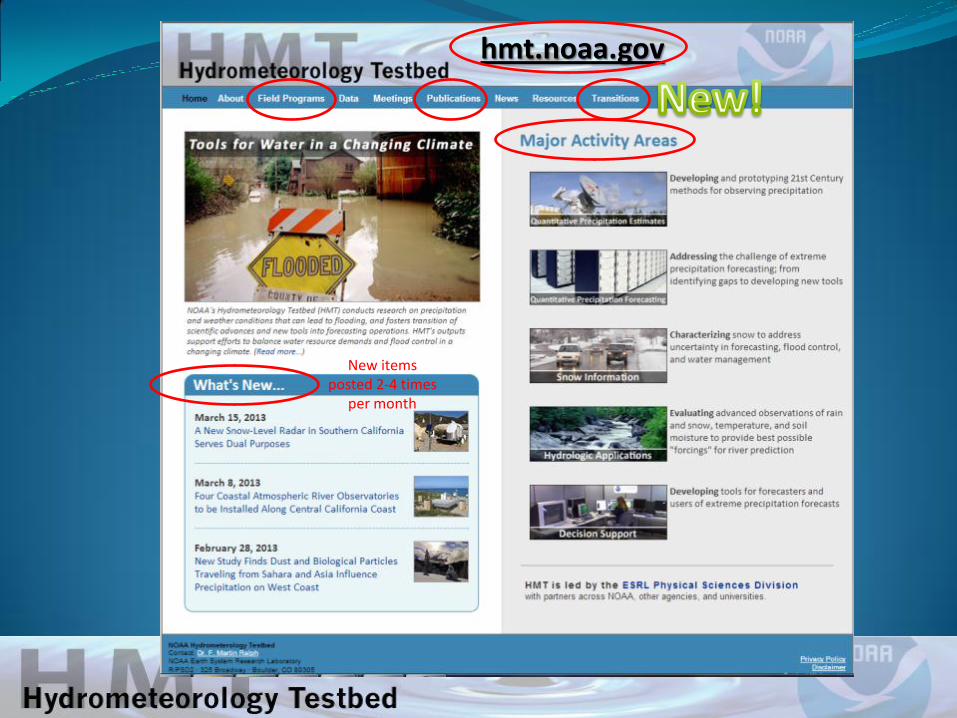
hmt.noaa.gov
New items posted 2-4 times
per month
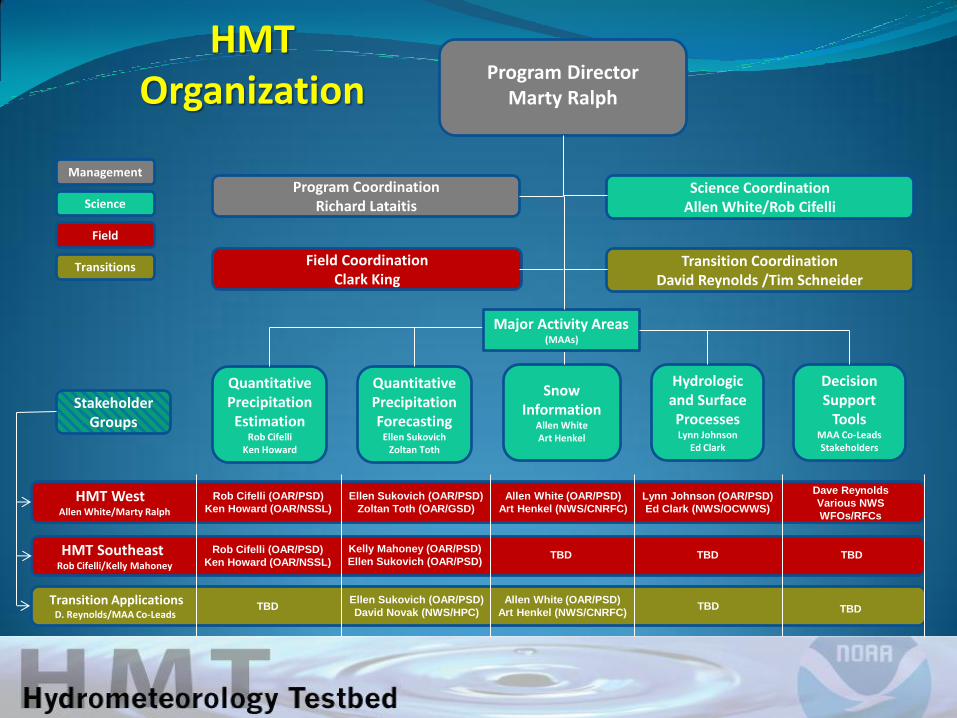
HMT Organization
Program Director Marty Ralph
Transition Coordination David Reynolds /Tim Schneider
Science Coordination Allen White/Rob Cifelli
Decision Support
Tools MAA Co-Leads Stakeholders
Hydrologic and Surface Processes Lynn Johnson
Ed Clark
Snow Information
Allen White Art Henkel
Quantitative Precipitation Forecasting
Ellen Sukovich Zoltan Toth
Quantitative Precipitation Estimation
Rob Cifelli Ken Howard
HMT Southeast Rob Cifelli/Kelly Mahoney
HMT West Allen White/Marty Ralph
Transition Applications D. Reynolds/MAA Co-Leads
TBD TBD Allen White (OAR/PSD)
Art Henkel (NWS/CNRFC)
Ellen Sukovich (OAR/PSD)
David Novak (NWS/HPC) TBD
Rob Cifelli (OAR/PSD)
Ken Howard (OAR/NSSL)
Ellen Sukovich (OAR/PSD)
Zoltan Toth (OAR/GSD)
Allen White (OAR/PSD)
Art Henkel (NWS/CNRFC)
Lynn Johnson (OAR/PSD)
Ed Clark (NWS/OCWWS)
Dave Reynolds
Various NWS
WFOs/RFCs
Rob Cifelli (OAR/PSD)
Ken Howard (OAR/NSSL)
Major Activity Areas (MAAs)
Program Coordination Richard Lataitis
Field Coordination Clark King
Stakeholder
Groups
Kelly Mahoney (OAR/PSD)
Ellen Sukovich (OAR/PSD) TBD TBD TBD
Management
Science
Field
Transitions

Why do we need HMT? Example: Precipitation Forecast Skill
1 inch
2 inches
4 inches
Courtesy Dave Novak, NOAA/NWS/WPC

Why Improve QPF? Improving the amount, type, location and timing of quantitative precipitation forecasts (QPF) and probabilistic quantitative precipitation forecasts (PQPF) are key elements to enhance the information content and reliability of these forecasts.
Water Resource Managers
Agriculture
Transportation
Emergency Management
Who needs accurate and reliable QPFs?
Public
See poster led by Ellen Sukovich
on Wednesday afternoon:
Analyzing Extreme Quantitative
Precipitation Forecast Performance

Examples of several key drivers for improved understanding
and prediction of the water cycle. (Courtesy Don Cline)
An Interagency Planning Workshop on Water Cycle Science for NOAA recommended several goals that HMT addresses and called for increased support and for coordination with other agencies.
Water is One of NOAA’s Five Grand Science Challenges
http://nrc.noaa.gov/CouncilProducts/WhitePapers.aspx
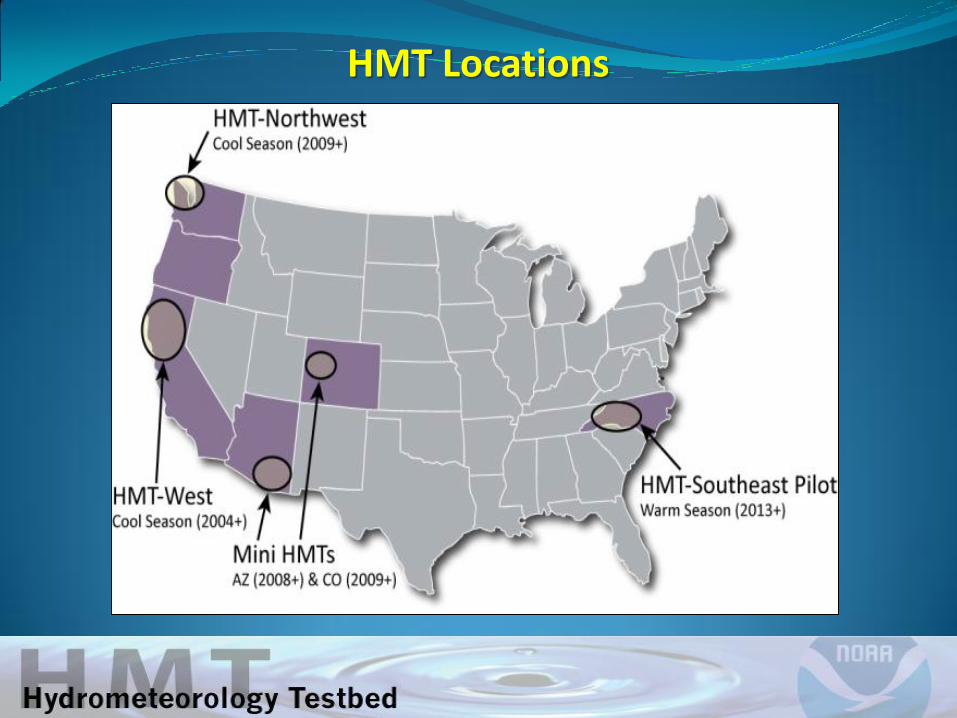
HMT Locations
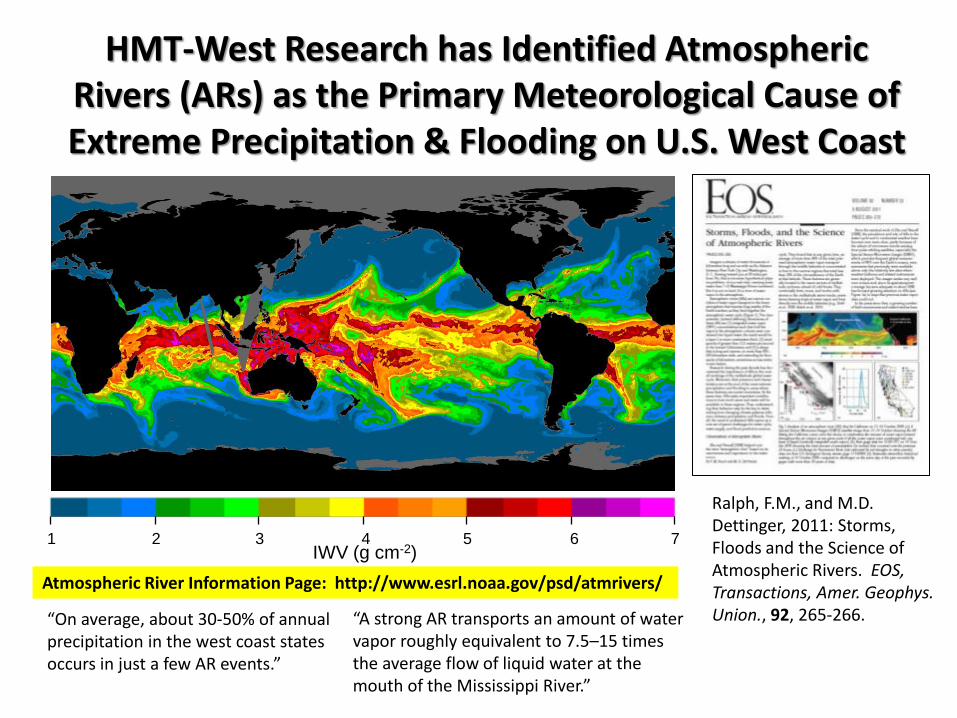
HMT-West Research has Identified Atmospheric Rivers (ARs) as the Primary Meteorological Cause of Extreme Precipitation & Flooding on U.S. West Coast
Ralph, F.M., and M.D. Dettinger, 2011: Storms, Floods and the Science of Atmospheric Rivers. EOS, Transactions, Amer. Geophys. Union., 92, 265-266.
1 2 3 4 5 6 7 IWV (g cm-2)
Atmospheric River Information Page: http://www.esrl.noaa.gov/psd/atmrivers/
“On average, about 30-50% of annual precipitation in the west coast states occurs in just a few AR events.”
“A strong AR transports an amount of water vapor roughly equivalent to 7.5–15 times the average flow of liquid water at the mouth of the Mississippi River.”

Ralph et al. (2013), JHM (accepted)
AR Duration is a Critical Component of Flooding 10 longest duration ARs (>31 h) Average of all 91 ARs
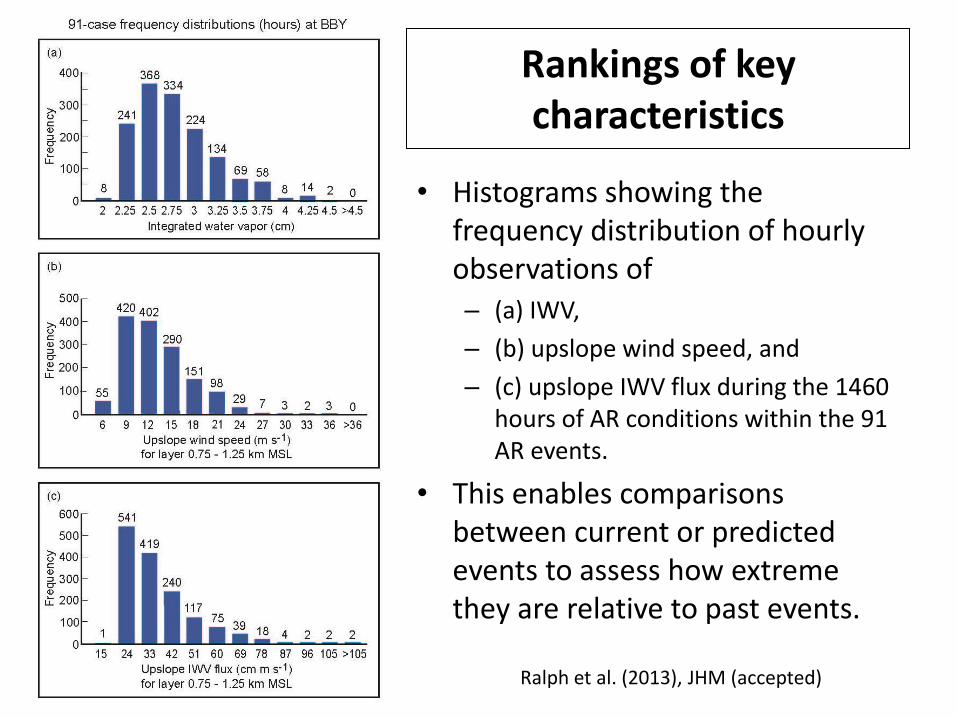
Rankings of key characteristics
• Histograms showing the frequency distribution of hourly observations of – (a) IWV,
– (b) upslope wind speed, and
– (c) upslope IWV flux during the 1460 hours of AR conditions within the 91 AR events.
• This enables comparisons between current or predicted events to assess how extreme they are relative to past events.
Ralph et al. (2013), JHM (accepted)
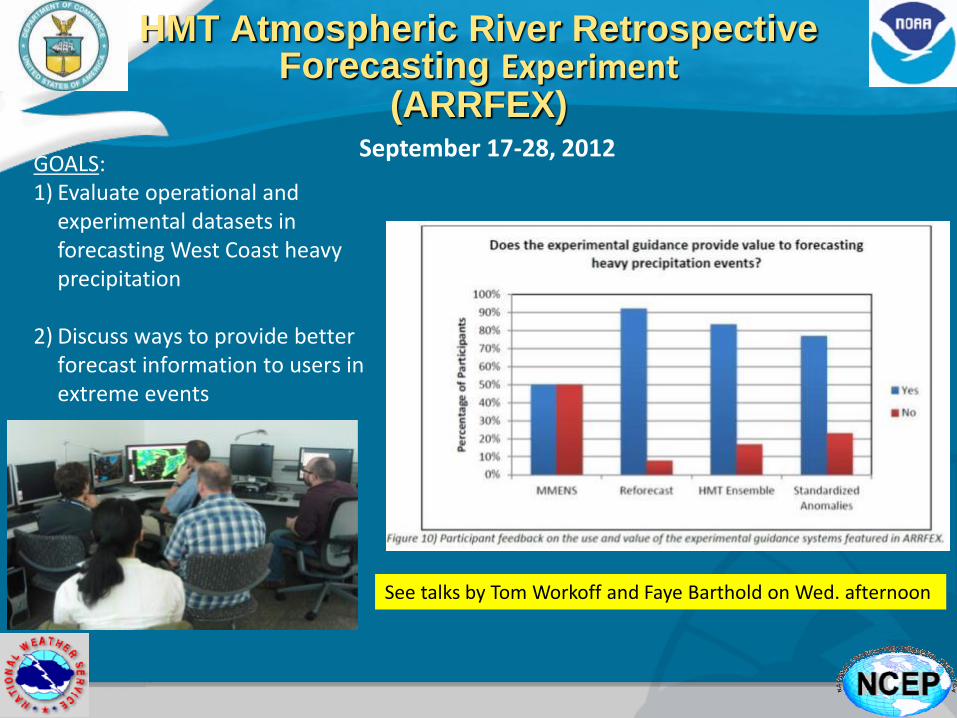
HMT Atmospheric River Retrospective Forecasting Experiment
(ARRFEX) September 17-28, 2012
See talks by Tom Workoff and Faye Barthold on Wed. afternoon
GOALS: 1) Evaluate operational and
experimental datasets in forecasting West Coast heavy precipitation
2) Discuss ways to provide better
forecast information to users in extreme events

14
Time of max. IWV flux at BBY: 1500 UTC 4-Jan-08 4 Jan 2008, 1500 UTC
Time (UTC)
CZD rain: 264mm BBY rain: 36mm
7.3:1
4 Jan 2008, 2100 UTC Time of max. IWV flux at PPB: 2100 UTC 4-Jan-08
Time (UTC)
TPK rain: 320mm PPB rain: 75mm 4.3:1
AR Propagation: ~12 m s-1.
½-day lead time for SoCal
Max. IWV flux in AR highly correlated with max. mountain rainfall at each site
5 Jan 2008, 0300 UTC
Time of max. IWV flux at GLA: 0300 UTC 5-Jan-08
Time (UTC)
SMC rain: 230mm GLA rain: 51mm 4.5:1
22
15
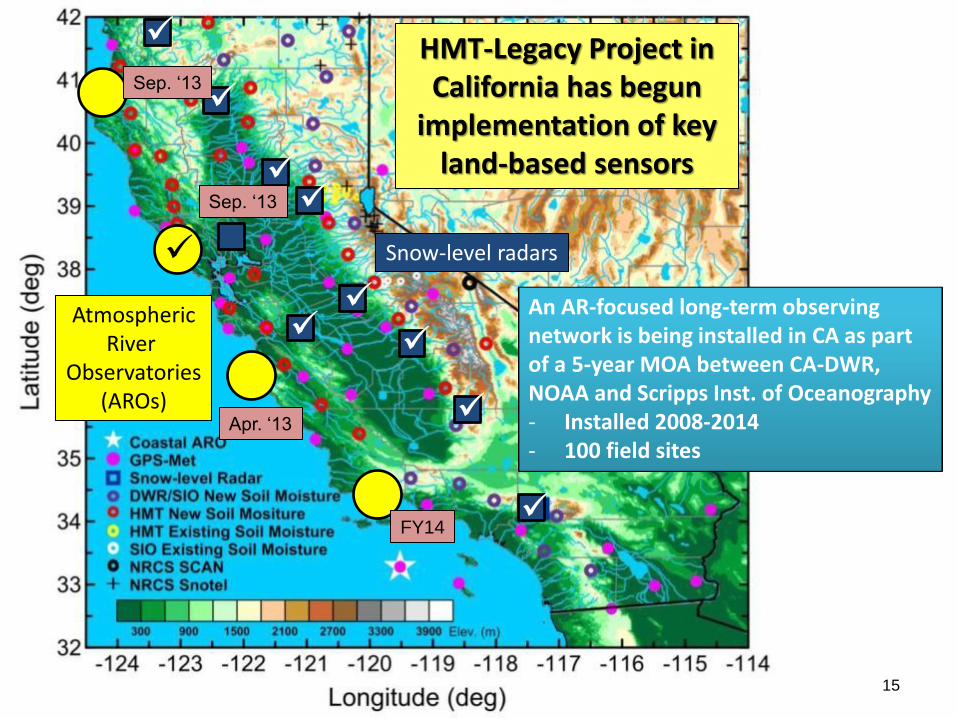
An AR-focused long-term observing network is being installed in CA as part of a 5-year MOA between CA-DWR, NOAA and Scripps Inst. of Oceanography - Installed 2008-2014 - 100 field sites
HMT-Legacy Project in California has begun
implementation of key land-based sensors
Atmospheric River
Observatories (AROs)
Snow-level radars
Apr. ‘13
Sep. ‘13
Sep. ‘13
FY14
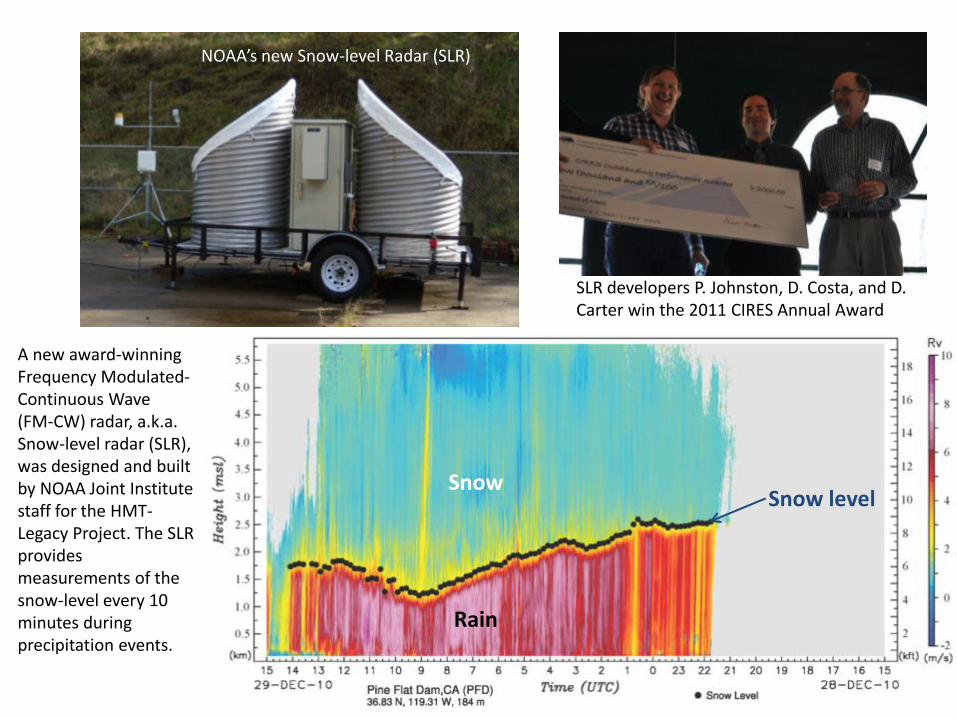
SLR developers P. Johnston, D. Costa, and D. Carter win the 2011 CIRES Annual Award
A new award-winning Frequency Modulated- Continuous Wave (FM-CW) radar, a.k.a. Snow-level radar (SLR), was designed and built by NOAA Joint Institute staff for the HMT-Legacy Project. The SLR provides measurements of the snow-level every 10 minutes during precipitation events.
Snow
Rain
NOAA’s new Snow-level Radar (SLR)
Snow level

Data and Instrument Displays in Google Maps
HMT-Legacy Project
observational data
are also being sent to
MADIS, CDEC, and
in SHEF-encoded
format to NWS
Western Region for
distribution to WFOs
and the RFC

HMT-West Scanning Radar Loops in Google Maps

Alt
itu
de
MSL
(km
)
0
1
2
3
GPS satellite
GPS-met receiver
Wind profiler (915 or 449 MHz)
10-m surface meteorology
tower
Wind profiler beam with 100-m vertical resolution
Atmospheric River
“Controlling layer” (upslope winds)
Surface friction and barrier jet
S-PROF precipitation
profiler; surface met; disdrometer
Snow level
Orographic cloud and precipitation
Atmospheric River Observatory (ARO)
0-50 km between wind profiler/GPS-met site and S-PROF precipitation profiler
Ocean
Rain shadow
Plan view Rain
shadow
Wind direction
in AR Mountains
S-PROF data up to 10 km MSL
ARO
19

HMT Engineers Work Tirelessly to Install an ARO at Bodega Bay, CA the week of March 18th 2013
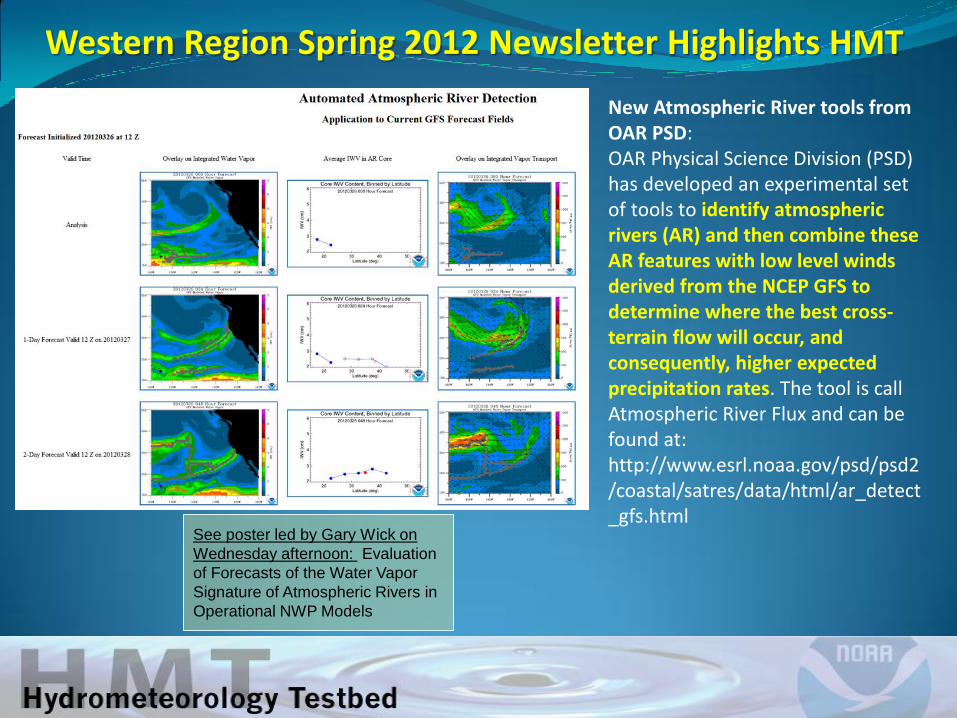
New Atmospheric River tools from OAR PSD: OAR Physical Science Division (PSD) has developed an experimental set of tools to identify atmospheric rivers (AR) and then combine these AR features with low level winds derived from the NCEP GFS to determine where the best cross-terrain flow will occur, and consequently, higher expected precipitation rates. The tool is call Atmospheric River Flux and can be found at: http://www.esrl.noaa.gov/psd/psd2/coastal/satres/data/html/ar_detect_gfs.html
Western Region Spring 2012 Newsletter Highlights HMT
See poster led by Gary Wick on
Wednesday afternoon: Evaluation
of Forecasts of the Water Vapor
Signature of Atmospheric Rivers in
Operational NWP Models

Western Region Spring 2012 Newsletter Highlights HMT
AR Observatory: A few sites have a number of sensors, which combined with the RUC, can be used to provide a more integrated view of the atmosphere. They are called AR Observatories and an example of the integrated model/data graphic is displayed below. All of the data can be found at: http://www.esrl.noaa.gov/psd/data/obs/ - click on the sites with “vapor flux”.
2010 Dept. of Commerce Bronze Medal

The HMT High-Resolution Deterministic Model
Five-hour forecast of composite reflectivity (dBZ) initialized on 3/19/13, 08 UTC.
CONFIGURATION: WRF-ARW • 3-km grid spacing over west coast • Initialized hourly; ran to 12 h • Initialization: NAM + LAPSt
• Boundary Conditions: NAM • Microphysics: Thompson scheme
PRIMARY APPLICATION: input for the HMT flux tool
LAPS (Local Analysis and Prediction System) • Blends a variety of in-situ and remote observations • Has hot start capability to add clouds and vertical
model at model initialization time • LAPSt: traditional (Barnes) analysis • LAPSv: multi-scale variational analysis
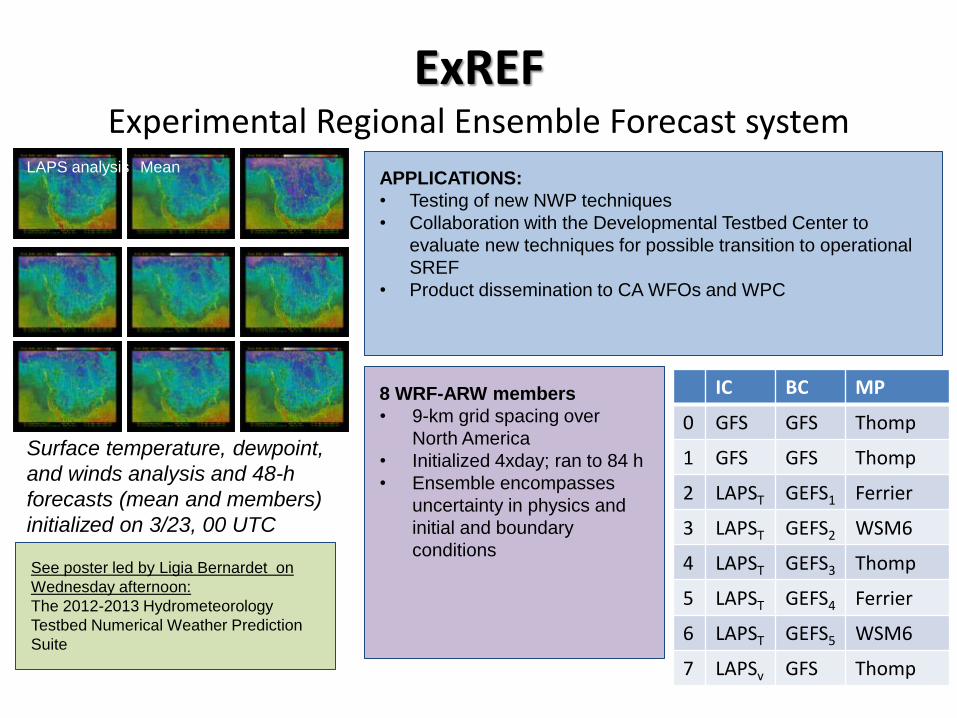
ExREF Experimental Regional Ensemble Forecast system
Mean LAPS analysis
Surface temperature, dewpoint,
and winds analysis and 48-h
forecasts (mean and members)
initialized on 3/23, 00 UTC
8 WRF-ARW members
• 9-km grid spacing over
North America
• Initialized 4xday; ran to 84 h
• Ensemble encompasses
uncertainty in physics and
initial and boundary
conditions
APPLICATIONS:
• Testing of new NWP techniques
• Collaboration with the Developmental Testbed Center to
evaluate new techniques for possible transition to operational
SREF
• Product dissemination to CA WFOs and WPC
IC BC MP
0 GFS GFS Thomp
1 GFS GFS Thomp
2 LAPST GEFS1 Ferrier
3 LAPST GEFS2 WSM6
4 LAPST GEFS3 Thomp
5 LAPST GEFS4 Ferrier
6 LAPST GEFS5 WSM6
7 LAPSv GFS Thomp
See poster led by Ligia Bernardet on
Wednesday afternoon:
The 2012-2013 Hydrometeorology
Testbed Numerical Weather Prediction
Suite

Initial Conditions Testing
• ExREF is a tool for testing new generations of NWP systems
• If value is demonstrated, innovations can be transitioned to operations
• ExREF initial conditions are being upgraded to use dynamic downscaling of perturbations
Forecasts will be initialized from a blend of local analyses and perturbations (differences between GEFS control and members.
Local analyses will be produced by a model run nudged towards LAPS analysis. This approach makes LAPS analyses more consistent with WRF to reduce spin up.
See poster led by Isidora Jankov on Wedensday afternoon: Initial Condition Perturbation Tests within Experimental Regional Ensemble Forecasting (ExREF) System for the purpose of Hydrometeorological Testbed
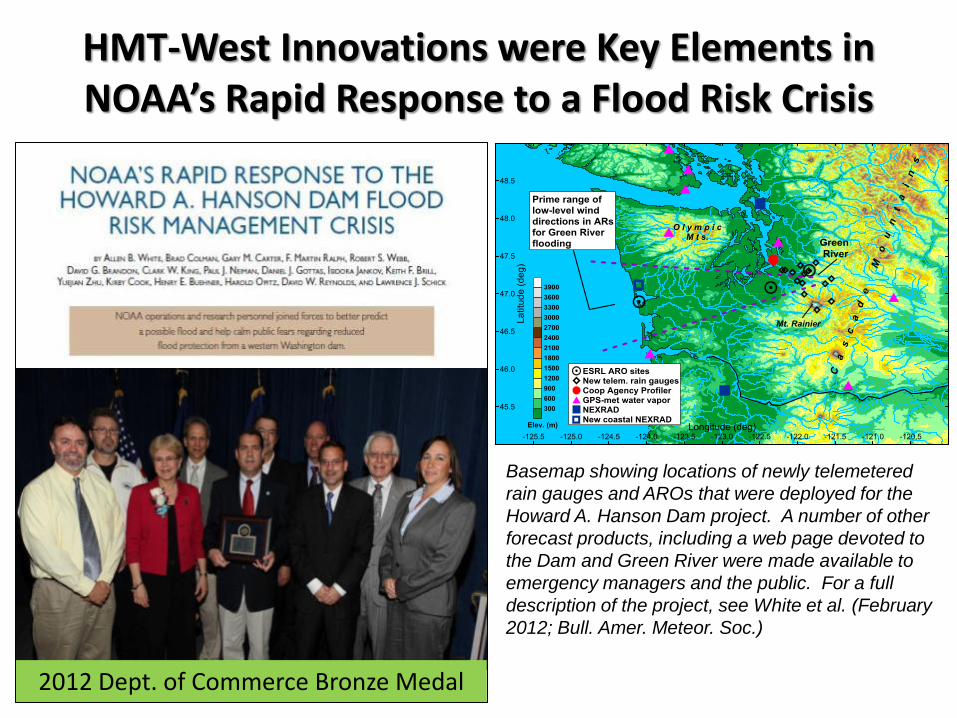
HMT-West Innovations were Key Elements in NOAA’s Rapid Response to a Flood Risk Crisis
2012 Dept. of Commerce Bronze Medal
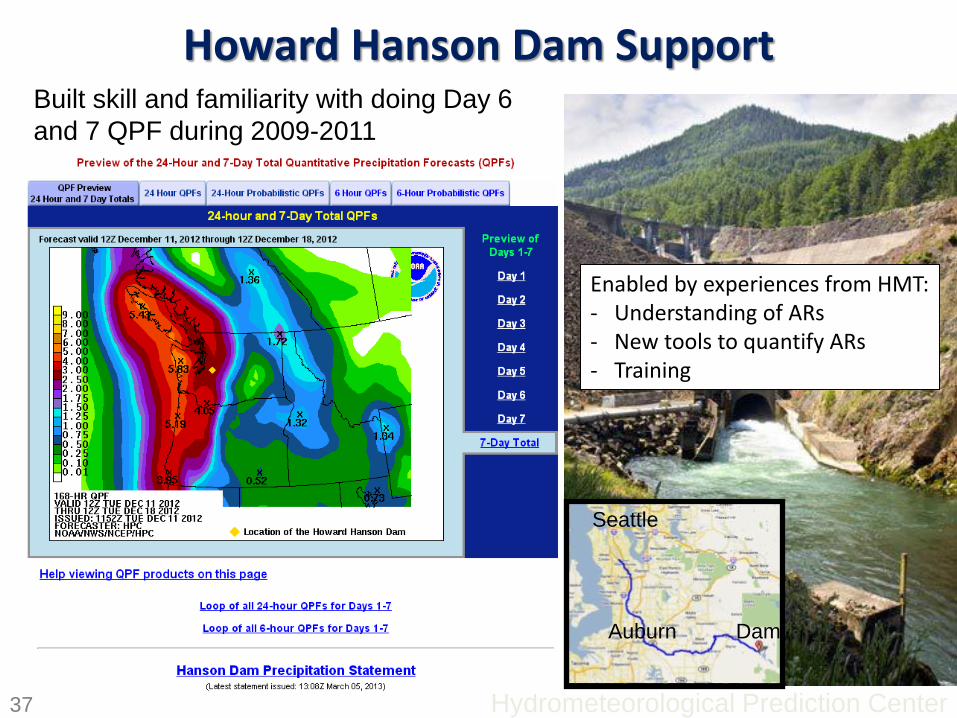
Basemap showing locations of newly telemetered
rain gauges and AROs that were deployed for the
Howard A. Hanson Dam project. A number of other
forecast products, including a web page devoted to
the Dam and Green River were made available to
emergency managers and the public. For a full
description of the project, see White et al. (February
2012; Bull. Amer. Meteor. Soc.)
Hydrometeorological Prediction Center
Howard Hanson Dam Support
37
Seattle
Auburn Dam
Built skill and familiarity with doing Day 6
and 7 QPF during 2009-2011
Enabled by experiences from HMT: - Understanding of ARs - New tools to quantify ARs - Training

53
QPF out to Day 7
December 2010 7
day rainfall
Dec 17-24, 2010
Building on technical and forecasting
experience of the Howard Hanson
Dam monitoring, Day 6-7 QPF was
expanded to the CONUS on an
experimental basis.
Soliciting comments through
April 30, 2013

WPC QPF Services
Deterministic QPF
Excessive Rainfall
54
QPF Desk
Probabilistic QPF
MetWatch Desk
Mesoscale Precipitation
Discussion
Medium Range Desk
Day 4-7 QPF

Multi-wind Direction Display for Westport ARO
New water vapor flux displays requested by Seattle WFO
When Westport ARO S-PROF was interfering with the new coastal NEXRAD, we offered to move the ARO, but here’s what the WCM from Seattle said: “The current site has some history now and its orientation to moisture moving into the interior of western Washington is excellent. We also would like to compare its output with the new radar data. So moving the ARO to another location....well, we'd really rather not.”

HMT-West infrastructure was the basis for development of a
major field experiment – CalWater that ran from 2009-2011
CalWater generated $5 M of
external funding that supported
• University PIs
• DOE scientists
• Cooperative Institutes
• NOAA/ESRL/PSD
A sample finding:
Asian aerosols were present in CA precipitation
when an aerosol plume intersected the top of
orographic clouds over the Sierras.
Ault et al. (2011, JGR)

Dust and Biological Aerosols from the Sahara and Asia Influence Precipitation in the Western U.S.
Jessie M. Creamean,1* Kaitlyn J. Suski,1* Daniel Rosenfeld,2 Alberto Cazorla,1 Paul J. DeMott,3 Ryan C. Sullivan,4 Allen B. White,5 F. Martin Ralph,5,6 Patrick Minnis,7 Jennifer M. Comstock,8 Jason M. Tomlinson,8 Kimberly A. Prather1,6 1Department of Chemistry and Biochemistry, University of California, San Diego, La Jolla, CA 92093, USA. 2Institute of Earth Sciences, The Hebrew University of Jerusalem, Jerusalem 91904, Israel. 3Department of Atmospheric Science, Colorado State University, Fort Collins, CO 80523, USA. 4Center for Atmospheric Particle Studies, Carnegie Mellon University, Pittsburgh, PA 15213, USA. 5Physical Sciences Division, National Oceanic and Atmospheric Administration/Earth System Research Laboratory, Boulder, CO 80305, USA. 6Scripps Institution of Oceanography, University of California, San Diego, La Jolla, CA 92093, USA. 7NASA Langley Research Center, Hampton, VA 23681, USA. 8Atmospheric Sciences and Global Change Division, PNNL, Richland, WA 99352, USA. *These authors contributed equally to this work. Published Online February 28 2013

Long-range transported dust
and biological aerosols
Mid-level orographic cloud (ice formation from dust and biological IN)
Stratiform cloud (droplets formed from
sea salt and rimed ice
crystals)
Ice rimes and
falls
Snow/graupel
Pacific
Ocean Central Valley
1
2
3
4
5
6
Sierra Nevada Range
0°C level
Cold rain Sierra Barrier Jet (SBJ)
(contains boundary layer pollution)
Atmospheric
river (AR) (moist, marine air)
Alt
itu
de
(km
, M
SL
)
(A) Prefrontal
Dust/biological aerosol
Cloud droplet formed from sea salt Ice crystal (grown from initial ice
crystal)
Highly rimed ice crystal
Snow
Graupel
Cold rain
Warm rain Supercooled cloud droplet
Initial ice crystal formed from
dust/biological aerosol
Creamean et al. (2013, Science)

Alt
itu
de
(km
, M
SL
)
Long-range transported
dust and biological aerosols
Mid-level orographic cloud (ice formation from dust and
biological IN)
Lower-level convective cloud (droplets formed from sea salt and
rimed ice crystals)
Ice rimes and
falls
Snow/graupel
Pacific
Ocean
Cloud gap
Central Valley
1
2
3
4
5
6
Sierra Nevada Range
0°C level
Cold rain Postfrontal
marine air
Dust/biological aerosol
Cloud droplet formed from sea salt Ice crystal (grown from initial ice
crystal)
Highly rimed ice crystal
Snow
Initial ice crystal formed from
dust/biological aerosol Graupel
Cold rain
Warm rain Supercooled cloud droplet
(B) Postfrontal
Creamean et al. (2013, Science)

Russian
River
Basin
Napa
River
Basin
QPE Analysis
Region
Phase I of Russian River Study with HMT and the Sonoma County Water Agency (SCWA): • Improve Quantitative Precipitation
Information (QPI) for the Russain River basin • Evaluate the benefit of TV radar
(KPIX). • Determine best combination of
radar and gauges to produce best possible QPE to drive hydro forecasts
• Provide high resolution temperature forecasts to mitigate Russian River draw down during frost and heat wave events
See talk by Rob Cifelli on Wed. afternoon

Red – analysis gauges Yellow – independent HMT gauges for verification
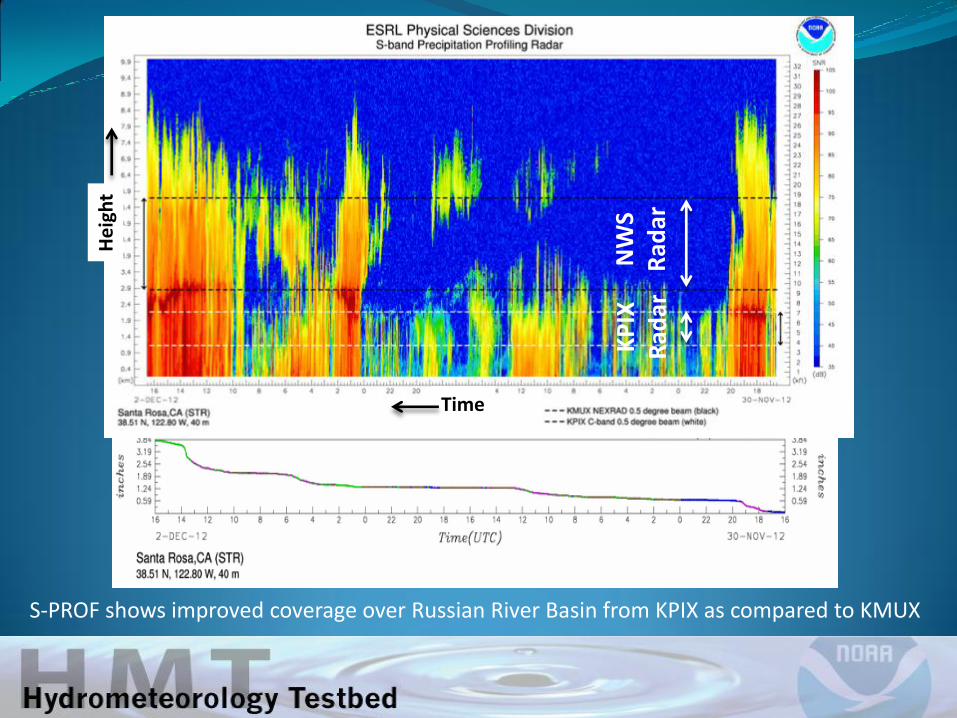
•S-PROF radar •Disdrometer •Surface Met
• S-PROF data used for Vertical Profile of Reflectivity (VRP) correction and to demonstrate spatial coverage of operational and TV radars
• Disdrometer data used to calibrate radars
NW
S R
adar
K
PIX
R
adar
Time
He
igh
t
S-PROF shows improved coverage over Russian River Basin from KPIX as compared to KMUX
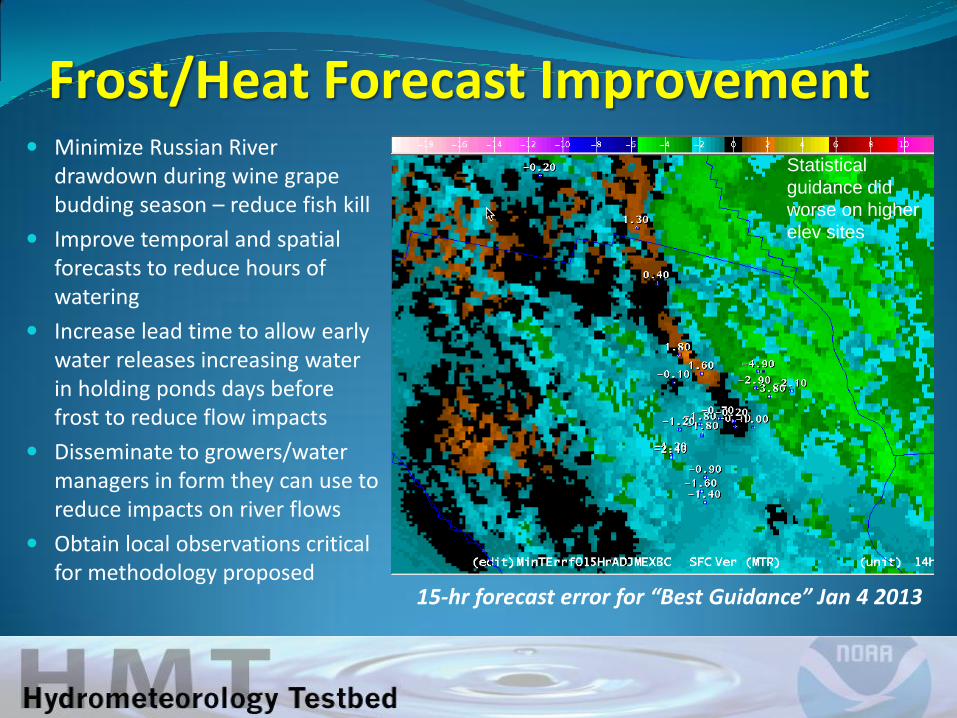
Frost/Heat Forecast Improvement Minimize Russian River
drawdown during wine grape budding season – reduce fish kill
Improve temporal and spatial forecasts to reduce hours of watering
Increase lead time to allow early water releases increasing water in holding ponds days before frost to reduce flow impacts
Disseminate to growers/water managers in form they can use to reduce impacts on river flows
Obtain local observations critical for methodology proposed
15-hr forecast error for “Best Guidance” Jan 4 2013
Statistical
guidance did
worse on higher
elev sites

Model Spectrum web page showing plot of available numerical and statistical minimum temperature forecasts along with NWS “official” forecast. Top is raw model forecasts and bottom shows forecasts after applying 10 day bias correction
Raw
Model
Bias Corrected

Geyserville SODAR
Fans?
Sprinklers

Russian-Napa Basins 2-D Hydro Model Purpose:
Account for spatial distribution of rain, topography, soils, land use and runoff
Tool to assess QPE/QPF products Research Distributed Hydrologic Model (RDHM)
Developed by NWS-OHD for nation-wide deployment
2-D using HRAP grid ~4 km side, 6 hr 1 km side, 1 hr
Gridded precipitation and surface temperature
Sacramento Soil Moisture Accounting Model (SAC-SMA) in each grid cell
Connectivity derived from DEM Runoff (overland and channel) routed by
kinematic wave equations Soils parameters based on SSURGO Channel routing based on USGS field
measurements Soil moisture linked to observations
Santa Rosa Creek at Santa Rosa
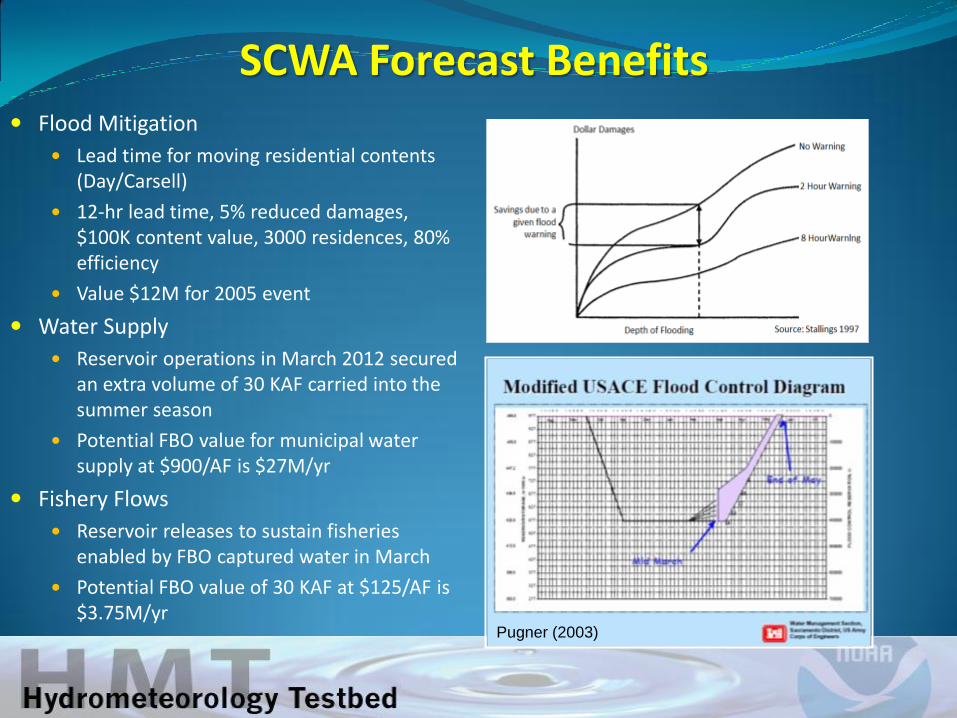
SCWA Forecast Benefits Flood Mitigation
Lead time for moving residential contents (Day/Carsell)
12-hr lead time, 5% reduced damages, $100K content value, 3000 residences, 80% efficiency
Value $12M for 2005 event
Water Supply
Reservoir operations in March 2012 secured an extra volume of 30 KAF carried into the summer season
Potential FBO value for municipal water supply at $900/AF is $27M/yr
Fishery Flows
Reservoir releases to sustain fisheries enabled by FBO captured water in March
Potential FBO value of 30 KAF at $125/AF is $3.75M/yr
Pugner (2003)

Water Management Actions
HMT Focus

HMT Southeast Pilot Study (HMT-SEPS)
Timeline-Location • May 2013 – September 2014 in western
North Carolina
Objectives • Warm season QPE and QPF for extreme
events • Evaluation and improvement of QPE algorithms • Improved understanding of moisture sources and
transport
Partners • NASA GPM • NOAA GPM Proving Ground
• NCEP CPC, NESDIS STAR, NWS OHD • NWS Eastern & Southern Region & SERFC • NC State, Duke, other Universities • NSSL
Management Structure http://hmt.noaa.gov/field_programs/hmt-se/


Melissa Tuttle Carr
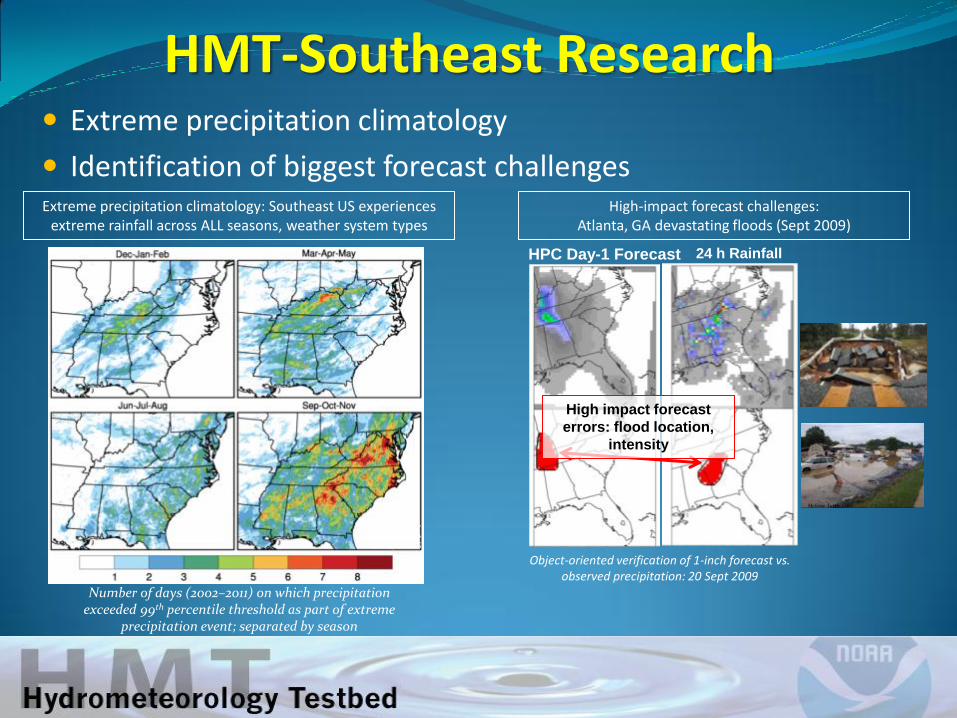
HMT-Southeast Research Extreme precipitation climatology
Identification of biggest forecast challenges
HPC Day-1 Forecast 24 h Rainfall
High impact forecast
errors: flood location,
intensity
Object-oriented verification of 1-inch forecast vs. observed precipitation: 20 Sept 2009
High-impact forecast challenges: Atlanta, GA devastating floods (Sept 2009)
Extreme precipitation climatology: Southeast US experiences extreme rainfall across ALL seasons, weather system types
Ben Moore, NOAA
ESRL/CIRES
Number of days (2002–2011) on which precipitation exceeded 99th percentile threshold as part of extreme
precipitation event; separated by season
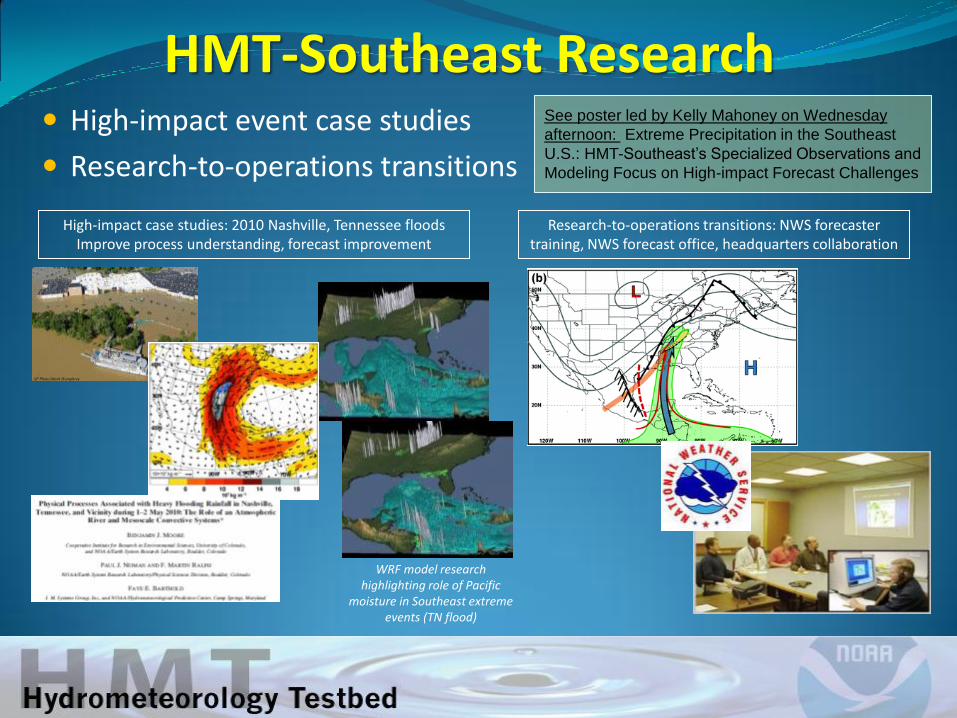
High-impact event case studies
Research-to-operations transitions
AP Photo/Mark Humphrey
Research-to-operations transitions: NWS forecaster training, NWS forecast office, headquarters collaboration
High-impact case studies: 2010 Nashville, Tennessee floods Improve process understanding, forecast improvement
WRF model research highlighting role of Pacific
moisture in Southeast extreme events (TN flood)
HMT-Southeast Research See poster led by Kelly Mahoney on Wednesday
afternoon: Extreme Precipitation in the Southeast
U.S.: HMT-Southeast’s Specialized Observations and
Modeling Focus on High-impact Forecast Challenges
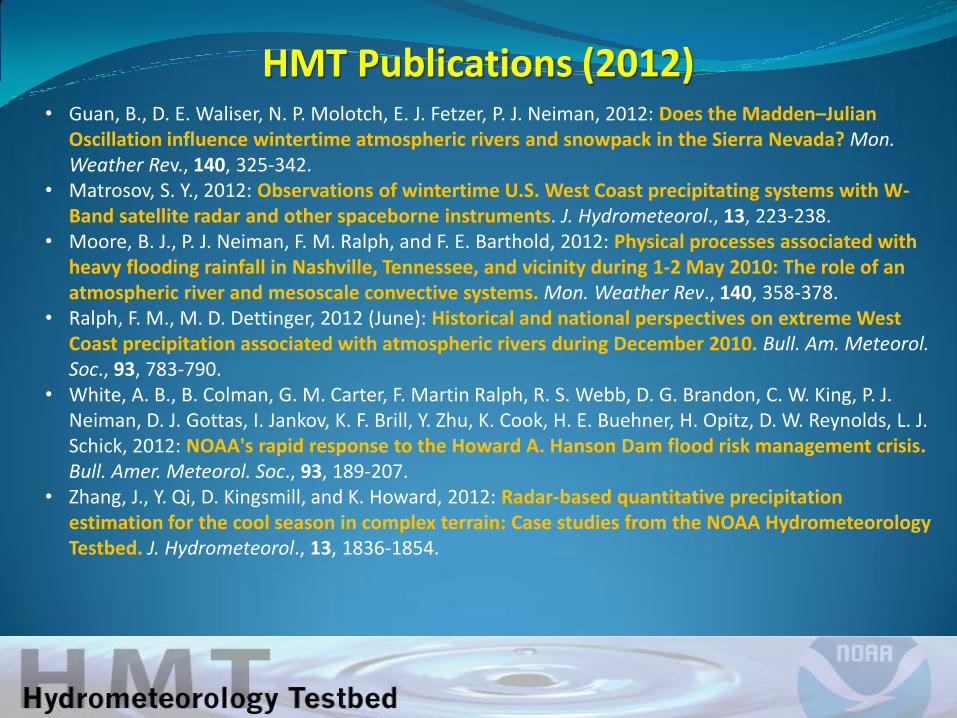
• Guan, B., D. E. Waliser, N. P. Molotch, E. J. Fetzer, P. J. Neiman, 2012: Does the Madden–Julian Oscillation influence wintertime atmospheric rivers and snowpack in the Sierra Nevada? Mon. Weather Rev., 140, 325-342.
• Matrosov, S. Y., 2012: Observations of wintertime U.S. West Coast precipitating systems with W-Band satellite radar and other spaceborne instruments. J. Hydrometeorol., 13, 223-238.
• Moore, B. J., P. J. Neiman, F. M. Ralph, and F. E. Barthold, 2012: Physical processes associated with heavy flooding rainfall in Nashville, Tennessee, and vicinity during 1-2 May 2010: The role of an atmospheric river and mesoscale convective systems. Mon. Weather Rev., 140, 358-378.
• Ralph, F. M., M. D. Dettinger, 2012 (June): Historical and national perspectives on extreme West Coast precipitation associated with atmospheric rivers during December 2010. Bull. Am. Meteorol. Soc., 93, 783-790.
• White, A. B., B. Colman, G. M. Carter, F. Martin Ralph, R. S. Webb, D. G. Brandon, C. W. King, P. J. Neiman, D. J. Gottas, I. Jankov, K. F. Brill, Y. Zhu, K. Cook, H. E. Buehner, H. Opitz, D. W. Reynolds, L. J. Schick, 2012: NOAA's rapid response to the Howard A. Hanson Dam flood risk management crisis. Bull. Amer. Meteorol. Soc., 93, 189-207.
• Zhang, J., Y. Qi, D. Kingsmill, and K. Howard, 2012: Radar-based quantitative precipitation estimation for the cool season in complex terrain: Case studies from the NOAA Hydrometeorology Testbed. J. Hydrometeorol., 13, 1836-1854.
HMT Publications (2012)

• Creamean, J. M., D. J. Suski, D Rosenfeld, A. Cazorla, P. J. DeMott, R. C. Sullivan, A. B. White, F. M. Ralph, P. Minnis, J. M. Comstock, J. M. Tomlinson, K. A. Prather, 2013: Dust and biological aerosols from the Sahara and Asia influence precipitation in the Western US. Science, Online release.
• Dettinger, M., and Ingram, L., 2013: The coming megafloods. Scientific American, 308, 64-71. • Kingsmill, D. E., P. J. Neiman, B. J. Moore, M. Hughes, S. E. Yuter, and M. Ralph, 2013: Kinematic and
thermodynamic structures of Sierra barrier jets and overrunning atmospheric rivers during a land-falling winter storm in northern California. Mon. Weather Rev., Online release.
• Matrosov, S. Y., R. Cifelli., and D. Gochis 2013 : Measurements of heavy convective rainfall in presence of hail in flood-prone areas using an X-band polarimetric radar. J. Appl. Meteorol. Clim., 52, 395-407.
• Minder, J. R., and D. E. Kingsmill, 2013: Mesoscale variations of the atmospheric snow-line over the northern Sierra Nevada: Multi-year statistics, case study, and mechanisms. J. Atmos. Sci., 70, 916-938.
• Mizukami, N., V. Koren, M. Smith, D. Kingsmill, Z. Xhang, B. Cosgrove, and Z. Cui, 2013: The impact of precipitation type discrimination on hydrologic simulation - rain-snow partitioning derived from HMT-West radar-detected bright-band height versus surface temperature data. J. Hydrometeorol., Online release.
• Ralph, F. M., T. Coleman, P. J. Neiman, R. J. Zamora, and M. D. Dettinger, 2013: Observed impacts of duration and seasonality of atmospheric-river landfalls on soil moisture and runoff in coastal northern California. J. Hydrometeorol., Online release.
HMT Publications (2013)

HMT Future Work (FY13-15) Finish HMT-Legacy observing system
deployments in California
Formalize 2nd MOU with CA-DWR Observing network O&M funding
Network optimization studies
Development of decision support tools
Begin HMT-SEPS in North Carolina NOAA component FY13-14
NASA component FY14
Formalize amendment to MOU with SCWA AR case studies for reservoir operations
Improved QPE for the Russian River Basin
Additional rain gauge/soil moisture monitoring sites
Benefits analysis
Implement plans for CalWater 2
Global Energy and Water Exchanges
NNEEWWSS
Vol. 23, No. 1 February 2013
CalWater 2: Impacts of Pacific Atmospheric Rivers and Aerosols
on Extreme Precipitation Events