Hydrometeorological Report No. 2IB - nws.noaa.gov · FORE\IVORD "Preliminary Report on MaXimum...
52
Hydrometeorological Report No. 2IB Revised Report on Angeles California Prepared by Hydrometeorological of Hydrologic December 29, 1945 V'tar Departmen., Corps of Engineer ·· Departmen
-
Upload
nguyentruc -
Category
Documents
-
view
214 -
download
0
Transcript of Hydrometeorological Report No. 2IB - nws.noaa.gov · FORE\IVORD "Preliminary Report on MaXimum...

Hydrometeorological Report No. 2IB
Revised Report
on
Angeles Area~ California
Prepared by
Hydrometeorological
of Hydrologic
December 29, 1945
V'tar Departmen., Corps of =~~:.~-,~~·~.~· Engineer ·· Departmen
FORE\IVORD
"Preliminary Report on MaXimum Possible Preoipitatien, Los Angeles
Lrea, California11 was issued by the Hydromcteorologioal Section, in
cooperation with the Corps of Engineers, on December 30., 1944. Since
. then., further consultations with the Los Angeles District Engineer Office
have disclosed the need for certain revisions, a:nong them a specific
diff'erentiation between the estimates of the maximum ger;.eral Bnd the
maximtun local storms for the region. The Revised Report now issued
supersedes the Preliminary Report. It contains not only the revisions
requested but also the pertinent results of recent evolutionary changes
hydrometeorological technique.

~~or Los Angelos Storms
1. Tho dominating influences on tho weather of tho ontiro Wost Coast
ctro tho somipormanont pressure cantors ovor tho ocean which develop from
tho gonorul circulation of ·bho c.tmosphoro. Tho moan positions of those
somipormo.nont low- and high, ... prossuro centers arc at about 55<lN and 35°Nt'
rospocti voly. Following the annual march of tho solar altitude, tho so
pressure systems aro fe.rtnost south in tho vnntor and farthest north
:i.n -~ho summer. Tho lovof•prostiuro system is usuully rvforrod to a..s tho
.'Joutic.n Low and tho hig}1-prossuro system as tho Pa.cific High of tho
ro:cth Pa.cific Ocean. 1:. full discussion of tho soa.sona.l va.rio.ti on in
::trongth, ox-t;onb, position, ::md gonora.l cha.ro,ctoristics of those somi-
crmccnont cantors of a.ction is given in cha.ptor II, Dynamic Clima.tology,
nf :iiyd'."omotoorologica.l Report :No. 3, "Ma.ximum Possible. Proc:i.pita.tion
·:vdr tho Sa.cramonto Bas:i.n of Cal:!.fornic..!' 11
2, Tho ra.iny souson, or soason during vJhich mo.jor storms occur
r'ro:,· southern Co.lifornio., is Novombor through April. Tho southwo.rd dis•
pJ.o.oomont of both somip<>rlntmcnt centers of n.cticn during this period,
tc:S;:..rthor 1Ji th a. similur displc.como:nt of tho polc,r front ccnd tho mov.n storm
brings southern Ca.lifor:nia. undor tho influonco of cyclonic systems
r:ov).ng inhmd from th0 Po.cific. S·borns v:hich produce n.pproci::..blo ruin
c.long tho Pnoific Cor.st of tho United Stc.tos ma.y bo di vi dod into
Typos, but o.ll typos will ho.vo sono impo:rto.nt fon.turos in cor:u·.10n1 except
tho doco.dont trop:i.cctl storms which infrequently movo fa.r enough north
·c,) r.ffoct southern Cnlifornia.. Ba.sica.lly, tho loco.tion, intonsi ty, t10isturo
chc,rg;o, nnd movonont of tho .con·bors of lovr pro ssuro c.ro tho fc,ctors which
no.ko m~y storra a flood-producing atom for o. pa.rticulr.r noction of tho

Pc.cific Const region. Che.ptor V of tho Sr.cra.monte Report describes fully
tho major foo.turos of flood-producing sterns for tho So.cro.monto Bo.sin n.nd
those n.ro o.pplioctblo also to flood-producing; storms over southern Cr.lifornie .•
3,. Ton of tho nk"\.jor sterns of record over southern California. ho.ve
boon subjected to n criticc.l :.:malys:ts to dotormino v.rhothcr or not thoro
Trns o.ny sinilnrity in tho gonorc.l fco.tures of tho storr:J.s.. Tho woc,thor
rx<.p concurrent with tho period of groo.tost procipito.tion ht<.S boon used
c~s -:ho prino.ry bo.sis for conpo.rison. In e;enero.l .. o.ll storms which produce
~:.pprecio.ble ar.wunts of prooipio.tion over this o.roa hnvo sil:rl.lar che,ro.c
-~Gristics. Cyclonic systor.1s which result in gradient winds fron tho
::;cuthwost quo.dra.nt over southern Cr'.lifornio. produce procipitntion, and
i:---ri;onsi ty of procipi ta.tion vo.rios directly ·uith vv'ind voloci ty o.nd dowpoint
1'ui~. inversely vdth distance of tho cyclonic syston fror.1 tho urea.. Tho
-~~x ma;.scs involved differ only slightly in their ossontia.l charactoristioso
CNo:r l::trgo arotl.s tho effect of frontal o.otivi ty on dopth of procipi to.tion
j_s unir.1portcmt oxcopt thc..t tho sugo of o. well-defined cold or occluded
~'ront onds ony npprocictblo r.counulo.tion of ::woro.go depth. OVor sndl
:tro::ts 1 howovor 1 tho fronto.l so.go mny contribute n Lmrkod incrouso in
vpth because of tho haavior local precipitation occurring along tho
L"mt:;h lino v1ith its intensifying offoot on oonvorgonco.
±• Nino of tho storns anolyzod occurred with.t or following, tho
s )ut~r,-ro..rd push of a. cold pola.r o.ir ross into tho Mississippi cmd Missouri
l,u ilcJ.rs. In nest ousos tho storm dovolopod off tho ~vest 0oo.st whon tho
c}old "..ir ho.d sproo.d v!Cstwo.rd ovor tho Rocky Mountains into tho Groo.t
£:'-sin c.nd tho northwest sttl.tos. Associc.tod with tho lc.rgo ross of cold o.ir
ovor tho continent vms n widosproo.d high-pressure urou y;hich in ovary case

t:mdod nortlwrostv;nrd into Ala.skn. o.nd tho po1a.r region. In oa.ch storm
no highest pressure oxcoodod 1025 :millibars; during tho storms of
?nbrm~ry 1927, Doconbor 1933-Jo.nuo..ry 1934, o.nd Docoubor 1921, a.nd tho
b::o Jnnua.ry 1916 sterns, it oxcooclod 1040 r.ullibo.rs • Tho tonporn.turos
in tho polo.r a.ir vroro gonoro.lly vroll bolorr tho n.voro.go :mini:·ltlm tcnpor
aturos for tho soo.son of tho yoa.r, ranging from o.bout l0°F o.s tho po1a.r
c•.ir sproo.d south,mrd into tho Da.kota.s in tho il.pril 1926 stern, to tom
pora.turos bolovr -20°F in sovora.l of tho mid·wintor sterns. On tho ba.sis
of pressure pa.ttorns, tho nino storns mentioned c,bovo co.n bo di-vided
into two gonoro.l clo.ssos. In clo.ss 1, a low-pressure o.roc. oxtondod
fro;:J. Co.lifornia. vrost\n:.rd or northwostvvn.rd beyond tho Aleutian Islt:.mds
o.::·.d j.ncludod two or mora sopo.ro.to and vwll-dovolopod cantors. In clc.ss
2, o. 1twGo o.roo. of low rrossuro wa.s contorod off tho 1:Vost Coast, bounded
0'1 tho oust a.nd west by extensive high-pressure systor1s v;hich wore con
nected rm tho north by [l high-prosr:uro ridge. Tho hig;h pressure on tho
west v;o.s usuo.l1y contorod ovor tho Gulf of Llo.sko. nnd oxtondod fo.r south
wo.rd, doup into tho niddlo la.titudos.
5. Tho storms of Jnnur.ry 20-24, 1943 1 Fobruo.ry 27-Mc.rch 4 1 1938,
Duccubor 30_, 1933 - Jo.nuo.ry 1, 1934 1 Fobruo.ry 13-16, 19271 "·~pril 4-9,
J926, o.nd Fobruo.ry~17-22, 1914, o.ro clo.ss 1 sterns. Procipitr.tion in
thos) storus occurred in two po:docls o.ssocic,tod v.ri th tho po.ssc.go of tvo
cyc1o:r•io systons which novocl in over tho coo.st in close succession fron o.
·;J'Cl~':.::rly dirocti on, but curved towo.rd tho southoc.st o.s thoy 1:1.0Vod inlo.nd.
·'":o ~ocond cyclonic systor.1 VIetS usuo.lly tho noro intonso o.nd produced tho
n.oc,.vicr ro.info.ll. Tho first system novod inlrmd o.nd occluded o.co.inst tho
:O~.gh mounto.ins boforo cmy a.pprocio.blo ::u:10unt of tho cold poliU' continonta.l
- 3 -

',i:r hnd spilled \vostvro.rd into tho northern coa.sta.l ror;ion. Tho first
8ystom thus sot up tho ciroula.tion for injecting 1o.rc;o a.nounts of po1a.r
:::dr into tho developing secondary systor:1 which follovvocl, providing tho
onorgy for tho moro intonso second dovolopmont.
6. Storl~ts in clnss 2 a.ro those of Dooonbor 18-27, 1~21, Jnnuc.ry
14-19, 1916, a.nd Ja.nua.ry 24-29, 1916. Tho pressure distribution ovor tho
United Stutes during those storms resulted in a. rola.tivoly slOi'l trnnslntion
of tho systons onstrra.rd. In tho first sta.cos tho low .. prcssuro aron usually
dovolopod off tho oot:.s·t of British O'olumbia., novocl south or south-southoa.st
'\vctrd, pnssocl inla.nd over Oroc;on or northern Cnlifornia., o.nd then moved in
'\ noro oo.stwa.rd direction. As in cla.ss 1, o. socondc.ry storm follovwd.
Houovor, it wns tho first storn v.rhich ca.usod tho cold a.ir on tho oa.st a.nd
nnrth to J!USh south"iva.rd over tho north·wost sta.tos. Thus 1 tho soconcl storu
novod in a. po.th fa.rtho:J\ to tho south 0.long tho pola.r front a.nd inlo.nd ovor
contrC'.l c~:lifornia.. J~s in cla.ss 1 storms, more cold a.ir vms dra.vm into
tho second., nnd usuc:.lly more intonso, syston tha.n into tho first. Tho
hor:.vio:r ra.info.ll v;r:.s o.~;o.in r.ssooiutocl with tho second clisturbanoo.
7. Tho tenth stern. that of Fobrua.:ry 13-15 1 1937 1 was nssooia.tod
wit,'.1 a. vro.vo which dovolopod Fobrm\:ry 11 on a. Pacific front o.t about longi-
t·,Ic1.o 145°'\IV a.nd la.tituclo 30°Ne ;.';.s this wo.vo disturbc.nco moved toward tho
cor,tro.l Ca.lifornia. coa.st on tho 13th, o. strong southca.st-northwost pressure
gradient ~vo.s osta.blishod over southern Co.lifornio., ca.using strong southwest
u.i..rds. Tho storn procipi to.tion, of rola.tivoly short dura.tion ru1d high
:; ntonsi ty, occur rod over southern Ca.lifornia. during tho night of tho
13th-14th a.nd iVO.S a.ssocia tod with tho movon.ont of this di sturba.nco inla.ncl
over tho a.roa.. 'l'ho only similc.ri ty botvroon tho Gonora.l pressure distribu-
tion of this storm a.nd tha.t of tho other nino ma.jor storms is thnt o. strong
S~"uthoa.st-northwost pressure gra.diont -vra.s ostnblishocl over southern Ca.lifornia..

Tho Ma.xin.U!'it possible Stern
8. As sta.toC. previously, rosults fron a. C.ota.ilod. a.no.lysis of n.ll
tho storo.s show tha.t tho nn.jor rn.infa.ll occurs vlith o. combination of high
cncl hi(;h do•-..points. Thorofare, in a.rry c.ttonpt to roproc~uco lili''.SS
curvos of ro.infa.ll over this r.roo., vlind o.nd do~;vpoint nust bo considered
tho prir>.D.ry controlling fa.ctors, tho clov>ipoint beinG a. noc..suro of tho
cipi table wn.tor, n.s cxplctinod in Hydroraotoorologica.l Report No •. 3.
9. Tho stoo!_Jost prosrmro sra.dionts of record bot,;~oon Sn.r. Frn.ncisco
::me: Los Jmsolos, n.nd tho hishost wind,s of record o.t Sc..n Dio;;o cJ1d Los
s, wore observed in tho sterns of Jnnuo.ry 24-29, 1916, o.ncl Jc.nuc.ry
?-:J-2,:1: 1 1943. Uppor-dr obsorva.tions vroro ccvD.ilc.blo for only tho lo.ttor
1i' tho tv:o storms a.nd during this period tho tompora.turos a.t the 3- n.nd
5"·kilouotor levels ovor tho northwest stettos oqua.lod, or c.pproo.chod, tho '
::t.:rir.w. of record. Sir.mltn.noously, tho tor.1porn.turos n.t those lovols over
·:~m Dioc;o vmro within 5 to l0°C of tho r;w.:ximr. of rocord. Since son.-lovol
ssuro r;ra.dionts c~urins this storm rro:ro tho stoopost of record o.nd tho
scn?crnturo ;;rn.dients n.loft urcdoubtodly D.llproa.chocl tho m£\.xir.nm1 of rocorcl,
tnoro is li ttlo ron.son to boliovo the. t thoso crr.dionts cc.n bo oxcocdod by
;:::c:y o..pprocl.c,blo c.mount. Very oxtrono ocndi ticns would bo required to
"( c.~uoo v.rind novonont o.s nuch o.s 10% in excess of thn.t observed in tho
J:',"l. J.::ry 1943 storm.
10. 1.. thooroticnl nothod of dotormininc tho nn.xinUi":l. possible prooipi-
t.:_ L~~- nn over n.n n.ron in n. [;i von tine y;a.s dovo loped in cho.ptors I D...""ld II of
:v:'~.ronotoorologicn.l Report No. 2, "Mn.ximum Possible Precipitation over
th.c Ohio River Ba.sin a.bovo Pittsburch, Ponnsylvn.nia., 11 Md in chuptor VI
c:f tho Sl'.cro.nonto Report. Also 1 roforonco vvrts mn.clo to this mothocl in a.
recent po.por, 11 ~\n J\.pproo.ch to Qun.ntito.tivo Foroc1sting of Procipi ta.ti on,

P:::u:t II - Fornulas for Quo.nti to..ti vo Rdnfall ForecastinG H by Ao Ko Shovmltor
Tho latter paper dononstro..tos tho.t ro.info.ll fnrr:mlo.s o.ro nost readily derived
by noms of a. stora.co oqua.tion in v1hich tho inflow ninus tho outflow of
n.oisturo oquc.ls stornco or c,nount p:rooipito.todo For tho conputo.tion tho
followine; a.ssunptions a.ro ne.do:
1. Tho rain 0ccurs ovor a finite roctancula.r o.roa XY, with X
norr.ml to both inflow o.nc1. outflovr, r:md Y po.rc.l1o1 to inf1ovr
o.ncl outfloy;.
2. Thoro is no not convorconco of upon tho o.roa, except for
tho vmtor vapor procipito.tod_, which onounts to no 'raoro tho.n
one or tvw por·cont of tho m.a.ss '-'f ~-cir invol\tOcl.o
3. Thoro D.:ro no horizonto.l velocity crc.dionts vri thin tho vortico.l
plo.nos norna.l to inflow· or outflow.
4. Tho clopths of inflolr a.nd outflovr cc.n oo.ch bo dofinod c.s D.
pressure difforonc~ constD.nt o.1one; x.
5. Tho 0.ir throur;hout is sc.h.U'o.tod o.nd hc-..s o. psoudo-o.dio.bc,tio
1o.pso ro.to.
11. In a. stondy sta.to~ inflovr news tro.nsport n.nd outflon nn.ss
t.,..n.nsport vfiJ.l bo oqun.l oxoopt for tho nocligiblo loss of vmtor Vtl.i)Or by
whoro subscripts 1 n.nd 2 rofor to inflow n.nd outflow., rospoctivoly., nnd V
<.nd H to velocity n.nd rx:..ss, rospoctivol~r· Tho UCI.SS in r;rc..ms por unit colun"l
d' cm2 cross-section is
-2 since !J p is in nillibn.rs, ·,'l/hich nrc dynes en • Nocloctinc vc.rir.tions
in G ( n.ccolorr.:<.tion (Jf gra.vi ty)
n'"" 1.02 4 p

npocific humidity q .c .. ,,.,,/_ls tho porcontc.co of tho nc.ss of c.ir the1.t
~s uator vrtpor, so tho..t nc.ss of 1:utcr va.pcr por unit column is
!:\;, = ,.~( q ch:l. = 1.02 lz q dp
,n·, 0..pproxinr,toly,
s inc 0 e. cr C'll:1 2
of liquid wa.tor por en cross-section has a depth of ono en,
tho do:Jth of procipi tn.blo wn.tor in en in a unit colurnn is a.lso
fimlm·ortod to inches this depth becomes
1j[. = .4 q Ll p p
·en tho Wp che\rt (ficuro 3),. whore 'Vfp is c. function of tho d.OVIJ.1oint a.t
:'000 1:1b_, tho conputations have boon rw.do for values of 1.) p sme1.l1 onouch
''o olir.1ino.to a.ll but nocliciblo orrors.
12,, Tho trMsport of vmtor vo..por by oc;.ch Utlit colu.r.m is thus
:'.:nd tho tota.l n'Ltt1bor of unit colur.ms cross inc a ci von line noruc.l to V is
T.!, Tho stor oqua. tion of wa.tor va:;_1o:r thus bocor.ms
R = (1)
.··r~ ch is -~inonsionD.lly correct if it is rononborod the, t Ll p ho..s boon pro•
-/~~ G ly ·c-.:nvortod to units of news ( crcJJ.s) • R is thus tho a.vo raco depth
r;f procil_;itc.tion, in inches por hour, ovor XY. Fu:rthorraoro, Since M1V
1 =
a..nd thorof'oro
end sinco
tho s tora.co oqua.ti on cn.n bo norc simply ·wri ttcn

R =
vl (Yvpr ... L.\ Pl ~''~pz) L\ Pz
C)~_·evious tests have indicated that it is usually not necessary to weight
wind speed with elevation in terms of moisture content.
13. Figure 1 is a schematic illustration of ono typq of flow ful-
:F'~lling tho basic asstunptions, a case of dowmvind decoloration. Tho flor;;
air is pc.rullol to tho planes AEFB and DHGC •. Inf~01il o.nd outfloljr a.ro
>.n:r:m..."\1 to tho plo.ncs .P..DHE a.nd BCGF. Tho difforunco botviOon depths of
-Lu''low n.rtd outflorr is roprosontt\tivo of a hypothetical situation ·whore,
":JrJc::~.uso of intorna.l convorgonco, thc.1 horizontal voloci ty on tho outflow
: O.o is oqw:~l to one-half tho inflo;.v vol oci ty. It follOYiS tho. t tho cunount
o:'_' 'TI.oisturo procipi to.tod over tho aroa ABCD in unit time is oqua.l to tho
1110~.sturo inflo·w minus tho moisture outflovr in tho sn:mo time. Actually
tl'.o air is ulso being lifted c.bovo tho surfa.co EFGH, c. comploto
on would hc.vo to include one for tho la.yor above EFGH up to tho
level of no lift. Tho computL'.tion for oa.ch la.yor ca.n bo mc,do by moans of
oqua.tion 2.
14. In tho ca.so of tho Los Angelos a.roa., tho orogra.phio barriers
j·.t,;··mino to a. groo.t extent tho gonora.l distribution of tho highest
1--;htJ locc.tion of tho highest conifers of rc.inf0.1l_, but thoro rra.s little
rlr..tinn tho locc.tion of tho 10,000-squo.ro-milo a.roa over which tho
Yl:"xiraum procipi tr.tion occurred. This fo..ct domonstrG.tos thc.t tho orographic
fvG.turos o..rc tho mG.jor controlling factors for prooipito.ting tho moisture
(2)
cm.d determining its distribution over a.roG.. Hoiilovcr 1 thoro is one im.porta.nt
exception: intense loca.l rcdnfall a.ssocio.tod with tho convergent processes
0f tho eye lonic sys·tom i tsolf ca.n c.nd docs occur ovor any nron irrospocti vo
- 8 -

topoe;rc,phy. In tho Los Angelos ctrocL this ra.info..J.l usuc~lly ho.s a
rulati vcly :short duration (loss the.n 12 hours); for longer p·Jriods tho
c.mountB of procipi tt:::t;i on occur ovor tho windv;c.rd slopes or ridges,
;•hGro procipit::tt:i.on con·binuos o..s long as moi;;t [.dr flo·ws in o....ny direction
15. incc t:::-,o oror;ro.ylhic bc~rriors in tho Los "'.ngolus ".ror, o.ro tho
.Gc.:in eontrolline; foo.turos for tho product:i :)n r.nd distribution of rdn-
f::-.11., ccny rainfo.ll oqua.t:i.o!l vd.ll }w.vo tc tc,ko into c:msidorrc;;iG::l: (1) tho
direction of flow rolo..tj.vo to the; brcrriors, (2) the hc1ght tl, vihich the
:c.~.r coltmm is Hftod, O.i,d ( 3) tho eraount of vorti octl shrir.ki::::.;;, or dmm-
·.-r::.r'd n.ccolcro:bio.n, .-.rl1ich tf'.h.:s plc,cc in tho c'.ir n.s it i;; forced n·'J
T': naxil'1Ui1l posi,iblo pr..:cipi to..tion, it is rst JJ.Ococ;s~\ry to dot.::;rmino
_,thods for ovo..luo.tir.~; tho vctri::.blvs c.nd thon to tost th;m Ctj)plic~'ction
•,·,sults nJ£',tch tho obrwrvod values, tho vo.rio..blos cc:.n then be incroc,sod
to their physic::..l upper J.inits o.nd introduced into oquc,tion 2 in order
'Go conputo tho mnxinum pos ;3i blo pi tati on.
16. Tho problon of ovr.luc, ion 2 is con ..
tho orographic bccrricrs. In tho Los i'>n€~olos t,roct 1 their o.vorCl.go
ctbovo 1000 r,1b in torr:1s of Drcsfmrc difforonco is 200 1:1b. F:i.g··uro 2 .c
j_;; o. scho;n~J.tic illustrc.tion of tho bcu·rior offoct on inflc-,; f'.nd outflovt
7o1oci tics. It uho,:vs tho orogrc .. rhic lift resultinG in VCJrticctl convorr;onco
by a.n incror .. so in velocity of tho air ovor tho croGt
,;~· tho burrior. Tl1is ravcrsoG tho ordor in figure 1, producing o.. grouter
of
OVtJ.lUC. tho depth of inflcnv c.nd outflov1 ln.yo:rs it is nocoi:.s:;.:ry to
.. 9 ...

do"c;ornino tho prccipito.blo vw.tcr content (vrp) of' tho a.ir, tho velocity of
t:;ho a.ir (v1) into tho o.ron, end tho distance (Y) v.rhich tho air travels in
precipitating its moisture.
17o In developing m~ximum possible rainstorms over various o.rens of
tho United Sto.tos tho Hydrornotoorelogico.l Section ho.s found it nooessnry
to detomino tho :t:lC..xinum moisture cho.rge possible for o. column of' o.ir and
to compc,ro this vo.luo to those c.ctuo.lly observed in sterns v1hich hc.ve
proc~ucod no.jor floods .. Exo.minution of' uppor-nir soundings in those situations
_-ovoo.lod tha.t tho nir vms noa.r sa.turo.tion fror:1. tho surf'a.co to high olova.tions
cmd tho lo.pso ro.to of tcmpornturo vra.s npproxiln().toly pseudo-ndia.ba.tic through-
out tho colur.m. During pvriods of.' oxcossivo ra.inf'r,ll, thorof'oro, it is
:"oa.sono.blo to a.ssu1ao tho.t tho procipita.blo wc.tor in a. column of' o.ir co.n
·oo relt:.d:;od to tho surface dov.rpoint. A family of curves wns developed
1 fi guro 3) 1 giving tho curaula. ti ve d opths of proci pi tub lo v:o. tor fron a.
;r;C"oCJsuro of 1000 mb to any height, vthoro tho vt0 values o.ro given a.s functions ~ '
of tho surfo.co dev.rpoint. Hovtcvor, boca.uso of tho intogra.l pc.rt pla.yod by
·';ho mountcdn barriers in tho rolC>.tionship botwoon tho prooipi ta.blo vvntor
crmtrtinod in tho inf'lov; colunns a.nd tho procipito.blo vmtor conto.inod in
+-,ho outflow oolur.ms, o.n oxo.nino.ti on of this fa.ctor vva.s noooss c.ry.
18., In order to dotorr:l.:i.no tho of'foct of' tho r.10unto.in bc.rriors on
c",c wind flov1 across tho nron, -voloci ty profiles vroro plotted for sir:ml-
·tc.noous pilot-ba.lloon nsconsi ons over Burbo.nk: ( olovo.tion 25 ft.)., C....'1d
So.ndborg (olovo.tion 4517 ft .. ). 1'Jhilo Burbank is not on tho const, it
,.rc.s tho only stc,tion nva.ilc.blo which could bo used a.s roo.sono.bly repro-
sonta.ti vo of' tho coc.sto.l a.roo.. 1m oxnr:'l.ina. tion of tho so wind· profiles
shO';rod thc.t tho velocity over Smidborg a.voro.g:od a.pproxinntoly 10% groa.tor
.:;ho.n ovor Bwba.nk a.nd tho.t nonr 20,000 foot tho voloci tics wore a.bout
.. 10 ..

~ This indica'tos th..r;.t tho incroaso in voloci ty bcco.uso of vortico.l
0onvorgonco of tho o.ir o.s it novas over tho burrier is lo.rgoly do..mpod
·)Ut t'\.t o.bout 20,000 foot. This is also o.n indicc.tion of tho height vihich
cc,n bo usoc.1 for tho inflov; layer cf c.ir vb ich wi 11 bo lifted bocauso of
tho topoGraphy of tho region. In othor wordst o.ny nir (\bovo this level
would rocoivo no o.pprocio.blo orogro.phic lift o.nd could thoroforo bq, disro-
go.rdod. Tho o.vorago prossuro o.t 201 000 foot is 460 nb, o.ssuning o. pseudo-
cn_:_c)x·.tic lapse ro.to and surface tonporo.turo nnd prossu:ro of 55°F und 1000
1':11
) rospocti voly. On this bc.sis tho nvora.go thickness of tho inflO'rr lo.yor
(d p1
) vnll bo a.ppro:x:ir.mtoly 540 r.1b. In tho Los lmgolos a.ron, tho avorngo
h<;ight of tho r;1otmto.in ba.rriors tc.kon nornnl to o. sQuthrmst ;vind, is
o.prro:x:inntoly 6200 foot r.nd tho prossuro a.t this lovol, using tho sc<l:lo
r,rr;ur:tonte as a.bovo, is o.ppro:x:ir.to.toly 800 ob. Tho a.vora.go pressure difforonco
tho top o.nd tho botton of tho outflow lo.yor (Ll p2
) o.bovo tho
Lc.rrior is thoroforo 340 nb.
19. Tho next stop wo.s tho ovo.luo.ti on of 1:I 1 a.nd 'if for usa in P P2
V1o ro.info.ll conputati on foruulo.. Since both IJ Pl n.nd £l p2 wore kept
con~tc,nt nlong X o.nd tJ. p1 (540 nb) oxtondod. fron tho 1000.;:1:1b level to tho
j.I)O ... nb lovol, YlPl could bo obto.inod directly from ficuro 3 by rending
r.:'·' tho VI vo.luo o.t tho intersection of tho 460-nb line with tho curve p
runro.sonting tho soloctocl d01i1lflOin-t; roducod to 1000 nb. Hov,rcvor, l.l p2
{ 340 ;.;b) o:x:tondod only fron tho 800-nb lovol to tho 460-nb level, so
tho.t 1_:[ I for D.ny po.rticulo.r 1000-r.tb do-rrpoint, Vl't:\.8 obtained by SUbtro.cting P2
L·on tho WPl for that dmtlpoint, tho Yip va.luo bolO'rr tho 800-nb line •

20. Tho problem of tho toto.l nJvonvr:b of r.ir c~cross tho
n.roc. vrcs rlifficult bccn.uso for vr.rly yc:::.rs nc u:;por-t<ind ob-
ycc.rr. n::no could bo ua.do
rn.:in per icds. Tho only cthor r.10thocls for gettinG a. non.surc of
t.>:J flow :cro: (l) using r. viind record for o.n olovn.tod station l'rhich v;culd
vo ct c;orxl Ct]JlJre>xinc.tion of tho cc rroct vo.luoc, c.s 110.s dono in 1-Iydro-
or0locicn.l nopnrt No. 3, (2) corr n. C('ntinur-:us ':lind roccrd for
:'vr~cSOlctccti vo first-order ~-.-O['.thor Bureau str'.ticn in tho D..roct so tho.t
10. roprosont tho ccvorr,co vcloci ty of C'. o::.,lwm of' (dr 20,000 fvot
(3 \) uso f tho ec: or r:ro.diont yfincln obte.inctl by
; r suro d::q;s fCJr froquont frDr.1 oricino.l bnro;~ra.ph records.
Since no conr.istont rolr.t;i cr·uld oo found botv.rcon ·tho
r.•Jrfn,cc i'vind voloci ty r.d; D. first-orclor ·:oc~thor :Surco.u stc:.ticn end r-
cJ.:' vc~Locity records lY.do o.t nirpcr·t; str~ti ·,ns 11 tho soconc~ nothod
c:rop;1ocl. Tho rcuetininc pos"iblo uoc\r:.:mroD of c-,ir n.ovol":lvnt o.cross tho
'VTCrO: tho COOGtrophic or tho wind 1 r'.nd tho Mt • - ii 1 sen vii nd
crd, this boi:cc o.n olovc .. to<l sta.tion fror1 which r_:o:cl rosul to nichjc ·jo
• In order to doturnino tho bost uoo.suro c:f v;inc'. to b0 ucod in
oqun.tion, as well et<J to no'"suro tho rolc.ticnshi:l of dorrpoint o.n(l
' to intmsi ty of ro.infctll, corrolL\ti C>n coofficionts
cxu: vroro obtr.inod for those olononts for tho ton st::Jres soloctod.
1 _ '.·:it5nn to tho o.bcvo El.oc,suros of Trind novonont, it v;o..s c~ocidod e.lso
toc~t tho Los Lngolos ,·rind rc:c0rd for po<>siblo usc o.s [.tn in~lox, since
-rr.:rk. Tho corrola.tiens ::::btc.inGd vroro tostoc'. fer sicnifico.nco by usinr:;
ons wore
by en C..."l.c.lysis cf va.rhmco anrl by usu of stnnchrd stc .. tisticctl
- 12 -

~jr.~ificunco tables. Tho tests of tho correlation cooffioionts showed
i:;J:oc-,t tho relations botvroon tho precipitation intonsi ty and tho do-r;vpoint,
botuoon precipitation intensity and oithor tho coostrophic or tho
L;:~··a.cliont 1rind, \toro hichly significant. Hovrovor, tho analysis of variance
of tho repression of dowpoint, goostrophic w·ind, cradient .-.rind, Los
~·:nco los vrind, et.."YJ.rl Mt. nils on wi:n.Ct, on tho intensity 1 showed tha.t tho
conbination of <.1ovvpoint and coostrophic -viind was r.wst sicnifico.nt o.nd
:J.ccou..'1tod for 0.5 to Oe9 of tho vuriat:i.on in rainfall irttcnsi ty, tho
;thor noa.suros of vrl.nd a.cocuntinc for tho ronaindor • Tho coostrophic
vrincl wo.s therefore solootod ns tho bost nousuro of totul \·.rind novonont•
22., In order to evaluate tho roprosonta.tivonoss of tho goostrophic
·Jin·l o.E> n. noo.suro of tho c;vorc,go volooi ty of tho total 20 1000-foot colunn,
tl-'.o v:~.~~ia.tion of pressure gradient und donsi ty with heicht nust bo
co:c.Bidorod. li'ror.l tho tc::1pvro.turos c.nd pressures obsvrvod t\t tho surfo.oo,
·: :'->o j"'rousure crt\cliont c.t 10,000 foot can bo conputcd by ~ioa.ns of figure 4.
Tho Clssunption basic to tho usc of tho cho.rt is that of psoudo .. adiabo.tic
lapse r::~to, o. valid c..ssunption in r.lt,jor sterns. In tho fie;uro, line 1\B
rC'proSOi."!ts a difforonco of 1 °F por 10-r.tb pressure differonco a.t tho
c;u:rfc..oo, r;oinG fran a oonbinution of hiGher tonpora.turo und prossuro to
o. cnnbinc.ti on cf lovvor tonporuturo c.nd pressure. · This wc.s a typicul
condition in ull ston~s prior to frontal pa.ssa.sos over tho o.roo..
Tho 10,000-foot chungo in pressure r,ra.diont bot~1oon two hypothoticul
rtt.tion C c..nd D on suoh Ct. lino follcTrs:
.. 13 -

Sur.f'ace Pressure
ion D 1010mb
Station C 990 mb
Difference 20mb
ratio of presst1re
Surface Tenperature
0 53 F
2
10,000-ft. pressure
695 mb
680 mb
15 mb
ient at 10,000 feet to that at the
surfa.c is, thus, 15/20, i•e•; the 10,000-foot pressure ient is 75}~
of the surface gradient• The values used and computed are consistent
with those observed in actual storms. 'l'he most intense rainfall occurred
in all cases before the passage of the major cold front, and in the warm
ah· ing the front the temperature differences were smallt usually
of tho order of 0° to 3 The average distribution of pressure and
vras one of low temperature and pressure to the north and
Eud pressure to tho south. Pressure differences across the
:·e varied from o. few millibars to 27.4 mb, tho lc.tter be the average
difference between San Francisco and Los les for a three-hour period
on January 21, 1943. G
24. The geostrophic wind may be expressed as V = where V is
-bhe geostrophic wind velocity, G the pressure gradient, f the parameter
du; to the earth's rotation- constant for any latitude - and e the density
of the air. The ratio of the velocity at 10,000 feet to tho velocity at
thE:: surface becomes
v10 = t: s G1o ----• v p 10 s
" (3)
where the subscripts refer to the levels. In the range of temperatures,
45 to , with surface pressure of 1010 mb and thG £tssumption of' a
pseudo-adiabatic sc rate· of rature, the ratio of tho dEmsity at
tho surface to that at 10,000 feet is approximately 12/9. Since the CV\:5r'J.[?;C
- 14 -

at 10,000 feet to the prc:Jssuro gradie:ntt at
the surface, as shown earlier, is 75/100 1 substitutlon in oqua.tion 3 gi'ves:
v s
:: 12
9
75 = 100
1
Thus, the a.vera.ge condition in major storms is one which gives a. gcostrophic
wind velocity consta.nt with height to 10,000 feet. This is verified by
tho ava.i1ablo 5000~ a.nd 10,000-foot cha.rts, which show the isobaric cur-
va.ture during ma.jor storms docroa.sing with height at such a. ra.te that,the
isobars becomo almost straight at 10~000 feet, and tho wind at that level
a.pproximatGly equal to the geostrophic wind speed indicated by tho sea-:-levol
isobars.
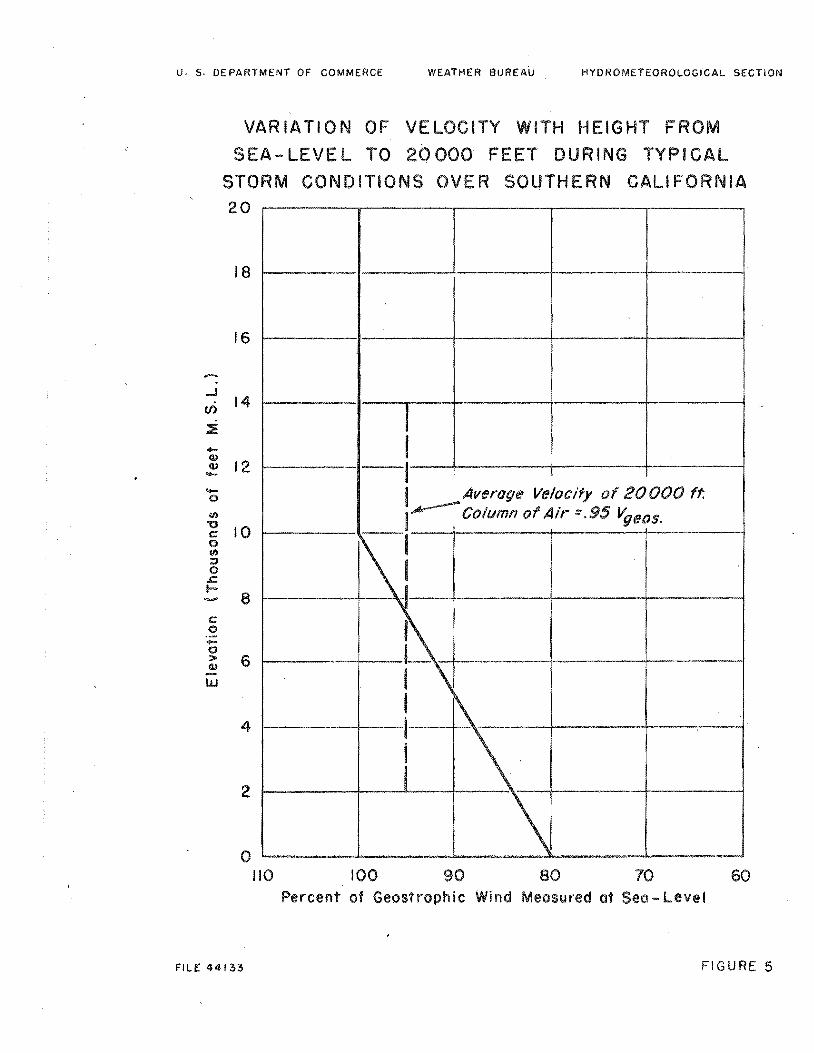
25. Using the same basic assumption of pseudo-adiabatic lapse ra.te
from 10,000 to 20,000 foot at sta.tions C and D, figure 4 1 it can be shown
that tho velocity is approximately constant with height in that la.yer.
Figure 5 shows the va.ria.tion of wind velocity with height throughout the
20,000-foot depth in percent of the geostrophic wind measured nt sea. level.
The varia.tion of velocity with height in tho lower 10,000 feet was assumed
to be linear e,nd t'he correction used for obta.ining gradient wind was
v d . - 0.8 v gra • geos.
This is an average correction based on a study'of ull the major storms,
where isobaric curvature variod frbm approximately 300 miles to 1000 miles
and the mea.sured geostrophic velocities from 20 mph to 91 mph~ By averaging
the velocity of tho whole column up to 20,000 feet in figure 5, an average
or 95% of the goostrophic value measured ut sou level is obtained. The
geostrophic wind velocity is thus demonstrated to be a good measure of the,
required velocity.
26. Errors inherent in the reduction of high-level-stn.tion pressure
to to determine the geostrophic wind from

isobars drawn for soa-love1 pressures~ To eliminate o.s much error ns pos
sible, the sea-level pressures usedwerG restricted to stations with ele
vations not more than 1200 feet above sea level. Tho pressures at stations
above 1200 feet wore reduced to their average level, all stations whoso
clsvations cxcoodcd the a.verage level by more than 1000 foot being elimin
ated. In drmrving the isobars the sea-level pressures were rigorously
followed along tho coast but the fixed-level pressures wore used to doter-'
mine th6 curvnturo 1111d direction of the isobnrs extending eastward from
California., Isobar:~~ of average pressure for the period 0600 to 0900 PST
of li'ebrun.ry 28, 1938 ,. are shovm in figure 6. Pressures at tho elevnted
stations are underlined and tho arrows indica.to the curvature and
direction of tho isobars over Nevada and eastern Calirornia. In each
cnsc tho wind direction wns taken ns pnrallel to the average direction of
tho isobars over tho 101 000-squarc-milo aroa of mnximum rainfall and the
wind velocity was computed from the pressure gradient measured normnl to
·this direction across the extreme limits of the 101 000-squnre-mile aroo..
f./Inps similar to f'iguro 6 were drmm for every three-hour period during
each storm ano.lyzed.
27. In order to evaluate Y, tho distance tho nir travels in
precipitating its moisture over the a.roc:., tho 10,000-squaro.o.milo area
over which tho mnximum rwero.go rninfo.ll occurred was dolinoatud for ench
storm. This o.rea wn.s in approximntoly the so.mc locution for on.ch of the
storms, giving ovidcnQo of tho importance of the orographic barr.ior in
releasing and determining the general distribution of tho major portion
of tho rninfall. In order to simplify computations o. rectangle with a
10,000-squaro.o.mile area wns adjusted to fit best tho avera.ge pattern for
all storms delineated by the mnximum rainfall over 10~000 sqm:tre miles •
... 16 ..

Figure 6 shows tho rectangle and its relation to tho isohyet encompassing
the 101 000 squa.re miles of maximum a.veragc rainfall for the February-Ma.roh
1938 storm. Tho base of this rectangle is normal to a. wind direction of
211°. In ordGr to comply with the original hypothesis of maintaining
the flow of cdr parallel to the sides and normal to tho ba.so, in which
case Y is always equal to 60 miles, it is necessary to obtain a. measure of
"
the wind component norma.l to the base of the rectangle. As wiP be seon
la.tor 1 it wa.s more convenient to ta.ke the value of Y pa.ra.llo 1 to the wind
direction between tho ba.se a.nd the top of the rectn.nglo. This is the
mathemn.ticn.l equivn.lont of taking the component of tho wind normal to the
bo.so of the rectangle. Thus the distance Y becomes o. function of the wind
direction and ca.n be dctorminGd trigonometrically. When the wind direction
is 280°, Y is oquo.l to 167 miles, which is tho length of the rectcmgle of
best fit. The value of Y is kopt constn.nt for all directions between
0 280 n.nd 292.5 since in no co.se would tho air move over a greater avern.ge
distance than tho length of tho rectangle in precipitating its moistur,o.
28. Obviously, the topography of the region is effective in pro-
ducing precipitation only wh:m the wind is blowing up slope, any down-
slope motion being rain-inhibiting ra.ther thn.n rain-producing. Also to
bo considered is tho fact that air coming into the southern California
region from o. direction other them between south-southec.st (157 .5°) o.nd
west-northwest (292.5°), clockwise, is ei-ther flowing down slope or is
considern.bly drier tha.n air coming in from those directions. Exo.mina.tion
of all storms showed thot when tho wind wn.s from o.ny d~rection outside this
SSE-W1Wf rango no n.pprociablo rain occurred n.nd therefore n.ll winds outside
this range could be disregarded, except in ca.sos where a front or marked
trough extending in a. west-to-east direction moved southwn.rd over California.
- 17 -

Dtrring those conditions approcio.blo rain could occur in the air preceding
the front or trough passage even though the isobars indicated movement
of air from a direction slightly north of west-northwest.
29. When marked frontal systems move into tho area attended by a
wind shift to northwest, rainfall occurs only over the portion of the
10,000-square-mile area in advance of the front. It is therefore
necessary to mult:.ply the right side of equation 2 by the percent of
e."ea in advance of the mean 3-hour position of the front to obtairt the
average rainfall ovor 10.,000 square miles for the 3-hour period.
30. During some synoptic situations a wedge of high pressure extends
into the area, producing winds from the SSE-W:N1JV directions, up-slope over
ro.rt of the aroo. and dovm .. s lope over the remainder • During these periods
tho percent of tho area experiencing up~slope winds was determined lli~d
the sam0 weighting procedure followed as above.
31. Up to this point the following doois:i.ons havo been made for
evn.luo.ting the rain-producing factors:
1. For oo.ch 3-hour period, the geostrophic wind as measured
from isobars carefully dravm from the 3-hour average
pressures will be used for v1, the inflmv velocity.
6. Pz will be kept constant at 540 mb and
340 mb respectively.
3. wpl and wp2 for o.ny particular dowpoint will be deter
mined from figure 3 sincG ~pl and 6p2 aro known.
4. 'The value of Y is u function of tho wind direction.
32. H~vever, preliminary computations for sevoral storms revealed
tho.t prior to the beginning of excessive precipitation, and between ex-
tended periods o.f precipitation when drier t:l.ir moves into the area tcmporaril~-,
- 18 -

the assumption of satura·tion throughout the inflow P...nd outflow la,_yers does
not hold. Jl..:n e:x:e..minat~.on of the Los .Angeles storms disclosed that in no
case d:i.d any appreciable procipi tat ion occur when th.e dev,'Po:ints were lO"I'!er
than 40°F 1 and that t:u~ colurmn of' air could not be assumed to be saturated
throughout its vertical ex·bent until the surface devrpoint reached 65"F.
It vras necessary then ·bo ob·tain some relationship bet·w·een the ~:.:mount of
moisture tha·b would be procipi tated in a lift:i.ng process from a saturated
c>cln'r:l of air with a g:lven surfac(::J devvpoint, and tha·b Vih:i:ch vmuld occur
H~1en the coh:unn was no·b comple·bely saturated. ll:n analysis of " . s :Lac-cor
dur~ng observed rains tho.t ·i:;he relationt1hip shown. in figure 7 was
t~, a.ppro}:imati on and c 0 1._:tld be 11s (:)d for de-v-:rpoints vri thin the range of\
R = and rearranging,
' ,...... l
I r (Tn) (v'P ... t.\ P1 I 1 . Woz) • 1.:i Pz ~
1--·----·--~-y--·-'-
v/.1ere f('rn) can be numerically EJvaluatod from figure 7.
(4)
33. B<;fore equation 4 was used fo1• computing the maximum possible
rainfall by increasing the variables to theoretical uppor limits 1 its
validity vro.s tested in five of tho major storms by insort;:i.ng the obs~rved
or computed values of wind, dovrpoin·b, etc• into the equat:i.on. To facilitato
the computations vrd.s possible to B:x:presG most of equa.t;ion 4 in graphic
L.iPz po.rticular devJ]Joint, and Y c. function of. the ·wind d:lrection. Figure 8
1 shows the graph in final form; the abscissa is Y in terms of vrind
... 19 ...

d.1reet1on, 1114 the ordinate i •
r(Tn) {~ • ~Pl 1 -11'L)
·l\ P2 .. P2
34. The value obtained from figure s. Rainfall Computation Chart,
is in inches per hour per unit wind volocity (mph) so that multiplying
by the three-hourly geostrophio wind movement obtained from the three~
hourly pressure maps yields the average depth of rainfall over 10,000
square miles for that period. V.fhen rainfall was not occurring over the
. ntire area, this value vvas multiplied by the o.ppropriate P'Jrcentage.
35. The validity of equat:i.on 4 was demon.strated by applying H to
stornm chosen for their marked variation in rainfall intensity and
duration. The January 1943 storm is the rmximum storm o;f l'Coord over
:;ho area e.n.d tho highest vvinds of reoord occurred in this storm and in
the January 1916 storm. Furthermore, tho storms of Janut~y 1916,
February 1937, tmd Febru.o'\ry-March 1938 were selected because ·the extreme
j_r:·egulari ty of their mass curves of rair.J'all would provide a rigorOtiS
test of tho method of mass-curve reproduction. The storm of December
1933-January 1934 was included since its mass-curve characteristics were
si.t-nilar ·t;o tho January 1943 storm, even though tho rainfall duration and
:in·bensity i'll'0re appreciably less than in the 1943 storm.
36. A synthetic construction of tho mass curves for those storms
was mo.de and the results aro shorm in figure 9. Tho remarkable agreement
of tho mass curves thoorotically computod for the fivo storms vrlth the
mass curves of averago observed rainfall for tho samo storms demonstrates
the validity of the equation. Tables 1 to 5 show the values of dev~oint,
vvind, rdnfall, and other factors obtained from actual rocords and maps,
and the 3•hourly e.verago depths computed from equation 4 •
... 20 -

37 <) Computn;bions of oorrelati on coefficients botv:oen the computed
and ob sorvcd arn.ounts for 6 hours, 12 hours, r~nd toto.l-sto:rm durations ·
·croro :made for u.ll five storms to verify these relationships. The
c()efj:'icionts 'iroro 0,.92 for 6 hotlrs, 0.96 for 12 hours, c1..nd 0..,99 for
total storme
Computation of the Ma.:x:imur,J. Possible Storm _._ •• - .. ~-~~-~- -·-"~' -·---·---,-·,...,.-_.,._ ___ ,...,~,. '» ..... ·-~-.., ......... ,_,_
38,. 'Nith the relationships among the ro.in-producinc; fn.ctors established
nJJ(: vcn.fied qucmtitntivoly as outlined above, cvc.lu&tion of those fD.ctors
time ~~as Ilooessttr;;.r i:n order to con1pute tl-1e :n1e~ximum possi blo stor1n.
~;:Lnco the complete urrangc.'lncil-1.~ of olemonbs comprising a ro.ajor metoorologico..l
event cannot be ru-l:::i.OI::.t1.lly synthesized, it vVTcS necessary to betse the :ntc.ximt:cr1.
~-" :~blo storm on a knovm arrangement of tho elements. The base from
T.'~···'· -:;h 'Chc; nax:bnur, possible storm was developed vr<1s the storm of Junuo.ry
:943 1 rrhich not only produced the highest wind and grcc.tost rainfall of
1 c'C}ord~ bu·t; also outranked o.ll others 11ihon theoretical rcdnfull wc.s com-
by incroEt.sing its v'linds and devvpoints to their physical uppor Hmi ts.
i'.. " increase of v:ind movomont ovor the 1943 ~'torm value \YO.S incorporated
:into tho c onrputations • A greator increr.1.se in vlind spood could not bo
justified by either direct or ind:i.:rect aorological rocko:rd;ngs (seo paragraph
0)" •.rho devrpoints possiblo in tho mnximum storn vroro doterrnined from
enveloping maximum do;,ypoint-durrttion curves, figure 10, for tho coo..stal
ro on of southern Californ:to. £:\.nd tho dov.rpoint-duration curve of tho
Janunry 194:3 storm. Since, during o.. storm situa·tion, high dov;points do
not porsist for so long a period cts indicated by tho m.n.ximum cUl"'VEls, the
onvol do,ta were gi von c. rate of decrease approximating the rato
observed in the 1943 storm.
39 • Briofly, the Gtops taken were as follov!S:
1. Maxim.ut1 dov.rpoints wore tabulated for durations of
- 21 -

2. Three-hour wind movements during the 1943 storm were
increased by 10% nnd tabulated.
:;. Those dewpoints and vnnd movements wore grouped and
arrt:L'Yl.gad in tho sru:no chronologie order in ·which their
relati vo 1Tl£l.g;ni tudes had boon observed in 1943. In
other vrords, the :rmximu.ro. 3-hour dovvpoint and wind
movement wore placed in tho sumo position in the storm
soquonoo as tho highest observed 3-hour dowpoint and
·vrind movo:rront •
4. , The mean s ... hour wind-direction sequence experienced in
tho 1943 storm was maintained in tho synthetic storm.
5. Throo•hour values of precipitation wore obtained by
using tho rainfall-computation chart, figure 8.
''hose values aro preso:ntod in table 6.
40o In general, tho rainfall of the maximum general storm, as
v,c E as the rainfall in tho observed gonoral storms., can bo classified
n.s stable orographic precipi·cation. This conclusion can be dravm be
cauoe tho basic hypothesis of a stable air mass flowing over a mountain
barrier has satisfactorily accounted for tho average depths ovor 10,000
Rqun.ro miles in tho major storms. Howovor 1 si:nco tho avorago depths
:wor snaller e.roas have been grent0r, it is apparent that the nrun.o
hypothesis co.nnot be extended, vrifuout modification, to tho rainfall
computation for smaller areas. Localized convorgonco, caused both by
tho storm dynamics and by tho terrain, is nddod to tho gonern.l orographic
effect, incroasing the local procipito.tion rates. For the purpose o:f'
bettor defining those local in~ensificatians. and on tho advice of Dr.
- 22 ..

~· Bjerknes during his a·t this office 1 the computation for smaller
areas was attempted.
41. Becrmse it wns the m..aximum.-·bype storm and because of the
greater nu:nib0:r· of gr.ges j,n it, the January 1943 s'co:nn was
selected as -~ho -;-;.a;:;t sl·orm,, Rectangles were fj_ tted to five areas of
:i.sohyet;al map~ The average height of the outflow barriers v.ras found
~'o~~ each area for each msan 6-hour wind direct5. on observed. Six-hour
:r.s Jhy:)tn.l maps vroro d.ravm for the ont:i.re Los Angeles area and all
nonputations were made for 6 ... hour periods. Because of' the variation in
barriGr height vJith wind direction and tho fact that tho Y used for
--~ COO sqrtrJ.ro Jniles 1vo.s no longer ttpplioable, it ,~las not possible to
l"f:o gu:r-e 8 :in solv1 .. ng equ.ation 41,) A separate e'\ralttation v;a.s mo..de for
o£~r,h :l.rcn. duri:np: ·che storm period by using 6 ... hour vdnd movoments, mce...n
s; and mean wind directions from tablo 5 and the appropriate
f'm . ~ r· 7 - '-'T; ...:rom _ :r..guro • By using tho mean 6-hour de1~oints, Ll P2 and
W could be obtain0d from figure 3 since they ·woro tmiquo for each gi von
outflow barrier and l'rind. direction. Sinco t::. :p1 was held constant
t.1.t 540 mb # Wp1
variod only vrith the devrpoint • However, there was no
s:1.tisfacta:ry way to determine the valuo of Y 1 t..~e distance, parallel to
";~10 ·iiind flow, over Ylhich tho prucipi tation falls. Sevort\l complete
computations were made, evaluating; Y differontly in e:J.ch series, as for
exrunple, the distance from the coast to the bt"!..rrier or the dista.nce
Prom tho coa.st to the leeward limit of the area of approcio.blo precipi-
tation. Consis·tent agreement botvvoon tho computed and tho observed precipi-
to be sub:Jte.ntially superior to any other.
- 23 -

42. _,W.other series of computations was carried out o.ftor a rough
sepa:ro.tion of oroc;raphic from convorgonoe procipi to.tion. Thoorotico.lly,
it was only tho oroe;raphi0 r!.linfall which could be computed from equation
4 s:tnco th:J air f:iow i7n:n1lod. Fcts similar to that used for tho 10.000-
Squn.l·o-m· ~. J.o "-rc • r' ~ O'' .r:>.· "'tU' "' ')) -· -- ,_.,.- l_... \ u -~> .J.. f-. v (" 0 By inspoct:t on of tho 6-hour isohyetal
maps of tho r;:-J.n-:'o.F ovor ·ch<; c0a.stal regions farthest removed from the
:mountains) [til arnonnt v;aR dctorminod which w-as called tho "base r£~.infall 11 ,
::Jr tho rcdYJ.fa.U during tho 6-hour poriod which could be o.esumod .to. bo. dut3
t;,, c ::Jnvorg moo vvi thin the air rrnss itself e..nd independent of tho lift of
·ch"~ motmtain barriers. This "base ra.infall" was subtracted from the ob-
served vc..luos., A nurr computation· was mado vd th Y measured as tho moan
d:~st.:t.n0o from tho 11 baso l'o.infall" isohyet in the coastal region to tho
'><.:~'"> inoh70t in the leo of tho mountains. To obtain comparable "observed"
·;,·a1J.u: -t~hie "baso r[unfctll" vms tmbtractod from the values actU<'"llly ob-
sc··"vc cl, Tho results a.go.in wore not sufficiently sc.tisfactory to be used
r.L +:ho bD.sis of o.n upwtu-d ox·l;ro.pola.tion of tho observed pa.rrunoto:rs to
·'~he '.r n~::c.ximum possible vu.luos.
43. Various modifico.tions of tho above computation procedures wero
tostod, including asstm1ptions of air flow difforont from that shovm in
figure 2 • No singlo l'lo·a model ·was r:>uffici:ontly sonsi ti vo to tho obsorvr.blo
fac·'..;or s to produce i~crem.onts of precipitation approximating those observed
througl10ut tho c.;torm pori odes Ro.ther 1 tho use of so"roro.l flow modols or
a vo..rying model was indica tod. A sonrch was mado for s omo charactcristi c
of tho storm, o.g., tho disto.ncc of tho Low center from the Los Angeles
0.rot1., with which a systematic and consistent transition from one typo of
flow to o.nothor could be synchronized. No such phenomenon shmvod a.
correlation with tho observed ra.infall groa.t enough to be usod success-
fully.
- 24 -

44. Tho frdlure of the. computn.[;ion mothods tested to reproduce the
"unall-aroa rainfall must bo charged to a combin:::ttion of factors. Tho
uso of tho sumo inflo'ifv-Yr.ind volooi "bJ for srmll aron.s as for 10,000
squn.ro milos was probably erroneous but too ob sorvations avc.'.ilablo did
not permit o. moro detailed distribu·tion a.c:ross tho aroa.. It is also
possible thnt tho dowpoints used, roprosontn.tivo for tho 101 000-squaro-
milo aron., might need roe:x:nmination, although it is bolisvod that any
such orr or could not be of mo..jor importc,noo. Om ... i.ssion of quanti tati vo
cn.lculations of localized c onvorgm1co offocts is a recognized dofioioncy;
t;hat problem cannot be satisfc.ctorily sol·v·od tmtil adoquato th.roo-dimen-
sionll.l meteorological obsorvc.tions o..ro C'.Vailablo during sJcorm poriods.
45. Since tho diroct application of equation 4 to areas loss than
10,000 squure milGs proved unsuccoss.ful, o.n empirically 1:1odifiod method
'T::'s finally adopted. J.nstct\d of ud:justing ro.inf'o.ll vo.luos reproduced
by ·hhooro-tical moans 1 tho obser·v·od rai:nft:\11 values vroro o..djus tod ... tho so
n~.:Lni'o..ll values contr.in:i.ng in themselves n. r,toasuro of the local ..
izod convorgonco and convoct:hro effects oth0rwiso unovc.luatod. Essontic.lly
tho :rnothod is tho so.mo as thl:ct usod for the 101000-squo.rc-mile computation.
It o.)so i:wolvon a.1:. incror~so of tho obsorvod moisture ru1d vJind values of
tho ,:uJ:mar:y 1943 storm to tho mc.:x:imum possible • Hoo.n mass curves for
the maxim1.un point, 25, 50, 100, 2501 500, 1000, 25001 and 5000-squaro'!"
n}ile areas woro drr1.wn and tho obs:Jrvod do·wpoint-duration curve 'W'US
plottr;~l by moun 6-honr inoror;w:nts. Ur.ing tho observed 171Bfu'1 6""'hour vr.ind
o··u;, tho mean 6 ... hour vuluo s of WLA, vroro tabula. ted • A corresponding
tabulo.;clor:. of WI,A' using tho Iik'l.Xililurn. pos lo dowpointsj wns rrndo~t Tho
of the w.aximum Vfu values to tho observed values wore compufbd
o.s percontagos and then multiplied by 110% to r.llow for tho increased
- 25 ..

1,,ind movm;tont in tho ua.ximmn storu. o,pplying those increases to tho
ob<wrvod 6-hcur precipitation increments ovor tho various ccroo.s, tho
:r:1o.ximu:rn Lw,ss curves ·wore obtuinoJ und tho rosult;ing dopth-uroa data
plotted und onvolopod in f'iguro 11. Tho values for the 1-hoc..tr and
3-hour durations woro obtained by utilizing tho :m.::;,:ximum. 1-hour and
3-hm.lr do.ta in o. similar mar>_nor.
46. 'While figure 11 gi vos tho dopth-e.rou data for tho mc.xinum
general storm, it is recognized ·chat for snn.ll urons and short durations,
those values cru.1 be and, in fact, hox·e boon excoodod. This cc.lls for
tho dotorrninatiQ.n of tho l:tc . .xi:rrrurrt "local11 r:tor:m. which can occur ovor tho
Los Angelos area. I·b is corto.in that the :maximum locc.l rcdnfalJ. v·Jill
bo o:t:porioncod ·within a. fairly gonord storm si tur.tion1 but not during
the r:li).Jeimum ger>.ernl storm. Salient :m.eteorolof~ical features of tho latter
storm preclude such an event. Most obvious of nll is the fact that the
mctrome vdnd ~,oloci'\:;ios of tho :i11f.tximum storm v:i 11 not por1d t tho convective
activity to groat heights v:luch lS O.}.'!p:lrontly nocossa.ry for rr.aximum local
rainfr.ll. Tho Ju:nuary 1943 storm illustrated this sinco no thunder-
stortl v;n.s roportod until tho m.n.jor portion of tho at ion
Mcwdmum Local Storms
47 • Tho typo of storra which produces tho hi rainfall intensities
for short durat:i.ons oYer small aroa.s is tho thundorstorr:J.. Tho thu.'Yldorstorm t s
charnc·coristic cumulonimbus cloud illustrrltos tho typo of flmv essentially
resJJon::.;iblo for its formation - convergent radial inflow at tho bottom.
end raci.ial outflow at tho top. other typos of flow such as
tro.:n.slt1.tion o:r ;;;~.~e(J.tcr magnitude cmd better obsorvod - aro often supor-
irnposod on tho bru:;ic flov;. Tho air ascends at vertical voloci tics dcpondont
- 26 ...

on .nc :tnc'l.gni tude and depth of radial inflow m:::.d on ·t;ho intc;:rnal properties
tho air nw.ss rather than on cyclonic acti-vity or Jcopography~ although
tho lat-Gor oftor. provide thcl initial impulses to th\mdorstorm formation.
lc"b1o analyses of rainf!\ll indicate that 1 except; for oxtromoly short
o.nct therefore negligible durc.tions 1 tho samo mrtxinatm vertical voloci ties
(and resulting raindrop concon·cr~:,ti ons) can occur C.:::l;)t'1iJhoro in tho Uni tod
8tn.tos. 1\ho poss iblo volttnc of rai11fall produced in tho muxinurn cn.se
thus becomes a function of tho raolsturo content oi' tho cdr mass processed.
48. In or.rlier reports of tho Hydromotoorologicccl Soct:l.on, particularly
Nos. 2 ru1.d 3 for tho Ohio River Basin c.bove Pittsbtu-gh nnd for the Sctora.rnonto
Bc,s:i.n1 rospocti vol;r, u rc~dio.l-inflo-rr r:~oJol of tho t:ypo discussed vms used
for tho computcttion of the off.ccti vo procipi to.blo wo.tor VI, us u function .,cJ
of cl.ov.rrJoint rtt 1000 mb • Furth or investigations have disclosed wca.kno ssos
:i.n the:\; ncdol .. most importc.nt being (1) c, violation of continuity of
mn.r-:s flo1.1 a:nd (2) u vur:ta:tion of cell height (o.nd therefore also a vari-"
ation of dopth of convorr;ent layer) inconsistent ·with obse.rvut:i.ons of
ctL-rn.ulordnbus heights • 1'o correct tho so vrocJ,:nossos a sories of mod.;:;;lr;,
all conte .. ining tho follovdng foc..turos 1 hnvo boon ctudied:
(1) Continuity of mn.ss flovr, by allowing oqun.l m~:.-...ss (equal
vorticul pressure difforencos) in oon;rorgont und divorgcmt lc .. yors
or by correcting c,ny inoque.li ty by a.d.justmont of vutflmv velocity
by the rutio of i:nflovr 4 p to outflow £1 P•
(2) VD.riution of total cell hoight linearly i-'Tl th surfa.co
vapor prousure (a function of devrpoint at ccr.sto.:nt prossuro) from
300 mb at a 1000-mb do·wpoint of 50•F to 100 mb o.t a 1000-mb do·wpoint
Tho dopth of the convergent le.yor vms V"~'riod from one ·i::;hird to tvJO thirds
of the pressure hoight of tho totn.l coll; tho divergent layer from one
- 27 ...

:.tlird to one half of tho s o.r;).o hoi ght; o.ncl tho :rniddlo layer from one
third of tho height to zero. Ea.ch of these models produced a different
-,n.lue of VIE for a specific devtpoint but tho porcentar;o va.riation of WE
vr.i th dovrpoint in o.ll models wns very r;.co.rly the srune o.s tho variation of
Wp vrith dowpoint 1 VIP being computed fr01a 1000 :mb to tho top of tho cell.
This fact allovrs for a moisture adjustment of thu.ndorstorm rainfo.ll without
roforonco to tho pc'1rticular flow model or to a specific value of Y{E• Evon
tho r::\infall resulting from a. group of thunderstorms rather than ono co.n
be deo.lt ;ni th in the sa:mo fashion. Since in tho maximtUJl thunclorstorn
situation it is a.ssmrod tha.t the nnximum dynmnics hD..vo boon achieved, the
ro.tio of mo.ximm1 possible thunderstorm-r::dnfall intensities over two
regions at tho sn.mo elev::cticm is oquo.l tl> tho rc:tio of their llk'l.ximum
possible 'li'p vn.lucs, defined n.bovo.
49. Tho upper lini.ts of thu:ndorstorm rahll'n.ll nrc reasonably well
cofinod by rm envelopment of m~1.:x:irctum ra:l.nf0.ll ob[~orvod in tho United Stc.tos
ovor small areas r.nd for short durn.tion& • Tho dovrpoints iYl thoso storms
equal or n.pproo.ch tho mnxilnum possible ffild tho dynoraic intonsi tics :un.y
o.lso bo o.ssumocl to bo tho rra:<.xinum. To ostiM\to tho lim5.ting thunderstorm-
rcdnf'n.ll ro.tcs over specific regions it is thus nocossr.ry only to ccmpctro
tho possible surfo.co dovrpoint~> ru1d to nultiply tho enveloping rates by
tho rc.tio of tho corrospondJ.ng Tho mnximum loco..l-storm dopth-aron.
vctluos vror~ dori vocl in this fn.shion and are given in figure 12. For tho
enveloping values tho one-hour dowpoint is 78°F (considorod to bo tho
ma..xintUn possible in o. rain si tun.ti on o.nywhoro in the United States) ru1.d
for tho Los lmgelos o.roe. tho mo.x::i.num pos;nblo clov1point is 67°F. The
porcontn.go of tho one-hour enveloping rnto possible ovor tho Los .Angeles
aroa is, on this bo.sis, 58. For other durations, tho corresponding vari-
n.ti ons of the clo•,'Points with time wore considered.
- 28 -

50. The loc~l-storm v~lues of figure 12 ~rc for the season November
through April. Thoy EJxcood tho m~imum gonoral-s·t;orm -valuGs only for
durations under 12 hours and the ~ro~s indicated in tho figure. For the
sr:10.llost aroc..s and shortest :iurQtions ·bhoy tho:rnsol vos may be exceeded
by tho local storm occurring in the surnmor becc.uso of the higher dewpoints
thc.t c~:u1 occur in that season. Tho rainfall of August 12, 1891, at CD.lllpo
is a ce.se in point. This occurred at a dev;rpoint of 72°1<' 1 which is o.lso
tho UP~u~l Paximum pdssible in tho region. Adjusting tho enveloping u. s.
values downvvo.rd to this dewp6int r;ivcs a vo.luo of 8.5 inches in ono hour
over one square milo, a good o.groomont vd th the observed point value cf
1L5 inches in 80 rainutos o.t Campo. Hovrover" the meteorological situation
peculiar to tho '"iost Coast in the sumner limits tho effectiveness of tho
ro.infall process. Although not o.ccuratoly dofinablo in a quo.ntitati ve
yc..y 1 it is tho opinion of tha Hydromotoorological Section that tho sumner
thundorstorr:l in the Los J .. ngolos area, v-rhoso m<:>,ximum ono-hour value over
o:w &quare milo is given above, vr.i.ll rapidly tt:,por do·wn so that for an
c;.roa uf 50 square miles ::.nd a duration of tvro hours it will no nore t..~an
equal tho corresponding v:intor-storm local ro..info.ll vo.luos. For lC\.rgor
o.rous and longer durations, tho winter loco.! storm will produce greater
depths.
51. The local-storrr1 values of figuro 12 arc for oocurroncos at sea
level., There is no orogro.phio intensification of tho J.initing thunderstorm
rate 1 but there is an orogrt.cphic depleting effect. The higher tho level
at which tho storm occurs, the loss the tota.l Yip that can bo processed
o.nd 1Cho loss tho rainfall. A study of o.ll the ro.dio.l-inflow models pro-
-,riousl;{ described also shovied that in n.ll cnsos tho doploting effect,
as n porcenta13;e, approximately equaled tho ro.tio of the Yvp
- 29 -

c ,tpu-t:od from tho ba.rrior elevation to tho top of ·bho coll to the Wp computed
frcm 1000 mb to the top of tho coll• Tho percentages of tho lirni ting rainfall
·~"to at so a lovol thu t aro possi blo at higher elevations, for lOOO .. mb
'l'-'wpoints around 67•F are gi 't'"On bolow:
~lavation (ft•) 500 1000 1500 2000 2500 3000 4000 5000 6000 7000 8000
of /0 95 91 87 83 79 75 68 61 54 48
perconbagos are applicable to all a.roas and d.urations of tho local
Distributi0n of Mo.ximum. Possible Rainfall
52. Because of i"t;s critical ne.ture for small basins vri th short con-
.,ontration times 1 somo indict\tion of tho timo brotlkdavm of nuJ .... ~i:nnull local
Aainfall for durat:t ons loss than one hour is nocossary. Tho only avai lablo
:lnto. for such dura.ti ons is from point-rainfo.ll observations. Tho Hydro-
; totoorological Section has in procoss a compilation of tho r:w .. :idmum recorded
ir,::.onsitios at first ... ordor Yloather Bu:t·oo.u stations for 5 1 10, 15, 30 rmd
BO Hinutes. A study of those vuluos t>hovrs t'> sj,gnificc.nt variation of tho
}Jo;·contago depth-duration curyes vf.i:l:;h cha:n£;o of tho one-hour a,';!ount 1 such
th~~t tho porcontago of the one-hour DlHOlmt that con fall in tho sh()rtor
od decrottsos 1rnth i:ncroaso of tho ono-hot~r o.mount. Tho magnitude of
tho docroaso also docroe,sos with increase of the one-hour o.mount, so th!\t
a limiting porcontago dopth•duration curve applicable to maximum. possible
intensities can bo reliably ostimo.tod. This has boon dono and tho por-
cuntt:1.gos applied (vrlth somo smoothing) to tho maximum. dupths for one
sq1.~a.ro milo • Thoy connot be o.ppliod without modificntion to larger aroa.s •
.i\rc n.nal;7sis of porcontago depth-duration data for periods groa.·ccr thnn
mlo hour indica. tos o. vario.tj_on of the relationship such that tho po.rtia.l
durc•:';ion porcontago depths decrease vn th increasing area. An Gxtrapolation
uf thin indio:: .. tod 1mrio.tion v1ith o.roc. has boon tied in with the percentage
- 30 ..
43

pth..;duro.tion values for one squo.r.;;; milo to give the 15-minute ·curves of
figure 12 up to 250 square wiles.
53. The possible goog:ra.phica.l loco.tion of ·bho mn.ximum. local storm
~d also tho geographical distr.ib,u~ion pf tho rai.nfall ~~thin tho maximum
r;enerc.l storm ca:.rmot be fully defined from tho dc,ta avnilablo at this
time. A_,diAtribution based on tho moan soo.sonal isohyetal pattern is
serviceable but only within limits, since tho pattorn is the summation
of a variety of storm occurrences, most of which are far from the
maximum possible. The moan soascnal pattern is influenced morG by frequency
of occurrence than by magnitude of ocourronoo while tho mnximum possible
has, naturally, an extremely lmv frequency.
54. For the googrc.phical distribution •·dthin tho w.nximum general
ntorm, tho Hydro:r::etoorological Socti on suggGsts that the best guide is
tho distrl but ion within tho JC\llw,ry 1943 storm. This storm is closest
+;o the mo..ximum genoral storm e..nd hc.s, in fact, served as tho basis for
its computn.ti on. Not only are lNind speeds and do·wpoints tho highest
recorded in such storms; the vr.i.nd directions - a determining factor
:i.nf'luoncing tho distribution - aro the most oritico.l.
55. For oxrunpl;e, to determine the nD.ximu:m average depth in the
m...'t.Ximum gonorn.l storm over a. project IQO .. squo.ro-mile urea, the January
1943 storm is used o.s tho basic pattern of intensity distribution in
tho follmving vro.y: The ratio of the 100-squuro•mile depth in figure 11
to tho maximum 100-squaro-milo depth in tho January 1943 storm is computed.
Tho Je~uary 1943 depth ovor tho project area is then multiplied by the
c::mrputed ratio v...."'ld tho result is tho mo..ximum average depth over the
project urea in tho mo.ximum possible general storm.
- 31 -

56. Tho ma.-x:imum loCD..J. storm is a diffor0nt problem. It is not as
:·roll controlled by topogra.phy ns tho g;onorul storm, slthough topogre.phy
a.n equally importcnt pe..r·b in inf.luoncing frequency of locn.l-storm
occurronco. Tho gonorn.l storm, for instance, is tho fonturo of the middle
of the rainy season - Docombor and Jamw.ry - while tho local storm char-
uctorizos tho beginning and ending of tho season. The sir;nificonco of
·V1is is borne out by u sto.tisti mt.l study not yet complotod by the Hydro-
netoz)rological Section ·which show..:; that tho corrol::>..tion b,3tvreon oleve.tion
c;::nd moan monthly ra:i.nfo.ll is hir:;Jwst in Jo.nuary and. lov;ost in "November
8.':-:.d April.
57 • Tho high v.r.ind voloci ties of the m.aximum general prevent
Cl10 e:~:trerao convectiva effects nocossary for tl1e rnnxirntun local storn1 and
spread the resulting rainfall over h:rbor areas • The m.azimui:l local storm.
likely to occur vrith lov,r -id.nd velocities, if the convergence
0f£\.JC,ts o.ro prosont. Evon on tho coastal plain, this fn.ct neans that
,_,cue .. 1 stabilizing offocts of tho low ocen.n ·temperatures need not be present
1to::.: tl1e srr1all o.rea.s o.n.cl for tl1e s11ort durt"tti ons of the l11£\.:x5.mrun local s·borm..
conclusion, therefore, ie tl:',o.t tho m.."l.xim.um local storm con occur
a:nyvihoro in tho Los Angeles area c .. nd that its rn.infn.ll is reduced ruther
L.'ll.cn incroasocl by o levat:i. on. The tc,blo of pn.ro .. graph 51 ·bho proper
adjustments to be used Rt various elovutio:ns • For basins
G:.c".:;onding over o.. range of elevc.ti ons, the moen elevation should be used.
58,. 'rho aroal distribution of intensities within the mnximum local
o-l;( rm CtUmot be defined accurc.toly. For that it is suggested that
;;he ·~c.oGt critical hydro distribu.-bion be usodo Tho restriction
- 32 -

any isohyeta.l pattern so constructed is that the average depth over tho
;;ub-areas encompassed by specific isohyets, or between specific isohyets,
should not exceed the depths of figure 12 a.fter thooo depths are reduced
to thE:J moan elevation of the sub-areas conc'ernod •
.. 33 -

Table 1
Rainfall Computations
Storm of January 24-28 1 1916
1Nind Dew o{f * Accumulated R Date Period Direction Point w . LA % vgeos ll,R Computed Observed
1/24 12-15 239 51 ,00250 30 50 .037 15-18 234 52 .00292 35 56 .057 .09 0.1 18-21 254 53 .00258 60 59 .091 21-24 256 53 .00250 60 63 .094 .28 0,1
l/25 00-03 257 52 .00220 75 83 .137 03-06 264 52 .00191 75 72 .103 .52 Ou4 06-09 280 52 .00113 75 107 .091 09-12 280 53 .00127 50 132 .084 .69 0 ... 6 12-15 281 53 .00127 45 155 .089 15-18 300 53 .00127 60 194 ~148 .93 0.7 18-21 300 52 .OOll3 60 216 .146 21-24 301 51 .00103 60 196 .121 1.20 0,.9
- /n6 l.j ~' 00-03 303 50 .00091 45 175 .on
03-06 298 49 .00078 30 174 .041 1.31 L,O 06-09 300+ .ooo 09-12 300+ .ooo 1.31 1 .. 0 12-15 300+ .ooo 15-18 300t .ooo 1.31 1.,0 18-21 276 50 .00106 100 52 .055 21-24 234 51 .00257 100 86 .221 1.59 1.3
J/27 00-03 222 52 .00311 100 122 .380 03-06 225 53 .00342 100 125 .428 2.40 2,;;4
06-09 237, 55 .00390 100 151 .590 09-12 230 56 .00440 100 188 .827 3.81 3.,8 12-15 260 56 .00306 100 269 .824 15-18 267 56 .00260 100 250 .650 5,29 ·1 .. 8 18-21 280 54 .00139 70 274 .267 21-24 292 51 .00103 30 267 .082 5.64 5c2
I 128 -; 00-03 300.J .ooo 03-06 300-! .ooo 5.64 5o5
* Percent of area. south of front or trough line or percent of area experiencing upslope winds based on isobaric pattern.
f(TD) (WPl - 540 ·v ) m v P2
:ll: lNLA ::1 y II
taken from figure 8, Rainfall Computation Chart.
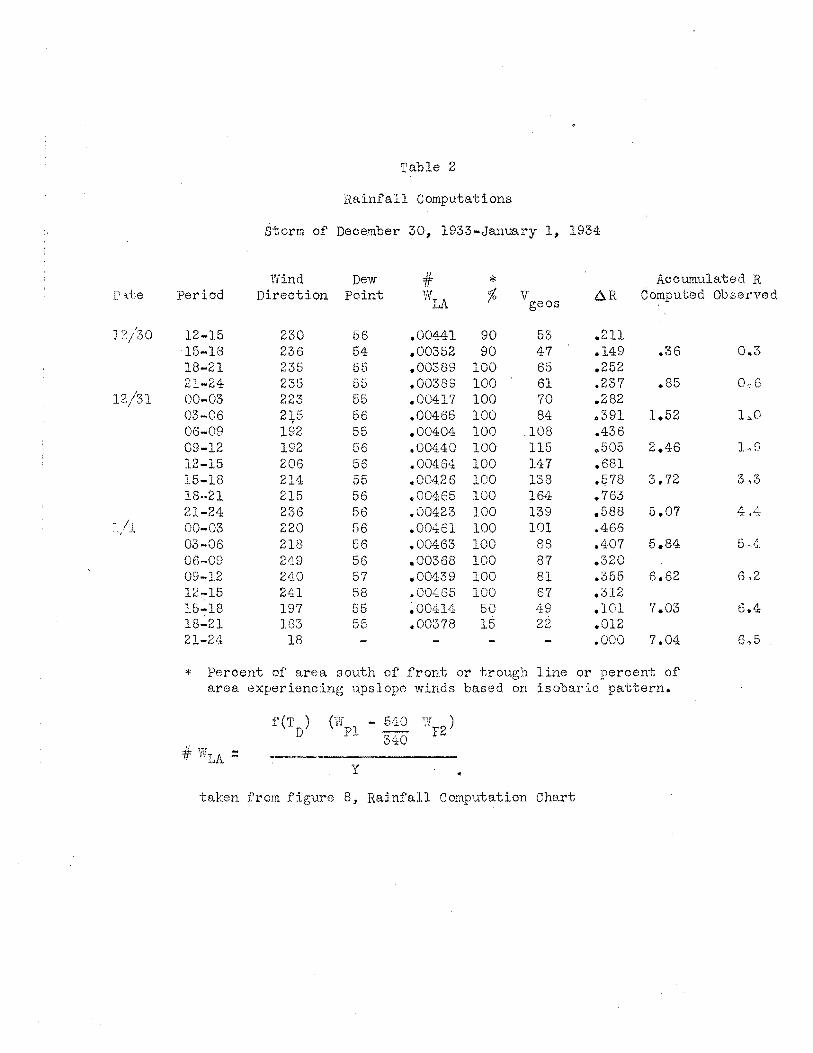
Table 2
Rainfall Computations
Storm of December 30, 1933-Janua.ry 1, 1934
Wind Dew # * Accumulated R I'CJ.te Period Direction Point w
LA % v 6.R Computed Observed geos
12/30 12-15 230 56 .00441 90 53 .211 15-18 236 54 .00352 90 47 .149 .36 0.,3 18-21 235 55 .00389 100 65 .252 21-24 235 55 .00389 100 61 .237 .85 o,,6
12/31 00-03 223 55 .00417 100 70 .282 03-06 2 56 .00465 100 84 ,.391 1.52 1 06-09 192 55 .00404 100 '108 .436 09-12 192 56 .00440 100 115 .,505 2.46 1~9
12-15 206 56 .00454 100 147 .681 15-18 214 55 .00426 100 138 .578 3.72 3 .,3 18--21 215 56 .00465 100 164 .763 21-24 236 56 .00423 100 139 .588 5.07 4.4 00-03 220 56 .00461 100 101 .466 03-06 218 56 .00463 100 88 .407 5.84 5 .,4,
06-09 249 56 .00368 100 87 .320 09-12 2<10 57 .00439 100 81 .355 6.62 6,2 12-15 241 58 .00465 100 67 .312 15-18 197 55 .00414 50 49 .101 7.03 6.4 18-21 183 55 .00378 15 22 .012 21-24 18 .ooo 7.04 6,5
* Percent of are a south of front or ·!:;rough line or percent of area experiencing upslope winds based on isobaric pattern.
f(T ) (WPl - 540 T1f )
D 3,:10 "rz # WLA:
y
taken from figure 8, Rainfall Computation Chart

Table 3
Rainfall Computations
Storm of February 13-14, 1937
Wind Dew 4fo * Accumulated R Date Period Direction Point WLA % vgeos ~''. R Computed Observed
2/13 06 ... 09 153 4:8 .00100 100 84 .084 09-12 165 52 .00218 100 96 .209 .29 0.2 12-15 175 52 .00256 100 90 .230 15-18 195 53 .00340 100 94 .320 .84 o.? 18-21 222 53 .00347 100 110 .382 21-24 216 53 .00352 100 145 .510 1.73 1.9
c/14 00-03 219 53 .00348 100 136 .4'14 03-06 2LJ:2 52 .00271 100 126 .342 2.55 3.0
* Peroent of area south of front or trough line or percent of area experiencing upslope winds based on isobaric pattern.
f(T ) (Vl - 540 w ) D Pl 340 P2
41" vir -H
LA ..
y
taken from figure 8, Rainfall Computation Chart.

Table 4
Rainfall Computations
Storm of February 27-March 3, 1938
Wind Dew =/1: * Accumulated R Date Period Direction Point WLA % Vgeos .AR Computed Observed
2/27 12 ... 15 137 .. ... .ooo ... 15-18 170 57 .00378 100 64 .242 ~24 0.3 18-21 182 57 .00436 100 75 .328 21-24 199 58 *00525 100 58 .304 .87' 0.7
2/28 00-03 200 58 .00527 100 38 .zoo 03-06 200 58 .00527 100 45 .237 1.:n 1~0
06-09 209 58 .00536 100 59 .316 09-12 216 59 .00566 80 82 .372 2.00 1 .. 4 12-15 232 59 .00532 60 98 .313 15-18 221 59 .00558 65 112 .407 2.72 1,9 18-21 234 58 .00495 100 98 .485 21-24 235 58 .00491 100 75 .368 3.57 3A
3/1 00-03 235 56 .00427 100 45 .192 03-06 243 55 .00365 70 46 .118 3.88 3.8 06-09 21:1:5 56 .00388 50 60 .116 09-12 248 57 .004:02 75 42 .127 4.12 3.8 12-15 243 57 .00426 60 55 .141 15.:.18 276 56 .00197 60 63 .07"1 4.34 3,,8 18.:.21 248 55 .00342 35 96 .115 21-24 254 56 .00341 50 120 .204 4.66 4.0
3/2 oo.:.o3 244 56 .00392 100 124 .486 03-06 224 57 .00492 100 126 .620 5.76 5 .. 2 06-09 220 '60 .00591 100 138 .816 09-12 224 60 .00583 100 146 .851 7.43 7.1 12-15 232 60 .00558 100 128 .715 15-18 238 58 .00478 100 146 .698 8.84 9.2 18-21 253 57 .00374 100 117 .438 21-24 270 54 .00200 100 102 .204 9.49 9.,8
3/3 00-03 269 54 .00206 100 99 .204 03-06 274 54 .00176 100 95 .167 9.86 10.2 06-09 274 53 .00160 100 101 .162 09-12 277 50 .-00102 100 104 .106 10.12 10.6
* Percent of area south of front or trough line or percent of area experiencing upslope \rinds based on isobaric pattern.
f(T ) (W - 5<10 WP2) D Pl 340 # w =
LA y
taken from figure 8, Rainfall Computation Chart.
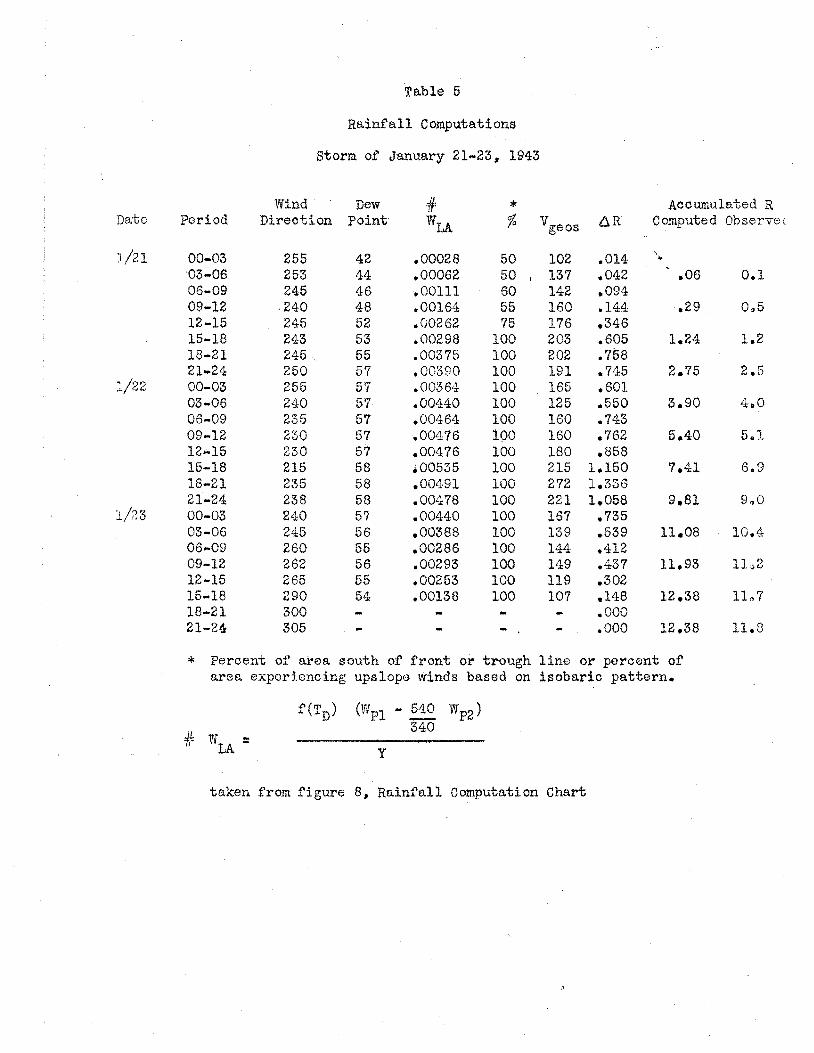
Table 5
Rainfall Computations
Storm of January 21~23, 1943
Wind Dew # * Accumulated R Date Period Direction Point WLA % vgeos AR Computed Observe(
J/21 00-03 255 42 .00028 50 102 .014 '·
" os .. o6 253 44 .00062 50 ; 137 .042 .06 0.1 06-09 245 46 .00111 60 142 .094 09-12 240 48 .00164 55 160 .144 .29 0,5 12-15 245 52 .00262 75 176 .346 15-18 243 53 .00298 100 203 .605 1.24 1.2 18-21 245 55 .00375 100 202 .758 21 ... 24 250 57 .00390 100 191 .745 2.75 2.5
:./22 00-03 255 57 .00364 100 165 .601 03-06 240 57 .00440 100 125 .550 3.90 4~0
06-09 235 57 .00464 100 160 .743 09-12 230 57 .00476 100 160 .762 5.40 5ol 12-15 230 57 .00476 100 180 .858 15-18 215 58 .oo535 100 215 1.150 7.41 6.9 18-21 235 58 .00491 100 272 1.336. 21-24 238 58 • 00~1:78 100 221 1.058 9.81 9,0
l/83 00-03 240 57 .00440 100 167 .735 03-06 245 56 .00388 100 139 .539 n.oa 10.4 os .. oe 260 55 .00286 100 144 .412 09-12 262 56 .00293 100 149 .437 11.93 n~z .12-15 265 55 .00253 100 119 .302 15-18 290 54 .00138 100 107 .. 148 12.38 11"7 18-21 300 .ooo 21-24 305 .ooo 12.38 11.8
* Percent or area south of front or trough line or percent of area experiencing upslope winds based on isobaric pattern.
f(TD) (WP1 • ~ wpz)
# 340
WLA: y
taken from figure 8, Rainfall Computation Chart

3-hr. Period
1 2 3 4 5 6 7 8 9
10 11 12 13 14 15 16 17 18 19 20 21 22
Table 6
Rainfall Computations
Maximum Possible Storm
(Based on the chronological pattern of, dewpoint and wind velocity in the January 1943 storm, dewpoints increased to rnaximwn in accordance with the Enveloping Maximu.m Dewpoint-Duration Curve 1 wind speeds increased lOjo, other factors kept constant.)
Wind Dew # * Accumu1o.ted Direction Point w % v t:. R R
LA goos
255 49~8 .00175 50 112 .10 ·.10 253 51.7 .00226 50 151 .17 .27 245 '53.3 .00300 60 156 .28 .55 240 54.6 .00360 176 .35 .90 245 55.8 .00380 75 194 .55 1.45 243 56.8 .00418 100 223 .93 2.38 245 58.0 .00446 100 222 .99 3.37 250 58.7 .. 00432 100 210 .91 4.28 255 59-.2 .00411 100 182 .75 5.03 240 59.5 .00509 100 138 .70 ,5. 73 235 59.9 .00543 100 176 .95 <6.68 230 60.3 .00574 100 176 1.01 7.69 230 60.9 .00590 100 198 1.17 8.86 215 62.4 .00663 100 236 1.56 10~<±2
235 63.8 .00636 100 299 1.90 12.32 238 61.5 .00573 100 2t.l:3 1.39 13.71 240 59.0 .00496 100 18<::: .91 14.62 245 58.5 .00458 100 153 .70 15.32 260 58.,_;, .00360 100 158 .57 15.89 262 58.2 • 0034:2 100 164 .56 16.45 265 58.1 .00316 100 131 .41 16.86 290 5?.6 .00186 100 118 .22 1'7 .08
* Percent of area south of front or trough line or percent of area experienc upslope winds based on isobaric pattern.
f(TD) (WP1 540 '7[ ) r V'p2 --# WLA - 340 -
y
taken from figure 8~ Rainfall Computation Chart.

U, S. Deportment of Commerce Weather Bureau Hyd rometeorologicol Section
COMPARATIVE INFLOW AND OUTFLOW VELOCITIES
FIGURE I -VERTICAL STRETCHING DUE TO DECELERATION
r I
........ -- ... ----
FIGURE 2- FLOW OVER AN IDEALIZED BARRIER
~~~ -------------,
jj Pt.
FILE 45001

U.S. DEPARTMENT OF COMMERCE WEATHER BUREAU HYOROMETEOROLOGICAL SECTION
(/) 0:: <( co _j _j
:.::?:
w 0:: :::> (f) (f)
w 0:: 0..
(/)
0:: <( m _j ....J
~
w 0:: ::::> (/) (f) w 0:: 0..
DEPTHS F PRECIPITABLE IN A COLUMN OF
0 MILLIBARS AIR F GIVEN HEIGHT ABOVE Assuming Saturation with a Pseudo-Adiabatic Lapse
Rate for the Indicated Surface Temperatures TEMPERATURE
"F 14.0 32.0 39.2 46.4 53.6 57.2 60.8 64.4 68.0 71.6 22
75.2 78.8 •c -to -4 o 2 4 6 8 10 12 14 16 18 20 24 26
200
300
400
500
600
700
700
800
900
1000
0 0.5 1.5 2.0 2.5 3.0 3.5 4.0 4.5 5.0 PRECIPITABLE WATER (INCHES)
TEMPERATURE 82.4 °F 2s •c
~~,-;r---r-·"'1'/''=j==f=~==l===:z: 3.05 -+t~;;~-~--~-1-'l-r-··+r-+-~7-·+~·-+;r·~······+··~~-~--+--~/--4--10
•f 14.0 28.4 35.6 42.8 50.0 53.6 57.2 •c -1o -6 -2 o 2 4 6 s 10 12 14
60.8 16
64.4 IS
71.6 22
75.2 24
78.8 26
680 20
0 0.5 1.0 1.5 2.0 2.5 PRECIPITABLE WATER (INCHES)
FILE 45007 FIGURE 3

U. S. Departm'enl of Commerce Weather Bureau Hydrometeorologicol Section
COMPUTATION CHART FOR IOOOO ... FOOT PRESSURES (ASSUMING PSEUDO -ADIABATIC lAPSE RATE)
10000-FOOT PRESSURES (MBJ
IOf.>o ro~fJ ro10o 'i/:)f.> &1o r/> 960 ~--.---r-~,---~~,----,-·---~-y-r----~~-.·---··-,~······~----60°
Q)
2 990 f.-: ----h,l'---+-----c/-+-----+--1"---+-
LIJ a:: :::> 995 f-/--f---/-f---1-/'-(/) (/) LLI lt 1000 i-' ~1"-t---+/
..J ~ I 00 5 f---W---·1--/'-+----+/'- --f---:;'111 LLI ..J
I I 0 I 0 1-/'---r----/-+·-·--+/--+--/4-~ <{ LLI (/)
l 040 ''--'<.--~~.~...-._.._,-__ ..L.__£...-l.-_ _t_;!'-.___L_ __ <!'....!---L._<; _ ___j_,. __ __.,_..e;____J_ __ .;
25 30 3!5 40 45 50 55 so 65 70 75 ao a5 so SEA- LEVEl TEMPERATURE (•F )
RELATIVE.- HUMIDITY CORRECTION
+2 ~--~~--+----+----+---~---~---·4---·-+-~~--T~--+--~--~ m
2+1
0 L........l.......::::::::i:=::::t -.......4---!...--
25 30 35 40 45 50 55 so 65 10 75 eo 85 eo SEA- LEVEL TEMPERATURE ("F)
'!>0 1
FILE 44135 FIGURE 4
u. S. DEPARTMENT OF COMMERCE WEATHER BUREAU HYDROMHEOROLOGICAL SECTION
...J (/)
..... Q> Q.) -If)
"0 r:: 0 If)
:::s 0
.s::. I--c 0 -0 > Q.)
w
VARIATION OF VELOCITY WITH HEIGHT FROM
SEA- LEVEL TO 20 000 FEET DURING TYPICAL
STORM CONDITIONS OVER SOUTHERN CALIFORNIA
20
18
16
14
12
10
8
6
4
2
0 110
I I I 1 Average Velocify of 20000 ft. ~~Column of Air =.95 Vgeos.
I I \ I ~ I
\ I I
\ 100 90 80 70 60
Percent of Geostrophic Wind Measured at Sea- Level
FILE 44133 FIGURE 5

u. S. DEPARTMENT OF COMMERCE WEATHER BUREAU HYDROMETEOROLOGlCAL SECTiON
SAMPLE 3-H URLY ME N PRESSURE MAP
FILE 44134
I t
I I
\ I I
\ I I
\ I I
~)\• I I
I
FIGURE 6

U. S. DEPARTMENT OF COMMERCE WEATHER BUREAU HYOROMETEOROL.OGICAL SECTION
100
90
80 f---..
70
.... 60 ;z UJ u a: UJ 50 a..
40
30
20
10
I
0 20
FILE 44125
.,
REL I N OF REDUCED DEW POINT .6p
TO PERCENTAGE OF (Wp1- Wp 2 )
S ANGELES AR
y I-
!
Dew point reduced pseudo-adiabafically to 1000 Mb. 1 I
L ,.
.
L - --+--~--- ·-
I I I
I I v
I --~ r---
) I
40 60 DEW POINT (°F)
GURE 7

U.S. PARTMENT OF COMMERCE
IN FALL FO HE
WEATHER BUREAU
COMPU LO NG
HYDROMETEOROLOGICAL SECTION
ION L
Maximum Average Rainfall Over 10000 Square Miles as a Fun ion of Wind Direction and Redu Dew Point
FILE 44126 FIGURE 8

U.s. DEPARTMENT Of COMMERCE WEATHER BUREAU
HYDROMETEOROLOGICAL SECTION
MAS CURVES OF MAX I UM AVE GE RAI F
ILES
(I) w z 0 z
OVER 10 000 SQUARE
BY STORM PER I ODS R
SOUTHERN CALIFORN lA
9
10
8
6
4
END
-Observed
----
---/r 27 ,., .,....
0
FILE 44124
I
/ _ ... v
I
12
10
8
lf) 6 w :l: 0 z
4 J'----~--------~~ ~--~----
2 if ,<:....JC---+-- ---+---1
0 I """'i""- I I I ! I I ! I I • I I I ~ ' I ' I I l -----1
I
l
10
8
6 :I: 0 z
4-
2
0
10
8
6
0 z
4-
2
0

U.S. DEPARTMENT OF COMMERCE WEATHER IUREAIJ
66
ENVE PING IMU E I
FOR E COA L I 0 OF S
-----I ----------·-- 2
0
and
and
rrences ,,
February u
I 50
R I ( )
cu
Los A'ngeles San Luis
Santa
~
HYOROMETEOROI.OGICAL SECTION
lA
1938-1894 1896-1927
-1943 1930-1938 1939-1944 1942-1934-1944
80 90 100
LE 45043

U S Department of Commerce Weather Bureau Hydrometeorologicol Section
AREA (Square Miles)
10000 8000
6000
4000
3000
I 3 6
DEPTH-AREA CURVES MAXIMUM POSSIBLE GENERAL STORM
LOS ANGELES AREA
H 0 U R S 12 18 24 48 72
L.I.:: .. L. .. l ... J.L.__j
2000 ~~~~-~~~~~~H~~~4-A+4-~~~~~~-~+4~~~44~++4-~+4-~++4-~
1000 800 600 ~-H~-1~_,...\-t-++
400 1-+-1-t-+-
300 1-++-f-+-
100 80 --
60
40
30 1-+--H+-r-+-;
20 1-++1+~~1-t-+4-H-~+-t--t--t-+-H~
10 8 6
4 ~+H~+-il-t-t-++
3 1-++1+~
0 2 4 6 8 10 12 14 16 18 20 22 24 26 28 30 32 34 36 38 40 42 44 46 48 50 52 DEPTH (Inches)
File 45044 Rev. FIGURE II

U. S. DEPARTMENT OF COMMERCE WEATHER BUREAU HVOROMETEOROL.OGICAL SECTiON
DE H-AREA CU ES I UM POSSIB
LO STOR LOS NGE S REA
3000~-\~+-\~\~r~
2 0 0 0 l-t-\L---t-1-\1c-+-\-t--l-\-+-\:-\ ----f-+----c-+-+--+--+-!c-+-+
-(/) w ..J
w a: <t :::> 0 {/) -<! w a: <.(
20
41-+-+-3 ~-+--l+-4-+l~l-~+-~-l-~+-H4-+41-~-~11~~-+-~-+-~-r-+-~
2 rr-----+---+--H--+l-H-+4-
I 0 2 4 6 8 10 12 14 16 18 20 22 24 26 28 30
DEPTH (INCHES)
FILE 45044-1 FIGURE 12.


![2+m``2MigL2m` HgL2irQ`Fb - cuni.czstraka/courses/npfl114/2021/...6B;m`2gRgQ7gT T2`g] gh?2Q`2iB+ HHvg:`QmM/2/g TTHB+ iBQMgQ7g.`QTQmigBMg_2+m``2MigL2m` HgL2irQ`Fb]-g?iiTb,ff `tBpXQ`;f](https://static.fdocuments.in/doc/165x107/613dc6902809574f586e2ccd/2m2migl2m-hgl2irqfb-cunicz-strakacoursesnpfl1142021-6bm2grgq7gt.jpg)
![Union Calendar No. 350 TH S H. R. 2IB Union Calendar No. 350 116TH CONGRESS 2D SESSION H. R. 2 [Report No. 116–437] To authorize funds for Federal-aid highways, highway safety programs,](https://static.fdocuments.in/doc/165x107/60081b2331f30f7d7707bd44/union-calendar-no-350-th-s-h-r-2-ib-union-calendar-no-350-116th-congress-2d.jpg)