Hydrometallurgical Treatment of Electronic Scrap To Recover Gold ...
25
/RI ls 94o PLEASE DO NOT REMOVE FROM LIBRARY g: Bureau of Mines Report of Investigations/1985 t} Hydrometallurgical Treatment of Electronic Scrap To Recover Gold and Silver By H. E. Hilliard, B. W. Dunning, Jr., D. A. Kramer, and D. M. Soboroff UNITED STATES DEPARTMENT OF THE INTERIOR M,NES 75TH A
Transcript of Hydrometallurgical Treatment of Electronic Scrap To Recover Gold ...

~ /RIls94o PLEASE DO NOT REMOVE FROM LIBRARY
g: Bureau of Mines Report of Investigations/1985
t}
Hydrometallurgical Treatment of Electronic Scrap To Recover Gold and Silver
By H. E. Hilliard, B. W. Dunning, Jr., D. A. Kramer, and D. M. Soboroff
UNITED STATES DEPARTMENT OF THE INTERIOR ilGY~J O~.~~
M,NES 75TH A ~

Report of Investigations 8 940
Hydrometallurgical Treatment of Electronic Scrap To Recover Gold and Silver
By H. E. Hilliard, B. W. Dunning, Jr., D. A. Kramer, and D. M . Soboroff
UNITED STATES DEPARTMENT OF THE INTERIOR
Donald Paul Hodel, Secretary
BUREAU OF MINES
Robert C. Horton, Director
Library of Congress Cataloging in Publicati on Data:
Hyd ro me t a llur gica l trea tme nt of electronic scrap to recover gold an d s ilv e r.
( Repo rt o f inve s ti gation s / United States Department of the Interior, Burea u o f Min es ; 8940)
Bibli ogra ph y : p.11.
Supt. o f Docs. no.: I 28.23:8940.
1. Go ld -Me tallurgy. 2. Silver-Metallurgy. 3. Hydrometallurgy. 4. Prec iou s met a l s -Recycling. 5. Electronic materials-Recycling. I. Hilli a rd, H. E . (He nry E.). II. Series: Report of investigations (Unite d St a tes . Burea u o f Min es) ; 8940.
TN23.U43 [TN770] 622s [669'.221 84-600340

Abstract •••••• Introduc tion •• Experimental equipment and procedure.
Pressure leaching ••••••••••••••••••
CONTENTS
Ultrasonic-aided leaching •••••••••••• Regeneration of sulfuric acid and iron metal recovery.
Results and discussion .................................. . Pressure-leaching results •• Precious metal separation •••• Ultrasonic-aided-leaching results •• Regeneration of sulfuric acid •••
Economics ••••• Summary........ .....•• . ••..•.•••••••••••.... Re f erences . . . . . • . . . . . . . . . . . . . . . • . . . . . . . . .... . Appendix.--Economic evaluation........................ . .................. .
1. 2. 3. 4. 5.
A-I. A-2. A-3.
1. 2.
3. 4. 5. 6. 7.
8. 9.
10. A-I. A-2. A-3. A-4.
A-5.
A-6.
ILLUSTRATIONS
High-tension-separated metal fraction •••••••••••• Flow diagram for countercurrent leaching process. Sulfuric acid regeneration cell •••••••••••••••••• Influence of reaction time on copper extraction.. • ••••• Influence of nitric acid addition to leach solution on copper and ext rae tion ....................................... .
Bulk electronic scrap separation section (step 1) •• Precious metal concentration section (step 2) •••• Precious metal separation section (step 3) ••••••
TABLES
silver
Elemental composition of HTS metallic fraction •••••••••••••••••••••• Average analysis of feed material for pressure and ultrasonic-aided
1 eachi ng •...•......•...........•..•...............•....•..•..•.•..•... Influence of leach temperature on extraction of copper from feed material Influence of pressure on extraction of copper from feed material ••••••••• Influence of reaction time on extraction of copper from feed material •••• Chemical analysis of leach liquor from each stage of leach cycle ••••• Concentration and distribution of metal values in leach solution and residue .......•.......•••.........
Chemical analysis of cement copper. Spectrochemical analysis of products ••••••• Cathode efficiency for iron deposition and H2S0 4 Estimated capital costs •••••••••••
regeneration.
Estimated operating costs ••••••••• Estimated daily processing costs ••••• Comparison of daily costs of proposed processing steps and refinery processing charges ••••••••••••••••••••••••••••••••••••••••••••••••••
Comparison of estimated daily profit with profit required for a 15-pct return on investment ••••••••••••••••••••••••••••••
Estimated return on investment after taxes •••••••••
1 2 3 3 4 4 6 6 8 8 9
10 11 11 12
3 4 5 8
9 12 13 14
3
6 7 7 7 7
8 8 9
10 16 18 18
19
19 19

A/ft2
g
g/L
gal
h
h/d
hp
kg
kHz
kW·h
L
lb
lb/d
lb/h
UNIT OF MEASURE ABBREVIATIONS USED IN THIS REPORT
ampere per square foot
degree Baume
degree Celsius
gram
gram per liter
gallon
hour
hour per day
horsepower
square inch
kilogram
kilohertz
kilowatt-hour
liter
pound
pound per day
pound per hour
Mgal
min
mL
Mlb
pct
psig
rpm
s
ton/d
tr oz/ton
vol pct
W
wt pct
yr
thousand gallon
minute
rn.illili te r
thousand pound
percent
pound per square inch, gauge
revolution per minute
second
ton per day
troy ounce per ton
volume percent
watt
watt hour
weight percent
year

HYDROMETALLURGICAL TREATMENT OF ELECTRONIC SCRAP TO RECOVER GOLD AND SILVER
By H. E. Hilliard, 1 B. W. Dunning, Jr.,2 D. A. Kramer, 1
and D. M. Soboroff3
ABSTRACT
The Bureau of Mines investigated hydrometallurgical procedures for concentrating precious metals from a mechanically processed metal fraction of obsolete military electronic scrap. Feed material for the leaching procedures described in this report was the high-tensionseparated metal concentrate obtained as a fraction from mechanically processing partially stripped electronic units. Initial pretreatment with a 20-wt-pct-NaOH solution solubilized most of the aluminum. After washing, the resulting residue was incinerated to destroy any organics attached to metal particles. The incinerated residue was leached with 20-vol-pct H2 S0 4 solution using two methods, countercurrent pressure and ultrasonic-aided leaching to solubilize the base metals, predominantly copper. Silver was recovered from the base metal leach residue using 50-vol-pct HN03, and gold contaminated with several percent palladium was recovered from the silver leach residue using aqua regia. The impure silver and gold plus palladium products represent about 1.5 wt pct of the high-tension-separated metal concentrate. Included is a threestep process evaluation study of mechanical processing of general electronic scrap and two hydrometallurgical procedures for leaching hightension-separated metallic concentrates obtained from the mechanical processing step. Process evaluation concluded that only mechanical processing is economically viable.
'Chemist. 2Supervisory metallurgist. 3Research supervisor. Avondale Research Center, Bureau of Mines, Avondale, MD.

2.
INTRODUCTION
The rec ove r y of precious me tal s from scrap supplies an important segment of domestic requirements for gold and silver . Bureau of Mines statist i.cs esti- ' mate that U. S . refinery prod~ct~on of gold and silver in 1982 totaled 3.4 and 79 million tr oz , respecr~_v~ly (1).4 Of this amount , 79 and 38 pct of -the gold and silver, respectively, was reclaimed flom secondary sources.
The Bureau of Mines investigated the recovery of precious metals from electronic scrap through a cooperative agreement ~lth the Defense Property Disposal Service (DPDS). DPDS , an agency of the Depa r t me n t of Defense, is responsible for the d i sposal of millions of pounas of obsolete military electronics annually. The main purpose of ~he cooperative agreement with DPDS was to obtain an estimate of the amount and distribution of precious metals in military electronic scrap . In an initial step t o obtain this infor mation, a mechanical processing pr ocedur e was develo ped on a l aboratory scale . Based on the laboratory resul t s, a small p i lot plant was developed fo r concentrating the precious metal s i n to more valuable fractions at feed rates up to 500 lb/h (2- 4) . Products obtained i nclud ed an iron- base fraction, a n aluminum-base fraction, a nonmagnetic frac ' tion, a tangled- wire fraction, and air classifier lights . The nonmagnetic frac" t i on was further pr ocessed by hightension separation (HTS) to r ecover me· tallic and nonmetall i c fyactions . The HTS metallic fraction represented about 17 pct of the total plant input for partially stripped general electronic scrap, yet contained approx imately 51 and 56 pct of the gold and silver, respectively . This material with its abundant surface area is idea l f o r hyd r ometal lurgical treatment to further concentrate the pre" cious metals, The remaining 83 pct of the mechanically processed electronic scrap can be handled in the following fashion. The aluminum fraction (11 pct)
4 Underlined numbers in parentheses re fer to items in the li s t of r e f e rences preceding the appendix.
and the plus 1/2·-in iron-base fraction (17 pct) can be recycled as aluminum and iron scrap. The minus 1/2-in iron-base f r action ( l l pe t) can he used as a copper cementing agent (1), recovering the precious metals from the washed residue, or as a coppe r blast furnace addition for the needed iron values, with the precious metals reporting to the black copper product . The remalnlng fractions (44 pct) would be ideal for pyrometallurgical treatment in a blast and/or converting furnace to produce copper-base bullion contaieing the !"emaining precious metals . The precious metals in the copper-base bullion would eventually be recovered from the slimes i n the copper cank house circuit.
The purpose of the high-tension separation step and subsequent leaching of this fraction (6) is to further concentrate the precio~s metals, thus providing a more reliable sample for 8.ssay. The separation step also reduces the weight of material t o ship to the r efiner and the per pound toll re f ini ng charge. Tradi tional l y, toll refiners have used several pyrometallurgical methods to recover pre-' cious metals from electronic scrap and electronic scrap concentrates: However, the small particle size resulting from mecha nical processing makes the HTS metallic fraction ideal for hydrometallurgical treatment such as pressure and cltrasonic-aided leaching to remove base metals and further concentrate the precious metals . While the economics of the hyd r ometallurgical operations are not favorable, the operations are useful for providing a homogeneous concentrate from which an accurate precious metal assay can be determined.
The physical appearance of the HTS metallic fraction is shmm in figure 1, and a chemical analysis is listed in table 1. The elemental composition of this fraction will vary depending on the type and vintage of electronic scrap processed. In ear l ier tests with a particlur lot of av ion ic s c r ap , the gold and si l ver conc ent rations in the HTS metallic frac t i on were equivalent to 42 and 505 tr oz/ton, r espectively (2). The fraction used in

FIGURE 1. - High-tension-seporated metal fraction.
3
this investigation contained 36 tr oz/ton gold and 401 tr oz/ton silver. The avionic scrap from which this fraction was recovered consisted of such items as radio receivers, amplifiers , transmitters, and decoders . Many of the items had been partially stripped of easily removed components such as circuit cards that contain precious metals . Prior to acid leaching, the HTS metallic fraction was leached with 20--"Wt-pct NaOH; the residue from this operation was washed and then incinerated to destroy any organics attached to the metallic particles. The caustic leaching of the HTS metallic fraction, as well as the mechanical bene-ficiation, are discussed in greater detail in other publications (l-~, ~).
TABLE 1. -- Elemental composition of HTS metallic traction
Conc, wt pct
Ag . . ... .... 1.37 Ai . . • • • • • • • 27.2 Au . . . . . . . . . .12 Cr. . . . . • . . . . 1 eu. . . . . . . . . 38.4
Conc, wt pct
Fe. . . . . . • • . 9.4 Ni • . • • • • . • • 3 . 2 Pb. 0 • • • • • • • .2 Sn • •• ..... ;.. 2. 1 Remainder, • ( 1 )
--~-----------------------
lMostly Si as Si0 2 (fiberglass and plastic filler).
EXPERIMENTAL EQUIPMENT AND PROCEDURE
Two leaching systems to solubilize the HTS metallic fraction using 20-vol-pct H2S04 were studied. One system used pressure leaching and mechanical stirring; the other leach was at atmospheric pressure but stirred with ultrasonic energy •
PRESSURE LEACHING
All pressure-leaching tests were conducted in titanium autoclaves of 2-L capacity. Vigorous agitation and rapid gas dispersion were achieved using a stirring shaft with two turbine-type impellers turning at 600 rpm. An internal thermowell, support brackets, and dip tubes provided baffling so that continuous turbulence of the leaching reagent was
maintained in the autoclaves. Leach tests were conducted in three-stage countercurrent steps with solid-liquid separation between each stage. Measured quantities of residue from NaOH leaching (~120 g) and 1 L second-stage depleted acid were charged into the first-stage autoclave and then heated to selected temperatures and pressures. The thirdstage autoclave was charged with 1 L of fresh 20-vol-pct H2S04. Leach cycle times studied were 1.5, 2, and 4 h per stage. Air was sparged through the autoclaves during all tests. After leaching, the slurry was removed from each auto--clave and filtered, and the products were analyzed, A flow diagram of the process is shown in figure 2 .

4
Fresh 20-vol-pct H2 S04
Air ---. , Air~ V
" Air~
First stage ,... Second stage ~ Third stage
-
Pregnant leach liquor
Solid -liquid separation
Liquid \ /
Solids
Solid -liquid Liquid separation
Solids
\ /
Solid -liquid separation
Precious metals concentrate
FIGURE 2 .• Flow diagram for countercurrent leaching process.
ULTRASONIC--AIDED LEACHING
Ultrasonic-aided leach tests were conducted using a magnetostrictive ultrasonic supply. This unit delivered 900 W of electrical power at the resonance frequency of 20 kHz to a transducer tank remote from the generator via a connecting cable. Measured quantities of residue from NaOH leaching (~120 g) and 1 L of 20-vol-pct H2S04 were added to a 2-L stainless steel beaker. The beaker was clamped inside the transducer tank, water was added to the same level as the liquid inside the beaker, and the power was turned on. All tests were single stage and conducted at atmospheric pressure. Extraction efficiency was determined for 0.5-, 1-, 2-, and 3-h leach times. The temperature was allowed to find its own level (70 0 to 75 0 C).
REGENERATION OF SULFURIC ACID AND IRON METAL RECOVERY
After copper cementation by a magnetic scrap fraction, the spent H2S0 4 leach liquor containing mostly ferrous iron was recycled and iron metal was recovered by electrolysis in a cell containing an anode and cathode chamber sep-arated by a cation-selective membrane. The anolyte containing aqueous ammonium sulfate and the catholyte (spent leach liquor) were circulated through the cell with a peristaltic pump. H2S0 4 was regenerated in the anode compartment, and iron plated on the cathode. Figure 3 is a photograph of the cell. The anode was a 4- by 4-in sheet of 6 pct antimonial lead; the cathode, a 4- by 4-in sheet of stainless steel; and the membrane, a 4- by 4-in sheet of

5
FIGURE 3. - Sulfuric acid regeneration cell.

6
Nafion 423 . 5 Sulfur ic acid regeneration and iron recovery tests were conducted as described by Burke (7) . The spent leach liquors were placed in the cathode chamber. The anode chamber contained an electrochemical equivalent of aqueous (NH4) 2S04. When current i s passed t h r ough the cell, t he reactions in the cell are a s follows :
membrane into they react (NH4)2 S04 "
che cathode chambe r , whe r e with S04- - ions to fo~m
Ca thode chamber : 3 . 2NH4 + + S04-- + (NH4)2S04
4 . Fe++ is reduced to Fe o at the c a thode .
Anode chamber: Fe++ + 2e + Fe o
1 . Electrolysis of water by the elec-tric current 5. H2 gas evolution
2. NH4 + ions chamber through
migrate from the anode the cation-selective
Sulfuric acid produced in the anode chamber ,vas returned to the leach cycle; ammonium sulfate produced in the cath·· ode chamber was recycled to the anode chamber.
RESULTS AND DISCUSSION
PRESSURE-LEACHING RESULTS
Feed. material for the pressure-·leaching tes t s was the HTS metal:ic concentrate from which aluminum had been extracted with aqueous sodium hydroxide and the combustibles destroyed by incineration (6) 0 An analysis of the feed material is listed in table 2. Since copper was the most abundant base metal in the feed, copper extraction was used to express the degree of leaching. Table 3 shows the influence of temperature on the percent copper extracted, which increased with temperature to about 90 pct at 90° C. Increasing the leach temperature above 90° C had little effect on the percent of copper extracted, owing to the presence of cupronickels and Monels that have very limited solubility for the parameters used in these tests . Table 4 shews the influence of pressure and table 5 the influence of reaction time on the percent of copper extracted. As the pressure and reaction time were increased, the percent
5Refere nce to specific not imply endorsement by Mines.
products does the Bureau of
of copper extraction increased, again to the apparent limiting valu e of about 90 pc~ Attempts to increase copper extraction beyond this point were not successful. Copper not extracted during the pressure-leach phase was recovered during the silver recovery phase.
TABLE 2. - Average analysis of feed material! for pressure and ultrasonic-aided leaching
Element:
Cone, ~t pct
Ag ••••••• 1.74 Al....... 2.8 Au. . . . • . • .16 Co. . . • • • • .2 Cr. . . . • • . . 2 Cu.... . .. 48 . 9 Fe....... 14 . 9 Mo. • • • • • • . 3 !Feed material is
leaching of the HTS 2Si as Si0 2 and
Element-Continued
Ni •• • •••.. • Pb •• •• • • ••• Pd •• • •••••• Sn ••• • • ••• • w •• •••••• 0 •
Remainder ••
Cone, wt pct
4.1 .3 .1
2.2 . 1
( 2)
the residue from NaOH metallics. additional oxygen as
metal oxides formea during t ion st.ep 0
the i nciner a -

TABLE 3 . - Influ ence of leach temperature on extraction of copper from feed material 1
Temp> °c
50 •••••••••• ••• ••••••• • • •••• 70 •••••••••••••••••••••••••• 90 • ••• • • ••••• • ••• ••••• • •• • • • 110 • •. •• ••••• •• •••••••••••••
Extraction, pct
63 86 89 90
1pressure, 100 psig ; l each time 4 h per stage ,
TABLE 4. - Influence of pressure on extraction of copper f rom feed material 1
Xressure, pS1g Ext '~'action,
pct
39. • • • • • • • • • • • • • • • • • • • • • • • • • 69 50. • • • • • • • • • • • • • • • • • . • • • • • • • 88 80. • • • • • • • • • • • • • • • • • • • • • • • • • 89 lOO •••••••••••• ~............ 89
1Leach time, 4 h per stage; leach temperature , 90 0 C.
TABLE 5. - Influence of reaction time on extraction of copper from feed material 1
Extraction, Leach cyle time, h pct
1.5 ••...•.•.... ;,..... . .. .. .. 70 2. • • • • • • • • • • • • • • • • • • • • • • • • • • 79 4. • • • • • • • • • • • • . • • • • • • • • • • • • • 89
1 Pressure, 100 ps ig; temperature. 90 0
C; 3 cycles.
Based on the results of these tests, the following conditions gave the best copper extraction:
Temperature Pressure Leach cycles
80 0 to 90 0 C 50 to 80 psig 4 h, three cycles
7
Table 6 l i sts a stage-by-stage analysls of the leach l i quor from each leach cy cleo More th.an 80- pct copper extract i on was obtained in the first two stages, while the final stage increased copper extraction to slightly more than 89 pct.
TABLE 6 0 .- Chemical analysis of leach liquor from each stage of leach cycle
Stage 1 Stage 2 _Stage 3 Ext raction
pct Cu •• 46 36 7.8 Conc in filtrate , giL: eu ..... . ....... 51.2 23,4 4 . 2 Ag ••••••••••••• <0 . 0001 <0-0001 <0 . 0004 Al . .....•..... . 1.2 0 . 07 0 . 01 Fe •• •• ••• •••• •• 0.5 1.4 1.4 Ni •••. ••••.. . • • 0.2 0.5 0.4
Results of larger scale (16-fold inincinerated residue charge tests) leaching are listed
crease in the used in other
in table 7, Distributions of metal val-ues between the leach solutions and residues are similar to those obtained in smal l-scale tests . Most of the copper and soluble nickel and iron were e x tracted, while tin, lead, and stainless steel reported to the residue with the precious metals. The residue (320.6 g) contained about 29 g of precious metals. Experimental conditions for larger scale leaching were 1,900 g feed material; 16 L 20-vol-pet H2 S0 4 , 3- to 4-h leach cycles,
90 0 C, 100 psig. Copper was recovered from the preg
nant leach liquor by cementation with a magnetic fraction of shredded electronic scrap. An analysis of the cement copper is listed in table 8. The cement copper was of acceptable quality for further commercial recovery operations, such as reverberatory smelting in a copper refinery.

8
TABLE 7. - Concentration and distribution of metal values in leach solution and residue
Products Concen- Distribution, tration pct
Leach solution: giL Ag ••••••••••••• <0.001 <0.004 Al ••••...••.••• .002 <.001 Au ••••••••••••• ND ND Cr ••••.•••••••• .0004 6.2 eu ............. 36.3 89.3 Fe ••••••••••••• 2.9 29.0 Ni ••.•••.•..•.• 1.02 38.8 Pb ••••••••••••• .003 1.4 Sn ••••••••••••• .14 7.9
Residue: wt pct Ag ••••••••••••• 8.13 99.1 AI ••••••••••••• .4 . 2 Au ••••••••••••• .74 >99.9 Cr ••••••••••••• 24.4 10.9 eu ............. .42 94.0 Fe ••••••••••••• 39.6 71.0 Ni •.••..••...•• 9.0 61.1 Pb ••••••••••••• 1.1 98.6 Pd ••••••••••••• .21 99.9 Sn .•••••••••••• 9.5 91.1
ND Not detected.
TABLE 8. - Chemical analysis of cement copper
Element Conc, wt pct
Ag ••••••••••••••• 0.001 AI •••••.•.••••..• <.01 Au ••••••••••••••• <.0001 eu ............... 91 Fe ••••••••••••••• 1.0 Pb ••••••••••••••• .01 Sn ••••••••••••••• .6
PRECIOUS METAL SEPARATION
Silver was recovered from the pressureleaching residue by dissolution in 50-vol-pct RN03 and subsequently precipitated with sodium chloride as silver chloride. Silver chloride was reduced to silver metal by mixing with sodium carbonate and heating the mixture to 600 0 C (~). Copper not extracted during H2S0 4 leaching was recovered from the silverfree HN03 solution by cementation with iron scrap. Finally, gold was extracted
from the RN03 leaching residue with aqua regia and precipitated with sodium bisulfite. An analysis of the gold and silver products and the final residue is listed in table 9. The final residue, weighing 194 g, consisted mostly of acid-insoluble noncombustibles (mostly silica) used in the manufacture of plastics and printed circuit boards. Stainless steel and tin made up the remainder.
ULTRASONIC-AID ED-LEACHING RESULTS
Figure 4 shows a plot of percent copper extracted versus reaction time during ultrasonic-aided leaching. About 38-pct extraction was obtained in the first 30 min, but subsequent dissolution of copper was very slow , The coextraction of silver is also plotted. Silver extraction was less than 1 pct after 240 min of leaching. In exploratory tests, RN0 3 was added to the H2 S0 4 solution as an oxidizing agent. Figure 5 shows the influence of RN0 3 concentration on the extraction of copper and silver. An extraction of 94 pct copper was obtained after a 2-h leach time. Coextr'action of silver was about 7 pct. Treatment of leach residues and leach liquors was the same as discussed under pressure leaching.
50,-----~----~----~----~----~
40
u c.
0 30 KEY z ... Cu 0 to-u • Ag <t: 20 a: to-x UJ
10
o 60 120 180 240 300
LEACH TIME , min
FIGURE 4. - Influence of reaction time on cop
per extraction.

9
TABLE 9. - Spectrochemical analysis of products, weight per cent
-Product Gold Cement silver' Final residue
Ag •••••••••••••••• • •••••••• • 0.03 - 0.3 >10 0.0003- 0.003 Al •••••• • •• • ••••••••••• • •••• . 003- .03 .03 -0.3 .3 - 3 Au •••••••••••••••••••••••••• >10 .0003- .003 ND Cr ••••••••• • ••• • ••••.••••••• .003- .03 ND . 3 - 3 eu ......... ~ ........ c. •••••• • .003- .03 .03 - . 3 .1 - 1 Fe •••••••••••••••••••••••••• .03 - .3 .03 - .3 .3 - 3 Ni •.......•.••...••.....•.•• .003- .03 .003 - .3 .01 - .1 Pb •••••••••••••••••••••••••• .01 ,,- .1 .3 ··-3 .1 - 1 Pd •• • ••••••• • ••••••••••••••• 1 - 10 ND ND Si ........•................. • 1 .- 1 .1 -1 >10 Sn •••••••. • ••••••..••.•• " •.. .03 - .J .3 -3 1 -10
ND Not detected. 'Quantitative a.nalysis of cement silver; 97.5 Ag, 0.028 Al, 0.53 Cu, 0.12
Pb, and 1. 82 Sn.
REGENERATION OF SULFURIC ACID
Burke (7) investigated the regeneration of H2S0 4-and the recovery of iron metal from spent pickle liquors at current densities from 32 to 129 A/ft 2 • A current density of about 60 A/ft 2 was reported to
-u c. -z
o IU <! c: lX W
100.-----.-----~------,-----,,-----.
80
60
40
20
o
KEY .. eu • Ag
2 4 6 8 10
HN0 3J mL
FIGURE 5. · Influence of nitric ac id add ition to
leach solution on copper and si Iver extraction.
be most economical. Burke determined that electrolysis at 32 A/ft 2 consumed less power (501 W'h versus 466 W·h). However, electrolysis at about 60 A/ft 2
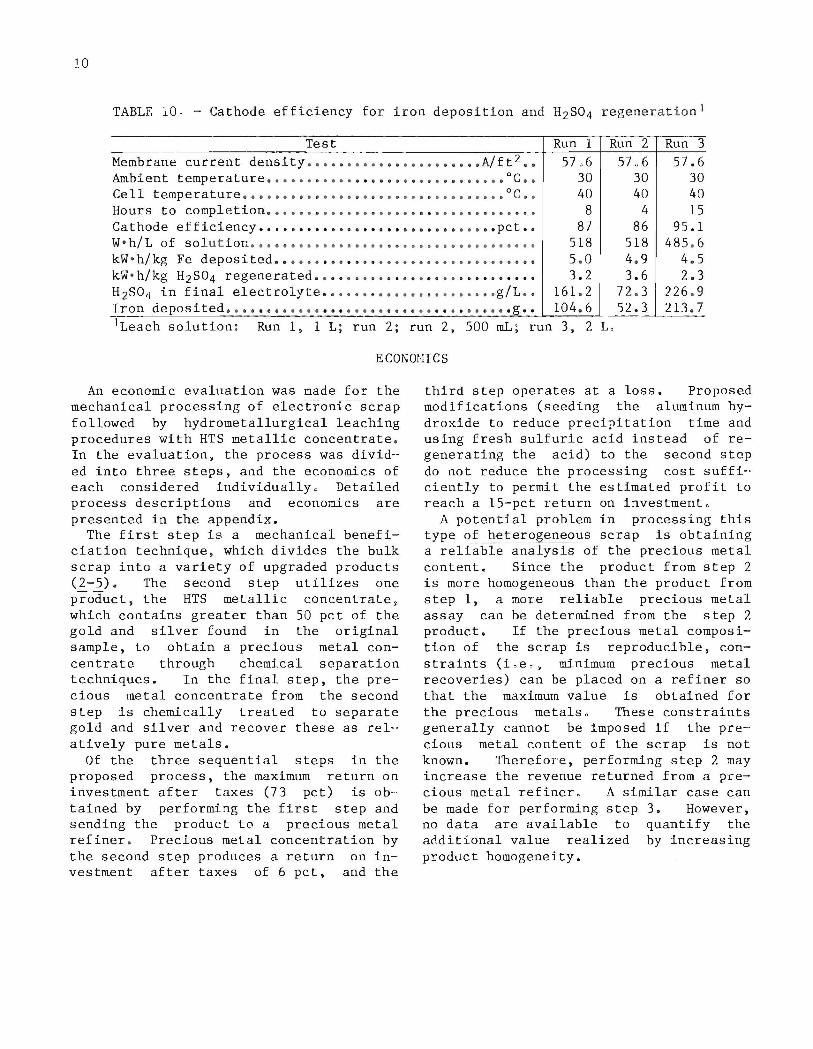
was preferable because the current efficiency is much higher and electroly·sis is completed in less than half the time required at 32 A/ft 2 (12 h versus 28 h). This was confirmed in our laboratory. Consequent l y, a ll resul ts reported here were obtained at a current den · sity of 58 A/ft 2 . The catholyte was spent leach solution containing 107 giL iron and 3.4 giL H2S04' The anolyte contained 368 giL ammonium sulfate. The electrolytes were circulated through the anode and cathode chamber and electrolyzed until essentially all iron was deposited. The pH in the cathode compartment was maintained between 1.3 and 3.0 with dilute H2S04' Electrolysis was carried out at room temperature. Results from three tests are reported in table 10. In practice, electrolysis is continued until the H2S04 concentration in the anode chamber reaches the desired level. This is accomplished by adjusting the ammonium ion content of the anolyte and the ferrous ion content of the catholyte.
!.O
TABLE lOo - Cathode eff i c i ency fo r iron depos i t i on and H2 S0 4 r egenerat ion 1
Test Run 1 Run 2 Run 3 -_.
Membrane current density •••...•..•••••.•.... . . AI f t 2 •• 57,,6 57u6 57.6 Ambi ent temperature •••.•..•.•.. . ...•... •.•.•••.. . °C •• 30 30 30 Cell temperature •••..•••.•••••..••..••••.•••...•. DC •• 40 40 40 Hours to completion . ...............•. .. . .....•....... 8 4 15 Cathode effici ency •..• • •••• ••.• .• • •• ••• • ••• ••• •• pct • • 87 86 95.1 W· h/L of so l ut ion .................................... 518 518 485 . 6 kW · h/kg Fe deposited .. •... . .. . ... ............•.•...•. 5 . 0 4 . 9 4 . 5 kW · h/kg H2 SO4 regenerated • • • • •••.• • . • • • ••. • ••• • •• ••• • 3.2 3.6 2 . 3 H2SO 4 in final elect rol y te • ••••• • •••••••••.•.••• g/L •• 161 . 2 72 . 3 226 . 9 Iron deposited .... . ... .... . . . ... . . .... .• .. . . ..... . g .. 104 . 6 52.3 213 .7 1Leach solution : Run 1 , 1 L ; run 2; run 2 , 500 mL; run 3 , 2 L,
ECONmncs
An economic evaluation was made for the mechanical processing of elect r onic scrap followed by hydrometallurgical leaching procedures with HTS metallic concentrate . In the evaluation, the process was divided into three steps, and the economics of each considered individually 0 Detailed process descriptions and economics are presented in the appendix.
The first step is a mechanical beneficiation technique , which divides the bulk scrap into a variety of upgraded products (2- 5) . The second step utilizes one product, the HTS metallic concentrate, which contains greater than 50 pct of the gold and silver found in the original sample, to obtain a precious metal concentrate through chemical separation techniques. In the final step, the precious metal concentrate from the second step is chemically treated to separate gold and silver and recover these as rel-atively pure metals.
Of the three sequential steps in the proposed process, the maximum return on investment after taxes (73 pct) is ob-tained by performing the first step and sending the product to a precious metal refiner . Precious metal concent ration by the second step produces a return on investment after taxes of 6 pct, and the
third step operates at a loss. Proposed modifications (seeding the aluminum hydroxide to reduce precipitation time and using fresh sulfuric acid instead of regenerating the acid) to the second step do not reduce the processing cost suffi·, .. ciently to permit the estimated profit to reach a 15-pct return on investment.
A potential problem in processing this type of heterogeneous scrap is obtaining a reliable analysis of the precious metal content. Since the product from step 2 is more homogeneous than the product from step 1, a more reliable precious metal assay can be determined from the step 2 product . If the precious metal composition of the scrap is rep r oducible, constraints (ioe", minimum precious metal recoveries) can be placed on a refiner so that the maximum value is obtained for the precious metals, These constraints generally cannot be imposed if the precious metal content of the scrap is not known. Therefore, performing step 2 may increase the revenue returned from a precious metal refiner. A similar case can be made for performing step 3. However, no data are available to quantify the additional value realized by increasing product homogeneity.

Mechanically processed HTS metallic fraction that has been pretreated with aqueous NaOH to remove the aluminum and incinerated to destroy the organics was leached with 20- vol-pct H2 S0 4 to remove most of the soluble base metals. Relatively Dure silver was removed from the H2 S0 4 leach residue using nitric acid. Impure gold contaminated with palladium was recovered from the silver leaching
11
residue with aqua regia . The impure silver and gold products represent about 1.5 pct of the original weight of the HTS meta:lic fraction. The final leach resi due is primarily silica, but does contain recoverable amounts of tin . While the economics of the hydrometallurgical pro'cessing are not favor-able, it provides a way to assess the value of the scrap trea.t"':!d .
REFERENCES
L U. S . Bureav of Mines" Mine:.:a.i. COIu modity Summaries 1983" Pp. 60"'61, 140·-141.
2. Ambrose, F:, and B. W. Dunning, Jro Precious Metals Recovery From Electronic Scrap. Paper in Proceedings of the Seventh Mineral Waste Utilization Symposium (Chicago, n, OcL 20··21, 1980). IIT Res . Inst., Chicago, IL, 1980 , pp . 184-1910
3. Mechanical Processing of Electronic Scrap To Recover PreciousMetal--Bearing Concentrates. Ch. in Precious Hetals, ed. by R. 0. HcGachie and A. G. Bradley. Pergamon, 1981, pp. 67-76.
4. Dunning, B. W., Jr., F. Ambrose, and H. W. Makar . Distribution and Analyses of Gold and Silver in Mechanically Processed Mixed Electronic Scrap. BuMines RI 8788, 1983, 17 pp.
5. and
Salisbury , H. B., L. J . H. Bilbrey, Jr.
J. Duchene , Recovery of
COPi'e:..- and Associated From Electronic Scrap . 1981, 16 pp.
Pr ecious Met8.ls BuMines RJ: 856J.
60 Hilliard, H. Eo, B. W. Dunning, Jr., and H. V. Makar. Hydrometallurgical Treatment of Electronic Scrap Concentrates Containing Precious Metals. BuMines RI 8757, 1983, 15 pp .
70 Burke, 20 1. Recovery Pickle Liquor and I ron Metal . 4 , 149,946, Apr. 1979 .
of Spent U. S. Pat.
8. Kunda, Wo Treatment of Complex Silver Arsenide Concentrate in Nitric Acid System. Can. J. Chem. Eng., v. 59, June 1981, pp. 347-356.
9. Weaver, J. B., and H. C. Bauman. Cost and Profitabilit.y Estimation. Sec. 25 in Perry's Chemici3l Engineers' Handbook, ed. by R. H. Perry and C. H. Chilton. McGraw-Hill, 5th ed., 1973, p. 47.

12
APPENDIX.--ECONOMIC EVALUATION
PROCESS DESCRIPTIONS
Brief descriptions of each of the three steps of the proposed process are
included here. Process flowsheets for each of the three steps are provided in figures A-I through A-3u
Wi re fract ion
Plus 1/2-in nonmagnetic
scrap
--
-
r
J I
Bulk electronic scrap
SH REDDIN G
, AIR CLASS I FIC AT ION
1 J I -L
L J
I MAGNET I C SEPARAT ION] _ Magnetic fraction
I I
I
I
~J -1
SCREENING I Minus 1/2 - in
nonmagnetic sc rap , CRUSH ING I
_ Wir e fraction
I Minu s 1/ 4- in scrap SCREENING
I
Plus 1/4- in sc rap
1 EDDY-CURRENT I
SEPARATION I Mix ed metal I ic and nonmetal I i c frac ti on
, Copper alloys and cast
Aluminum fract ion
aluminum fraction
J - I
DU ST COLLECTION 1 I
HIGH-TENSION 1 SEPARATION 1
I~
No!metal Ii c fraction
FIGURE A-l. - Bulk e lectronic scrap separation section (step 1).
-
-
Light fraction
Meta)) ic fraction

Makeup NaOH
NaOH
'Wash
'Wa-=.h wa te r
'Wate r vapor
Metallic rra ct ion of hi gh-ten s ion -=.e parator scrap Air
AI (OH),
Fille r c a ke
Wa sh i nq s \.las h
wate r
Fe
'Wa c,1 1 watl.:r
Fe
13
Air Oftga,>~s
'Water
FIGURE A-2. - Precious metal concentration section (step 2).
Bulk Electronic Scrap Separation Section (Step 1)
As-received electronic scrap is shredded in a 75-hp hammer mill at a feed rate of 6 ton/d to reduce the size to about 1-1/2 in, and then fed to an air classifier where it is separated by differences in density. Light material entrained in the air stream is removed by a dust collector. The heavy material is conveyed to a magnetic separator where the magnetic fraction is separated from the bulk scrap and recovered as a product. Nonmagnetic material from the magnetic separator is sized on a 1/2-in vibrating screen. Plus 1/2-in nonmagnetic scrap is stored as an intermediate product, while the minus 1/2-in material is fed to a 15-hp roll crusher.
After the ceramic and nonmetallic portions of the minus 1/2-in scrap are broken up in the roll crusher, the scrap falls onto a 1/4-in vibrating screen.
Wire collects in bunches on the screen and is easily removed by hand. The plus 1/4-in fraction from the screen and the plus 1/2-in nonmagnetic scrap intermediate product are fed to an eddy-current separator, which is a batch operation where three products are recovered--an aluminum fraction, a copper alloy and cast aluminum fraction, and a mixed metallic-nonmetallic fraction.
Minus 1/4-in scrap from the vibrating screen is combined with the mixed metallic and nonmetallic fraction from the eddy-current separator. These are fed to a high-tension separator, operating batchwise, where the material is separated by its ability to hold an induced charge. Two products are recovered from this separation--a nonmetallic fraction and a metallic fraction. About 1,200 Ib/d of the metallic fraction is recovered, which contains significant quantities of precious metals and is used as feed to the second step.
Ce f'lent co pper
NdC 1 so l ul i on
..Jas h
'-'OJ t e r
F i 1 t r a te
Si I vc r rllf! ta 1
Preciou s me tal s COnce n t r a t e
F ILT RAT ION
\.lash
,":a l er
''''as h water
Gold"pal l adium metal
HNO:: a-rl He I
Res i due
o i sea r de d f i 1 tra t t;
Wa ter va po r
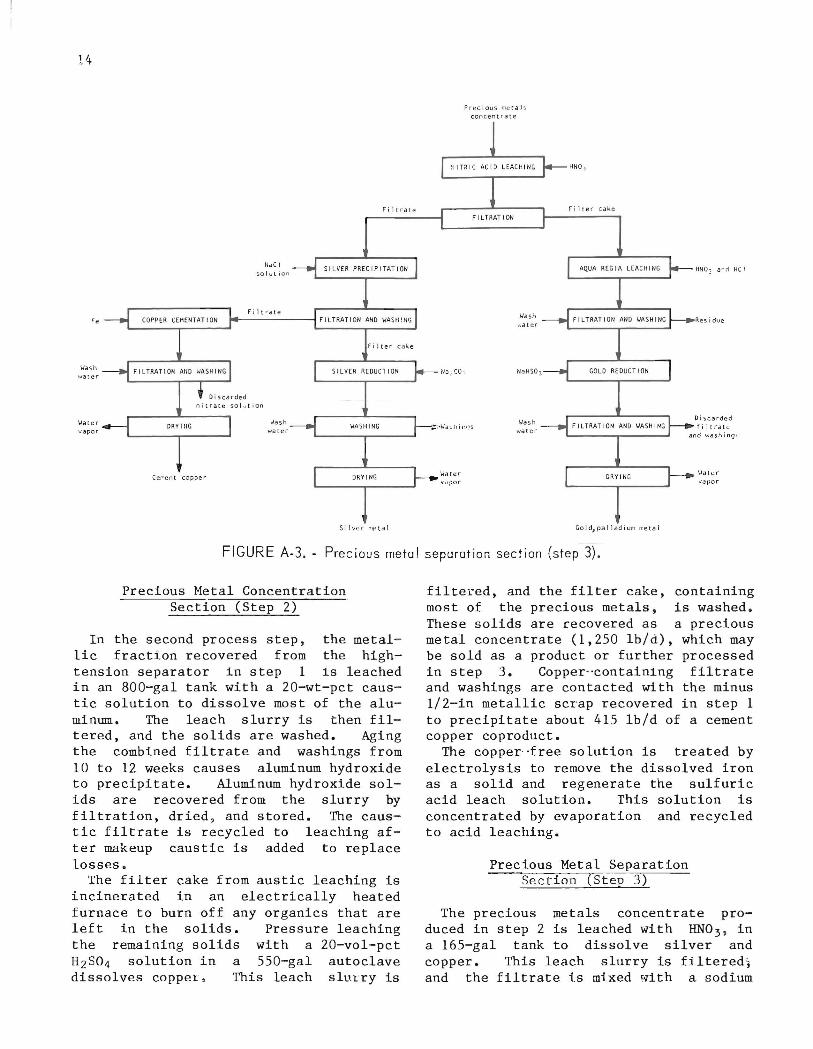
FIGURE A-3 . - Precious metal separation secti on (step 3) .
Precious Metal Concentration Section (Step 2)
In the second process step , the metallic fraction recovered from the hightension separator in step 1 is leached in an 800-gal tank with a 20-wt-pct caustic solution to dissolve most of the aluminum. The leach slurry is then filtered, and the solids are washed. Aging the combined filtrate and washings from 10 to 12 weeks causes aluminum hydroxide to precipitate. Aluminum hydroxide solids are recovered from the slurry by filtration, dried, and stored. The caustic filtrate is recycled to leaching af ter makeup caustic is added to replace losses .
The filter cake from austic leaching is incinerated in an electrically heated furnace to burn off any organics that are left in the solids. Pressure leaching the remaining solids with a 20-vol-pct H2S04 solution in a SSO-gal autoclave dissolves coppel, This leach sltl.-cry is
filtered, and the filter cake, containing most of the precious metals, is washed . These solids are cecovered as a precious metal concentrate (1,2S0 lb/d), which may be sold as a product or further processed in step 3. Copper··containing filtrate and washings are contacted with the minus 1/ 2-in metallic scrap recovered in step 1 to precipitate about 41S lbld of a cement copper coproduct.
The copper· ·free solution is treated by electrolysis to remove the dissolved iron as a solid and regenerate the sulfuric acid leach solution. This solution is concentrated by evaporation and recycled to acid leaching.
Precious Metal Separation Section (Step 3)
The precious metals concentrate produced in step 2 is leached with HN0 3 , in a 16S-gal tank to dissolve silver and copper. This leach slurry is fil tered~
and the filtrate is mixed with a s odium

chloride solution t o p r eci pitate the silver as a chloride . Silver chloride solids are separated from the coppercontaining solution and washed . These solids are then heated with soda ash , which reduces the silver chlor ide to lI'.etal > and any remaining solids salts are dissolved by ~Jashing the silver met -al. About 18 Ibid of this silver precip" itate is dried and stored as a product for shipment to a precious metal refiner . Ce ment copper is recoverp.r1 f"':-0t:f1 t h e remaining solution as in step 2 (49 Ibid) .
Filter cake from nitric acid leaching , which contains gold and palladium, is leached in a 170 ' ~a: tank with aqua regia, dissolving these metals as chlorides . The solids are separated by fi l tration and disca=ded. Saturating the chloride filtrate TtJith sodium. bisulfite precipitates gold aLld palladium as met als. These metals are recovered from the solution by filtration and washed. The mixed gold and palladium metal precipitate (2 Ibid) is dried and stored as a product fo1.' shipment 1':0 a precious metal refiner .
ECONOHICS
Estimated capital and operating costs are based on the preceding process de .. · scriptions and are presented separately for each step,
Capital Costs
The capital cost estimate is of the general type called a study estimate by Weaver and Bauman (9).' This type of estimate , prepared from a flowsheet and a minimum of equipment data , can be expect·· ed to be within 30 pct of the actual cost for the plant described. The estimated capital costs for each of the three steps 3re shown in table A-ion a third quarter 1983 basis (Marshall and Swift (M and S) index of 764.7). Plants designed for each of the three steps operate 1 shift per day,S days per week.
- lUnderlined numbers in parentheses re fer to items in the list of references preceding the appendix.
::'5
Equ i pmen t costs f o r the proc ess are based on cost- capacity data and manuf acturer s' cost quotation . Costs data are brought up to date by use o'f inflation indices. In developing the plant capital costs. co r rosion' resis t ant materials of s ons t ruc tJon ar e used whet'e appropriate .
Facto~s for piping , etc., except for the foundation and electrical factors, are assigned to each step, using as a basis the effect fluids, solids, or a c omb i nat i on of f luids and solid s may ha v e on the proces s equipment. Foundat ion costs are es tima t ed fo r each piece of equipment i ndividually, a nd a factor fo r the enti r e step is calculated from the totals " The electrical factor is based on motor hOl'sepower r equirements fo r each step" A factor of 10 pct, referred to as miscellaneous, is added to each step 'to cover minor equipment and construction costs that are not shown with the equip·ment listed.
For each step, the field indirect cost, which covers field supervision, inspection tempo1:'a,y const ruction , equipment rental, and payroll overhead , is estima t ed a t 10 pct of the di r ec t cos t . Engineering cost is est i mated at 10 pct, and administration and overhead cost is estimated at 5 pct of the construction cost. A contingency allowance of 15 pct and a contractor ' s fee of 5 pct are ill-' cluded in the step cost.
The costs of plant facilities and plant utilities are estimated as 5 and 1 pct, respectively, of the total process costs and include the same field indirect costs, engineering, administration and overhead, contingency allowance, and cont r actor 's fcc as are incL.1ded in the sec- ' tion costs. Included under plant faci l ities are the costs of material and labor for auxiliary buildings such as offices, shops, laboratories, and cafeterias, and the cost of nonprocess equipment such as office furniture, together with safety, shop, and laboratory equipment. Also included are labor and material costs for site preparation such as site clearing, grading, drainage, roads, and fences. The cost of water , power , and steam distribution systems is included under plant util i ties .

16
TABLE A- I . - Estimated capital costs 1
F:I.xed capital : Erected equipment cost ••••••• •• •• •••• •• ••• • • •• • ••••
Foundations •••• • ••• • ••• • ••••• • ••••••••••••••••••• Buildings .•.•. ••••• . • . ..•. .... . ...... . ......•.... St ructures . ..................................... . Ins ula t ion ...............••...................... Instrumentation .. e _ ••••••••••••••••••••••••••••••
Electrical ••••••••.•••••••••••••••••••••••••••••• Piping .•..................•......... • ..•. • ••. . ... Painting ....................•.........•.......•.. Miscellaneous ..•.................................
Total direct cost •••.••••••••••••••••• • •••..
Field indirect ••••••.•••.•••••••••••••••••••••••••• Total construction cost •••••.• c •••••••••••••
Engineering .........•..•..................•....•.•• Adminfstration and overhead ••••••••••••••••••••••••
Subtotal ...............••.........•.........
Con tingency ...............................•....•.•. Subtotal ................................... .
Contractor's fee ....................••............. Subtotal ..••.............•..................
Plant facilities, 5 pct of above subtotal •••••.•.•• Plant utilities, 1 pct of above subtotal •••••••••••
Total plant cost ...•.•....•..........•......
Land cos t ..•.•...................••.............•.• Subtotal .•.•...............•..•............•
Interest during construction period ••••••••••••••.• Fixed capital cost .........•...•............
Working capital: Raw material and supplies •.•••••••••••••••••••••••• Product and in-process inventory ••••••••••••••••••• Accounts receivable .....................•.......... Available cash .•...................••..............
Working capital cost ••••••••••••••••••••.•••
Capitalized startup costs ••••.•••.••••••••••••••••••• Subtotal ...................•.•..............
Total capital cost •••••••••••••••••.•••••.•• 1Basis: M and S equipment cost index of 764.7.
Step 1
$392,600 51,500
103,400 15,300
0 15,300 50,000 46,000 9,200
30,700 714,000
71,400 785,400
117,800 39,300
942,500
94,300 1,036,800
51,800 1,088,600
54,400 10,900
1,153,900
0 1,153,900
66,600 1,220,500
1,000 27,200 27,200 15,700 71,100
12,200 83,300
1,303,800
Step 2 Step 3
$644,900 $107,900 61,300 5,500 77 ,500 8,300 50,600 5,500
5,500 0 1,500 500
47,100 31,000 30,600 2,700 4,600 500
15,300 5,500 938,900 167,400
93,900 16,700 1,032,800 184,100
154,900 27,600 51,600 9,200
1,239,300 220,900
123,900 22,100 1,363,200 243,000
68,200 12,200 1,431,400 25~,200
71,600 12,800 14,300 2,600
1,517,300 270,600
0 0 1,517,300 270,600
87,500 15,700 1,604,800 286,300
15,400 5,400 27,600 16,200 27,600 16,200 15,700 12,500 86,300 50,300
16,000 2,900 102,300 53,200
1,707,200 339,500

The cost for interest on the capital borrowed for construction is included as interest during construction. Land investment is not included in this estimate. Cost for the plant mmer' s supervision is not included in the capital cost of the proposed plant.
Working capital is defined as the funds in addition to fixed capital, land investment, and startup costs that must be provided to operate the plant. Working capital, also shown in table A-l, is es·timated from the following items: (1) Raw material and supplies inventory (cost for raw material and operating supplies for 30 days in steps 1 and 3 and 90 days in step 2), (2) product and in-process inventory (total operating cost for 30 days), and (3) available cash (direct expenses for 30 days).
Capitalized startup costs are estimated as 1 pct of the fixed capital, which is shown in table A-i.
Operating Costs
The estimated operating costs are based on an average of 250 days of operation per year over the life of the plant. The operating costs are divided into direct, indirect, and fixed costs.
Direct costs include raw materials, utilities, direct labor, plant mainte~
nance, payroll overhead, and operating supplies. The direct labor cost is estimated by assigning employees where needed. It has been assumed that no supervision will be required and that these employees will perform routine maintenance tasks. Thus, the only cost component for plant maintenance is the required materials.
Payroll overhead, estimated as 35 pct of direct labor and maintenance labor, includes vacation, sick leave, social security, and fringe benefits. The cost of operating supplies is estimated as 10 pct of the cost of the plant maintenance.
Indirect costs are estimated as 25 pct of the direct labor and maintenance costs. The indirect costs include the expenses of control laboratories, accounting, plant protection and safety, plant administration, marketing, and
17
company overhead. Research and overall company administrative costs outside the plant are not included.
Fixed costs include the cost of taxes (excluding income taxes), insurance, and depreciation. The costs of both taxes and insurance are each estimated as 1 pct of the plant construction cost. Depreciation is based on a straight-line, 20-yr period.
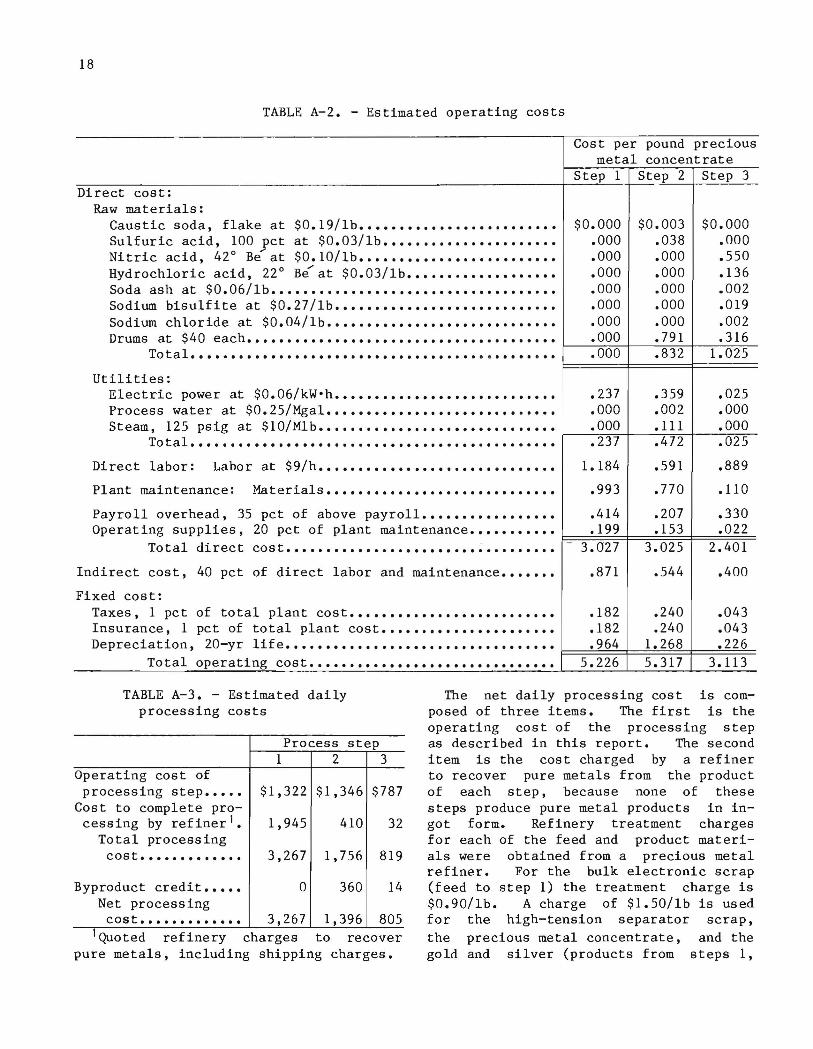
The estimated operating costs for the three steps are shown in table A-2. No credit is included for other product fractions recovered from the bulk scrap in step 1, nor is a credit included for t.he cement copper coproduct recovered in steps 2 and 3. In the precious metals concentration section (step 2), no credit has been included for the byproduct aluminum hydroxide. It is possible that this material could have a value to the cement industry, but this is not presently known. In addition, no waste disposal costs have been included in either step 2 or step 3. Solid residue must be disposed of, and the waste liquids must be either neutralized or recycled. Inclusion of these costs will increase the operating costs for both steps.
ECONOMIC EVALUATION
In this three-step process, each step produces an upgraded product from which precious metals can be recovered. Based on data currently available, the precious metal losses in the proposed process are equivalent to those that a precious metal refiner would have. Each step reduced the volume of material to be treated by a precious metal refiner. The smaller the volume of material, the lower the shipping and processing charges. After each of the processing steps, the product can either be sold to a refinery to recover the precious metals or used as feed material for the next step. Thus, the cost of each processing step must be considered individually and compared to the cost of sending the feed material for that step directly to a refinery. Table A-3 presents the estimated daily processing cost of each of the three steps.
18
TABLE A-2. - Estimated operating costs
Direct cost: Raw materials:
Caustic soda, flake at $0.19/lb ••••••••••••••••••••••••• Sulfuric acid, 100 pct at $0.03/lb •••••••••••••••••••••• Nitric acid, 42° Be at $0.10/lb ••••••••••••••••••••••••• Hydrochloric acid, 22° Be at $0.03/lb ••••••••••••••••••• Soda ash at $0.06/lb •••••••••••••••••••••••••••••••••••• Sodium bisulfite at $0.27/lb •••••••••••••••••••••••••••• Sodium chloride at $0. 04/lb ••••••••••••••••••••••••••••• Drums at $40 each ...•........•••.........•••............
Total ................•..............•....• • .•......
Utilities: Electric power at $0.06/kW·h •••••••••••••••••••••••••••• Process water at $0.25/Mgal ••••••••••••••••••••••••••••• Steam, 125 psig at $10/Mlb ••••••••••••••••••••••••••••••
Total ..................................••.•........
Direct labor: Labor at $9/h ••••••••••••••••••••••••••••••
Plant maintenance: Materials •••••••••••••••••••••••••••••
Payroll overhead, 35 pct of above payroll ••••••••••••••••• Operating supplies, 20 pct of plant maintenance •••••••••••
Total direct cost ••••••••••••••••••••••••••••••••••
Indirect cost, 40 pct of direct labor and maintenance •••••••
Fixed cost: Taxes, 1 pct of total plant cost •••••••••••••••••••••••••• Insurance, 1 pct of total plant cost •••••••••••••••••••••• Depreciation, 20-yr life ................................. .
Total operating cost •••••••••••••••••••••••••••••••
Cost per pound precious metal concentrate
Step 1 Step 2 Step 3
$0.000 $0.003 $0.000 .000 .038 .000 .000 .000 .550 .000 .000 .136 .000 .000 .002 .000 .000 .019 .000 .000 .002 .000 .791 .316 .000 .832 1.025
.237 .359 .025
.000 .002 .000
.000 .111 .000
.237 .472 .025
1.184 .591 .889
.993 .770 .110
.414 .207 .330
.199 .153 .022 3.027 3.025 2.401
.871 .544 .400
.182 .240 .043
.182 .240 .043
.964 1.268 .226 5.226 5.317 3.113
TABLE A-3. - Estimated daily processing costs
Process step 1 2 3
Operating cost of processing step ••••• $1,322 $1,346 $787
Cost to complete pro-cessing by refiner 1• 1,945 410 32
Total processing cos t •.....•...... 3,267 1,756 819
Byproduct credit ••••• 0 360 14 Net processing
cos t ............• 3,267 1,396 805 1 Quoted refinery charges to recover
pure metals, including shipping charges.
The net daily processing cost is composed of three items. The first is the operating cost of the processing step as described in this report. The second item is the cost charged by a refiner to recover pure metals from the product of each step, because none of these steps produce pure metal products in ingot form. Refinery treatment charges for each of the feed and product materials were obtained from a precious metal refiner. For the bulk electronic scrap (feed to step 1) the treatment charge is $0.90/lb. A charge of $1.50/lb is used for the high-tension separator scrap, the precious metal concentrate, and the gold and silver (products from steps 1,
2, and 3, respectively). In addition, a shipping charge of $241/ton is added to determine the total refinery processing charges (~). This charge is for a 250-mile shipping distance. The third item is a credit for byproducts recovered in steps 2 and 3. (Cement copper and unreacted metallic scrap from copper cementation, both containing significant quantities of precious metals, are recovered in step 2. Cement copper is recovered in step 3.) The copper coproduct is valued at $0.30/lb, gold is valued at $350/tr oz, and silver is valued at $8.50/tr oz. Therefore, the net daily cost of processing for each step is the daily cost of the processing step, plus the additional refinery processing charges, minus the byproduct credit.
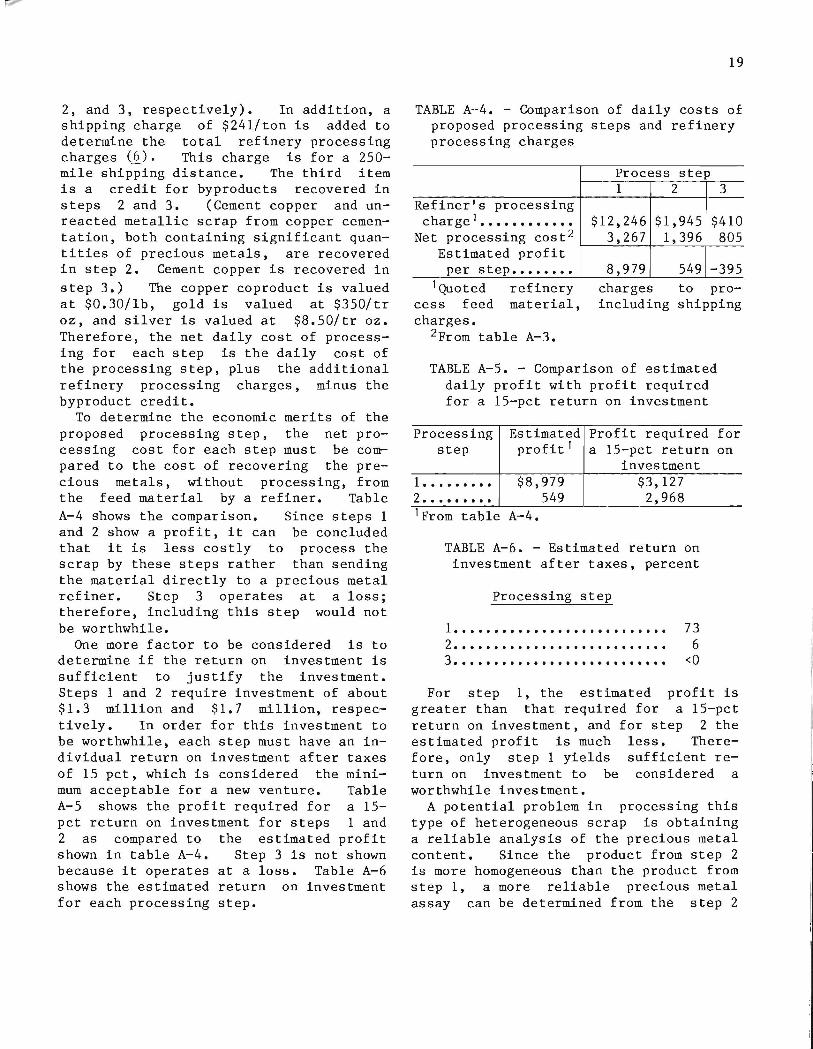
To determine the economic merits of the proposed processing step, the net processing cost for each step must be compared to the cost of recovering the precious metals, without processing, from the feed material by a refiner. Table A-4 shows the comparison. Since steps 1 and 2 show a profit, it can be concluded that it is less costly to process the scrap by these steps rather than sending the material directly to a precious metal refiner. Step 3 operates at a loss; therefore, including this step would not be worthwhile.
One more factor to be considered is to determine if the return on investment is sufficient to justify the investment. Steps 1 and 2 require investment of about $1.3 million and $1.7 million, respectively. In order for this investment to be worthwhile, each step must have an individual return on investment after taxes of 15 pct, which is considered the minimum acceptable for a new venture. Table A-5 shows the profit required for a 15-pct return on investment for steps 1 and 2 as compared to the estimated profit shown in table A-4. Step 3 is not shown because it operates at a loss. Table A-6 shows the estimated return on investment for each processing step.
19
TABLE A--4. - Comparison of daily cos ts of proposed processing steps and refinery processing charges
Process step 1 2 3
Refiner's processing charge 1 •••••••••••• $12,246 $1,945 $410
Net processing cost 2 3,267 1,396 805 Estimated profit
per step •••••••• 8,979 549 -395
1 Quoted refinery cess feed material, charges.
charges to proincluding shipping
2From table A-3.
TABLE A-5. - Comparison of estimated daily profit with profit required for a 15-pct return on investment
Processing Estimated Profit required step profit 1 a 15-pct return
investment 1 ••••••••• $8,979 $3,127 2 ••••••••• 549 2,968 lFrom table A-4.
TABLE A-6. - Estimated return on investment after taxes, percent
Processing step
1. . . . . . . • • . . . . . . . . . • . . . . . . . . 73 2. • • • • • • • • • • • • • • • • • • • • • • • • • • 6 3. • • • • • • • • • • • • • • • • • • • • • • • • • • < 0
for on
For step 1, the estimated profit is greater than that required for a 15-pct return on investment, and for step 2 the estimated profit is much less. Therefore, only step 1 yields sufficient return on investment to be considered a worthwhile investment.
A potential problem in processing this type of heterogeneous scrap is obtaining a reliable analysis of the precious metal content. Since the product from step 2 is more homogeneous than the product from step 1, a more reliable precious metal assay can be determined from the step 2
I
,I I

20
product. If the precious metal assay of the scrap is reliable, constraints (i.e., minimum precious metal recoveries) can be placed on a refiner so that the maximum value is obtained for the precious metals. These constraints generally cannot be imposed if the precious metal content of the scrap is not known. Therefore, performing step 2 may increase the revenue returned from a precious metal refiner. A similar case can be made for performing step 3. Because no data are available to quantify the additional value realized by increasing product homogeneity, it cannot be considered in this study.
TECHNICAL EVALUATION
Modifications to the proposed process have the potential to reduce costs. At present, modifications to the second step of the proposed process are the only ones that should be considered. Costs of the third step cannot be considered until the second step is shown to be viable.
There are two high-cost operations in the second step of the proposed process: aluminum hydroxide precipitation and H2S04 regeneration.
The aging time of 10 to 12 weeks for the aluminum hydroxide precipitation requires a large number of tanks for storing the solution, and these are a significant portion of the capital cost. In normal Bayer process operation, this same type of precipitation takes 36 to 48 h using recycled seed slurry. If the precipitation time for the proposed process
;;-U.S. GPO: 1985-505-019/20,031
can be reduced to the length of time used in the Bayer process, the cost of the tanks will be reduced significantly. This would reduce the depreciation charges in the operating cost by roughly IS pct, or $0.20/1b of precious metal concentrate.
H2S04 regeneration by the electrolytic procedure described in this report is also a costly item. It accounts for about 17 pct or $0.90 of the total operating cost. The electrolytic cell is a highcapital-cost item, and it consumes most of the electrical energy required in this step. Instead of regenerating the H2S04, the solution could be neutralized with lime and discarded, and fresh acid could be used for each batch. Neutralizing and disposing of the H2S04 would cost about $O.SO/lb of precious metal concentrate, which would be less expensive than electrolytic regeneration by about $0.40/1b of precious metal concentrate.
Consequently, if both these modifications are employed, the total cost savings would be about $0.60/1b of precious metal concentrate, or 11 pct of the total operating cost for this step. However, even with this savings, the reduction in the operating cost would not be sufficient to yield a IS-pct return on investment after taxes. Any other process modifications that could be considered represent minor savings compared to the two detailed above. Thus, even with cost-saving modifications, the estimated profit on the proposed process will not produce a IS-pct return on investment after taxes.
INT.-BU.OF MINFS,PGH.,PA. 27942