Hydrological Evaluation
22
Hydrological Evaluation Wister Solar Development Project June 8, 2020 Prepared for: ORNI 21, LLC 6140 Plumas Street Reno, NV 89519-6075 Prepared by: Stantec Consulting Services 290 Conejo Ridge Road Thousand Oaks, CA 91362
Transcript of Hydrological Evaluation
Hydrological Evaluation
Wister Solar Development Project
June 8, 2020
Prepared for: ORNI 21, LLC 6140 Plumas Street Reno, NV 89519-6075 Prepared by: Stantec Consulting Services 290 Conejo Ridge Road Thousand Oaks, CA 91362

Revision Description Author Quality Check
A Internal Draft S Smith 5/29/20 K Kohan 5/29/20
0 Client Draft S Smith 6/1/20 K Kohan 6/2/20
1 Final S Smith 6/8/20 K Kohan 6/8/20
HYDROLOGICAL EVALUATION
This document entitled Hydrological Evaluation was prepared by Stantec Consulting Services Inc. (“Stantec”)
for the account of ORNI 21, LLC (the “Client”). Any reliance on this document by any third party is strictly
prohibited. The material in it reflects Stantec’s professional judgment in light of the scope, schedule and other
limitations stated in the document and in the contract between Stantec and the Client. The opinions in the
document are based on conditions and information existing at the time the document was published and do not
take into account any subsequent changes. In preparing the document, Stantec did not verify information
supplied to it by others. Any use which a third party makes of this document is the responsibility of such third
party. Such third party agrees that Stantec shall not be responsible for costs or damages of any kind, if any,
suffered by it or any other third party as a result of decisions made or actions taken based on this document.
Prepared by
(signature)
Stanley Smith
Reviewed & Approved by
(signature)
Kevin Kohan
HYDROLOGICAL EVALUATION
Table of Contents
ABBREVIATIONS ...................................................................................................................... I
1.0 INTRODUCTION ............................................................................................................ 1
2.0 SITE DESCRIPTION ...................................................................................................... 2
2.1 PHYSIOGRAPHY ........................................................................................................... 2
2.2 GEOLOGIC SETTING .................................................................................................... 2
2.3 CLIMATE ........................................................................................................................ 2
2.4 LAND AND WATER USE ............................................................................................... 3
3.0 HYDROLOGICAL SYSTEM ........................................................................................... 5
3.1 PRECIPITATION AND EVAPOTRANSPIRATION .......................................................... 5
3.2 SURFACE WATER SYSTEM ......................................................................................... 5
3.3 GROUNDWATER SYSTEM ........................................................................................... 6 3.3.1 Aquifer Extent and Properties ......................................................................... 6 3.3.2 Well Inventory ................................................................................................ 8 3.3.3 Recharge ....................................................................................................... 8 3.3.4 Discharge and Extraction ............................................................................... 8 3.3.5 Seeps and Springs ......................................................................................... 8 3.3.6 Underflow ....................................................................................................... 9 3.3.7 Groundwater Levels ....................................................................................... 9 3.3.8 Groundwater Quality ...................................................................................... 9 3.3.9 Transmissivity and Well Yield ....................................................................... 10
3.4 WATER RIGHTS AND POINTS OF DIVERSION ..........................................................10
4.0 HYDROLOGIC EVALUATION SUMMARY ...................................................................11
5.0 REFERENCES ............................................................................................................... 0
LIST OF TABLES
Table 1 Estimated Project Water Needs..................................................................................... 1 Table 2 Climate Normals near the Project .................................................................................. 3 Table 3 Land Use Within Two Miles of the Project ..................................................................... 4 Table 4 Lithological Log of 12S/16E-9A (9 Miles Southwest of the Project) ................................ 7
LIST OF FIGURES
Figure 1 Project Location and Overview Figure 2 Groundwater Basins Figure 3 Well and Water Resources Inventory
HYDROLOGICAL EVALUATION
i
Abbreviations
°F Degrees Fahrenheit
AAC All American Canal
AFY Acre-feet per year
amsl Above mean sea level
ANL Argonne National Laboratory
bmsl Below mean sea level
DWR California Department of Water Resources
IIRWMP Imperial Integrated Regional Water Management Plan
LLNL Lawrence Livermore National Laboratory
POD Point of Diversion
Project Wister Solar Development Project
Proposed Well Wister Solar Development Project Proposed Water Distribution Well
Stantec Stantec Consulting Services
TDS Total dissolved solids
HYDROLOGICAL EVALUATION
Introduction
1
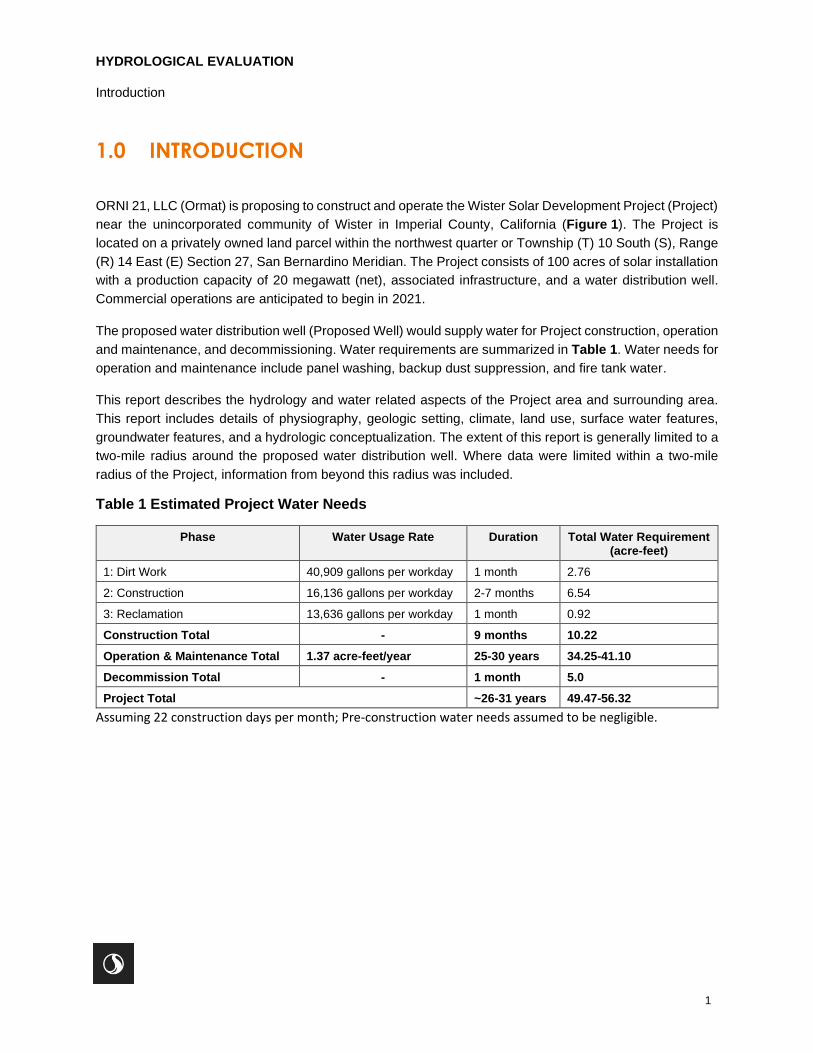
1.0 INTRODUCTION
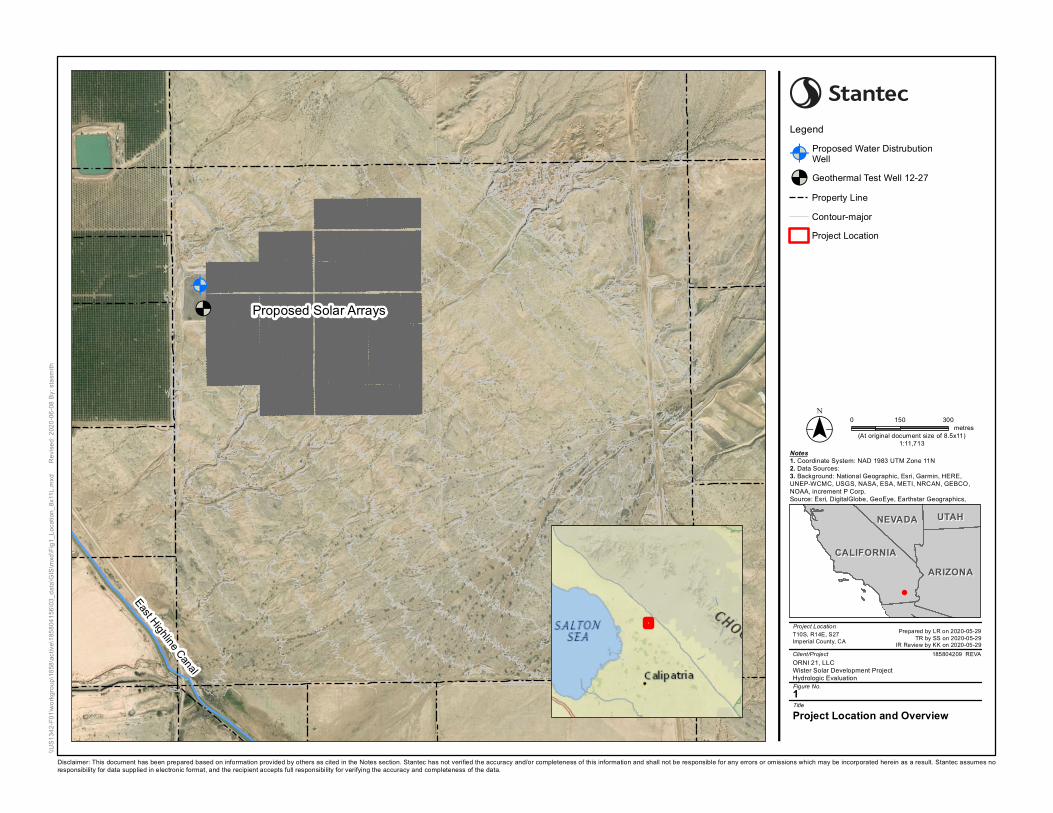
ORNI 21, LLC (Ormat) is proposing to construct and operate the Wister Solar Development Project (Project)
near the unincorporated community of Wister in Imperial County, California (Figure 1). The Project is
located on a privately owned land parcel within the northwest quarter or Township (T) 10 South (S), Range
(R) 14 East (E) Section 27, San Bernardino Meridian. The Project consists of 100 acres of solar installation
with a production capacity of 20 megawatt (net), associated infrastructure, and a water distribution well.
Commercial operations are anticipated to begin in 2021.
The proposed water distribution well (Proposed Well) would supply water for Project construction, operation
and maintenance, and decommissioning. Water requirements are summarized in Table 1. Water needs for
operation and maintenance include panel washing, backup dust suppression, and fire tank water.
This report describes the hydrology and water related aspects of the Project area and surrounding area.
This report includes details of physiography, geologic setting, climate, land use, surface water features,
groundwater features, and a hydrologic conceptualization. The extent of this report is generally limited to a
two-mile radius around the proposed water distribution well. Where data were limited within a two-mile
radius of the Project, information from beyond this radius was included.
Table 1 Estimated Project Water Needs
Phase Water Usage Rate Duration Total Water Requirement (acre-feet)
1: Dirt Work 40,909 gallons per workday 1 month 2.76
2: Construction 16,136 gallons per workday 2-7 months 6.54
3: Reclamation 13,636 gallons per workday 1 month 0.92
Construction Total - 9 months 10.22
Operation & Maintenance Total 1.37 acre-feet/year 25-30 years 34.25-41.10
Decommission Total - 1 month 5.0
Project Total ~26-31 years 49.47-56.32
Assuming 22 construction days per month; Pre-construction water needs assumed to be negligible.

HYDROLOGICAL EVALUATION
Site Description
2
2.0 SITE DESCRIPTION
2.1 PHYSIOGRAPHY
The Project is located in the Basin and Range physiographic province, which includes inland portions of
California, the majority of Nevada, and portions or Arizona, New Mexico, Oregon, Utah, Idaho, and Mexico.
The Basin and Range is divided into several sub basins, which includes the Salton Trough, which contains
the Project. The Salton Trough includes the Imperial Valley in the south and the Coachella Valley in the
north. The Project is near the northeastern margin of the Imperial Valley, approximately 5 miles east of the
Salton Sea, a saline lake located in Imperial Valley. Imperial Valley is bounded by the Coyote and Jacumba
Mountains to the west, the Chocolate and Orocopia Mountains to the northeast, the Sand Hills and Cargo
Muchacho Mountains to the southeast, and the United States of America and Mexico border to the south.
Furthermore, the elevated margins of Imperial Valley are named West Mesa and East Mesa. The elevation
of the Imperial Valley is mostly below sea level and the Project is at approximately 15 feet bmsl. The
Chocolate Mountains, which are the closest mountains to the Project, have a maximum elevation of 2,877
feet amsl.
2.2 GEOLOGIC SETTING
The Salton Trough is a tectonically active pull-apart basin. The extensional tectonics results in crustal
thinning and sinking. Fault systems near the Project include the San Andreas Fault Zone and Imperial Fault
Zone, which are linked by the Brawley Seismic Zone. The trough has filled with sediments due to its
topographically low setting and continued sinking. The overall vertical relief of the trough formation is
estimated to exceed 14,000 feet, which has been caused by faulting, folding, and warping (Loeltz et al.,
1975). The geology and geomorphology of the Imperial Valley was influenced by prehistoric Lake Cahuilla,
including lacustrine sediments and paleo-shorelines. The adjacent Chocolate Mountains include outcrops
Tertiary and older igneous and metamorphic rocks. The piedmont slope of the Chocolate Mountains,
located northeast of the Project, includes poorly sorted alluvial and fluvial deposits with sparse vegetation
(Loeltz et al., 1975).
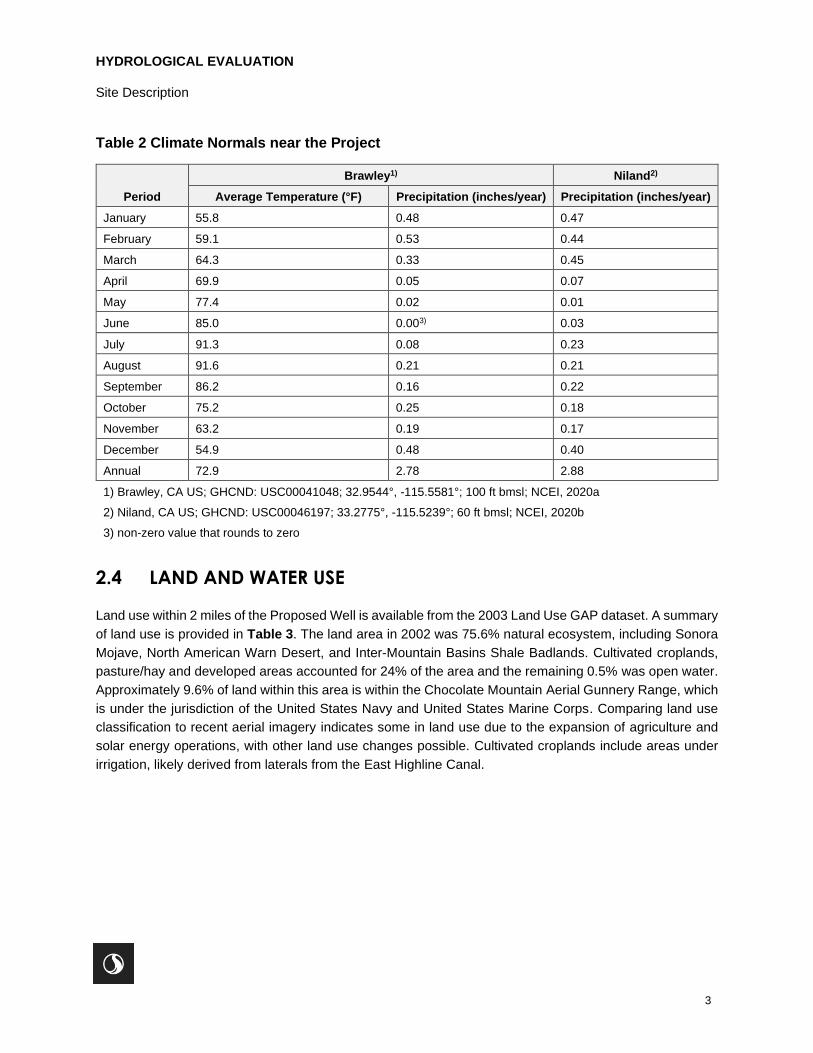
2.3 CLIMATE
The Project area has a hot desert climate. Climate data was available from two nearby weather stations:
Niland (0.9 miles west-northwest of the Project; NCEI 2020a) and Brawley (22 miles south of the Project;
NCEI 2020b). Both sites report climate normals (1981 to 2010) with Niland reporting precipitation and
Brawley reporting precipitation and temperature. Monthly average temperatures are between 54.9 to 91.6°F
with minimum temperatures occurring in December and maximum temperatures occurring in August.
Average annual precipitation at Niland was 2.88 inches and at Brawley was 2.78 inches. The majority of
precipitation occurs from December through March.
Precipitation in the adjacent Chocolate Mountains are estimated at 4–6 inches/year (PRISM, 2020).
HYDROLOGICAL EVALUATION
Site Description
3
Table 2 Climate Normals near the Project
Period
Brawley1) Niland2)
Average Temperature (°F) Precipitation (inches/year) Precipitation (inches/year)
January 55.8 0.48 0.47
February 59.1 0.53 0.44
March 64.3 0.33 0.45
April 69.9 0.05 0.07
May 77.4 0.02 0.01
June 85.0 0.003) 0.03
July 91.3 0.08 0.23
August 91.6 0.21 0.21
September 86.2 0.16 0.22
October 75.2 0.25 0.18
November 63.2 0.19 0.17
December 54.9 0.48 0.40
Annual 72.9 2.78 2.88
1) Brawley, CA US; GHCND: USC00041048; 32.9544°, -115.5581°; 100 ft bmsl; NCEI, 2020a
2) Niland, CA US; GHCND: USC00046197; 33.2775°, -115.5239°; 60 ft bmsl; NCEI, 2020b
3) non-zero value that rounds to zero
2.4 LAND AND WATER USE
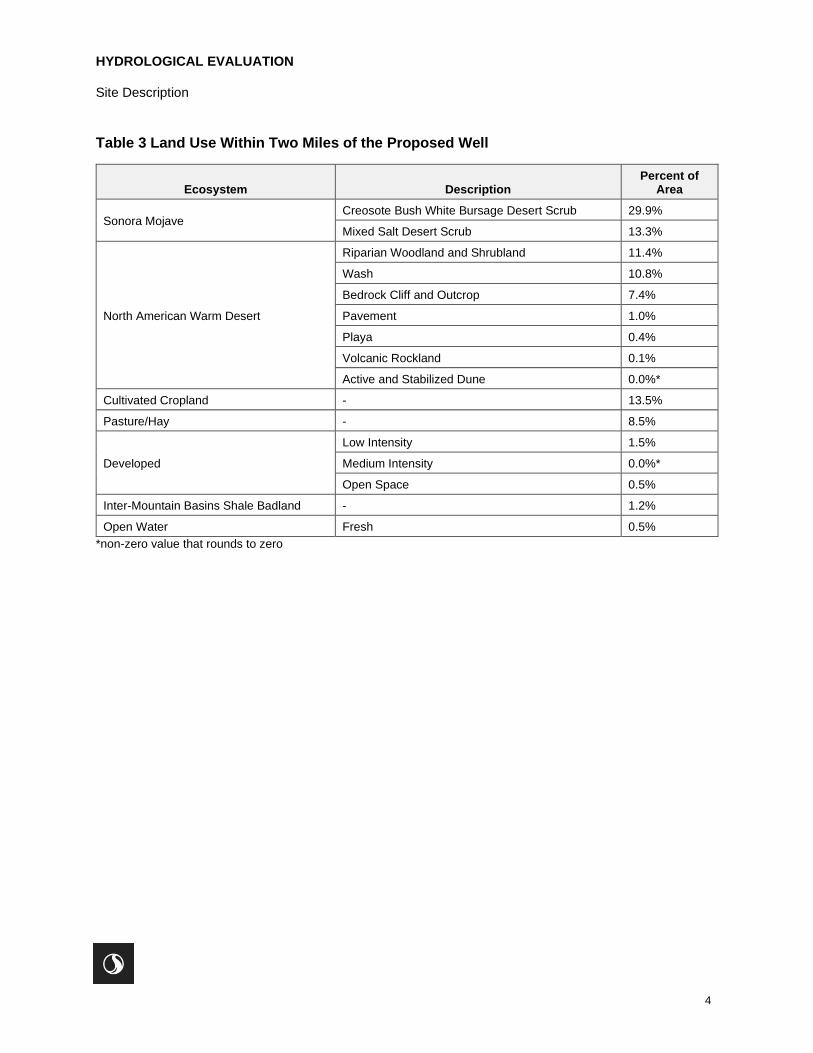
Land use within 2 miles of the Proposed Well is available from the 2003 Land Use GAP dataset. A summary
of land use is provided in Table 3. The land area in 2002 was 75.6% natural ecosystem, including Sonora
Mojave, North American Warn Desert, and Inter-Mountain Basins Shale Badlands. Cultivated croplands,
pasture/hay and developed areas accounted for 24% of the area and the remaining 0.5% was open water.
Approximately 9.6% of land within this area is within the Chocolate Mountain Aerial Gunnery Range, which
is under the jurisdiction of the United States Navy and United States Marine Corps. Comparing land use
classification to recent aerial imagery indicates some in land use due to the expansion of agriculture and
solar energy operations, with other land use changes possible. Cultivated croplands include areas under
irrigation, likely derived from laterals from the East Highline Canal.
HYDROLOGICAL EVALUATION
Site Description
4
Table 3 Land Use Within Two Miles of the Proposed Well
Ecosystem Description Percent of
Area
Sonora Mojave Creosote Bush White Bursage Desert Scrub 29.9%
Mixed Salt Desert Scrub 13.3%
North American Warm Desert
Riparian Woodland and Shrubland 11.4%
Wash 10.8%
Bedrock Cliff and Outcrop 7.4%
Pavement 1.0%
Playa 0.4%
Volcanic Rockland 0.1%
Active and Stabilized Dune 0.0%*
Cultivated Cropland - 13.5%
Pasture/Hay - 8.5%
Developed
Low Intensity 1.5%
Medium Intensity 0.0%*
Open Space 0.5%
Inter-Mountain Basins Shale Badland - 1.2%
Open Water Fresh 0.5%
*non-zero value that rounds to zero
HYDROLOGICAL EVALUATION
Hydrological System
5
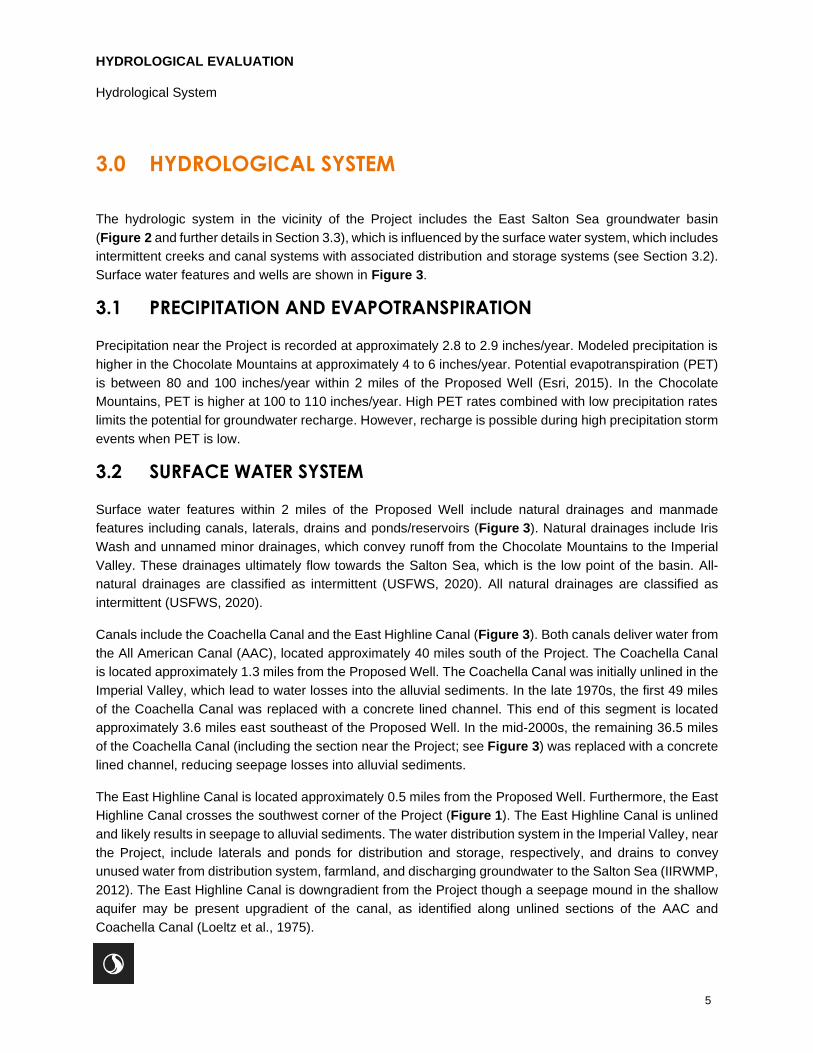
3.0 HYDROLOGICAL SYSTEM
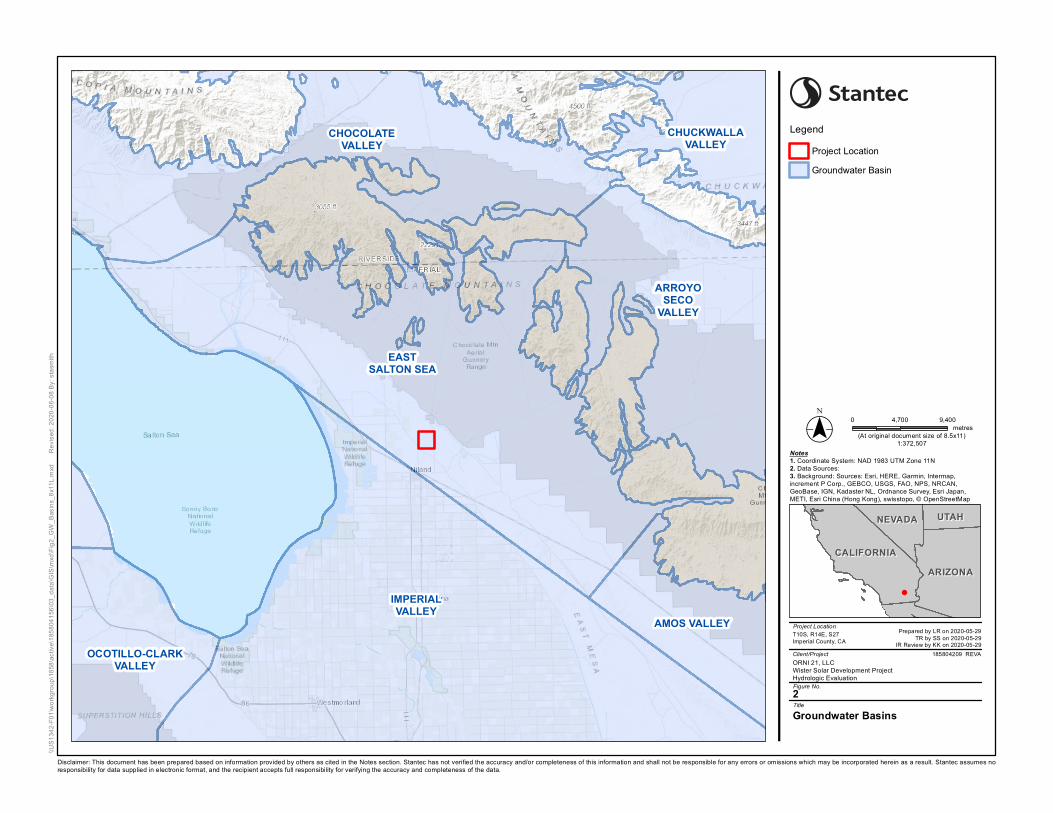
The hydrologic system in the vicinity of the Project includes the East Salton Sea groundwater basin
(Figure 2 and further details in Section 3.3), which is influenced by the surface water system, which includes
intermittent creeks and canal systems with associated distribution and storage systems (see Section 3.2).
Surface water features and wells are shown in Figure 3.
3.1 PRECIPITATION AND EVAPOTRANSPIRATION
Precipitation near the Project is recorded at approximately 2.8 to 2.9 inches/year. Modeled precipitation is
higher in the Chocolate Mountains at approximately 4 to 6 inches/year. Potential evapotranspiration (PET)
is between 80 and 100 inches/year within 2 miles of the Proposed Well (Esri, 2015). In the Chocolate
Mountains, PET is higher at 100 to 110 inches/year. High PET rates combined with low precipitation rates
limits the potential for groundwater recharge. However, recharge is possible during high precipitation storm
events when PET is low.
3.2 SURFACE WATER SYSTEM
Surface water features within 2 miles of the Proposed Well include natural drainages and manmade
features including canals, laterals, drains and ponds/reservoirs (Figure 3). Natural drainages include Iris
Wash and unnamed minor drainages, which convey runoff from the Chocolate Mountains to the Imperial
Valley. These drainages ultimately flow towards the Salton Sea, which is the low point of the basin. All-
natural drainages are classified as intermittent (USFWS, 2020). All natural drainages are classified as
intermittent (USFWS, 2020).
Canals include the Coachella Canal and the East Highline Canal (Figure 3). Both canals deliver water from
the All American Canal (AAC), located approximately 40 miles south of the Project. The Coachella Canal
is located approximately 1.3 miles from the Proposed Well. The Coachella Canal was initially unlined in the
Imperial Valley, which lead to water losses into the alluvial sediments. In the late 1970s, the first 49 miles
of the Coachella Canal was replaced with a concrete lined channel. This end of this segment is located
approximately 3.6 miles east southeast of the Proposed Well. In the mid-2000s, the remaining 36.5 miles
of the Coachella Canal (including the section near the Project; see Figure 3) was replaced with a concrete
lined channel, reducing seepage losses into alluvial sediments.
The East Highline Canal is located approximately 0.5 miles from the Proposed Well. Furthermore, the East
Highline Canal crosses the southwest corner of the Project (Figure 1). The East Highline Canal is unlined
and likely results in seepage to alluvial sediments. The water distribution system in the Imperial Valley, near
the Project, include laterals and ponds for distribution and storage, respectively, and drains to convey
unused water from distribution system, farmland, and discharging groundwater to the Salton Sea (IIRWMP,
2012). The East Highline Canal is downgradient from the Project though a seepage mound in the shallow
aquifer may be present upgradient of the canal, as identified along unlined sections of the AAC and
Coachella Canal (Loeltz et al., 1975).
HYDROLOGICAL EVALUATION
Hydrological System
6
3.3 GROUNDWATER SYSTEM
The Project is located in the East Salton Sea Basin (basin 7-033) (Figure 2). The basin occupies the
northeastern margin of the Imperial Valley, including the East Mesa, and alluvial surficial deposits of the
Chocolate Mountains. The basin covers 279,824 acres. Adjacent basins include Chocolate Valley to the
north, Arroyo Seco Valley to the east, Amos Valley to the southeast, and Imperial Valley to the south. No
groundwater basin is defined in the footprint of the Salton Sea.
3.3.1 Aquifer Extent and Properties
Aquifers in the East Salton Sea Basin include alluvial aquifers, which are present as valley fill with maximum
thicknesses of at least 400 feet (Willets et al., 1954). Water bearing units include unconsolidated Quaternary
alluvium and semi-consolidated Tertiary to Quaternary alluvium. The groundwater storage capacity was
estimated at 360,000 acre-feet (DWR, 1975). High permeability units likely include coarse sands and
gravels, where present. Aquifer extents are bounded by outcropping bedrock in the Chocolate Mountains
and possibly low-permeability fault zones such as the San Andreas Fault Zone, the Banning Mission Fault,
and other unnamed faults.
Specific to East Mesa, aquifers in this area are generally unconfined, homogenous, and composed of
sediments deposited by the Colorado River (IIWMP, 2012).
A geothermal test well was previously drilled at the Project by Ormat (well 12-27) to a depth of
3401 feet bgs. The shallow groundwater system was not specifically characterized during drilling and
testing. However, static temperature logs from the well may indicate the presence of an aquifer zone as
shallow as 40 to 50 feet bgs. Other aquifer zones are likely present but were not identified due to the
limitations of temperature logs. Geothermal properties of the test well were non-economical, and the well
was abandoned.
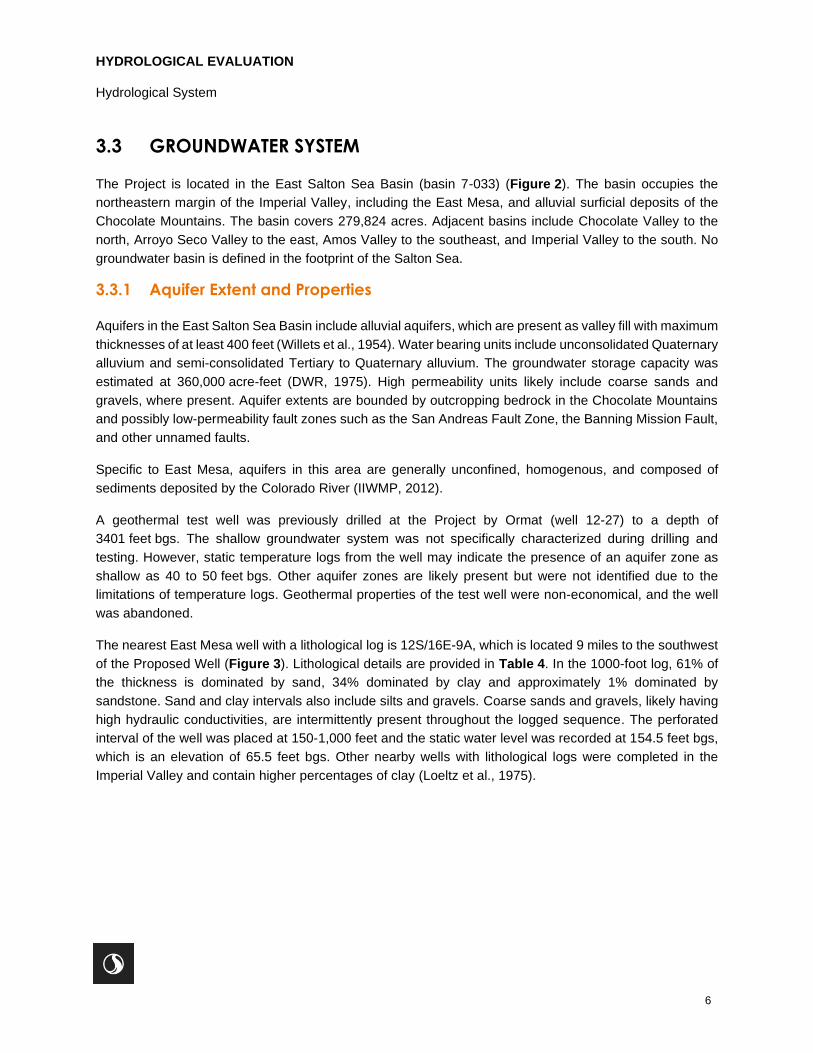
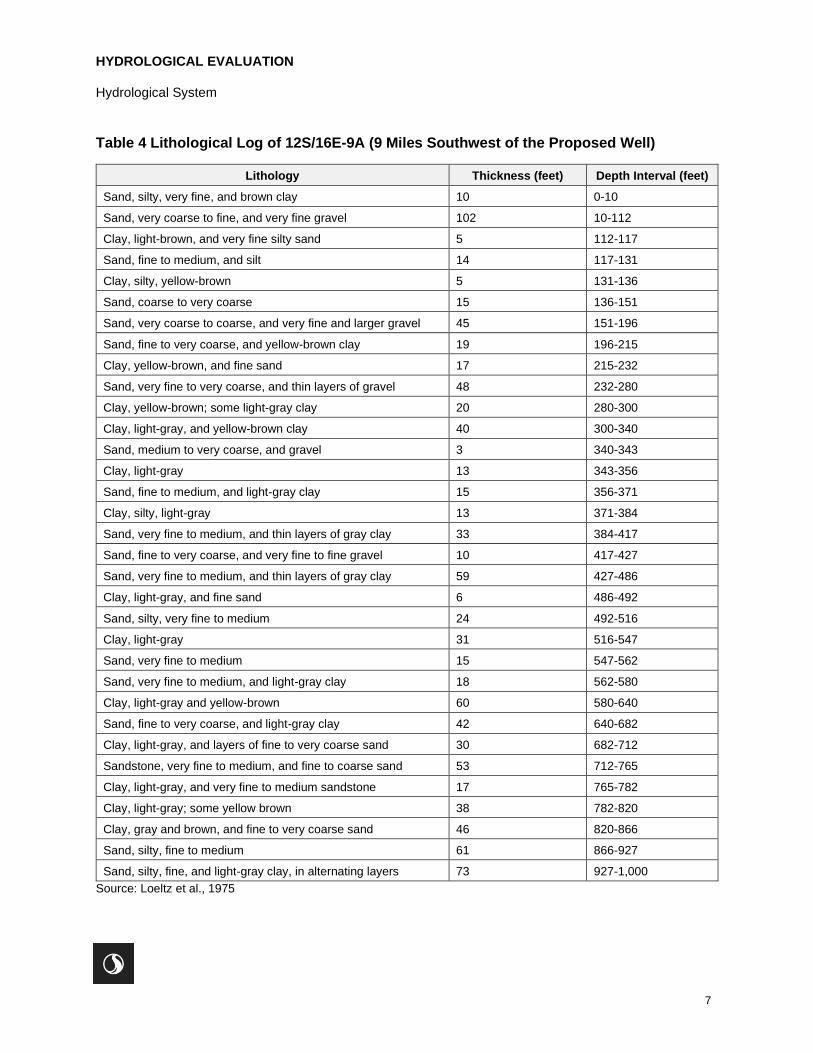
The nearest East Mesa well with a lithological log is 12S/16E-9A, which is located 9 miles to the southwest
of the Proposed Well (Figure 3). Lithological details are provided in Table 4. In the 1000-foot log, 61% of
the thickness is dominated by sand, 34% dominated by clay and approximately 1% dominated by
sandstone. Sand and clay intervals also include silts and gravels. Coarse sands and gravels, likely having
high hydraulic conductivities, are intermittently present throughout the logged sequence. The perforated
interval of the well was placed at 150-1,000 feet and the static water level was recorded at 154.5 feet bgs,
which is an elevation of 65.5 feet bgs. Other nearby wells with lithological logs were completed in the
Imperial Valley and contain higher percentages of clay (Loeltz et al., 1975).
HYDROLOGICAL EVALUATION
Hydrological System
7
Table 4 Lithological Log of 12S/16E-9A (9 Miles Southwest of the Proposed Well)
Lithology Thickness (feet) Depth Interval (feet)
Sand, silty, very fine, and brown clay 10 0-10
Sand, very coarse to fine, and very fine gravel 102 10-112
Clay, light-brown, and very fine silty sand 5 112-117
Sand, fine to medium, and silt 14 117-131
Clay, silty, yellow-brown 5 131-136
Sand, coarse to very coarse 15 136-151
Sand, very coarse to coarse, and very fine and larger gravel 45 151-196
Sand, fine to very coarse, and yellow-brown clay 19 196-215
Clay, yellow-brown, and fine sand 17 215-232
Sand, very fine to very coarse, and thin layers of gravel 48 232-280
Clay, yellow-brown; some light-gray clay 20 280-300
Clay, light-gray, and yellow-brown clay 40 300-340
Sand, medium to very coarse, and gravel 3 340-343
Clay, light-gray 13 343-356
Sand, fine to medium, and light-gray clay 15 356-371
Clay, silty, light-gray 13 371-384
Sand, very fine to medium, and thin layers of gray clay 33 384-417
Sand, fine to very coarse, and very fine to fine gravel 10 417-427
Sand, very fine to medium, and thin layers of gray clay 59 427-486
Clay, light-gray, and fine sand 6 486-492
Sand, silty, very fine to medium 24 492-516
Clay, light-gray 31 516-547
Sand, very fine to medium 15 547-562
Sand, very fine to medium, and light-gray clay 18 562-580
Clay, light-gray and yellow-brown 60 580-640
Sand, fine to very coarse, and light-gray clay 42 640-682
Clay, light-gray, and layers of fine to very coarse sand 30 682-712
Sandstone, very fine to medium, and fine to coarse sand 53 712-765
Clay, light-gray, and very fine to medium sandstone 17 765-782
Clay, light-gray; some yellow brown 38 782-820
Clay, gray and brown, and fine to very coarse sand 46 820-866
Sand, silty, fine to medium 61 866-927
Sand, silty, fine, and light-gray clay, in alternating layers 73 927-1,000
Source: Loeltz et al., 1975
HYDROLOGICAL EVALUATION
Hydrological System
8
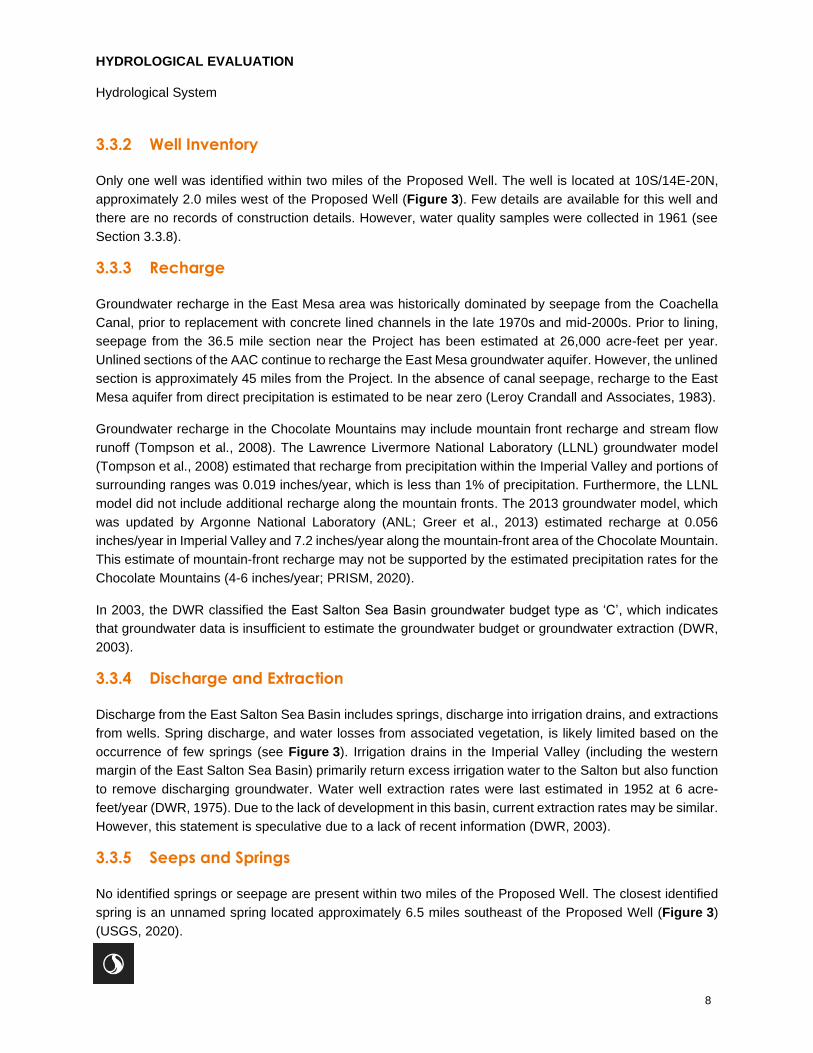
3.3.2 Well Inventory
Only one well was identified within two miles of the Proposed Well. The well is located at 10S/14E-20N,
approximately 2.0 miles west of the Proposed Well (Figure 3). Few details are available for this well and
there are no records of construction details. However, water quality samples were collected in 1961 (see
Section 3.3.8).
3.3.3 Recharge
Groundwater recharge in the East Mesa area was historically dominated by seepage from the Coachella
Canal, prior to replacement with concrete lined channels in the late 1970s and mid-2000s. Prior to lining,
seepage from the 36.5 mile section near the Project has been estimated at 26,000 acre-feet per year.
Unlined sections of the AAC continue to recharge the East Mesa groundwater aquifer. However, the unlined
section is approximately 45 miles from the Project. In the absence of canal seepage, recharge to the East
Mesa aquifer from direct precipitation is estimated to be near zero (Leroy Crandall and Associates, 1983).
Groundwater recharge in the Chocolate Mountains may include mountain front recharge and stream flow
runoff (Tompson et al., 2008). The Lawrence Livermore National Laboratory (LLNL) groundwater model
(Tompson et al., 2008) estimated that recharge from precipitation within the Imperial Valley and portions of
surrounding ranges was 0.019 inches/year, which is less than 1% of precipitation. Furthermore, the LLNL
model did not include additional recharge along the mountain fronts. The 2013 groundwater model, which
was updated by Argonne National Laboratory (ANL; Greer et al., 2013) estimated recharge at 0.056
inches/year in Imperial Valley and 7.2 inches/year along the mountain-front area of the Chocolate Mountain.
This estimate of mountain-front recharge may not be supported by the estimated precipitation rates for the
Chocolate Mountains (4-6 inches/year; PRISM, 2020).
In 2003, the DWR classified the East Salton Sea Basin groundwater budget type as ‘C’, which indicates
that groundwater data is insufficient to estimate the groundwater budget or groundwater extraction (DWR,
2003).
3.3.4 Discharge and Extraction
Discharge from the East Salton Sea Basin includes springs, discharge into irrigation drains, and extractions
from wells. Spring discharge, and water losses from associated vegetation, is likely limited based on the
occurrence of few springs (see Figure 3). Irrigation drains in the Imperial Valley (including the western
margin of the East Salton Sea Basin) primarily return excess irrigation water to the Salton but also function
to remove discharging groundwater. Water well extraction rates were last estimated in 1952 at 6 acre-
feet/year (DWR, 1975). Due to the lack of development in this basin, current extraction rates may be similar.
However, this statement is speculative due to a lack of recent information (DWR, 2003).
3.3.5 Seeps and Springs
No identified springs or seepage are present within two miles of the Proposed Well. The closest identified
spring is an unnamed spring located approximately 6.5 miles southeast of the Proposed Well (Figure 3)
(USGS, 2020).
HYDROLOGICAL EVALUATION
Hydrological System
9
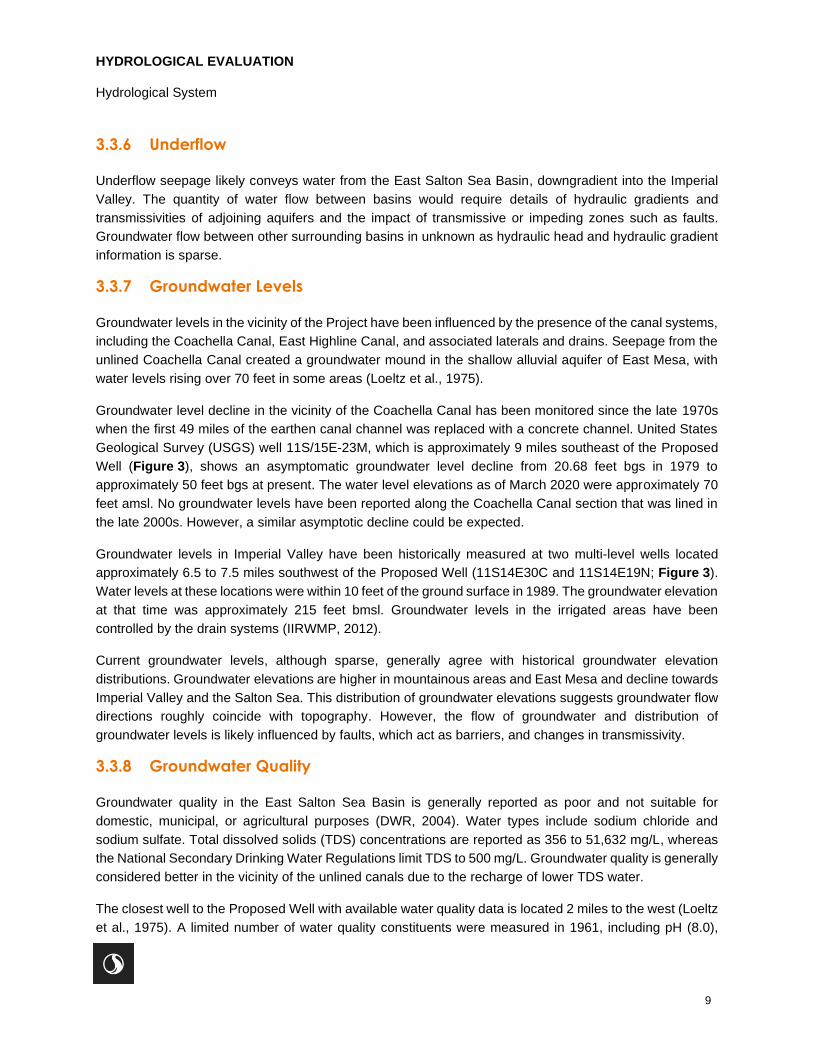
3.3.6 Underflow
Underflow seepage likely conveys water from the East Salton Sea Basin, downgradient into the Imperial
Valley. The quantity of water flow between basins would require details of hydraulic gradients and
transmissivities of adjoining aquifers and the impact of transmissive or impeding zones such as faults.
Groundwater flow between other surrounding basins in unknown as hydraulic head and hydraulic gradient
information is sparse.
3.3.7 Groundwater Levels
Groundwater levels in the vicinity of the Project have been influenced by the presence of the canal systems,
including the Coachella Canal, East Highline Canal, and associated laterals and drains. Seepage from the
unlined Coachella Canal created a groundwater mound in the shallow alluvial aquifer of East Mesa, with
water levels rising over 70 feet in some areas (Loeltz et al., 1975).
Groundwater level decline in the vicinity of the Coachella Canal has been monitored since the late 1970s
when the first 49 miles of the earthen canal channel was replaced with a concrete channel. United States
Geological Survey (USGS) well 11S/15E-23M, which is approximately 9 miles southeast of the Proposed
Well (Figure 3), shows an asymptomatic groundwater level decline from 20.68 feet bgs in 1979 to
approximately 50 feet bgs at present. The water level elevations as of March 2020 were approximately 70
feet amsl. No groundwater levels have been reported along the Coachella Canal section that was lined in
the late 2000s. However, a similar asymptotic decline could be expected.
Groundwater levels in Imperial Valley have been historically measured at two multi-level wells located
approximately 6.5 to 7.5 miles southwest of the Proposed Well (11S14E30C and 11S14E19N; Figure 3).
Water levels at these locations were within 10 feet of the ground surface in 1989. The groundwater elevation
at that time was approximately 215 feet bmsl. Groundwater levels in the irrigated areas have been
controlled by the drain systems (IIRWMP, 2012).
Current groundwater levels, although sparse, generally agree with historical groundwater elevation
distributions. Groundwater elevations are higher in mountainous areas and East Mesa and decline towards
Imperial Valley and the Salton Sea. This distribution of groundwater elevations suggests groundwater flow
directions roughly coincide with topography. However, the flow of groundwater and distribution of
groundwater levels is likely influenced by faults, which act as barriers, and changes in transmissivity.
3.3.8 Groundwater Quality
Groundwater quality in the East Salton Sea Basin is generally reported as poor and not suitable for
domestic, municipal, or agricultural purposes (DWR, 2004). Water types include sodium chloride and
sodium sulfate. Total dissolved solids (TDS) concentrations are reported as 356 to 51,632 mg/L, whereas
the National Secondary Drinking Water Regulations limit TDS to 500 mg/L. Groundwater quality is generally
considered better in the vicinity of the unlined canals due to the recharge of lower TDS water.
The closest well to the Proposed Well with available water quality data is located 2 miles to the west (Loeltz
et al., 1975). A limited number of water quality constituents were measured in 1961, including pH (8.0),
HYDROLOGICAL EVALUATION
Hydrological System
10
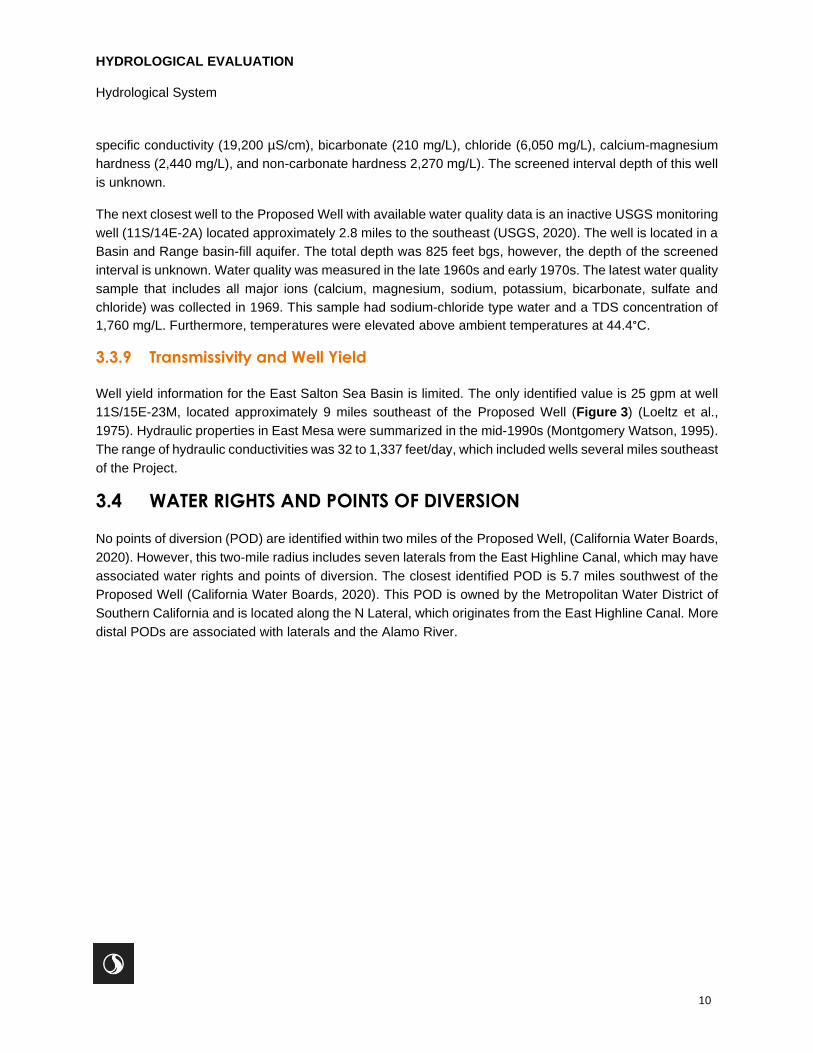
specific conductivity (19,200 µS/cm), bicarbonate (210 mg/L), chloride (6,050 mg/L), calcium-magnesium
hardness (2,440 mg/L), and non-carbonate hardness 2,270 mg/L). The screened interval depth of this well
is unknown.
The next closest well to the Proposed Well with available water quality data is an inactive USGS monitoring
well (11S/14E-2A) located approximately 2.8 miles to the southeast (USGS, 2020). The well is located in a
Basin and Range basin-fill aquifer. The total depth was 825 feet bgs, however, the depth of the screened
interval is unknown. Water quality was measured in the late 1960s and early 1970s. The latest water quality
sample that includes all major ions (calcium, magnesium, sodium, potassium, bicarbonate, sulfate and
chloride) was collected in 1969. This sample had sodium-chloride type water and a TDS concentration of
1,760 mg/L. Furthermore, temperatures were elevated above ambient temperatures at 44.4°C.
3.3.9 Transmissivity and Well Yield
Well yield information for the East Salton Sea Basin is limited. The only identified value is 25 gpm at well
11S/15E-23M, located approximately 9 miles southeast of the Proposed Well (Figure 3) (Loeltz et al.,
1975). Hydraulic properties in East Mesa were summarized in the mid-1990s (Montgomery Watson, 1995).
The range of hydraulic conductivities was 32 to 1,337 feet/day, which included wells several miles southeast
of the Project.
3.4 WATER RIGHTS AND POINTS OF DIVERSION
No points of diversion (POD) are identified within two miles of the Proposed Well, (California Water Boards,
2020). However, this two-mile radius includes seven laterals from the East Highline Canal, which may have
associated water rights and points of diversion. The closest identified POD is 5.7 miles southwest of the
Proposed Well (California Water Boards, 2020). This POD is owned by the Metropolitan Water District of
Southern California and is located along the N Lateral, which originates from the East Highline Canal. More
distal PODs are associated with laterals and the Alamo River.
HYDROLOGICAL EVALUATION
Hydrologic Evaluation Summary
11
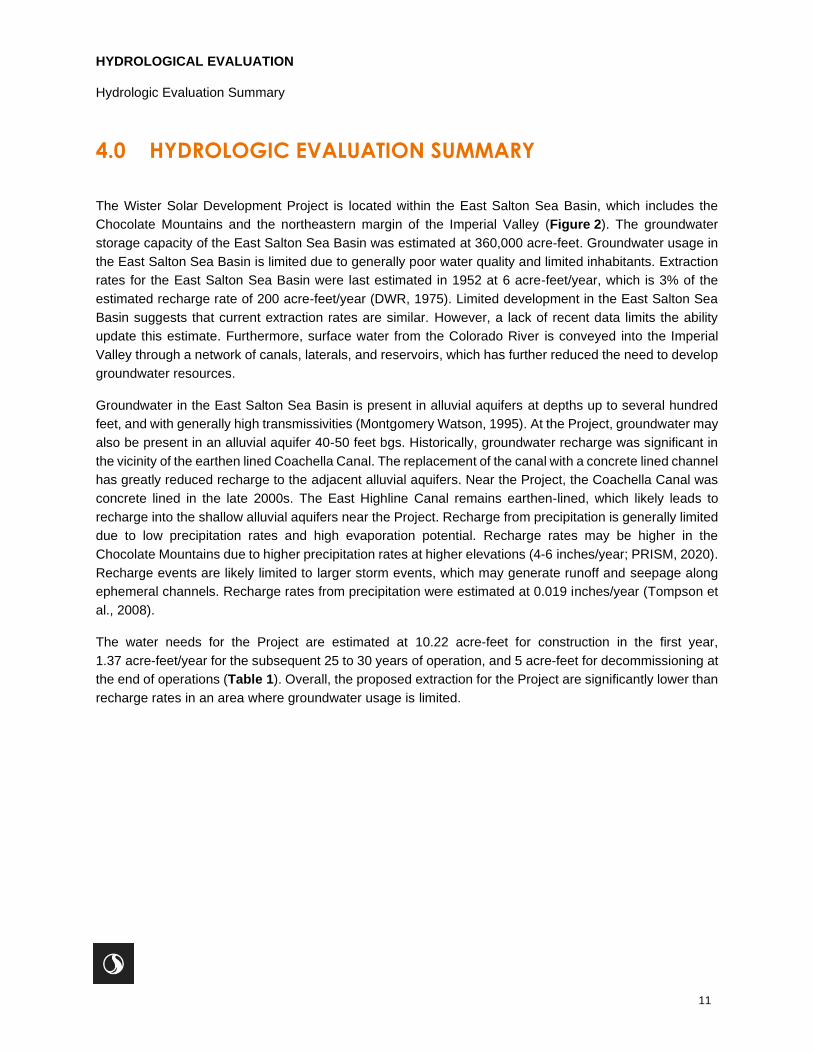
4.0 HYDROLOGIC EVALUATION SUMMARY
The Wister Solar Development Project is located within the East Salton Sea Basin, which includes the
Chocolate Mountains and the northeastern margin of the Imperial Valley (Figure 2). The groundwater
storage capacity of the East Salton Sea Basin was estimated at 360,000 acre-feet. Groundwater usage in
the East Salton Sea Basin is limited due to generally poor water quality and limited inhabitants. Extraction
rates for the East Salton Sea Basin were last estimated in 1952 at 6 acre-feet/year, which is 3% of the
estimated recharge rate of 200 acre-feet/year (DWR, 1975). Limited development in the East Salton Sea
Basin suggests that current extraction rates are similar. However, a lack of recent data limits the ability
update this estimate. Furthermore, surface water from the Colorado River is conveyed into the Imperial
Valley through a network of canals, laterals, and reservoirs, which has further reduced the need to develop
groundwater resources.
Groundwater in the East Salton Sea Basin is present in alluvial aquifers at depths up to several hundred
feet, and with generally high transmissivities (Montgomery Watson, 1995). At the Project, groundwater may
also be present in an alluvial aquifer 40-50 feet bgs. Historically, groundwater recharge was significant in
the vicinity of the earthen lined Coachella Canal. The replacement of the canal with a concrete lined channel
has greatly reduced recharge to the adjacent alluvial aquifers. Near the Project, the Coachella Canal was
concrete lined in the late 2000s. The East Highline Canal remains earthen-lined, which likely leads to
recharge into the shallow alluvial aquifers near the Project. Recharge from precipitation is generally limited
due to low precipitation rates and high evaporation potential. Recharge rates may be higher in the
Chocolate Mountains due to higher precipitation rates at higher elevations (4-6 inches/year; PRISM, 2020).
Recharge events are likely limited to larger storm events, which may generate runoff and seepage along
ephemeral channels. Recharge rates from precipitation were estimated at 0.019 inches/year (Tompson et
al., 2008).
The water needs for the Project are estimated at 10.22 acre-feet for construction in the first year,
1.37 acre-feet/year for the subsequent 25 to 30 years of operation, and 5 acre-feet for decommissioning at
the end of operations (Table 1). Overall, the proposed extraction for the Project are significantly lower than
recharge rates in an area where groundwater usage is limited.
HYDROLOGICAL EVALUATION
References
0
5.0 REFERENCES
California Water Boards. 2020. eWRIMS – Electronic Water Rights Information Management System –
GIS. Accessed 26 May 2020.
Department of Water Resources (DWR). 1975. Bulletin 118 California’s Ground Water. September 1975.
135 p.
Department of Water Resources (DWR). 2003. Bulletin 118 California’s Groundwater Update 2003. October
1975. 246 p.
Department of Water Resources (DWR). 2004. Bulletin 118 California’s Groundwater. February 27, 2004.
Department of Water Resources (DWR). 2020a. Well Completion Report Map Application. Accessed 26
May 2020.
Department of Water Resources (DWR). 2020b. Water Data Library. Accessed 26 May 2020.
Esri. 2015. Average annual potential evapotranspiration in mm/year. University of Montana Numerical
Terradynamic Simulation Group. https://landscape6.arcgis.com/arcgis/. Accessed 26 May 2020.
Greer, C.B., J.J. Quinn, B.L. O’Conner, and A.F.B. Tompson. 2013. A Groundwater Model to Assess Water
Resource Impacts at the Imperial East Solar Energy Zone. December 2013.
Imperial Integrated Regional Water Management Plan (IIRWMP). 2012. October 2012.
Leroy Crandall and Associates. 1983. Phase 1 Hydrogeologic Investigation Feasibility of Recovering
Ground Water in the East Mesa Area, Imperial County, CA. Prepared for Six Agency Committee,
November 30, 1983.
Loeltz, O.J., B. Irelan, J.H. Robison, and F.H. Olmsted. 1975. Geohydrologic Reconnaissance of the
Imperial Valley, California. Water Resources of Lower Colorado River-Salton Sea Area. Geological
Survey Professional Paper 486-K.
Montgomery Watson. 1995. Imperial County Groundwater Study, Final Report. December 1995.
National Center for Environmental Information (NCEI). 2020a. Monthly Normals (1981-2010) for Niland, CA
(USC00046197) weather station. Accessed 20 May 2020.
National Center for Environmental Information (NCEI). 2020b. Monthly Normals (1981-2010) for Brawley,
CA (USC00041048) weather station. Accessed 20 May 2020.
PRISM Climate Group. 2020. Oregon State University http://prism.oregonstate.edu. Accessed 20 May
2020.
HYDROLOGICAL EVALUATION
References
1
Tompson, A., Z. Demir, J. Moran, D. Mason, J. Wagoner, S. Kollet, K. Mansoor, and P. McKereghan. 2008.
Groundwater Availability Within the Salton Sea Basin, Final Report, LLNL-TR-400426. Lawrence
Livermore National Laboratory. January 29, 2008.
United States Fish and Wildlife Service (USFWS). 2020. National Wetlands Inventory, Wetlands Mapper.
Accessed 19 May 2020.
United States Geological Survey (USGS). 2020. National Water Information System (NWIS). Surface
Water, Spring and Groundwater Data for various USGS monitored sites. Accessed 27 May 2020.
Willets, D.B., and others. 1954. Ground Water Occurrence and Quality. Colorado River Basin Region.
Water Quality Investigations Report No. 4.

HYDROLOGICAL EVALUATION
FIGURES
ARIZONAARIZONACALIFORNIACALIFORNIA
NEVADANEVADA UTAHUTAH
@A
&<
East Highline Canal
1
ORNI 21, LLCWister Solar Development ProjectHydrologic Evaluation
Legend
@AProposed Water DistrubutionWell
&< Geothermal Test Well 12-27Property LineContour-majorProject Location
\\US1
342-F
01\w
orkgro
up\18
58\ac
tive\1
8580
4156
\03_d
ata\G
IS\m
xd\Fi
g1_L
ocati
on_8
x11L
.mxd
R
evise
d: 20
20-06
-08 B
y: sta
smith
185804209 REVA
T10S, R14E, S27Imperial County, CA
Prepared by LR on 2020-05-29TR by SS on 2020-05-29
IR Review by KK on 2020-05-29
Project Location and Overview
Disclaimer: This document has been prepared based on information provided by others as cited in the Notes section. Stantec has not verified the accuracy and/or completeness of this information and shall not be responsible for any errors or omissions which may be incorporated herein as a result. Stantec assumes noresponsibility for data supplied in electronic format, and the recipient accepts full responsibility for verifying the accuracy and completeness of the data.
Project Location
Client/Project
Figure No.
Title
Notes1. Coordinate System: NAD 1983 UTM Zone 11N2. Data Sources:3. Background: National Geographic, Esri, Garmin, HERE,UNEP-WCMC, USGS, NASA, ESA, METI, NRCAN, GEBCO,NOAA, increment P Corp.Source: Esri, DigitalGlobe, GeoEye, Earthstar Geographics,
(At original document size of 8.5x11)1:11,713($$¯ 0 150 300
metres
Proposed Solar Arrays
ARIZONAARIZONACALIFORNIACALIFORNIA
NEVADANEVADA UTAHUTAH
AMOS VALLEYIMPERIALVALLEY
EASTSALTON SEA
ARROYOSECO
VALLEY
CHOCOLATEVALLEY
CHUCKWALLAVALLEY
OCOTILLO-CLARKVALLEY
2
ORNI 21, LLCWister Solar Development ProjectHydrologic Evaluation
LegendProject LocationGroundwater Basin
\\US1
342-F
01\w
orkgro
up\18
58\ac
tive\1
8580
4156
\03_d
ata\G
IS\m
xd\Fi
g2_G
W_B
asins
_8x1
1L.m
xd
Rev
ised:
2020
-06-08
By:
stasm
ith
185804209 REVA
T10S, R14E, S27Imperial County, CA
Prepared by LR on 2020-05-29TR by SS on 2020-05-29
IR Review by KK on 2020-05-29
Groundwater Basins
Disclaimer: This document has been prepared based on information provided by others as cited in the Notes section. Stantec has not verified the accuracy and/or completeness of this information and shall not be responsible for any errors or omissions which may be incorporated herein as a result. Stantec assumes noresponsibility for data supplied in electronic format, and the recipient accepts full responsibility for verifying the accuracy and completeness of the data.
Project Location
Client/Project
Figure No.
Title
Notes1. Coordinate System: NAD 1983 UTM Zone 11N2. Data Sources:3. Background: Sources: Esri, HERE, Garmin, Intermap,increment P Corp., GEBCO, USGS, FAO, NPS, NRCAN,GeoBase, IGN, Kadaster NL, Ordnance Survey, Esri Japan,METI, Esri China (Hong Kong), swisstopo, © OpenStreetMap
(At original document size of 8.5x11)1:372,507($$¯ 0 4,700 9,400
metres
ARIZONAARIZONACALIFORNIACALIFORNIA
NEVADANEVADA UTAHUTAH
@A
@?
@?@?
@?
@?
@?
@?
@?@?@?
@?
@?
@?@?
@?
@?@?@?@?
@?
@?@?
@?
A
A
A
A
A
AA
A
@?@?
@?@?
@?@?
@?
@?@?
@?@?
@?
@?
@?@?@?@?
@?
@?
@?
@?
@? @?
@?@?
@?
SUMP 306SALTON SUMP 20
11S/13E-33M
11S/13E-33F
12S/13E-4Q
11S/13E-28K
12S/13E-10D
11S/13E-27M
10S/13E-34F
11S/13E-22H
11S/13E-23C 11S/13E-13D
11S/13E-13K
11S/14E-2A
12S/15E-4A
12S/15E-3A
11S/16E-7D11S/16E-7C
11S/16E-5F
11S/13E-33R
12S/13E-10D
10S/16E-5D(1242)
11S/15E-23M(70)
10S/14E-20N
11S/13E-22H(-227)
9S/12E-2A1
S11S15E05
11S14E19N003S(-213)
12S/14E-21J
11S14E30C004S (-215)
12S/15E-23M
12S/15E-27R(-60)
12S/16E-9A(75)
Coachella Canal
Iris Wash
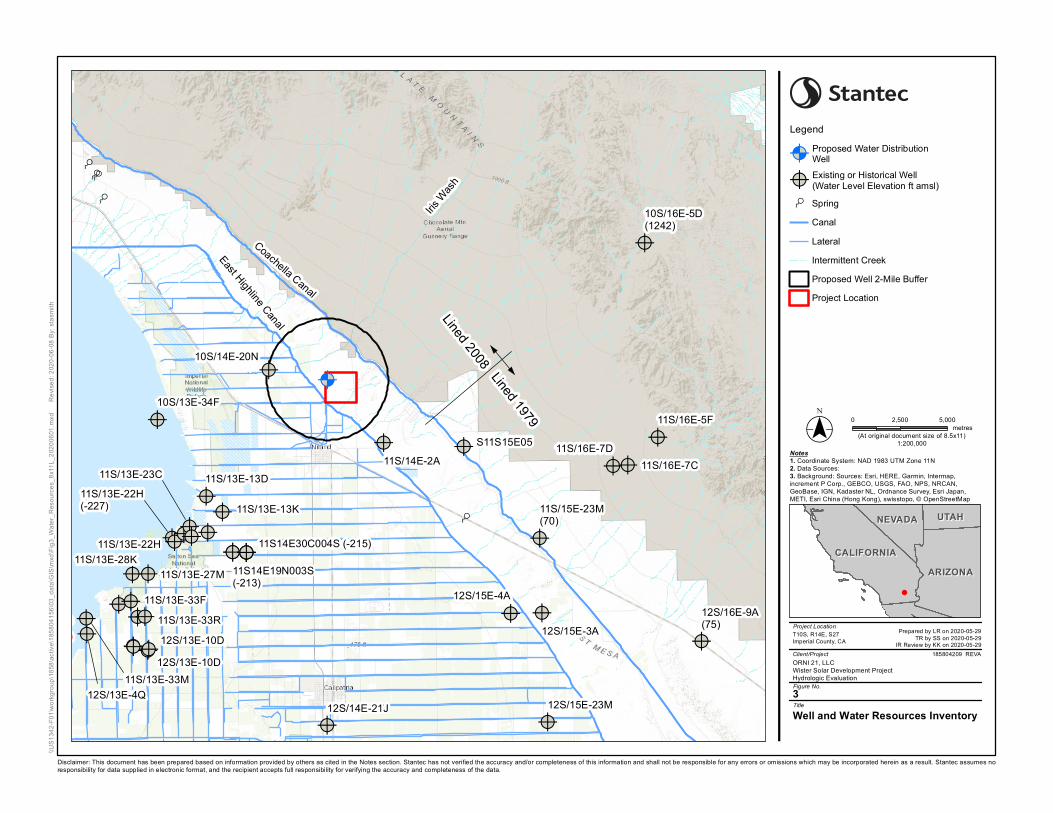
3
ORNI 21, LLCWister Solar Development ProjectHydrologic Evaluation
Legend
@AProposed Water DistributionWell
@?Existing or Historical Well(Water Level Elevation ft amsl)A
SpringCanalLateralIntermittent CreekProposed Well 2-Mile BufferProject Location
\\US1
342-F
01\w
orkgro
up\18
58\ac
tive\1
8580
4156
\03_d
ata\G
IS\m
xd\Fi
g3_W
ater_R
esou
rces_
8x11
L_20
2006
01.m
xd
Rev
ised:
2020
-06-08
By:
stasm
ith
185804209 REVA
T10S, R14E, S27Imperial County, CA
Prepared by LR on 2020-05-29TR by SS on 2020-05-29
IR Review by KK on 2020-05-29
Well and Water Resources Inventory
Disclaimer: This document has been prepared based on information provided by others as cited in the Notes section. Stantec has not verified the accuracy and/or completeness of this information and shall not be responsible for any errors or omissions which may be incorporated herein as a result. Stantec assumes noresponsibility for data supplied in electronic format, and the recipient accepts full responsibility for verifying the accuracy and completeness of the data.
Project Location
Client/Project
Figure No.
Title
Notes1. Coordinate System: NAD 1983 UTM Zone 11N2. Data Sources:3. Background: Sources: Esri, HERE, Garmin, Intermap,increment P Corp., GEBCO, USGS, FAO, NPS, NRCAN,GeoBase, IGN, Kadaster NL, Ordnance Survey, Esri Japan,METI, Esri China (Hong Kong), swisstopo, © OpenStreetMap
(At original document size of 8.5x11)1:200,000($$¯ 0 2,500 5,000
metres
Lined 1979
Lined 2008
East Highline Canal