Hydrologic Analysis - NC
56
BC-Unit 5-6-0008 Hydrologic Analysis Buck Steam Station Rowan County, North Carolina Prepared for : Duke Energy Corporation ECllJ / PO Box 1006 Charlotte, North Carolina 28201-1006 Prepared by: ESP Associates, P .A. 5121 Kingdom Way, Suite 208, Raleigh, North Carolina 27607 April 20, 2012
Transcript of Hydrologic Analysis - NC
BC-Unit 5-6-0008
Hydrologic Analysis Buck Steam Station
Rowan County, North Carolina
Prepared for:
Duke Energy Corporation ECllJ / PO Box 1006
Charlotte, North Carolina 28201-1006
Prepared by:
ESP Associates, P .A. 5121 Kingdom Way, Suite 208, Raleigh, North Carolina 27607
April 20, 2012

BC-Unit 5-6-0008
5121 Kingdom Way • Suite 208 • Raleigh, NC 27607
919.678.1070 • fax 919.677.1252
www.espassociates.com
April 20, 2012
Alex Papp Duke Energy EC11J / PO Box 1006 Charlotte, NC 28201-1006 RE: Buck Stream Station Hydrologic Analysis Dear Mr. Papp: Under Purchase Order 380209 with Duke Energy Corporation, ESP Associates, P.A. was contracted to conduct a hydrologic analysis to analyze the existing wet-ash pond system at the Buck steam station and their response during the specified spillway design flood (SDF). As high hazard dams, the SDF analyzed was the ¾ Probable Maximum Flood. The study area is located in Rowan County close to Salisbury, NC adjacent to the Yadkin River just downstream of Interstate 85 and upstream of the headwaters of High Rock Lake. The results of the hydrologic analysis show that the SDF can be passed through the pond system without overtopping any of the embankments. A summary of the approach used for the analysis and results along with supporting data can be found in the attached report. If you have any questions or need additional information, please do not hesitate to call me at 919-678-1070. Sincerely, ESP Associates, P.A.
Matthew Dudley, P.E., CFM Project Manager

BC-Unit 5-6-0008
Table of Contents Introduction .................................................................................................................................................. 4
Review of Available Data .............................................................................................................................. 5
Field Reconnaissance .................................................................................................................................... 6
Topographic Data .......................................................................................................................................... 6
Hydrologic Parameter Calculation ................................................................................................................ 7
Drainage Area ....................................................................................................................................... 7
Curve Number ....................................................................................................................................... 8
Time of Concentration ........................................................................................................................ 10
Probable Maximum Precipitation Calculation ............................................................................................ 11
Stage/Storage/Discharge Curve Development ........................................................................................... 13
Hydrologic Model Development and Results ............................................................................................. 16
Additional Modeling Considerations .......................................................................................................... 19
Wave Heights ...................................................................................................................................... 19
Main Dam Spillway Usage ................................................................................................................... 20
Optional Outlet Pipe Modification for Main Dam .............................................................................. 20
Conclusions ................................................................................................................................................. 21
References .................................................................................................................................................. 21
List of Figures Figure 1: Project Area ................................................................................................................................... 5
Figure 2: Watershed Delineations ................................................................................................................ 8
Figure 3: Project Area Soils (HSG = Hydrologic Soil Group) .......................................................................... 9
Figure 4: Project Area Land-Cover .............................................................................................................. 10
Figure 5: Time of Concentration Flow Paths ............................................................................................... 11
Figure 6: HEC-HMS Existing Conditions Basin Model.................................................................................. 16
List of Tables Table 1: General Dam Information ............................................................................................................... 4
Table 2: Hydrologic Parameters .................................................................................................................... 7
Table 3: Land-Cover Categories .................................................................................................................... 9
Table 4: ¾ PMP Development ..................................................................................................................... 12
Table 5: Additional Primary Stage/Storage Curve ...................................................................................... 13

BC-Unit 5-6-0008
Table 6: Primary Stage/Storage Curve ........................................................................................................ 14
Table 7: Secondary Stage/Storage Curve .................................................................................................... 15
Table 8: Cell 1 Stage/Storage/Discharge Curve .......................................................................................... 17
Table 9: Cell 2 Stage/Storage/Discharge Curve .......................................................................................... 17
Table 10: Cell 3 Stage/Storage/Discharge Curve ........................................................................................ 18
Table 11: HEC-HMS Results ......................................................................................................................... 19
List of Appendices
Appendix A: USDA Soil Report
Appendix B: WinTR-55 Output
Appendix C: Time of Concentration Calculations
Appendix D: HMR-52 Output
Appendix E: Stage/Discharge Calculations
Appendix F: HEC-HMS Output HEC-RAS Model Results
Appendix G: NOAA ATLAS 14 Data
Appendix H: Digital Data
BC-Unit 5-6-0008
Buck Steam Station Hydrologic Analysis Submission: 4/20/12 Rowan County, NC Page 4
Buck Steam Station Hydrologic Analysis Summary
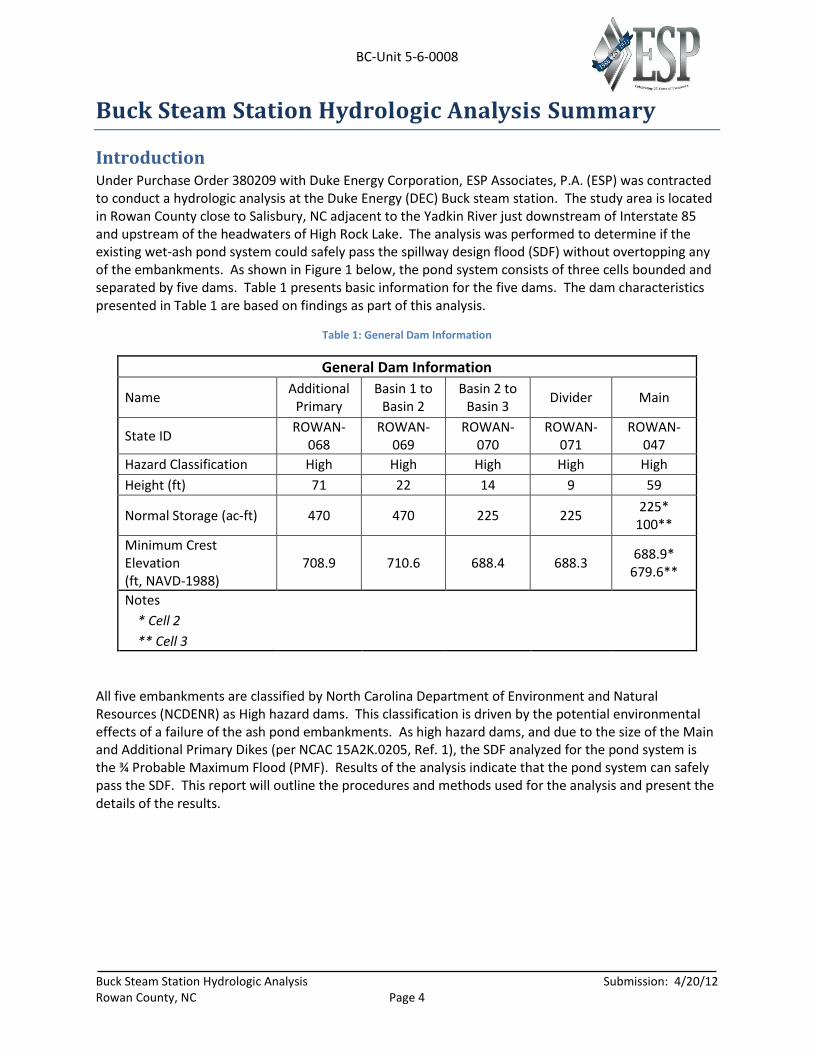
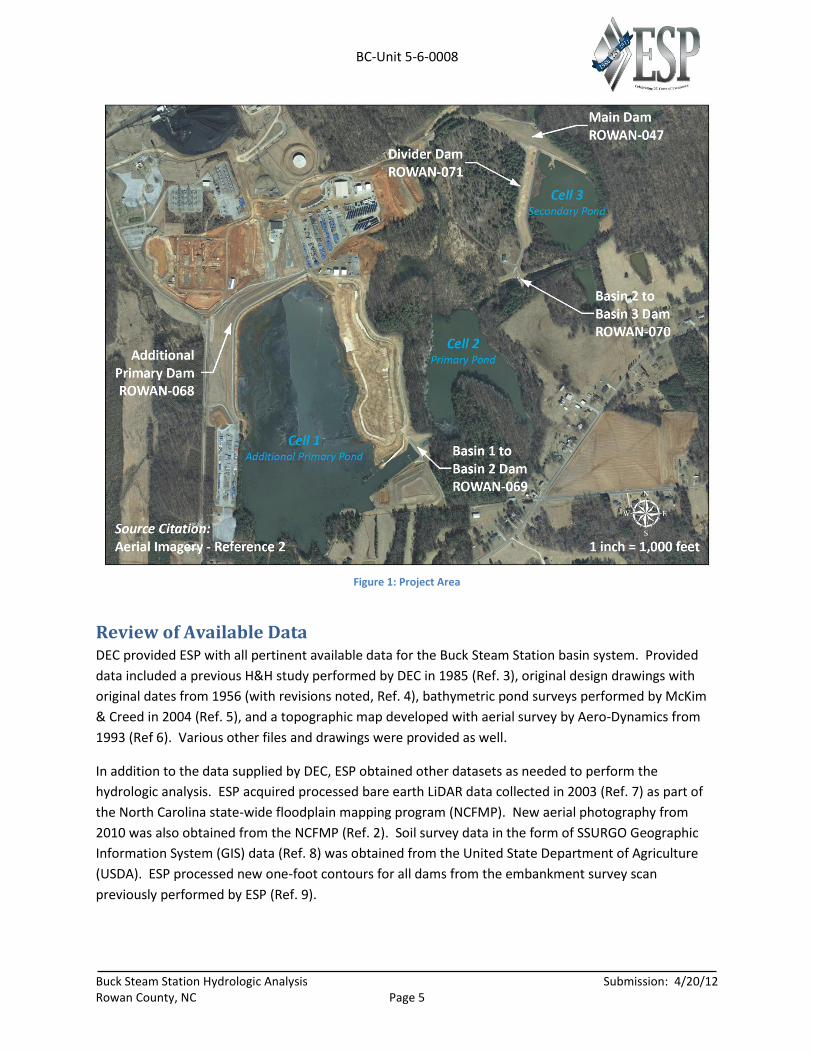
Introduction Under Purchase Order 380209 with Duke Energy Corporation, ESP Associates, P.A. (ESP) was contracted to conduct a hydrologic analysis at the Duke Energy (DEC) Buck steam station. The study area is located in Rowan County close to Salisbury, NC adjacent to the Yadkin River just downstream of Interstate 85 and upstream of the headwaters of High Rock Lake. The analysis was performed to determine if the existing wet-ash pond system could safely pass the spillway design flood (SDF) without overtopping any of the embankments. As shown in Figure 1 below, the pond system consists of three cells bounded and separated by five dams. Table 1 presents basic information for the five dams. The dam characteristics presented in Table 1 are based on findings as part of this analysis.
Table 1: General Dam Information
General Dam Information
Name Additional
Primary Basin 1 to
Basin 2 Basin 2 to
Basin 3 Divider Main
State ID ROWAN-
068 ROWAN-
069 ROWAN-
070 ROWAN-
071 ROWAN-
047
Hazard Classification High High High High High
Height (ft) 71 22 14 9 59
Normal Storage (ac-ft) 470 470 225 225 225*
100**
Minimum Crest Elevation (ft, NAVD-1988)
708.9 710.6 688.4 688.3 688.9*
679.6**
Notes
* Cell 2
** Cell 3
All five embankments are classified by North Carolina Department of Environment and Natural
Resources (NCDENR) as High hazard dams. This classification is driven by the potential environmental effects of a failure of the ash pond embankments. As high hazard dams, and due to the size of the Main and Additional Primary Dikes (per NCAC 15A2K.0205, Ref. 1), the SDF analyzed for the pond system is the ¾ Probable Maximum Flood (PMF). Results of the analysis indicate that the pond system can safely pass the SDF. This report will outline the procedures and methods used for the analysis and present the details of the results.
BC-Unit 5-6-0008
Buck Steam Station Hydrologic Analysis Submission: 4/20/12 Rowan County, NC Page 5
Figure 1: Project Area
Review of Available Data DEC provided ESP with all pertinent available data for the Buck Steam Station basin system. Provided
data included a previous H&H study performed by DEC in 1985 (Ref. 3), original design drawings with
original dates from 1956 (with revisions noted, Ref. 4), bathymetric pond surveys performed by McKim
& Creed in 2004 (Ref. 5), and a topographic map developed with aerial survey by Aero-Dynamics from
1993 (Ref 6). Various other files and drawings were provided as well.
In addition to the data supplied by DEC, ESP obtained other datasets as needed to perform the
hydrologic analysis. ESP acquired processed bare earth LiDAR data collected in 2003 (Ref. 7) as part of
the North Carolina state-wide floodplain mapping program (NCFMP). New aerial photography from
2010 was also obtained from the NCFMP (Ref. 2). Soil survey data in the form of SSURGO Geographic
Information System (GIS) data (Ref. 8) was obtained from the United State Department of Agriculture
(USDA). ESP processed new one-foot contours for all dams from the embankment survey scan
previously performed by ESP (Ref. 9).

BC-Unit 5-6-0008
Buck Steam Station Hydrologic Analysis Submission: 4/20/12 Rowan County, NC Page 6
Collected data were reviewed for use in this analysis. Factors impacting the use of the data were
documented for reference while performing subsequent tasks.
Field Reconnaissance On Thursday, March 8, 2012, ESP staff performed field reconnaissance of the project area. The purpose
of the field reconnaissance was to gain familiarity with the project area and an understanding of normal
conditions and operations. All embankments, ponds, and outlet works were observed and
photographed.
The field reconnaissance performed as part of this project was not intended to serve as a safety
inspection of the dams and should not be considered as such.
Topographic Data As introduced in the “Review of Available Data” section, multiple sources of topographic data were
obtained for the project area. Particular care was taken in consideration of the vertical datum of the
elevation datasets. The original design drawings and 1993 aerial survey based topographic map
provided by DEC was in NGVD 1929. The 2004 bathymetric survey, 2003 LiDAR data, and 2012 ESP
embankment scan data was in NAVD 1988. Using a database of known points across the state, a datum
conversion value of -0.73’ was identified to convert NGVD 1929 elevations to NAVD 1988 elevations
within the project area.
The various topographic datasets utilized were:
2004 Bathymetric Survey. Developed by McKim & Creed (Ref. 5), this dataset was in vertical
datum NAVD 1988. Sub-surface contours in two foot intervals were provided. The data was
used to help develop stage/storage curves for the ponds for use in the hydrologic model.
1993 Aerial Survey. Developed by Aero-Dynamics (Ref. 6), this dataset was in vertical datum
NGVD 1920. Two foot contours were provided covering the impounded areas of the ponds from
the water surface to the embankment crest, as well as the surrounding area on Duke property.
The data was used to help develop stage/storage curves for the ponds for use in the hydrologic
model.
2003 Statewide LiDAR. Developed by the North Carolina Floodplain Mapping program (Ref. 7),
this dataset was in vertical datum NAVD 1988. Bare earth mass points were provided. These
points were processed into a digital elevation model (DEM) and contours with two foot intervals
covering the entire project area including beyond Duke property. The processed DEM was used
for watershed delineation while the contours were used for time of concentration calculations
as well as to help develop stage/storage curves for the ponds for use in the hydrologic model.
2012 Embankment Scan. Developed by ESP Associates (Ref. 9) using a mobile LiDAR system,
this dataset was in vertical datum NAVD 1988. A processed bare earth point cloud was used to
develop one foot contours covering the dam embankments from the toe of the downstream
BC-Unit 5-6-0008
Buck Steam Station Hydrologic Analysis Submission: 4/20/12 Rowan County, NC Page 7
face to the water surface on the upstream face. The contours and points were used to verify
the embankment crest elevations.
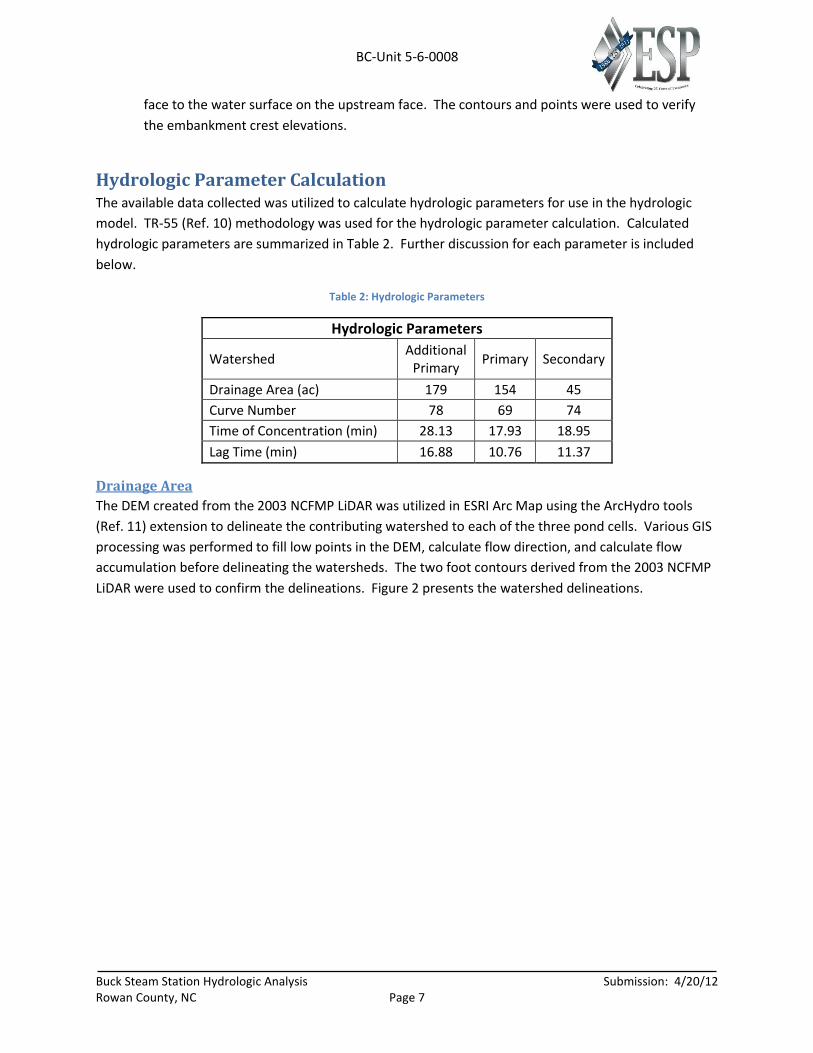
Hydrologic Parameter Calculation The available data collected was utilized to calculate hydrologic parameters for use in the hydrologic
model. TR-55 (Ref. 10) methodology was used for the hydrologic parameter calculation. Calculated
hydrologic parameters are summarized in Table 2. Further discussion for each parameter is included
below.
Table 2: Hydrologic Parameters
Hydrologic Parameters
Watershed Additional
Primary Primary Secondary
Drainage Area (ac) 179 154 45
Curve Number 78 69 74
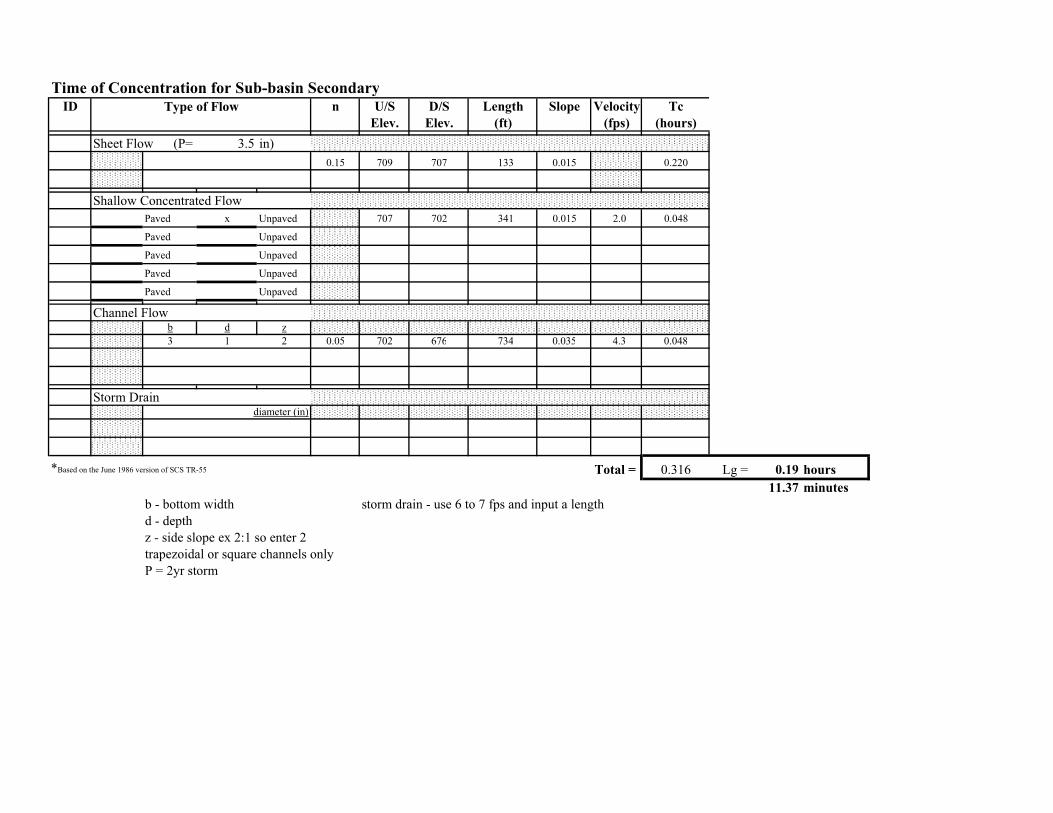
Time of Concentration (min) 28.13 17.93 18.95
Lag Time (min) 16.88 10.76 11.37
Drainage Area
The DEM created from the 2003 NCFMP LiDAR was utilized in ESRI Arc Map using the ArcHydro tools
(Ref. 11) extension to delineate the contributing watershed to each of the three pond cells. Various GIS
processing was performed to fill low points in the DEM, calculate flow direction, and calculate flow
accumulation before delineating the watersheds. The two foot contours derived from the 2003 NCFMP
LiDAR were used to confirm the delineations. Figure 2 presents the watershed delineations.

BC-Unit 5-6-0008
Buck Steam Station Hydrologic Analysis Submission: 4/20/12 Rowan County, NC Page 8
Figure 2: Watershed Delineations
Curve Number
Soil Conservation Service (SCS) curve numbers correlate to the volume of runoff produced for a given
watershed for a defined storm event. Higher curve numbers produce greater runoff volume. Curve
numbers are calculated by considering the combination of land-cover and hydrologic soil group for a
given area. For the three watersheds identified in the project area, curve numbers were calculated
using SSURGO soil data and land-cover delineated from the 2010 aerial imagery obtained from NCFMP.
Antecedent Moisture Condition Type II was assumed for the project area.
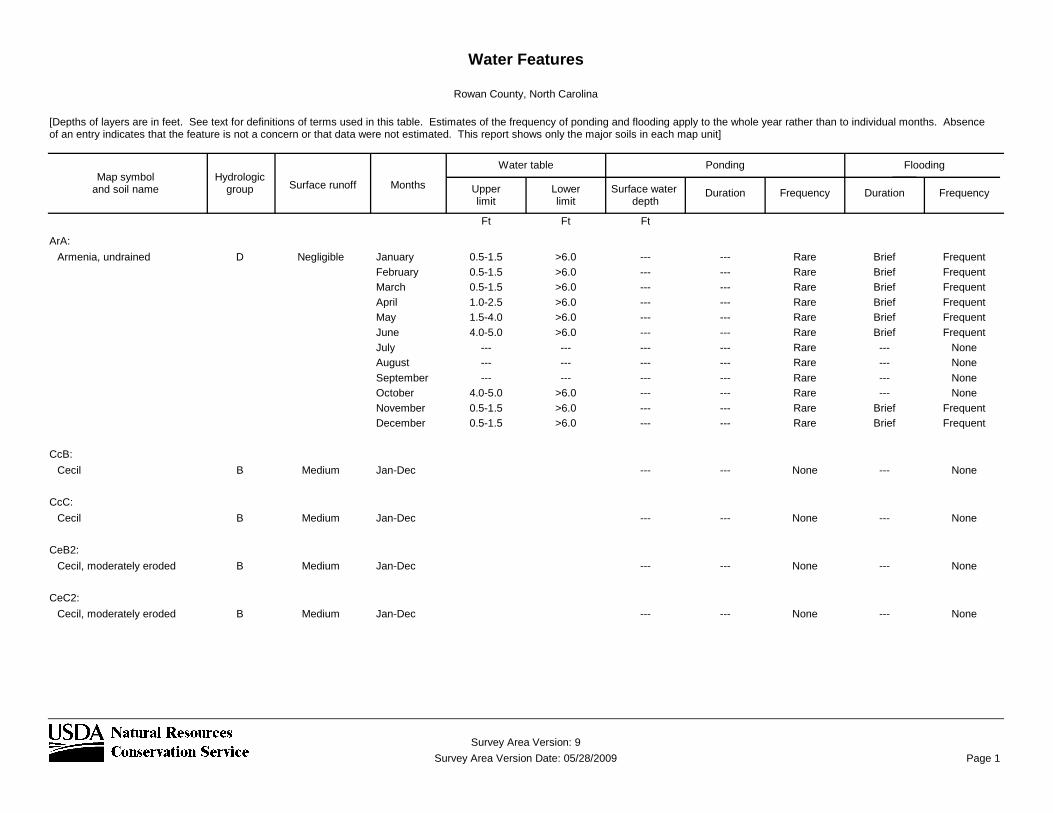
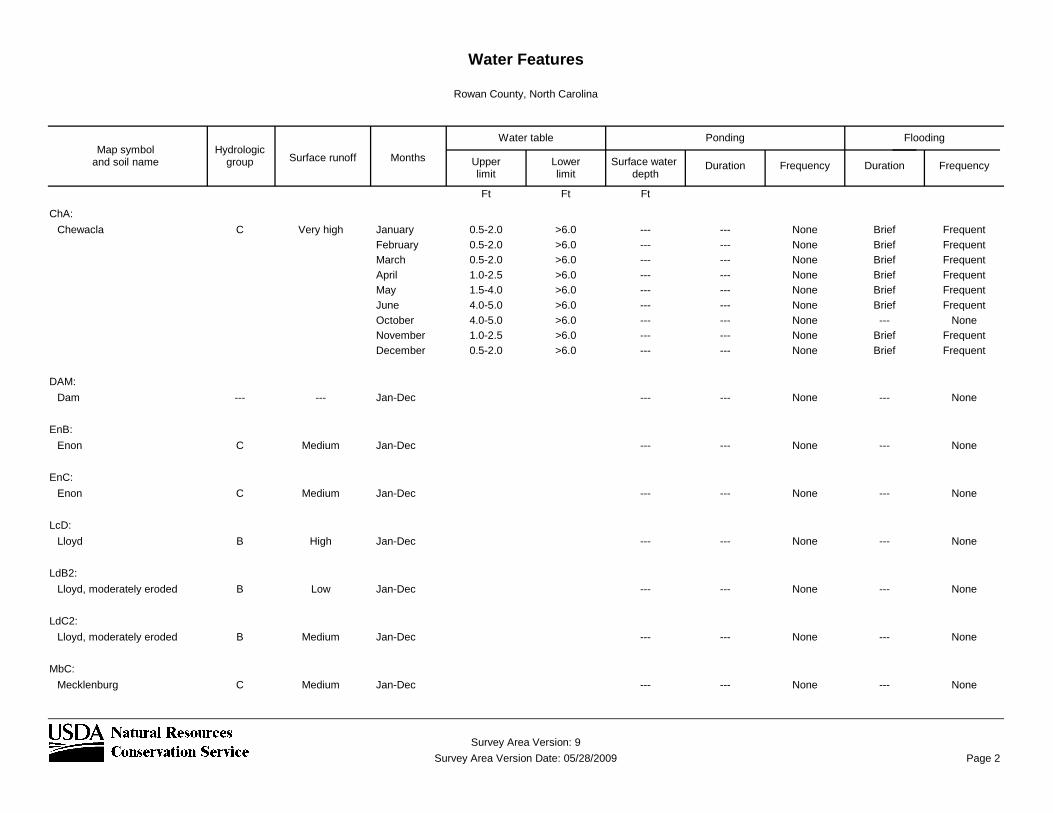
The USDA website (Ref. 12) was used to select a study area and identify the soils names within the study
area based on SSURGO. For each soil name, a hydrologic soil group was reported. The selected study
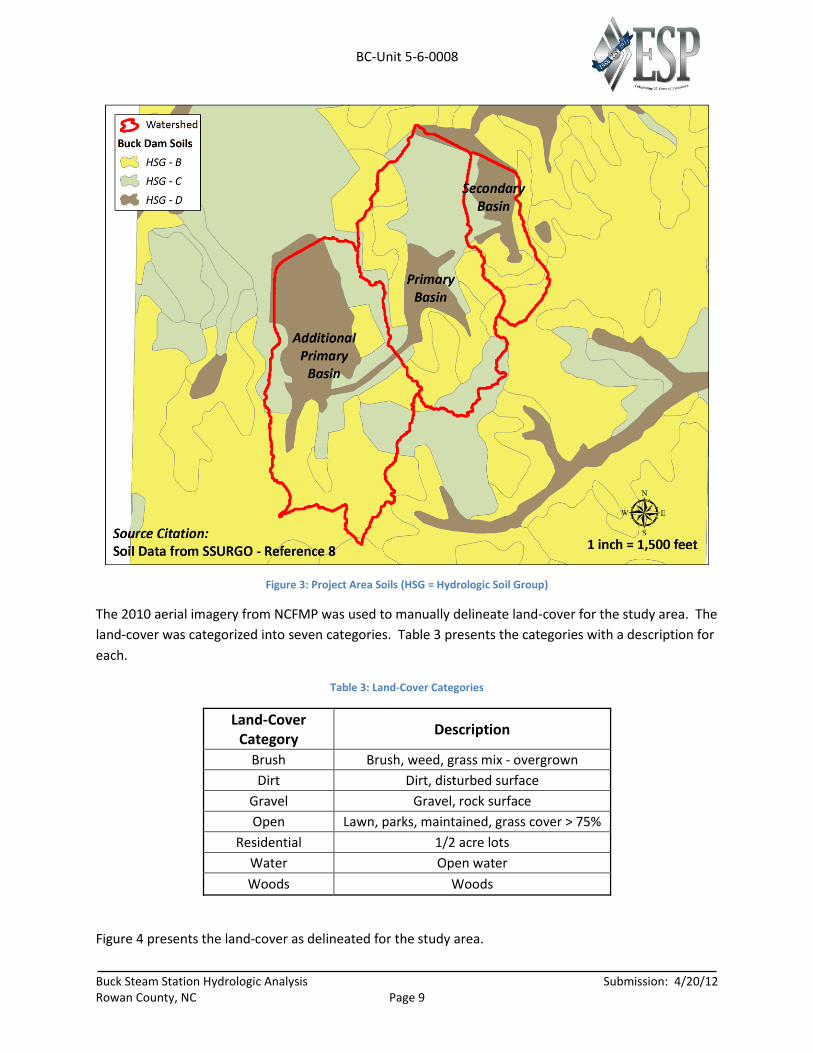
area soil report from the USDA website is available in Appendix A. Figure 3 presents the hydrologic soil
groups within the study area.
BC-Unit 5-6-0008
Buck Steam Station Hydrologic Analysis Submission: 4/20/12 Rowan County, NC Page 9
Figure 3: Project Area Soils (HSG = Hydrologic Soil Group)
The 2010 aerial imagery from NCFMP was used to manually delineate land-cover for the study area. The
land-cover was categorized into seven categories. Table 3 presents the categories with a description for
each.
Table 3: Land-Cover Categories
Land-Cover Category
Description
Brush Brush, weed, grass mix - overgrown
Dirt Dirt, disturbed surface
Gravel Gravel, rock surface
Open Lawn, parks, maintained, grass cover > 75%
Residential 1/2 acre lots
Water Open water
Woods Woods
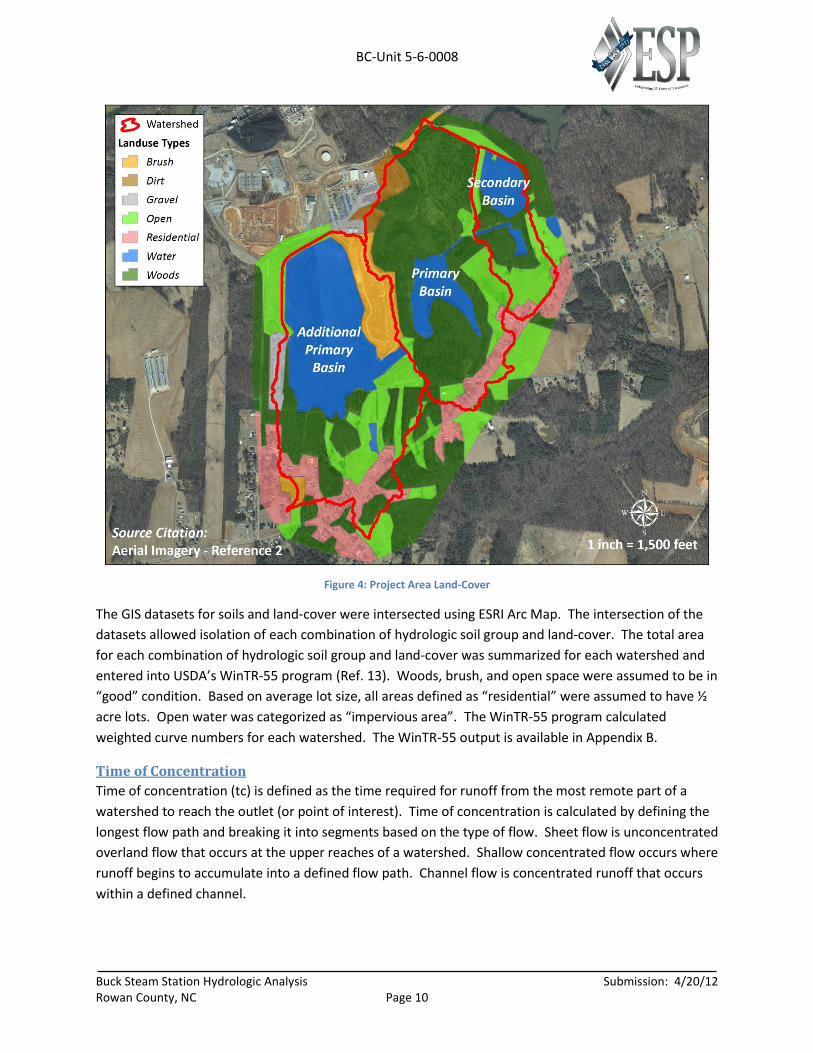
Figure 4 presents the land-cover as delineated for the study area.
BC-Unit 5-6-0008
Buck Steam Station Hydrologic Analysis Submission: 4/20/12 Rowan County, NC Page 10
Figure 4: Project Area Land-Cover
The GIS datasets for soils and land-cover were intersected using ESRI Arc Map. The intersection of the
datasets allowed isolation of each combination of hydrologic soil group and land-cover. The total area
for each combination of hydrologic soil group and land-cover was summarized for each watershed and
entered into USDA’s WinTR-55 program (Ref. 13). Woods, brush, and open space were assumed to be in
“good” condition. Based on average lot size, all areas defined as “residential” were assumed to have ½
acre lots. Open water was categorized as “impervious area”. The WinTR-55 program calculated
weighted curve numbers for each watershed. The WinTR-55 output is available in Appendix B.
Time of Concentration
Time of concentration (tc) is defined as the time required for runoff from the most remote part of a
watershed to reach the outlet (or point of interest). Time of concentration is calculated by defining the
longest flow path and breaking it into segments based on the type of flow. Sheet flow is unconcentrated
overland flow that occurs at the upper reaches of a watershed. Shallow concentrated flow occurs where
runoff begins to accumulate into a defined flow path. Channel flow is concentrated runoff that occurs
within a defined channel.
BC-Unit 5-6-0008
Buck Steam Station Hydrologic Analysis Submission: 4/20/12 Rowan County, NC Page 11
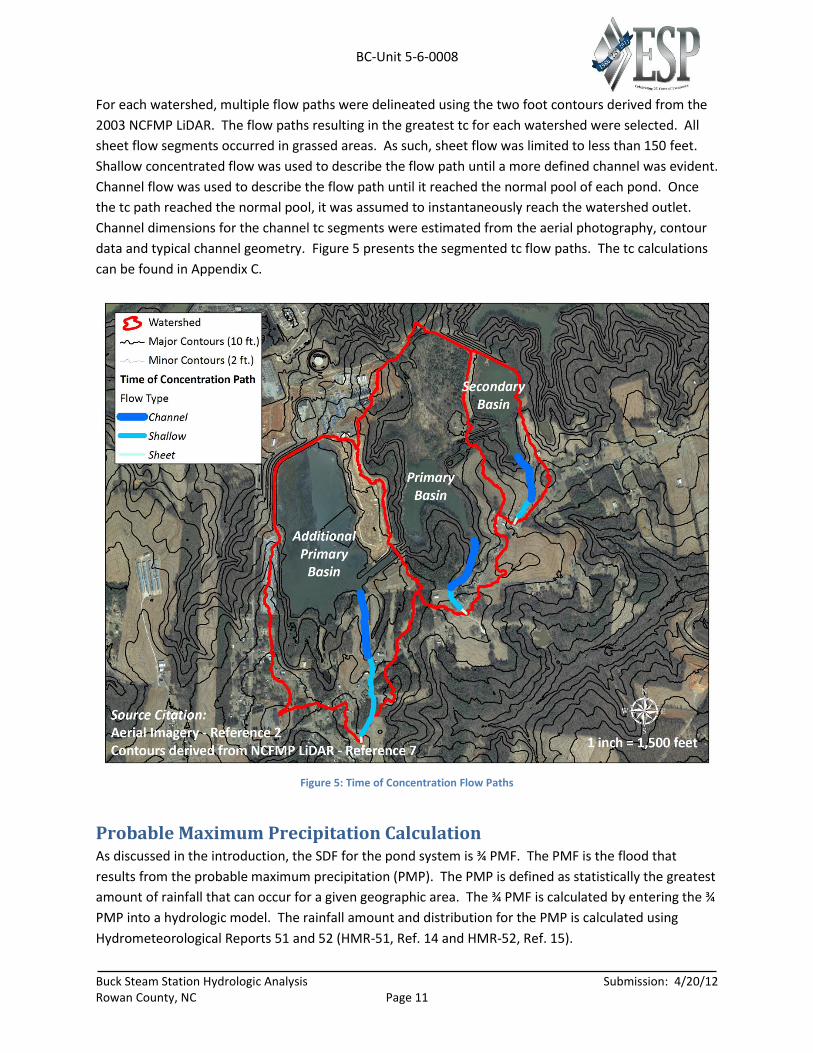
For each watershed, multiple flow paths were delineated using the two foot contours derived from the
2003 NCFMP LiDAR. The flow paths resulting in the greatest tc for each watershed were selected. All
sheet flow segments occurred in grassed areas. As such, sheet flow was limited to less than 150 feet.
Shallow concentrated flow was used to describe the flow path until a more defined channel was evident.
Channel flow was used to describe the flow path until it reached the normal pool of each pond. Once
the tc path reached the normal pool, it was assumed to instantaneously reach the watershed outlet.
Channel dimensions for the channel tc segments were estimated from the aerial photography, contour
data and typical channel geometry. Figure 5 presents the segmented tc flow paths. The tc calculations
can be found in Appendix C.
Figure 5: Time of Concentration Flow Paths
Probable Maximum Precipitation Calculation As discussed in the introduction, the SDF for the pond system is ¾ PMF. The PMF is the flood that
results from the probable maximum precipitation (PMP). The PMP is defined as statistically the greatest
amount of rainfall that can occur for a given geographic area. The ¾ PMF is calculated by entering the ¾
PMP into a hydrologic model. The rainfall amount and distribution for the PMP is calculated using
Hydrometeorological Reports 51 and 52 (HMR-51, Ref. 14 and HMR-52, Ref. 15).
BC-Unit 5-6-0008
Buck Steam Station Hydrologic Analysis Submission: 4/20/12 Rowan County, NC Page 12
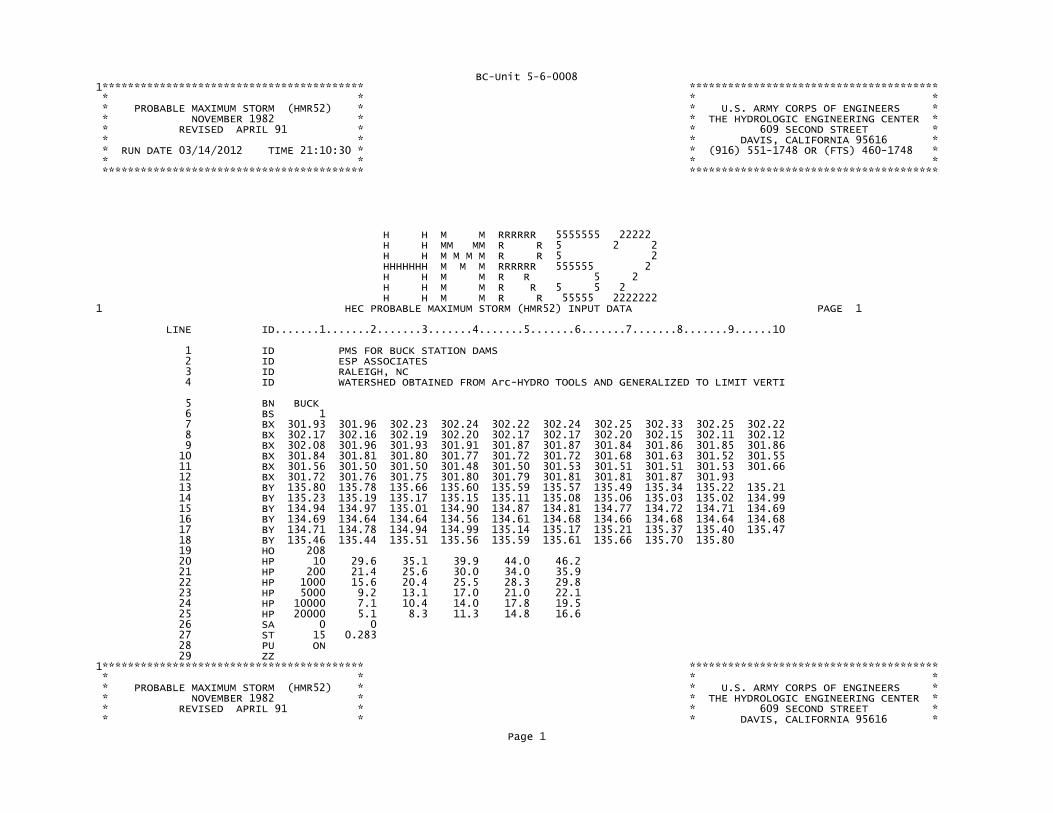
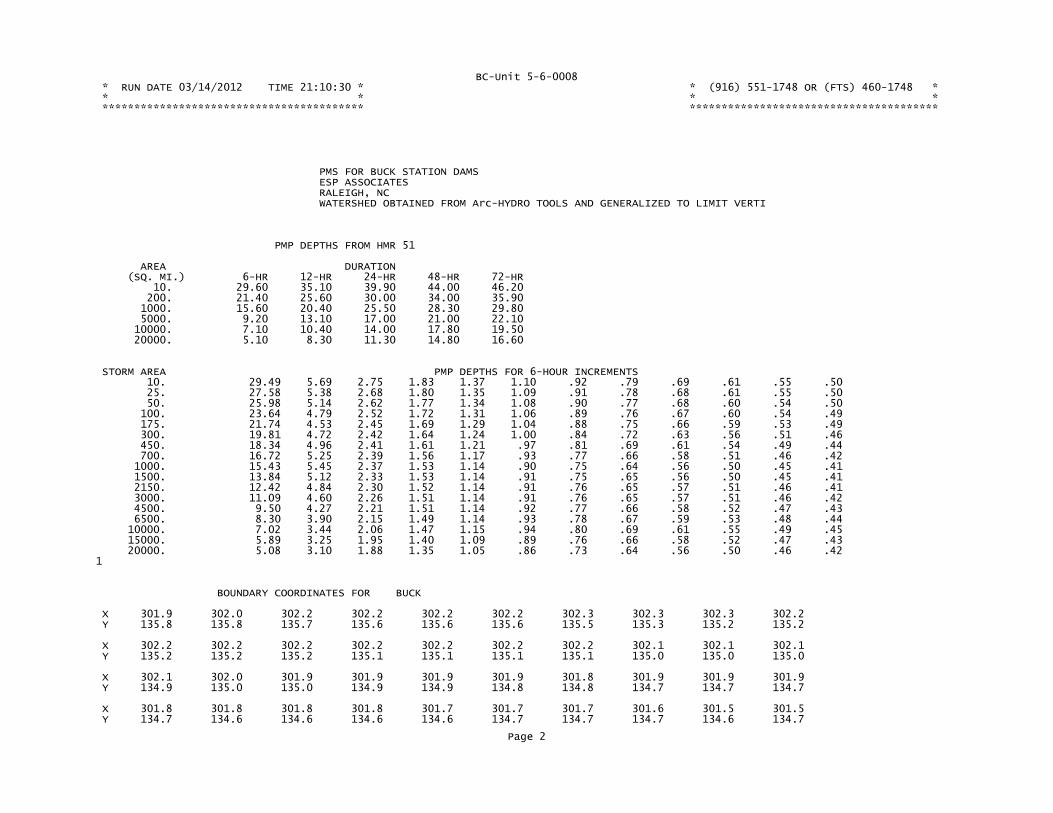
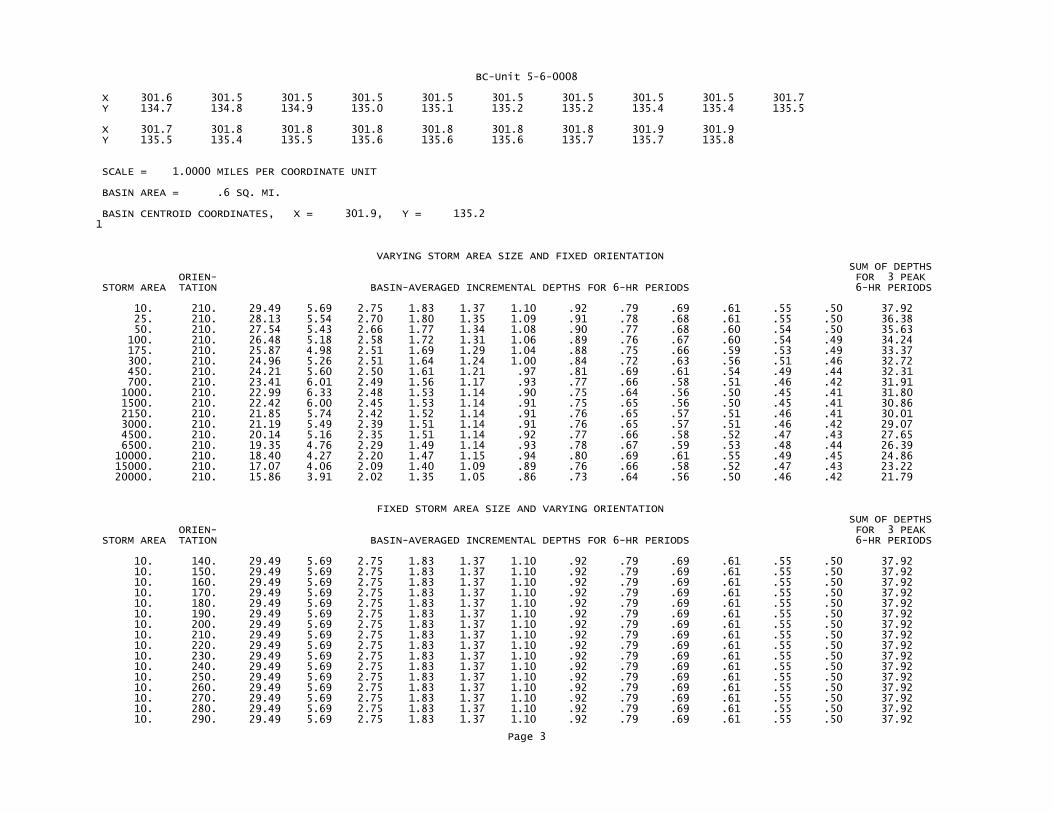
The HMR-52 computer program (Ref. 16) was used to calculate the PMP with a 15 minute time interval.
Required inputs for the program include watershed coordinates and storm/rainfall information found in
HMR-51 and HMR-52. The program will automatically vary storm size and orientation to produce the
greatest amount of rainfall on the watershed. The program results include the PMP distribution and
total rainfall. The maximum 6 hour period of rainfall is the PMP used for this analysis. The total PMP
rainfall was calculated to be 29.49 inches. The HMR-52 computer program output can be found in
Appendix D.
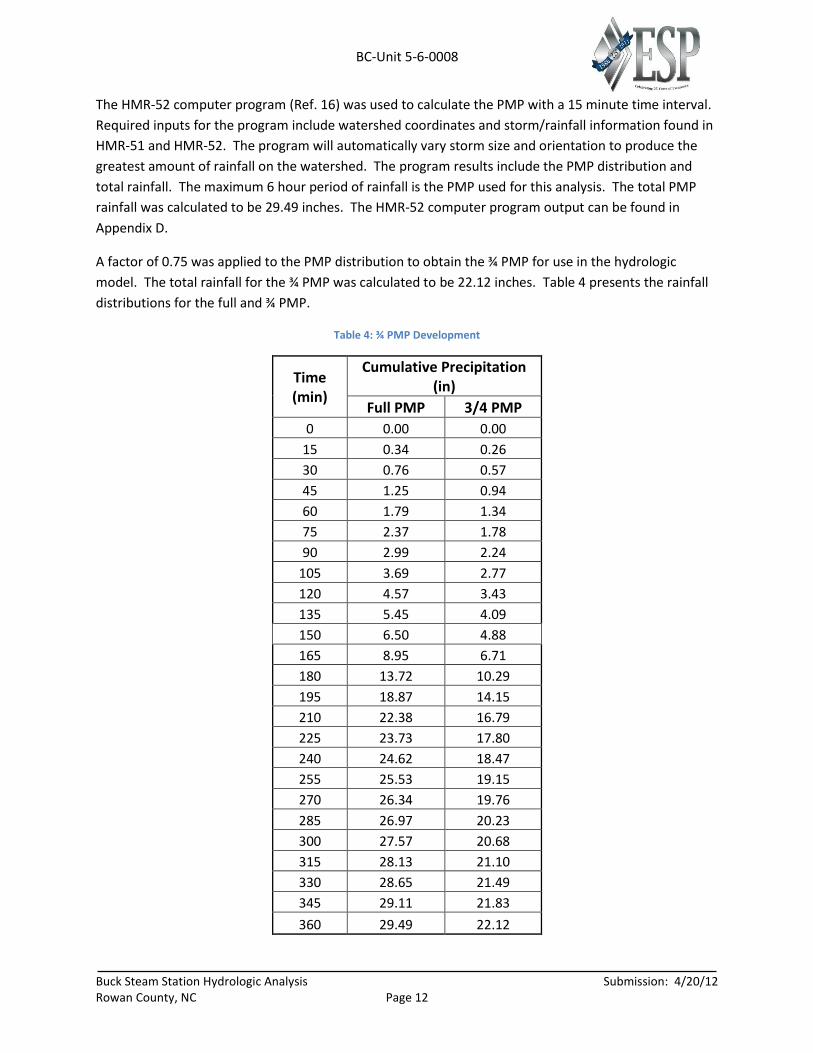
A factor of 0.75 was applied to the PMP distribution to obtain the ¾ PMP for use in the hydrologic
model. The total rainfall for the ¾ PMP was calculated to be 22.12 inches. Table 4 presents the rainfall
distributions for the full and ¾ PMP.
Table 4: ¾ PMP Development
Time (min)
Cumulative Precipitation (in)
Full PMP 3/4 PMP
0 0.00 0.00
15 0.34 0.26
30 0.76 0.57
45 1.25 0.94
60 1.79 1.34
75 2.37 1.78
90 2.99 2.24
105 3.69 2.77
120 4.57 3.43
135 5.45 4.09
150 6.50 4.88
165 8.95 6.71
180 13.72 10.29
195 18.87 14.15
210 22.38 16.79
225 23.73 17.80
240 24.62 18.47
255 25.53 19.15
270 26.34 19.76
285 26.97 20.23
300 27.57 20.68
315 28.13 21.10
330 28.65 21.49
345 29.11 21.83
360 29.49 22.12
BC-Unit 5-6-0008
Buck Steam Station Hydrologic Analysis Submission: 4/20/12 Rowan County, NC Page 13
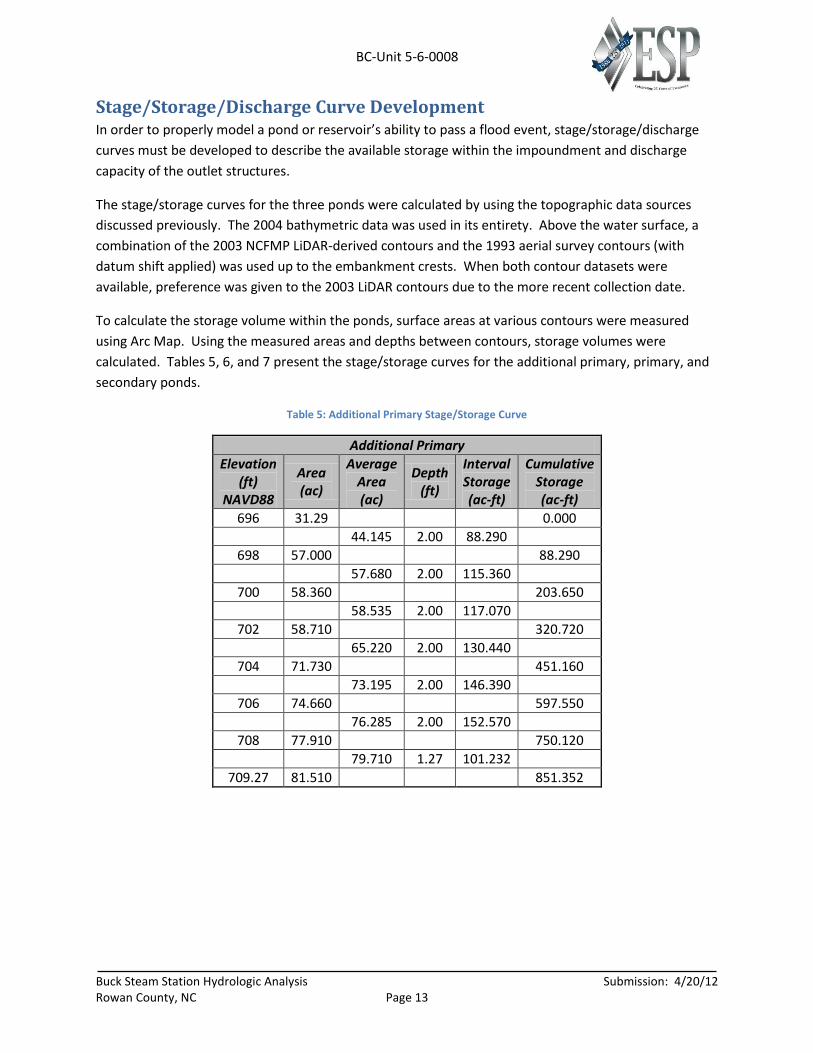
Stage/Storage/Discharge Curve Development In order to properly model a pond or reservoir’s ability to pass a flood event, stage/storage/discharge
curves must be developed to describe the available storage within the impoundment and discharge
capacity of the outlet structures.
The stage/storage curves for the three ponds were calculated by using the topographic data sources
discussed previously. The 2004 bathymetric data was used in its entirety. Above the water surface, a
combination of the 2003 NCFMP LiDAR-derived contours and the 1993 aerial survey contours (with
datum shift applied) was used up to the embankment crests. When both contour datasets were
available, preference was given to the 2003 LiDAR contours due to the more recent collection date.
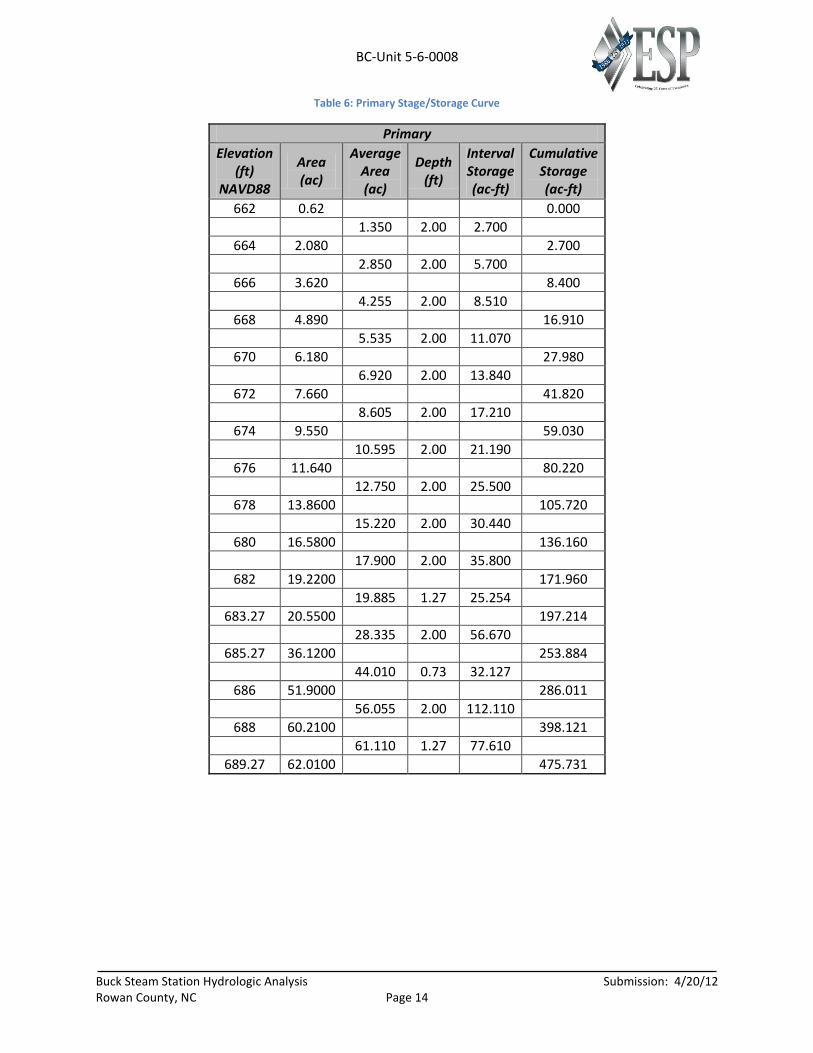
To calculate the storage volume within the ponds, surface areas at various contours were measured
using Arc Map. Using the measured areas and depths between contours, storage volumes were
calculated. Tables 5, 6, and 7 present the stage/storage curves for the additional primary, primary, and
secondary ponds.
Table 5: Additional Primary Stage/Storage Curve
Additional Primary
Elevation (ft)
NAVD88
Area (ac)
Average Area (ac)
Depth (ft)
Interval Storage (ac-ft)
Cumulative Storage (ac-ft)
696 31.29 0.000
44.145 2.00 88.290
698 57.000 88.290
57.680 2.00 115.360
700 58.360 203.650
58.535 2.00 117.070
702 58.710 320.720
65.220 2.00 130.440
704 71.730 451.160
73.195 2.00 146.390
706 74.660 597.550
76.285 2.00 152.570
708 77.910 750.120
79.710 1.27 101.232
709.27 81.510 851.352
BC-Unit 5-6-0008
Buck Steam Station Hydrologic Analysis Submission: 4/20/12 Rowan County, NC Page 14
Table 6: Primary Stage/Storage Curve
Primary
Elevation (ft)
NAVD88
Area (ac)
Average Area (ac)
Depth (ft)
Interval Storage (ac-ft)
Cumulative Storage (ac-ft)
662 0.62 0.000
1.350 2.00 2.700
664 2.080 2.700
2.850 2.00 5.700
666 3.620 8.400
4.255 2.00 8.510
668 4.890 16.910
5.535 2.00 11.070
670 6.180 27.980
6.920 2.00 13.840
672 7.660 41.820
8.605 2.00 17.210
674 9.550 59.030
10.595 2.00 21.190
676 11.640 80.220
12.750 2.00 25.500
678 13.8600 105.720
15.220 2.00 30.440
680 16.5800 136.160
17.900 2.00 35.800
682 19.2200 171.960
19.885 1.27 25.254
683.27 20.5500 197.214
28.335 2.00 56.670
685.27 36.1200 253.884
44.010 0.73 32.127
686 51.9000 286.011
56.055 2.00 112.110
688 60.2100 398.121
61.110 1.27 77.610
689.27 62.0100 475.731

BC-Unit 5-6-0008
Buck Steam Station Hydrologic Analysis Submission: 4/20/12 Rowan County, NC Page 15
Table 7: Secondary Stage/Storage Curve
Secondary
Elevation (ft)
NAVD88
Area (ac)
Average Area (ac)
Depth (ft)
Interval Storage (ac-ft)
Cumulative Storage (ac-ft)
658 0.79 0.000
1.935 2.00 3.870
660 3.080 3.870
3.900 2.00 7.800
662 4.720 11.670
5.350 2.00 10.700
664 5.980 22.370
6.495 2.00 12.990
666 7.010 35.360
7.570 2.00 15.140
668 8.130 50.500
8.785 2.00 17.570
670 9.440 68.070
10.050 2.00 20.100
672 10.660 88.170
11.810 3.27 38.619
675.27 12.9600 126.789
15.530 2.00 31.060
677.27 18.1000 157.849
18.730 2.00 37.460
679.27 19.3600 195.309
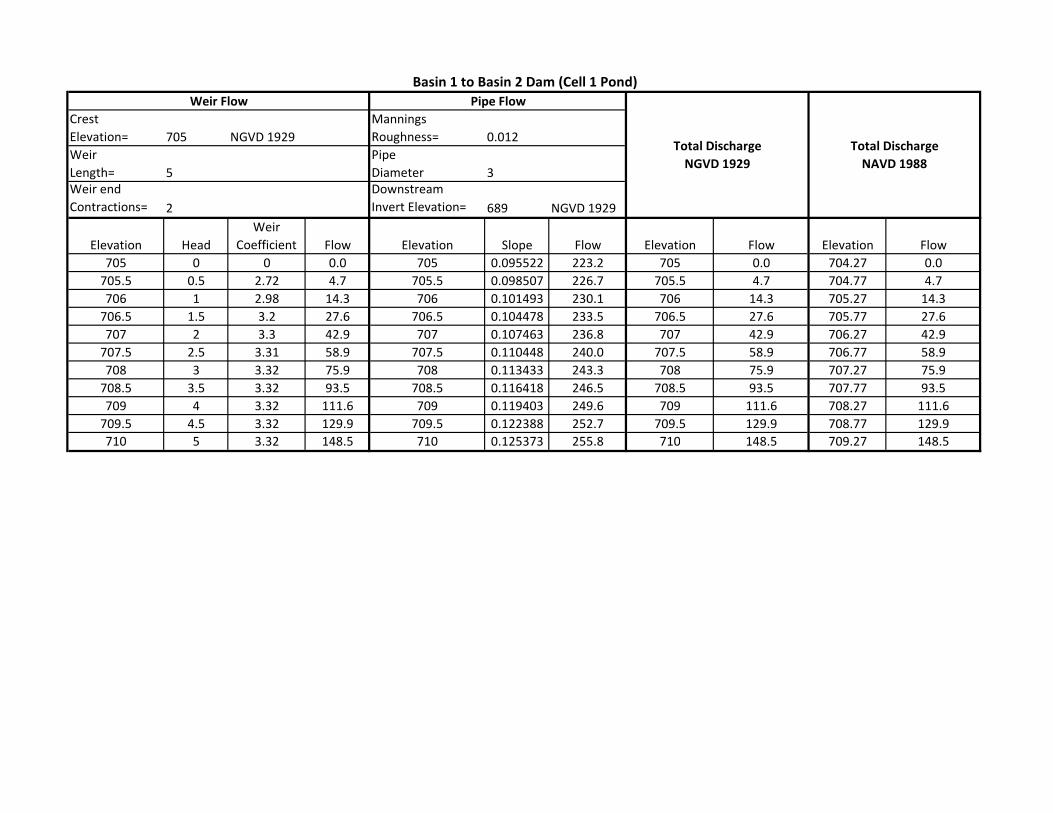
The stage/discharge curves for the three ponds were calculated using standard weir and pipe flow equations for the riser structures. The original design drawings were consulted for the details of the riser outlet structures. The outlet structures were verified during the field reconnaissance. Two of the structures were found to have been constructed differently than the design drawings indicated. The Basin 1 to Basin 2 Dam outlet tower was designed to discharge through all four sides of the tower, however, only one side is actually discharging. The Basin 2 to Basin 3 Dam outlet tower was designed to discharge through all four sides of the tower, however, only two sides are actually discharging.
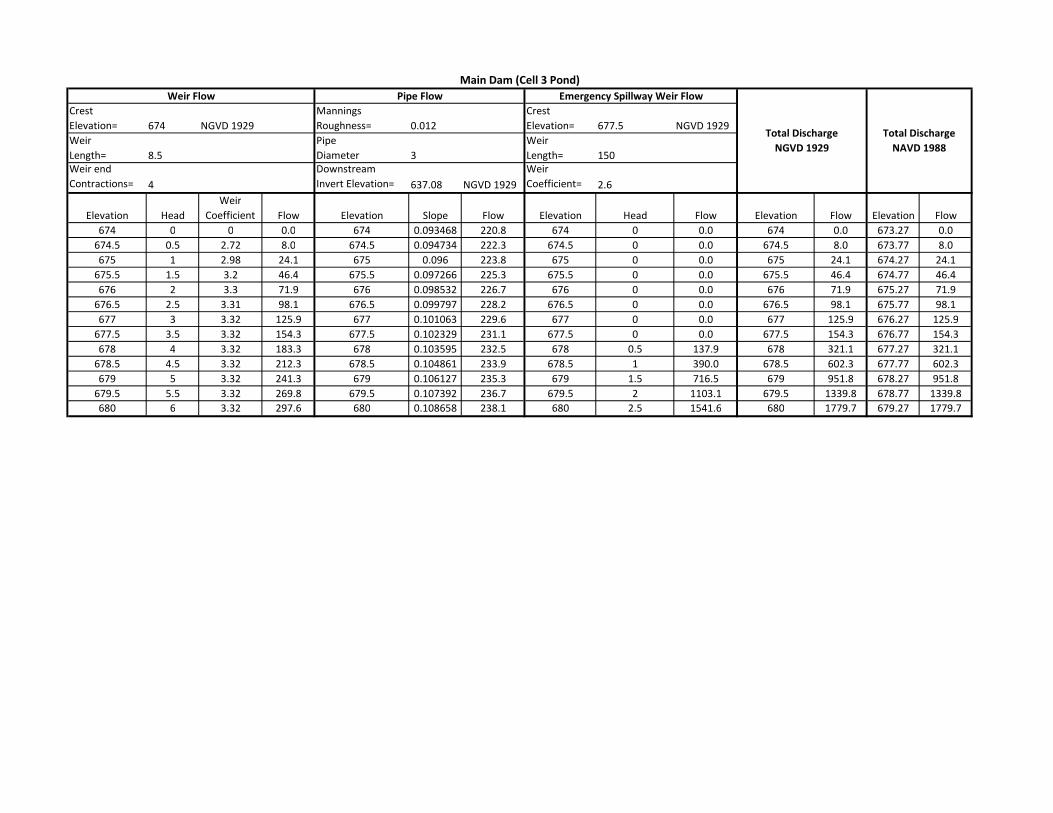
At each elevation, the weir and pipe flow were calculated and the lesser of the two was used in the discharge rating curve. The weir coefficients used for the discharge calculations over the stop logs of the outlet towers were obtained from the table of broad crested weir coefficients in Brater and King (1976) and varied with head over the weir. The weir equation was also used to calculate the discharge capacity of the emergency spillway for the main dam using a minimum weir coefficient of 2.6 given the breadth of the weir. For the pipe flow calculations, the “invert” of the outlet was entered as the maximum water surface elevation of the receiving body of water during the SDF. Using the actual pipe outlet invert would not have been appropriate based on the tailwater conditions. The stage/discharge spreadsheet calculations can be found in Appendix E. It should be noted that the discharge capacity of the outlet structures were initially calculated on the NGVD 1929 vertical datum based on the original design drawings. The elevations were then converted to the NAVD 1988 vertical datum.
BC-Unit 5-6-0008
Buck Steam Station Hydrologic Analysis Submission: 4/20/12 Rowan County, NC Page 16
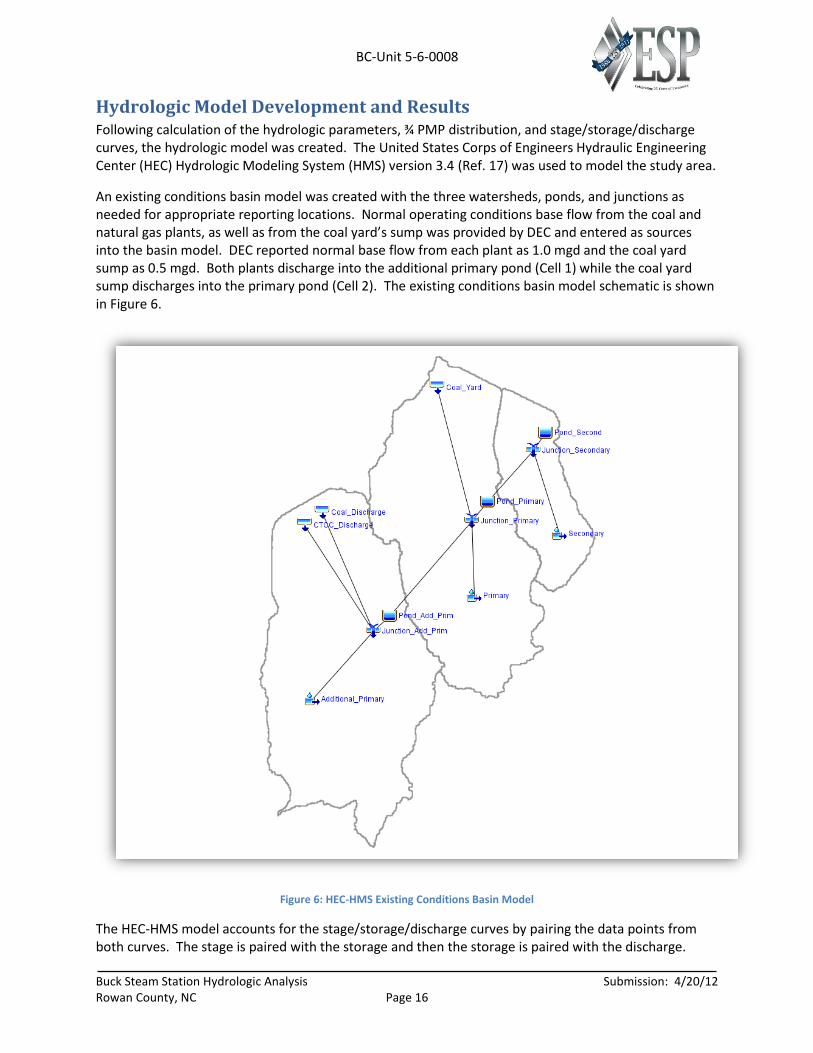
Hydrologic Model Development and Results Following calculation of the hydrologic parameters, ¾ PMP distribution, and stage/storage/discharge curves, the hydrologic model was created. The United States Corps of Engineers Hydraulic Engineering Center (HEC) Hydrologic Modeling System (HMS) version 3.4 (Ref. 17) was used to model the study area.
An existing conditions basin model was created with the three watersheds, ponds, and junctions as needed for appropriate reporting locations. Normal operating conditions base flow from the coal and natural gas plants, as well as from the coal yard’s sump was provided by DEC and entered as sources into the basin model. DEC reported normal base flow from each plant as 1.0 mgd and the coal yard sump as 0.5 mgd. Both plants discharge into the additional primary pond (Cell 1) while the coal yard sump discharges into the primary pond (Cell 2). The existing conditions basin model schematic is shown in Figure 6.
Figure 6: HEC-HMS Existing Conditions Basin Model
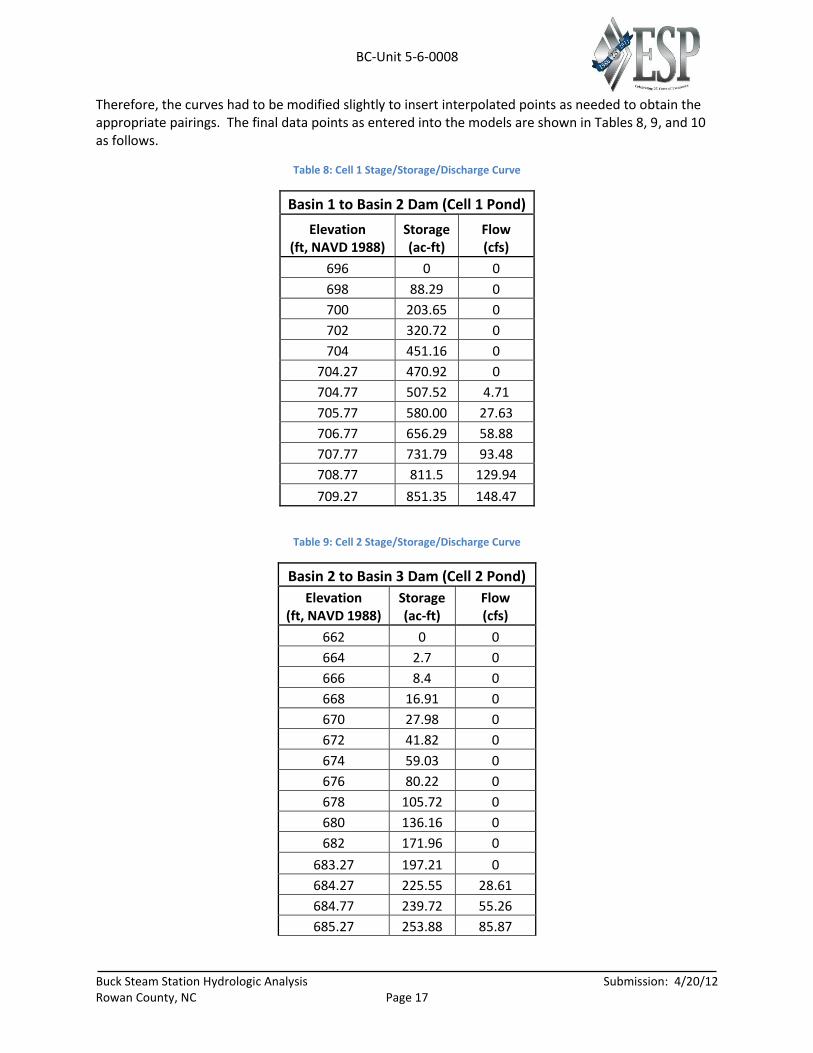
The HEC-HMS model accounts for the stage/storage/discharge curves by pairing the data points from both curves. The stage is paired with the storage and then the storage is paired with the discharge.
BC-Unit 5-6-0008
Buck Steam Station Hydrologic Analysis Submission: 4/20/12 Rowan County, NC Page 17
Therefore, the curves had to be modified slightly to insert interpolated points as needed to obtain the appropriate pairings. The final data points as entered into the models are shown in Tables 8, 9, and 10 as follows.
Table 8: Cell 1 Stage/Storage/Discharge Curve
Basin 1 to Basin 2 Dam (Cell 1 Pond)
Elevation (ft, NAVD 1988)
Storage (ac-ft)
Flow (cfs)
696 0 0
698 88.29 0
700 203.65 0
702 320.72 0
704 451.16 0
704.27 470.92 0
704.77 507.52 4.71
705.77 580.00 27.63
706.77 656.29 58.88
707.77 731.79 93.48
708.77 811.5 129.94
709.27 851.35 148.47
Table 9: Cell 2 Stage/Storage/Discharge Curve
Basin 2 to Basin 3 Dam (Cell 2 Pond)
Elevation (ft, NAVD 1988)
Storage (ac-ft)
Flow (cfs)
662 0 0
664 2.7 0
666 8.4 0
668 16.91 0
670 27.98 0
672 41.82 0
674 59.03 0
676 80.22 0
678 105.72 0
680 136.16 0
682 171.96 0
683.27 197.21 0
684.27 225.55 28.61
684.77 239.72 55.26
685.27 253.88 85.87
BC-Unit 5-6-0008
Buck Steam Station Hydrologic Analysis Submission: 4/20/12 Rowan County, NC Page 18
Basin 2 to Basin 3 Dam (Cell 2 Pond)
Elevation (ft, NAVD 1988)
Storage (ac-ft)
Flow (cfs)
685.77 273.12 117.76
686.77 329.17 186.96
687.77 384.07 227.86
688.77 445.18 238.76
689.27 475.73 244.04
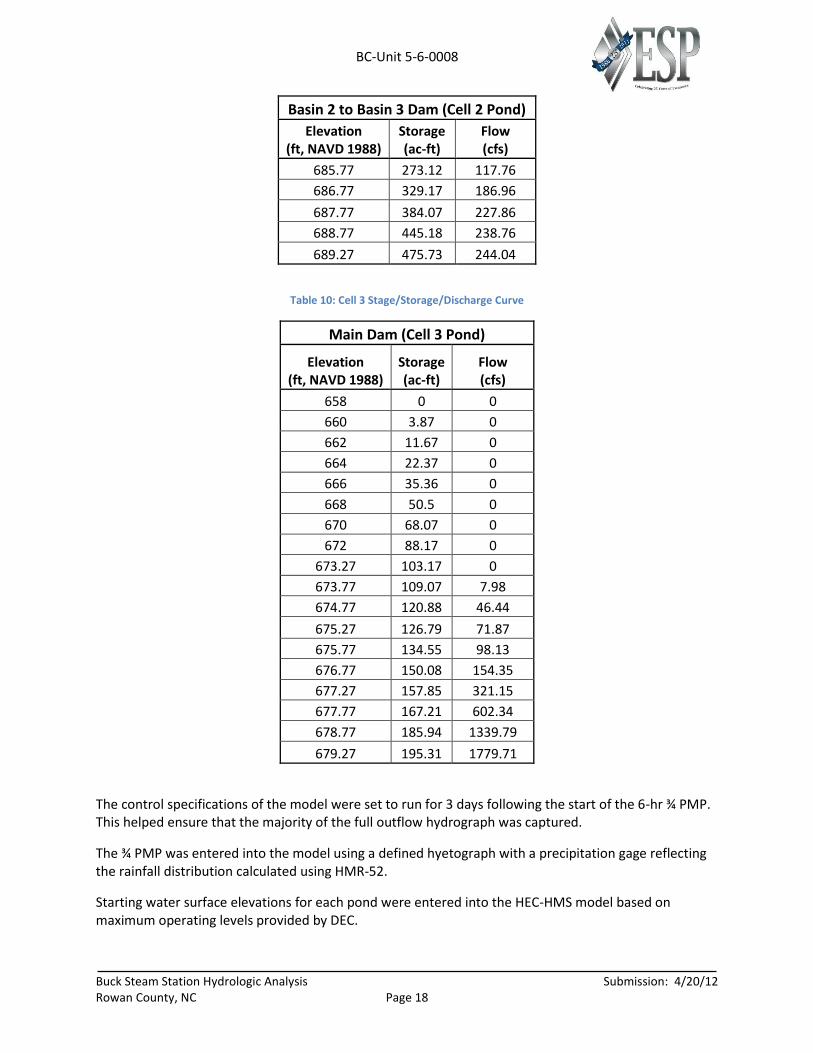
Table 10: Cell 3 Stage/Storage/Discharge Curve
Main Dam (Cell 3 Pond)
Elevation (ft, NAVD 1988)
Storage (ac-ft)
Flow (cfs)
658 0 0
660 3.87 0
662 11.67 0
664 22.37 0
666 35.36 0
668 50.5 0
670 68.07 0
672 88.17 0
673.27 103.17 0
673.77 109.07 7.98
674.77 120.88 46.44
675.27 126.79 71.87
675.77 134.55 98.13
676.77 150.08 154.35
677.27 157.85 321.15
677.77 167.21 602.34
678.77 185.94 1339.79
679.27 195.31 1779.71
The control specifications of the model were set to run for 3 days following the start of the 6-hr ¾ PMP. This helped ensure that the majority of the full outflow hydrograph was captured.
The ¾ PMP was entered into the model using a defined hyetograph with a precipitation gage reflecting the rainfall distribution calculated using HMR-52.
Starting water surface elevations for each pond were entered into the HEC-HMS model based on maximum operating levels provided by DEC.

BC-Unit 5-6-0008
Buck Steam Station Hydrologic Analysis Submission: 4/20/12 Rowan County, NC Page 19
Table 11 presents the results of the hydrologic analysis for each dam within each cell.
Table 11: HEC-HMS Results
Additional HEC-HMS output including hydrographs and summary tables can be found in Appendix F.
Additional Modeling Considerations In order to adhere to certain requirements of NCAC 15A2K, some additional modeling considerations
were investigated. In addition, DEC requested an optional modeling run be performed to evaluate a
potential modification to the Main dam’s outlet structure. The implementation of this potential
modification is not required.
Wave Heights
Although this analysis shows that the ¾ PMF can be routed through the pond system without
overtopping any of the dam embankments, additional consideration was given to potential wave heights
within the ponds that could produce overtopping.
Wave heights are affected by depth of water, wind speed, and fetch length. The fetch length is the
distance over open water available for the wave to form. The United States Army Corps of Engineers
(USACE) Engineering Manual (EM) 110-2-1420 (Ref. 18) discusses dam freeboard requirements and
addresses wave height considerations in Chapter 15. The manual refers to USACE EM 110-2-1414 (Ref.
19) for additional references.
Section VI 2 of chapter 3 in the USACE Shore Protection Manual (Ref. 20) explains propagation and
decay of waves over flooded, vegetated land. Figure 3-37 specifically depicts the elevated bottom
friction factors of areas with dense vegetation. Based on the results of the hydrologic analysis, the dams
Dam
Additional
Primary
Basin 1 to
Basin 2
Basin 2 to
Basin 3 Divider Main Divider Main
State ID
ROWAN-
068
ROWAN-
069
ROWAN-
070
ROWAN-
071
ROWAN-
047
ROWAN-
071
ROWAN-
047
Minimum Crest
Elev. (ft, NAVD 1988) 708.9 710.6 688.4 688.3 688.9 688.3 679.6
Maximum Operating
WSEL (ft, NAVD 1988) 704.27 704.27 682.27 682.27 682.27 674.27 674.27
Peak WSEL
(ft, NAVD 1988) 707.8 707.8 687.5 687.5 687.5 677.3 677.3
Peak Storage
(ac-ft) 735.3 735.3 370.4 370.4 370.4 158.1 158.1
Peak Inflow
(cfs) 2407.7 2407.7 2124.1 2124.1 2124.1 747.8 747.8
Peak Outflow
(cfs) NA 95.1 217.6 NA NA NA 327.3
Minimum
Freeboard (ft) 1.1 2.8 0.9 0.8 1.4 11.0 2.3
Cell 2Cell 1 Cell 3
BC-Unit 5-6-0008
Buck Steam Station Hydrologic Analysis Submission: 4/20/12 Rowan County, NC Page 20
with the least amount of freeboard are the Additional Primary in Cell 1 and the Basin 2 to Basin 3,
Divider, and Main in Cell 2. In each of these instances, the dams have adjacent dense vegetation that
was observed during the field reconnaissance and the 2010 aerial imagery from NCFMP. In the case of
Cell 2, where the Basin 2 to Basin 3 and Divider dams have less than one foot of freeboard, there is
substantial vegetation consisting of stands of large trees. The effective flow path of any wave within Cell
2 would travel a greater distance through this dense vegetation than the fetch length over open water
for the wave setup. As such, it is reasonable to assume any waves formed over the open water portion
of the ponds would be decayed before reaching the embankment.
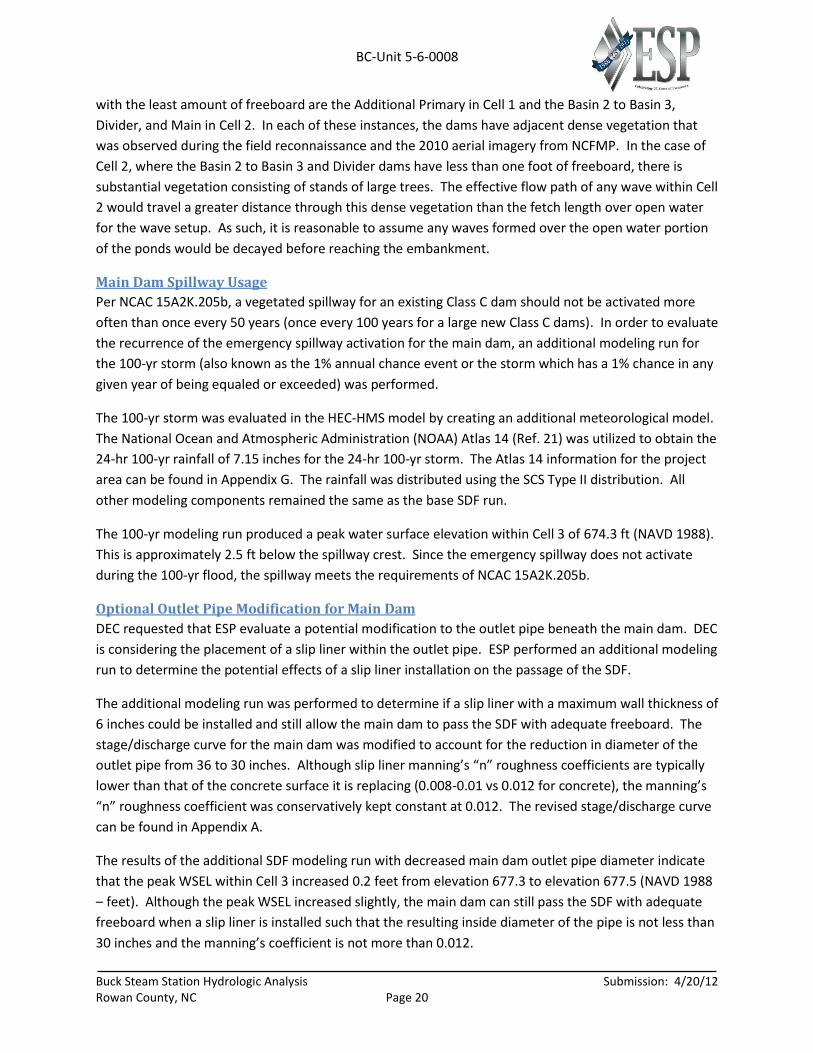
Main Dam Spillway Usage
Per NCAC 15A2K.205b, a vegetated spillway for an existing Class C dam should not be activated more
often than once every 50 years (once every 100 years for a large new Class C dams). In order to evaluate
the recurrence of the emergency spillway activation for the main dam, an additional modeling run for
the 100-yr storm (also known as the 1% annual chance event or the storm which has a 1% chance in any
given year of being equaled or exceeded) was performed.
The 100-yr storm was evaluated in the HEC-HMS model by creating an additional meteorological model.
The National Ocean and Atmospheric Administration (NOAA) Atlas 14 (Ref. 21) was utilized to obtain the
24-hr 100-yr rainfall of 7.15 inches for the 24-hr 100-yr storm. The Atlas 14 information for the project
area can be found in Appendix G. The rainfall was distributed using the SCS Type II distribution. All
other modeling components remained the same as the base SDF run.
The 100-yr modeling run produced a peak water surface elevation within Cell 3 of 674.3 ft (NAVD 1988).
This is approximately 2.5 ft below the spillway crest. Since the emergency spillway does not activate
during the 100-yr flood, the spillway meets the requirements of NCAC 15A2K.205b.
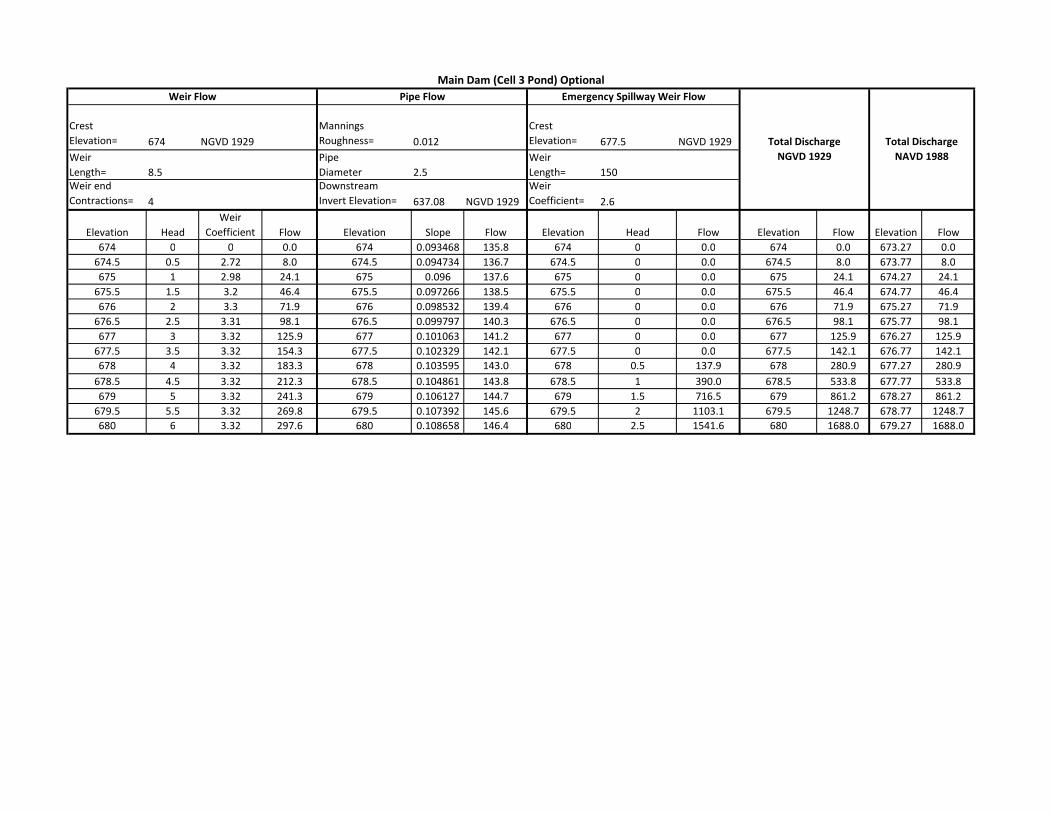
Optional Outlet Pipe Modification for Main Dam
DEC requested that ESP evaluate a potential modification to the outlet pipe beneath the main dam. DEC
is considering the placement of a slip liner within the outlet pipe. ESP performed an additional modeling
run to determine the potential effects of a slip liner installation on the passage of the SDF.
The additional modeling run was performed to determine if a slip liner with a maximum wall thickness of
6 inches could be installed and still allow the main dam to pass the SDF with adequate freeboard. The
stage/discharge curve for the main dam was modified to account for the reduction in diameter of the
outlet pipe from 36 to 30 inches. Although slip liner manning’s “n” roughness coefficients are typically
lower than that of the concrete surface it is replacing (0.008-0.01 vs 0.012 for concrete), the manning’s
“n” roughness coefficient was conservatively kept constant at 0.012. The revised stage/discharge curve
can be found in Appendix A.
The results of the additional SDF modeling run with decreased main dam outlet pipe diameter indicate
that the peak WSEL within Cell 3 increased 0.2 feet from elevation 677.3 to elevation 677.5 (NAVD 1988
– feet). Although the peak WSEL increased slightly, the main dam can still pass the SDF with adequate
freeboard when a slip liner is installed such that the resulting inside diameter of the pipe is not less than
30 inches and the manning’s coefficient is not more than 0.012.

BC-Unit 5-6-0008
Buck Steam Station Hydrologic Analysis Submission: 4/20/12 Rowan County, NC Page 21
Conclusions The HEC-HMS model used in this analysis was developed using information obtained during the review
of available data. The developed model is deemed a reasonable estimation of the existing condition for
the project area. The analysis was performed using conservative assumptions where appropriate for
hydrologic parameter calculation and hydraulic capacity of the outlet structures. Based on the results of
this analysis, the additional primary, primary, and secondary pond system at the DEC Buck steam station
can safely pass the 6-hr ¾ PMF without any required remediation actions.
References 1. North Carolina Administrative Code – Title 15A Department of Environment and Natural
Resources of Subchapter 2K – Dam Safety. http://portal.ncdenr.org/web/lr/dams
2. North Carolina Statewide Orthoimagery 2010. North Carolina Center for Geographic
Information and Analysis. North Carolina 911 Board and City of Durham Emergency
Communications Center. September 2011.
http://data.nconemap.com/geoportal/catalog/main/home.page
3. Duke Energy Corporation Calculation # BC-0238. Buck Steam Station – Units 3-6. ¾ PMP Study
and supporting calculations. August 23, 1985. Provided by Duke Energy Corporation January 27,
2012.
4. Duke Energy Corporation Buck Steam Station Design Plans. 1956, 1977, 1979, and 1982.
Drawing numbers 3039-d, 3039-d-01, 3039-d-02, 3039-e, 3039-f, b-3066, b-3066-a, b-3066-b, b-
3066-c, b-3066-d. Provided by Duke Energy Corporation January 25, 2012.
5. Topographic Survey of Buck Station Ash Pond. Duke Energy Corporation. Developed by McKim
& Creed, June 18, 2004. Provided by Duke Energy Corporation January 25, 2012.
6. Topographic Map of Buck Steam Station. Duke Energy Corporation. Developed by Aero-
Dynamics, Corp. January 25, 1993. Provided by Duke Energy Corporation January 25, 2012.
7. North Carolina Floodplain Mapping: Yadkin River Basin; LIDAR Bare Earth Mass Points, Feb-Apr
and Dec 2003. Floodplain Mapping Program, North Carolina Division of Emergency
Management. Available at http://www.ncfloodmaps.com
8. United States Department of Agriculture. Natural Resources Conservation Service. Soil Survey
Geographic (SSURGO) Database. http://soils.usda.gov/survey/geography/ssurgo/
9. Mobile LIDAR Scan of Buck Steam Station Dam Embankments. Collected by ESP Associates, P.A.
March 8, 2012.
10. Urban Hydrology for Small Watersheds. TR-55. USDA. NRCS. Conservation Engineering
Division. June 1986.
http://www.nrcs.usda.gov/wps/portal/nrcs/detailfull/national/technical/alphabetical/water/hy
drology/?&cid=stelprdb1042925
11. ESRI ArcHydro Hydro Data Model for ArcGIS. March 25, 2010.
http://support.esri.com/en/downloads/datamodel/detail/15
12. Web Soil Survey for Project Area. USDA. NRCS. May 28, 2009.
http://websoilsurvey.nrcs.usda.gov/app/WebSoilSurvey.aspx

BC-Unit 5-6-0008
Buck Steam Station Hydrologic Analysis Submission: 4/20/12 Rowan County, NC Page 22
13. WinTR-55 User Guide. Small Watershed Hydrology. January 2009. USDA. NRCS.
http://www.nrcs.usda.gov/wps/portal/nrcs/detailfull/national/technical/alphabetical/water/hy
drology/?&cid=stelprdb1042901
14. Probable Maximum Precipitation Estimates, United States East of the 105th Meridian.
Hydrometeorological Report No. 51. NOAA. June 1978.
http://www.nws.noaa.gov/oh/hdsc/studies/pmp.html#PMP_documents
15. Application of Probable Maximum Precipitation Estimates – United States East of the 105th
Meridian. Hydrometeorological Report No. 52. NOAA. August 1982.
http://www.nws.noaa.gov/oh/hdsc/studies/pmp.html#PMP_documents
16. HMR52 Probable Maximum Storm (Eastern United States) User’s Manual. USACE, Hydrologic
Engineering Center. March 1984.
17. USACE Hydrologic Engineering Center Hydrologic Modeling System (HEC-HMS) User’s Manual.
Version 3.4, August 2009. http://www.hec.usace.army.mil/software/hec-hms/
18. USACE Engineer Manual 1110-2-1420. Hydrologic Engineering Requirements for Reservoirs.
October 31, 1997.
19. USACE Engineer Manual 1110-2-1414. Water Levels and Wave Heights for Coastal Engineering
Design. July 5, 1989.
20. Shore Protection Manual. Coastal Engineering Research Center. USACE. 1984.
21. NOAA Atlas 14 Precipitation-Frequency Atlas of the United States. Volume 2 Version 3.0. 2006.
http://hdsc.nws.noaa.gov/hdsc/pfds/index.html

BC-Unit 5-6-0008
Appendix A
USDA Soil Report
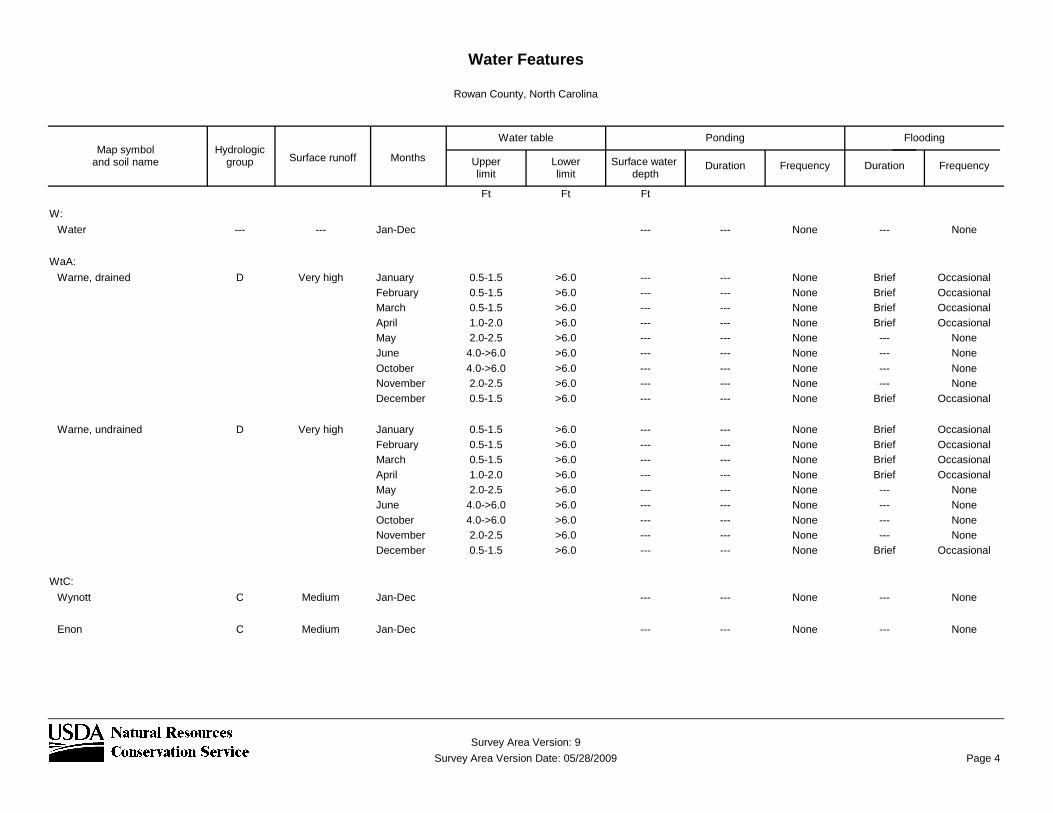
Water Features
Rowan County, North Carolina
Map symboland soil name
[Depths of layers are in feet. See text for definitions of terms used in this table. Estimates of the frequency of ponding and flooding apply to the whole year rather than to individual months. Absence of an entry indicates that the feature is not a concern or that data were not estimated. This report shows only the major soils in each map unit]
Surface water depth
Duration Frequency
FloodingPondingWater tableHydrologic
group Upperlimit
Lowerlimit
Ft
Months
Ft Ft
Duration FrequencySurface runoff
ArA:
Armenia, undrained D Negligible --- Rare Brief Frequent---January 0.5-1.5 >6.0--- Rare Brief Frequent---February 0.5-1.5 >6.0--- Rare Brief Frequent---March 0.5-1.5 >6.0--- Rare Brief Frequent---April 1.0-2.5 >6.0--- Rare Brief Frequent---May 1.5-4.0 >6.0--- Rare Brief Frequent---June 4.0-5.0 >6.0--- Rare --- None---July --- ------ Rare --- None---August --- ------ Rare --- None---September --- ------ Rare --- None---October 4.0-5.0 >6.0--- Rare Brief Frequent---November 0.5-1.5 >6.0--- Rare Brief Frequent---December 0.5-1.5 >6.0
CcB:
Cecil B Medium --- None --- None---Jan-Dec
CcC:
Cecil B Medium --- None --- None---Jan-Dec
CeB2:
Cecil, moderately eroded B Medium --- None --- None---Jan-Dec
CeC2:
Cecil, moderately eroded B Medium --- None --- None---Jan-Dec
Page 1
Survey Area Version: 9
Survey Area Version Date: 05/28/2009
mdudley
Typewritten Text
BC-Unit 5-6-0008
mdudley
Typewritten Text
mdudley
Typewritten Text
Water Features
Rowan County, North Carolina
Map symboland soil name Surface water
depthDuration Frequency
FloodingPondingWater tableHydrologic
group Upperlimit
Lowerlimit
Ft
Months
Ft Ft
Duration FrequencySurface runoff
ChA:
Chewacla C Very high --- None Brief Frequent---January 0.5-2.0 >6.0--- None Brief Frequent---February 0.5-2.0 >6.0--- None Brief Frequent---March 0.5-2.0 >6.0--- None Brief Frequent---April 1.0-2.5 >6.0--- None Brief Frequent---May 1.5-4.0 >6.0--- None Brief Frequent---June 4.0-5.0 >6.0--- None --- None---October 4.0-5.0 >6.0--- None Brief Frequent---November 1.0-2.5 >6.0--- None Brief Frequent---December 0.5-2.0 >6.0
DAM:
Dam --- --- --- None --- None---Jan-Dec
EnB:
Enon C Medium --- None --- None---Jan-Dec
EnC:
Enon C Medium --- None --- None---Jan-Dec
LcD:
Lloyd B High --- None --- None---Jan-Dec
LdB2:
Lloyd, moderately eroded B Low --- None --- None---Jan-Dec
LdC2:
Lloyd, moderately eroded B Medium --- None --- None---Jan-Dec
MbC:
Mecklenburg C Medium --- None --- None---Jan-Dec
Page 2
Survey Area Version: 9
Survey Area Version Date: 05/28/2009
mdudley
Typewritten Text
BC-Unit 5-6-0008

Water Features
Rowan County, North Carolina
Map symboland soil name Surface water
depthDuration Frequency
FloodingPondingWater tableHydrologic
group Upperlimit
Lowerlimit
Ft
Months
Ft Ft
Duration FrequencySurface runoff
MeB2:
Mecklenburg, moderately eroded
C Medium --- None --- None---Jan-Dec
MeC2:
Mecklenburg, moderately eroded
C Medium --- None --- None---Jan-Dec
PaD:
Pacolet B High --- None --- None---Jan-Dec
PaE:
Pacolet B High --- None --- None---Jan-Dec
PcB2:
Pacolet, moderately eroded B Medium --- None --- None---Jan-Dec
PcC2:
Pacolet, moderately eroded B Medium --- None --- None---Jan-Dec
PxD:
Poindexter B High --- None --- None---Jan-Dec
Rowan B High --- None --- None---Jan-Dec
Ud:
Udorthents, loamy C Medium --- None --- None---Jan-Dec
VnB2:
Vance, moderately eroded C Medium --- None --- None---Jan-Dec
Page 3
Survey Area Version: 9
Survey Area Version Date: 05/28/2009
mdudley
Typewritten Text
BC-Unit 5-6-0008
Water Features
Rowan County, North Carolina
Map symboland soil name Surface water
depthDuration Frequency
FloodingPondingWater tableHydrologic
group Upperlimit
Lowerlimit
Ft
Months
Ft Ft
Duration FrequencySurface runoff
W:
Water --- --- --- None --- None---Jan-Dec
WaA:
Warne, drained D Very high --- None Brief Occasional---January 0.5-1.5 >6.0--- None Brief Occasional---February 0.5-1.5 >6.0--- None Brief Occasional---March 0.5-1.5 >6.0--- None Brief Occasional---April 1.0-2.0 >6.0--- None --- None---May 2.0-2.5 >6.0--- None --- None---June 4.0->6.0 >6.0--- None --- None---October 4.0->6.0 >6.0--- None --- None---November 2.0-2.5 >6.0--- None Brief Occasional---December 0.5-1.5 >6.0
Warne, undrained D Very high --- None Brief Occasional---January 0.5-1.5 >6.0--- None Brief Occasional---February 0.5-1.5 >6.0--- None Brief Occasional---March 0.5-1.5 >6.0--- None Brief Occasional---April 1.0-2.0 >6.0--- None --- None---May 2.0-2.5 >6.0--- None --- None---June 4.0->6.0 >6.0--- None --- None---October 4.0->6.0 >6.0--- None --- None---November 2.0-2.5 >6.0--- None Brief Occasional---December 0.5-1.5 >6.0
WtC:
Wynott C Medium --- None --- None---Jan-Dec
Enon C Medium --- None --- None---Jan-Dec
Page 4
Survey Area Version: 9
Survey Area Version Date: 05/28/2009
mdudley
Typewritten Text
BC-Unit 5-6-0008
mdudley
Typewritten Text
mdudley
Typewritten Text

BC-Unit 5-6-0008
Appendix B
WinTR-55 Output
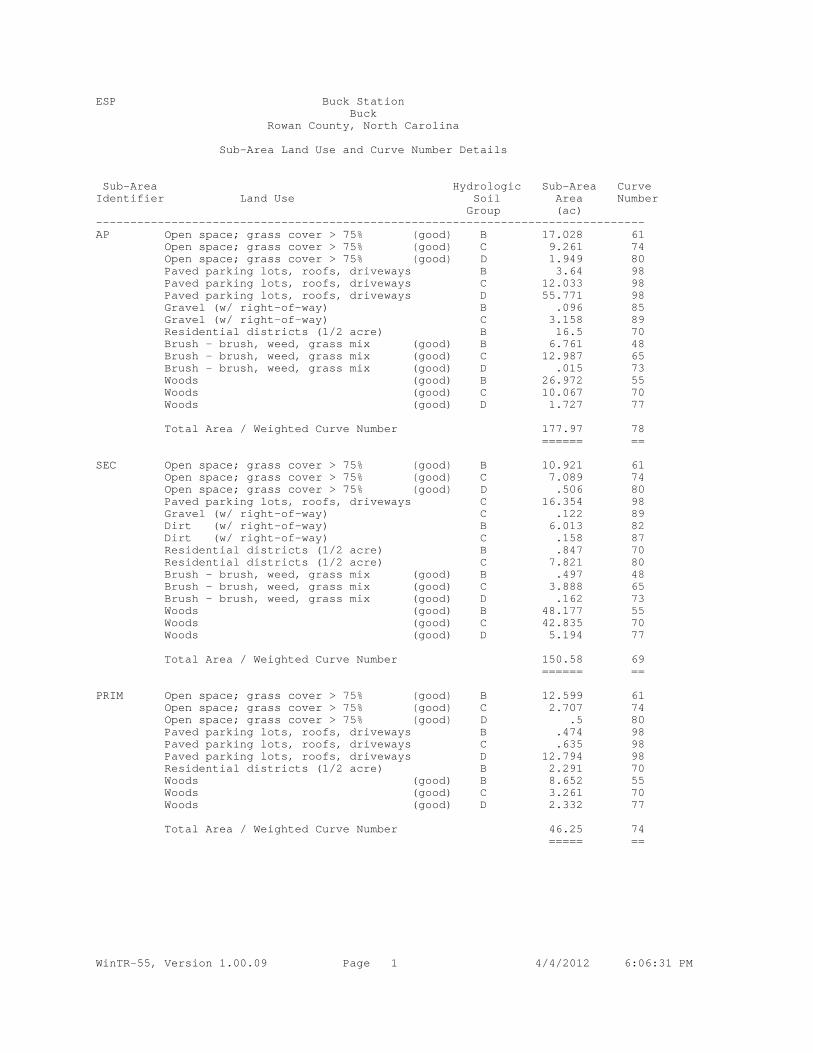
ESP Buck Station Buck Rowan County, North Carolina
Sub-Area Land Use and Curve Number Details
Sub-Area Hydrologic Sub-Area CurveIdentifier Land Use Soil Area Number Group (ac)--------------------------------------------------------------------------------AP Open space; grass cover > 75% (good) B 17.028 61 Open space; grass cover > 75% (good) C 9.261 74 Open space; grass cover > 75% (good) D 1.949 80 Paved parking lots, roofs, driveways B 3.64 98 Paved parking lots, roofs, driveways C 12.033 98 Paved parking lots, roofs, driveways D 55.771 98 Gravel (w/ right-of-way) B .096 85 Gravel (w/ right-of-way) C 3.158 89 Residential districts (1/2 acre) B 16.5 70 Brush - brush, weed, grass mix (good) B 6.761 48 Brush - brush, weed, grass mix (good) C 12.987 65 Brush - brush, weed, grass mix (good) D .015 73 Woods (good) B 26.972 55 Woods (good) C 10.067 70 Woods (good) D 1.727 77
Total Area / Weighted Curve Number 177.97 78 ====== ==
SEC Open space; grass cover > 75% (good) B 10.921 61 Open space; grass cover > 75% (good) C 7.089 74 Open space; grass cover > 75% (good) D .506 80 Paved parking lots, roofs, driveways C 16.354 98 Gravel (w/ right-of-way) C .122 89 Dirt (w/ right-of-way) B 6.013 82 Dirt (w/ right-of-way) C .158 87 Residential districts (1/2 acre) B .847 70 Residential districts (1/2 acre) C 7.821 80 Brush - brush, weed, grass mix (good) B .497 48 Brush - brush, weed, grass mix (good) C 3.888 65 Brush - brush, weed, grass mix (good) D .162 73 Woods (good) B 48.177 55 Woods (good) C 42.835 70 Woods (good) D 5.194 77
Total Area / Weighted Curve Number 150.58 69 ====== ==
PRIM Open space; grass cover > 75% (good) B 12.599 61 Open space; grass cover > 75% (good) C 2.707 74 Open space; grass cover > 75% (good) D .5 80 Paved parking lots, roofs, driveways B .474 98 Paved parking lots, roofs, driveways C .635 98 Paved parking lots, roofs, driveways D 12.794 98 Residential districts (1/2 acre) B 2.291 70 Woods (good) B 8.652 55 Woods (good) C 3.261 70 Woods (good) D 2.332 77
Total Area / Weighted Curve Number 46.25 74 ===== ==
WinTR-55, Version 1.00.09 Page 1 4/4/2012 6:06:31 PM
mdudley
Typewritten Text
BC-Unit 5-6-0008
mdudley
Typewritten Text

BC-Unit 5-6-0008
Appendix C
Time of Concentration Calculations
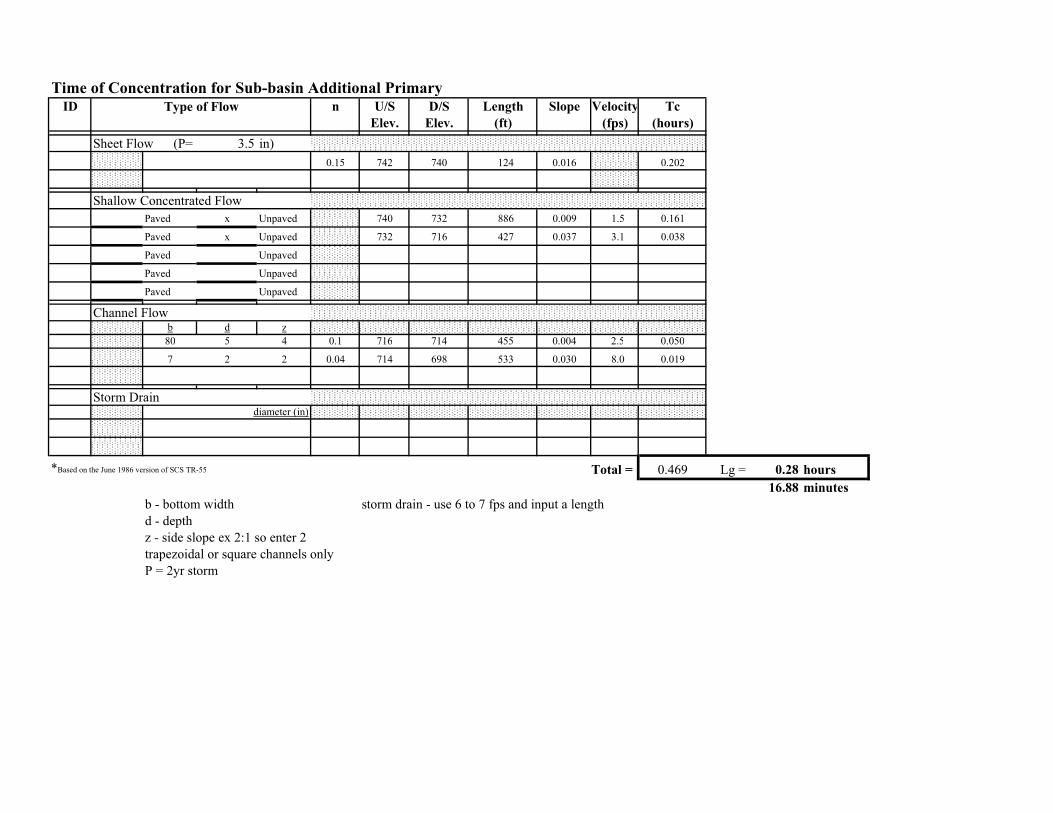
ID Type of Flow n U/S D/S Length Slope Velocity TcElev. Elev. (ft) (fps) (hours)
Sheet Flow (P= 3.5 in)0.15 742 740 124 0.016 0.202
Shallow Concentrated FlowPaved x Unpaved 740 732 886 0.009 1.5 0.161Paved x Unpaved 732 716 427 0.037 3.1 0.038Paved Unpaved Paved Unpaved Paved Unpaved
Channel Flowb d z80 5 4 0.1 716 714 455 0.004 2.5 0.0507 2 2 0.04 714 698 533 0.030 8.0 0.019
Storm Draindiameter (in)
*Based on the June 1986 version of SCS TR-55 Total = 0.469 Lg = 0.28 hours16.88 minutes
b - bottom width storm drain - use 6 to 7 fps and input a lengthd - depthz - side slope ex 2:1 so enter 2trapezoidal or square channels onlyP = 2yr storm
mdudley
Typewritten Text
BC-Unit 5-6-0008
mdudley
Typewritten Text
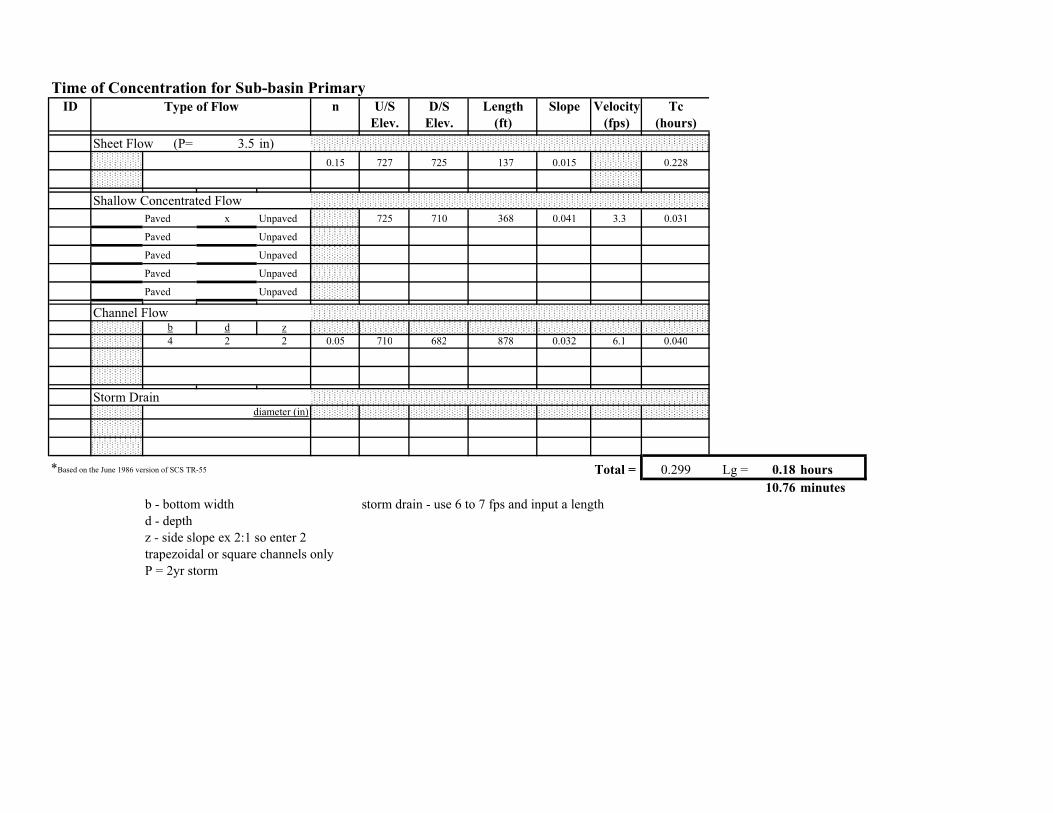
ID Type of Flow n U/S D/S Length Slope Velocity TcElev. Elev. (ft) (fps) (hours)
Sheet Flow (P= 3.5 in)0.15 727 725 137 0.015 0.228
Shallow Concentrated FlowPaved x Unpaved 725 710 368 0.041 3.3 0.031Paved Unpaved Paved Unpaved Paved Unpaved Paved Unpaved
Channel Flowb d z4 2 2 0.05 710 682 878 0.032 6.1 0.040
Storm Draindiameter (in)
*Based on the June 1986 version of SCS TR-55 Total = 0.299 Lg = 0.18 hours10.76 minutes
b - bottom width storm drain - use 6 to 7 fps and input a lengthd - depthz - side slope ex 2:1 so enter 2trapezoidal or square channels onlyP = 2yr storm
mdudley
Typewritten Text
BC-Unit 5-6-0008
mdudley
Typewritten Text
ID Type of Flow n U/S D/S Length Slope Velocity TcElev. Elev. (ft) (fps) (hours)
Sheet Flow (P= 3.5 in)0.15 709 707 133 0.015 0.220
Shallow Concentrated FlowPaved x Unpaved 707 702 341 0.015 2.0 0.048Paved Unpaved Paved Unpaved Paved Unpaved Paved Unpaved
Channel Flowb d z3 1 2 0.05 702 676 734 0.035 4.3 0.048
Storm Draindiameter (in)
*Based on the June 1986 version of SCS TR-55 Total = 0.316 Lg = 0.19 hours11.37 minutes
b - bottom width storm drain - use 6 to 7 fps and input a lengthd - depthz - side slope ex 2:1 so enter 2trapezoidal or square channels onlyP = 2yr storm
mdudley
Typewritten Text
BC-Unit 5-6-0008
mdudley
Typewritten Text
mdudley
Typewritten Text

BC-Unit 5-6-0008
Appendix D
HMR-52 Output
BC-Unit 5-6-00081***************************************** *************************************** * * * * * PROBABLE MAXIMUM STORM (HMR52) * * U.S. ARMY CORPS OF ENGINEERS * * NOVEMBER 1982 * * THE HYDROLOGIC ENGINEERING CENTER * * REVISED APRIL 91 * * 609 SECOND STREET * * * * DAVIS, CALIFORNIA 95616 * * RUN DATE 03/14/2012 TIME 21:10:30 * * (916) 551-1748 OR (FTS) 460-1748 * * * * * ***************************************** ***************************************
H H M M RRRRRR 5555555 22222 H H MM MM R R 5 2 2 H H M M M M R R 5 2 HHHHHHH M M M RRRRRR 555555 2 H H M M R R 5 2 H H M M R R 5 5 2 H H M M R R 55555 2222222 1 HEC PROBABLE MAXIMUM STORM (HMR52) INPUT DATA PAGE 1 LINE ID.......1.......2.......3.......4.......5.......6.......7.......8.......9......10 1 ID PMS FOR BUCK STATION DAMS 2 ID ESP ASSOCIATES 3 ID RALEIGH, NC 4 ID WATERSHED OBTAINED FROM Arc-HYDRO TOOLS AND GENERALIZED TO LIMIT VERTI 5 BN BUCK 6 BS 1 7 BX 301.93 301.96 302.23 302.24 302.22 302.24 302.25 302.33 302.25 302.22 8 BX 302.17 302.16 302.19 302.20 302.17 302.17 302.20 302.15 302.11 302.12 9 BX 302.08 301.96 301.93 301.91 301.87 301.87 301.84 301.86 301.85 301.86 10 BX 301.84 301.81 301.80 301.77 301.72 301.72 301.68 301.63 301.52 301.55 11 BX 301.56 301.50 301.50 301.48 301.50 301.53 301.51 301.51 301.53 301.66 12 BX 301.72 301.76 301.75 301.80 301.79 301.81 301.81 301.87 301.93 13 BY 135.80 135.78 135.66 135.60 135.59 135.57 135.49 135.34 135.22 135.21 14 BY 135.23 135.19 135.17 135.15 135.11 135.08 135.06 135.03 135.02 134.99 15 BY 134.94 134.97 135.01 134.90 134.87 134.81 134.77 134.72 134.71 134.69 16 BY 134.69 134.64 134.64 134.56 134.61 134.68 134.66 134.68 134.64 134.68 17 BY 134.71 134.78 134.94 134.99 135.14 135.17 135.21 135.37 135.40 135.47 18 BY 135.46 135.44 135.51 135.56 135.59 135.61 135.66 135.70 135.80 19 HO 208 20 HP 10 29.6 35.1 39.9 44.0 46.2 21 HP 200 21.4 25.6 30.0 34.0 35.9 22 HP 1000 15.6 20.4 25.5 28.3 29.8 23 HP 5000 9.2 13.1 17.0 21.0 22.1 24 HP 10000 7.1 10.4 14.0 17.8 19.5 25 HP 20000 5.1 8.3 11.3 14.8 16.6 26 SA 0 0 27 ST 15 0.283 28 PU ON 29 ZZ 1***************************************** *************************************** * * * * * PROBABLE MAXIMUM STORM (HMR52) * * U.S. ARMY CORPS OF ENGINEERS * * NOVEMBER 1982 * * THE HYDROLOGIC ENGINEERING CENTER * * REVISED APRIL 91 * * 609 SECOND STREET * * * * DAVIS, CALIFORNIA 95616 *
Page 1
BC-Unit 5-6-0008 * RUN DATE 03/14/2012 TIME 21:10:30 * * (916) 551-1748 OR (FTS) 460-1748 * * * * * ***************************************** ***************************************
PMS FOR BUCK STATION DAMS ESP ASSOCIATES RALEIGH, NC WATERSHED OBTAINED FROM Arc-HYDRO TOOLS AND GENERALIZED TO LIMIT VERTI
PMP DEPTHS FROM HMR 51 AREA DURATION (SQ. MI.) 6-HR 12-HR 24-HR 48-HR 72-HR 10. 29.60 35.10 39.90 44.00 46.20 200. 21.40 25.60 30.00 34.00 35.90 1000. 15.60 20.40 25.50 28.30 29.80 5000. 9.20 13.10 17.00 21.00 22.10 10000. 7.10 10.40 14.00 17.80 19.50 20000. 5.10 8.30 11.30 14.80 16.60
STORM AREA PMP DEPTHS FOR 6-HOUR INCREMENTS 10. 29.49 5.69 2.75 1.83 1.37 1.10 .92 .79 .69 .61 .55 .50 25. 27.58 5.38 2.68 1.80 1.35 1.09 .91 .78 .68 .61 .55 .50 50. 25.98 5.14 2.62 1.77 1.34 1.08 .90 .77 .68 .60 .54 .50 100. 23.64 4.79 2.52 1.72 1.31 1.06 .89 .76 .67 .60 .54 .49 175. 21.74 4.53 2.45 1.69 1.29 1.04 .88 .75 .66 .59 .53 .49 300. 19.81 4.72 2.42 1.64 1.24 1.00 .84 .72 .63 .56 .51 .46 450. 18.34 4.96 2.41 1.61 1.21 .97 .81 .69 .61 .54 .49 .44 700. 16.72 5.25 2.39 1.56 1.17 .93 .77 .66 .58 .51 .46 .42 1000. 15.43 5.45 2.37 1.53 1.14 .90 .75 .64 .56 .50 .45 .41 1500. 13.84 5.12 2.33 1.53 1.14 .91 .75 .65 .56 .50 .45 .41 2150. 12.42 4.84 2.30 1.52 1.14 .91 .76 .65 .57 .51 .46 .41 3000. 11.09 4.60 2.26 1.51 1.14 .91 .76 .65 .57 .51 .46 .42 4500. 9.50 4.27 2.21 1.51 1.14 .92 .77 .66 .58 .52 .47 .43 6500. 8.30 3.90 2.15 1.49 1.14 .93 .78 .67 .59 .53 .48 .44 10000. 7.02 3.44 2.06 1.47 1.15 .94 .80 .69 .61 .55 .49 .45 15000. 5.89 3.25 1.95 1.40 1.09 .89 .76 .66 .58 .52 .47 .43 20000. 5.08 3.10 1.88 1.35 1.05 .86 .73 .64 .56 .50 .46 .421
BOUNDARY COORDINATES FOR BUCK X 301.9 302.0 302.2 302.2 302.2 302.2 302.3 302.3 302.3 302.2 Y 135.8 135.8 135.7 135.6 135.6 135.6 135.5 135.3 135.2 135.2 X 302.2 302.2 302.2 302.2 302.2 302.2 302.2 302.1 302.1 302.1 Y 135.2 135.2 135.2 135.1 135.1 135.1 135.1 135.0 135.0 135.0 X 302.1 302.0 301.9 301.9 301.9 301.9 301.8 301.9 301.9 301.9 Y 134.9 135.0 135.0 134.9 134.9 134.8 134.8 134.7 134.7 134.7 X 301.8 301.8 301.8 301.8 301.7 301.7 301.7 301.6 301.5 301.5 Y 134.7 134.6 134.6 134.6 134.6 134.7 134.7 134.7 134.6 134.7
Page 2
BC-Unit 5-6-0008 X 301.6 301.5 301.5 301.5 301.5 301.5 301.5 301.5 301.5 301.7 Y 134.7 134.8 134.9 135.0 135.1 135.2 135.2 135.4 135.4 135.5 X 301.7 301.8 301.8 301.8 301.8 301.8 301.8 301.9 301.9 Y 135.5 135.4 135.5 135.6 135.6 135.6 135.7 135.7 135.8
SCALE = 1.0000 MILES PER COORDINATE UNIT BASIN AREA = .6 SQ. MI. BASIN CENTROID COORDINATES, X = 301.9, Y = 135.21
VARYING STORM AREA SIZE AND FIXED ORIENTATION SUM OF DEPTHS ORIEN- FOR 3 PEAK STORM AREA TATION BASIN-AVERAGED INCREMENTAL DEPTHS FOR 6-HR PERIODS 6-HR PERIODS 10. 210. 29.49 5.69 2.75 1.83 1.37 1.10 .92 .79 .69 .61 .55 .50 37.92 25. 210. 28.13 5.54 2.70 1.80 1.35 1.09 .91 .78 .68 .61 .55 .50 36.38 50. 210. 27.54 5.43 2.66 1.77 1.34 1.08 .90 .77 .68 .60 .54 .50 35.63 100. 210. 26.48 5.18 2.58 1.72 1.31 1.06 .89 .76 .67 .60 .54 .49 34.24 175. 210. 25.87 4.98 2.51 1.69 1.29 1.04 .88 .75 .66 .59 .53 .49 33.37 300. 210. 24.96 5.26 2.51 1.64 1.24 1.00 .84 .72 .63 .56 .51 .46 32.72 450. 210. 24.21 5.60 2.50 1.61 1.21 .97 .81 .69 .61 .54 .49 .44 32.31 700. 210. 23.41 6.01 2.49 1.56 1.17 .93 .77 .66 .58 .51 .46 .42 31.91 1000. 210. 22.99 6.33 2.48 1.53 1.14 .90 .75 .64 .56 .50 .45 .41 31.80 1500. 210. 22.42 6.00 2.45 1.53 1.14 .91 .75 .65 .56 .50 .45 .41 30.86 2150. 210. 21.85 5.74 2.42 1.52 1.14 .91 .76 .65 .57 .51 .46 .41 30.01 3000. 210. 21.19 5.49 2.39 1.51 1.14 .91 .76 .65 .57 .51 .46 .42 29.07 4500. 210. 20.14 5.16 2.35 1.51 1.14 .92 .77 .66 .58 .52 .47 .43 27.65 6500. 210. 19.35 4.76 2.29 1.49 1.14 .93 .78 .67 .59 .53 .48 .44 26.39 10000. 210. 18.40 4.27 2.20 1.47 1.15 .94 .80 .69 .61 .55 .49 .45 24.86 15000. 210. 17.07 4.06 2.09 1.40 1.09 .89 .76 .66 .58 .52 .47 .43 23.22 20000. 210. 15.86 3.91 2.02 1.35 1.05 .86 .73 .64 .56 .50 .46 .42 21.79
FIXED STORM AREA SIZE AND VARYING ORIENTATION SUM OF DEPTHS ORIEN- FOR 3 PEAK STORM AREA TATION BASIN-AVERAGED INCREMENTAL DEPTHS FOR 6-HR PERIODS 6-HR PERIODS 10. 140. 29.49 5.69 2.75 1.83 1.37 1.10 .92 .79 .69 .61 .55 .50 37.92 10. 150. 29.49 5.69 2.75 1.83 1.37 1.10 .92 .79 .69 .61 .55 .50 37.92 10. 160. 29.49 5.69 2.75 1.83 1.37 1.10 .92 .79 .69 .61 .55 .50 37.92 10. 170. 29.49 5.69 2.75 1.83 1.37 1.10 .92 .79 .69 .61 .55 .50 37.92 10. 180. 29.49 5.69 2.75 1.83 1.37 1.10 .92 .79 .69 .61 .55 .50 37.92 10. 190. 29.49 5.69 2.75 1.83 1.37 1.10 .92 .79 .69 .61 .55 .50 37.92 10. 200. 29.49 5.69 2.75 1.83 1.37 1.10 .92 .79 .69 .61 .55 .50 37.92 10. 210. 29.49 5.69 2.75 1.83 1.37 1.10 .92 .79 .69 .61 .55 .50 37.92 10. 220. 29.49 5.69 2.75 1.83 1.37 1.10 .92 .79 .69 .61 .55 .50 37.92 10. 230. 29.49 5.69 2.75 1.83 1.37 1.10 .92 .79 .69 .61 .55 .50 37.92 10. 240. 29.49 5.69 2.75 1.83 1.37 1.10 .92 .79 .69 .61 .55 .50 37.92 10. 250. 29.49 5.69 2.75 1.83 1.37 1.10 .92 .79 .69 .61 .55 .50 37.92 10. 260. 29.49 5.69 2.75 1.83 1.37 1.10 .92 .79 .69 .61 .55 .50 37.92 10. 270. 29.49 5.69 2.75 1.83 1.37 1.10 .92 .79 .69 .61 .55 .50 37.92 10. 280. 29.49 5.69 2.75 1.83 1.37 1.10 .92 .79 .69 .61 .55 .50 37.92 10. 290. 29.49 5.69 2.75 1.83 1.37 1.10 .92 .79 .69 .61 .55 .50 37.92
Page 3

BC-Unit 5-6-0008 10. 300. 29.49 5.69 2.75 1.83 1.37 1.10 .92 .79 .69 .61 .55 .50 37.92 10. 310. 29.49 5.69 2.75 1.83 1.37 1.10 .92 .79 .69 .61 .55 .50 37.92 10. 155. 29.49 5.69 2.75 1.83 1.37 1.10 .92 .79 .69 .61 .55 .50 37.92 10. 165. 29.49 5.69 2.75 1.83 1.37 1.10 .92 .79 .69 .61 .55 .50 37.921
PROBABLE MAXIMUM STORM FOR BUCK STORM AREA = 10. SQ. MI., ORIENTATION = 160., PREFERRED ORIENTATION = 208. STORM CENTER COORDINATES, X = 301.9, Y = 135.2 AREA ISOHYET WITHIN AREA BASIN DEPTHS (INCHES) FOR 6-HOUR INCREMENTS OF PMS (SQ.MI.) (SQ.MI.) 1 2 3 4 5 6 7 8 9 10 11 12 A 10. 1. 29.49 5.69 2.75 1.83 1.37 1.10 .92 .79 .69 .61 .55 .50 B 25. 1. 18.87 3.64 1.79 1.19 .89 .72 .60 .51 .45 .40 .36 .33 C 50. 1. 14.15 2.73 1.32 .88 .66 .53 .44 .38 .33 .29 .27 .24 D 100. 1. 11.21 2.22 1.07 .71 .54 .43 .36 .31 .27 .24 .22 .20 E 175. 1. 8.85 1.71 .82 .55 .41 .33 .28 .24 .21 .18 .17 .15 F 300. 1. 7.08 1.36 .66 .44 .33 .26 .22 .19 .17 .15 .13 .12 G 450. 1. 5.60 1.14 .55 .37 .27 .22 .18 .16 .14 .12 .11 .10 H 700. 1. 4.13 .80 .38 .26 .19 .15 .13 .11 .10 .09 .08 .07 I 1000. 1. 2.95 .57 .27 .18 .14 .11 .09 .08 .07 .06 .06 .05 J 1500. 1. 1.77 .40 .18 .12 .09 .07 .06 .05 .04 .04 .04 .03 K 2150. 1. .59 .17 .08 .05 .04 .03 .03 .02 .02 .02 .02 .02 L 3000. 1. .00 .00 .00 .00 .00 .00 .00 .00 .00 .00 .00 .00 M 4500. 1. .00 .00 .00 .00 .00 .00 .00 .00 .00 .00 .00 .00 N 6500. 1. .00 .00 .00 .00 .00 .00 .00 .00 .00 .00 .00 .00 O 10000. 1. .00 .00 .00 .00 .00 .00 .00 .00 .00 .00 .00 .00 P 15000. 1. .00 .00 .00 .00 .00 .00 .00 .00 .00 .00 .00 .00 Q 25000. 1. .00 .00 .00 .00 .00 .00 .00 .00 .00 .00 .00 .00 R 40000. 1. .00 .00 .00 .00 .00 .00 .00 .00 .00 .00 .00 .00 S 60000. 1. .00 .00 .00 .00 .00 .00 .00 .00 .00 .00 .00 .00 AVERAGE DEPTH 29.49 5.69 2.75 1.83 1.37 1.10 .92 .79 .69 .61 .55 .501
TIME INTERVAL = 15. MINUTES 1-HR TO 6-HR RATIO FOR ISOHYET A AT 20000 SQ. MI. = .283
DEPTH VS. DURATION ISOHYET 5MIN 10MIN 15MIN 30MIN 1-HR 2-HR 3-HR 6-HR 12-HR 18-HR 24-HR 30-HR 36-HR 42-HR 48-HR 54-HR 60-HR 66-HR 72-HR A 1.72 3.45 5.15 9.93 15.88 20.04 23.34 29.49 35.17 37.92 39.75 41.13 42.23 43.15 43.93 44.62 45.24 45.79 46.29 B .34 .68 1.02 2.03 4.07 8.04 11.71 18.87 22.51 24.30 25.49 26.38 27.10 27.69 28.20 28.65 29.05 29.41 29.74 C .25 .51 .76 1.53 3.05 6.03 8.78 14.15 16.88 18.20 19.08 19.74 20.27 20.71 21.09 21.42 21.71 21.98 22.22 D .20 .40 .60 1.21 2.41 4.77 6.94 11.21 13.42 14.50 15.21 15.74 16.17 16.53 16.84 17.11 17.35 17.56 17.76 E .16 .32 .48 .95 1.91 3.77 5.49 8.85 10.55 11.38 11.93 12.34 12.67 12.94 13.18 13.39 13.57 13.74 13.89 F .13 .25 .38 .76 1.53 3.02 4.39 7.08 8.44 9.10 9.54 9.87 10.13 10.35 10.54 10.71 10.86 10.99 11.11 G .10 .20 .30 .60 1.20 2.38 3.47 5.60 6.74 7.29 7.66 7.93 8.15 8.33 8.49 8.63 8.75 8.86 8.96 H .07 .15 .22 .44 .89 1.76 2.56 4.13 4.92 5.31 5.57 5.76 5.91 6.04 6.15 6.25 6.33 6.41 6.48 I .05 .11 .16 .32 .64 1.26 1.83 2.95 3.52 3.79 3.98 4.11 4.22 4.31 4.39 4.46 4.52 4.58 4.63 J .03 .06 .09 .19 .38 .75 1.09 1.77 2.17 2.35 2.46 2.55 2.63 2.69 2.74 2.78 2.82 2.86 2.89 K .01 .02 .03 .06 .12 .24 .35 .59 .76 .84 .90 .94 .97 1.00 1.02 1.04 1.06 1.08 1.09 L .00 .00 .00 .00 .00 .00 .00 .00 .00 .00 .00 .00 .00 .00 .00 .00 .00 .00 .00 M .00 .00 .00 .00 .00 .00 .00 .00 .00 .00 .00 .00 .00 .00 .00 .00 .00 .00 .00 N .00 .00 .00 .00 .00 .00 .00 .00 .00 .00 .00 .00 .00 .00 .00 .00 .00 .00 .00
Page 4

BC-Unit 5-6-0008 O .00 .00 .00 .00 .00 .00 .00 .00 .00 .00 .00 .00 .00 .00 .00 .00 .00 .00 .00 P .00 .00 .00 .00 .00 .00 .00 .00 .00 .00 .00 .00 .00 .00 .00 .00 .00 .00 .00 Q .00 .00 .00 .00 .00 .00 .00 .00 .00 .00 .00 .00 .00 .00 .00 .00 .00 .00 .00 R .00 .00 .00 .00 .00 .00 .00 .00 .00 .00 .00 .00 .00 .00 .00 .00 .00 .00 .00 S .00 .00 .00 .00 .00 .00 .00 .00 .00 .00 .00 .00 .00 .00 .00 .00 .00 .00 .00 AVERAGE 1.72 3.45 5.15 9.93 15.88 20.04 23.34 29.49 35.17 37.92 39.75 41.13 42.23 43.15 43.93 44.62 45.24 45.79 46.291
PROBABLE MAXIMUM STORM FOR BUCK
DAY 1 TIME PRECIPITATION TIME PRECIPITATION TIME PRECIPITATION TIME PRECIPITATION INCR TOTAL INCR TOTAL INCR TOTAL INCR TOTAL 0015 .02 .02 0615 .03 .53 1215 .03 1.15 1815 .05 1.95 0030 .02 .04 0630 .03 .55 1230 .03 1.18 1830 .05 1.99 0045 .02 .06 0645 .03 .58 1245 .03 1.21 1845 .05 2.04 0100 .02 .08 0700 .03 .60 1300 .03 1.25 1900 .05 2.09 0115 .02 .10 0715 .03 .63 1315 .03 1.28 1915 .05 2.13 0130 .02 .13 0730 .03 .66 1330 .03 1.31 1930 .05 2.18 0145 .02 .15 0745 .03 .68 1345 .03 1.34 1945 .05 2.22 0200 .02 .17 0800 .03 .71 1400 .03 1.38 2000 .05 2.27 0215 .02 .19 0815 .03 .73 1415 .03 1.41 2015 .05 2.32 0230 .02 .21 0830 .03 .76 1430 .03 1.44 2030 .05 2.36 0245 .02 .23 0845 .03 .78 1445 .03 1.48 2045 .05 2.41 0300 .02 .25 0900 .03 .81 1500 .03 1.51 2100 .05 2.45 0315 .02 .27 0915 .03 .83 1515 .03 1.54 2115 .05 2.50 0330 .02 .29 0930 .03 .86 1530 .03 1.57 2130 .05 2.54 0345 .02 .31 0945 .03 .89 1545 .03 1.61 2145 .05 2.59 0400 .02 .33 1000 .03 .91 1600 .03 1.64 2200 .05 2.64 0415 .02 .36 1015 .03 .94 1615 .03 1.67 2215 .05 2.68 0430 .02 .38 1030 .03 .96 1630 .03 1.71 2230 .05 2.73 0445 .02 .40 1045 .03 .99 1645 .03 1.74 2245 .05 2.77 0500 .02 .42 1100 .03 1.01 1700 .03 1.77 2300 .05 2.82 0515 .02 .44 1115 .03 1.04 1715 .03 1.80 2315 .05 2.87 0530 .02 .46 1130 .03 1.06 1730 .03 1.84 2330 .05 2.91 0545 .02 .48 1145 .03 1.09 1745 .03 1.87 2345 .05 2.96 0600 .02 .50 1200 .03 1.12 1800 .03 1.90 2400 .05 3.00 6-HR TOTAL .50 .61 .79 1.101
DAY 2 TIME PRECIPITATION TIME PRECIPITATION TIME PRECIPITATION TIME PRECIPITATION INCR TOTAL INCR TOTAL INCR TOTAL INCR TOTAL 0015 .07 3.07 0615 .16 4.99 1215 .34 10.86 1815 .15 40.16 0030 .07 3.13 0630 .16 5.15 1230 .42 11.29 1830 .15 40.31 0045 .07 3.20 0645 .17 5.33 1245 .49 11.77 1845 .14 40.45 0100 .07 3.27 0700 .18 5.50 1300 .54 12.32 1900 .14 40.59 0115 .07 3.34 0715 .18 5.69 1315 .58 12.90 1915 .13 40.72 0130 .07 3.41 0730 .19 5.88 1330 .62 13.52 1930 .13 40.86 0145 .07 3.48 0745 .20 6.08 1345 .70 14.21 1945 .13 40.98 0200 .07 3.55 0800 .20 6.28 1400 .88 15.09 2000 .12 41.11 0215 .07 3.62 0815 .21 6.49 1415 .88 15.97 2015 .12 41.23 0230 .07 3.69 0830 .22 6.71 1430 1.05 17.02 2030 .12 41.34 0245 .07 3.77 0845 .23 6.94 1445 2.45 19.46 2045 .11 41.46
Page 5

BC-Unit 5-6-0008 0300 .07 3.84 0900 .23 7.17 1500 4.77 24.24 2100 .11 41.57 0315 .08 3.92 0915 .24 7.41 1515 5.15 29.39 2115 .11 41.68 0330 .08 3.99 0930 .25 7.65 1530 3.51 32.90 2130 .11 41.79 0345 .08 4.07 0945 .25 7.91 1545 1.35 34.24 2145 .10 41.89 0400 .08 4.15 1000 .26 8.17 1600 .89 35.14 2200 .10 41.99 0415 .08 4.23 1015 .27 8.44 1615 .91 36.05 2215 .10 42.09 0430 .08 4.31 1030 .28 8.71 1630 .81 36.86 2230 .10 42.19 0445 .08 4.39 1045 .28 8.99 1645 .63 37.48 2245 .10 42.29 0500 .08 4.48 1100 .29 9.28 1700 .60 38.09 2300 .10 42.38 0515 .09 4.57 1115 .30 9.58 1715 .56 38.65 2315 .09 42.48 0530 .09 4.65 1130 .31 9.89 1730 .52 39.17 2330 .09 42.57 0545 .09 4.74 1145 .31 10.20 1745 .46 39.62 2345 .09 42.66 0600 .09 4.83 1200 .32 10.52 1800 .38 40.01 2400 .09 42.76 6-HR TOTAL 1.83 5.69 29.49 2.751
DAY 3 TIME PRECIPITATION TIME PRECIPITATION TIME PRECIPITATION TIME PRECIPITATION INCR TOTAL INCR TOTAL INCR TOTAL INCR TOTAL 0015 .06 42.81 0615 .04 44.17 1215 .03 45.08 1815 .02 45.76 0030 .06 42.87 0630 .04 44.21 1230 .03 45.11 1830 .02 45.78 0045 .06 42.93 0645 .04 44.24 1245 .03 45.13 1845 .02 45.81 0100 .06 42.99 0700 .04 44.28 1300 .03 45.16 1900 .02 45.83 0115 .06 43.04 0715 .04 44.32 1315 .03 45.19 1915 .02 45.85 0130 .06 43.10 0730 .04 44.36 1330 .03 45.22 1930 .02 45.88 0145 .06 43.16 0745 .04 44.40 1345 .03 45.25 1945 .02 45.90 0200 .06 43.21 0800 .04 44.44 1400 .03 45.28 2000 .02 45.92 0215 .06 43.27 0815 .04 44.47 1415 .03 45.31 2015 .02 45.94 0230 .06 43.33 0830 .04 44.51 1430 .03 45.34 2030 .02 45.97 0245 .06 43.39 0845 .04 44.55 1445 .03 45.36 2045 .02 45.99 0300 .06 43.44 0900 .04 44.59 1500 .03 45.39 2100 .02 46.01 0315 .06 43.50 0915 .04 44.63 1515 .03 45.42 2115 .02 46.04 0330 .06 43.56 0930 .04 44.67 1530 .03 45.45 2130 .02 46.06 0345 .06 43.62 0945 .04 44.70 1545 .03 45.48 2145 .02 46.08 0400 .06 43.67 1000 .04 44.74 1600 .03 45.51 2200 .02 46.11 0415 .06 43.73 1015 .04 44.78 1615 .03 45.54 2215 .02 46.13 0430 .06 43.79 1030 .04 44.82 1630 .03 45.57 2230 .02 46.15 0445 .06 43.84 1045 .04 44.86 1645 .03 45.59 2245 .02 46.17 0500 .06 43.90 1100 .04 44.90 1700 .03 45.62 2300 .02 46.20 0515 .06 43.96 1115 .04 44.93 1715 .03 45.65 2315 .02 46.22 0530 .06 44.02 1130 .04 44.97 1730 .03 45.68 2330 .02 46.24 0545 .06 44.07 1145 .04 45.01 1745 .03 45.71 2345 .02 46.27 0600 .06 44.13 1200 .04 45.05 1800 .03 45.74 2400 .02 46.29 6-HR TOTAL 1.37 .92 .69 .551
Page 6

BC-Unit 5-6-0008
Appendix E
Stage/Discharge Calculations
CrestElevation= 705 NGVD 1929
ManningsRoughness= 0.012
Weir Length= 5
Pipe Diameter 3
Weir end Contractions= 2
Downstream Invert Elevation= 689 NGVD 1929
Elevation HeadWeir
Coefficient Flow Elevation Slope Flow Elevation Flow Elevation Flow705 0 0 0.0 705 0.095522 223.2 705 0.0 704.27 0.0
705.5 0.5 2.72 4.7 705.5 0.098507 226.7 705.5 4.7 704.77 4.7706 1 2.98 14.3 706 0.101493 230.1 706 14.3 705.27 14.3
706.5 1.5 3.2 27.6 706.5 0.104478 233.5 706.5 27.6 705.77 27.6707 2 3.3 42.9 707 0.107463 236.8 707 42.9 706.27 42.9
707.5 2.5 3.31 58.9 707.5 0.110448 240.0 707.5 58.9 706.77 58.9708 3 3.32 75.9 708 0.113433 243.3 708 75.9 707.27 75.9
708.5 3.5 3.32 93.5 708.5 0.116418 246.5 708.5 93.5 707.77 93.5709 4 3.32 111.6 709 0.119403 249.6 709 111.6 708.27 111.6
709.5 4.5 3.32 129.9 709.5 0.122388 252.7 709.5 129.9 708.77 129.9710 5 3.32 148.5 710 0.125373 255.8 710 148.5 709.27 148.5
Weir Flow Pipe Flow
Total Discharge NGVD 1929
Total Discharge NAVD 1988
Basin 1 to Basin 2 Dam (Cell 1 Pond)
mdudley
Typewritten Text
BC-Unit 5-6-0008
mdudley
Typewritten Text
mdudley
Typewritten Text

CrestElevation= 684 NGVD 1929
ManningsRoughness= 0.012
Weir Length= 10
Pipe Diameter 3
Weir end Contractions= 4
Downstream Invert Elevation= 678.3 NGVD 1929
Elevation HeadWeir
Coefficient Flow Elevation Slope Flow Elevation Flow Elevation Flow684 0 0 0 684 0.05561 170.3 684 0 683.27 0
684.5 0.5 2.72 9.4 684.5 0.060488 177.6 684.5 9.4 683.77 9.4685 1 2.98 28.6 685 0.065366 184.7 685 28.6 684.27 28.6
685.5 1.5 3.2 55.3 685.5 0.070244 191.4 685.5 55.3 684.77 55.3686 2 3.3 85.9 686 0.075122 198.0 686 85.9 685.27 85.9
686.5 2.5 3.31 117.8 686.5 0.08 204.3 686.5 117.8 685.77 117.8687 3 3.32 151.8 687 0.084878 210.4 687 151.8 686.27 151.8
687.5 3.5 3.32 187.0 687.5 0.089756 216.4 687.5 187.0 686.77 187.0688 4 3.32 223.1 688 0.094634 222.2 688 222.2 687.27 222.2
688.5 4.5 3.32 259.9 688.5 0.099512 227.9 688.5 227.9 687.77 227.9689 5 3.32 296.9 689 0.10439 233.4 689 233.4 688.27 233.4
689.5 5.5 3.32 334.0 689.5 0.109268 238.8 689.5 238.8 688.77 238.8690 6 3.32 370.8 690 0.114146 244.0 690 244.0 689.27 244.0
Basin 2 to Basin 3 Dam (Cell 2 Pond)Weir Flow Pipe Flow
Total Discharge NGVD 1929
Total Discharge NAVD 1988
mdudley
Typewritten Text
BC-Unit 5-6-0008
CrestElevation= 674 NGVD 1929
ManningsRoughness= 0.012
CrestElevation= 677.5 NGVD 1929
Weir Length= 8.5
Pipe Diameter 3
Weir Length= 150
Weir end Contractions= 4
Downstream Invert Elevation= 637.08 NGVD 1929
Weir Coefficient= 2.6
Elevation HeadWeir
Coefficient Flow Elevation Slope Flow Elevation Head Flow Elevation Flow Elevation Flow674 0 0 0.0 674 0.093468 220.8 674 0 0.0 674 0.0 673.27 0.0
674.5 0.5 2.72 8.0 674.5 0.094734 222.3 674.5 0 0.0 674.5 8.0 673.77 8.0675 1 2.98 24.1 675 0.096 223.8 675 0 0.0 675 24.1 674.27 24.1
675.5 1.5 3.2 46.4 675.5 0.097266 225.3 675.5 0 0.0 675.5 46.4 674.77 46.4676 2 3.3 71.9 676 0.098532 226.7 676 0 0.0 676 71.9 675.27 71.9
676.5 2.5 3.31 98.1 676.5 0.099797 228.2 676.5 0 0.0 676.5 98.1 675.77 98.1677 3 3.32 125.9 677 0.101063 229.6 677 0 0.0 677 125.9 676.27 125.9
677.5 3.5 3.32 154.3 677.5 0.102329 231.1 677.5 0 0.0 677.5 154.3 676.77 154.3678 4 3.32 183.3 678 0.103595 232.5 678 0.5 137.9 678 321.1 677.27 321.1
678.5 4.5 3.32 212.3 678.5 0.104861 233.9 678.5 1 390.0 678.5 602.3 677.77 602.3679 5 3.32 241.3 679 0.106127 235.3 679 1.5 716.5 679 951.8 678.27 951.8
679.5 5.5 3.32 269.8 679.5 0.107392 236.7 679.5 2 1103.1 679.5 1339.8 678.77 1339.8680 6 3.32 297.6 680 0.108658 238.1 680 2.5 1541.6 680 1779.7 679.27 1779.7
Main Dam (Cell 3 Pond)
Total Discharge NAVD 1988
Total Discharge NGVD 1929
Emergency Spillway Weir FlowWeir Flow Pipe Flow
mdudley
Typewritten Text
BC-Unit 5-6-0008
CrestElevation= 674 NGVD 1929
ManningsRoughness= 0.012
CrestElevation= 677.5 NGVD 1929
Weir Length= 8.5
Pipe Diameter 2.5
Weir Length= 150
Weir end Contractions= 4
Downstream Invert Elevation= 637.08 NGVD 1929
Weir Coefficient= 2.6
Elevation HeadWeir
Coefficient Flow Elevation Slope Flow Elevation Head Flow Elevation Flow Elevation Flow674 0 0 0.0 674 0.093468 135.8 674 0 0.0 674 0.0 673.27 0.0
674.5 0.5 2.72 8.0 674.5 0.094734 136.7 674.5 0 0.0 674.5 8.0 673.77 8.0675 1 2.98 24.1 675 0.096 137.6 675 0 0.0 675 24.1 674.27 24.1
675.5 1.5 3.2 46.4 675.5 0.097266 138.5 675.5 0 0.0 675.5 46.4 674.77 46.4676 2 3.3 71.9 676 0.098532 139.4 676 0 0.0 676 71.9 675.27 71.9
676.5 2.5 3.31 98.1 676.5 0.099797 140.3 676.5 0 0.0 676.5 98.1 675.77 98.1677 3 3.32 125.9 677 0.101063 141.2 677 0 0.0 677 125.9 676.27 125.9
677.5 3.5 3.32 154.3 677.5 0.102329 142.1 677.5 0 0.0 677.5 142.1 676.77 142.1678 4 3.32 183.3 678 0.103595 143.0 678 0.5 137.9 678 280.9 677.27 280.9
678.5 4.5 3.32 212.3 678.5 0.104861 143.8 678.5 1 390.0 678.5 533.8 677.77 533.8679 5 3.32 241.3 679 0.106127 144.7 679 1.5 716.5 679 861.2 678.27 861.2
679.5 5.5 3.32 269.8 679.5 0.107392 145.6 679.5 2 1103.1 679.5 1248.7 678.77 1248.7680 6 3.32 297.6 680 0.108658 146.4 680 2.5 1541.6 680 1688.0 679.27 1688.0
Pipe FlowMain Dam (Cell 3 Pond) Optional
Emergency Spillway Weir Flow
Total Discharge NGVD 1929
Total Discharge NAVD 1988
Weir Flow
mdudley
Typewritten Text
BC-Unit 5-6-0008

BC-Unit 5-6-0008
Appendix F
HEC-HMS Output HEC-RAS Model Results

BC-Unit 5-6-0008
“Additional Primary” (Cell 1) Basin Results
,,;
w
w
m
w
,500
,000
,500
,000
;"
) 00:00
I
\ 12: 00
01J an2012
Subbasin "Additional_Prim ary" Results for Run "3/4 PMF'
00:00
I
12:00
02J an2012
,
00:00
I
12:00
03J an2012
l~ (C~teT"" : O'lApr20 11, 15:'IO :ln
- Rl.n 3?4 fV EIome<t : AOOTONALJ'R'~ARY Re, L.t:Prociph too - Rcn3?4 fV EIome<t : AOOTONALJ'R~ARY Re, L.t:Prociph too Lo"
-- Rl.n 3?4 fV EIome<t : AOOTONALJ~ARY Re, L.t:Ottfuw --- Rcn 3?4 fV EIome<t : AOOTONALJ~ARY Re, L.t:&O, efuw
Summary R~u lts for Subbasin "Additional_Primaryft =
Project: Buck Simulation Run : 3/4 PMF SUbbasin: Additional_Prmary
Start of Run: o lJan20 12, 00:00 Basin Model: Existilg Conditions End of Run : 04Jan20 12, 00 :00 Meteorologic Model: 6-hr 3/4PMP Compute lime: 09Apr20 12, 15:40: 27 Control Spedfications: Three-oay
Volume Units : @ IN IE> AC-FT
Computed Results
Peak Discharge: 2404.6 (CFS) Date/Tme of Peak Discharge : 0 lJan2012, 03:24 Total Predpitation : 22.12 (IN) Total Direct Runoff : 19.06 (IN) Total Loss: 3.06 (IN) Total Baseflow : 0.00 (IN) Total Excess: 19 .06 (IN) Discharge: 19.06 (IN)
,
00:01
I
BC-Unit 5-6-0008
“Pond_Add_Prim” (Cell 1) Pond Results
E 0 <
" ,
eo 8 ! "
" c
" c
0; c
oc c
" c
;c c / ! ,
" C
2,50 C
\
" " " " 2,000 n--
1,50
1,00
;c
C
C
" " " " " " " " " " , ,
" , , , , , , , , , ,
C ---"--,
,
, , , , , \ , , , , c ' , 00:00
I
12: 00
01Jan2012
Reservoir "Pond_Add_Prim ' Results for Run "3/4 PMF'
00:00
I
12:00
02J an2012
00:00
I
12:00
03J an2012
l~ (C~teT"" : O9Apr2011, 15 :'IO :2n
------ Rcn3?4 fV EIome<t : f'OI',V_AOO_~ Re, ut stc" "}e
-- Rl.n 3?4 f'Mf EIeme<t : f'OI',V_AOO_~ Re, ut Ottfuw
Rcn3?4 f'Mf EIome<t:f'Oi',V _ADD _~ Re" .t:Poo Elevotoo
--- Rl.n 3?4 f'Mf EIeme<t : f'OI',V_AOO_~ Re" .t:COOJbined .,fIow
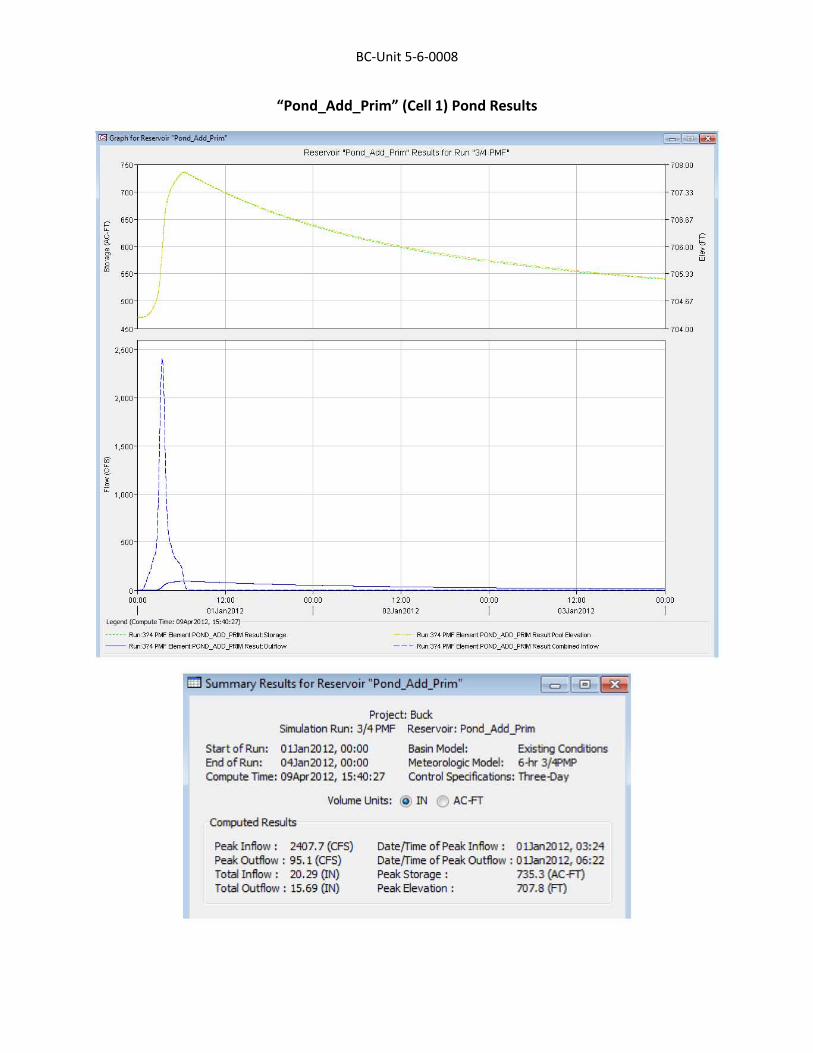
= 0
Project: Buck. SWnulatioo Run: 3/4 PMF Reservoir : Pond_Add Prim
Start of Run : OlJan2012, OO :OO End of Run: 04Jan20 12,OO:OO Compute Tme: 09Apr20 12, 15:40:27
Basin Model: Existing Conditions Meteorologic Model: 6-hr 3/4PMP Conb"oI Specifications: TlYee-Day
Volume Units: @ IN IE) AC-FT
Computed Results
Peak Inflow : 2.qQ7.7 (CFS) Peak Outflow ; 95 . 1 (CFS) Totallnflow : 20 .29 (IN) Total Outflow : 15 .69 (IN)
Date/lime of Peak Inflow : OlJan20 1.2, 03:24 Date/r1tT1e of Peak Outflow ; 0 lJan20 12, 06: 21 Peak Storage: 735.3 (AC-fT) Peak Elevation: 707.8 (FT)
~ 8
708.00
707.33
706.67
706.00 E , w
-- 705.33 --70(67
70(00
00:00
I
BC-Unit 5-6-0008
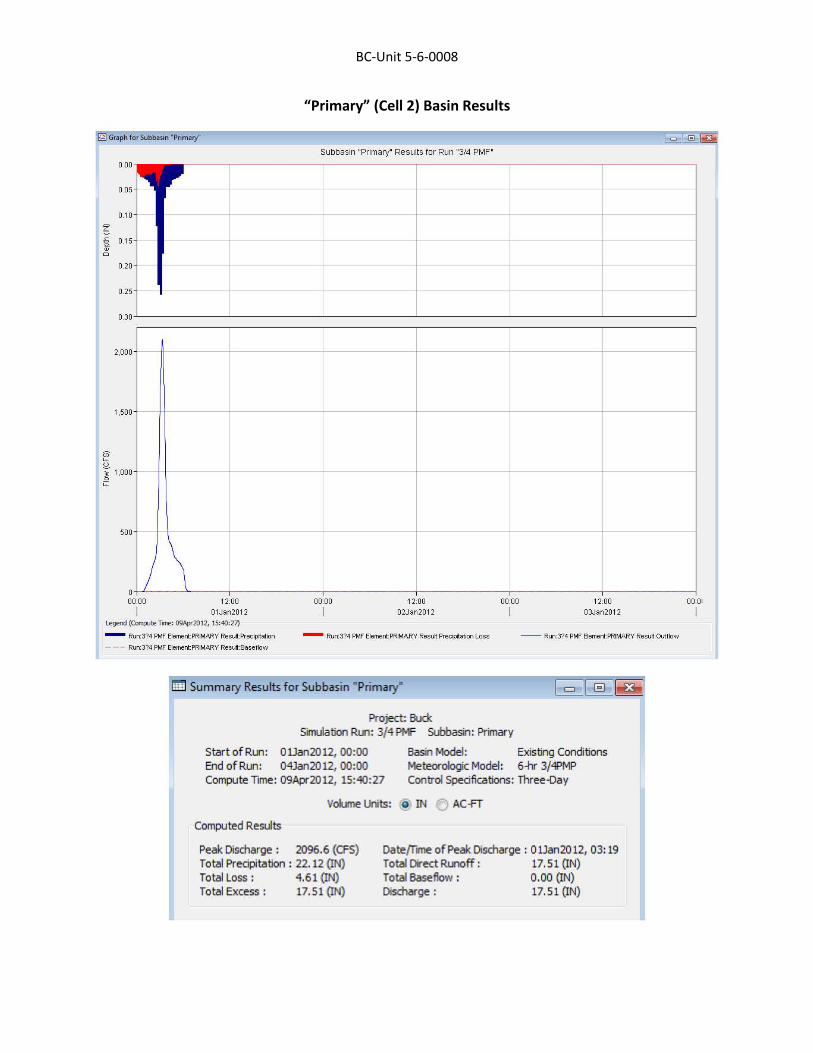
“Primary” (Cell 2) Basin Results
Groph for Sub~io "",;mo'Y"
,000
,500
eo 8 ~ 1,000
"
12:00
01Jan2012
l~ (C~teT"" : O9Apr2011, 11 :'IO :2n
- Rl.n3?4 fV EIerne<t:f'RM'..RY Re, L.t:Prociphtoo
--- Rl.n 3?4 fV EIeme<t:f'RM'..RY Re, L.t:BMefuw
Subbasin "Primary" Results for Run "3/4 PMF"
00:00
I
12:00
02Jan2012
00:00
I
12:00
03Jan2012
Summary Resutts for Subbasin "Primary" = 8
Project: Buck Simulation Run: 3/4 PMF Subbasin: Primary
Start of Run: OUan2012, OO:00 Basin Model: Existing Conditions End of Run: 04Jan2012, OO:00 Meteorologic Model: 6-hr 3/4PMP Compute Tlrne : 09Apr2012, 15:40:27 Control Spedfications: Three-oay
Volume Units: @ IN IE) AC.fl
Computed Results
Peak Discharge: 2096.6 (CfS) Date/fme of Peak Discharge: OUan2012, 03: 19 Total Predpitation : 22. 12 (IN) Total DirectRlr1off: 17.51 (IN) Total loss : 4.61 (IN) Total Baseflow : 0.00 (IN) TotalExcess: 17.51 (IN) Discharge : 17. 5 1 (IN)
00:01
I
J
BC-Unit 5-6-0008
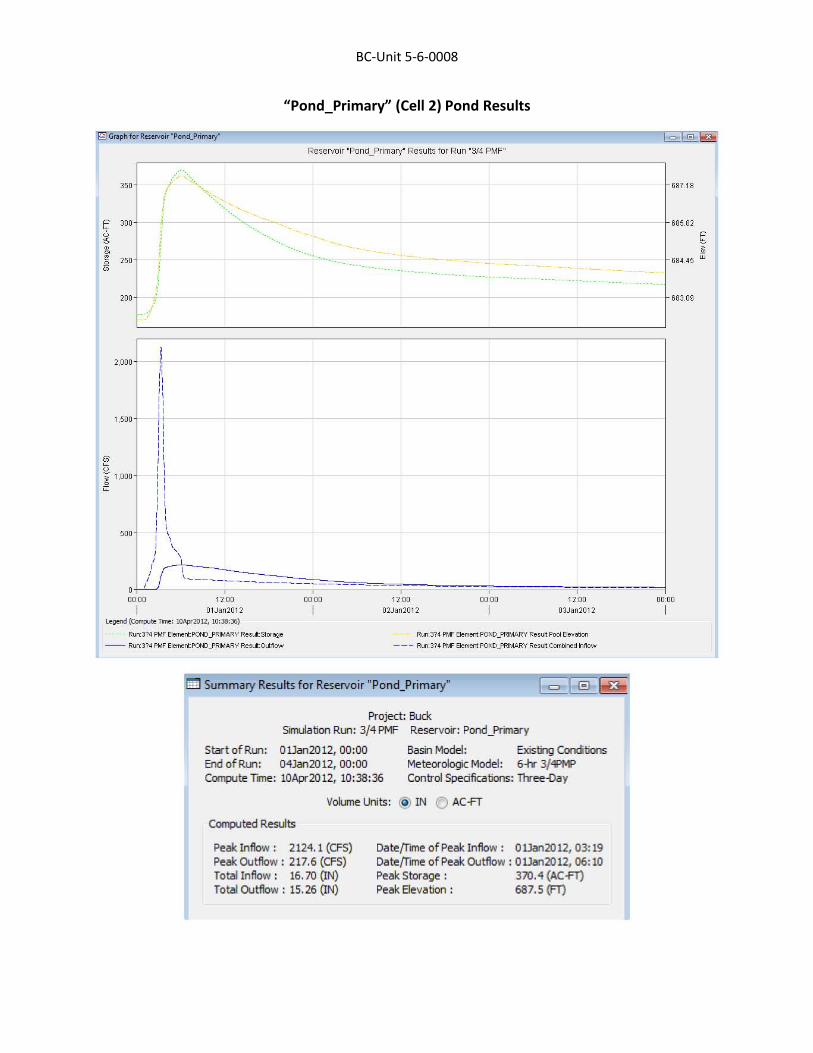
“Pond_Primary” (Cell 2) Pond Results
,;c
E ,CC 0 < , ,;c ,
,CC
J
2,000
_ rima
/
\--" "
"
" "
" 1,500 ---+j , ,
eo 8 ~ 1,000
"
, , , , , ,
: ' ,-,---, ' , ' , ' , ' , ' , ' , \---, , , ,
Reservoir "Pond_Primary" Results for Run "3/4 PMF"
"+ .... -. -"--.-.- ----.-.. - r=== L ····C ···, ±
, \ ,
c LL!r\==~, ~~~~,==~~~, ---7' ---"---~'
687.18
685.82
68((5
68309
00:00 12:00 00:00 12:00 00:00 12:00 00:00
I 01Jan2012 I 02Jan2012 I 03Jan2012 I l~(C~teT"" 1OApr2011, 10 :38 :36)
- - - - - - Rcn 3?4 f'Mf EIeme<t:f'Oi',V _f'RM'.RY Re" ':: ste<_ Rl.n 3?4 f'Mf EIeme<t:f'Oi',V _f'RM'.RY Re" .t:Poo Elevotoo
-- Rl.n3?4 fV EIerne<t:f'OI',V_f'RM'.RY Re" .t:W fuw - - - Rcn 3?4 f'Mf EIeme<t:f'Oi',V _f'RM'.RY Re" .t:COOJbined .,fIow
Summary Results for Res~rvo i r "Pond_Primary" = Project: Buck.
SWnulation Run: 3/4 PMF Reservoir : Pond_Primary
Start of Run : o Uan20 12, 00:00 Basin Model: Existing Conditions End of Run: 04Jan2012, 00:00 Meteorologic Model: 6-hr 3/ 'WMP Compute Tm e : lOApr2012, 10:38:36 Control Spedfications: Three-Day
Volume Units : @ IN tEl ACfl
Computed Results
Peak Inflow : 2124. 1 (CFS) Peak Outflow : 217.6 (CFS) Total Inflow : 16 .70 (IN) Total Outflow ; 15 .26 (IN)
Date/Tme of Peak Inflow: o lJan20 12, 03: 19 Date{rme of Peak Outflow : o 1Jan20 12, 06: 10 Peak Storage: 370 .4 {AC-FT} Peak 8evation : 687.5 (FT)
; , W
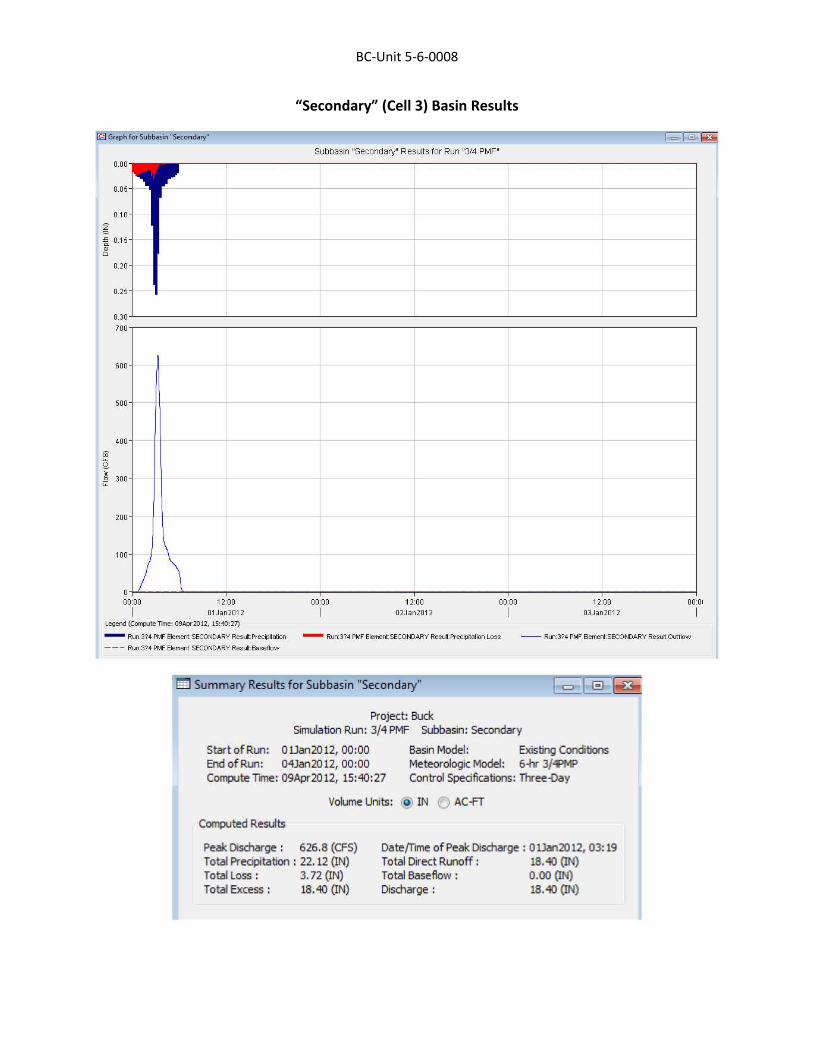
BC-Unit 5-6-0008
“Secondary” (Cell 3) Basin Results
Groph for ~b~io "*o,,cJ.ry
0'"
W
~ ~ W
0
m
w
'"
occ
;"
." eo 8 ! " '"
,"
." -
\ ) 00.00 12.00
I 01J an2012
l <9<'ld (C~teT"" : O'lApr2011, 15 :'IO :2n
Subbasin ' Secondary" Results for Run ' 3/4 PMF'
00.00
I
12.00
02J an201 2
00.00
I
- Rcn 3?4 f'Mf EIeme<t:SEC()I',VAAY Re, L.t:Procipti>too - Rl.n 3?4 f'Mf EIeme<t:SECOKlAAY Re, L.t:Procipti>too lo"
- - - Rcn 3?4 f'Mf EIeme<t: SEC()I',VAAY Re, L.t:BM efuw
Summary R6 ultS for Subbasin "St:condary"
Project: Buc:k. Simulation Run: 3/4 PMF Subbasin: Secondary
12.00
03J an2012
Start of Roo : OlJan2012, 00:00 End of Roo: 04Jan2012, 00:00 Compute Time: 09Apr2012, 15:40:27
Basin Model: Existilg Conditions MeteOfoiogic Model: 6« 3/"1PMP Conuol Specifications: Three-Day
Volume Units: @ IN ~ AC -FT
Computed Results
Peak Discharge: 626.8 (CFS) Date(rllTle of Peak Discharge : a lJan2012, 03: 19 Total Precipitation: 22. 12 (IN) Total DifectRunoff: 18.40 (IN) Total Loss : 3,72 (IN) Total Baseflow : 0.00 (IN) Total Excess: 18.40 (IN) Discharge: 18.40 (IN)
00.01
I

BC-Unit 5-6-0008
“Pond_Second” (Cell 3) Pond Results
~ '" Reservoir "Pond_Second" Results for Run "3/4 PMF"
"C,---------------------------------------------------------------------------------T 677.50
:::'---~".rL'---~"·:'·C<:-.~--,-"--.. -"-j;.".-"---:cc__ i 1 ""-c .. c~"-
"" - --11---~ 1( 0 ---+ o i 135
~ 1301---j---w "'1---1----nc,-,~----
! " "
"
" "
, , , , " , , , , , ,
W __ L , 8 400
I I
, ' , , ,- 1_-
200 r
~ 300 --i-,\.~
,co J -~'-c-c----------_l----- -
00,00
I
12.00
01Jan2012
l~(C~teT"" 1OApr2012, 10 :38 :36)
- - - - - - Rl.n 3?4 f'Mf EIeme<t:f'Oi',V _SECOI'.v Re" ' ::ste<_
00,00
I
- - - Rcn3?4 f'Mf EIeme<t:f'Oi',V _SECOI'.v Re" .t:COOJbined .,fIow
12.00
02Jan2012
00,00
I
12.00
03Jan2012
Summary Results for Rese:rvoir "Pond_S&ond" = Project: Buck
Simulation Run: 3/4 PMF Reservoir : Pond_Second
Start of Run: OUan2012, 00:00 End of Run: 04Jan2012, OO:00 Compute lime: lOApr2012, 10:38:36
Basin Model : Existing Conditions Meteorologic Model: 641r 3/4PMP Control Specifications: Three-Day
Volume Units: @ IN eJ AC-FT
Computed Results
Peak Inflow : 747.8 (CFS) Peak Outflow: 327. 3 (CfS) Total Inflow : 15 .63 (IN) Total Outflow : 15 .68 (IN)
Date/rmeofPeakInflow : OlJan2012,03: 21 Date/rme of Peak Outflow : OlJan20 12,04:09 Peak Storage: 158 . 1 (AC-FT) Peak Bevation : 6n.3 (FT)
677.15
676.80
676 ( 5
676.10
675.75
675 ( 0
67505
67 0 0
67 U 5
67(. 00
00,00
I
; , W

BC-Unit 5-6-0008
Appendix G
NOAA ATLAS 14 Data

NOAA Atlas 14, Volume 2, Version 3Location name: Salisbury, North Carolina, US*
Coordinates: 35.7127, -80.3677Elevation: 703ft** source: Google Maps
POINT PRECIPITATION FREQUENCY ESTIMATESG.M. Bonnin, D. Martin, B. Lin, T. Parzybok, M.Yekta, and D. Riley
NOAA, National Weather Service, Silver Spring, Maryland
PF_tabular | PF_graphical | Maps_&_aerials
PF tabularPDS-based point precipitation frequency estimates with 90% confidence intervals (in inches)1
Duration Average recurrence interval (years)1 2 5 10 25 50 100 200 500 1000
5-min 0.385(0.355-0.419)
0.456(0.421-0.497)
0.532(0.489-0.578)
0.583(0.535-0.632)
0.639(0.584-0.693)
0.676(0.615-0.733)
0.708(0.640-0.767)
0.734(0.660-0.797)
0.760(0.678-0.826)
0.776(0.686-0.845)
10-min 0.615(0.567-0.669)
0.730(0.673-0.795)
0.852(0.783-0.926)
0.933(0.856-1.01)
1.02(0.931-1.10)
1.08(0.979-1.17)
1.13(1.02-1.22)
1.16(1.05-1.26)
1.20(1.07-1.31)
1.22(1.08-1.33)
15-min 0.769(0.708-0.836)
0.917(0.846-0.999)
1.08(0.991-1.17)
1.18(1.08-1.28)
1.29(1.18-1.40)
1.36(1.24-1.48)
1.42(1.29-1.54)
1.47(1.32-1.59)
1.51(1.35-1.65)
1.53(1.36-1.67)
30-min 1.06(0.971-1.15)
1.27(1.17-1.38)
1.53(1.41-1.67)
1.71(1.57-1.85)
1.91(1.75-2.07)
2.05(1.87-2.23)
2.18(1.97-2.36)
2.28(2.06-2.48)
2.41(2.15-2.62)
2.48(2.20-2.71)
60-min 1.32(1.21-1.43)
1.59(1.47-1.73)
1.96(1.81-2.13)
2.23(2.04-2.41)
2.55(2.33-2.76)
2.78(2.53-3.02)
3.00(2.71-3.25)
3.20(2.88-3.48)
3.45(3.08-3.76)
3.63(3.21-3.95)
2-hr 1.52(1.40-1.65)
1.84(1.69-2.00)
2.28(2.10-2.49)
2.61(2.39-2.84)
3.03(2.76-3.29)
3.34(3.03-3.62)
3.64(3.28-3.95)
3.93(3.52-4.27)
4.30(3.80-4.67)
4.56(3.99-4.97)
3-hr 1.62(1.49-1.76)
1.95(1.80-2.13)
2.44(2.24-2.65)
2.80(2.57-3.04)
3.27(2.98-3.54)
3.63(3.28-3.93)
3.97(3.58-4.30)
4.31(3.85-4.67)
4.76(4.20-5.17)
5.09(4.43-5.53)
6-hr 1.96(1.80-2.14)
2.36(2.18-2.57)
2.94(2.70-3.21)
3.39(3.10-3.68)
3.98(3.62-4.32)
4.44(4.01-4.81)
4.90(4.39-5.30)
5.36(4.76-5.80)
5.97(5.22-6.46)
6.43(5.56-6.96)
12-hr 2.30(2.12-2.52)
2.78(2.56-3.04)
3.48(3.20-3.80)
4.03(3.69-4.39)
4.77(4.33-5.18)
5.36(4.83-5.81)
5.97(5.33-6.45)
6.59(5.82-7.11)
7.43(6.45-8.01)
8.07(6.91-8.71)
24-hr 2.76(2.57-2.97)
3.33(3.11-3.58)
4.17(3.89-4.49)
4.83(4.50-5.19)
5.72(5.31-6.15)
6.43(5.95-6.91)
7.15(6.60-7.68)
7.89(7.26-8.48)
8.89(8.14-9.57)
9.67(8.83-10.4)
2-day 3.20(2.99-3.43)
3.86(3.60-4.13)
4.79(4.47-5.13)
5.52(5.14-5.90)
6.49(6.04-6.94)
7.26(6.74-7.77)
8.04(7.44-8.61)
8.84(8.15-9.47)
9.91(9.10-10.6)
10.7(9.84-11.5)
3-day 3.41(3.19-3.64)
4.09(3.83-4.38)
5.06(4.73-5.41)
5.82(5.43-6.21)
6.84(6.37-7.31)
7.64(7.10-8.18)
8.46(7.84-9.06)
9.30(8.59-9.96)
10.4(9.59-11.2)
11.3(10.4-12.2)
4-day 3.61(3.39-3.85)
4.33(4.07-4.62)
5.33(4.99-5.69)
6.12(5.72-6.52)
7.18(6.70-7.67)
8.03(7.46-8.58)
8.89(8.24-9.51)
9.76(9.02-10.5)
11.0(10.1-11.8)
11.9(10.9-12.8)
7-day 4.16(3.92-4.43)
4.97(4.68-5.29)
6.03(5.67-6.42)
6.88(6.46-7.32)
8.03(7.52-8.54)
8.95(8.36-9.52)
9.88(9.19-10.5)
10.8(10.0-11.5)
12.1(11.2-13.0)
13.1(12.1-14.1)
10-day 4.74(4.49-5.02)
5.64(5.34-5.97)
6.77(6.40-7.16)
7.65(7.23-8.10)
8.84(8.33-9.36)
9.78(9.19-10.4)
10.7(10.0-11.4)
11.7(10.9-12.4)
13.0(12.1-13.8)
13.9(12.9-14.9)
20-day 6.38(6.07-6.70)
7.52(7.15-7.91)
8.88(8.43-9.34)
9.96(9.44-10.5)
11.4(10.8-12.0)
12.5(11.8-13.2)
13.7(12.9-14.4)
14.9(13.9-15.7)
16.4(15.3-17.4)
17.6(16.4-18.7)
30-day 7.89(7.54-8.27)
9.28(8.86-9.70)
10.8(10.3-11.3)
11.9(11.4-12.5)
13.5(12.8-14.1)
14.6(13.9-15.3)
15.8(14.9-16.5)
16.9(16.0-17.8)
18.5(17.4-19.4)
19.6(18.4-20.7)
45-day 9.92(9.52-10.4)
11.6(11.1-12.1)
13.3(12.7-13.8)
14.6(13.9-15.2)
16.2(15.5-16.9)
17.5(16.7-18.2)
18.7(17.8-19.5)
19.9(18.9-20.8)
21.5(20.3-22.5)
22.7(21.4-23.8)
60-day 11.8(11.4-12.3)
13.8(13.3-14.3)
15.5(15.0-16.1)
16.9(16.2-17.6)
18.6(17.9-19.4)
20.0(19.1-20.8)
21.2(20.3-22.1)
22.5(21.4-23.4)
24.0(22.9-25.1)
25.2(23.9-26.4)
1 Precipitation frequency (PF) estimates in this table are based on frequency analysis of partial duration series (PDS).Numbers in parenthesis are PF estimates at lower and upper bounds of the 90% confidence interval. The probability that precipitation frequency estimates (for a given duration and average recurrence interval) will be greater than the upper bound (or less than the lower bound) is 5%. Estimates at upper bounds are not checked against probable maximum precipitation (PMP) estimates and may be higher than currently valid PMP values.Please refer to NOAA Atlas 14 document for more information.
Back to Top
PF graphical
Page 1 of 4Precipitation Frequency Data Server
3/27/2012http://hdsc.nws.noaa.gov/hdsc/pfds/pfds_printpage.html?lat=35.7127&lon=-80.3677&data...
mdudley
Highlight
mdudley
Typewritten Text
mdudley
Typewritten Text
BC-Unit 5-6-0008
mdudley
Typewritten Text
mdudley
Typewritten Text

BC-Unit 5-6-0008
Appendix H
Digital Data
(Attached CD containing HEC-HMS model and pertinent GIS spatial files)