Hydrographic Services Review Panel October 12, 2010.
13
Hydrographic Services Review Panel October 12, 2010
-
Upload
evangeline-wiggins -
Category
Documents
-
view
217 -
download
1
Transcript of Hydrographic Services Review Panel October 12, 2010.
Hydrographic Services Review Panel
October 12, 2010

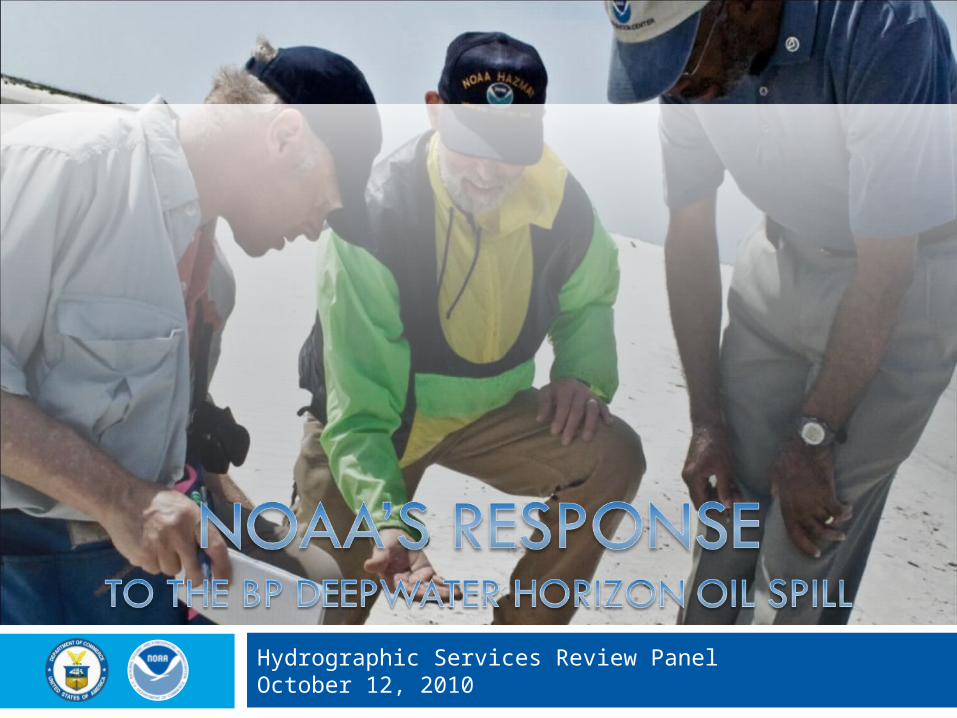
People – who live and work in and love the Gulf
Quality of life and livelihoods at stake
NOAA also lives and works in the Gulf –
Weather and river forecast officesOcean and fisheries servicesResearch labs and data centersCooperative Institutes
2
What’s at Stake?

OceansResponseRestoration
Fisheries
Weather
Satellites
ResearchScientistsVessels
Services across NOAA3

National Ocean ServiceOceanographic modeling supportProduction of nautical charts that display the spill zone forecast - Data to support trajectory forecastsCollection of aerial imageryOperation and maintenance of systems to measure water levels, weather, and near-shore current metersSupport for National Estuarine Research Reserves and Gulf coastal managersCollection of data to monitor contaminants in the areaAssessment of socioeconomic impacts
National Ocean Service’s Contributions
4

Performing sub-surface testing to determine presence of oil and monitor water quality
Vessels5
THOMAS JEFFERSON GORDON GUNTER
PISCES DELAWARE II Numerous Partnerships

• Nautical charts for response efforts
• Spill zone forecasts included on charts for vessel routing
Nav Services: Bathymetry, Charts
6

• Acoustic and fluorometric scanning for subsurface oil
Nav Services: Subsurface Oil
7

Nav Services: Aerial Imagery
8
Aircraft – New NOAA King AirImagery – Visible and Near Infrared (NIR)Data -
69,954 Images Collected5,695 Mosaic Tiles Created5.4TB of Data
Dissemination – ERMAUSGS Hazards Data Disaster Center

• Spill trajectory support
• Tides, currents, and weather analyses
• Supporting safe navigation into and out of ports
Nav Services: PORTS, Quicklook
9
PISCES DELAWARE II
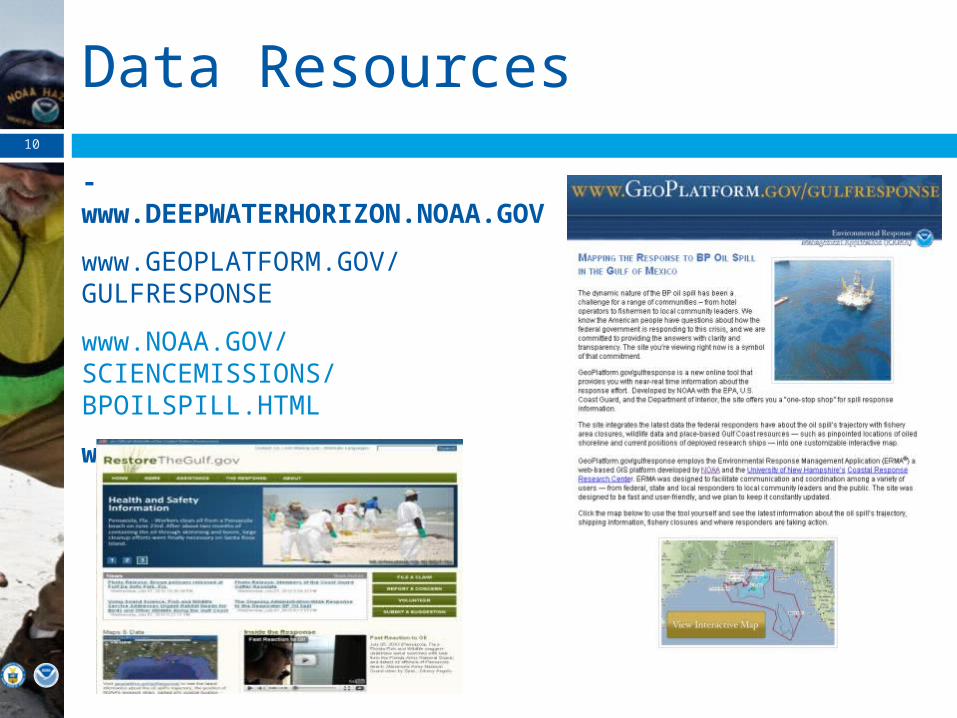
Data Resources
-www.DEEPWATERHORIZON.NOAA.GOV
www.GEOPLATFORM.GOV/GULFRESPONSE
www.NOAA.GOV/SCIENCEMISSIONS/BPOILSPILL.HTML
www.RESTORETHEGULF.GOV
10
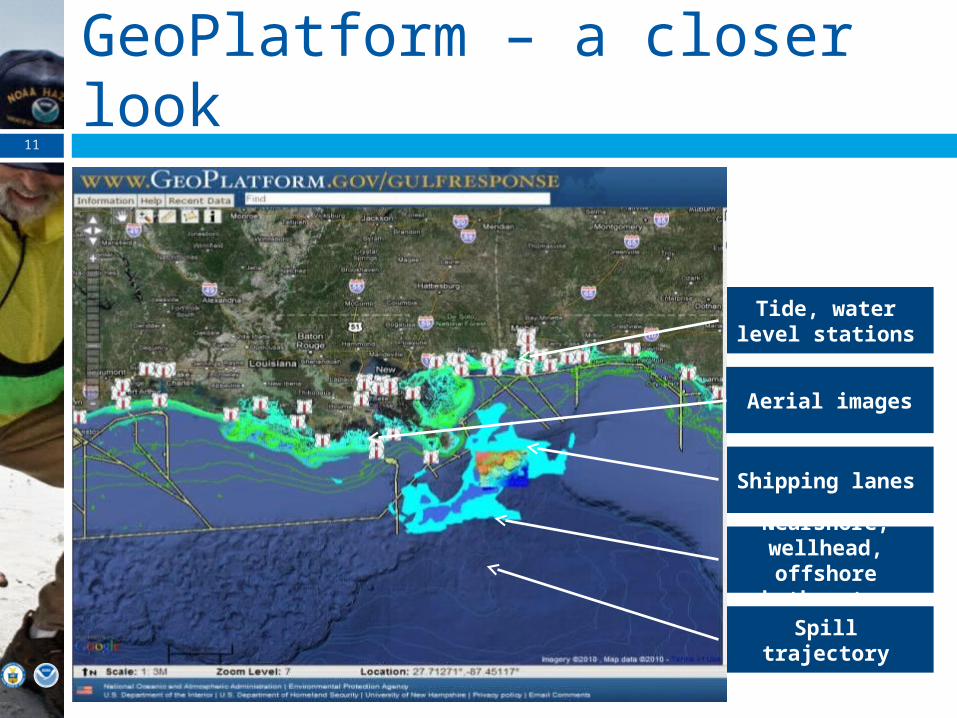
11
Nearshore, wellhead, offshore
bathymetry
Spill trajectory
Shipping lanes
Tide, water level stations
Aerial images
GeoPlatform – a closer look

Maritime Commerce12
11 of the top 25 U.S. Ports were directly affected due to inspections, decontamination, and other spill impacts
NOAA, USCG, and Navy:
Alternative anchorage areas for vessels requiring inspection and decontamination before entering port
Magnetometer survey for pilots to ensure anchors would not rupture buried, uncharted pipelines