Hydrograph Modification Management Using Simplified Low Impact Development Design
24
Hydrograph Modification Management Using Simplified Low Impact Development Design Christie Beeman, P.E. Philip Williams & Associates
description
Hydrograph Modification Management Using Simplified Low Impact Development Design. Christie Beeman, P.E. Philip Williams & Associates. precipitation. runoff. infiltration. Hydrograph Modification. Pre-Development. Time. Hydrograph Modification. - PowerPoint PPT Presentation
Transcript of Hydrograph Modification Management Using Simplified Low Impact Development Design
Hydrograph Modification Management
Using Simplified Low Impact Development Design
Christie Beeman, P.E.Philip Williams & Associates

runoff
infiltration
precipitation
Hydrograph Modification

Hydrograph Modification
Run
off
Time
Pre-Development
Urbanization tends to increase stormwater runoff:
volume
peak flows
frequency
Post-Development

Hydrograph Modification: Flow Peak
0.00
0.10
0.20
0.30
0.40
0.50
0.60
0.70
0.80
0.90
1.00
0 1 2 3 4 5 6 7 8 9 10
Recurrence Interval (years)
Peak
Flo
w (c
fs)
Impervious Drainage Area Runoff
Group D Soil Runoff
Group A Soil Runoff

Hydrograph Modification: Flow Duration
0.00
0.20
0.40
0.60
0.80
1.00
1.20
0.00% 0.02% 0.04% 0.06% 0.08% 0.10% 0.12% 0.14% 0.16% 0.18% 0.20%
% Time Exceeded
Flow
(cfs
)
Impervious Drainage Area Runoff
Group D Soil Runoff
Group A Soil Runoff

Hydrograph Modification Management
SFRWQCB adding C.3 to Bay Area NPDES permits
C.3.f requires Hydrograph Modification Management Plan (HMP)– Control runoff peak flows &
durations to pre-project levels
– Prevent erosion impacts to receiving streams

Contra Costa HMP - approach
Encourage LID for Hydrograph Modification Management
Guidelines already in place for water quality treatment– Typical details
– Sizing spreadsheet
Expand for hydrograph modification management

Contra Costa HMP: Compliance Options Compare Pre- and Post-project Site Conditions
Implement LID using IMP GalleryImplement LID using IMP Gallery– Design details, specifications and sizing factorsDesign details, specifications and sizing factors
Demonstrate flow peak and duration mitigation – Continuous hydrologic model
– Flow peak and duration control
Assess risk of erosion impacts (receiving stream) – Demonstrate low risk of erosion
– Propose alternative mitigation

LID Integrated Management Practices
runoff
precipitation
infiltration
– Mimic natural hydrologic conditions• Retention, infiltration
– Can fit in site landscaping– Practical for small projects

Contra Costa HMP
Challenge:Challenge:Hydrograph Modification Management
IMP design guidance – Make IMP design and sizing easy
– Demonstrate peak and duration control
Solution:Solution:Develop IMP sizing factors using
continuous simulation hydrologic model

IMP Design Guidance – sizing factors Develop Pre-Project and Post-Project Runoff
Time Series using HPSF– Flow peak and duration plots
Build IMPs into the HSPF model
Adjust IMP size until peak and duration plots below pre-project– Sizing factor = (facility size)/(area managed)– Most sizing factors between 0.05 and 0.13

LID Integrated Management Practices
Planter box
Infiltration trench/basin
Vegetated swale
Bioretention basin
Dry well

Flow-Through Planter Example
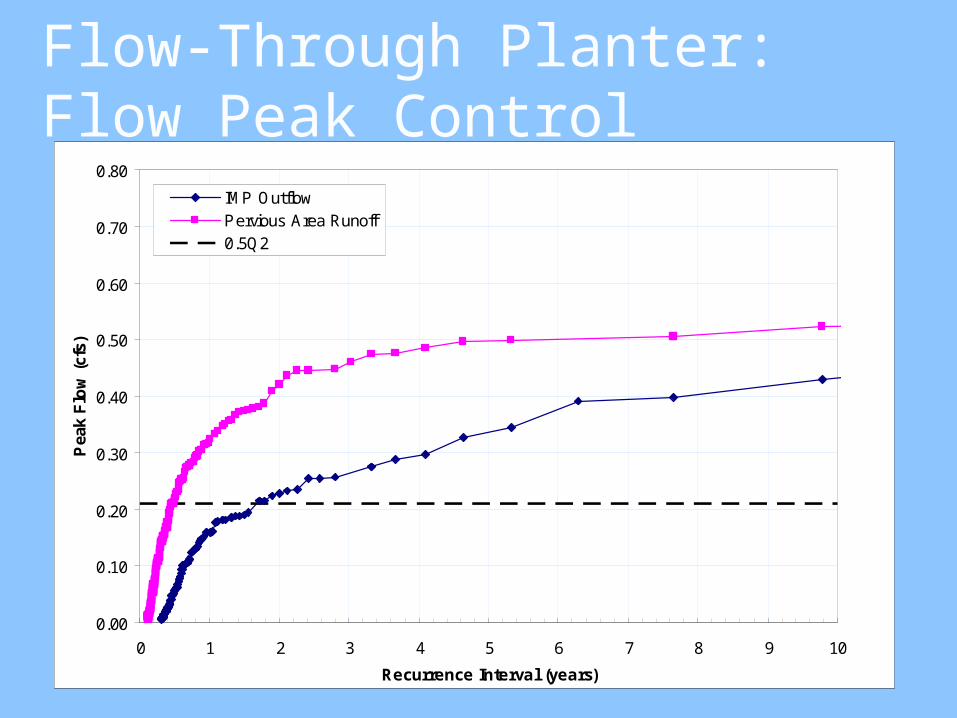
Flow-Through Planter: Flow Peak Control
0.00
0.10
0.20
0.30
0.40
0.50
0.60
0.70
0.80
0 1 2 3 4 5 6 7 8 9 10
Recurrence Interval (years)
Peak
Flo
w (c
fs)
IMP OutflowPervious Area Runoff0.5Q2

Flow-Through Planter: Flow Duration Control
0.00
0.10
0.20
0.30
0.40
0.50
0.60
0.70
0.80
0.00% 0.02% 0.04% 0.06% 0.08% 0.10% 0.12% 0.14% 0.16% 0.18% 0.20%
% Time Exceeded
Flow
(cfs
)
IMP OutflowPervious Area Runoff0.5Q2Q10

IMP Sizing Worksheet
Define Project
DMA Input
IMP Sizing
Total Drainage Area (SF):Number of Post-project DMA*:Select Rain Gauge:
Total: SF
Bottom Width: ftSwale Depth: ft
NoneNone
NoneNone
Dimension: UnitsDimension: Units
Dimension: UnitsDimension: Units
Dimension: UnitsDimension: Units
Dimension: UnitsDimension: Units
Dimension: UnitsDimension: Units
Dimension: UnitsDimension: Units
Dimension: UnitsDimension: Units
Units
Units
Units
Units
Units
Units
Select IMP Type IMP Dimensions IMP Size
Units
Surrounding Soil Group
CFS
Underdrain Discharge Limit
CFS
CFS
Post-project
Select IMP ID to Manage Runoff
SFTotal:
Units
LF
SF
SF
Units
Units
Units
Units
Units
Units
IMP ID
Pre-project
Project Name:
DMA ID
Hydrologic Soil Group
Land CoverArea of DMA (SF)
No. of Identical
Areas
Total Area (SF)
Example
145,000
6
1 40,0001 NoneScrub Scrub
1 50,0002 AScrub Scrub
3 15,0003 BScrub Impervious
2 10,0004 CScrub Impervious
1 15,0005 AScrub Impervious
1 15,0006 AScrub Grass
A
D
A
D
D
D
A 6
B
C
287
400
200
1
145,000
40,000
50,000
5,000
5,000
10,000
15,000
5,618
*DMA = Drainage Management Area
Vegetated/Grassy Swale
In-Ground Planter
In-Ground Planter
D
A
D
Martinez 2S (Mean Annual Precip = 20.2 inches)
N/A
0.027
N/A

IMP Sizing Worksheet - example
A soilsD soils

IMP Sizing Worksheet – Delineate DMAs
Total Drainage Area (SF):Number of Post-project DMA*:Select Rain Gauge:
Project Name: Example
145,000
6
*DMA = Drainage Management AreaMartinez 2S (Mean Annual Precip = 20.2 inches)
66
55
3c3c
3a3a
3b3b
4a4a
4b4b
2211

66
55
3c3c
3a3a
3b3b
4a4a
4b4b
2211
IMP Sizing Worksheet – DMA inputs
DMA ID
Area of DMA (SF)
1
2
3
4
5
6
40,000
50,000
5,000
5,000
10,000
15,000
Total: SF
No. of Identical
Areas
Total Area (SF)
1 40,000
1 50,000
3 15,000
2 10,000
1 15,000
1 15,000
145,000

IMP Sizing Worksheet – DMA inputs
66
55
3c3c
3a3a
3b3b
4a4a
4b4b
2211
DMA ID
1
2
3
4
5
6
SF
Hydrologic Soil Group
A
D
A
D
D
D

IMP Sizing Worksheet – DMA inputsSelect IMP ID
to Manage Runoff
None
A
B
C
A
A
DMA ID
1
2
3
4
5
6
66
55
3c3c
3a3a
3b3b
4a4a
4b4b
2211
B
B
B
C
C
A

IMP Sizing Worksheet – Select IMPs
1 2
Select IMP Type Surrounding Soil Group
IMP ID
A
B
C
Vegetated/Grassy Swale
In-Ground Planter
In-Ground Planter
D
A
D 66
55
3c3c
3a3a
3b3b
4a4a
4b4b
BB
BB
BB
CC
CC
AA
2211

IMP Sizing Worksheet –IMP dimensions
1 2
IMP ID
A
B
C
Bottom Width: ftSwale Depth: ft
NoneNone
NoneNone
Dimension: UnitsDimension: Units
Dimension: UnitsDimension: Units
IMP Dimensions
6
1
66
55
3c3c
3a3a
3b3b
4a4a
4b4b
BB
BB
BB
CC
CC
AA
2211

IMP Sizing Worksheet –IMP size
1 2
IMP ID
A
B
C
IMP Size Underdrain Discharge Limit
LF
SF
SF
Units
Units
287
400
200
Units
Units
CFS
Underdrain Discharge Limit
CFS
CFS
N/A
0.027
N/A 66
55
3c3c
3a3a
3b3b
4a4a
4b4b
BB
BB
BB
CC
CC
AA
2211