Hydrogeochemistry “Geochemistry of Natural Waters” “Geochemistry of Natural Waters” No...
35
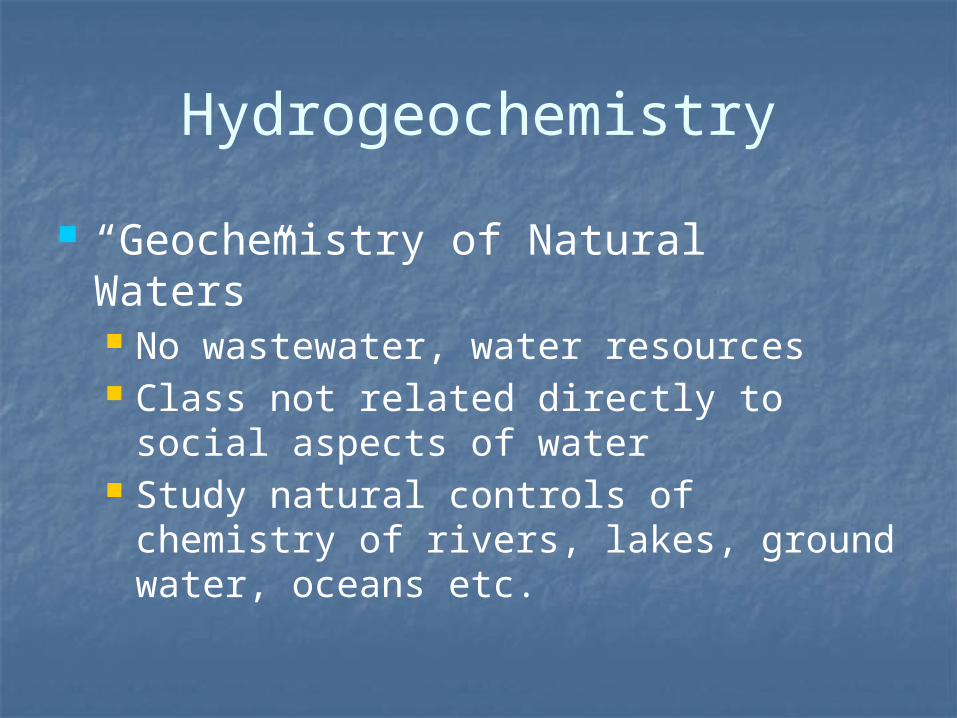
Hydrogeochemistry “Geochemistry of Natural Waters” No wastewater, water resources Class not related directly to social aspects of water Study natural controls of chemistry of rivers, lakes, ground water, oceans etc.
-
Upload
dwayne-lane -
Category
Documents
-
view
226 -
download
4
Transcript of Hydrogeochemistry “Geochemistry of Natural Waters” “Geochemistry of Natural Waters” No...
Hydrogeochemistry
“Geochemistry of Natural Waters” No wastewater, water resources Class not related directly to social
aspects of water Study natural controls of chemistry of
rivers, lakes, ground water, oceans etc.

Questions considered:
Why do different waters have different chemical compositions?
What controls the compositions? This will lead to discussion of chemical
reactions between water, rocks, and atmosphere
How do compositions vary with setting?
How do they vary with time?

Why consider water compositions?
Can provide information on basic geological processes: Diagenesis ≡ All chemical (and physical)
alteration of solid material (low T and P) Weathering ≡ alteration of mineral
phases at earth surface conditions Biological activities in certain
environments Exchange with atmosphere (C cycle –
global climate change)

Reactants include Water and… Inorganic solids: rocks, sediments,
minerals Biota: plants, animals, bacteria, archea Gas phases: Earth’s atmosphere,
biologically produced gas (CO2, H2S)

Concentration terminology
We will need a way to discuss what is in water Dissolved components (ions, gasses,
complexes etc.) Solid components
The following is a lot of definitions, terminology, and algorithms to calculate solutes

Dissolved concentrations Fresh water
Potable, generally < 1000 mg/L solids per liter of water (TDS)
Brackish Non-potable, but < seawater
Seawater, salinity 34 to 37 (defined soon) 97% of free water on earth Concentration important threshold for
Thermo Saline water/brine > seawater
salinity

Total dissolve solids
Mass of solid remaining after evaporation of water
Note – in GWB, often just “dissolved solids” Bicarbonate converted to carbonate Units of mass/volume (e.g. g/L, kg/L,
etc.) Commonly used in fresh water
systems

Chlorinity (Cl)
Definition Mass of Cl in one kg of seawater
equivalent to Cl, Br, and I in seawater Determined by titration with AgNO3
Precipitate Ag(Cl,Br,I) with indicator AgNO3 calibrated with seawater with
known chlorinity (19.374 g/kg) Commonly used in seawater systems

Salinity Operationally – all salts in seawater Originally (Knudsen, 1901) defined as
With Cl = 19.374 g/kg measured with AgNO3
Intercept because not all salts measured Precision to 3 decimal places
S(‰)=0.03 + 1.805 Cl(‰)
From Millero, 2011, Marine Chemistry
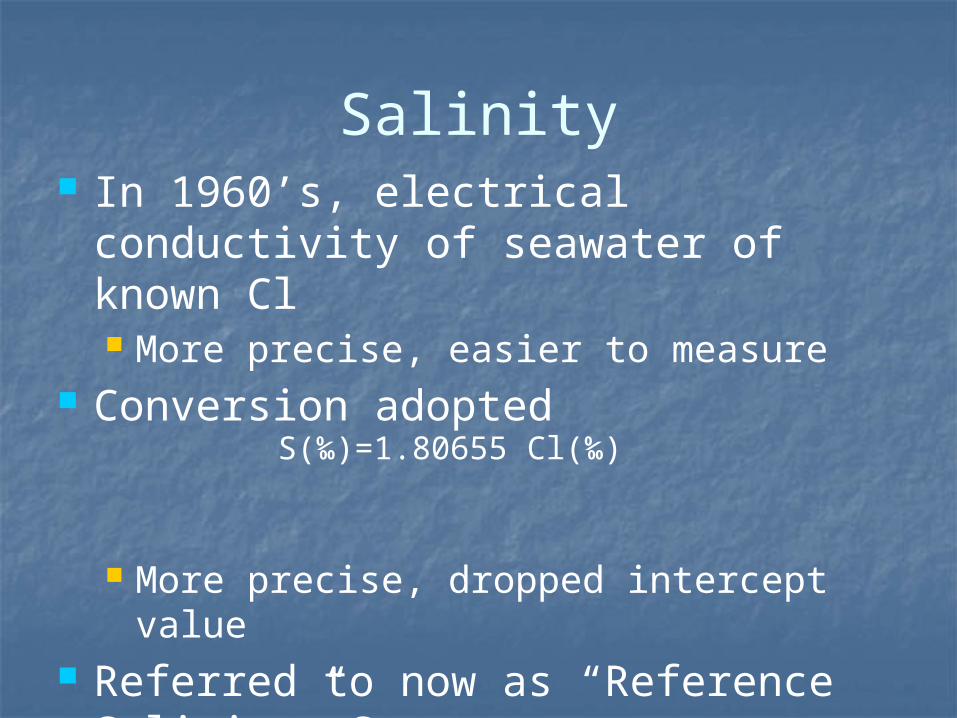
Salinity In 1960’s, electrical conductivity of
seawater of known Cl More precise, easier to measure
Conversion adopted
More precise, dropped intercept value Referred to now as “Reference
Salinity” SR
Units of g/kg or ‰
S(‰)=1.80655 Cl(‰)

Practical Salinity Scale Based on conductivity measurements
to determine Reference Salinity (SR) Practical Salinity (SP) is defined as
Since ratio, it is unitless Originally had units of PSU (Practical
Salinity Units)
S P=( 35.00035.165 )∗( S Rg /kg
)

Absolute Salinity Scale (SA) Defined by
SCOR (Scientific Committee on Oceanic Research)
IAPSO (International Association of Physical Sciences of the Ocean)
Endorsed by IOC (Intergovernmental oceanographic Commission)
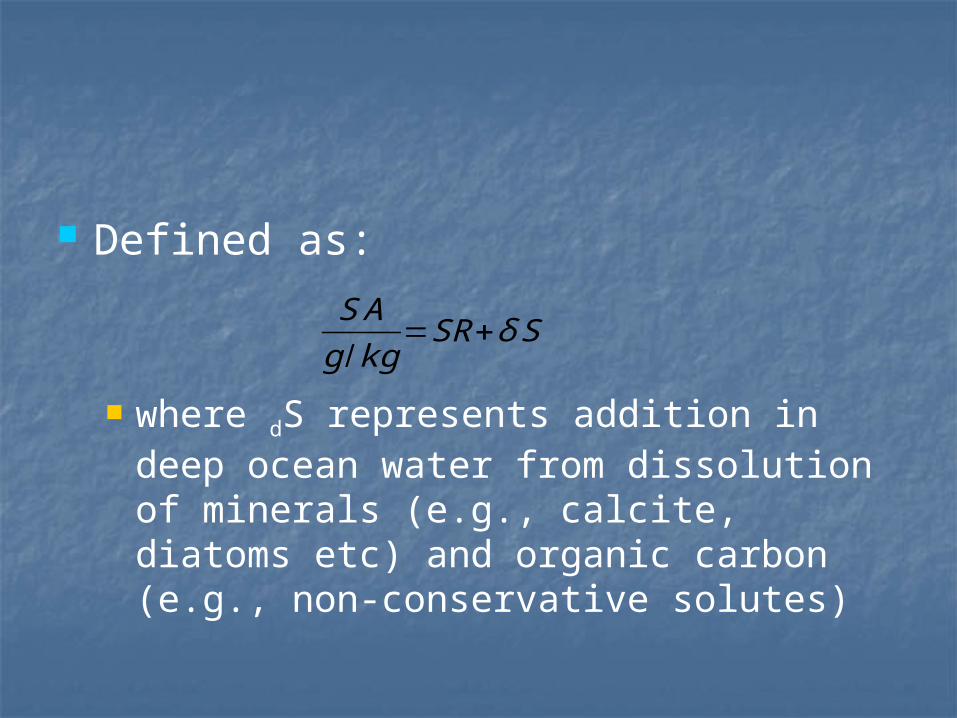
Defined as:
where dS represents addition in deep ocean water from dissolution of minerals (e.g., calcite, diatoms etc) and organic carbon (e.g., non-conservative solutes)
S Ag /kg
=SR+δ S
Other measures of TDS
Refractive index Amount of refraction of light passing
through water Linearly related to concentrations of
dissolved salts Conductivity/resistivity
Current carried by solution is proportional to dissolved ions
Conductivity
Inverse of resistance Units of Siemens/cm Siemen = unit of electrical
conductance 1 Siemen = 1 Amp/volt = 1/Ohm = 1
Mho Conductance is T dependent
Typically normalized to 25º C Called Specific Conductivity
Reporting units
Need to report how much dissolved material (solute) in water, two ways: Mass Moles (& equivalents)
Need to report how much water (solvent) Volume of water, typically solution
amount – analytically easy Mass of water, typically solvent amount
– analytically difficult
Weight units
Mass per unit volume For example: g/L or mg/L
If very dilute solution Mass per unit volume about the same as
mass per mass 1L water ~ 1000 g, BUT variable with T,
P and X as density changes

Molar units Number of molecules (atoms, ions
etc) in one liter of solution Most common – easy to measure
solution volumes Units are M, mM, µM (big M) Example
Na2SO4 = 2Na+ + SO42-
1 mole sodium sulfate makes 2 moles Na+ and 1 mole SO4
2-

Molal Units
Number of molecules (atoms, ions etc) in one kg of solvent Abbreviation: m or mm or mm (little m) Difficult to determine mass of solvent in
natural waters with dissolved components
not used so often in natural waters Useful for physical chemistry because
doesn’t depend on T, P or X (composition of dissolved constituents).
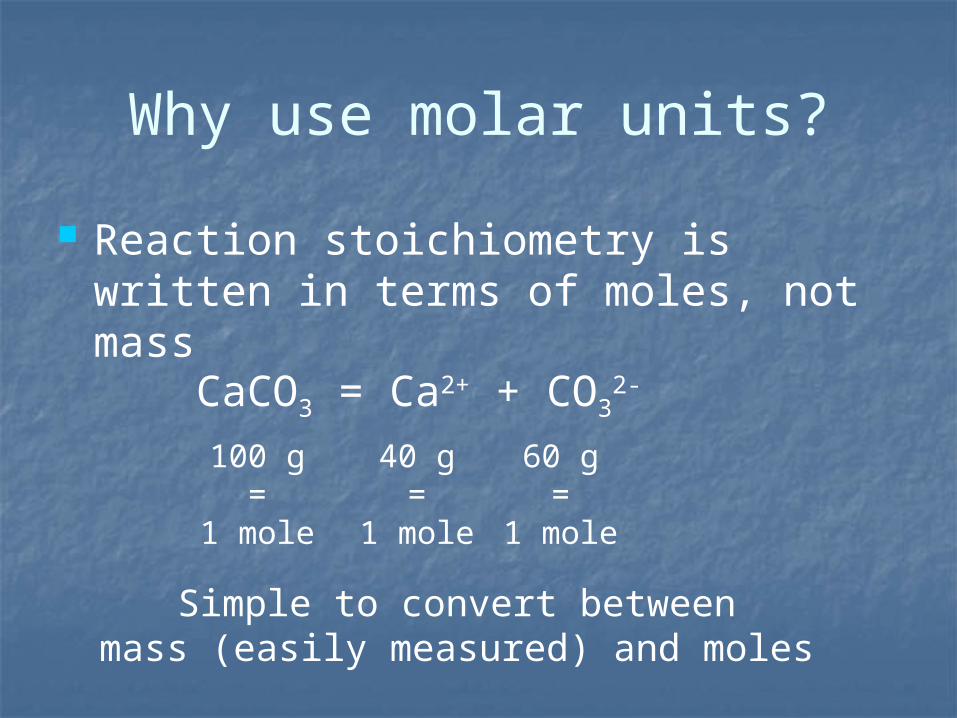
Why use molar units?
Reaction stoichiometry is written in terms of moles, not mass
CaCO3 = Ca2+ + CO32-
100 g=
1 mole
40 g=
1 mole
60 g=
1 mole
Simple to convert betweenmass (easily measured) and moles

Example
Nitrate a pollution of concern Commonly measured as mass Reported as mass of N in NO3
E.g., g N in NO3
NO3 is measured Weight concentration of NO3 is 4 X
bigger than weight concentration of N Molar units of NO3 and N are identical
Mass – Mole conversion
Conversion from weight units to molar units Divide by gram formula weight
Molar units to weight units Multiply by gram formula weight

Alternative – charge units
Equivalents – molar number of charges per volume eq/L or meq/L Used to plot piper diagrams Used to calculate electrical neutrality of
solutions

Calculation: Moles (or millimoles) of ion times its
chargeNa2SO4 = 2Na+ + SO4
2-
1 mole of Na = 1 eq Na solution1 mole of SO4 = 2 eq SO4 solution
Although different number of moles, solution is still electrically neutral
Example

Charge Balance Electrical neutrality provides good
check on analytical error Charge Balance Error – CBE
Note: - = excess anions; + = excess cations
CBE =SmcZc - SmaZa
SmcZc + SmaZaWhere: m = molar concentration of major solutes
z =charge of cation (c) or anion (a)
Possible causes of errors
Significant component not measured Commonly alkalinity – can be estimated
by charge balance Analytical error
+5% difference OK – acceptable + 3% good 0% probably impossible

Graphical data presentation
Cross plots (XY plots) Time series Ternary diagrams Stiff diagram – geographic
distribution Piper diagram – comparison of large
numbers of samples Many others, not used widely

Stiff Diagrams
Cations on left Anions on right Top K+Na & Cl =
seawater Middle Ca & HCO3
(alkalinity) most fresh water Carbonate mineral
reactions Bottom Mg & SO4 – other
major component 4th optional – redox
couples
Drever, 1997
Zaporozec, 1972, GW
Depth
(ft
)

Piper Diagrams
Two ternary diagrams
Projected on quadralinear diagram
Very useful figure for comparing concentrations of numerous water samples

Construction
Convert concentrations to meq/L Use major cations and anions
concentrations Cations = Ca, Mg, Na + K Anions = SO4, Cl, HCO3 + CO3 (or
alkalinity)

Calculate %’s of each element on ternary diagram
For example Ca is:
Plot %’s on ternary diagrams Project each % onto diamond
diagrams
[Ca]
[Ca] + [Mg] + [Na + K]*100
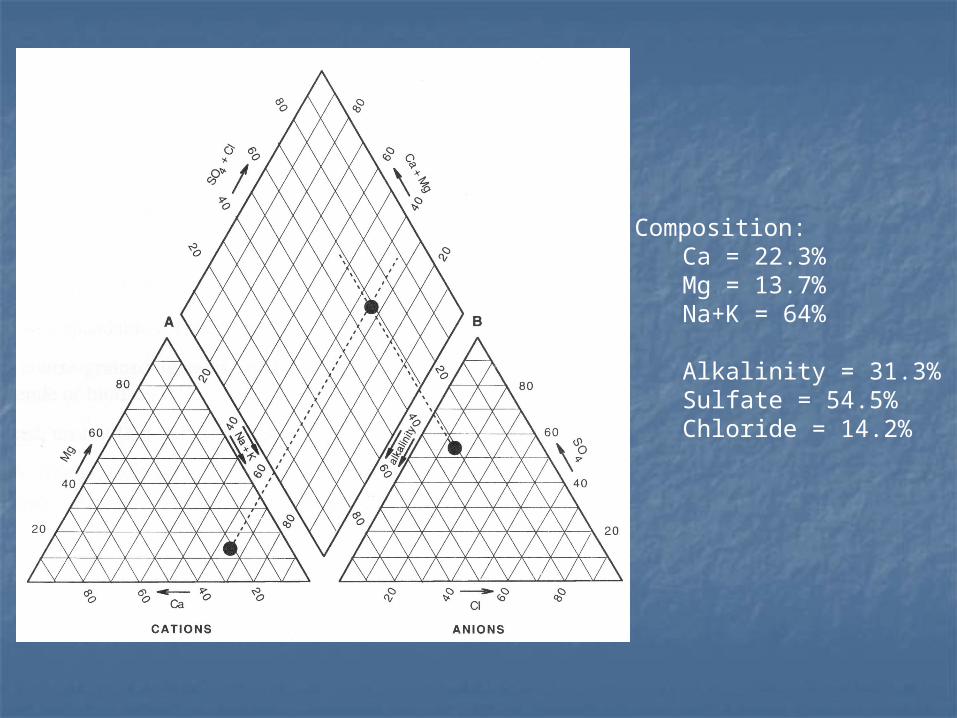
Composition:Ca = 22.3%Mg = 13.7%Na+K = 64%
Alkalinity = 31.3%Sulfate = 54.5%Chloride = 14.2%

Santa Fe water chemistry Mixing
between three sources of water: 1 = shallow
groundwater 2 = deep
groundwater 3 = dilute
Surface water
Moore et al., 2009, J Hydro

Fortunately – computer programs available to make plots for you Stiff diagrams:
http://www.twdb.state.tx.us/publications/reports/GroundWaterReports/Open-File/Open-File_01-001.htm
Piper plots: http//water.usgs.gov/nrp/gwsoftware/GW_Chart/GW_Chart.html
Geochemist workbench http://student.gwb.com/ Download GWB