HYDROGEOCHEMICAL CHARACTERIZATION OF …ijsit.com/admin/ijsit_files/HYDROGEOCHEMICAL...
13
Beka J. E_et al., IJSIT, 2014, 3(5),423-435 IJSIT (www.ijsit.com), Volume 3, Issue 5, September-October 2014 423 HYDROGEOCHEMICAL CHARACTERIZATION OF GROUNDWATER IN AKWA IBOM STATE, NIGERIA Beka J. E 1 , Udom G.J 2 and Akpokodje E.G 3 1,2,3 Department of Geology, University of Port Harcourt, Port Harcourt, Nigeria ABSTRACT Detailed study of the physical and chemical quality analyses of groundwater samples was carried out in Akwa Ibom State in order to delineate aquifers for the drilling of productive boreholes and evaluate the groundwater quality. Detailed analysis of borehole lithologic samples shows a multi-aquifer system, with a sub-regional trend of upper unconfined aquifer and locally restricted subjacent second and third aquifers. The regionally extensive upper unconfined aquifer was logged across boreholes in Abak, Etim Ekpo, Etinan, Ibiono Ibom, Ikono, Ini, Itu, Nsit Atai, Nsit Ibom, Obot Akara, Okobo, Oron, Uruam and Uyo. The depth of this aquifer varies from 10 - 67 meters from coastal to central areas, and 22.5 - 120 meters towards the north.. Thirty two groundwater samples were analyzed for their physico–chemical and microbiological properties, using standard methods. The average temperature of groundwater samples is 27 o C. The water is slightly acidic to slightly alkaline with pH values ranging from 4.28 – 8.92. Electrical conductivity (EC) values range from 20.3 μs/cm to 343.1 μs/cm. Chloride contents in some boreholes are up to 31.30 mg/l, possibly indicating saltwater encroachment in those locations (Ibeno, Mbo, Onna and Udung Uko).. Total Dissolved Solids (TDS) range from 12.60 – 147 mg/l. Total Iron (Fe) values range from 0.01 - 8.5 mg/l. With the exception of Iron, all other analyzed parameters fall within World Health Organisation and Nigeria Standard for Drinking Water Quality permissible limits for potable water. Detailed interpretation of gross hydrogeochemical data suggest that the prevailing hydrogeochemical processes responsible for the groundwater chemistry are attributable to ion exchange, carbonate and silicate weathering, precipitation and dissolution from rocks, through which the water infiltrates.
Transcript of HYDROGEOCHEMICAL CHARACTERIZATION OF …ijsit.com/admin/ijsit_files/HYDROGEOCHEMICAL...

Beka J. E_et al., IJSIT, 2014, 3(5),423-435
IJSIT (www.ijsit.com), Volume 3, Issue 5, September-October 2014
423
HYDROGEOCHEMICAL CHARACTERIZATION OF GROUNDWATER IN
AKWA IBOM STATE, NIGERIA
Beka J. E1, Udom G.J2 and Akpokodje E.G3
1,2,3Department of Geology, University of Port Harcourt, Port Harcourt, Nigeria
ABSTRACT
Detailed study of the physical and chemical quality analyses of groundwater samples was carried out in
Akwa Ibom State in order to delineate aquifers for the drilling of productive boreholes and evaluate the
groundwater quality. Detailed analysis of borehole lithologic samples shows a multi-aquifer system, with a
sub-regional trend of upper unconfined aquifer and locally restricted subjacent second and third aquifers.
The regionally extensive upper unconfined aquifer was logged across boreholes in Abak, Etim Ekpo, Etinan,
Ibiono Ibom, Ikono, Ini, Itu, Nsit Atai, Nsit Ibom, Obot Akara, Okobo, Oron, Uruam and Uyo. The depth of this
aquifer varies from 10 - 67 meters from coastal to central areas, and 22.5 - 120 meters towards the north..
Thirty two groundwater samples were analyzed for their physico–chemical and microbiological properties,
using standard methods. The average temperature of groundwater samples is 27oC. The water is slightly
acidic to slightly alkaline with pH values ranging from 4.28 – 8.92. Electrical conductivity (EC) values range
from 20.3 µs/cm to 343.1 µs/cm. Chloride contents in some boreholes are up to 31.30 mg/l, possibly
indicating saltwater encroachment in those locations (Ibeno, Mbo, Onna and Udung Uko).. Total Dissolved
Solids (TDS) range from 12.60 – 147 mg/l. Total Iron (Fe) values range from 0.01 - 8.5 mg/l. With the
exception of Iron, all other analyzed parameters fall within World Health Organisation and Nigeria Standard
for Drinking Water Quality permissible limits for potable water. Detailed interpretation of gross
hydrogeochemical data suggest that the prevailing hydrogeochemical processes responsible for the
groundwater chemistry are attributable to ion exchange, carbonate and silicate weathering, precipitation and
dissolution from rocks, through which the water infiltrates.

Beka J. E_et al., IJSIT, 2014, 3(5),423-435
IJSIT (www.ijsit.com), Volume 3, Issue 5, September-October 2014
424
INTRODUCTION
Globally, rural communities, particularly in developing nations including Nigeria, have as one of the
major problems, the lack of adequate potable water supply for domestic use. This is the scenario in several
areas, including Akwa Ibom State, because some of the existing water wells which initially produced water
have either dried up, diminished in yield or produced non-potable water. The funds lost or wasted on such
projects would have been properly utilised, if suitable drill sites or depths were recommended from detailed
hydrogeological or geophysical studies.This is the rationale for this research study on Aquifer Delineation and
Hydro-geochemistry.
There are several instances within various regional settings where water boreholes became
unproductive soon after their installation. Within the Nigerian setting, available information indicates that
there was inadequate consideration of existing borehole data to guide the drilling of the boreholes. Studies by
Udom et al(1999) indicate high failure rate of over 70% of the boreholes drilled in Akwa Ibom State, Nigeria.
It is well known that just as in the upstream petroleum sector, well data and site studies are a useful guide to
any drilling operation in the water industry. As a result of these issues, many boreholes have been rendered
redundant in the state. Arising from this, there have been issues of insufficient water supply in the state, thus
resulting in the utilisation of surface waters for domestic water supply. This scenario increases human
exposure to water borne diseases because of vulnerability of surface water to pollution.
Location of Study area:The location of study for this research project is AkwaIbom State. The state occupies
part of the southeastern corner of Nigeria. It is located between latitudes 4:30’and 5:30’ North and
longitudes 7:30’ and 8:20’ East (Fig. 1). Akwa Ibom State is triangular in shape and covers a total land area of
about 6,900 square kilometers, encompassing the Qua Iboe River Basin, the western part of the lower Cross
River Basin and the eastern part of the Imo River Basin. The State has an ocean front which spans a distance
of 129 kilometers from Ikot Abasi in the west to Oron in the southeast.
Beka J. E_et al., IJSIT, 2014, 3(5),423-435
IJSIT (www.ijsit.com), Volume 3, Issue 5, September-October 2014
425
Figure 1: Map of Akwa Ibom State showing the 31 Local Government Areas (modified from FMEMV, 2013)
AIM AND OBJECTIVES OF THE STUDY
To study the physical and chemical water qualities of the groundwater within the area, to determine
the dominant cations and anions and their influence on of the area, compare the results of the study with
international specification (WHO Standard) in order to determine their suitability for domestic and industrial
use

Beka J. E_et al., IJSIT, 2014, 3(5),423-435
IJSIT (www.ijsit.com), Volume 3, Issue 5, September-October 2014
426
LITERATURE REVIEW
Amajor (1989) appraised groundwater exploitation and asserted that the number and kinds of
aquifer, and the fresh/saline water interface is not precisely known. All these studies only cover some aspects
of hydrogeochemistry and water supply problems. It is in view of this fact that Etu-Efetor and Akpokodje
(1990) attempted a detailed stratigraphic analysis of the various geologic/geomorphological units and they
identified a major regional aquifer. However, aquifer parameters and the water qualities of the various
aquifers were not determined.
Amajor (1991) discussed the general aquifer characteristics in Rivers State as well as their
depositional environment, but did not consider aspects of groundwater quality in the research.
Udom et al (1999, 2002), investigated the hydrogeochemistry of some groundwaters in parts of the
Niger Delta and the results show that the water in these areas are soft and low in dissolved constituents (Fe,
Zn, Ca, Mg, Na, and K) except Fe. Salt water encroachment is evidenced in these areas from geoelectrical
studies (Etu-Efeotor et al., 1989; Oteri, 1990)..
Geology and Hydrogeology of the Study Area:The whole of Akwa lbom State is underlain by sedimentary
formations of Late Tertiary and Holocene ages (Edet, 1993; Esu et al, 1999). Deposits of recent alluvium and
beach ridge sands occur along the coast and the estuaries of the Imo River and Qua lboe River, and also along
the flood-plains of creeks. Inland, a greater part of the state consists of coastal plain sands, now weathered
into lateritic layers, especially in Ini, Ikono, Etinan, Ikot Ekpene, Ibiono and ltu LGAs. A belt of shales
associated with sandstones and limestones, north of Nkari and Obotme, extends down to ltu. The latter
lithologies include the late Cretaceous Nsukka Formation at the base followed by the early Tertiary Imo Shale
and the phosphatic Ameke Formation. Upwards, the geologic succession passes imperceptibly into thick
sequences of clays, sands and gravel (Udom, 2002).
METHODOLOGY
(i) Sampling:
Both fieldwork and laboratory analysis were utilized in this research. Thirty one (31) boreholes, one
from each of the 31 Local Government Areas of Akwa Ibom State were analyzed for physico-chemical
parameters. The essence was to provide a regional but detailed overview of the groundwater chemistry of the
area. Various maps of the study area were obtained. Also, data in the form of lithologic logs and Static Water
Level for each of the Local Government Areas within the entire study area were accessed and interpreted.
(ii) Data Collection and Analysis:
(a) Water Sample Collection: Groundwater samples were collected in the sterilized two- litre containers
tightly fitting covers wrapped in black polyethylene plastic bags and put in a cooler to ensure constant

Beka J. E_et al., IJSIT, 2014, 3(5),423-435
IJSIT (www.ijsit.com), Volume 3, Issue 5, September-October 2014
427
temperature. The samples were immediately transported to the laboratory for analysis.
(b) Laboratory Analyses for Water Quality Parameters: All analyses were carried out at a standardized
laboratory, using standard methods. The evaluation of water quality was in accordance with the regulatory
standards set by the Federal Environmental protection Agency FEPA (1991). The approach ensures that the
samples collected were tested in accordance with agreed requirements.
RESULTS AND DISCUSSION
Water samples from the thirty one (31) Local Government Areas of Akwa Ibom State were analyzed
to determine their physicochemical characteristics. See Table 1 and 2
(A) PHYSICOCHEMICAL CHARACTERISTICS:
(i) Electrical Conductivity (ec): Conductivity in water is affected by the presence of inorganic dissolved
solids such as chloride, nitrate, sulfate, and phosphate anions (ions that carry a negative charge) or sodium,
magnesium, calcium, iron, and aluminum cations (ions that carry a positive charge).The average value of
electrical conductivity in groundwater samples in the study area is of 161.6µS/cm, having its highest at
343.1µS/cm in Onna Local Government Area and lowest 20.3µS/cm in Eket Local Government Area.

Beka J. E_et al., IJSIT, 2014, 3(5),423-435
IJSIT (www.ijsit.com), Volume 3, Issue 5, September-October 2014
428
Table 1: Major Ion Concentration Values in Groundwater from some of sampled Locations
Conductivity values are particularly important in water meant for irrigation (Todd, 1980). All the
water from the sampled boreholes in the study area have EC values within permissible regulatory limits of
the WHO (2006) and the NSDWQ (2008) which is 1400µS/cm.
(ii) Total dissolved solids:Total dissolved solids are a measure of the sum of organic and inorganic solutes
in water. The TDS concentration ranges from 12.6mg/l to 147.0mg/l and has an average value of 84.32mg/l
within the study area. This shows that groundwater in the area is fresh in most of the locations. The TDS
values correlate well with conductivity values. The highest TDS values of 147mg/l and 138.2mg/l were
recorded in Etim Ekpo and Onna Local Government Areas, respectively. These areas with the highest Total
Dissolved Solids values show corresponding highest Electronic Conductivity values. The WHO (2006) and the
NSDWQ (2008) permissible limits for TDS is 500mg/l for potable drinking water. Thus, from results obtained
the groundwater samples are potable with respect to TDS. According to Richards (1954), more that 1000mg/l
TDS is good for dying textiles and the manufacture of pulp, paper, plastics and rayon.
Beka J. E_et al., IJSIT, 2014, 3(5),423-435
IJSIT (www.ijsit.com), Volume 3, Issue 5, September-October 2014
429
S/N Parameters Average Maximum Minimum WHO
(2006)
NSDWQ
(2008)
1. Temperature (OC) 27.9 29.8 25 - ambient
2. pH 6.93 8.9 4.2 6.5-8.5 6.5 – 8.5
3. EC (us/cm) 161.68 343.1 20.3 500 1000
4. TDS (mg/l) 84.32 147 12.6 500 500
5. Hardness (mg/l) 82.18 249.4 1.04 500 500
6. Na+(mg/l) 6.20 15.3 0.7 200 200
7. K+(mg/l) 3.43 16.7 0.241 10 -
8. Ca2+(mg/l) 15.18 33.4 1.6 75 75
9. Mg2+ (mg/l) 8.45 16.36 0.22 50 0.2
10. Cl-(mg/l) 18.0 31.3 1.5 250 250
11. HCO3-(mg/l) 21.93 55 4 - -
12. SO42- (mg/l) 9.35 20.9 0 250 100
13. NO3- (mg/l) 2.34 4.63 0.45 50 50
14. Fe (mg/l) 1.83 8.5 0.01 0.3 0.3
15. Mn2+ (mg/l) 4.69 99.8 0 0.1 0.2
16. T.Coliform
(cfu/ml)
0.17 3 0 - 10
Table 2: Statistical Analysis of Values of Analyzed Parameters Averaged Over the Study Locations.
(iii) PH:The pH (hydrogen-ion concentration) of a solution is used to express the intensity of acidity or
alkalinity conditions of that solution. The pH scale ranges from 0-14, values below 7 indicate levels of
increased acidity as the value reduces. Increasing values from 7-14 show increase alkalinity. A solution that
shows a value of 7 at 25:C represents absolute neutrality. The pH values in the study area range from 4.2 to
8.9, indicating that the groundwater in some areas are weakly acidic to very slightly alkaline..
(iv)Temperature:Groundwater temperature is a physical parameter which is widely used in
hydrogeophysical investigation. The range for the groundwater temperature in the study area lies between

Beka J. E_et al., IJSIT, 2014, 3(5),423-435
IJSIT (www.ijsit.com), Volume 3, Issue 5, September-October 2014
430
250C and 29.80C with a mean temperature of 27.90C. However, The WHO (2006) and the NSDWQ (2008)
present no standard value for potable groundwater temperature. Groundwater temperatures have been used
to determine forms of heat transport in karst aquifers (Bundschuh, 1993; Liedl and Sauter, 1998).
Distribution of temperatures within the study area are approximately the same (figure 2).
(v) Iron:The WHO (2006) and the NSDWQ (2008) have permissible limit for iron in portable drinking water
as 0.3mg/l. However, majority of the wells in the area of study show higher concentration values for iron. The
concentration values ranges from 0.01 – 8.5mg/l with a mean value 1.8 mg/l. Exposure of water samples to
air could cause ferrous (Fe2+) ion in them to oxidize to ferric (Fe3+) ion which would precipitate a ferric-
hydroxide which stains laundry, plumbing fixtures and cooking utensils (Udom et al, 1999). High iron
concentration in groundwater poses potential hazards for many industrial processes such as high pressure
boiler feed water, process water, fabric dying, paper making, brewery, distillery, photographic film
manufacture, ice making and food processing which require water that is almost completely iron free (ASTM,
1969
(vi) SODIUM (Na):The ranges of sodium concentration values for groundwater samples from the various
study locations lie between 15.3mg/l to 0.7mg/l (Table 4.3).The WHO (2006) and the NSDWQ (2008)
permissible limit for sodium in portable drinking water is 200mg/l. This indicates the portability of
groundwater in the study area, based on the consideration of this parameter.

Beka J. E_et al., IJSIT, 2014, 3(5),423-435
IJSIT (www.ijsit.com), Volume 3, Issue 5, September-October 2014
431
Figure 2: Overall Groundwater Temperatures of Study Area
(vii) Hardness:Hard water is generally considered as water containing large quantities of dissolved salts, for
example, calcium and magnesium ions. Groundwater hardness in the area of study lies between a range of
249.4mg/l and 1.04mg/l. The values are within the permissible limits of the WHO (2006) and the NSDWQ
(2008) which is 500mg/l for potable water.. Most of the water in the study area is within soft to moderately
hard, except for Etim Ekpo (169.52 mg/l) and Onna (249.4 mg/l), which fall within classification of hard. High
levels of calcium and magnesium account for hardness at these few locations.
(B) HYDROCHEMICAL FACIES:
The diagnostic chemical character of water solutions in hydro systems has been determined with the
application of the concept of hydrochemical facies (Back, 1966). This Approach enables convenient
subdivision of water compositions by identifiable categories and reflects the effect of chemical processes
occurring between the minerals within the subsurface rock units and the groundwater.
Hydrogeochemical spatial display diagrams, such as Piper, Schoeller and Stiff diagrams (Figs. 3 and 4) are
used to recreate the scenario into hydrochemical processes operating in the groundwater system within the
area of study. The Piper diagram (figure 3) shows the relative concentrations of the different ions from the
individual samples based on average values for each location. The Piper diagram was used to characterize the
22
23
24
25
26
27
28
29
30
31
Ab
ak
East
ern
Ob
olo
Eket
Esit
Eke
t
Essi
en U
dim
Etin
an
Etim
Ekp
o
Iben
o
Ibes
ikp
o A
suta
n
Ibio
no
Ibo
m Ika
Iko
no
Iko
t A
bas
i
Iko
t Ek
pen
e Ini
Itu
Mb
o
Mp
at E
nin
Nsi
t A
tai
Nsi
t Ib
om
Nsi
t U
biu
m
Ob
ot
Aka
ra
Oko
bo
On
nn
a
Oro
n
Ud
on
g U
ko
Uka
naf
un
Uru
an
Uru
e-O
ffo
ng/
Oru
ko
Oru
k A
nam Uyo
Borehole Location
Tem
per
atu
re (
OC
)

Beka J. E_et al., IJSIT, 2014, 3(5),423-435
IJSIT (www.ijsit.com), Volume 3, Issue 5, September-October 2014
432
various water types within the area of study. It also permits the cations and anion compositions of
characterizing the various groundwater types within the area. It permits the cation and anion compositions of
many samples to be represented on a single graph in which major grouping or trends in the data can be
discerned visually (Freeze and Cherry, 1979).
Piper diagram for the study area shows that there is a mixture of two types of water with variable
concentration of major ions. These are Ca-Mg-Cl-SO4 type and Na-K-Cl-SO4 water types. The second is
influenced by NO3 (Fig. 4)
The Schoeller Logarithmic plots (figure 4) (major ion distribution for cations and anions) of data
further confirmed this water type. The peaks indicate the dominant ions in the water samples while the
troughs indicate the less dominant ions. In this study, the dominant ions are Ca, Mg for cations and Cl, HCO3
for anions.
Figure 3: Piper Diagram of Study Area
Piper Diagram
20%
20%
20%
40%
40%
40%
60%
60%
60%
80%
80%
80%
Mg
Ca
20%
20%
20%
40%
40%
40%
60%
60%
60%
80%
80%
80%
SO
4
Cl
SO
4 +
Cl C
a +
Mg
Na +
K HC
O3
80%
80%
60%
60%
40%
40%
20%
20%
A
A
A
CC
C
A
A
A
K
K
K
A
A
A
I
I
I
D
D
D
E
E
E
BB
B
H
H
H
D
D
D
K
K
K
D D
D
EE
E
M
M
M
M
M
M
C
C
C
II
I
M
M
M
O O
O
D
D
D
O
O
O
A
A
A
H
H
H
AA
A
B
B
B
LL
L
M
M
M
DD
D
A
A
A
I
I
I
EketEsit Eket
Itu
Legend
A Abak
C Eastern Obolo
A Eket
K Esit Eket
A Essien Udim
I Etinan
D Etim Ekpo
E Ibeno
B Ibesikpo...
H Ibiono Ibom
D Ika
K Ikono
D Ikot Abasi
E Ikot Ekpene
M Ini
M Itu
C Mbo
I Mpat Enin
M Nsit Atai
O Nsit Ibom
D Nsit Ubium
O Obot Akara
A Okobo
H Onna
A Oron
B Orue Offong...
5 More...
Beka J. E_et al., IJSIT, 2014, 3(5),423-435
IJSIT (www.ijsit.com), Volume 3, Issue 5, September-October 2014
433
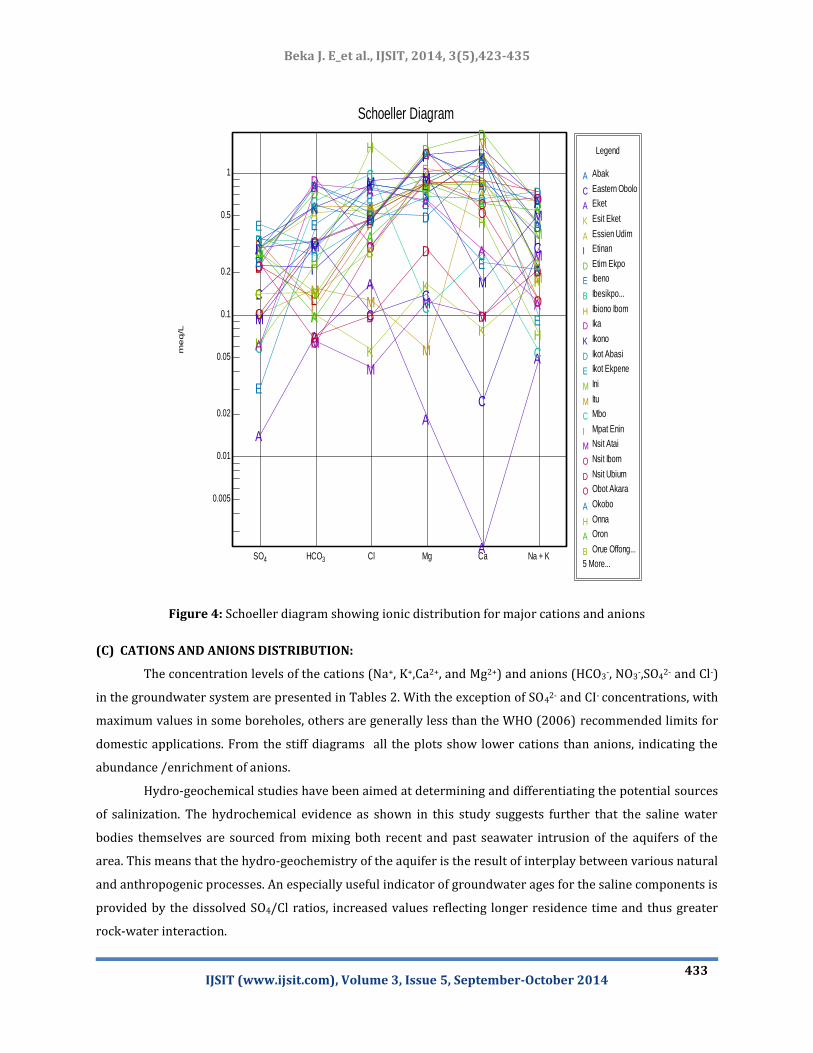
Figure 4: Schoeller diagram showing ionic distribution for major cations and anions
(C) CATIONS AND ANIONS DISTRIBUTION:
The concentration levels of the cations (Na+, K+,Ca2+, and Mg2+) and anions (HCO3-, NO3
-,SO42- and Cl-)
in the groundwater system are presented in Tables 2. With the exception of SO42- and CI- concentrations, with
maximum values in some boreholes, others are generally less than the WHO (2006) recommended limits for
domestic applications. From the stiff diagrams all the plots show lower cations than anions, indicating the
abundance /enrichment of anions.
Hydro-geochemical studies have been aimed at determining and differentiating the potential sources
of salinization. The hydrochemical evidence as shown in this study suggests further that the saline water
bodies themselves are sourced from mixing both recent and past seawater intrusion of the aquifers of the
area. This means that the hydro-geochemistry of the aquifer is the result of interplay between various natural
and anthropogenic processes. An especially useful indicator of groundwater ages for the saline components is
provided by the dissolved SO4/Cl ratios, increased values reflecting longer residence time and thus greater
rock-water interaction.
Schoeller Diagram
SO4 HCO3 Cl Mg Ca Na + K
me
q/L
0.005
0.01
0.02
0.05
0.1
0.2
0.5
1
A
A
A
A
A
A
C
C
C
C
C
C
A
A
A
A
A
A
K
K
K
K
K
A
A A
AA
A
I I
I
I
I
ID
D
D
DD
D
E
E
EE
EE
B B
BB
B
B
H
H H
H
H
H
D
D
D
D D
D
K
K
KK
K
K
DD
D
D DD
E
E
E
E
E
E
M
M
M
M M
M
M
MM
M
M
M
C
C
C
C
C
C
I
I
I
I I
I
M
M
MM
MO
O
O
O
O O
D
D
D
D
D
O
O
O
O
O
O
A
AA
A
AA
H
H
H
H
H
H
A
A
A
A
AA
B B
B
BB
BL
L
L
L LL
M
M
M M
M
M
D
D
D D
D
D
A
A AA
A
A
I I
I
I I
I
Legend
A Abak
C Eastern Obolo
A Eket
K Esit Eket
A Essien Udim
I Etinan
D Etim Ekpo
E Ibeno
B Ibesikpo...
H Ibiono Ibom
D Ika
K Ikono
D Ikot Abasi
E Ikot Ekpene
M Ini
M Itu
C Mbo
I Mpat Enin
M Nsit Atai
O Nsit Ibom
D Nsit Ubium
O Obot Akara
A Okobo
H Onna
A Oron
B Orue Offong...
5 More...

Beka J. E_et al., IJSIT, 2014, 3(5),423-435
IJSIT (www.ijsit.com), Volume 3, Issue 5, September-October 2014
434
The physico-chemical characteristics of the groundwater in the study area generally reflect a
situation of salinization that is associated principally with marine intrusion. This can be appreciated from the
Stiff diagrams nevertheless, some deviations from this simple scheme occur. These deviations can be
significant and reveal some interesting hydro- geochemical and hydrodynamic aspects.
Groundwater contamination by chloride can also result from other means than by seawater
intrusion. Hem (1985) suggested that seawater intrusion into coastal aquifers may also be indicated by
sulphate ionic proportions similar to that in seawater, and by low Ca and Mg concentrations. Industrial
activities and urbanization can alter groundwater chemistry as reported by Knuth et al. (1989) which
presents an integrated approach involving hydrogeological, geochemical, and geophysical methods to
determine the source of salinity contaminating a groundwater supply in the area.
REFERENCES
1. Akpokodje, E.G., Etu-Efeotor, J.O.,& Mbeledogu,I.U (1996)”A study of environmental effects of deep
subsurface injection of drilling waste on water resources of the Niger Delta” CORDEC, University of Port
Harcourt, Choba, Port Harcourt, Nigeria.
2. Alabo and Pandey, p. (1987) Distribution and Engineering Properties of Red Soils in the Central Lower
Niger Delta. Proceeding from the Ninth Regional Conference for Africa, Rotterdam, the Netherlands:
ISSSMFE, A.A. Balkema Publishers.
3. Amajor, L.C. (1991) Aquifer in the Benin Formation (Miocene-Recent), Eastern Niger Delta, Nigeria:
Lithostartigraphy, Hydraulics, and Water Quality. Environ. Geol. Water Sci., Vol.17, No. 2: 85-101.
4. Beka, J. E. (2014). Assessment of Hydrocarbon Pollution Potential of Aquifers in Parts of Akwa Ibom State,
Nigeria. Paper Presented at 7th NAPE Mini – Conference for Tertiary Institutions, 5th – 8th June, 2014;
University of Port Harcourt, Nigeria.
5. Bolaji, T.A. (2009). Hydrogeochemistry and quality index of groundwater in Port Harcourt, Nigeria. Msc
Thesis, University of Port Harcourt, Nigeria. Pp186.
6. Bolaji, T.A, Tse, C.A. (2009). Spatial Variation in groundwater geochemistry and water quality index in
Port Harcourt. Scientia Africana, 8(1); 134-155.
7. .Ekwere S J, Ukpong E E, 1994. Geochemistry of saline water in Ogoja, Cross River State of Nigeria. Journal
of Mining and GeologyVol 30 No 1: 11-15.
8. Etu-Efeotor, J.O. and Odigi, M.I., (1983) Water Supply Problems in the Eastern Niger Delta, Journ. Min.

Beka J. E_et al., IJSIT, 2014, 3(5),423-435
IJSIT (www.ijsit.com), Volume 3, Issue 5, September-October 2014
435
Geol., 20 (1 And 2), 183-105.
9. Etu-Efeotor, J.O. and Akpokodje , E.G (1990) Aquifer Systems of Niger Delta. JMG Vol. 26 No 2, 279-284.
10. Ngah, S.A. (1990). Groundwater resource development in the Niger Delta: problems and prospects.
Proceedings of the 6th International Congress of the International Association of Engineering Geology,
Amsterdam, Netherlands, pp80-94.
11. Udom, G. J. (2004). Regional Hydrogeology of Akwa Ibom State, Nigeria Using Lithological, Pump Testing
and Resistivity Data. Unpolished PhD Thesis, University of Calabar.
12. Udom, G. j.; Etu-Efeotor, J.O. and Esu, E.O. (1999). Hydro chemical evaluation of groundwater in parts of
Port Harcourt and Tai-Elemi Local Government Area, River., Global Journal of pure and Applied Sciences,
Vol.5,pp546-552.
13. Udom, G.J., Ushie, F. A., and Esu, E.O. (2002). A. geochemical survey of groundwater in Khana and Gokana
Local Government Area of Rivers State, Nigeria., J.Appl. Sci., $ Environ. Mgt., Vol1,pp51-59.
14. Udom G..j.; Etu-Efeotor, J.O. and Ekere,S. J. (1998). Quality Status of Groundwater in Calabar Municipality,
Southeastern Nigeria. Global Journal of pure and Applied Sciences, 4(2):163-169.
15. World Health Organization (WHO). (2006). International Standards for Drinking Water and Guidelines
for water quality. World Health Organization, Geneva.