HYDROGENOTROPHIC DENITRIFICATION OF AQUACULTURE WASTEWATER...
110
HYDROGENOTROPHIC DENITRIFICATION OF AQUACULTURE WASTEWATER USING HOLLOW FIBER MEMBRANE BIOREACTOR by Nguyen Quang Hung A thesis submitted in partial fulfillment of the requirements for the degree of Master of Engineering Examination Committee: Prof. C. Visvanathan (Chairperson) Prof. Chongrak Polprasert Prof. Nguyen Cong Thanh Nationality: Previous Degree: Vietnamese Bachelor of Engineering in Environmental Technology Hanoi University of Technology Hanoi, Vietnam Scholarship Donor: PetroVietnam Asian Institute of Technology School of Environment, Resources and Development Thailand May 2006 i
Transcript of HYDROGENOTROPHIC DENITRIFICATION OF AQUACULTURE WASTEWATER...
HYDROGENOTROPHIC DENITRIFICATION OF AQUACULTURE WASTEWATER USING HOLLOW FIBER MEMBRANE
BIOREACTOR
by
Nguyen Quang Hung
A thesis submitted in partial fulfillment of the requirements for the degree of Master of Engineering
Examination Committee: Prof. C. Visvanathan (Chairperson) Prof. Chongrak Polprasert Prof. Nguyen Cong Thanh
Nationality:
Previous Degree:Vietnamese Bachelor of Engineering in Environmental Technology Hanoi University of Technology Hanoi, Vietnam
Scholarship Donor: PetroVietnam
Asian Institute of Technology School of Environment, Resources and Development
Thailand May 2006
i

Acknowledgments The author takes this opportunity to deeply express his profound gratitude, most sincere appreciation and utmost thanks to his advisor, Prof. C. Visvanathan for his excellent guidance, valuable suggestions and continued encouragement during the whole thesis period. The author wishes to express deepest sincere thanks to Prof. Chongrak Polprasert and Prof. Nguyen Cong Thanh, for their valuable comments, critical ideas and serving as members of examination committee. The author gratefully acknowledges the PetroVietNam for granting him the scholarship and Dzung Quat Refinery Project Management Board for providing him favorable conditions which allow him to pursue his study at AIT. The author wishes to present sincere thanks to all staffs and his lab colleagues in the Environmental Engineering Program for friendship, help and moral support, which contributed in many ways to the completion of this thesis. Acknowledgement is also brought to Two-stage Master Program for valuable support and guidance during the time studying at AITCV as well as AIT. The author’s sincere gratitude goes to Dr. Porntip Sridang, Prince of Songkla University, Thailand for her valuable comment and suggestion. Thanks also extend to Prof. Visvanathan’s research associates, research assistants and other doctoral and master students for their valuable and critical suggestions and discussions throughout the study and also in my experimental work. Sincere appreciation is addressed to all his friends in and outside AIT who assisted the author through difficult times, which contributes to the success of this study. Finally, the author would like to express his deepest gratitude and dedicate this small piece of work to his dear wife Thanh Hao, lovely son Viet Hung, his beloved parents and his brother and sisters for their sacrifices, continuous inspiration, encouragement, love and support during his long absence from home.
ii

Abstract Major problem of aquaculture activities is discharge of wastewater with high concentration of nutrient that causes eutrophication of receiving bodies. A hydrogenotrophic denitrification system, which consists of continuous membrane bioreactors, was evaluated for removal of organic matter and nitrate from synthetic aquaculture wastewater for recycle purpose. Two membrane bioreactors systems namely aeration-denitrification (AD) and denitrification-aeration (DA) systems were studied with inlet concentration of organic matter and nitrate nitrogen of 50 mg/L. AD system was experimented at hydraulic retention time (HRT) of 9, 6, 4, 3 and 2 hours with using buffer (K2HPO4 and KH2PO4) and using CO2 at HRT of 3, 2.5 and 2 hours for controlling pH. DA system was operated at HRT of 3, 2.5 and 2 hours with using CO2 to control pH. The results in AD system with using buffer showed that, removal efficiency reached 100%, 98%, 95%, 86% and 65%; and denitrification rate achieved 104, 191, 280, 332 and 378 g/m3.day at HRT of 9, 6, 4, 3 and 2 hours respectively. COD outlet at denitrification reactor is 20-40mg/L this value is higher than inlet (10-15mg/L) due to soluble microbial products. The results in AD system with using CO2 indicated that, average removal efficiency was 88.3%, 72% and 66%; and denitrification rate was 343, 378 and 379 g/m3.day at HRT of 3, 2.5 and 2 hours respectively. Nitrite accumulation in AD system using CO2 was less than using buffer to control pH. In DA system, not only the sequence of reactors but also function of membrane was changed from diffusion to suction, denitrification rate and efficiency of removal were almost the same with original case but water quality in term of COD removal, turbidity, SS, nitrite and dissolved oxygen were very good. The study has demonstrated that this system can maintain acceptable water quality for aquaculture activity in a closed recirculating system without discharge.
iii

Table of Contents Chapter Title Page
Title Page i Acknowledgements ii Abstract iii Table of Contents iv List of Tables v List of Figures vi List of Abbreviations vii
1 Introduction 1 1.1 Background 1 1.2 Objectives of study 2 1.3 Scope of study 2 2 Literature review 2.1 Overview of aquaculture wastewater 3 2.1.1 Characteristics of aquaculture wastewater 3 2.1.2 Effects of aquaculture wastewater 6 2.1.3 Water quality for aquaculture pond 7 2.2 Treatment of aquaculture wastewater 7 2.2.1 Organic matter removal 7 2.2.2 Nitrogen removal 8 2.2.3 Phosphate removal 12 2.2.5 Recent studies on treatment of aquaculture
wastewater 13
2.3 Hydrogenotrophic denitrification 17 2.3.1 Theory 17 2.3.2 Hydrogenotrophic denitrification in water treatment 18 2.3.3 Hydrogenotrophic denitrification in wastewater
treatment 20
2.4 Gas permeable membrane 22 2.4.1 Fundamentals of gas transfer 22 2.4.2 Membrane as gas diffuser 23 2.5 Hydrogenotrophic hollow fiber membrane biofilm reactor for
denitrification 24
2.6 Influence factors of hydrogenotrophic denitrification incorporating with hollow fiber membrane bioreactor
25
2.6.1 Effect of pH 25 2.6.2 Effect of hydrogen pressure 26 2.6.3 Membrane fouling 27 2.6.4 Biofilm layer 27 2.6.5 Dissolved Oxygen 27 3 Methodology 28 3.1 Introduction 28 3.2 Feed wastewater, and microorganisms 29
iv
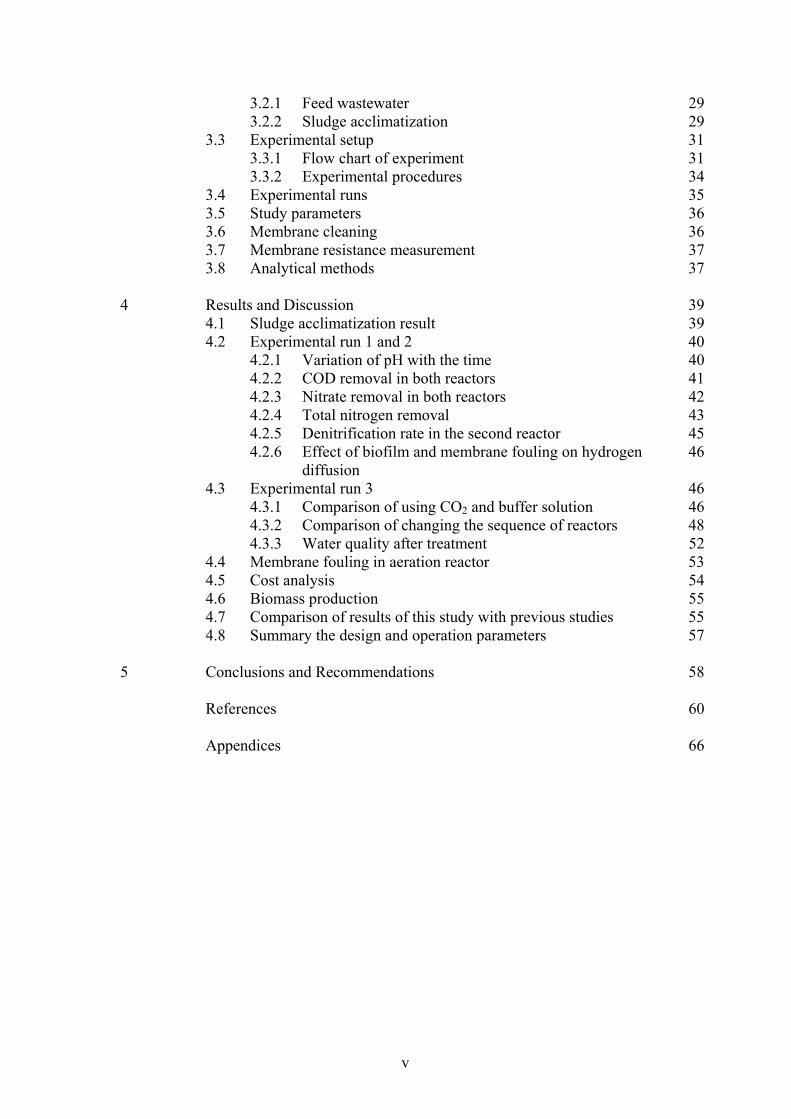
3.2.1 Feed wastewater 29 3.2.2 Sludge acclimatization 29 3.3 Experimental setup 31 3.3.1 Flow chart of experiment 31 3.3.2 Experimental procedures 34 3.4 Experimental runs 35 3.5 Study parameters 36 3.6 Membrane cleaning 36 3.7 Membrane resistance measurement 37 3.8 Analytical methods 37 4 Results and Discussion 39 4.1 Sludge acclimatization result 39 4.2 Experimental run 1 and 2 40 4.2.1 Variation of pH with the time 40 4.2.2 COD removal in both reactors 41 4.2.3 Nitrate removal in both reactors 42 4.2.4 Total nitrogen removal 43 4.2.5 Denitrification rate in the second reactor 45 4.2.6 Effect of biofilm and membrane fouling on hydrogen
diffusion 46
4.3 Experimental run 3 46 4.3.1 Comparison of using CO2 and buffer solution 46 4.3.2 Comparison of changing the sequence of reactors 48 4.3.3 Water quality after treatment 52 4.4 Membrane fouling in aeration reactor 53 4.5 Cost analysis 54 4.6 Biomass production 55 4.7 Comparison of results of this study with previous studies 55 4.8 Summary the design and operation parameters 57 5 Conclusions and Recommendations 58
References 60 Appendices 66
v
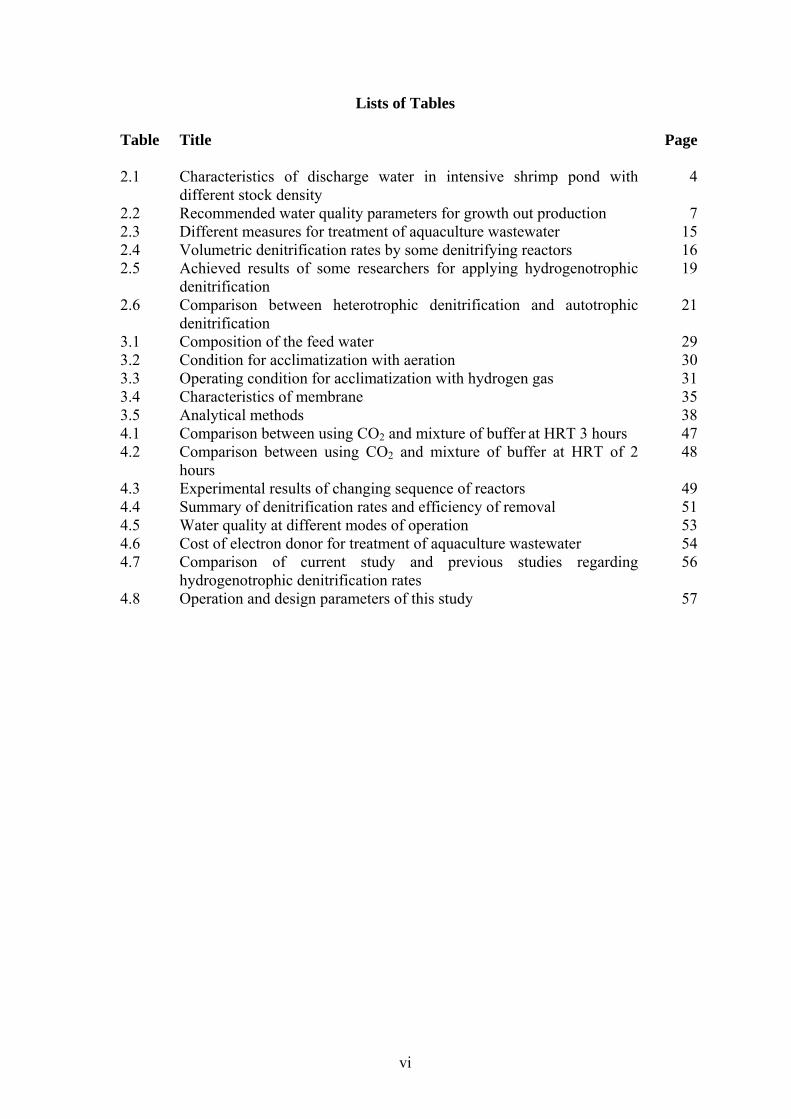
Lists of Tables Table Title Page 2.1 Characteristics of discharge water in intensive shrimp pond with
different stock density 4
2.2 Recommended water quality parameters for growth out production 72.3 Different measures for treatment of aquaculture wastewater 152.4 Volumetric denitrification rates by some denitrifying reactors 162.5 Achieved results of some researchers for applying hydrogenotrophic
denitrification 19
2.6 Comparison between heterotrophic denitrification and autotrophic denitrification
21
3.1 Composition of the feed water 293.2 Condition for acclimatization with aeration 303.3 Operating condition for acclimatization with hydrogen gas 313.4 Characteristics of membrane 353.5 Analytical methods 384.1 Comparison between using CO2 and mixture of buffer at HRT 3 hours 474.2 Comparison between using CO2 and mixture of buffer at HRT of 2
hours 48
4.3 Experimental results of changing sequence of reactors 494.4 Summary of denitrification rates and efficiency of removal 514.5 Water quality at different modes of operation 534.6 Cost of electron donor for treatment of aquaculture wastewater 544.7 Comparison of current study and previous studies regarding
hydrogenotrophic denitrification rates 56
4.8 Operation and design parameters of this study 57
vi
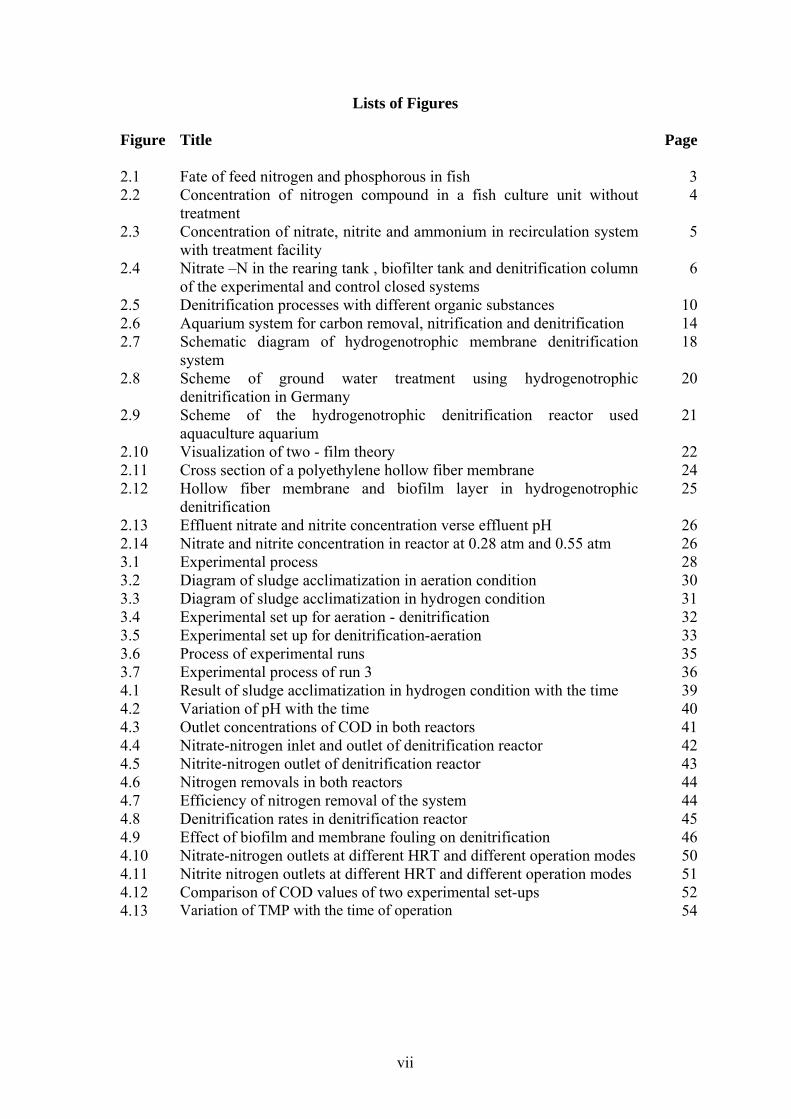
Lists of Figures Figure Title Page 2.1 Fate of feed nitrogen and phosphorous in fish 32.2 Concentration of nitrogen compound in a fish culture unit without
treatment 4
2.3 Concentration of nitrate, nitrite and ammonium in recirculation system with treatment facility
5
2.4 Nitrate –N in the rearing tank , biofilter tank and denitrification column of the experimental and control closed systems
6
2.5 Denitrification processes with different organic substances 102.6 Aquarium system for carbon removal, nitrification and denitrification 142.7 Schematic diagram of hydrogenotrophic membrane denitrification
system 18
2.8 Scheme of ground water treatment using hydrogenotrophic denitrification in Germany
20
2.9 Scheme of the hydrogenotrophic denitrification reactor used aquaculture aquarium
21
2.10 Visualization of two - film theory 222.11 Cross section of a polyethylene hollow fiber membrane 242.12 Hollow fiber membrane and biofilm layer in hydrogenotrophic
denitrification 25
2.13 Effluent nitrate and nitrite concentration verse effluent pH 262.14 Nitrate and nitrite concentration in reactor at 0.28 atm and 0.55 atm 263.1 Experimental process 283.2 Diagram of sludge acclimatization in aeration condition 303.3 Diagram of sludge acclimatization in hydrogen condition 313.4 Experimental set up for aeration - denitrification 323.5 Experimental set up for denitrification-aeration 333.6 Process of experimental runs 353.7 Experimental process of run 3 364.1 Result of sludge acclimatization in hydrogen condition with the time 394.2 Variation of pH with the time 404.3 Outlet concentrations of COD in both reactors 414.4 Nitrate-nitrogen inlet and outlet of denitrification reactor 424.5 Nitrite-nitrogen outlet of denitrification reactor 434.6 Nitrogen removals in both reactors 444.7 Efficiency of nitrogen removal of the system 444.8 Denitrification rates in denitrification reactor 454.9 Effect of biofilm and membrane fouling on denitrification 464.10 Nitrate-nitrogen outlets at different HRT and different operation modes 504.11 Nitrite nitrogen outlets at different HRT and different operation modes 514.12 Comparison of COD values of two experimental set-ups 524.13 Variation of TMP with the time of operation 54
vii

List of Abbreviations AD Aeration-Denitrification sequence BOD Biochemical Oxygen Demand COD Chemical Oxygen Demand DA Denitrification-Aeration sequence DNR Denitrification rate EBRP Enhanced biological phosphorous removal HLR Hydraulic Loading Rate HRT Hydraulic Retention Time mg Milligram mL Milliliter N Nitrogen NTU Nephelometric Turbidity Unit NUR Nitrogen Utilization Rate P Phosphorous PAO Polyphosphate accumulating organisms PHA Polyhydroxyalkanoates SRT Sludge Retention Time TAN Total Ammonium Nitrogen TMP TransMembrane Pressure USEPA United States Environmental Protection Agency WHO World Health Organization
viii

Chapter 1
Introduction 1.1 Background Aquaculture has been developed steadily over the last decade in response to the increasing world market demand. Besides, it also discharges into environment an enormous amount of wastewater with high concentration of nitrites, nitrates, and phosphorus, which can cause eutrophication on receiving waters and affect benthic fauna, macroalgal growth and diversity, epiphyte communities, phytoplankton, zooplankton, and bacterial communities. These lead to the disease outbreaks and environmental degradation in aquaculture (Paez-Osuna, 2000). Aquaculture industry is now looking for a better way to treat these wastewaters prior to discharge into the receiving waters or prior to circulation to the aquaculture pond. In recirculating systems, control of dissolved oxygen and organic matter is accomplished by gas exchange, and ammonium by the nitrification process. The end product of the nitrification process, the nitrate ion, tend to accumulate in closed recirculating system (Grommen et al., 2006). Reduction of nitrate concentration in the system can be accomplished by exchanging a fraction of the water in the system with water low in nitrate. This way is not a good approach due to cost of large water exchange especially in some areas which are scare of water and low environmental assimilative capacity, and because of legislative restrictions on effluent discharges (Grguric et al., 2000). Or it can be accomplished by the process of biological denitrification in which nitrate is reduced to gaseous nitrogen product, which are released to the atmosphere. Traditionally, organic electron donors, such as methanol, are used for this purpose. Anaerobic bacteria will use nitrate as terminal electron acceptor under anoxic conditions. This process must be carefully controlled as overdosing of the organic electron donor can lead to the severe water quality problems (Ergas and Reuss, 2001). To overcome the need dosing of an organic electron donor, the use of biodegradable polymers was suggested, in which the polymer acts as biofilm carrier and carbon source (Boley et al., 2000). The organic matter, which naturally accumulates in recirculating fish culture system, has also been used as electron donor for denitrification reactor (Arbiv and van Rijn, 1995). Elemental sulfur has been used as electron donor for autotrophic denitrification, but has some disadvantages, such as consumption of alkalinity and production of sulphates (Koenig and Liu, 1996). Hydrogen gas is a safe alternative to organic electron donors and element sulphur, as it is non toxic and does not give rises to unwanted by-products (Rezania et al., 2005). Furthermore, it is not expensive and generates 50% less microbial biomass than traditional electron donors, such as methanol (Ergas and Reuss, 2001). Using hydrogen gas as the electron donor, the reaction of hydrogenotrophic denitrification will occur in the absence of oxygen, hydrogen gas as electron donor; and the nitrate is reduced to nitrogen, which is a harmless gas to dispose. The limitation of using hydrogenotrophic denitrification is the low solubility of hydrogen gas into a closed space, leading to its accumulation and explosion (Ergas and Reuss, 2001). Several studies have reported on using gas permeable membrane as an effective method of dispersing the gas into a reactor with high efficiency (Pankhania and Semmens, 1994; Ahmed and Semmens, 1992). In using a bubble-free permeable membrane, delivery of hydrogen gas was successful without creating an explosive environment (Lee and Rittmann, 2000; Ergas and Reuss, 2001; Mo et al., 2005).
1

This research study is conducted to investigate the performance of hydrogenotrophic denitrification using permeable hollow fiber membrane in treating aquaculture wastewater. 1.2 Objectives of study This study focuses on hydrogenotrophic denitrification using hollow fiber membrane bioreactor. It was conducted to treat nutrient rich aquaculture wastewater using autotrophic, hydrogen-oxidizing microorganisms. The specific objectives are as follows:
• To investigate the potential of autotrophic, hydrogen oxidizing bacteria in denitrifying aquaculture wastewater;
• To identify the various design parameters and operational requirements, which play a significant role in operation and performance of hydrogenotrophic denitrification in hollow fiber membrane bioreactor;
• To optimize the operating conditions which could project its application on a large scale.
1.3 Scope of study In this research, a laboratory scale gas permeable membrane bioreactor was fabricated, performing hydrogenotrophic denitrification and treating synthetic aquaculture wastewater. Various operating conditions were subjected in attempt to optimize the denitrification process and obtained the most feasible wastewater treatment.
2

Chapter 2
Literature Review
2.1 Overview of aquaculture wastewater 2.1.1 Characteristics of aquaculture wastewater In aquaculture culture system, especially in extensive culture the primary source of nitrogen and phosphorous in the pond water is derived from feed application. However, not all of the nutrient inputs would be integrated into fish biomass. A large proportion of nitrogen and phosphorous reach the pond as metabolic waste and uneaten feed. Only about 30% feed N and P are retained by salmonid fed, even if they consume all of the feed fed. Feed N and P not retained by the fish are excreted (Figure 2.1).
Food: 100% N 100% P
Retained:30% N 32% P
Effluent:70% N 68% P
Dissolved:87% N 10-40% P
Solids: 13% N 60-90% P
Figure 2.1 Fate of feed nitrogen and phosphorus in fish (Source: http://aquanic.org/publicat/state/il-in/ces/garling.pdf)
The pollutant load discharged into the environment from aquaculture systems has been calculated by many researchers. Suzuki et al. (2003) found that one ton of produced fish generates 0.8 kg of nitrogen/day and 0.1 kg of phosphorous/day. While, Pillay (1992) reported that one kg of fish production discharges amount of 577g of BOD, 90.4g of nitrogen and 10.5 g of phosphorous. The result from study of Lin et al. (1993) showed that with shrimp stocking densities of 30-50/m2, the average harvest of 5 tons to 6 tons/crop would require 10-12 tons of feed, assuming a food conversion ratio of 2. However, only about 20% of the feed is incorporated into shrimp biomass, so approximately 8-10 tons of feed end up as uneaten food and excreted matter of shrimp. Yomjinda (1993) showed that in catfish culture, intensive culture, among 57-58% of nitrogen in feed, 16% nitrogen accumulated in pond sediment and 22% nitrogen still remain in the water; 54-59% phosphorous of feed was released as water material and uneaten feed, 26-30% accumulated in mud and 14.5-17.6% in water body. In intensive shrimp culture, 11.56% nitrogen and 14.11% phosphorous of nutrient input remained in water body; 19% and 36.21% accumulated in sediment (Satapornvanit, 1993). In Thailand,
3
shrimp pond effluent annually contribute an estimated 187,500 tones of organic matter, 13,050 tone of nitrogen and 4200 tones of phosphorous to environment (Lin et al., 1993). Based on the facts and figures it concludes that aquaculture wastewater is characterized by rich nutrient such as nitrogen compound, phosphorous and organic matter. Characteristics of wastewater depend on the amount of water exchange through system. For the open loop system (water comes in and come out without recycle) concentration of pollutants is presented as table 2.1.
Table 2.1 Characteristic of discharge water in intensive shrimp pond with different stock density (Dierberg et al., 1996)
Stocking density (No/m2) 30 40 50 60 70
NO2--N, mg/L 0.02 0.01 0.06 0.08 0.08
NO3--N, mg/L 0.07 0.06 0.15 0.15 0.15
TAN, mg/L 0.98 0.98 6.36 7.87 6.50
Total N, mg/L 3.55 4.04 14.9 20.9 17.1
Total P, mg/L 0.18 0.25 0.53 0.49 0.32
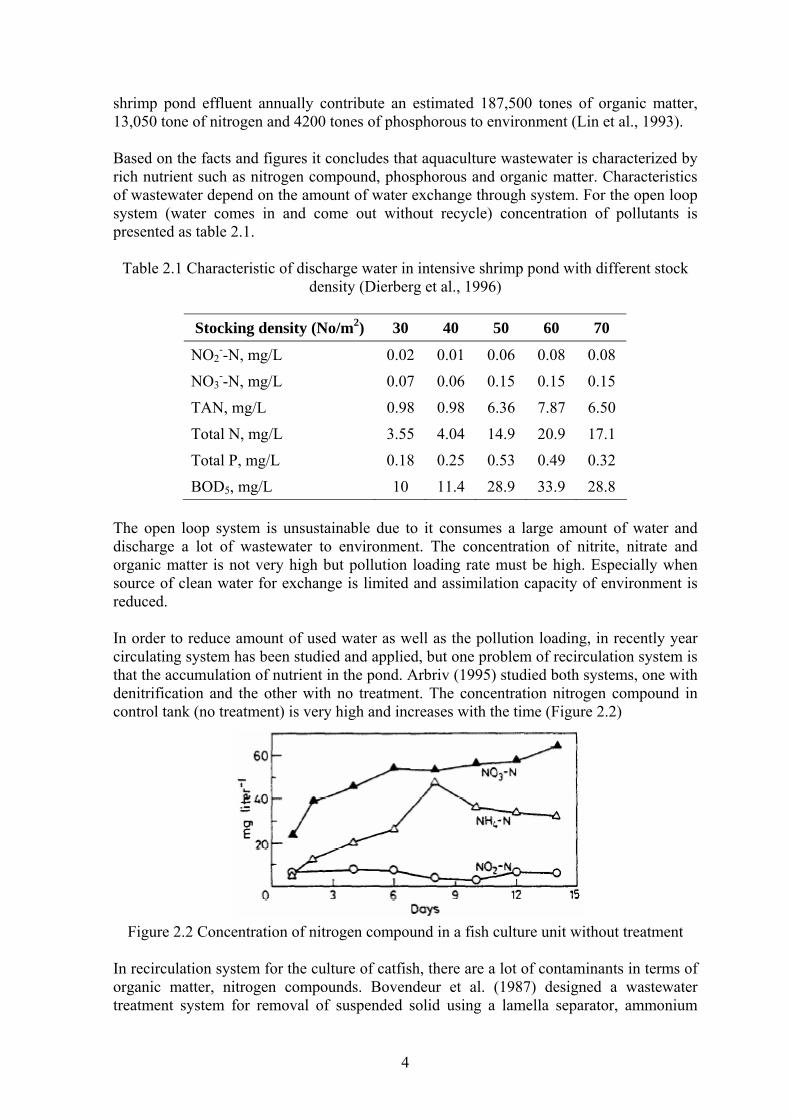
BOD5, mg/L 10 11.4 28.9 33.9 28.8 The open loop system is unsustainable due to it consumes a large amount of water and discharge a lot of wastewater to environment. The concentration of nitrite, nitrate and organic matter is not very high but pollution loading rate must be high. Especially when source of clean water for exchange is limited and assimilation capacity of environment is reduced. In order to reduce amount of used water as well as the pollution loading, in recently year circulating system has been studied and applied, but one problem of recirculation system is that the accumulation of nutrient in the pond. Arbriv (1995) studied both systems, one with denitrification and the other with no treatment. The concentration nitrogen compound in control tank (no treatment) is very high and increases with the time (Figure 2.2)
Figure 2.2 Concentration of nitrogen compound in a fish culture unit without treatment
In recirculation system for the culture of catfish, there are a lot of contaminants in terms of organic matter, nitrogen compounds. Bovendeur et al. (1987) designed a wastewater treatment system for removal of suspended solid using a lamella separator, ammonium
4
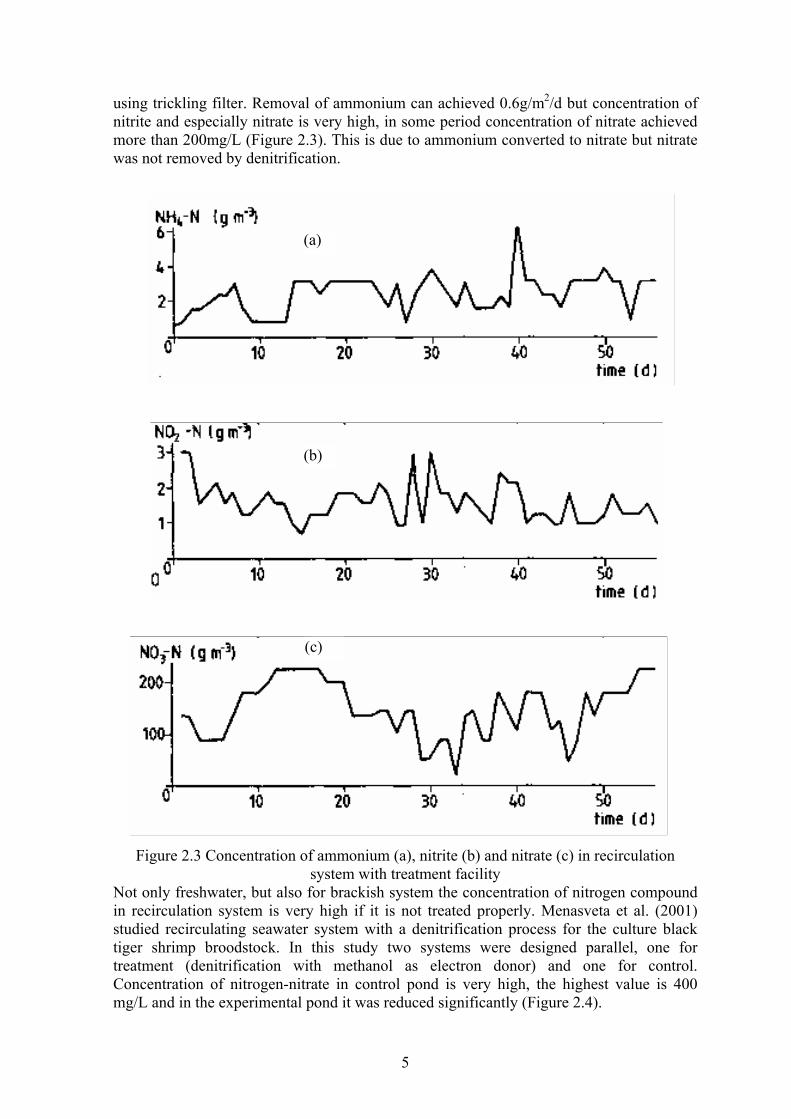
using trickling filter. Removal of ammonium can achieved 0.6g/m2/d but concentration of nitrite and especially nitrate is very high, in some period concentration of nitrate achieved more than 200mg/L (Figure 2.3). This is due to ammonium converted to nitrate but nitrate was not removed by denitrification.
(a)
(b)
2 h (c)
Figure 2.3 Concentration of ammonium (a), nitrite (b) and nitrate (c) in recirculation system with treatment facility
Not only freshwater, but also for brackish system the concentration of nitrogen compound in recirculation system is very high if it is not treated properly. Menasveta et al. (2001) studied recirculating seawater system with a denitrification process for the culture black tiger shrimp broodstock. In this study two systems were designed parallel, one for treatment (denitrification with methanol as electron donor) and one for control. Concentration of nitrogen-nitrate in control pond is very high, the highest value is 400 mg/L and in the experimental pond it was reduced significantly (Figure 2.4).
5
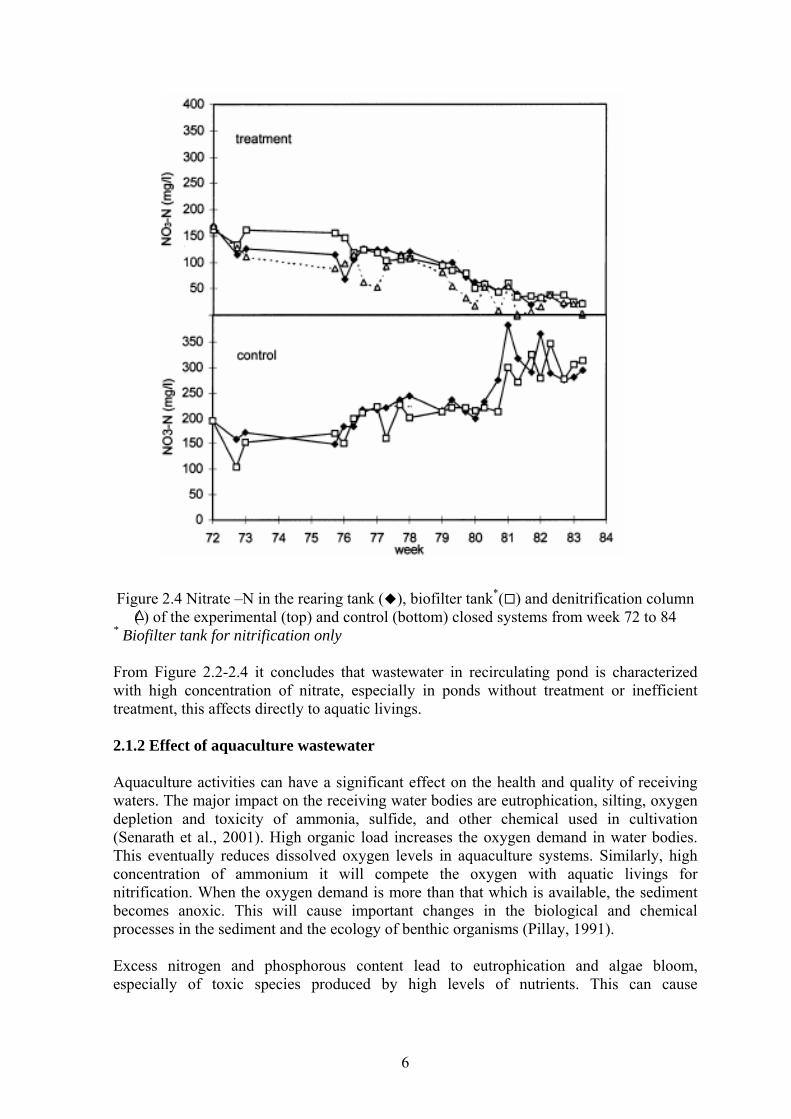
Figure 2.4 Nitrate –N in the rearing tank ( ), biofilter tank*( ) and denitrification column
( ) of the experimental (top) and control (bottom) closed systems from week 72 to 84 * Biofilter tank for nitrification only From Figure 2.2-2.4 it concludes that wastewater in recirculating pond is characterized with high concentration of nitrate, especially in ponds without treatment or inefficient treatment, this affects directly to aquatic livings. 2.1.2 Effect of aquaculture wastewater Aquaculture activities can have a significant effect on the health and quality of receiving waters. The major impact on the receiving water bodies are eutrophication, silting, oxygen depletion and toxicity of ammonia, sulfide, and other chemical used in cultivation (Senarath et al., 2001). High organic load increases the oxygen demand in water bodies. This eventually reduces dissolved oxygen levels in aquaculture systems. Similarly, high concentration of ammonium it will compete the oxygen with aquatic livings for nitrification. When the oxygen demand is more than that which is available, the sediment becomes anoxic. This will cause important changes in the biological and chemical processes in the sediment and the ecology of benthic organisms (Pillay, 1991). Excess nitrogen and phosphorous content lead to eutrophication and algae bloom, especially of toxic species produced by high levels of nutrients. This can cause
6
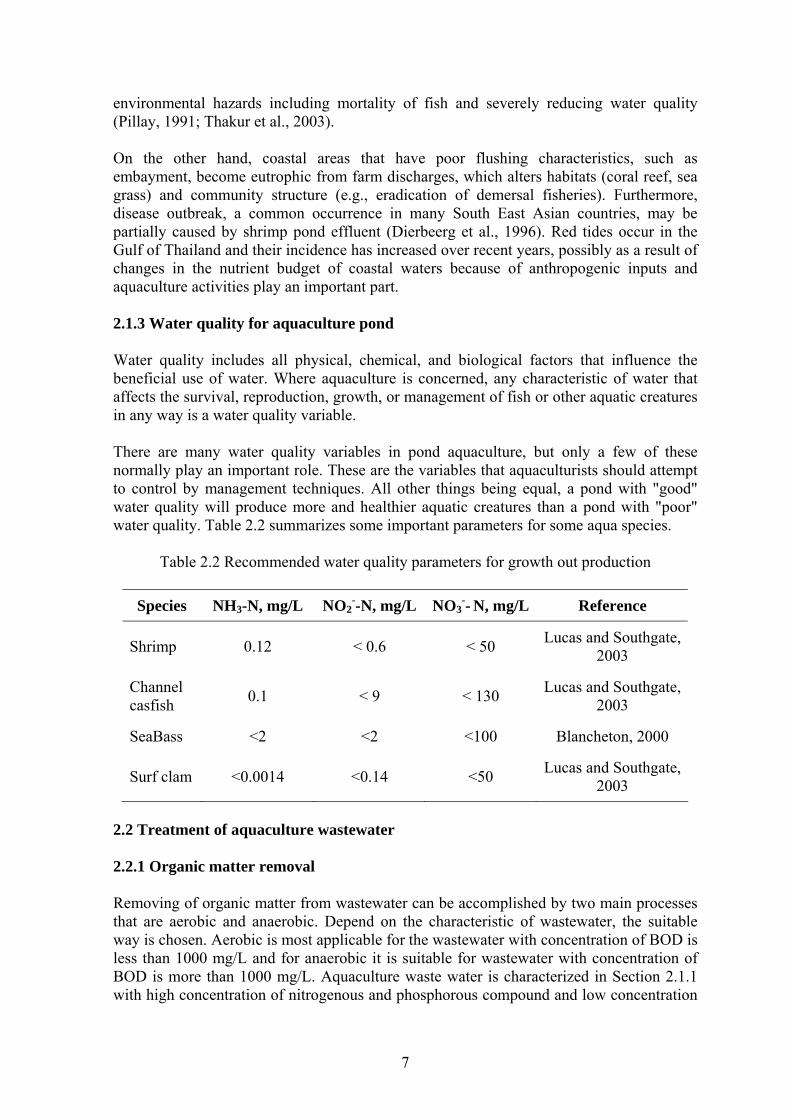
environmental hazards including mortality of fish and severely reducing water quality (Pillay, 1991; Thakur et al., 2003). On the other hand, coastal areas that have poor flushing characteristics, such as embayment, become eutrophic from farm discharges, which alters habitats (coral reef, sea grass) and community structure (e.g., eradication of demersal fisheries). Furthermore, disease outbreak, a common occurrence in many South East Asian countries, may be partially caused by shrimp pond effluent (Dierbeerg et al., 1996). Red tides occur in the Gulf of Thailand and their incidence has increased over recent years, possibly as a result of changes in the nutrient budget of coastal waters because of anthropogenic inputs and aquaculture activities play an important part. 2.1.3 Water quality for aquaculture pond Water quality includes all physical, chemical, and biological factors that influence the beneficial use of water. Where aquaculture is concerned, any characteristic of water that affects the survival, reproduction, growth, or management of fish or other aquatic creatures in any way is a water quality variable. There are many water quality variables in pond aquaculture, but only a few of these normally play an important role. These are the variables that aquaculturists should attempt to control by management techniques. All other things being equal, a pond with "good" water quality will produce more and healthier aquatic creatures than a pond with "poor" water quality. Table 2.2 summarizes some important parameters for some aqua species.
Table 2.2 Recommended water quality parameters for growth out production
Species NH3-N, mg/L NO2
--N, mg/L NO3-- N, mg/L Reference
Shrimp 0.12 < 0.6 < 50 Lucas and Southgate, 2003
Channel casfish 0.1 < 9 < 130 Lucas and Southgate,
2003
SeaBass <2 <2 <100 Blancheton, 2000
Surf clam <0.0014 <0.14 <50 Lucas and Southgate, 2003
2.2 Treatment of aquaculture wastewater 2.2.1 Organic matter removal Removing of organic matter from wastewater can be accomplished by two main processes that are aerobic and anaerobic. Depend on the characteristic of wastewater, the suitable way is chosen. Aerobic is most applicable for the wastewater with concentration of BOD is less than 1000 mg/L and for anaerobic it is suitable for wastewater with concentration of BOD is more than 1000 mg/L. Aquaculture waste water is characterized in Section 2.1.1 with high concentration of nitrogenous and phosphorous compound and low concentration
7
of organic matter. So removal of organic matter in aquaculture wastewater is accomplished by aerobic process. For the aerobic process, organic removal is accomplished by supplying the oxygen and the biochemical conversion takes place in general accordance with the stoichiometry shown in Eqs 2.1 and 2.2 (Metcalf and Eddy, 2003). Oxidation and synthesis:
Bacteria COHNS + O2 + Nutrients
C5H7NO2 + CO2 +NH3 + other products
Eq 2.1
Organic matter New bacteria cells Endogenous respiration
Bacteria C5H7NO2 + 5O2
CO2 + 2H2O + NH3 + Energy
Eq 2.2
Oxygen for above reaction is supplied from the air by air diffuser or surface aeration in which surface aeration is preferred in aquaculture pond. The function of aeration is to supply the oxygen for aqua-livings and microorganism to discompose organic matter and the others. 2.2.2 Nitrogen removal 2.2.2.1 Nitrification Nitrification involves the two-step conversion of ammonia to nitrite and nitrite to nitrate. It realized by autotrophic aerobic microorganisms which are Nitrosomonas species and Nitrobacter species. The process for the ammonium oxidizing bacteria is .
NH4
+ + 3/2O2 (g)
Nitrosomonas →
NO2
- + 2H+ + H2O + energy Eq (2.3)
NO2
- + 0.5 O2
Nitrobacter →
NO3
- + energy
Eq (2.4)
Both nitrosomonas and nitrobacter are chemoautotrophic and obligate aerobes. Thus, they require no organic growth factors and are capable of growing in completely inorganic media using carbon dioxide as the sole source of carbon. The inorganic energy sources for the two species are NH3 and NO2
- respectively. The growth of nitrifiers is very low compared with that of the COD consuming heterotrophs. Also, the cell yield per unit of energy substrate oxidized is low. The stoichiometry of the growth for the two genera of nitrifiers can be presented as follow (Metcalf and Eddy, 2003; Rittmann and McCarty, 2001; and Henze et al., 2002):
80.7NH4 + 114.6O2 + 160.4HCO3- C5H7NO2 +79.7NO2
- + 155.4H2CO3 + 83.7H2O Nitrosomonas
Eq (2.5)
134.5NO2- + NH4
+ + 4H2CO3 + 62.25O2 +HCO3- C5H7NO2 + 134.5NO3
- + 3H2O Nitrobacter
Eq (2.6)
8

The reaction for nitrifier synthesis and oxidation can be obtained by combining the above equations NH4
+ + 1.86O2 + 1.98HCO3- 0.020C5H7NO2 + 1.04H2O + 0.98NO3
- + 1.88H2CO3 Eq (2.7) The oxidation of ammonium to nitrate creates two acid equivalents (H+) per mole of nitrogen oxidized. Oxygen is required for the oxidation of ammonium and is used as the terminal electron acceptor by the nitrifying bacteria. 2.2.2.2 Denitrification Biological denitrification occurs naturally when certain bacteria use nitrate as terminal electron acceptor in their respiratory process, in the absence of oxygen. Denitrification consists of a sequence of enzymatic reaction leading to the evolution of nitrogen gas. The process involves the formation of a number of nitrogen intermediates and can be summarized as follows:
NO3- NO2
- NO N2O N2 Eq (2.8) Or
NO3- + 6H+ + 5e- → ½ N2 (g) + 3H2O Eq (2.9)
Elemental nitrogen is the end product of this process, but intermediate accumulation of nitrite, nitric oxide and nitrous oxide may take place under certain conditions. Denitrification of nitrate to nitrogenous gas can be accomplished by autotrophic or heterotrophic microorganisms. Heterotrophic denitrifiers, using organic carbon compounds as a source of biosynthetic carbon and electron, are the most common denitrifiers. In some reduced environments, low in dissolved carbon, autotrophic denitrifiers are the prevalent denitrifiers using reduced inorganic compounds, such as Mn2+, Fe2+, sulfur and H2 as electron source and inorganic carbon source as biosynthetic carbon source (Korom, 1992). Heterotrophic denitrification Under oxygen-limited or anoxic conditions, denitrification is usually realized by heterotrophic bacteria in the presence of a suitable electron donor. Electron donors that are often used include:
• COD in the influent wastewater • the COD produced during endogenous decay • an exogenous source such as acetate, methanol and ethanol.
Reaction stoichiometry for different electron donors is show as follows. The term C10H19O3N is often used to represent the biodegradable organic mater in wastewater (Metcalf and Eddy, 2003). Wastewater:
C10H19O3N + 10NO3- 5 N2 (g) + 3H2O + NH3 + 10CO2 + 10OH- Eq (2.10)
9

Methanol:
6NO3- + 5CH3OH → 5CO2 + 3N2 + 7H2O + 6OH- Eq (2.11)
Acetate:
8NO3- + 5CH3COOH → 10CO2 + 4N2 + 6H2O + 8OH- Eq (2.11)
The C/N ratio required for complete nitrate reduction to nitrogen gas by denitrifying bacteria depends on the nature of carbon source and bacterial species (Payne, 1973 cited by van Rijn et al., 2006). A COD/NO3
--N (w/w) ratio from 3-6 enables complete nitrate reduction to element nitrogen (Narcis et al., 1979; Skinde and Bhagat, 1982). Carbon limitation will result in the accumulation of intermediate products, such as NO2
-, while excess carbon will promote dissimilatory nitrate reduction to ammonia (van Rijn et al., 2006). In addition, a denitrification rate depends on type of carbon source. In anaerobic reactors, for example, denitrification was faster with acetate than glucose or ethanol (Tam et al., 1992). Advantages of these systems include the high specificity of denitrifying organisms for NO3
-, low cost and high denitrification rates. Problems with these systems include carryover of added organic carbon and microbial biomass to the product water, especially for treatment of drinking water (Ergas and Reuss, 2001). In order to avoid the risk of overdosing of organic substance such as methanol, acetate, etc, organic substance is made in the form of biodegradable polymers. Microorganisms use the biopolymer in form of pellets as biofilm carrier and simultaneously as water insoluble carbon source for denitrification, which is accessible only by enzymatic attack (Boley et al., 2000). The new system with biodegradable polymers does not require an external dosing of soluble organic substrate as polymer itself acts as biofilm carrier and organic carbon source (Figure 2.5). The summarized denitrification equation including biomass formation can be given as:
0.494C4H6O2 + NO3
- → 0.130CO2 + HCO3- +0.415N2 + 0.169C5H7NO2+ 0.390 H2O Eq (2.12)
Denitrification with BioDegradable Polymer
BioDegradable Polymer: carrier
E-donor
N2 H2O CO2
NO3 H2O
Denitrification with conventional organic substance
Biofilm
-Ethanol -Methanol-Acetic
Inert carrier
N2 H2O CO2
NO3 H2O
Biofilm BDP
Fig. 2.5 Denitrification processes with different organic substances (Boley et al., 2000)
10

Autotrophic denitrification An alternative to heterotrophic biological denitrification is autotrophic denitrification which uses inorganic substance as electron donor, these substance include hydrogen and sulfur which utilize inorganic carbon compounds (e.g., CO2, HCO3-) as their carbon source. Autotrophic denitrification with sulfur uses thiobacillus denitrificans. This bacterium can reduce nitrate to nitrogen gas while oxidizing elemental sulfur or reduced sulfur compounds (S2-, S2O3
2-, SO32-) to sulfate, thereby eliminating of the need for organic
compounds. The reaction using elemental sulfur has been represented as following (Rittmann and MacCarty, 2001)
56 NO3 + -
5H2
= SO4 + 2O
2-
53 N2 +
54
S(s) + H+ Eq (2.13)
2001). It also has been studied for itrified landfill leachates, because of the favorable low C:N ratio and very promising
- + 2- +
eside sulfur/limestone, hydrogen gas is an excellent electron donor for autotrophic enitrific n as followi
N2 + 6H2O Eq. (2.14)
NAMOX, and CANON process
H4+ is converted - by ammonium oxidizing b
l nitrific
)
he converted e x ns in the SHARON reactor byeterotrophic o n (Annachhatre, 2005)
sing heterotrophic microorganism for enitrification, so the problems of this process is the same with heterotrophic
denitrification as mentioned in the section 2.2.3.
Autotrophic denitrification with sulfur/lime stone has been extensively investigated to remove nitrate from polluted water (Koeing et al.,nresults have been obtained (Koenig and Liu, 1996). Basing on the Eq (2.13) when NO3 is consumed, H and SO4 are generated. The H consumes the alkalinity and sulfate is also a pollutant. This is disadvantage of this method. Bd
ation and the reactio ng:
2 NO3- + 2H+ + 5H2 →
This will be discussed detail in the Section 2.3. 2.2.2.3 SHARON, A SHARON process N to NO2 under aerobic condition
ation) as following reaction acteria
(partia
NH4+ + 1.5O2 + = NO2
- + 2H+ + H2O Eq. (2.15 T nitrit can be removed under ano ic conditio
rganisms (denitrification) as following reactio
. h
6NO2- + 3CH3OH = 3N2 + 6HCO3
+ + 7H2O Eq. (2.16) The principle of SHARON process is ud
11

ANAMOX process Recently, a novel bacteria in the Planctomycetales group has been discovered for it ability to anaerobically oxidize NH4
+-N to N2 not to NO2. It is called the ANAMOX microorganism because it does ANaerobic AMmonium OXidation (Rittmann and McCarty, 2001; Annachhatre, 2005). The ANAMOX bacterium uses ammonium as its electron donor and nitrite as its electron acceptor. The energy reaction is
NH4+ + NO2
- = N2 + 2H2O Eq. (2.17) The cells are autotrophs, and the reduction of organic carbon to the oxidation state of cellular carbon is via oxidation of nitrite to nitrate. Nitrite also is the nitrogen source:
5CO2 + 14 NO2- + 3 H2O + H+ = C5H7NO2 + 13NO3
-
Eq. (2.18)
The yield and specific growth rate reported for ANAMOX are low, about 0.14 g VSS/g NH4 and 0.065/d, respectively. This gives an overall stoichiometry of approximately (Rittmann and McCarty, 2001). NH4
+ + 1.26NO2- +0.085CO2 +0.02H+ = N2 + 0.017C5H7NO2 +0.24NO3 + 1.95H2O
Eq. (2.19)
The important of ANAMOX bacteria in environmental biotechnology practice is know yet. Conditions favoring their accumulation included exceptional biomass retention (to give a very long SRT), stable operation, the presence of nitrite, lack of oxygen, and lack of donors that could cause the reduction of nitrite via denitrification (Rittmann and McCarty, 2001). CANON process Under oxygen - limited condition, ammonium would be converted partly to nitrite by aerobic nitrifiers, such as Nitrosomonas and Nitrosoria as following:
NH4+ + 1.5O2 = NO2
- + 2H+ + H2O Eq. (2.20) Subsequently, anaerobic ammonium oxidizers planctomycete like ANAMOX bacteria would convert ammonium with the produced nitrite to nitrogen gas and trace amount of nitrate (Annachhatre, 2005). 2.2.3 Phosphate removal Enhanced biological phosphorus removal (EBPR) from domestic wastewater in activated sludge plants is accomplished by alternate stages, where sludge is subjected to anaerobic and aerobic conditions. Phosphorus is released from bacterial biomass in the anaerobic stage and is assimilated by these bacteria in excess as polyphosphate (poly-P) during the aerobic stage. Phosphorus is removed from the process stream by harvesting a fraction of the phosphorus-rich bacterial biomass. Some of these polyphosphate accumulating organisms (PAO) are also capable of poly-P accumulation under denitrifying conditions (Barker and Dold, 1996; Mino et al., 1998).
12

Under anaerobic conditions, acetate or other low molecular weight organic compounds are converted to polyhydroxyalkanoates (PHA), poly-P and glycogen are degraded and phosphate is released. Under aerobic and anoxic conditions, PHA is converted to glycogen, phosphate is taken up and poly-P is synthesized intracellularly. Under the latter conditions, growth and phosphate uptake is regulated by the energy released from the breakdown of PHA. Some heterotrophic denitrifiers exhibit phosphorus storage in excess of their metabolic requirements through poly-P synthesis under either aerobic or anoxic conditions, without the need for alternating anaerobic/aerobic switches (Barak and van Rijn, 2000a). The feasibility of this type of phosphate removal was demonstrated for freshwater as well as marine recirculating systems (Barak and van Rijn, 2000b; Shnel et al., 2002; Barak et al., 2003). In the culture water of these systems, stable orthophosphate concentrations were found throughout the culture period. Phosphorus immobilization took place in the anoxic treatment stages of the system where it accumulated to up to 19% of the sludge dry weight. 2.2.4 Recent studies on treatment of aquaculture wastewater Recently, the concerns of treatment of aquaculture wastewater has been increased, especially the shortage of supplied clean water and reducing of assimilative capacity of environment. So aquaculture wastewater must be treated properly and recirculated back to the system. The technology of recirculating aquaculture system has been developed (Bovendeur et al., 1987; van Rijn and Rivera, 1990; Arbiv and van Rijn, 1995; Boley et al., 2000; Suzuki et al., 2003…). Removal of organic matter and nitrogenous substance in aquaculture wastewater was studied by van Rijn and Rivera (1990); Arbiv and van Rijn (1995) by combining both aerobic and anaerobic biofiltration for nitrification and denitrification in an aquaculture unit with an aerobic trickling filter (for nitrification) and two anaerobic fluidized bed columns (for denitrification). Carbon source for denitrification is the organic carbon produced in the fish culture units (fish feces and unutilized feed) and external organic compound (methanol). The maximum removal rate of ammonia by trickling filter was 0.43 g NH4-N/m2/day and maximum nitrate removal rates was around 432 g NO3
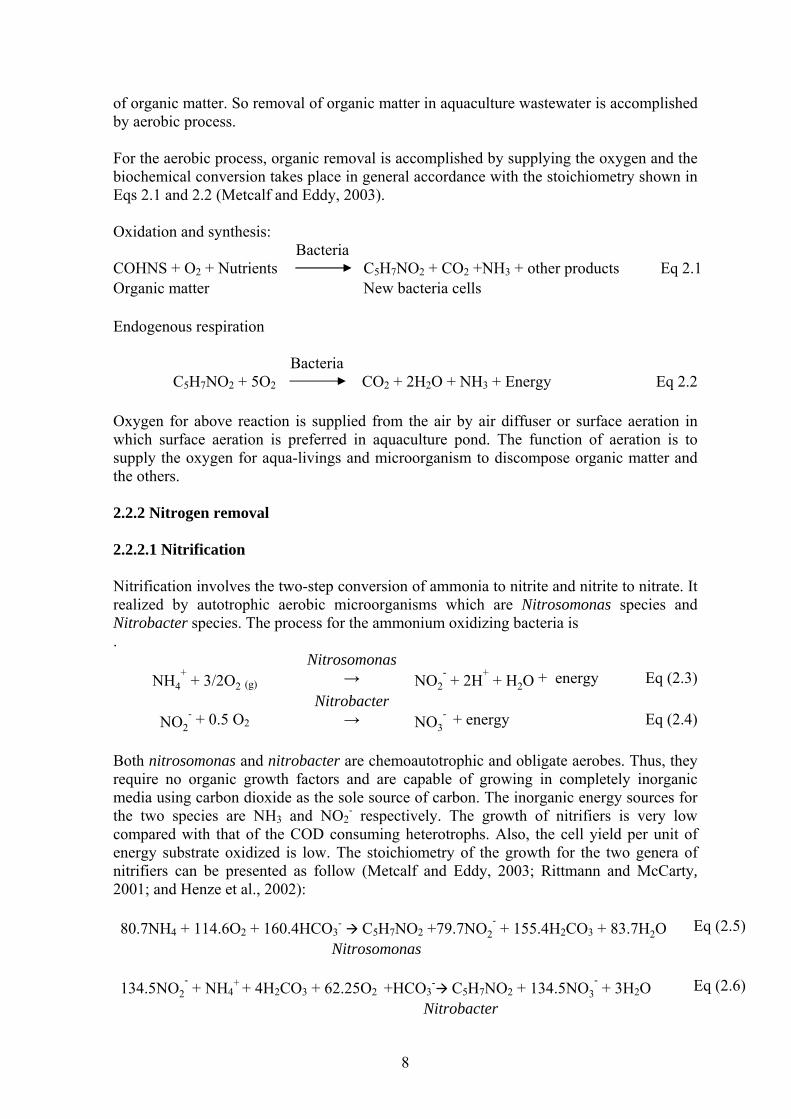
--N/m3/day. Boley et al. (2000) studied the ability of using biodegradable polymers as electron donor and biofilm carrier for denitrification in recirculated aquaculture system (Figure 2.6). In this system, removal both organic matter and nitrogenous compound were carried out. Removing of carbon substance and nitrification was accomplished via biofilter and nitrate was removed in denireactor using biodegradable polymers as electron donor. Treated water was recirculated back to the aquarium. This method was more expensive than other method using liquid substrate for biological nitrate removal however it got positive expectation which is: reduction of clean water requirement, reduction of wastewater production and reduction of energy consumption.
13
Denireactor Biofilter (carbon removal + nitrification)
NO3-, NH4
-, organic
Figure 2.6 Aquarium system for carbon removal, nitrification and denitrification (Boyley
et al., 2000). With similar study, Suzuki et al. (2003) investigated the performance of a closed recirculating system with foam separation, nitrification and denitrification units for intensive culture of eel. About 90% of the total nitrogen in the system was removed by denitrification. Based on the results in this study, the intensive aquaculture of freshwater fish such as eel can be achieved using a closed recirculating system without emission. Treatment of aquaculture wastewater can be accomplished by constructed wetland. The studies (Lin et al., 2002; 2003; and 2005) have demonstrated that constructed wetlands can efficiently remove the major pollutants from catfish, shrimp and milkfish pond effluents, including suspended solids, organic matter, nitrogen, phosphorus, and phytoplankton under an HLR ranged between 0.018–1.95m/day and effectively reduced the influent concentrations of 5-day biochemical oxygen demand (24%-54%), suspended solids (55-71%), total ammonium (57- 66%), nitrite nitrogen (83-94%) and nitrate nitrogen (68%). Phosphate reduction was the least efficient (5.4%). Accordingly, a constructed wetland was technically and economically feasible for managing water quality of an intensive aquaculture system. It can improve the water quality and provide a good culture environment. The above mentioned studies are nitrification by aeration and denitrification by heterotrophic bacteria. Carbon source for denitrification is the organic carbon produced in the fish culture units (fish feces and unutilized feed) or addition of external carbon such as methanol or biodegradable polymers. A new direction in treatment of aquaculture wastewater is that using hydrogen as electron donor for denitrification (Grommen et al., 2006). This will be discussed more detail in the section 2.3. Table 2.3 summarizes different methods for treatment of aquaculture wastewater.
14

Table 2.3 Different treatment methods for aquaculture wastewater
Treatment by Objectives Electron donor Efficiency (%) Reference
Lamella separator and trickling filter
Nitrification and SS removal -
SS: 75
COD: 20-25 Bovendeur et al. (1987)
Trickling filter
Fluidised bed Nitrification and denitrification CH3OH
- van Rijn et al. (1990)
Trickling filter Fluidised bed
Nitrification and denitrification
Organic decompostion - Arbiv et al.
(1995)
Submersed filter Denitrification
C4H6O2
C6H10O2
C6H8O4
- Boley et al. (2000)
Trickling filter Nitrification - - Knosche. (1994)
Submersed filter Denitrification C2H5OH
CH3OH 84 Menasveta et
al. (2001)
Trickling filter Submersed filter
Nitrification denitrification CH3OH 90 Suzuki et al.
(2003)
Constructed wetland
Nitrification and denitrification -
NH4+-N: 57 - 66
NO2--N: 83- 94
NO3--N: 68
Lin et al. (2003; 2005)
Tricling filter and ozonation
Nitrogen removal
C6H12O6
CH3OH
NH4+-N: 31
NO2--N: 13.2
NO3--N: 50
Otte et al. (1979)
Submersed filter Denitrification H2 (gas) - Grommen et al. (2006)
Removal of organic matter as well as nitrification is accomplished by gas exchange and nitrification. The end product of the nitrification process, the nitrate ion, tends to accumulate in aquaria and closed recirculating aquaculture systems. Many researchers have studied the removal of nitrate in aqua system with different methods and results are presented in Table 2.4.
15
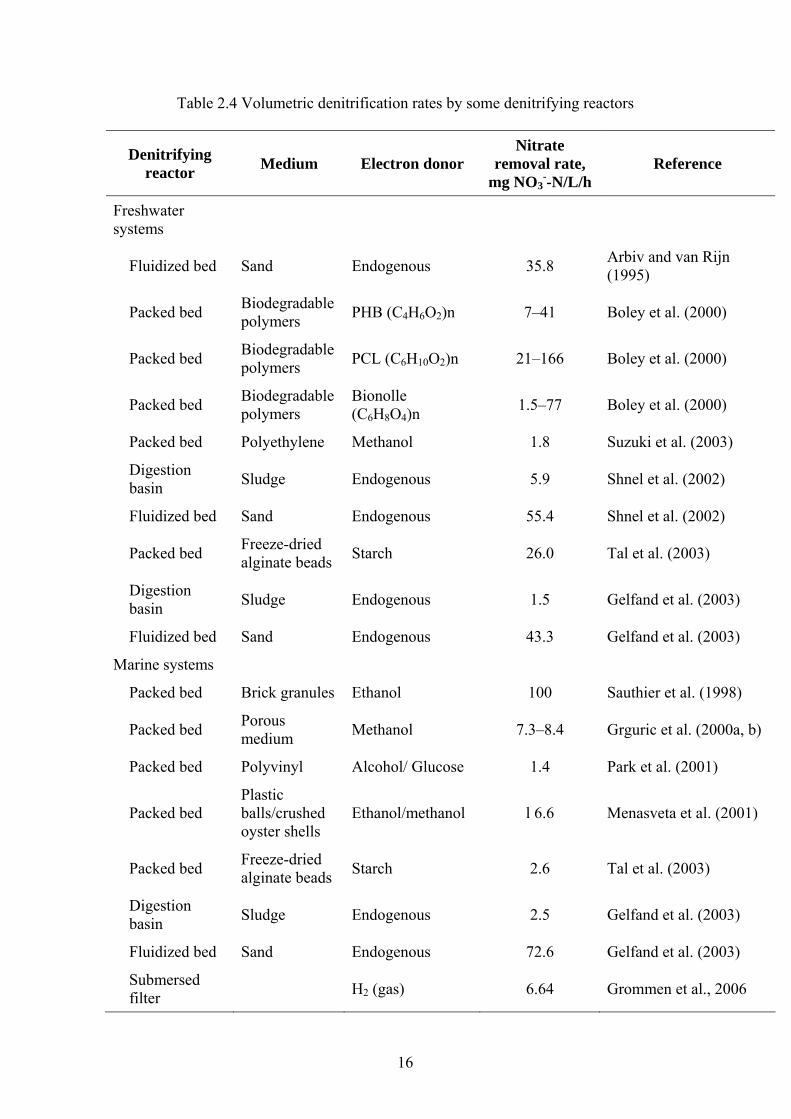
Table 2.4 Volumetric denitrification rates by some denitrifying reactors
Denitrifying reactor Medium Electron donor
Nitrate removal rate,
mg NO3--N/L/h
Reference
Freshwater systems
Fluidized bed Sand Endogenous 35.8 Arbiv and van Rijn (1995)
Packed bed Biodegradable polymers PHB (C4H6O2)n 7–41 Boley et al. (2000)
Packed bed Biodegradable polymers PCL (C6H10O2)n 21–166 Boley et al. (2000)
Packed bed Biodegradable polymers
Bionolle (C6H8O4)n 1.5–77 Boley et al. (2000)
Packed bed Polyethylene Methanol 1.8 Suzuki et al. (2003)
Digestion basin Sludge Endogenous 5.9 Shnel et al. (2002)
Fluidized bed Sand Endogenous 55.4 Shnel et al. (2002)
Packed bed Freeze-dried alginate beads Starch 26.0 Tal et al. (2003)
Digestion basin Sludge Endogenous 1.5 Gelfand et al. (2003)
Fluidized bed Sand Endogenous 43.3 Gelfand et al. (2003)
Marine systems
Packed bed Brick granules Ethanol 100 Sauthier et al. (1998)
Packed bed Porous medium Methanol 7.3–8.4 Grguric et al. (2000a, b)
Packed bed Polyvinyl Alcohol/ Glucose 1.4 Park et al. (2001)
Packed bed Plastic balls/crushed oyster shells
Ethanol/methanol l 6.6 Menasveta et al. (2001)
Packed bed Freeze-dried alginate beads Starch 2.6 Tal et al. (2003)
Digestion basin Sludge Endogenous 2.5 Gelfand et al. (2003)
Fluidized bed Sand Endogenous 72.6 Gelfand et al. (2003)
Submersed filter H2 (gas) 6.64 Grommen et al., 2006
16

2.3 Hydrogenotrophic denitrification 2.3.1 Theory Hydrogenotrophic denitrification utilizes H2 as electron donor for removing Nitrate out of the water and waste water. Nitrate elimination is carried out by autotrophic hydrogen oxidizing microorganism (A. brasilence, H. flava, H. Pseudoplava, H. taeniospiralis, P. denitrificans, R. eutropha ) which naturally occur in lakes, brooks or ground water (Mansell and Schroeder, 2002). These microorganisms are able to use molecular hydrogen as an electron donor. Through the oxidation of hydrogen, they are able to meet energy requirement for assimilating inorganic carbon (CO2, HCO3
-). In the absence of oxygen, nitrate-ions are used as the source of oxygen, and the nitrate becomes reduced to nitrogen. Sequential reactions are presented as following (Lee and Rittmann, 2002): - Nitrate reduction
H2 + NO3- → H2O + NO2
- Eq (2.21 ) - Nitrite reduction
0.5H2 + NO2- + H+→ H2O + N2O Eq (2.22 )
- Nitric oxide reduction
H2 + N2O → N2 + H2O Eq (2.23) - Overall denitrification reaction from NO3
- to N2
2 NO3
- + 2H+ + 5H2 →N2 + 6H2O Eq (2.24 ) Stoichiometric reaction among e- donor, e- acceptor, and biomass H2 + 0.35 NO3
- + 0.35 H+ + 0.052CO2 → 0.17N2 + 1.1 H2O + 0.010 C5H7NO2 Eq (2.25 ) Based on the equation 2.25, the cell yield is approximately 0.24 g cells/g NO3
-N, which is considerably lower than the 0.6 to 0.9 g cells/g NO3
-N typically reported for heterotrophic denitrification (Ergas and Reuss, 2001). According to the Equation 2.24, 1g of NO3
-N converted to N2 will consume 0.357 g of hydrogen gas and theoretically produce 3.57 g alkalinity (Ho et al., 2001) Advantages of hydrogentrophic denitrification over heterotrophic denitrification include (Lee and Ritmann, 2000; Ergas and Reuss, 2001; Mo et al., 2005):
1. Lower cell yield 2. Elimination of carryover of added organic electron donor to the product water 3. The relatively low solubility of H2, which make it easy to remove from the product
water by air stripping 4. Low cost of H2
17
Disadvantage of hydrogenotrophic denitrification (Lee and Ritmann, 2000; Ergas and Reuss, 2001; Mo et al., 2005):
1. Hydrogen gas is explosive and flammable 2. Hydrogen gas has low solubility so it is difficult to dissolve in water.
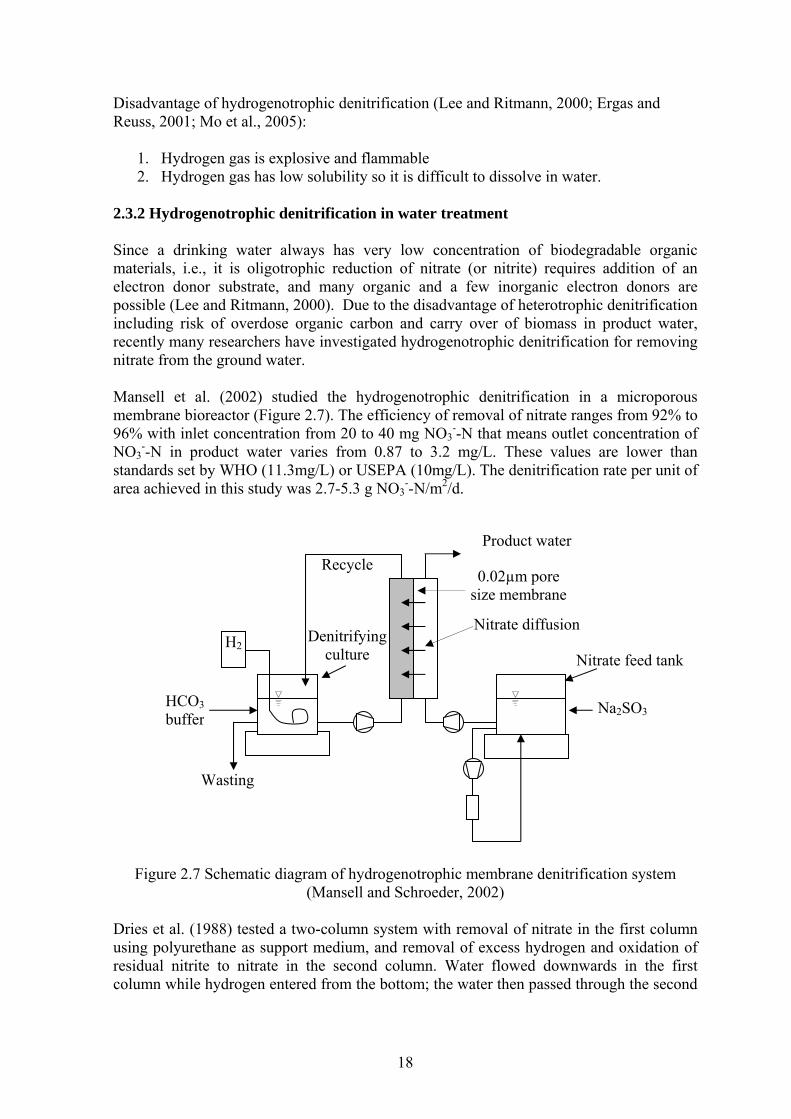
2.3.2 Hydrogenotrophic denitrification in water treatment Since a drinking water always has very low concentration of biodegradable organic materials, i.e., it is oligotrophic reduction of nitrate (or nitrite) requires addition of an electron donor substrate, and many organic and a few inorganic electron donors are possible (Lee and Ritmann, 2000). Due to the disadvantage of heterotrophic denitrification including risk of overdose organic carbon and carry over of biomass in product water, recently many researchers have investigated hydrogenotrophic denitrification for removing nitrate from the ground water. Mansell et al. (2002) studied the hydrogenotrophic denitrification in a microporous membrane bioreactor (Figure 2.7). The efficiency of removal of nitrate ranges from 92% to 96% with inlet concentration from 20 to 40 mg NO3
--N that means outlet concentration of NO3
--N in product water varies from 0.87 to 3.2 mg/L. These values are lower than standards set by WHO (11.3mg/L) or USEPA (10mg/L). The denitrification rate per unit of area achieved in this study was 2.7-5.3 g NO3
--N/m2/d.
H2
Recycle
Denitrifyingculture
HCO3buffer
Wasting
Na2SO3
Nitrate diffusion
0.02µm pore size membrane
Product water
Nitrate feed tank
Figure 2.7 Schematic diagram of hydrogenotrophic membrane denitrification system (Mansell and Schroeder, 2002)
Dries et al. (1988) tested a two-column system with removal of nitrate in the first column using polyurethane as support medium, and removal of excess hydrogen and oxidation of residual nitrite to nitrate in the second column. Water flowed downwards in the first column while hydrogen entered from the bottom; the water then passed through the second
18
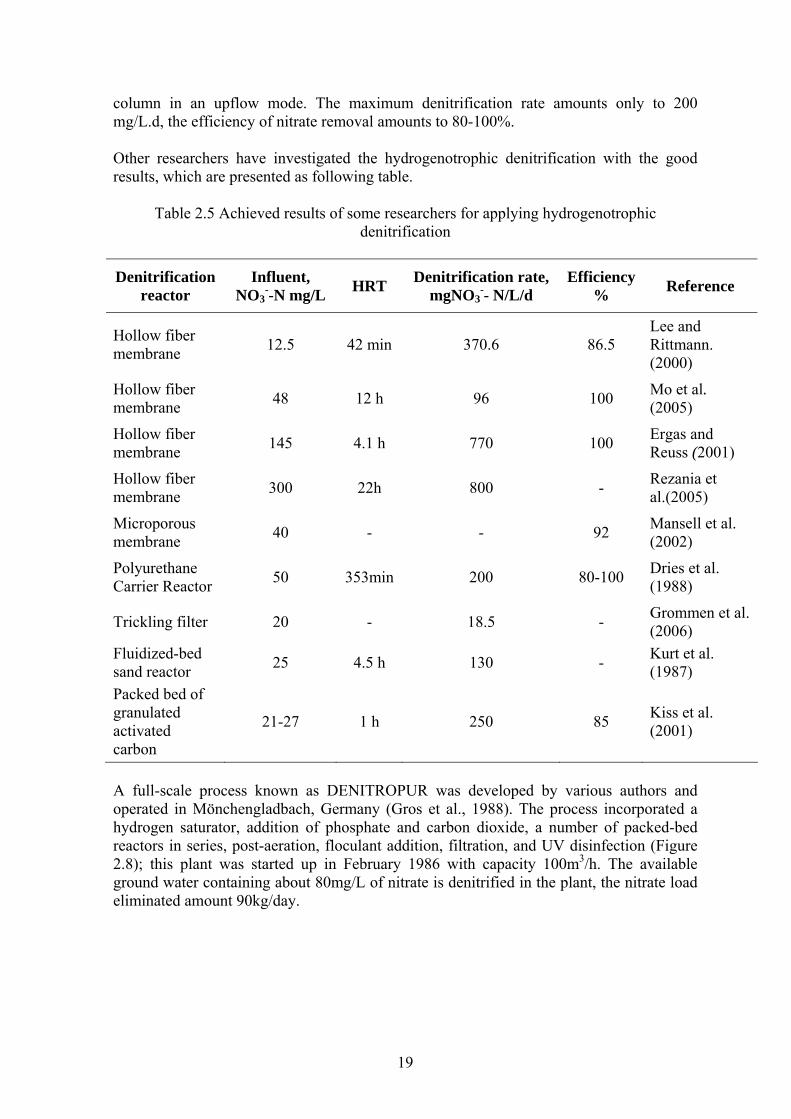
column in an upflow mode. The maximum denitrification rate amounts only to 200 mg/L.d, the efficiency of nitrate removal amounts to 80-100%. Other researchers have investigated the hydrogenotrophic denitrification with the good results, which are presented as following table.
Table 2.5 Achieved results of some researchers for applying hydrogenotrophic denitrification
Denitrification reactor
Influent, NO3
--N mg/L HRT Denitrification rate, mgNO3
-- N/L/d Efficiency
% Reference
Hollow fiber membrane 12.5 42 min 370.6 86.5
Lee and Rittmann. (2000)
Hollow fiber membrane 48 12 h 96 100 Mo et al.
(2005)
Hollow fiber membrane 145 4.1 h 770 100 Ergas and
Reuss (2001)
Hollow fiber membrane 300 22h 800 - Rezania et
al.(2005)
Microporous membrane 40 - - 92 Mansell et al.
(2002)
Polyurethane Carrier Reactor 50 353min 200 80-100 Dries et al.
(1988)
Trickling filter 20 - 18.5 - Grommen et al. (2006)
Fluidized-bed sand reactor 25 4.5 h 130 - Kurt et al.
(1987) Packed bed of granulated activated carbon
21-27 1 h 250 85 Kiss et al. (2001)
A full-scale process known as DENITROPUR was developed by various authors and operated in Mönchengladbach, Germany (Gros et al., 1988). The process incorporated a hydrogen saturator, addition of phosphate and carbon dioxide, a number of packed-bed reactors in series, post-aeration, floculant addition, filtration, and UV disinfection (Figure 2.8); this plant was started up in February 1986 with capacity 100m3/h. The available ground water containing about 80mg/L of nitrate is denitrified in the plant, the nitrate load eliminated amount 90kg/day.
19

Flushing air
blowerWash water pump
Filtrate
Ground water pumps
Hydrogen tank
Ventilator
CO2 Dosing
H2 S
atur
ator
Figure 2.8 Scheme of ground water treatment using hydrogenotrophic denitrification in Germany (Gros et al., 1988)
2.3.3 Hydrogenotrophic denitrification in wastewater treatment Wastewater with high ratio C/N such as domestic wastewater or food processing industries, heterotrophic denitrification can be applied to remove nitrate out of the wastewater. For this wastewater, the electron donor source is from endogenous decay (Metcalf and Eddy, 2003) so it is not required the external carbon source such as methanol, acetate…. But for waste water with low ratio C: N such as leachate from landfill or aquaculture wastewater, the external carbon resource is required. If using heterotrophic denitrification for removal of nitrate out of the water, the problems described in the treating of ground water will be met. So hydrogenotrophic denitrification is one option to treat this kind of wastewater. Studies and articles relating hydrogenotrophic denitrification in wastewater are limited they are not abundant as in ground water. Grommen et al. (2006) studied removal of nitrate in aquaria by mean of electrochemically generated hydrogen gas as electron donor for biological denitrification (Figure 2.9). In this study, electrochemical cell was used to generate hydrogen gas. During a 7 days aquarium test, a nitrate removal rate up to 18.5 mgN/L reactor per day was recorded at an influent NO3
--N concentration of 20mg/L. The experiments were carried out in aquarium provided with two internal, air driven, submerged biofilters which serves as nitrification and oxidation of organic carbon. For the denitrification this aquarium was connected with denitrification. The diagram of experiment is described below:
20

H2 from electrolysis cell
Influent from aquarium
Effluent to aquarium
Trickling filter column V= 1.3L
Centrifugal pump, 300L/h
Canister filter 6 L
Aquarium
Figure 2.9 Scheme of the hydrogenotrophic denitrification reactor used aquaculture
aquarium (Grommen et al., 2006) The result of experiment is not good as heterotrophic denitrification but it will open a new direction for further study of hydrogenotrophic denitrification in aquaculture wastewater.
Table 2.6 Comparison between heterotrophic denitrification and autotrophic denitrification
Process Electron donor Advantage Disadvantage Application Methanol, ethanol, and acetate
- High efficiency - Low cost
-Residual organic carbon - excess biomass
Wastewater
Het
erot
roph
ic
BioDegradable Polimer
- High efficiency - Low cost - excess biomass Wastewater
Sulfur, lime stone
- No need for an external organic carbon source, i.e., methanol and ethanol, -Lowers the cost - Less sludge production, this minimizes the handling of sludge.
-Consume alkalinity -Product of process is pollutant (SO4
2-)
- Ground water treatment - Waste water with low ratio C:N such as aquaculture, leachate, and separated urine
Aut
otro
phic
Hydrogen gas
- Lower cell yield, less sludge production - Elimination of carryover of added organic electron donor to the treated water - The relatively low solubility of H2, which make it easy to remove from the product water by air stripping - Low cost of H2
- Hydrogen gas is explosive - Low solubility in water
- Ground water treatment - Waste water with low ratio C:N such as aquaculture, leachate, and separated urine
21

2.4 Gas permeable membrane 2.4.1 Fundamentals of gas transfer Gas transfer is defined as the process by which gas is transferred from gas phase to liquid phase. The rate of molecular diffusion of dissolved gas in a liquid is dependent on the characteristic of the gas and the liquid, the temperature, the concentration gradient, and the cross sectional area across which diffusion occurs. The basis model for description of gas transfer process is the two – film theory (Figure 2.10) The gas transfer zone is comprised of two films, a gas film and a liquid film, on the respective sides of the interface (Noll, 1999).
Pi
Ci
PG
CL
Driving force
Driving force
Gas phase
Liquid phase
Figure 2.10 Visualization of two film theory At steady state conditions, the rate of mass transfer of a gas through the gas film must be equal to the rate transfer through the liquid film. The mass flux for each phase for absorption is written as follow:
r= kg (PG – Pi) = kL (Ci – CL) Eq (2.25) Where: r = rate of mass transferred per unit of time
kg = gas film mass transfer coefficient kL = liquid film mass transfer coefficient PG = partial pressure of constituent A in the bulk of gas phase Pi = partial pressure of constituent A at interface in equilibrium with concentration Ci of constituent A in liquid Ci = concentration of constituent A at the interface in equilibrium with partial pressure Pi of constituent A in the gas CL= concentration of constituent A in the bulk liquid phase
However, because it is difficult to measure the values of kL and kG at the interface it is common to use overall coefficient KG and KL, depending on whether the resistance to mass transfer is on the gas or liquid side. If it is assumed that all of the resistance to mass transfer is caused by the liquid film, then the rate mass transfer can be defined as follows in terms of the overall liquid mass transfer coefficient (Metcalf and Eddy, 2003):
22
r = KL(CS-CL) Eq (2.26) Where r= rate of mass transferred per unit of area per unit time
KL = overall liquid mass transfer coefficient CL= concentration of constituent A in the liquid phase CS = concentration of constituent A at the interface in equilibrium with the partial pressure of constituent A in bulk gas phase.
f gas,
he overall liquid mass transfer coefficient KL can be calculated following formula:
P = partial pressure oH = Henry constant
T
GLL HkkK+= 111
Eq (2.28)
e is obtained by multiplying Eq. .26) by the area A and dividing by the volume V.
The rate of mass transfer per unit volume per unit tim(2
)()( LSLLSLv CCaKCCVAKr −=−= Eq (2.29)
Where
increasing er per unit volume.
uitable for the gas have
surface area and as a result a high gas transfer rate can be achieved (Ahmed t al., 2004).
rv = rate of mass transfer per unit volume per unit time, KLa = Volumetric mass transfer coefficient
lume A = area through which mass transfer per unit voV = volume in which constituent concentration isa = interfacial for mass transf
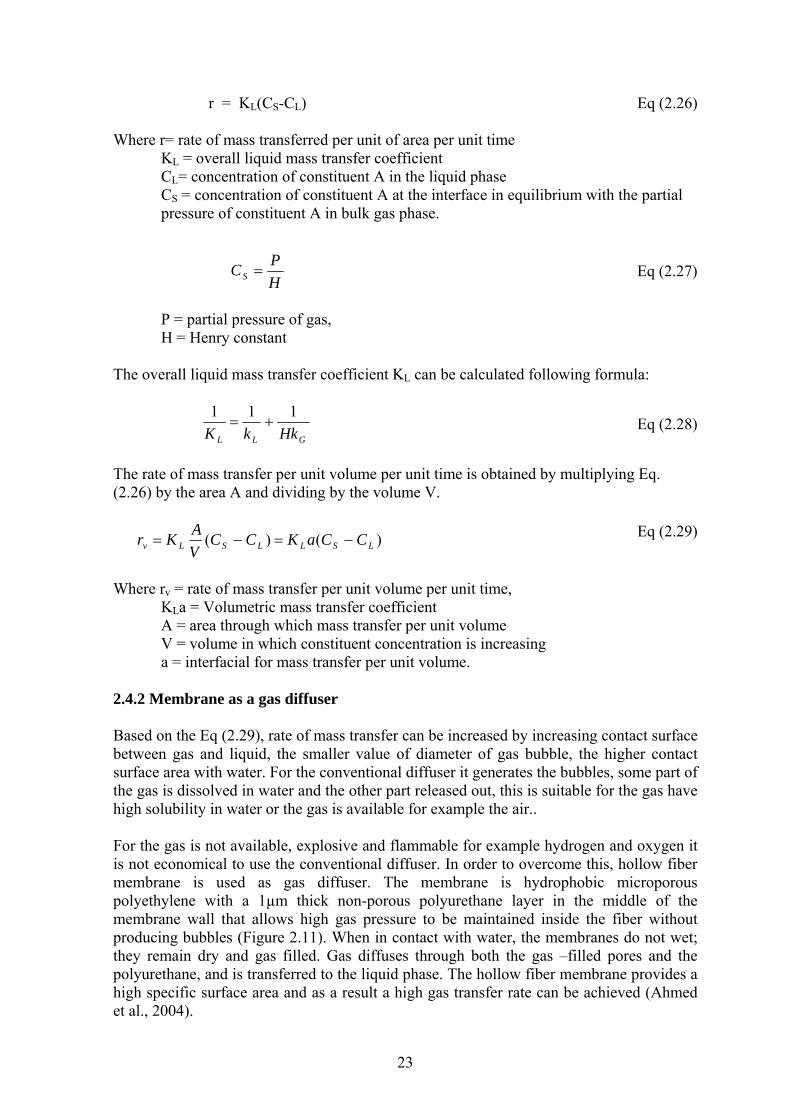
2.4.2 Membrane as a gas diffuser Based on the Eq (2.29), rate of mass transfer can be increased by increasing contact surface between gas and liquid, the smaller value of diameter of gas bubble, the higher contact surface area with water. For the conventional diffuser it generates the bubbles, some part of he gas is dissolved in water and the other part released out, this is st
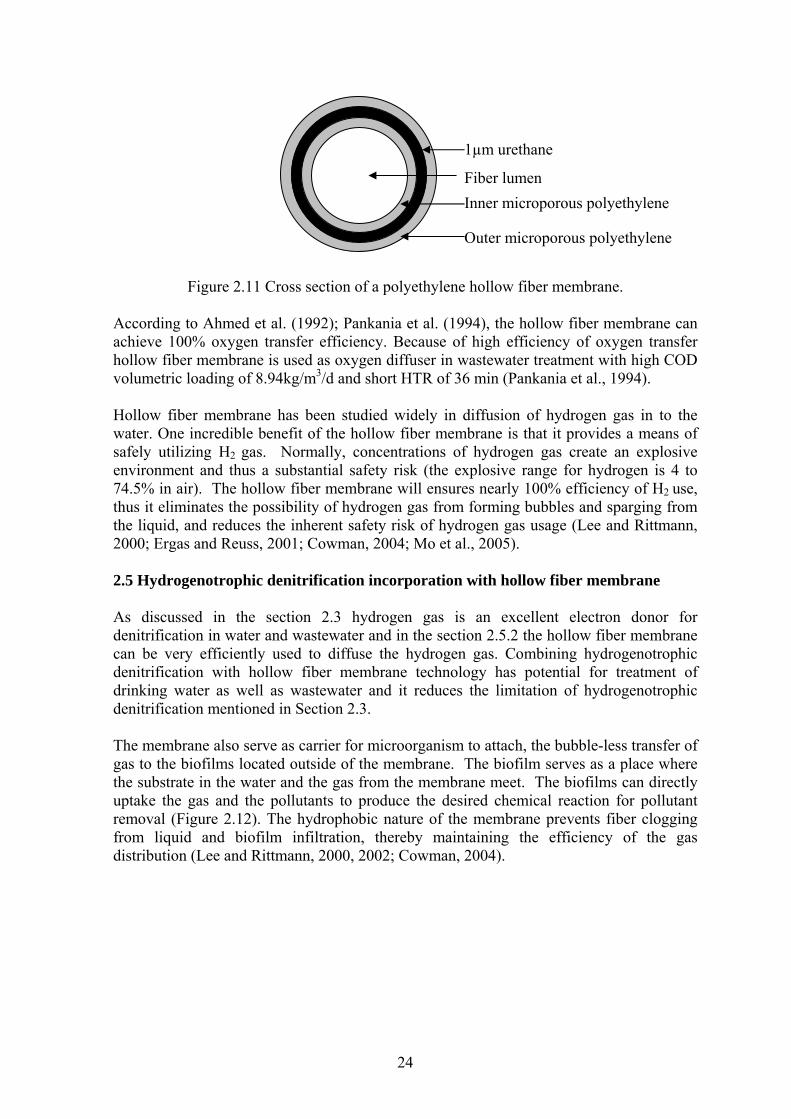
high solubility in water or the gas is available for example the air.. For the gas is not available, explosive and flammable for example hydrogen and oxygen it is not economical to use the conventional diffuser. In order to overcome this, hollow fiber membrane is used as gas diffuser. The membrane is hydrophobic microporous polyethylene with a 1µm thick non-porous polyurethane layer in the middle of the membrane wall that allows high gas pressure to be maintained inside the fiber without producing bubbles (Figure 2.11). When in contact with water, the membranes do not wet; they remain dry and gas filled. Gas diffuses through both the gas –filled pores and the polyurethane, and is transferred to the liquid phase. The hollow fiber membrane provides a igh specific h
e
HPCS = Eq (2.27)
23
1µm urethane
Fiber lumen Inner microporous polyethylene
Outer microporous polyethylene
Figure 2.11 Cross section of a polyethylene hollow fiber membrane.
COD olumetric loading of 8.94kg/m3/d and short HTR of 36 min (Pankania et al., 1994).
usage (Lee and Rittmann, 000; Ergas and Reuss, 2001; Cowman, 2004; Mo et al., 2005).
.5 Hydrogenotrophic denitrification incorporation with hollow fiber membrane
d it reduces the limitation of hydrogenotrophic enitrification mentioned in Section 2.3.
the efficiency of the gas istribution (Lee and Rittmann, 2000, 2002; Cowman, 2004).
According to Ahmed et al. (1992); Pankania et al. (1994), the hollow fiber membrane can achieve 100% oxygen transfer efficiency. Because of high efficiency of oxygen transfer hollow fiber membrane is used as oxygen diffuser in wastewater treatment with highv Hollow fiber membrane has been studied widely in diffusion of hydrogen gas in to the water. One incredible benefit of the hollow fiber membrane is that it provides a means of safely utilizing H2 gas. Normally, concentrations of hydrogen gas create an explosive environment and thus a substantial safety risk (the explosive range for hydrogen is 4 to 74.5% in air). The hollow fiber membrane will ensures nearly 100% efficiency of H2 use, thus it eliminates the possibility of hydrogen gas from forming bubbles and sparging from the liquid, and reduces the inherent safety risk of hydrogen gas 2 2 As discussed in the section 2.3 hydrogen gas is an excellent electron donor for denitrification in water and wastewater and in the section 2.5.2 the hollow fiber membrane can be very efficiently used to diffuse the hydrogen gas. Combining hydrogenotrophic denitrification with hollow fiber membrane technology has potential for treatment of drinking water as well as wastewater and The membrane also serve as carrier for microorganism to attach, the bubble-less transfer of gas to the biofilms located outside of the membrane. The biofilm serves as a place where the substrate in the water and the gas from the membrane meet. The biofilms can directly uptake the gas and the pollutants to produce the desired chemical reaction for pollutant removal (Figure 2.12). The hydrophobic nature of the membrane prevents fiber clogging from liquid and biofilm infiltration, thereby maintaining d
24
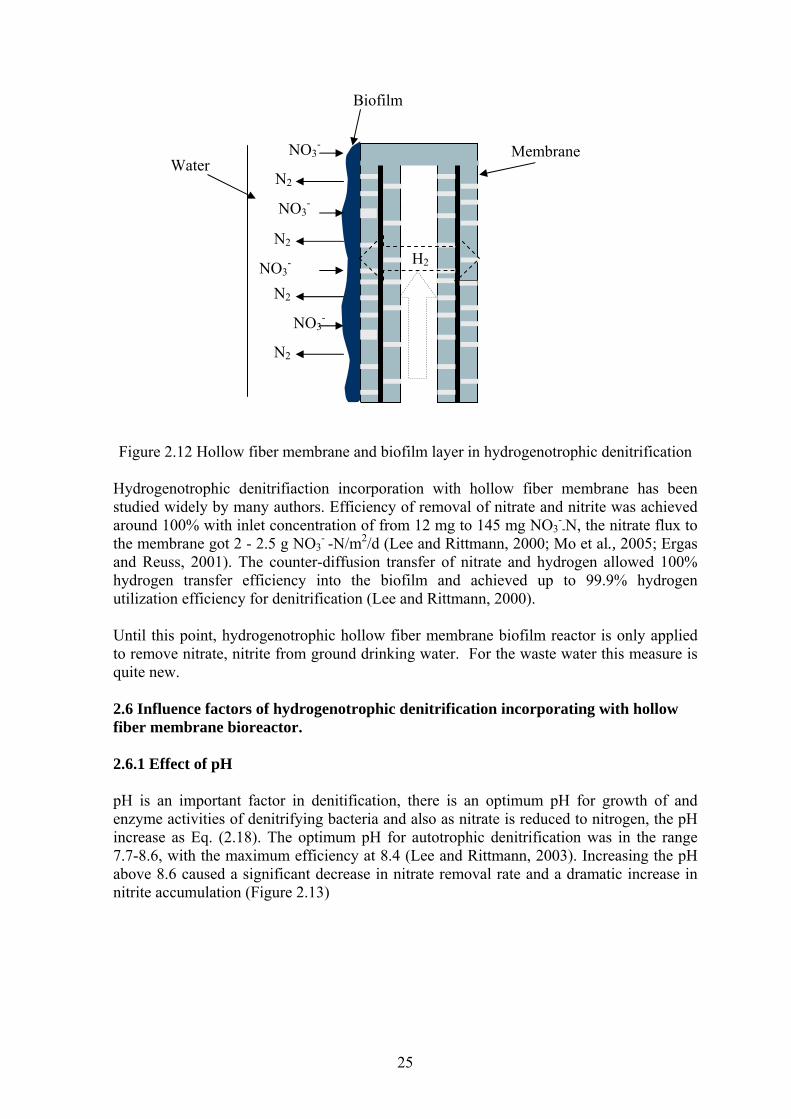
embrane and biofilm layer in hydrogenotrophic denitrification
p to 99.9% hydrogen tilization efficiency for denitrification (Lee and Rittmann, 2000).
itrate, nitrite from ground drinking water. For the waste water this measure is uite new.
genotrophic denitrification incorporating with hollow ber membrane bioreactor.
.6.1 Effect of pH
rease in nitrate removal rate and a dramatic increase in itrite accumulation (Figure 2.13)
H2
Water
Biofilm
NO3-
N2
NO3-
NO3-
N2
N2
NO3-
N2
Membrane
Figure 2.12 Hollow fiber m
Hydrogenotrophic denitrifiaction incorporation with hollow fiber membrane has been studied widely by many authors. Efficiency of removal of nitrate and nitrite was achieved around 100% with inlet concentration of from 12 mg to 145 mg NO3
--N, the nitrate flux to
the membrane got 2 - 2.5 g NO3- -N/m2/d (Lee and Rittmann, 2000; Mo et al., 2005; Ergas
and Reuss, 2001). The counter-diffusion transfer of nitrate and hydrogen allowed 100% hydrogen transfer efficiency into the biofilm and achieved uu Until this point, hydrogenotrophic hollow fiber membrane biofilm reactor is only applied to remove nq 2.6 Influence factors of hydrofi 2 pH is an important factor in denitification, there is an optimum pH for growth of and enzyme activities of denitrifying bacteria and also as nitrate is reduced to nitrogen, the pH increase as Eq. (2.18). The optimum pH for autotrophic denitrification was in the range 7.7-8.6, with the maximum efficiency at 8.4 (Lee and Rittmann, 2003). Increasing the pH above 8.6 caused a significant decn
25

Figure 2.13 Effluent nitrate and nitrite con ion verse effluent pH (Lee and Rittmann, 2003)
um pH conditions for nitrate and nitrite duction were 9.5 at 25±1 oC and 8.5 at 12±1 oC.
.6.2 Effect of hydrogen pressure
ogen ressure was lower than 0.2 atm, nitrite accumulation occurred (Rezania et al., 2005).
Figure 2.14 Nitrate and nitrite concentration in reactor at 0.28 atm (a) and 0.55 atm (b).
gh membrane. So
Nitr
ate,
nitr
ite, h
ydro
gen
(mg/
L)
pH in the effluent
centrat
According to Rezania et al. (2005), nitrite and nitrate reduction was inhibited at pH of 7 at both temperatures of 12±1 and 25±1 oC. The optimre 2 According to Eqs. 2.16 - 2.18, 1 mole of hydrogen is consumed per one mole of nitrate, whereas 1.5 mole of hydrogen is consumed per 1 mole of nitrite. Therefore, the accumulation of nitrite may occur if there is not sufficient hydrogen for the biomass. The effect of hydrogen on accumulation of nitrite is shown in Figure 2.14. When the hydrp
mg/
L
mg/
L
i i ur)T me (hour) T me (ho
The flux of hydrogen gas through membrane depends on the pressure of gas, the higher pressure of hydrogen is, the higher flux of hydrogen gas goes throuefficiency of nitrate removal depends on the pressure of hydrogen gas. Lee and Rittmann (2000, 2002) studied nitrate removal with different pressure from 0.2 atm to 0.56 atm the result show that the higher pressure applied in the membrane, the
26
higher efficiency of nitrate removal was achieved but the concentration of hydrogen gas in
ganic fraction of TSS. Solubility of the precipitated materials is pH ependent, as higher precipitation of inorganic compounds is expected at higher pH
an (2003) in the short term of experiment recipitation of mineral solids did not adversely affect H2 transfer and denitrification and
effect may occur.
scouring with gas bubbles (Pankhania et al., 1994). An attempt was made shear some of the biomass by increasing the circulation velocity to 0.72cm/s (Ergas and
e oxygen in water will compete with nitrate in hydrogen as following reaction so it ill reduce concentration of hydrogen gas in water and efficiency of nitrate reduction will
reduce
+ = 2H2O Eq (2.30) 4g 16g
denitrification reactor. This would lead to a reduction of both the hydrogen gas consumption and the minimum hydraulic retention time of the system (Grommen et al., 2006).
the effluent is higher. 2.6.3 Membrane fouling Precipitation seems to be one of the major reasons for fouling of hydrogen diffusers as was reported by Egras and Reuss (2001). Precipitation of mineral solids was found to have negative impact on the performance of hydrogen diffuser membranes. Cation in water, such as Ca2+ and Mg2+, can precipitate basis ions, such as carbonate, phosphate, mono-hydrogen phosphate and di-hydrogenphosphate. Mineral have lower solubility, such as Ca5(PO4)3OH, Ca3(PO4)2 and CaCO3, and are therefore expected to be the major contributors to the inord(Rezania et al., 2005). However, according to Lee and Rittmpwarned that long term 2.6.4 Biofilm layer Hollow fiber membrane performance in bioreactor is decreased after development of thick biofilm due to substrate mass transfer limitations, membrane fiber plugging, and decreased biomass activity so efficiency of nitrate removal is reduced (Ergas and Reuss, 2001). Several operational strategies have been used to maintain film thickness at an optimum level including the use of cross-flow membrane configurations (Ahmed and Semmens, 1996) and periodic shearing of biomass from membrane using high liquid velocities combined withtoReuss, 2001). 2.6.5 Dissolved oxygen Availablw
.
2 H2 O2
0.25g 1g In order to consume 1 g of dissolved oxygen in water it requires 0.25 g of hydrogen gas. So a low DO concentration, usually less than 0.2 mg/L, must be maintained by minimizing contact with the atmosphere (Rittmann and McCarty, 2001) or the effluent sample could be sparged with nitrogen gas to make it anoxic before entering the
27

Chapter 3
Methodology
3.1 Introduction This research was carried out under laboratory – scale experiment, using synthetic wastewater and at ambient condition to investigate the treatment efficiency of hydrogenotrophic denitrification of aquaculture wastewater using hollow fiber membrane. Method carrying out the research is described in Figure 3.1.
Synthetic wastewater
Aeration reactor
Denitrification reactor
Analyze: pH, COD, NO3
-, NO -2 , pH, DO
Performance Evaluation (Efficiency of removal, denitrification rate)
Acclimatized sludge
- Optimization of parameters (HRT, pH, buffer capacity)
- Using CO2 as agent to control pH - Change the sequence of reactors
(denitrification - aeration)
Acclimatized sludge
Figure 3.1 Experimental process
28

3.2 Feed wastewater, and microorganisms 3.2.1 Feed wastewater The study used synthetic wastewater containing concentration of 50 mg/L of NO3
--N, and 50 mg/L of COD. Nutrient salts and inorganic carbon were added to make the feed wastewater favorable for microorganism growth; the solution was buffered to approximate pH of around 7. The composition of synthetic wastewater is summarized in Table 3.1.
Table 3.1 Composition of the feed water
Chemicals Concentration COD* 50 mg/L NaNO3
* 303.6 (50 mg/L N- NO3) KH2PO4 87 mg/L NaHCO3 210 mg MgSO4.7H2O 10 g/L ZnSO4.7H2O 2.2 CaCl2.2H2O 7.3 MnCl2.4H2O 2.5 CoCl2.6H2O 0.5 (NH4)6Mo7O24.4H2O 0.5 FeSO4.7H2O 5 CuSO4.5H2O 0.2 Tr
ace**
el
emen
t,1m
L/L
* Composition of synthetic wastewater was prepared basing on the toxic level to the aqua livings (Lucas and Southgate, 2003; Blancheton, 2000; Jewell and Cummings, 1990) ** Ho et al, 2001. 3.2.2 Sludge acclimatization The system included two reactors, one was aeration for removal of organic carbon and the other was anaerobic for removal of nitrate by hydrogenotrophic bacteria. The sludge prepared for the system was acclimated with aeration and hydrogen gas condition. They are described as follow: Sludge acclimatization with aeration condition Activated sludge was acclimated with synthetic wastewater at 50 mg/L of NO3
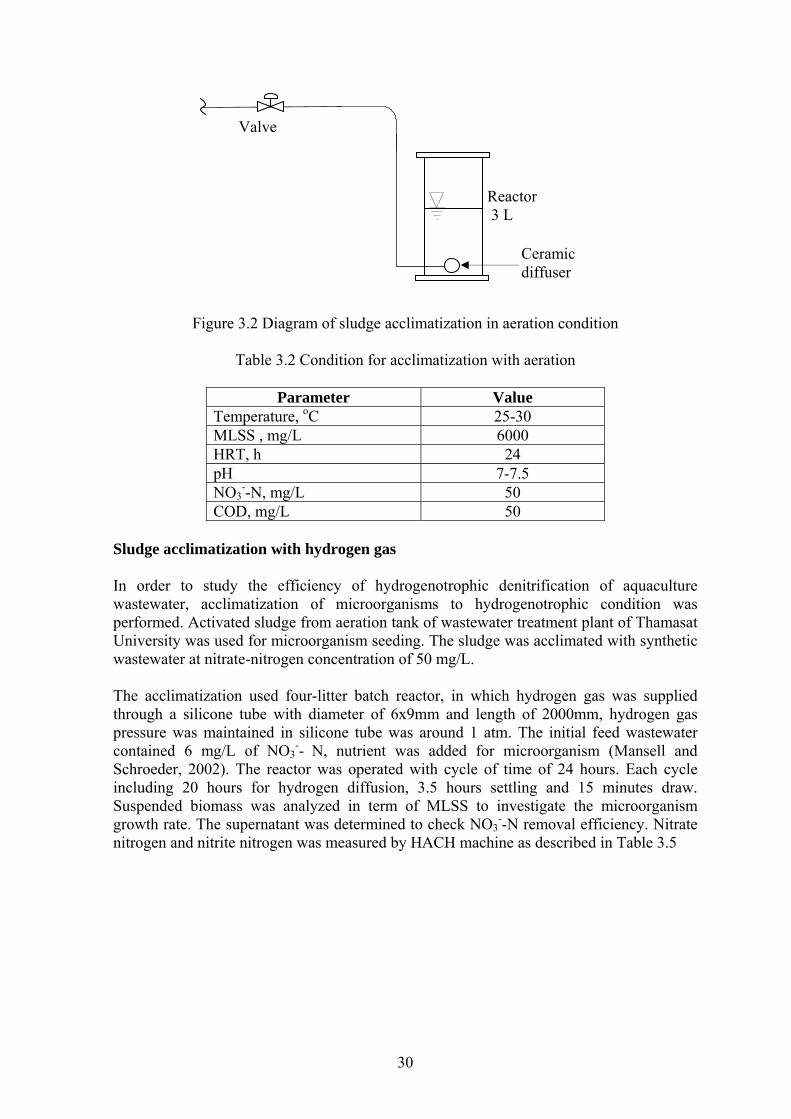
--N, 50 mg/L of COD, and enough nutrients. Acclimatization used three-litter batch reactor, in which air was supplied through a ceramic diffuser, diagram of reactor is described in Figure 3.2. The reactor was operated with cycle of time of 24 hours. Each cycle included 20 hours aeration, 3.5 hours settling and 15 minutes draw. Suspended biomass was analyzed in term of MLSS to investigate the microorganism growth rate. The supernatant was determined to check COD removal efficiency. The conditions for acclimatization with aeration are described in the Table 3.2
29
Valve
Ceramic diffuser
Reactor 3 L
Figure 3.2 Diagram of sludge acclimatization in aeration condition
Table 3.2 Condition for acclimatization with aeration
Parameter Value
Temperature, oC 25-30 MLSS , mg/L 6000 HRT, h 24 pH 7-7.5 NO3
--N, mg/L 50 COD, mg/L 50
Sludge acclimatization with hydrogen gas In order to study the efficiency of hydrogenotrophic denitrification of aquaculture wastewater, acclimatization of microorganisms to hydrogenotrophic condition was performed. Activated sludge from aeration tank of wastewater treatment plant of Thamasat University was used for microorganism seeding. The sludge was acclimated with synthetic wastewater at nitrate-nitrogen concentration of 50 mg/L. The acclimatization used four-litter batch reactor, in which hydrogen gas was supplied through a silicone tube with diameter of 6x9mm and length of 2000mm, hydrogen gas pressure was maintained in silicone tube was around 1 atm. The initial feed wastewater contained 6 mg/L of NO3
-- N, nutrient was added for microorganism (Mansell and Schroeder, 2002). The reactor was operated with cycle of time of 24 hours. Each cycle including 20 hours for hydrogen diffusion, 3.5 hours settling and 15 minutes draw. Suspended biomass was analyzed in term of MLSS to investigate the microorganism growth rate. The supernatant was determined to check NO3
--N removal efficiency. Nitrate nitrogen and nitrite nitrogen was measured by HACH machine as described in Table 3.5
30
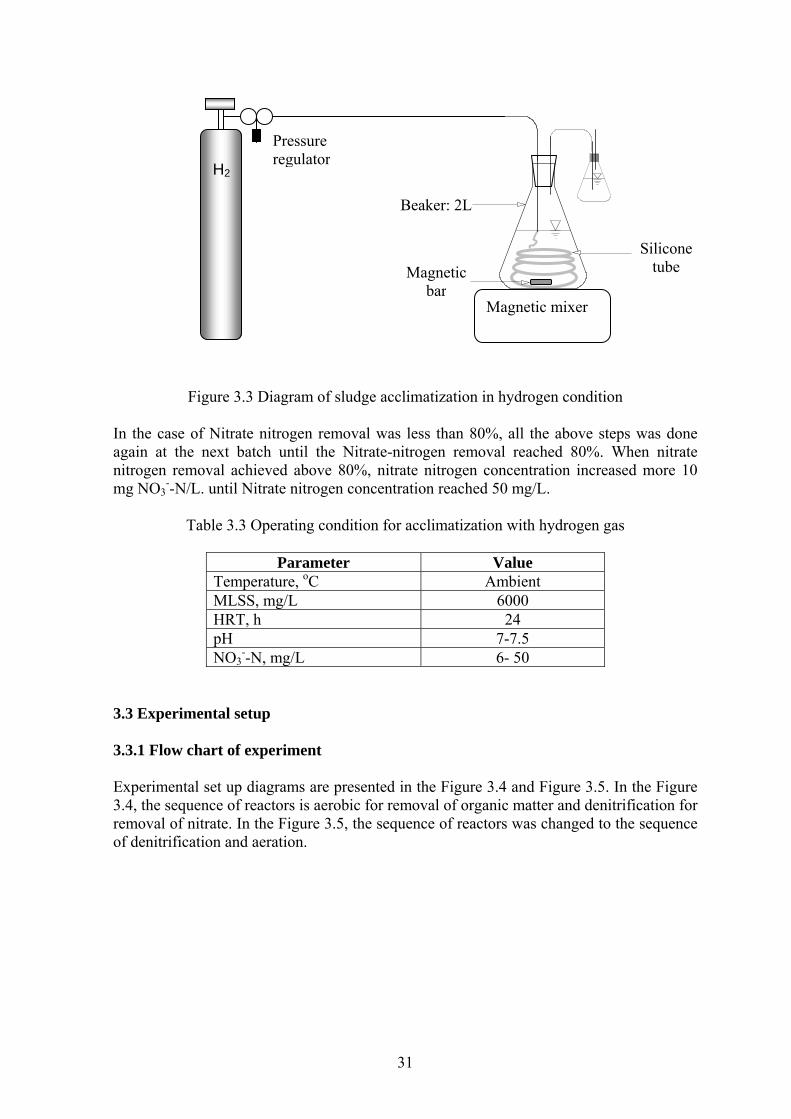
31
Figure 3.3 Diagram of sludge acclimatization in hydrogen condition In the case of Nitrate nitrogen removal was less than 80%, all the above steps was done again at the next batch until the Nitrate-nitrogen removal reached 80%. When nitrate nitrogen removal achieved above 80%, nitrate nitrogen concentration increased more 10 mg NO3
--N/L. until Nitrate nitrogen concentration reached 50 mg/L.
Table 3.3 Operating condition for acclimatization with hydrogen gas
Parameter Value Temperature, oC Ambient MLSS, mg/L 6000 HRT, h 24 pH 7-7.5 NO3
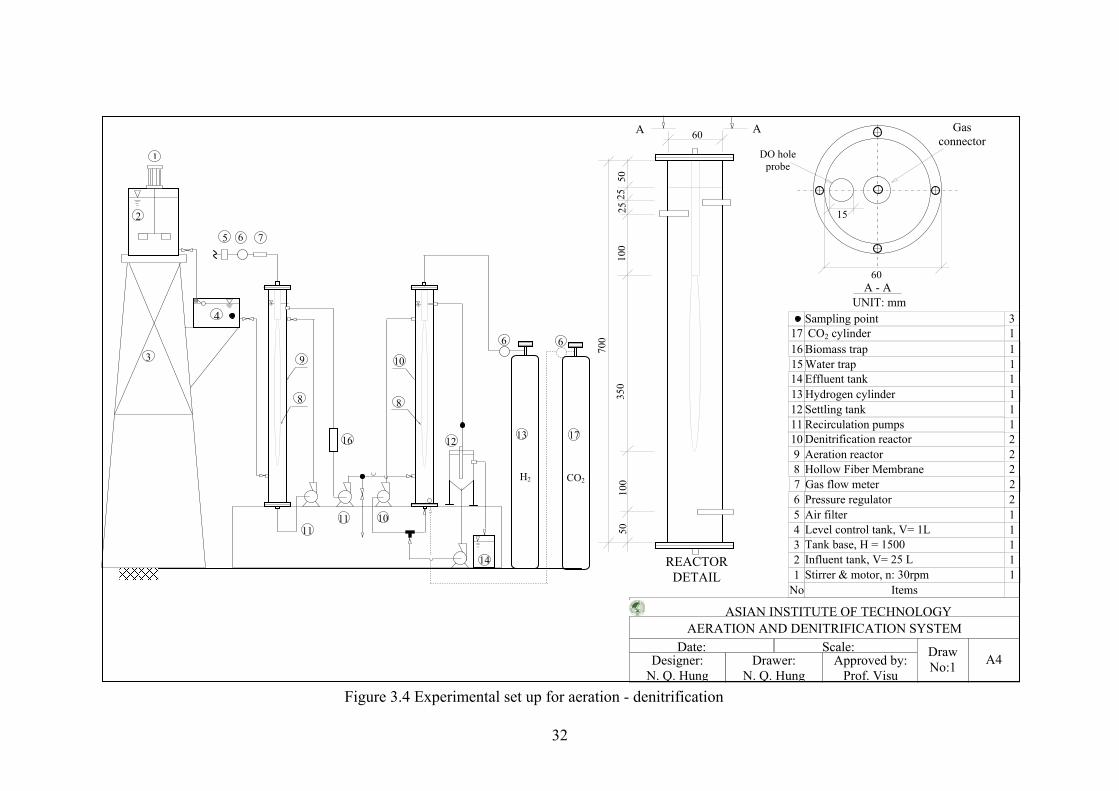
--N, mg/L 6- 50 3.3 Experimental setup 3.3.1 Flow chart of experiment Experimental set up diagrams are presented in the Figure 3.4 and Figure 3.5. In the Figure 3.4, the sequence of reactors is aerobic for removal of organic matter and denitrification for removal of nitrate. In the Figure 3.5, the sequence of reactors was changed to the sequence of denitrification and aeration.
H2
Magnetic bar
Silicone tube
Beaker: 2L
Magnetic mixer
Pressure regulator
32
Biomass trap 1 16Water trap 1 15
Items No
Gas flow meter 2 7
Stirrer & motor, n: 30rpm 1Influent tank, V= 25 L 1 2Tank base, H = 1500 1 3Level control tank, V= 1L 1 4Air filter 1 5Pressure regulator 2 6
Hollow Fiber Membrane 2 8Aeration reactor 2 9Denitrification reactor 2 10Recirculation pumps 1 11Settling tank 1 12Hydrogen cylinder 1 13
1
UNIT: mmSampling point 3
Effluent tank 1 14
CO2 cylinder 1 17
AA 60
50
350
50
700
25
REACTORDETAIL
100
100
25
ASIAN INSTITUTE OF TECHNOLOGYAERATION AND DENITRIFICATION SYSTEM
Designer: N. Q. Hung
Drawer: N. Q. Hung
Approved by: Prof. Visu
Date: Scale: Draw No:1 A4
15
60A - A
DO hole probe
Gas connector
Figure 3.4 Experimental set up for aeration - denitrification
H2
3
14
1
2
5 6 7
4
9
8
6
11 10
1216
10
11
8
CO2
6
13 17
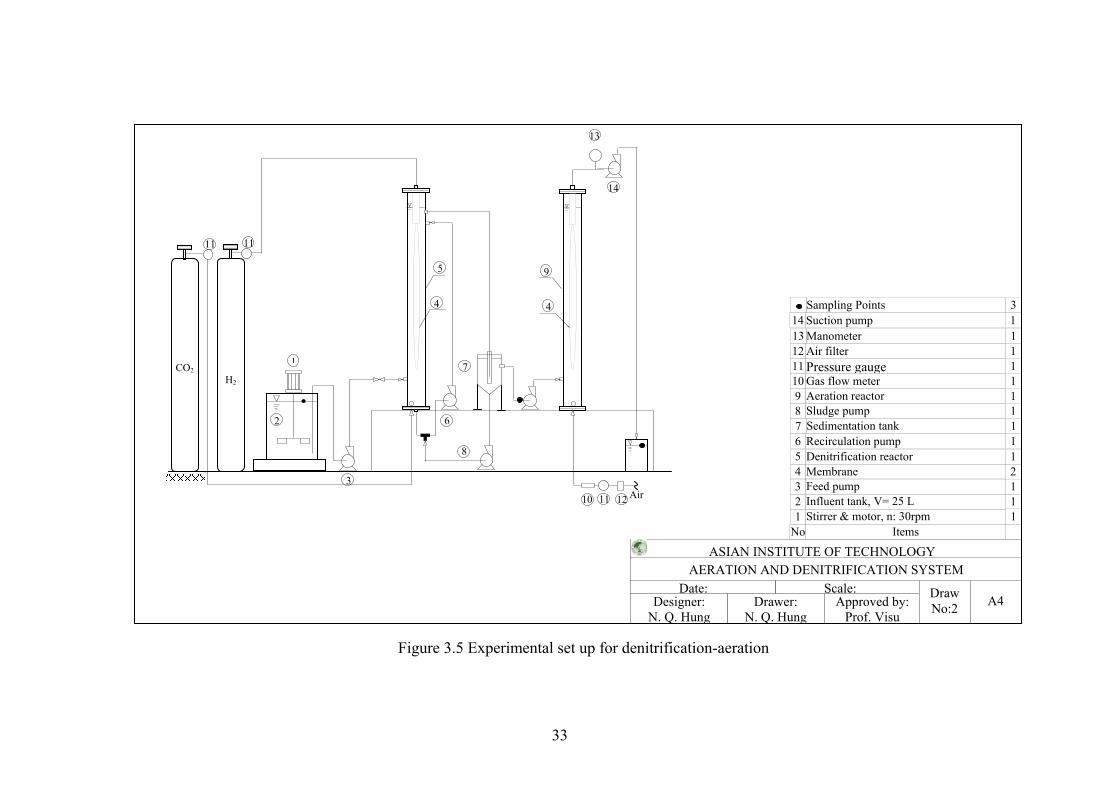
Items No
Manometer 1 13
Sampling Points 3
Sedimentation tank 1 7
Stirrer & motor, n: 30rpm 1Influent tank, V= 25 L 1 2Feed pump 1 3Membrane 2 4Denitrification reactor 1 5Recirculation pump 1 6
Sludge pump 1 8Aeration reactor 1 9Gas flow meter 1 10Pressure gauge 1 11Air filter 1 12
1
Suction pump 1 14
ASIAN INSTITUTE OF TECHNOLOGYAERATION AND DENITRIFICATION SYSTEM
Designer: N. Q. Hung
Drawer: N. Q. Hung
Approved by: Prof. Visu
Date: Scale: Draw No:2 A4
Figure 3.5 Experimental set up for denitrification-aeration
CO2
1
2
4 4
11
H2
11
10 Air
6
14
13
5
8
7
3
11 12
9
33

3.3.2 Experimental procedure 3.3.2.1 Aeration and Denitrification Synthetic waste water is stored in feed tank and run to the control level tank through control valve before coming to the reactor. The water level in control tank is the same as the level in aeration reactor. When the water level in control tank is below the low level, the control valve is opened and when the water level in control tank reaches the high level the valve is automatically closed. Outlet flow of this reactor is lead to the denitrification reactor. In the reactor, compressed air is supplied through hollow fiber membrane. This membrane is manufactured by Mitsubishi Rayon Company, Japan (Sterapore), the characteristics of the membrane are showed in the Table 3.4. The membrane serves as bubble-free diffuser and carrier for microorganism to attach. In order to reduce the effect of oil, particle in the air on the membrane the air was cleansed by an air filter before entering to the membrane. Amount of air supplied into the aeration reactor was controlled properly; dissolved oxygen was less than 2 mg/L for reduction of effect on denitrification in the second reactor. In this reactor, organic matter was removed by aeration process. In order to control biofilm layer on the membrane recycle water was necessary. It depended on the thickness of biofilm, different velocity in the reactor was controlled. A pump was required to recirculate the water in this reactor. Retention time of wastewater in reactor was controlled from 2-9 h In the start up stage of the system, only aeration reactor operated. The effluent was analyzed for determination of COD removal efficiency. When this value was achieved around 80%, the effluent was pumped to the denitrification reactor, here hydrogen gas was supplied for hydrogenotrophic denitrification process through hollow fiber membrane. Before coming to the denitrification reactor, washed out biomass in the effluent from the first reactor was separated by biomass trap. In this reactor, it was the same as with aeration reactor, the hollow fiber membrane served as both bubble-free diffuser and carrier for microorganism to attach. Hydrogen gas was supplied from a cylinder with high pressure of 150 atm so its pressure was reduced to around 0.5 atm before coming to the membrane. In the denitrification reactor or anaerobic reactor, nitrate was reduced to nitrogen by autotrophic microorganism. In order to control biofilm layer on the membrane, recycle water was necessary. It depends on the thickness of biofilm, velocity in the reactor was controlled. A pump was required to recirculate the water in this reactor. Retention time of wastewater in reactor was 9 hours in the start up stage of experiment. It depended on efficiency of treatment this value was reduced from 9 hours to 2 hours. During the experiment the values pH, DO, and hydrogen pressure was controlled to optimize the denitrification process. 3.3.2.2 Denitrification and aeration In this part, there is small change of sequence of reactors and the function of membrane. Wastewater is stored in feed tank and pumped to the denitrification reactror, in which denitrification process occurs. Membrane is used to diffuse hydrogen for microorganism. Water after removal of nitrate is run to the settling tank, here sludge is recirculated back to
34

the reactor and supernatant is pumped to the aeration reactor. In this reactor, air is supplied through ceramic diffuser placed at the bottom of reactor, water is sucked out through membrane which was used in previous experiment (Figure 3.5). This is the main difference with previous experimental setup.
Table 3.4 Characteristics of membrane
Membrane type Hollow fiber Membrane material Polyethylene (PE) Pore size 0.1µm Surface area 0.42m2
3.4 Experimental runs The research was divided into three runs, they are described as follow: The first run with retention time of 9h or Nitrate- Nitrogen loading rate (NLR) 130 g/m3/d. During this stage, the effect pH and buffer capacity on denitrification efficiency was studied. Characteristics of effluent was characterized with various parameters: pH, efficiency of treatment, NO3
--N, NO2--N. This stage found the optimum buffer capacity
which was run in the run 2. In this run mixture of solution K2HPO4 and KH2PO4 was used as buffer. This run prolonged 1.5 month. The second run was studied the efficiency of treatment with various retention times or the loading rates. In each loading rate, those previous parameters were measured for determination of optimum denitrification rate. The optimum value was used in the run 3. The time for this run prolonged 3 months. The last one, the optimum loading rate found in the run 1 and 2 was used in the run 3. In this stage, mixture of solution K2HPO4 and KH2PO4 was replaced by CO2 for controlling pH. The time for this run was around 3 months. The processes of experiment are described in Figure 3.5
Figure 3.6 Process of experimental runs
DN
R, g
/m3 .d
ay
Time, month 1 2 3 4 6
RUN 1 RUN 2 RUN 3
Run with different buffer capacity
HRT varies from 9 hours to 2 hour
- CO2 as agent for controlling pH- Optimum HRT - Changing the sequence of
reactors
pH Characterization
Efficiency characterization
Efficiency characterization
5 7
35
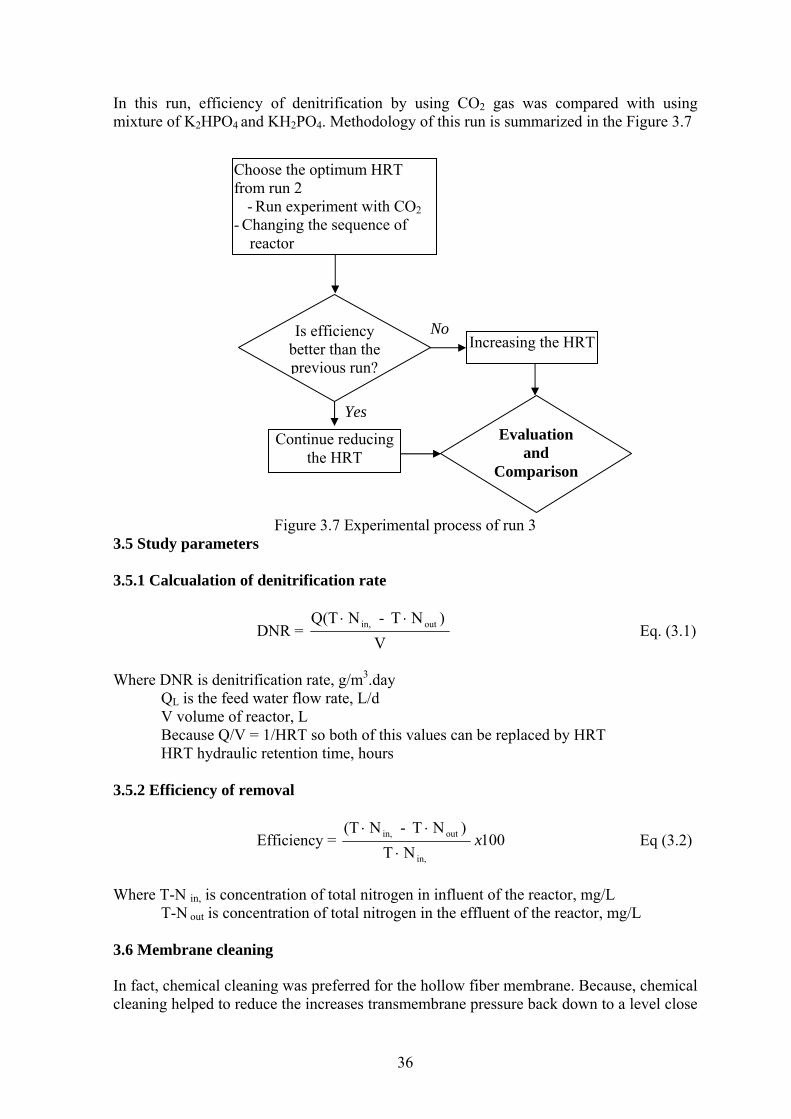
In this run, efficiency of denitrification by using CO2 gas was compared with using mixture of K2HPO4 and KH2PO4. Methodology of this run is summarized in the Figure 3.7
Choose the optimum HRT from run 2
- Run experiment with CO2 - Changing the sequence of
reactor
Is efficiency better than the previous run?
Yes
Continue reducing the HRT
No Increasing the HRT
Evaluation and
Comparison
Figure 3.7 Experimental process of run 3 3.5 Study parameters 3.5.1 Calcualation of denitrification rate
DNR = V
)NT -NQ(T out in, ⋅⋅ Eq. (3.1)
Where DNR is denitrification rate, g/m3.day
QL is the feed water flow rate, L/d V volume of reactor, L Because Q/V = 1/HRT so both of this values can be replaced by HRT HRT hydraulic retention time, hours
3.5.2 Efficiency of removal
Efficiency = 100NT in,⋅
)NT -NT out in, x( ⋅⋅
Eq (3.2)
here T-N in, total nitrogen in the effluent of the reactor, mg/L
W is concentration of total nitrogen in influent of the reactor, mg/L
T-N out is concentration of 3.6 Membrane cleaning In fact, chemical cleaning was preferred for the hollow fiber membrane. Because, chemical cleaning helped to reduce the increases transmembrane pressure back down to a level close
36
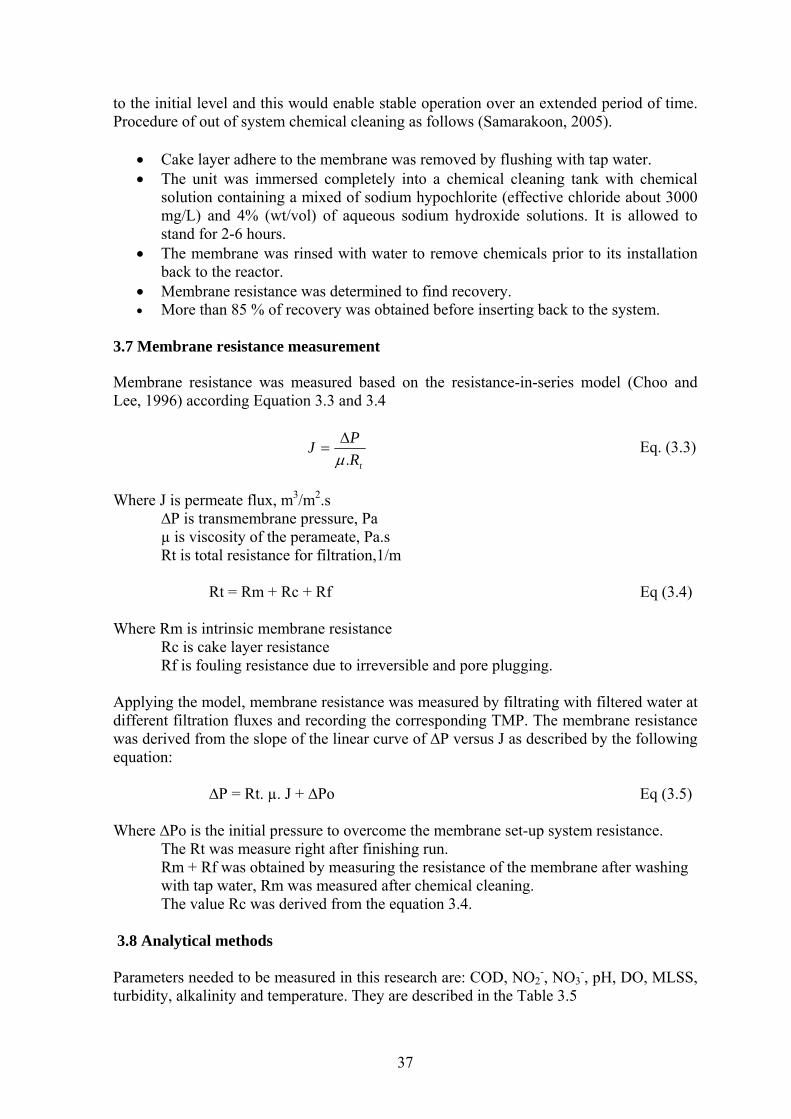
37
l level and this would enable stable operation over an extended period of time. Pro
• •
mixed of sodium hypochlorite (effective chloride about 3000
icals prior to its installation
• Membrane resistance was determined to find recovery. d before inserting back to the system.
embrane resistance was measured based on the resistance-in-series model (Choo and Lee, 1996) according Equation 3.3 and 3.4
tRPJ
.µ∆
= Eq. (3.3)
Where
is viscosity of the perameate, Pa.s Rt is to tion,1/m
Eq (3.4) Where Rm
c is cake layer resistance
ltration fluxes and recording the corresponding TMP. The membrane resistance as derived from the slope of the linear curve of ∆P versus J as described by the following
equation:
.5) Where
of the membrane after washing with tap water, Rm was measured after chemical cleaning.
the equation 3.4.
Parameters needed to be measured in this research are: COD, NO2 , NO3 , pH, DO, MLSS, turbidity, alkalinity and temperature. They are described in the Table 3.5
3.8 Analytical methods
- -
to the initiacedure of out of system chemical cleaning as follows (Samarakoon, 2005).
Cake layer adhere to the membrane was removed by flushing with tap water. The unit was immersed completely into a chemical cleaning tank with chemical solution containing amg/L) and 4% (wt/vol) of aqueous sodium hydroxide solutions. It is allowed to stand for 2-6 hours.
• The membrane was rinsed with water to remove chemback to the reactor.
• More than 85 % of recovery was obtaine 3.7 Membrane resistance measurement M
J is permeate flux, m3/m2.s ∆P is transmembrane pressure, Pa µ
tal resistance for filtra
Rt = Rm + Rc + Rf
is intrinsic membrane resistance RRf is fouling resistance due to irreversible and pore plugging.
Applying the model, membrane resistance was measured by filtrating with filtered water at different fiw
∆Po is the initial pressure to overcome the membrane set-up system resistance. The Rt was measure right after finishing run.
The value Rc was derived from
Rm + Rf was obtained by measuring the resistance
∆P = Rt. µ. J + ∆Po Eq (3

38
Paramters Analytical method Analytical equipment Range Interference Sampling point Reference
pH - pH meter WTW 1-14 - Influent/effluent -
DO - DO probe WTW - H2S, N2, etc Influent/effluent -
Temperature - Thermal sensor WTW - - Influent/effluent -
Turbidity - HACH 2100 N Turbidimeter - - Effluent -
MLSS/MLVSSFiltration/evaporation/
Weighting - - - Effluent APHA et al., 1998
COD Closed reflux - 0-50 NO2-, Cl-, Br- Influent/effluent APHA et al., 1998
Alkalinity Titration - - Soap, oil, SS Influent/effluent APHA et al., 1998 CO2 Titration - - - Effluent APHA et al., 1998
NO2--N Ferrous Sulfate
Method
HACH, NitriVer®3
Nitrite reagent
0-0.3 mg N/L
Cl2, NaCl3, Fe3+, Pb2+ Effluent HACH company manual:
DR2000, APHA et al., 1998
NO3--N Cadmium Reduction
Method
HACH, NitraVer®5
Nitrate reagent
0-30 mg N/L Cl-, NO2
-, ion Influent/effluent HACH company manual: DR2000 APHA et al., 1998
Table 3.5 Parameters and Their Analytical Methods
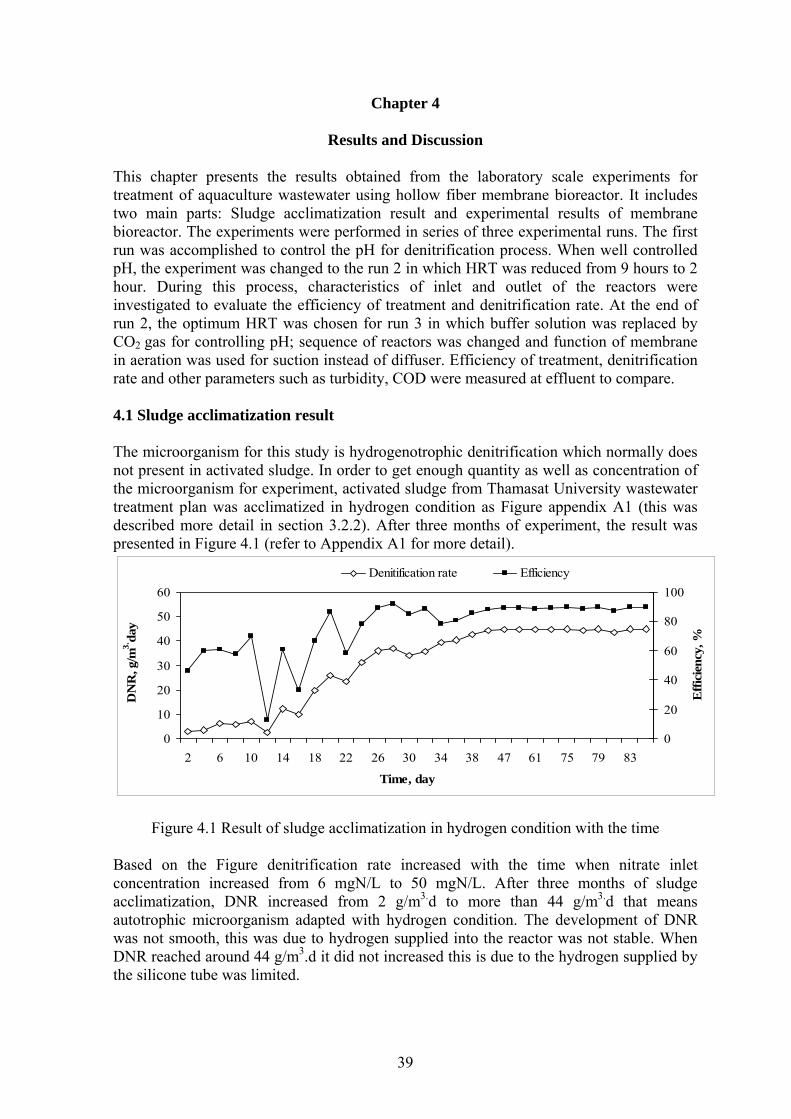
Chapter 4
Results and Discussion This chapter presents the results obtained from the laboratory scale experiments for treatment of aquaculture wastewater using hollow fiber membrane bioreactor. It includes two main parts: Sludge acclimatization result and experimental results of membrane bioreactor. The experiments were performed in series of three experimental runs. The first run was accomplished to control the pH for denitrification process. When well controlled pH, the experiment was changed to the run 2 in which HRT was reduced from 9 hours to 2 hour. During this process, characteristics of inlet and outlet of the reactors were investigated to evaluate the efficiency of treatment and denitrification rate. At the end of run 2, the optimum HRT was chosen for run 3 in which buffer solution was replaced by CO2
gas for controlling pH; sequence of reactors was changed and function of membrane in aeration was used for suction instead of diffuser. Efficiency of treatment, denitrification rate and other parameters such as turbidity, COD were measured at effluent to compare. 4.1 Sludge acclimatization result The microorganism for this study is hydrogenotrophic denitrification which normally does not present in activated sludge. In order to get enough quantity as well as concentration of the microorganism for experiment, activated sludge from Thamasat University wastewater treatment plan was acclimatized in hydrogen condition as Figure appendix A1 (this was described more detail in section 3.2.2). After three months of experiment, the result was presented in Figure 4.1 (refer to Appendix A1 for more detail).
Denitif on rateicati60 100
0
10
20
30
40
2 6 10 14
DN
R, g
/m3.
day
0
20
40
60
80
Effi
cien
cy, %
50
18 22 26 30 34 38 47 61 75 79 83
Time, day
Efficiency
ation rate increased with the time when nitrate inlet mgN/L to 50 mgN/L. After three months of sludge
3. to more than 44 g/m3.d that means n condition. The development of DNR
Figure 4.1 Result of sludge acclimatization in hydrogen condition with the time
Based on the Figure denitrificoncentration increased from 6c
acclimatization, DNR increased from 2 g/m dutotrophic microorganism adapted with hydrogea
was not smooth, this was due to hydrogen supplied into the reactor was not stable. When DNR reached around 44 g/m3.d it did not increased this is due to the hydrogen supplied by
e silicone tube was limited. th
39

Parallel with DNR, the efficiency of nitrate nitrogen removal was increased significantly. In the initial days, the efficiency was around 30% with inlet NO3
--N of 6mg/L and after two months efficiency reached around 90% with inlet NO3
--N of 50 mg/L and HRT of 24 hours. 4.2 Experimental run 1 and 2 4.2.1 pH change during denitrification process During denitrification process, pH was increased gradually if there was no buffer solution added as presented in Figure 4.2.
From this time buffer solution added
7.07.58.0
9.510.0
8.59.0
pH v
alue
0 5 10 15 20 25 30 35 40 45 50Time, day
Figure 4.2 Variation of pH with the time pH increased from 8.6 to 9.8 after 4 days of experiment, this is due to denitrification process produce alkalinity as the reaction of Eq 4.1. According to Ho et al. (2001), 1g of NO3
-N converted to N2 will theoretically produces 3.57 g alkalinity as CaCO3
H2 + 0.35 NO3- + 0.35 H+ + 0.052CO2 → 0.17N2 + 1.1 H2O + 0.010 C5H7NO2 Eq 4.1
From the fourth day onwards, pH was reduced gradually; this is due to at this time mixtures of buffer KH2PO4 and K2HPO4 were added to suppress the increasing of pH. This value reached at 8.6 at day 13. At this time the lowest value of NO3
--N and NO2--N were
achieved zero (Figure 4.4 and 4.5). At day 16, pH reduced to 7.5 this is due to the denitrification rate was lowered at this time so alkalinity produced in Eq 4.1 was less, the outlet of NO3
--N and NO2--N were high (Figure 4.4 and 4.5). From the day 20 onwards, pH
was maintained around 8.0 at this value is the optimum for denitrification (Lee and Rittmann, 2003). Amount of KH2PO4 and K2HPO4 consumed for maintain this pH value is 21g and 27 g per 1 g of NO3
--N feed respectively.
40

4.2.2 COD removal in both reactors With hydraulic retention time (HRT) of 9 hours, 6 hours, 4 hours, 3 hours and 2 hours; and inlet concentration of COD was around 50 mg/L, the outlet concentration of COD is presented in Figure 4.3. When HRT was 9 hours, the outlet concentration of COD in the first reactor (aerobic) was around 10 mg/L, efficiency of treatment is around 85% to 90%. Although long retention time but efficiency can not be high than that this is due to ultimate BOD is not the same with COD evenly that substance is glucose. For glucose, the ratio of ultimate BOD and COD is around 85% (Sawyer et al., 2003).
05 10 15 20 25 30 35 40 45 50 55 60 65 70
Time, day
10
20
30
40
CO
D, m
g/
50
60
L
Outlet 1 Outlet 2
Outlet 2 is the outlet of denitrification reator (anaerobic reactor) Figure 4.3 Outlet concentrations of COD in both reactors
From the day 14 onward, retention time of wastewater was reduced to 6 hours, 4 hours respectively, however the outlet COD in the first reactor was not changed significantly. When HRT was reduced to 3 hours and 2 hours respectively, outlet COD increases but it is not much. These are explained that composition of COD is glucose it is easily decomposed in a short HRT so within the range HRT of 2 hour to 9 hours the efficiency of treatment is not changed. The outlet of the first reactor was the inlet of second reactor (anaerobic). In the Figure 4.3 the outlet in the second reactor was higher than the inlet, it was 10-15mg/L as COD. In this reactor organic was not only removed but also added more. This was due to the second reactor was anaerobic process, only denitrification was occurred here. The increasing of COD in the outlet comparing with outlet was caused by the generation and release of soluble microbial products into the water (Mo et al., 2005).
Note: Outlet 1 is the outlet of aerobic reactor
6 h 9 h 4 h 3 h 2 h HRT
41
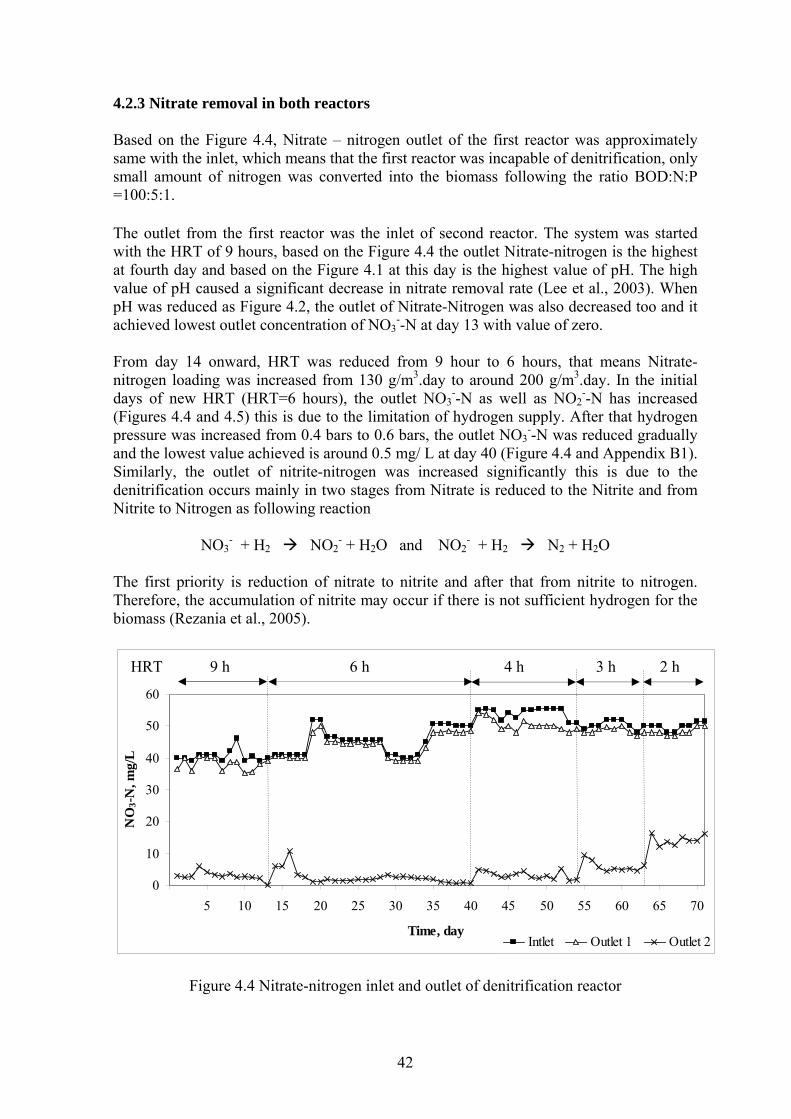
4.2.3 Nitrate removal in both reactors Based on the Figure 4.4, Nitrate – nitrogen outlet of the first reactor was approximately same with the inlet, which means that the first reactor was incapable of denitrification, only small amount of nitrogen was converted into the biomass following the ratio BOD:N:P =100:5:1. The outlet from the first reactor was the inlet of second reactor. The system was started with the HRT of 9 hours, based on the Figure 4.4 the outlet Nitrate-nitrogen is the highest at fourth day and based on the Figure 4.1 at this day is the highest value of pH. The high value of pH caused a significant decrease in nitrate removal rate (Lee et al., 2003). When pH was reduced as Figure 4.2, the outlet of Nitrate-Nitrogen was also decreased too and it achieved lowest outlet concentration of NO3
--N at day 13 with value of zero. From day 14 onward, HRT was reduced from 9 hour to 6 hours, that means Nitrate-nitrogen loading was increased from 130 g/m3.day to around 200 g/m3.day. In the initial days of new HRT (HRT=6 hours), the outlet NO3
--N as well as NO2--N has increased
(Figures 4.4 and 4.5) this is due to the limitation of hydrogen supply. After that hydrogen pressure was increased from 0.4 bars to 0.6 bars, the outlet NO3
--N was reduced gradually and the lowest value achieved is around 0.5 mg/ L at day 40 (Figure 4.4 and Appendix B1). Similarly, the outlet of nitrite-nitrogen was increased significantly this is due to the denitrification occurs mainly in two stages from Nitrate is reduced to the Nitrite and from Nitrite to Nitrogen as following reaction
NO3- + H2 NO2
- + H2O and NO2- + H2 N2 + H2O
The first priority is reduction of nitrate to nitrite and after that from nitrite to nitrogen. Therefore, the accumulation of nitrite may occur if there is not sufficient hydrogen for the biomass (Rezania et al., 2005).
0
10
20
30
40
50
60
5 10 15 20 25 30 35 40 45 50 55 60 65 70
Time, day
NO
3-N
, mg/
L
Intlet Outlet 1 Outlet 2
6 h 9 h 4 h 3 h 2 h HRT
Figure 4.4 Nitrate-nitrogen inlet and outlet of denitrification reactor
42
Similarly, when HRT was reduced from 6 hours to 4 hours, 3 hours and 2 hours, in the initial days of each new HRT the outlet nitrate-nitrogen and nitrite nitrogen was increased temporarily. This is due to nitrate loading rate has been suddenly increased from 200 g/m3.day to around 600 g/m3.day, hydrogen supplied is not sufficient, and the microorganism was not familiar with high loading rate. After that hydrogen pressure was increased 0.1 bar of each new HRT and outlet nitrite and nitrate nitrogen was reduced (Figure 4.4 and Figure 4.5). Hydrogen pressure at HRT of 2 hours was 0.9 bar
5
10
NO
2-N
, mg/
L
05 10 33 38 43 48 53 58 63 68
Time, day
15
20
Figure 4.5 Nitrite nitrogen outlet of denitrification reactor 4.2.4 Total nitrogen removal Nitrogen was removed simultaneously in both reactors; only small part of total nitrogen was removed in the first reactor. This is explained that some nitrogen was converted into the biomass following the ratio BOD: N: P =100:5:1 and the other may be the heterotrophic denitrification when DO was low (Walter et al., 2005). The major part of nitrogen was removed in the second reactor according to the denitrification process. Total nitrogen outlet includes nitrate and nitrite nitrogen. Based on the Figure 4.6, when HRT was 9 hours the outlet nitrogen was low, it was less than 10 mg/L. This is due to the good denitrification process. At this stage the efficiency of nitrate removal of second reactor (denitrification reactor) was achieved 100% at day 13th of experiment (as described in Figure 4.7 and Appendix B3).
6 h 9 h 4 h 3 h 2 h HRT
43
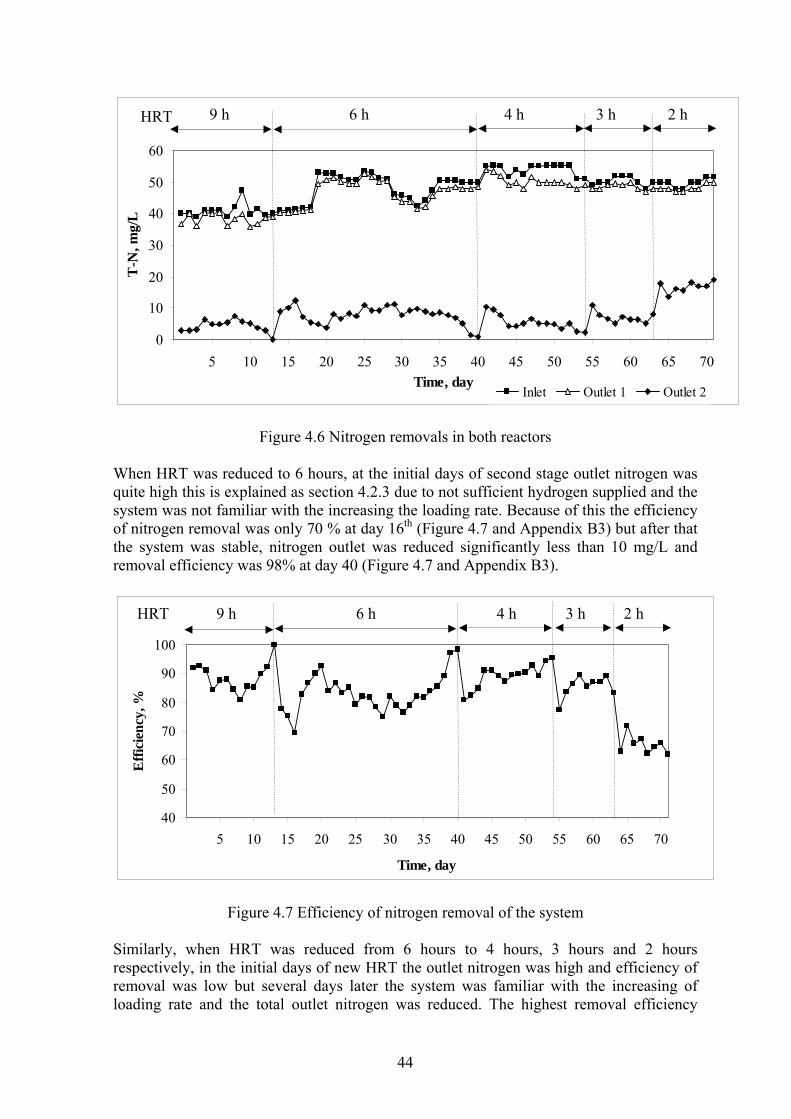
0
10
20
30
T-N
, m
40
50
5 10 15 20 25 30 35 40 45 50 55 60 65 70, day
g/60
Time
L
Inlet Outlet 1 Outlet 2
the initial days of second stage outlet nitrogen was uite high this is explained as section 4.2.3 due to not sufficient hydrogen supplied and the
system was not familiar with the increasing the loading rate. Because of this the efficiency of nitrogen removal was only 70 % at day 16th (Figure 4.7 and Appendix B3) but after that the system was stable, nitrogen outlet was reduced significantly less than 10 mg/L and removal efficiency was 98% at day 40 (Figure 4.7 and Appendix B3).
9 h 6 h 4 h
Figure 4.6 Nitrogen removals in both reactors
When HRT was reduced to 6 hours, at q
40
50
60
70
80
90
100
5 10 15 20 25 30 35 40 45 50 55 60 65 70
Effi
cien
cy, %
Time, day
itial days of new HRT the outlet nitrogen was high and efficiency of moval was low but several days later the system was familiar with the increasing of
loading rate and the total outlet nitrogen was reduced. The highest removal efficiency
Figure 4.7 Efficiency of nitrogen removal of the system
Similarly, when HRT was reduced from 6 hours to 4 hours, 3 hours and 2 hours respectively, in the inre
3 h 2 h HRT
6 h 9 h 4 h 3 h 2 h HRT
44

achieved 95%, 90% and 71 % at HRT of 4 hours, 3 hours and 2 hours respectively (Figure 4.7 and Appendix B3). 4.2.5 Denitrification rate in the second reactor Figure 4.8 below shows the denitrification rate in the second reactor and the total system.
s discussed in section 4.2.4 the nitrogen removal in the first reactor was very low so the denitrification of this reactor was insignificant it mainly occurred in the second reactor. This is also an objective of this study.
A
050
100150200250300350400450
5 10 15 20 25 30 35 40 45 50 55 60 65 70
Time, day
DN
R, g
/m3 .d
ay
40
50
60
70
80
90
100
Effi
cien
cy, %
DNR Removal efficiency
Figure 4.8 Denitrification rate in denitrification reactor
When HRT was 9 hours, DNR was quite stable this value was around 100 g/m3.day. When HRT was reduced to 6 hours, 4 hours, 3 hours and 2 hours, the highest denitrification rates were achieved 191 g/m3.day, 280 g/m3.day, 356 g/m3.day and 413 g/m3.day respectively (Figure 4.8 and Appendix B3). This is due to increasing the inlet nitrate loading rate and hydrogen supplied. Based on Figure 4.8, when HRT was reduced from 9 hours to 3 hours the results were good, efficiency of nitrate removal was higher than 90%. But when HRT was reduced to 2 hours, the efficiency was reduced significantly; it achieved less than 70%. Although DNR increased comparing with HRT of 3 hours, the quality of effluent was not good (NO3
--N = 12 - 16 mg/L, NO2
--N = 1.5-3 mg/L) for recycle so HRT of 3 hours was selected for next run of experiment.
6 h 9 h 4 h 3 h 2 h HRT
45

4.2.6 Effect of biofilm and membrane fouling on hydrogen diffusion From day 85 of experiment, HRT was increased from 2 hours to 3 hours in order to prepare for new run. Efficiency of denitrification is presented in Figure 4.9
02468
101214
85 86 87 88 89 90 91 92
NO
3-N
/NO
2-N
, mg 16
1820
93 94 95
/L
Time, day
outlet outlet 3 day 55-6
periment efficiency was very low, especially from day 90 to 93 it endix Table B2 and B4). Visual observation indicated that this
film was attached on the hollow fiber (Appendix I2) so the gas ermore, this may be precipitation of
e hydrogen diffusion (Rezania
oncludes that efficiency of nitrate removal as neral
4.3 Experimental run 3
r HCO3
- is used as in organic carbon source
Figure 4.9 Effect of biofilm and membrane fouling on denitrification
Based on Figure 4.9, efficiency of denitrification from day 55 to 63 was around 90% but rom day 85 to 93 of exf
was around 65-70% (Appecrease due to thick biod
was diffused difficultly (Pankhania et al., 1994). Furthineral solids on the surface of hollow fibers so it limited thm
et al., 2005; Ergas and Reuss, 2001). Membrane resistance was increased from 5.26917x10¹¹m-1 to 7.62857x10¹¹m-1 (Appendix E), so the limited hydrogen supplied is the reason cause reduction of denitrification efficiency From day 94 to 95 of experiment, after membrane was cleaned by physical and chemical (described in Section 3.6) membrane resistance was reduced to 5.53083x10¹¹ m-1
(Appendix E), efficiency of denitrification was increased. Outlet Nitrate and nitrite were educed significantly. From this result it cr
well as denitrification rate was affected by biofilm layer and precipitation of some mialts on the membrane. s
4.3.1 Comparison of using CO2 and buffer solution Normally, in order to control the pH, mixture of K2HPO4 and KH2PO4 is used as buffe olution to suppress the increasing of pH ands
(Rezania et al., 2005; Lee and Rittman, 2000, 2002, 2003; Mansell et al., 2002). In this study, in order to maintain pH around 8, total alkalinity of feed wastewater is 750 mg/L as CaCO3
this was caused by K2HPO4, KH2PO4 and HCO3-. When CO2 was used as agent to
Cleaned membrane
NO3 -N -
NO2 -N -
NO3 -N -
46
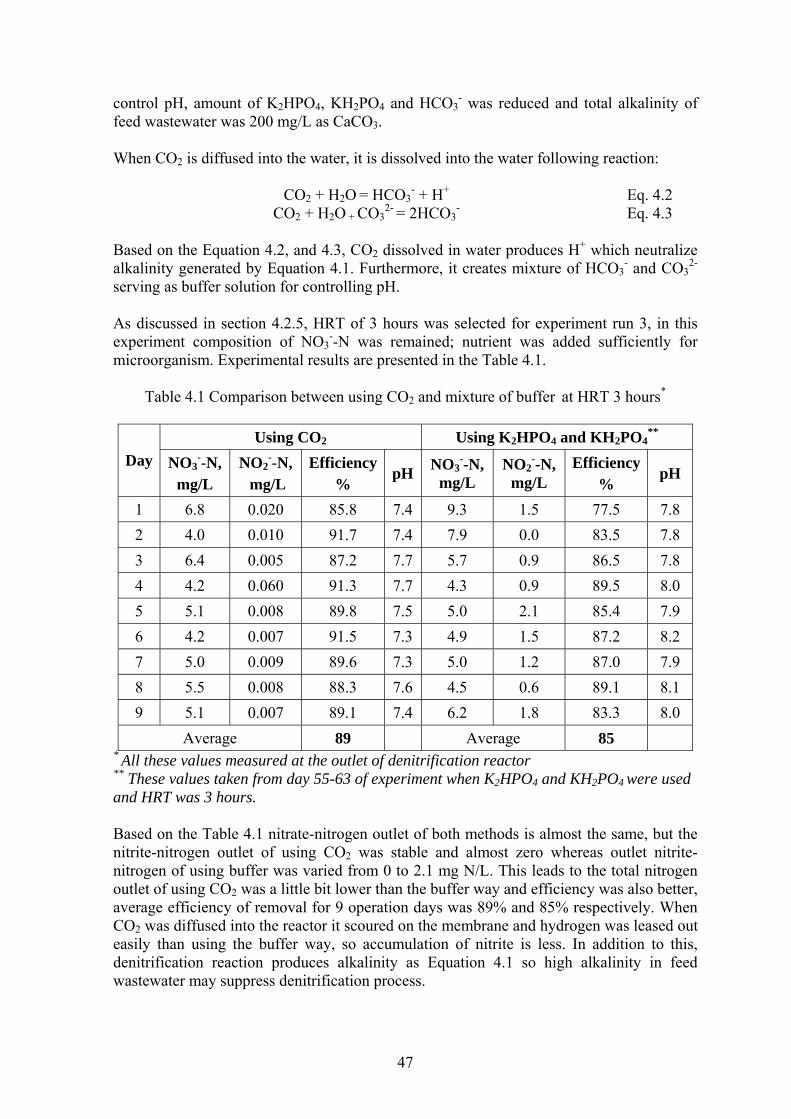
control pH, amount of K2HPO4, KH2PO4 and HCO3- was reduced and total alkalinity of
feed
When CO2 is diffused ter, it is dissolved in
C + 42 + H2 CO3
2- = 2HC Eq. 4.3
Ba on t quati and 4 2 dissolved in water produces H+ neu e alkalinity generated by Equation 4.1. Furth re, eates m re of H and 2-
ser g as r solu r con g pH As discussed in section 4.2.5, HRT of 3 hours was selected for experime s experiment composition of NO3 as ined; nutrient was added sufficiently for mic organ res e pr ed i Table 4.1.
able omp betwe ng C nd ure of r at HRT 3 hours
CO2 ng K2 4 and O4**
wastewater was 200 mg/L as CaCO3.
into the wa to the water following reaction:
CO2 + H2O = H O3- H+ Eq. .2
CO O + O3-
sed he E on 4.2, .3, CO whichCO
traliz COermo it cr ixtu 3
-3
vin buffe tion fo trollin .
nt run 3, in thi--N w rema
ro ism. Experimental ults ar esent n the
T 4.1 C arison en usi O a2 mixt buffe *
Using Usi HPO KH2PDay N O2
--N, Efficiency NO3- --N,
L Efficiency
% O3
--N, Nmg/L mg/L %
pH mg/L mg/-N, NO2 pH
1 6.8 0.020 85.8 7.4 9.3 1.5 77.5 7.8 2 4.0 0.010 91.7 7.4 7.9 0.0 83.5 7.8 3 6.4 0.005 87.2 7.7 5.7 0.9 86.5 7.8 4 4.2 0.060 91.3 7.7 4.3 0.9 89.5 8.0 5 5.1 0.008 89.8 7.5 5.0 2.1 85.4 7.9 6 4.2 0.007 91.5 7.3 4.9 1.5 87.2 8.2 7 5.0 0.009 89.6 7.3 5.0 1.2 87.0 7.9 8 5.5 0.008 88.3 7.6 4.5 0.6 89.1 8.1 9 5.1 0.007 89.1 7.4 6.2 1.8 83.3 8.0
Average 89 Average 85 * All these values measured at the outlet of denitrification reactor ** These values taken from day 55-63 of experiment when K2HPO4 and KH2PO4 were used and HRT was 3 hours. Based on the Ta t ge u thods is almost the same, but the itrite-nitrogen 2 s ost zero whereas outlet nitrite-itrogen of usin fr 0 total nitrogen tlet of using CO2 was a little bit lower than the buffer way and efficiency was also better,
accumulation of nitrite is less. In addition to this, enitrification reaction produces alkalinity as Equation 4.1 so high alkalinity in feed
ble .1 nitra4 e-nitrooutlet of using CO
n owa
tlet of both mestable and almn
n g buffer was varied om to 2.1 mg N/L. This leads to theouaverage efficiency of removal for 9 operation days was 89% and 85% respectively. When CO2 was diffused into the reactor it scoured on the membrane and hydrogen was leased out easily than using the buffer way, so dwastewater may suppress denitrification process.
47
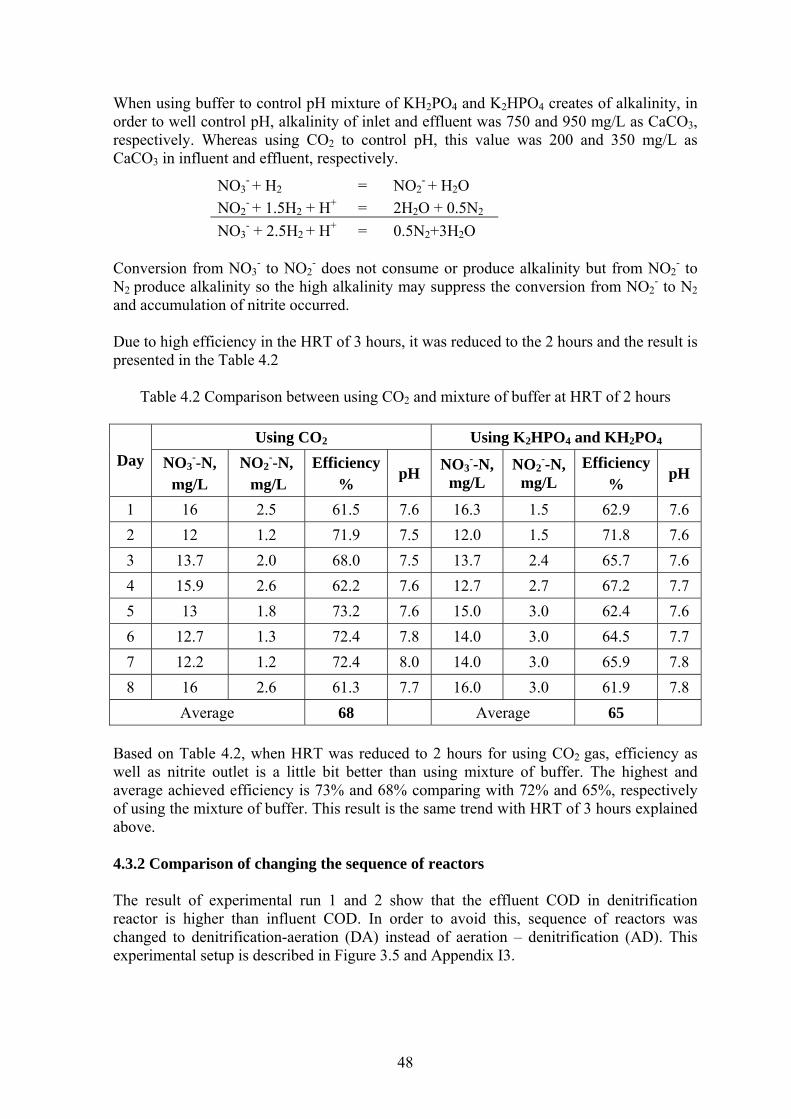
When using buffer to control pH mixture of KH2PO4 and K2HPO4 creates of alkalinity, in orde O3,
spectively. Whereas using CO2 to control pH, this value was 200 and 350 mg/L as CaCO3 in influent and effluent, respectively.
Conversion from NO3 NO2
- does not consume or produce alkalinity but from NO N roduc linity e high nity sup the co sion fr O2
- t an ccum on of n occurr D to hig ficiency e HRT our as d to t hours a e res pr nted Table
par betwee g CO d m of bu t HRT ours
Using CO2 U PO4 and PO4
r to well control pH, alkalinity of inlet and effluent was 750 and 950 mg/L as CaCre
- to 2o N
- to2 p e alka so th alkali may press nver om N 2d a ulati itrite ed.
ue h ef in th of 3 h s, it w reduce he 2 nd th ult isese in the 4.2
anTable 4.2 Com ison n usin 2 ixture ffer a of 2 h
sing K2H KH2
Day NO --N, NO --N, Efficiency - - Efficiency 3
mg/L 2
mg/L % pH NO3 -N,
mg/L NO2 -N,
mg/L % pH
1 16 2.5 61.5 7.6 16.3 1.5 62.9 7.6 2 12 1.2 71.9 7.5 12.0 1.5 71.8 7.6 3 13.7 2.0 68.0 7.5 13.7 2.4 65.7 7.6 4 15.9 2.6 62.2 7.6 12.7 2.7 67.2 7.7 5 13 1.8 73.2 7.6 15.0 3.0 62.4 7.6 6 12.7 1.3 72.4 7.8 14.0 3.0 64.5 7.7 7 12.2 1.2 72.4 8.0 14.0 3.0 65.9 7.8 8 16 2.6 61.3 7.7 16.0 3.0 61.9 7.8
Average 68 Average 65 Based on Table 4.2, when HRT wa s reduced to 2 hours for using CO2 gas, efficiency as
ell as nitrite outlet is a little bit better than using mixture of buffer. The highest and comparing with 72% and 65%, respectively
f using the mixture of buffer. This result is the same trend with HRT of 3 hours explained
3.
O NO - +NO2 2 + H+ 2 + NO3
- + 2.5H2 + H 0 +3H
N 3- + H2 = 2
H H2O
0.5N- + 1.5H = 2O 2
+ = .5N2 2O
waverage achieved efficiency is 73% and 68%oabove. 4.3.2 Comparison of changing the sequence of reactors The result of experimental run 1 and 2 show that the effluent COD in denitrification reactor is higher than influent COD. In order to avoid this, sequence of reactors was changed to denitrification-aeration (DA) instead of aeration – denitrification (AD). This experimental setup is described in Figure 3.5 and Appendix I
48
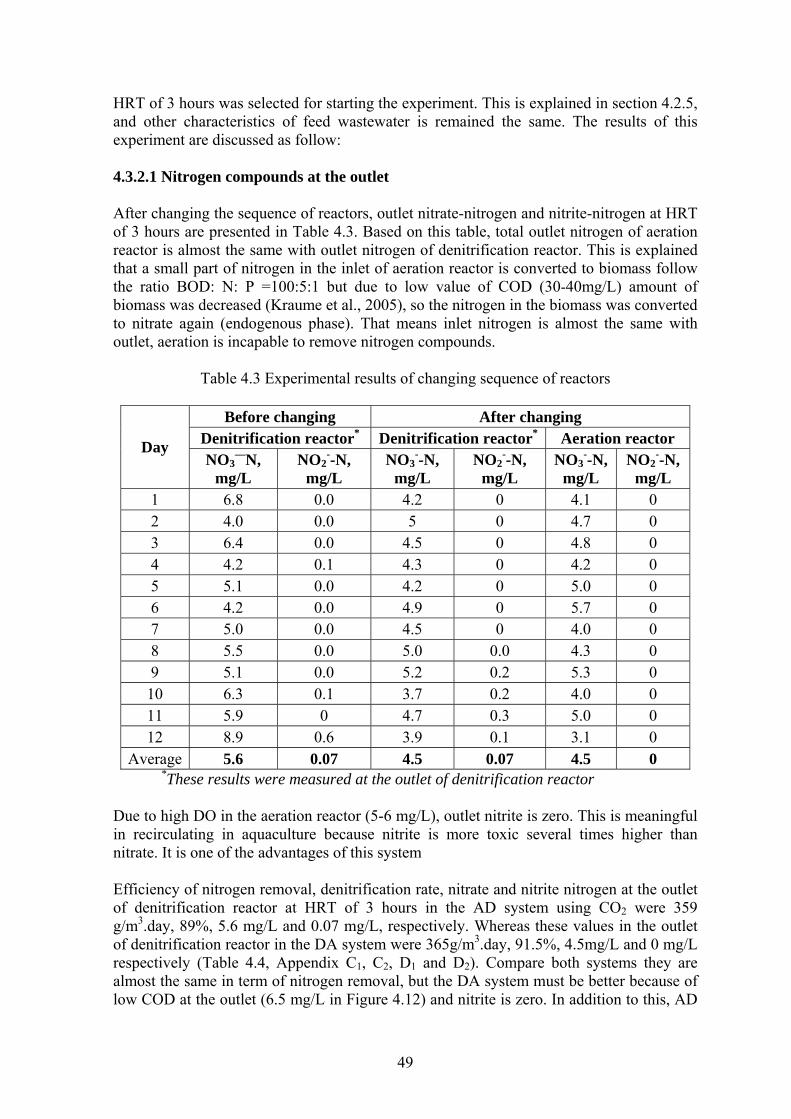
HRT of 3 hours w rting the experiment. in section 4.2.5, and ch te me is expe t ar 4.3.2.1 Nitrogen compounds at the outlet After anging t quence of tors, outle itrate-nitro and nitrite-nitrogen at HRT of 3 hours are presented in Table 4.3. Based on this table, total outlet gen of ation reactor is almost the same with outlet nitrogen of denitrific on reacto is is ex ined that a small part of nitrogen in the inlet of aeration reactor is converted to biomass follow the ratio BOD: N: P =100:5:1 but due to low value of COD (30-4biomass was decreased (Kraum al., 2005) the nitroge n the bio was co erted to nit e again genous p ). That m s inlet nit en is alm the samoutlet, aeration is incapable to r ve nitrogen compounds
Table 4.3 Experim l results anging s nce of re rs
re chang After changin
as selected for sta This is explainedotherrimen
aracteristics of feed was as
water is remained the sa . The results of the discussed follow:
ch he se reac t n gennitro aer
ati r. Th pla
0mg/L) amount of masse et , so n i nv
rat (endo hase ean rog ost e with emo .
enta of ch eque acto
Befo ing g Denitrification reactor* Denitrification reactor* Aeration reactor Day — - - - -NO3 N,
mg/L NO2 -N,
mg/L NO3 -N,
mg/L NO2 -N,
mg/L NO3 -N
mg/L , NO2
mg/L --N,
1 6.8 0.0 4.2 0 4.1 0 2 4.0 0.0 5 0 4.7 0 3 6.4 0.0 4.5 0 4.8 0 4 4.2 0.1 4.3 0 4.2 0 5 5.1 0.0 4.2 0 5.0 0 6 4.2 0.0 4.9 0 5.7 0 7 5.0 0.0 4.5 0 4.0 0 8 5.5 0.0 5.0 0.0 4.3 0 9 5.1 0.0 5.2 0.2 5.3 0 10 6.3 0.1 3.7 0.2 4.0 0 11 5.9 0 4.7 0.3 5.0 0 12 8.9 0.6 3.9 0.1 3.1 0
Average 5.6 0.07 4.5 0.07 4.5 0 *These results were measured at the outlet of denitrification reactor
Due to high DO in the aeration reactor (5-6 mg/L), outlet nitrite is zero. This is meaningful
these values in the outlet f denitrification reactor in the DA system were 365g/m .day, 91.5%, 4.5mg/L and 0 mg/L
respectively (Table 4.4, Appendix C1, C2, D1 and D2). Compare both systems they are almost the same in term of nitrogen removal, but the DA system must be better because of low COD at the outlet (6.5 mg/L in Figure 4.12) and nitrite is zero. In addition to this, AD
in recirculating in aquaculture because nitrite is more toxic several times higher than nitrate. It is one of the advantages of this system Efficiency of nitrogen removal, denitrification rate, nitrate and nitrite nitrogen at the outlet of denitrification reactor at HRT of 3 hours in the AD system using CO2 were 359 g/m3.day, 89%, 5.6 mg/L and 0.07 mg/L, respectively. Whereas
3o
49

is more complicated in operation than DA system such as washed out biomass and DO in aeration reactor must be controlled to avoid disturbing the denitrification reactor. Because of good quality in the treated water with HRT of 3 hours (average NO3-N = 4.5, NO2-N=0), HRT was reduced to 2.5 and 2 hours respectively. The results of three different HRTs are expressed in Figure 4.10 and 4.11. Based on Figure 4.10, the outlet nitrate at three different modes of operation at each HRT was not changed so much they are almost the same. Except at HRT = 2.5 hours, outlet nitrate-nitrogen of denitrification reactor in DA system is significantly lower than using AD way (6.3 mg/L compared with 10 mg/L). This is due to inlet NO3-N to the reactor of DA is 47.5 mg/L whereas this value was 50 mg/L for reactor using CO2 of AD system (Appendix D1 and D2). The lower inlet causes the lower outlet.
20
g/L
0
5
10
Out
let N
O3-
N, 15
HRT=3 HRT=2.5 HRT=2
Hydraulic retention e (HRT), h
m
BufferCO2Sequence
tim
*HRT=2.5 hours was not run for using buffer
Figure 4.10 Nitrate-nitrogen outlets at different HRT and different operation modes
onverted to NO3 in eration reactor. Outlet nitrite in the case of using CO2 is lower than in the case of using
buffer fo on the embrane and makes the easy diffusion of hydrogen into the reactor (This was explained
in section 4.3.1)
CO2
*
Based on Figure 4.11 outlet NO2-N after changing the sequence of reactor is very good. These values are 0, 0.04 and 0.3 mg/L at HRT of 3, 2.5 and 2 hours, respectively. This is due to the remaining of NO2 at the outlet of denitrification reactor was ca
r controlling of pH, this is due to lower alkalinity and CO2 scours m
50

00.5
11.5
HRT=3 HRT=2.5 HRT=2
Out
let N
O
22.5
32
-N, m
g/L
Buffer
Hydraulic retention time (HRT), h
CO2Sequence
Figure 4.11 Nitrite nitrogen outlets at different HRT and different operation modes
y of removal of nitrate in using CO2 are better than sing buffer as a way to control pH this was explained in section 4.3.1.
*
CO2
*HRT=2.5 hours was not run for using buffer case
Denitrification rates and efficiency of removal of the three modes of operation at three different HRTs of 3, 2.5 and 2 hours are summarized in Table 4.4. Based on this Table, Denitrification rate as well as efficiencu
Table 4.4 Summary of the Denitrification rates and efficiency of removal
HRT=3 HRT=2.5 HRT=2
DN reactor Total system DN reactor Total system DN reactor Total system Modes of operation
DN* E** DN E DN E DN E DN E DN E
Buffer 332.5 85.5 347.2 86.0 - - - - 378.0 65.3 397.0 66.4
CO2 343.5 88.3 359.2 88.8 377.6 72.0 403.0 73.0 379.0 66.0 404.7 67.4
Sequence 363.7 91.4 365.0 91.5 383.9 85.8 396.4 88.3 351.8 66.1 406.3 74.4*DN: Denitrification rate, g/m3.day; **E: Efficiency of removal, %; After changing the sequence of reactor results in term of denitrification rate as well as efficiency is better compared with previous one but it is not significant. This is due to the system is more stable with the time and maybe present of heterotrophic microorganism which c
an remove the nitrate.
51

4.3.2.2 COD value at the outlet
ereas it was 20-30 mg/L in the experimental n 1 and 2 with the same HRT (Figure 4.3 and Appendix B1). This is explained that,
remain organic matter after denitrification process was treated by aeration incorporating with membrane bioreactor so the quality of outlet water is very good. Outlet COD was independent with HRT at three modes of operation especially after changing the sequence of reactor. Outlet COD were almost the same at HRT of 3, 2.5 and 2 hours this value is 6-8 mg/L. This is due to low concentration of organic matter and high DO in the aeration reactor (5-6mg/L). Not only the COD but also turbidity and suspended solid (SS) are better than before changing the sequence of reactors. Based on Table 4.5, turbidity and SS are 0.1-0.3 NTU and 0 mg/L whereas these values are 5-12 NTU and 10-40mg/L in AD system (before changing sequence of reactors). This is due to treated water was filtered through hollow fiber membrane and achieved good quality.
After changing the sequence of reactor, COD value was less than 10 mg/L, average value is 6.5 mg/L (Figure 4.12 and Appendix D). Whru
0
5
10
15
20
25
30
HRT=3 HRT=2.5 HRT=2
Hydraulic retention time (HRT), h
CO
D, m
g/L
Using BufferUsing carbon dioxideChange the sequence
*HRT=2.5 hours was not run for using buffer case
Figure 4.12 Comparison of COD values of two experimental set-ups
4.3.3 Water quality after treatment Water quality after treatment with two HRT (3 hours and 2.5 hours) at different modes of operation is summarized in Table 4.5. Water quality at HRT of 2 hours is not good (high NO3-N and NO2-N) so it is not recommended.
*
52

Table 4.5 Water quality at different modes of operation
Outlet before changing sequence Outlet after changing sequence
HRT=3 Parameter Inlet
Buffer CO2HRT=2.5* HRT=3 HRT=2.5
Safety level***
pH 7-8 7.8-8.1 7.4-7.6 7.1-8.3 8-8.3 8-8.3 6.5-8.3
Blancheton, 2000 DO - 0-0.4 0-0.4 0-0.4 4-5 4-5 -
COD, mg/L 45-52 24-30 20-30 20-30 6-8 6-8 <50****
Jewell and Cummings, 1990
NO3-N, mg/L 46-52 5.7 5.6 10 4.5 6.3 <50 Lucas and
Southgate, 2003 NO2-N, mg/L 0 1.1 0.1 0.8 0 0.05 <0.6
Lucas and Southgate, 2003
Turbidity, NTU - 8-12 5-10 5-10 0.1-0.3 0.1-0.3 - SS, mg/L - 10-30 10-40 10-40 0 0 <15-200
Jewell and Cummings, 1990
Alkalinity, mg/L ** 900-950 350-370 350 350-370 360 - CO2, mg/L - 0 5-20 5-20 0 0 <40
Blancheton, 2000 * Using CO2, at this HRT, experiment with buffer was not carried out. ** Inlet alkalinity for buffer way was 750 mg/L as CaCO3, for using CO2 was 200 mg/L as CaCO3 *** These values depend on the species of aqua livings and the recommendation of each authors ****BOD5 value Based on Table 4.5, almost all the parameters in effluent meet the requirement, except NO2-N in using buffer way. Water quality after changing the sequence of reactor at HRT of 3 as well as 2.5 hours is very good compared with other modes of operation. It is lower than safety level several folds and it can be applied in reality to treat the aquaculture wastewater which requires high quality for aqua livings in recycle aquaculture systems. 4.4 Membrane fouling in aeration reactor Membrane resistance, which is the indicator for membrane fouling, was recorded. After one month and half of operation, the TMP was increased from 1.8 kPa to 2.1 kPa (Figure 13 and Appendix D1).
53

1.5
1.7
1.9
2.1
1 6 11 16 21 26 31 36 41
TM
P, k
Pa2.3
2.5
Time, day
is result revealed that membrane has started to be fouled but it was not so much and the v nd half),
all pe biomass oncentration (1000-2000 mg/L) in reactor.
4.5 Cost analysis R o indica trification of aquaculture w ate fiber membrane bioreactor is very good in term of efficiency and denitrification rate. In order to te the app ity of this m into practice, cost analysis was performed by calculation of hydr
e gram ate –nitrogen or treatment of one m3 of wastewater,
ar the Table 4.6 (please refer to Appendix F for more detail c io
ectron donor)
Figure 4.13 Variation of TMP with the time of operation
When HRT of 3 hours or permeate flux of 1.24 L/m2.h, TMP was constant it was 1.8 kPa after 15 days of operation. HRT was reduced to 2.5 and 2 hours or permeate flux was increased to 1.49 and 1.86 L/m2.h, TMP was increased from 1.8 to 1.9 and 2 kPa respectively. In period of each HRT, TMP is constant, TMP increases linearly with permeate flux. From day 29 onwards HRT was increased to 3 hours again TMP remained in 2 kPa for 5 days after that it increased to 2.1 kPa. Th
alue of TMP was still low. This is due to short time operation (one month armeate flux (1.24-1.89 L/m2.h comparing with 250 L/m2.day) and low sm
c
esultsastew
f this study r using hollow
te that hydrogenotrophic deni
evalua licabilogen cost and m
ethodethanol cost as electron
donor forresults alculat
removal of one presented in
of nitr
n).
Table 4.6 Cost of electron donor for treatment of aquaculture wastewater
Autrotrohic (Hydrogen as electron donor)
Heterotrophic (Methanol as elItems
Theory Reality Theory Reality For 1 gram of removed NO3-N 0.44 0.78 0.48 - Cost,
Baht For 1 m3 of wastewater 19.8 34.8 21.5 -
For 1 gram of removed NO3-N 0.357 0.66 1.9 - Electron
donor, gram For 1 m3 of 16.1 29.7 85.7 - wastewater
HRT = 2.5hHRT = 3h HRT = 2h HRT = 3h
54

Based on this table the hydrogen consumed for 1 gram of removed nitrate is higher than an
from cylinder to membrane due to leaking rough tube and loss because of unconsumed hydrogen leased out of water.
heoretical cost for treatment by using hydrogen as electron donor is lower than using
.6 Biomass production
iomass production from denitrification process was calculated to compare with theory
3 N. ccording calculation in this study (refer to Appendix J for more detail) these values were
0.34 and 0.45 g cells/gNO3 for HRT of 3 hours and 2 hours respectively. The actual value is higher than theory but it is not so much but they are lower than the 0.6 to 0.9 g cells/g NO3
-N typically reported for heterotrophic denitrification (Ergas et al., 2001). The higher production of biomass comparing with theory may be development of other type of microorganism in the reactor and addition of biomass from aeration reactor. 4.7 Comparison of results of this study with previous studies This study was carried out with 5 different HRTs from 9 hours to 2 hours; and 3 modes of operation: using CO2 gas; mixture of K2HPO4 and KH2PO4 as agent to control pH; and changing the sequence of reactors. The results of study are presented in Table 4.7. The results of this study with different HRT are almost better than results other studies except results of Ergas and Reuss (2001); and Rezania et al., (2005).
theory about 76% (0.66 gram compared with 0.375 gram). The actual value is higher ththeory is explained that loss of hydrogen th Tmethanol, but the actual cost of hydrogen is higher than cost of methanol which is calculated based on theoretical consumption. But actual consumption of methanol must be higher theory so the cost must be higher too and when methanol consumed is higher than theory requirement, it will produce organic matter in the effluent. It is required to treat this substance and overall cost for system must be higher than theory calculation several time. 4 Bwhich is described in the following reaction. H2 + 0.35 NO3
- + 0.35 H+ + 0.052CO2 → 0.17N2 + 1.1 H2O + 0.010 C5H7NO2 Based on the above equation, the cell yield is approximately 0.24 g cells/g NO -
A
55

Table 4.7 Comparison of current study and previous studies regarding hydrogenotrophic denitrification rates
Reactor type Influent, NO3
--N mg/L HRT Denitrification
rate, gNO3--
N/m3/d
Efficiency % Reference
10 42 min 228.3* 66.6*Hollow fiber membrane 12.5 42 min 370.6* 86.5*
Lee and Rittmann. (2000)
Hollow fiber membrane 48 12 h 96 100 Mo et al. (2005)
Hollow fiber membrane 145 4.1 h 770 100 Ergas and Reuss
(2001)
Hollow fiber membrane 300 22h 800 - Rezania et
al.(2005)
Microporous membrane 40 `- - 92 Mansell and
Schroeder. (2002)
Polyurethane Carrier Reactor 50 353min 200 80-100 Dries et al. (1988)
Trickling filter 20 - 18.5 - Grommen et al. (2006)
Fixed film 80 - 250 - Gros et al. (1988) Fluidized-bed sand reactor 25 4.5 h 130 - Kurt et al. (1987)
Packed bed of granulated activated carbon
21-27 1 h 250 85 Kiss et al. (2001)
9 h** 104 100 6 h** 191 98 4 h** 280 95 3h*** 363.7 91.4
2.5h*** 383.9 85.8 2h*** 380 66
Hollow fiber membrane 50
Current study
* Extrapolated (not provided by authors) **Using buffer to control pH ***Using CO2 and changing the sequence of reactors The results of above mentioned studies were better than this study, because inlet nitrate-nitrogen is higher. This value was 150 and 300 mg/L for study of Ergas and Reuss (2001) and Rezania et al. (2005), respectively, whereas this value for this study was 50 mg/L.
56
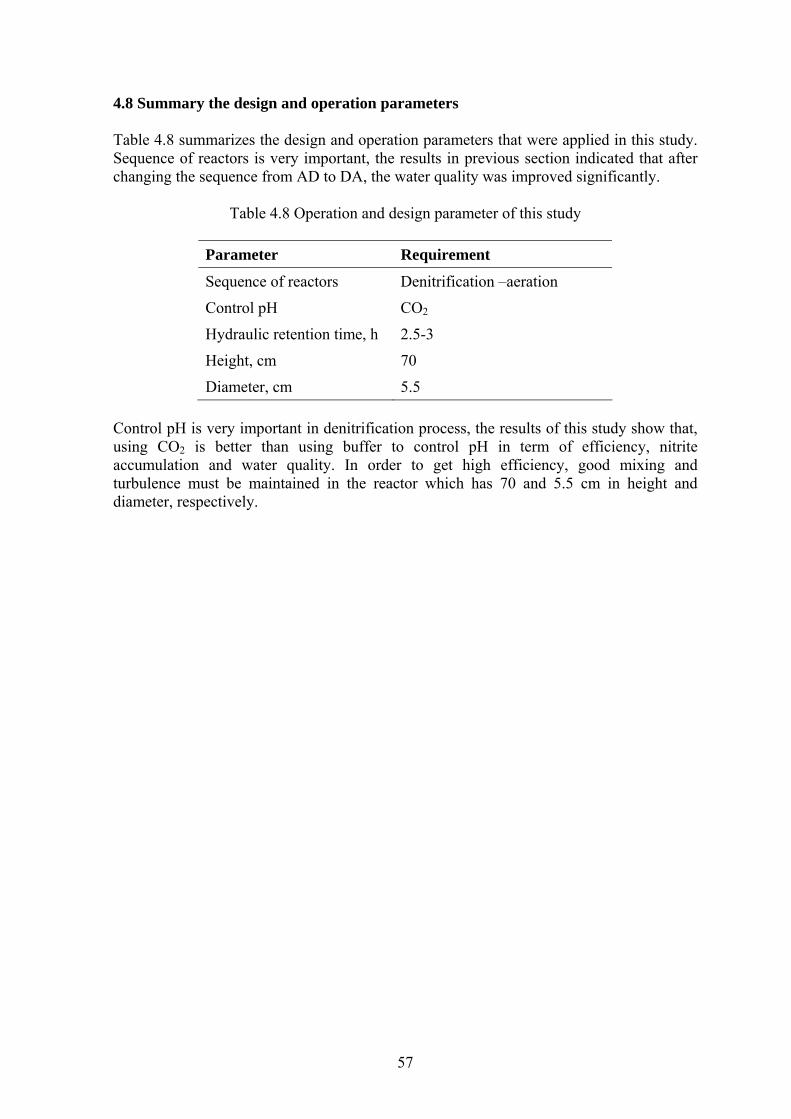
4.8 Summary the design and operation parameters Table 4.8 summarizes the design and operation parameters that were applied in this study. Sequence of reactors is very important, the results in previous section indicated that after changing the sequence from AD to DA, the water quality was improved significantly.
Table 4.8 Operation and design parameter of this study
Parameter Requirement
Sequence of reactors Denitrification –aeration
Control pH CO2
Hydraulic retention time, h 2.5-3
Height, cm 70
Diameter, cm 5.5 Control pH is very important in denitrification process, the results of this study show that, using CO2 is better than using buffer to control pH in term of efficiency, nitrite accumulation and water quality. In order to get high efficiency, good mixing and turbulence must be maintained in the reactor which has 70 and 5.5 cm in height and diameter, respectively.
57

Chapter 5
Conclusions and Recommendation This study investigated the performance of hydrogenotrophic denitrification of aquaculture wastewater using hollow fiber membrane bioreactor. The experiments were performed in a series of three experimental runs. The first run was accomplished to control the pH for denitrification process. When well controlled pH, the experiment was changed to the run 2 in which HRT was reduced from 9 hours to 2 hour. During this process, characteristics of inlet and outlet of the reactors were investigated to evaluate the efficiency of treatment and denitrification rate. At the end of run 2, the optimum denitrification rate was chosen for run 3 in which buffer solution was replaced by CO2
gas for controlling pH ; sequence of reactors was also changed and function of membrane in aeration was used for suction instead of diffuser. Efficiency of treatment, denitrification rate and other parameters such as turbidity, COD were measured at effluent to compare. The conclusions drawn from these results are presented below: 5.1 Conclusion
1. In activated sludge there is less hydrogenotrophic denitrification microorganism. In order to get enough quantity as well as quality, activated sludge must be acclimatized in hydrogen condition at least 1 month
2. In denitrification process, alkalinity was produced leading to pH increase from 8 to 10 within four days of operation if there is no measure to control it. Normally buffer solution (mixture of HPO4
2- and H2PO4-) is used to control pH. It was
maintained around 8, amount of KH2PO4 and K2HPO4 consumed for maintain this pH value is 21g and 27 g per 1 g of NO3
--N feed respectively.
3. In denitrification process, organic matter is not only removed but also added, this is due to soluble microbial products (SMP). For inlet nitrate nitrogen 50 mg/L, outlet is less than 10 mg/L, amount of SMP added to the effluent is 10-15 mg/L expressed as COD.
4. pH >9 and limited hydrogen supply is the main factor cause the high nitrite in the outlet and reduction of removal efficiency of nitrate. The optimum pH for denitrification is around 8.
5. When using buffer to control pH, efficiency of nitrogen removal and denitrification rate in denitrification reactor could reach 100, 98, 95, 91, 86 and 65%; and 100, 191, 280, 332 and 378 g/m3.day at HRT of 9 hours, 6 hours, 4 hours, 3 hours, 2.5 hours and 2 hours, respectively.
6. Average efficiency of nitrogen removal and denitrification rate of denitrification reactor when using CO2 to control pH were 88.3, 72 and 66%; and 343, 378 and 379 g/m3.day at HRT of 3, 2.5 and 2 hours respectively.
7. Using CO2 to control pH is better than using mixture of buffer in term of P pollution in environment as well as efficiency of removal. If mixture of buffer (H2PO4
- and HPO42-) was used, the addition of phosphorous and alkalinity into
effluent increases, nitrate nitrogen was removed but phosphorous was added. Using CO2 reduces the accumulation of nitrite and alkalinity at the effluent.
58

8. It is better to change the sequence of reactor from aeration –denitrification (AD) to denitrification – aeration (DA). COD effluent as well as nitrite nitrogen is lower than the original one. It is also easier in operation, in AD system DO in aeration reactor should be controlled properly in the range of 2 mg/L to avoid disturbing the denitrification reactor but in DA system it is not necessary to do that.
9. Water quality in term of COD, SS, CO2, DO, Nitrate-nitrogen, nitrite- nitrogen, Turbidity is very good in DA system at HRT of 3 hour and 2.5 hour. All these values are lower than safety level several times. Treated water can be recycled back to the system for zero discharge or it can be used for other purposes.
10. Real hydrogen consumption is higher than theory consumption is 76% this is due to loss of hydrogen from cylinder to the reactor through connection of tube. Cost of hydrogen as electron donor for removal of 1 gram of nitrate-nitrogen and 1 m3 of wastewater is 0.78 and 34.4 Baht respectively.
11. Biomass production was calculated base on one gram of removed nitrate-nitrogen. It is 0.34-0.45 g/g NO3-N, this value is higher than theory calculation (0.24g/gNO3-N). However, this value is still lower than heterotrophic denitrification (0.6-0.9 g/gNO3-N).
12. Due to low biomass concentration, organic matter, short operation time and low permeate flux, membrane was not fouled in aeration reactor. TMP increased linearly with permeate flux. However it may be fouled if long operation time.
5.2 Recommendation for future study
1. Cost analysis in this study is only draft calculation, in order to get accurate result, hydrogen flow meter is required to measure the flow rate into the reactor.
2. In this study dissolved hydrogen in water was not measured, in future study this parameter must be determine to find relationship between dissolved hydrogen and efficiency of nitrogen removal and find the efficiency of hydrogen consumption.
3. In aquaculture, phosphorous is important parameter, in future study should be concerned on removal not only nitrogen species and organic matter but also phosphorous removal.
4. In aquaculture activities depend on the species of aqua livings they can accept the different kinds of water quality, attempt to treat the different concentration of nitrate nitrogen and organic matter should be studied in future.
5. Efficiency after changing the sequence of reactors was a little bit better than the original one. This may be present of heterotrophic in denitrification reactor. In next study, organism in denitrification reactor in DA system should be investigated.
6. Mixing well in the reactor is necessary for good diffusion of hydrogen from membrane, in this study reactor is a little small so it took time for operator. In next future study, reactor should be designed larger in diameter and shorter in length so the volume will be the same with the old one.
7. This study only focused on fresh aquaculture wastewater, in future study, salinity aquaculture wastewater should be investigated.
59
References
Ahmed, T. and Semmens, M. J. (1992). Use of sealed end hollow fibers for bubbles membrane aeration: experimental studies. Journal of Membrane Science, 69, 1-10. Ahmed, T. and Semmens, M. J. (1996). The use of transverse hollow fibers for bubbles membrane aeration. Water Research, 30(2), 440-446. Ahmed, T., Semmens, M. J. and Voss, M. A. (2004). Oxygen transfer characteristics of hollow-fiber. Advances in Environmental Research, 8, 637-646. Annachhatre, A. (2005). Advanced wastewater treatment. (Lecture notes, Course No ED 78.17, School of Environment Resource and Development). Bangkok. Asian Institute of Technology APHA, AWWA, WPCF. (1998). Standard Methods for the examination of Water and Wastewater, 20th Edition, Washington DC, USA. Arbiv, R. and van Rijn, J. (1995). Performance of a treatment system for inorganic nitrogen removal in intensive aquaculture systems. Aquaculture Engineering, 14, 189-203. Barak, Y. and van Rijn, J. (2000a). Atypical polyphosphate accumulation by the denitrifying acterium Paracoccus denitrificans. Applied Environment Microbiology, 66, 1209–1212. Barak, Y. and van Rijn, J. (2000b). Biological phosphate removal in a prototype recirculating aquaculture treatment system. Aquaculture Engineering, 22, 121–136. Barak, Y., Cytryn, E., Gelfand, I., Krom, M. and van Rijn, J. (2003). Phosphate removal in a marine prototype recirculating aquaculture system. Aquaculture, 220, 313–326. Barker, P.S. and Dold, P.L. (1996). Denitrification behaviour in biological excess phosphorus removal activated sludge systems. Water Research, 30, 769–780. Beckman, W. J., Avendt, R. J., Mulligan, T. J. and Kehrberger, G. J. (1972). Combined carbon oxidation-nitrification. Journal WPCF, 44(10), 1916-1931. Blancheton, J.P. (2000). Developments in recirculation systems for Mediterranean fish species. Aquaculture Engineering, 22, 17-31. Boley, A., Muller, W.R. and Haider, G. (2000). Biodegradable polymers as solid substrate and biofilm carrier for denitrification in recirculated aquaculture systems. Aquaculture Engineering, 22, 75–85. Bovendeur, J., Eding, E. H. and Henken, A. M. (1987). Design and performance of a water recirculation system for high density culture of the African catfish, Clarias gariepinus (Burchell 1822). Aquaculture, 63, 329-353.
60

Boyley, A., Muller, W. R. and Haider. (2000). Biodegradable polymers as solid substrate and biofilm carrier for denitrification in circulated aquaculture systems. Aquaculture Engineering, 22, 75-85. Chang, C.C., Tseng, S. K. and Huang, H. K. (1999). Hydrogenotrophic denitrification with immobilized Alcaligenes eutrophus for drinking water treatment. Bioresource Technology, 69, 53-58. Choo, K.H. and Lee, C.H. (1996). Effect of anaerobic digestion broth composition on membrane permeability. Water Science and Technology, 34(9), 173–179. Cowman, J. Total Nitrogen Removal in a completely mixed membrane biofilm reactor for nitrification and denitrification. Retrieved 7 July 2005, from the Water Environment Federation Website: http://www.weftec.org/pdffiles/CSWEA-Jennifer_Cowman.pdf Dahab, M. (1987-1988). Treatment alternatives for nitrate contaminated ground water supplies. J. Environmental Systems, 17(1), 65-75. Dierberg, F. E. and Kiattisimkul, W. (1996). Issues, Impact, and Implications of Shrimp Aquaculture in Thailand. Environmental Management, 20(5), 649-666. Dries, D., Liessens, J., Verstraete, W., Stevens, P., de Vost, P. and de Ley, J. (1988). Nitrate removal from drinking water by means of hydrogenotrophic denitrifiers in a polyurethane carrier reactor. Water Supply, 6, 181-192. Ergas, S. J. and Reuss, A. F. (2001). Hydrogenotrophic denitrification of drinking water using a hollow fiber membrane bioreactor. J. Water Supply Research and Technology-AQUA, 50(3), 161-17. Gelfand, I., Barak, Y., Even-Chen, Z., Cytryn, E., Krom, M., Neori, A. and van Rijn, J. (2003). A novel zero-discharge intensive seawater recirculating system for culture of marine fish. J. World Aquaculture. Soc. 34, 344–358. Grguric, G., Sondey, C.J. and DuVall, B.M. (2000b). Carbon and nitrogen fluxes in a closed seawater facility. Science Total Environment, 247, 57– 69. Grguric, G., Wetmore, S.S. and Fournier, R.W. (2000a). Biological denitrification in a closed seawater system. Chemosphere, 40, 549–555. Grommen, R., Verhaege, M. and Verstraete, W. (2006). Removal of nitrate in aquaria by means of electrochemically generated hydrogen gas as electron donor for biological denitrification. Aquaculture Engineering, 34(1), 33-39 Gros, H., Schnoort, G. and Ruttent, P. (1988). Biological Denitrification process with hydrogen-oxidizing bacteria for drinking water treatment. Water Supply, 6, 193-198. Henze., Harremoes. and Arvin, L. C. J. (2002). Wastewater Treatment. Third Edition. Berlin. Springer. ISBN: 3-540-42228-5
61

Ho, C. M., Tseng, S. K. and Chang, Y. J. (2001). Autotrophic denitrification via a novel membrane-attached biofilm reactor. Letters in Applied Microbiology, 33, 2001-2005. Jewell, W. J. and Cummings, R.J. (1990). Expanded bed treatment of complete recycle aquaculture systems. Water Science and Technology, 22 (1-2), 443-450 Kiss, I., Szekeres, S., Bejerano, T.T. and Soares, M.I.M. (2000). Hydrogen-dependent denitrification: preliminary assessment of two bio-electrochemical systems. Water Science Technology, 42, 373–379 Knosche, R. (1994). An effective biofilter type for eel culture in recirculating systems. Aquaculture Engineering, 13, 71-82 Koenig, A. and Liu, L.H. (1996). Autotrophic denitrification of landfill leachate using elemental sulfur. Water Science and Technology, 34(5-6), 469-476. Koenig, K. and Liu, L. H. (2001). Kinetic model of autotrophic denitrification in sulphur packed-bed reactors. Water Research, 35(8), 1969-1978. Korom, S.F. (1992). Natural denitrification in the saturated zone: a review. Water Resource Research, 28(6), 1657–1668. Kurt, M., Dunn, I.J. and Bourne, J.R. (1987). Biological denitrification of drinking water using autotrophic organisms with H2 in a fluidized-bed biofilm reactor. Biotechnology Bioengineering, 29, 493–501. Lee, K. C. and Rittmann, B. E. (2000). A novel hollow-fiber membrane biofilm reactor for autohydrogenotrophic denitrification of drinking water. Water Science and Technology, 41(4-5), 219-226. Lee, K. C. and Rittmann, B. E. (2002). Applying a novel autohydrogenotrophic hollow-fiber membrane biofilm reactor for denitrification of drinking water. Water Research, 36(8), 2040-2052. Lee, K. C. and Rittmann, B. E. (2003). Effect of pH and precipitation on autohydrogenotrophic denitrification using the hollow-fiber membrane-biofilm reactor. Water Research, 37(7), 1551-1556. Lin, C. K., Ruamthaveesub, P. and Wanuchsoontorn. (1993). Intergrated culture of green mussel (Perraviridis) in wastewater from an intensive shrimp pond: Concept and Practice. World Aquaculture, 24(2), 68-73 Lin, Y. F., Jing, S. R. and Lee, D. Y. (2003). The potential use of constructed wetlands in a recirculating aquaculture system for shrimp culture. Environmental Pollution, 123, 107–113. Lin, Y. F., Jing, S. R., Lee, D. Y. and Wang, T. W. (2002). Removal of solids and oxygen demand from aquaculture wastewater with constructed wetland system in the start – up phase. Water Environmental Research, 74(2), 136-141.
62
Lin, Y. F., Jing, S. R., Lee, D. Y., Chang, Y. F., Chen, Y., M. and Shih, K. C. (2005). Performance of a constructed wetland treating intensive shrimp aquaculture wastewater under high hydraulic loading rate. Environmental Pollution, 134, 411–421. Lucas, J. S. and Southgate, P.C. (2003). Aquaculture Farming Aquatic Animals and Plants. Fishing News Books, Oxford, UK, ISBN: 0-85238-222-7 Mansell, B. O. and Schroeder, E. D. (2002). Hydrogenotrophic denitrification in a microporous membrane bioreactor. Water Research, 36(19), 4683-4690 Menasveta, P., Panritdam, T., Sihanonth, P., Powtongsook, S., Chuntapa, B. and Lee, P. (2001). Design and function of a closed, recirculating seawater system with denitrification for the culture of black tiger shrimp broodstock. Aquaculture Engineering, 25, 35–39. Menasveta, P., Panritdam, T., Sihanoth, P., Powtongsook, S., Chuntapa, B. and Lee, P (2001). Design and function of a closed, recirculating seawater system with denitrification for the culture of black tiger shrimp broodstock. Aquacultural Engineering, 25, 35-49. Metcalf and Eddy (2003). Wastewater Engineering: Treatment and Reuse. Fourth edition. McGraw-Hills. ISBN: 0-07-041878-0 Mino, T., van Loosdrecht, M.C.M. and Heijnen, J.J. (1998). Microbiology and biochemistry of the enhanced biological phosphate removal processes. Water Research, 32 (11), 3193–3207. Mo H., Oleszkiewicz J. A., Cicek N., Rezania B. (2005). Incorporating Membrane Gas Diffusion into a Membrane Bioreactor for Hydrogenotrophic Denitrification of Groundwater. Water Science & Technology, 51(6-7), 357-364. Narcis, N., Rebhun, M. and Scheindorf, C. (1979). Denitrification at various carbon to nitrogen ratios. Water Research, 13, 93–98 Noll, K, E. (1999). Fundamentals of air quality systems: Design of air pollution control devices. An American Academy of Environmental Engineers Publication. ISBN: 1-883767-25-3 Otte, G. and Rosenthal, H. (1979). Management of a closed brackish water system for high density fish culture by biological and chemical water treatment. Aquaculture, 18, 169-181. Paez-Osuna, F. (2001). The Environmental Impact of Shrimp Aquaculture: Causes, Effects, and Mitigating Alternatives. Environmental Management, 28(1), 131-140 Pankhania, M., Stephenson, T. and Semmens, M.J. (1994). Hollow fiber bioreactor for wastewater treatment using bubbles membrane aeration. Water Research, 28(10), 2233-2236.
63

Park, E.J., Seo, J.K., Kim, M.R., Jung, I.H., Kim, J.Y. and Kim, S.K. (2001). Salinity acclimation of immobilized freshwater denitrifiers. Aquaculture Engineering, 24, 169–180. Pillay, T. V. R. (1991). Aquaculture and the environment. Fishing New Books. Oxford. ISBN0-85238-183-2 Ramseyer, L. J. and Garling, D. L. Fish nutrition and aquaculture waste management. Retrieved 5 July 2005, from the Aquaculture Network Information Center Website: http://aquanic.org/publicat/state/il-in/ces/garling.pdf Reisng, A.R., Schroeder, E.D. and Member. (1996). Denitrification incorporating microporous membranes. J. Environmental Engineering, 122(7), 599-604. Rezania, B., Cicek, N. and Oleszkiewicz. (2005). Kinetics of hydrogen-dependent denitrification under varying pH and temperature conditions. Biotechnology Bioengineering, 92(7), 900-906. Rezina, B., Oleszkiewicz, J. A., Cicex, N. and Mo, H. (2005). Hydrogen-dependent denitrification in an alternating anoxic-aerobic SBR membrane reactor. Water Science & Technology, 51(6-7), 403-409. Rittmann, B.E. and McCarty, P.L. (2001). Environmental Biotechnology: Principles and Applications. McGraw-Hills Book Co., New York. ISBN: 0-07-234553-5 Rutten, R. and Schnoor, G. (1992). Five years experience of nitrate removal from drinking water. Water Supply, 10(3), 183-190. Samarakoon, S.M.S.M.K. (2005). Development of an aerobic membrane bioreactor for small scale domestic wastewater treatment in tropical regions. AIT Thesis no.EV-05-27, Asian Institute of Technology, Bangkok, Thailand. Satapornvanit, K. (1993). The environmental impact of shrimp farm effluent. Master Thesis no No. AE-93-30, Asian Institute of Technology, Bangkok, Thailand. Sauthier, N., Grasmick, A. and Blancheton, J.P. (1998). Biological denitrification applied to a marine closed aquaculture system. Water Research, 32, 1932–1938. Sauthier, N., Grasmick, A. and Blancheton, J.P. (1998). Biological denitrification applied to a marine closed aquaculture system. Water Research, 32, 1932–1938. Sawyer, C. N., McCarty, P. L. and Parkin, G. F. (2003). Chemistry for Environmental Engineering and Science. Fifth Edition. McGraw-Hill, New York, USA. ISBN: 0-07-123045-9 Senarath, C. and Visvanathan, C (2001). Environmental issues in brackish water shrimp aquaculture in Srilanka. Environmental management, 27(3), 335-348.
64
Shnel, N., Barak, Y., Ezer, T., Dafni, Z. and van Rijn, J. (2002). Design and performance of a zero-discharge tilapia recirculating system. Aquaculture Engineering, 26, 191–203. Shnel, N., Barak, Y., Ezer., Dafni, Z. and van Rijn, J. (2002). Design andperform of zero discharge tilapia recirculating system. Aquacultural Engineering, 26, 191-203. Skinde, J.R. and Bhagat, S.K. (1982). Industrial wastes as carbon sources in biological denitrification. Journal of Water Pollution Control Federation, 54, 370–377 Smith, R. L., Ceazan, M. L. and Brooks, M.H. (1994). Autotrophic, Hydrogen-Oxidizing, denitrifying bacteria in ground water, potential Agents for bioremediation of Nitrate contamination. Applied and Environmental Microbiology, 60(6), 1949-1955. Soares, M.I.M. (2000). Biological denitrification of ground water. Water, Air, and Soil pollution, 123, 183-193. Suzuki, Y., Hatano, N., Ito, S. and Ikeda, H. (2000). Performance of nitrogen removal and biofilm structure of porous gas permeable membrane reactor. Water Science and Technology, 41(4-5), 211-217. Suzuki, Y., Maruyama, T., Numata, H., Sato, H. and Asakawa, M. (2003). Performance of a closed recirculating system with foam separation, nitrification and denitrification units for intensive culture of eel: toward zero emission. Aquacultural Engineering, 29, 165-182. Tal, Y., Nussinovitch, A. and van Rijn, J. (2003a). Nitrate removal in aquariums by immobilized denitrifiers. Biotechnology Progress, 19, 1019–1021. Tam, N.F.T., Wong, Y.S., Leung, G. (1992). Effect of exogenous carbon sources on removal of inorganic nutrient by the nitrification-denitrification process. Water Research, 26, 1229–1236. Thakur, D. P. and Lin., C. K. (2003). Water quality and nutrient budget in closed shrimp (Penaeus monodon) culture systems. Aquacultural Engineering, 27, 159-176 van Rijn, J. and Rivera, G. (1990). Aerobic and an aerobic biolofiltration in an aquaculture unit nitrite accumulation as a result of nitrification and denitrification. Aquaculture Engineering, 9, 217-234. van Rijn. J., Tal.Y. and Schreie, H.J. (2006). Denitrification in recirculating systems: Theory and applications. Aquacultural Engineering, 34 ( 3), 364-376 Walter, B., Haase, C. and Rabiger, N. (2005). Combined nitrification/denitrification in a membrane reactor. Water research, 39, 2781–2788 Yomjinda, M. (1993). Effect of bottom muds on nutrient cycling and water quality in catfish-tilapia integrated culture. Master Thesis No. AE-93-35, Asian Institute of Technology, Bangkok, Thailand.
65

Appendices
66

Appendix A
Results of sludge acclimatization
67
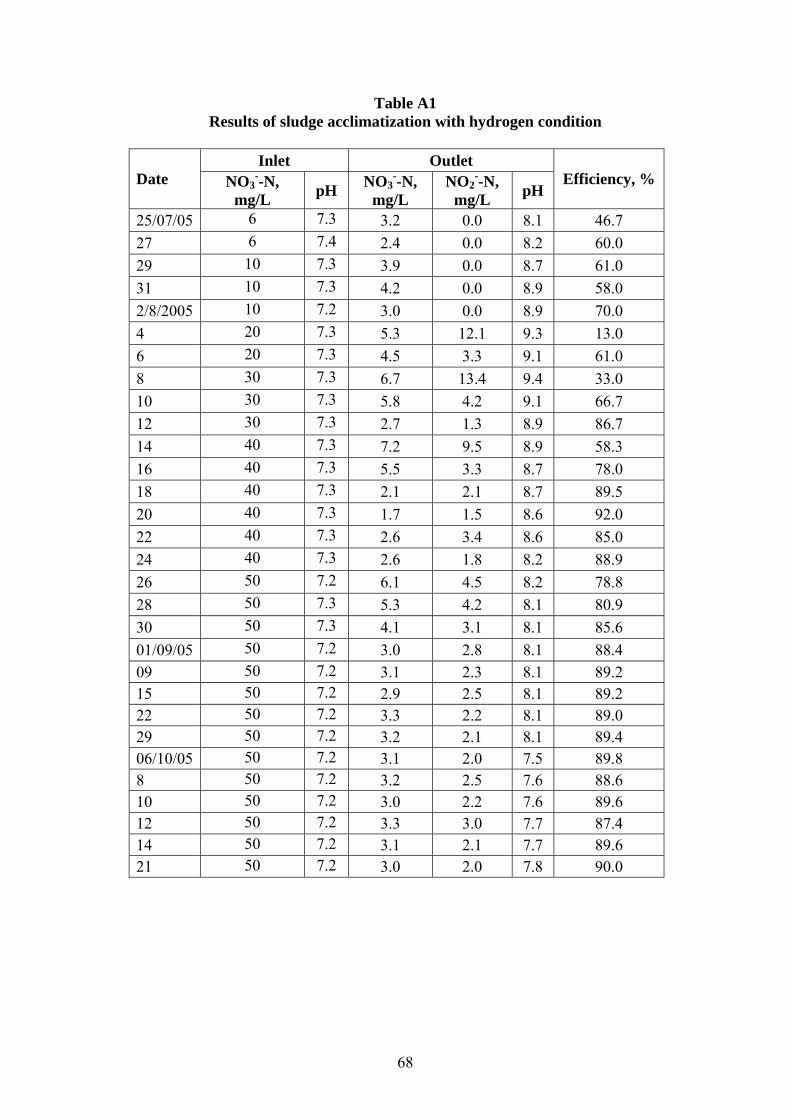
Table A1 Results of sludge acclimatization with hydrogen condition
Inlet Outlet
Date NO3--N,
mg/L pH NO3--N,
mg/L NO2
--N, mg/L pH
Efficiency, %
25/07/05 6 7.3 3.2 0.0 8.1 46.7 27 6 7.4 2.4 0.0 8.2 60.0 29 10 7.3 3.9 0.0 8.7 61.0 31 10 7.3 4.2 0.0 8.9 58.0 2/8/2005 10 7.2 3.0 0.0 8.9 70.0 4 20 7.3 5.3 12.1 9.3 13.0 6 20 7.3 4.5 3.3 9.1 61.0 8 30 7.3 6.7 13.4 9.4 33.0 10 30 7.3 5.8 4.2 9.1 66.7 12 30 7.3 2.7 1.3 8.9 86.7 14 40 7.3 7.2 9.5 8.9 58.3 16 40 7.3 5.5 3.3 8.7 78.0 18 40 7.3 2.1 2.1 8.7 89.5 20 40 7.3 1.7 1.5 8.6 92.0 22 40 7.3 2.6 3.4 8.6 85.0 24 40 7.3 2.6 1.8 8.2 88.9 26 50 7.2 6.1 4.5 8.2 78.8 28 50 7.3 5.3 4.2 8.1 80.9 30 50 7.3 4.1 3.1 8.1 85.6 01/09/05 50 7.2 3.0 2.8 8.1 88.4 09 50 7.2 3.1 2.3 8.1 89.2 15 50 7.2 2.9 2.5 8.1 89.2 22 50 7.2 3.3 2.2 8.1 89.0 29 50 7.2 3.2 2.1 8.1 89.4 06/10/05 50 7.2 3.1 2.0 7.5 89.8 8 50 7.2 3.2 2.5 7.6 88.6 10 50 7.2 3.0 2.2 7.6 89.6 12 50 7.2 3.3 3.0 7.7 87.4 14 50 7.2 3.1 2.1 7.7 89.6 21 50 7.2 3.0 2.0 7.8 90.0
68

Figure A1. Sludge acclimatization with hydrogen condition
Figure A2. Sludge acclimatization with aeration condition
69

Appendix B
Analysis results of experiment of run 1 and 2
70
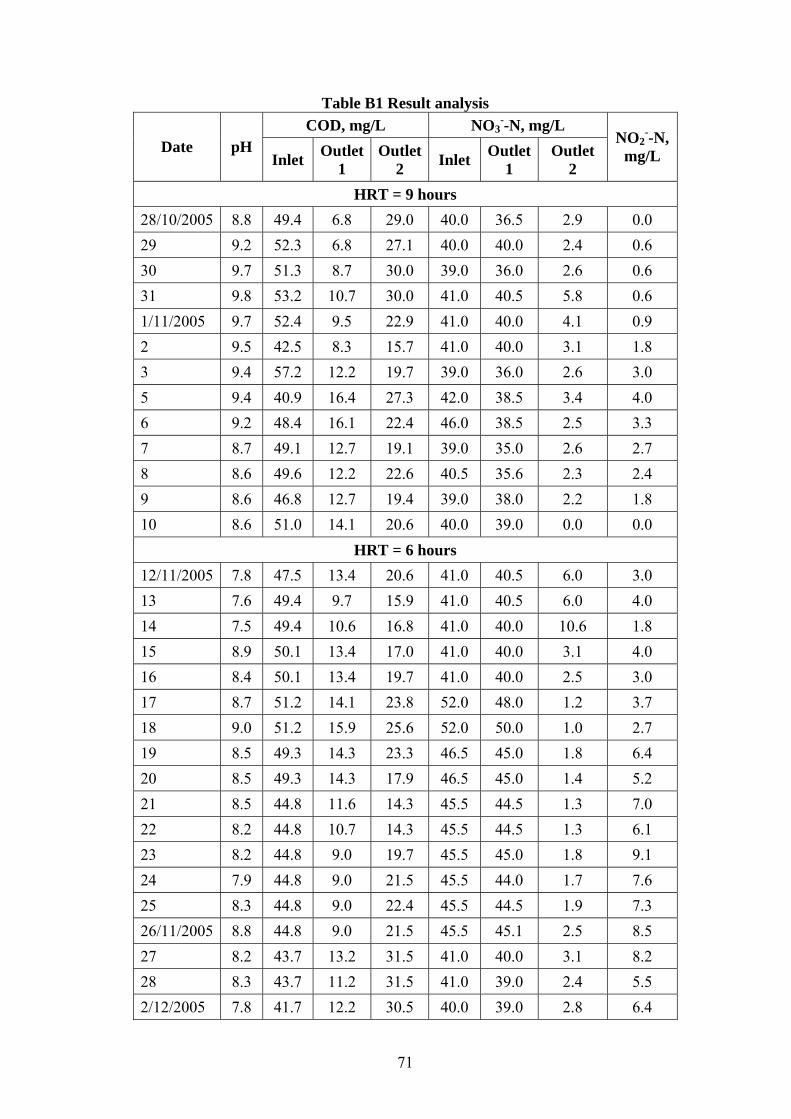
Table B1 Result analysis COD, mg/L NO3
--N, mg/L Date pH
Inlet Outlet 1
Outlet 2 Inlet Outlet
1 Outlet
2
NO2--N,
mg/L
HRT = 9 hours 28/10/2005 8.8 49.4 6.8 29.0 40.0 36.5 2.9 0.0 29 9.2 52.3 6.8 27.1 40.0 40.0 2.4 0.6 30 9.7 51.3 8.7 30.0 39.0 36.0 2.6 0.6 31 9.8 53.2 10.7 30.0 41.0 40.5 5.8 0.6 1/11/2005 9.7 52.4 9.5 22.9 41.0 40.0 4.1 0.9 2 9.5 42.5 8.3 15.7 41.0 40.0 3.1 1.8 3 9.4 57.2 12.2 19.7 39.0 36.0 2.6 3.0 5 9.4 40.9 16.4 27.3 42.0 38.5 3.4 4.0 6 9.2 48.4 16.1 22.4 46.0 38.5 2.5 3.3 7 8.7 49.1 12.7 19.1 39.0 35.0 2.6 2.7 8 8.6 49.6 12.2 22.6 40.5 35.6 2.3 2.4 9 8.6 46.8 12.7 19.4 39.0 38.0 2.2 1.8 10 8.6 51.0 14.1 20.6 40.0 39.0 0.0 0.0
HRT = 6 hours 12/11/2005 7.8 47.5 13.4 20.6 41.0 40.5 6.0 3.0 13 7.6 49.4 9.7 15.9 41.0 40.5 6.0 4.0 14 7.5 49.4 10.6 16.8 41.0 40.0 10.6 1.8 15 8.9 50.1 13.4 17.0 41.0 40.0 3.1 4.0 16 8.4 50.1 13.4 19.7 41.0 40.0 2.5 3.0 17 8.7 51.2 14.1 23.8 52.0 48.0 1.2 3.7 18 9.0 51.2 15.9 25.6 52.0 50.0 1.0 2.7 19 8.5 49.3 14.3 23.3 46.5 45.0 1.8 6.4 20 8.5 49.3 14.3 17.9 46.5 45.0 1.4 5.2 21 8.5 44.8 11.6 14.3 45.5 44.5 1.3 7.0 22 8.2 44.8 10.7 14.3 45.5 44.5 1.3 6.1 23 8.2 44.8 9.0 19.7 45.5 45.0 1.8 9.1 24 7.9 44.8 9.0 21.5 45.5 44.0 1.7 7.6 25 8.3 44.8 9.0 22.4 45.5 44.5 1.9 7.3 26/11/2005 8.8 44.8 9.0 21.5 45.5 45.1 2.5 8.5 27 8.2 43.7 13.2 31.5 41.0 40.0 3.1 8.2 28 8.3 43.7 11.2 31.5 41.0 39.0 2.4 5.5 2/12/2005 7.8 41.7 12.2 30.5 40.0 39.0 2.8 6.4
71

COD, mg/L NO3--N, mg/L
Date pH Inlet Outlet
1 Outlet
2 Inlet Outlet 1
Outlet 2
NO2--N,
mg/L
3/12/2005 8.0 42.7 12.2 30.5 40.0 39.0 2.4 7.3 4 8.0 45.8 11.2 31.5 41.0 39.0 2.2 6.7 5 8.0 46.8 10.2 29.5 45.0 43.0 2.1 6.1 6 8.5 48.0 11.0 32.0 50.5 48.0 2.0 6.7 7 8.5 49.0 11.0 34.0 50.5 48.0 1.0 6.7 8 8.4 46.0 10.0 28.0 50.5 48.5 0.9 6.1 9 8.3 48.0 11.0 31.0 50.0 48.0 0.6 4.6 10 8.1 46.0 10.0 29.0 50.0 48.0 0.7 0.6 11 8.1 49.0 11.0 35.0 50.0 48.5 0.5 0.3
HRT = 4 hours 12/12/2005 8.1 48.0 10.0 34.0 55.0 54.0 4.8 5.5 14 8.2 42.0 12.0 35.0 55.5 53.5 4.6 4.9 16 8.1 47.0 10.0 29.0 55.0 52.0 3.6 4.3 18 8.1 48.0 12.0 34.0 51.8 49.0 2.3 2.1 20 8.2 47.2 11.8 31.5 54.0 50.0 2.6 1.8 22 8.1 45.2 10.8 25.6 52.5 48.0 3.4 1.8 24 8.2 45.2 9.8 24.6 55.0 51.5 4.4 2.1 25 8.2 51.2 11.8 31.5 55.0 50.0 2.5 2.7 26 8.2 51.2 11.8 31.5 55.5 50.0 2.1 3.0 27 8.0 51.2 9.8 22.6 55.5 50.0 3.0 1.8 28 8.0 51.2 12.0 28.0 55.5 50.0 2.0 1.5 29 8.0 51.2 12.0 23.0 55.5 49.0 5.0 0.3 30 8.2 47.0 10.0 22.0 51.0 48.0 1.4 1.2 31 8.1 46.0 11.0 24.0 51.0 49.0 1.7 0.6
HRT = 3 hours 2/01/2006 7.8 42.7 16.3 32.7 49.0 48 9.3 1.5 3 7.8 44.0 15.0 30.0 50.0 48 7.9 0.0 4 7.8 45.0 16.0 28.0 50.0 49 5.7 0.9 5 8.01 45.0 14.0 24.0 52.0 49.5 4.3 0.9 6 7.93 45.0 15.0 25.0 52.0 49 5 2.1 7 8.17 44.0 14.0 24.0 52.0 50 3.9 1.5 8 7.88 44.0 18.0 28.0 50.0 48 5 1.2 9 8.07 44.0 16.0 24.0 48.0 47 4.5 0.6
72
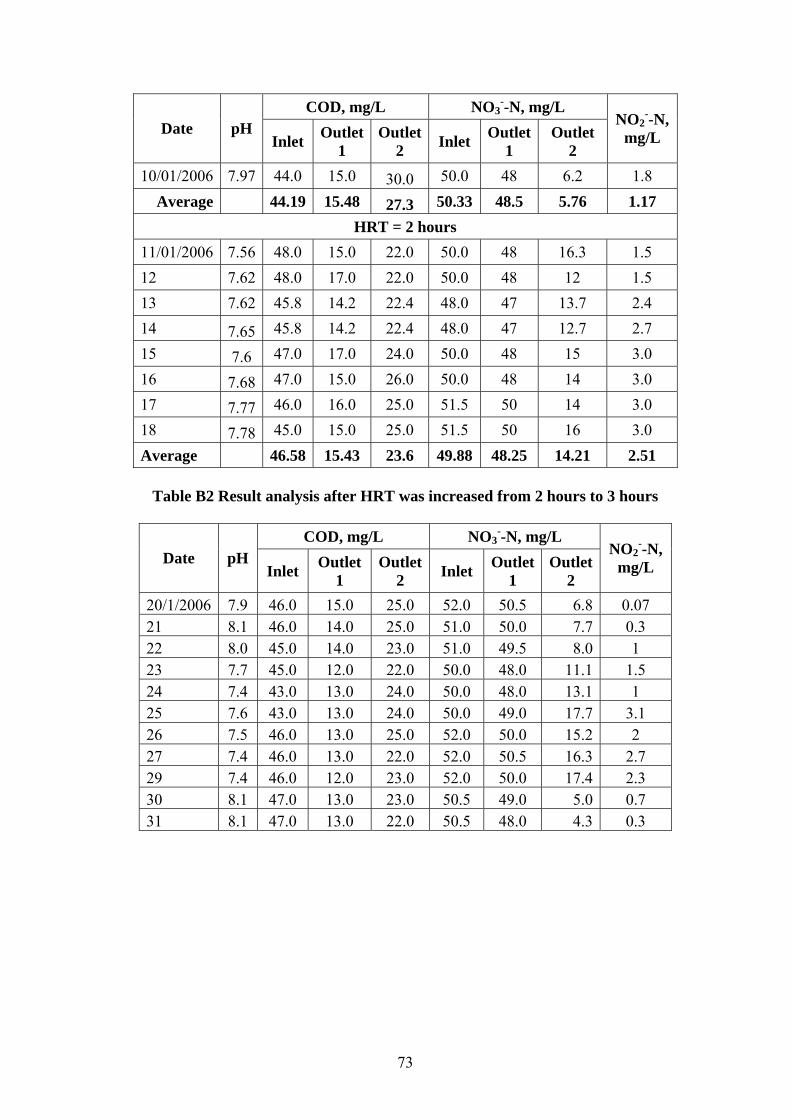
NO3--N, mg/L COD, mg/L
NO2--N,
mg/L Date pH Outlet 1
Outlet 2
Outlet 1
Outlet 2 Inlet Inlet
10/01/2006 7.97 44.0 15.0 30.0 50.0 48 6.2 1.8 Average 44.19 15.48 27.3 50.33 48.5 5.76 1.17
HRT = 2 hours 11/01/2006 7.56 48.0 15.0 22.0 50.0 48 16.3 1.5 12 7.62 48.0 17.0 22.0 50.0 48 12 1.5 13 7.62 45.8 14.2 22.4 48.0 47 13.7 2.4 14 7.65 45.8 14.2 22.4 48.0 47 12.7 2.7 15 7.6 47.0 17.0 24.0 50.0 48 15 3.0 16 7.68 47.0 15.0 26.0 50.0 48 14 3.0 17 7.77 46.0 16.0 25.0 51.5 50 14 3.0 18 7.78 45.0 15.0 25.0 51.5 50 16 3.0 Average 46.58 15.43 23.6 49.88 48.25 14.21 2.51
Table B2 Result analysis after HRT was increased from 2 hours to 3 hours
COD, mg/L NO3
--N, mg/L Date pH
Inlet Outlet 1
Outlet 2 Inlet Outlet
1 Outlet
2
NO2--N,
mg/L
20/1/2006 7.9 46.0 15.0 25.0 52.0 50.5 6.8 0.07 21 8.1 46.0 14.0 25.0 51.0 50.0 7.7 0.3 22 8.0 45.0 14.0 23.0 51.0 49.5 8.0 1 23 7.7 45.0 12.0 22.0 50.0 48.0 11.1 1.5 24 7.4 43.0 13.0 24.0 50.0 48.0 13.1 1 25 7.6 43.0 13.0 24.0 50.0 49.0 17.7 3.1 26 7.5 46.0 13.0 25.0 52.0 50.0 15.2 2 27 7.4 46.0 13.0 22.0 52.0 50.5 16.3 2.7 29 7.4 46.0 12.0 23.0 52.0 50.0 17.4 2.3 30 8.1 47.0 13.0 23.0 50.5 49.0 5.0 0.7 31 8.1 47.0 13.0 22.0 50.5 48.0 4.3 0.3
73

Appendix B3
1. Calculation of T-N T-N inlet is equal to amount of nitrate nitrogen at the inlet T-N outlet 1 is equal to the total of nitrogen species at the outlet of reactor 1
T-N outlet 1 = NO3-N + NO2-N T-N outlet 1 is equal to the total of nitrogen species at the outlet of reactor 2
T-N outlet 2 = NO3-N + NO2-N All the values of nitrogen species is available in the appendix A2 2. Calcualation of denitrification rate
DNR = V
)NT -NQ(T out in, ⋅⋅
Where DNR is denitrification rate, g/m3/day
QL is the feed water flow rate, L/d V volume of reactor, L Because Q/V = 1/HRT so both of this values can be replaced by HRT HRT hydraulic retention time, hours
Above formula can be written as follow:
HRT )NT N(T in, -24 out⋅⋅
DNR =
. Efficiency of removal
Efficiency =
3
100NT
)NT -N(T
in,
out in, x⋅
⋅⋅
here T-N out is concentration of total nitrogen in the effluent of the reactor, mg/L
W T-N in, is concentration of total nitrogen in influent of the reactor, mg/L
74
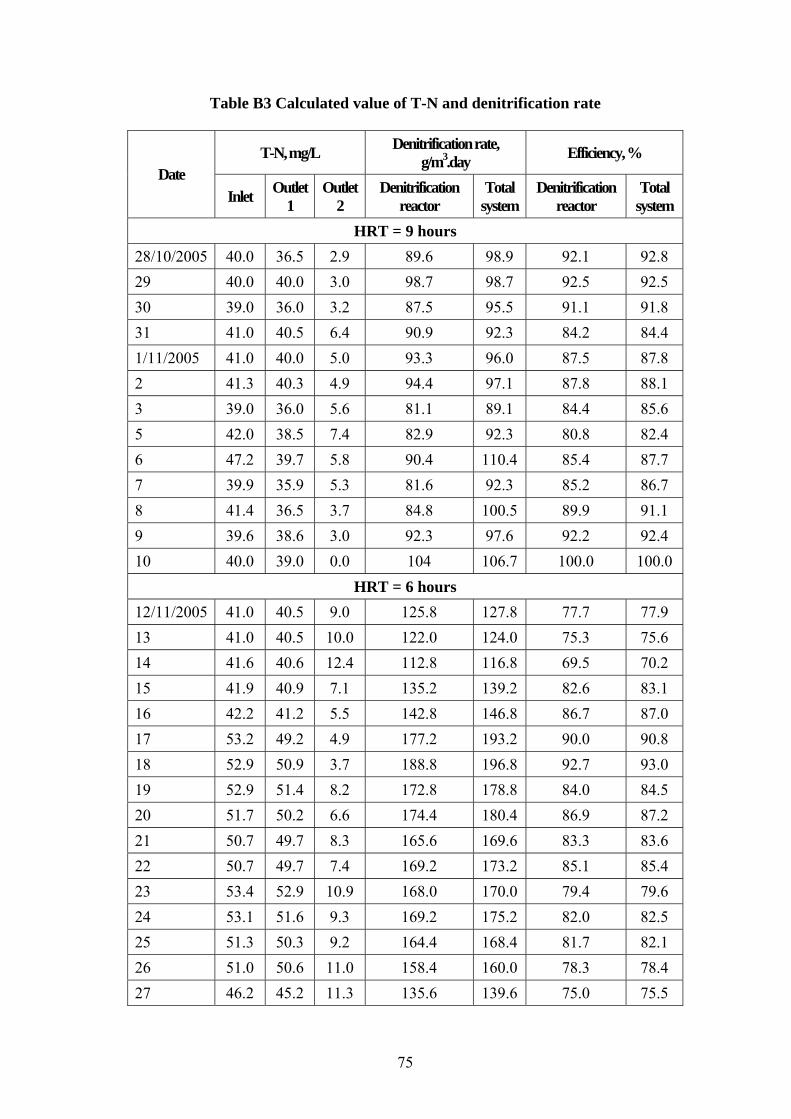
Table B3 Calculated value of T-N and denitrification rate
T-N, mg/L Denitrification rate, g/m3.day Efficiency, %
Date Inlet Outlet
1 Outlet
2 Denitrification
reactor Total
systemDenitrification
reactor Total
system HRT = 9 hours
28/10/2005 40.0 36.5 2.9 89.6 98.9 92.1 92.8 29 40.0 40.0 3.0 98.7 98.7 92.5 92.5 30 39.0 36.0 3.2 87.5 95.5 91.1 91.8 31 41.0 40.5 6.4 90.9 92.3 84.2 84.4 1/11/2005 41.0 40.0 5.0 93.3 96.0 87.5 87.8 2 41.3 40.3 4.9 94.4 97.1 87.8 88.1 3 39.0 36.0 5.6 81.1 89.1 84.4 85.6 5 42.0 38.5 7.4 82.9 92.3 80.8 82.4 6 47.2 39.7 5.8 90.4 110.4 85.4 87.7 7 39.9 35.9 5.3 81.6 92.3 85.2 86.7 8 41.4 36.5 3.7 84.8 100.5 89.9 91.1 9 39.6 38.6 3.0 92.3 97.6 92.2 92.4 10 40.0 39.0 0.0 104 106.7 100.0 100.0
HRT = 6 hours 12/11/2005 41.0 40.5 9.0 125.8 127.8 77.7 77.9 13 41.0 40.5 10.0 122.0 124.0 75.3 75.6 14 41.6 40.6 12.4 112.8 116.8 69.5 70.2 15 41.9 40.9 7.1 135.2 139.2 82.6 83.1 16 42.2 41.2 5.5 142.8 146.8 86.7 87.0 17 53.2 49.2 4.9 177.2 193.2 90.0 90.8 18 52.9 50.9 3.7 188.8 196.8 92.7 93.0 19 52.9 51.4 8.2 172.8 178.8 84.0 84.5 20 51.7 50.2 6.6 174.4 180.4 86.9 87.2 21 50.7 49.7 8.3 165.6 169.6 83.3 83.6 22 50.7 49.7 7.4 169.2 173.2 85.1 85.4 23 53.4 52.9 10.9 168.0 170.0 79.4 79.6 24 53.1 51.6 9.3 169.2 175.2 82.0 82.5 25 51.3 50.3 9.2 164.4 168.4 81.7 82.1 26 51.0 50.6 11.0 158.4 160.0 78.3 78.4 27 46.2 45.2 11.3 135.6 139.6 75.0 75.5
75
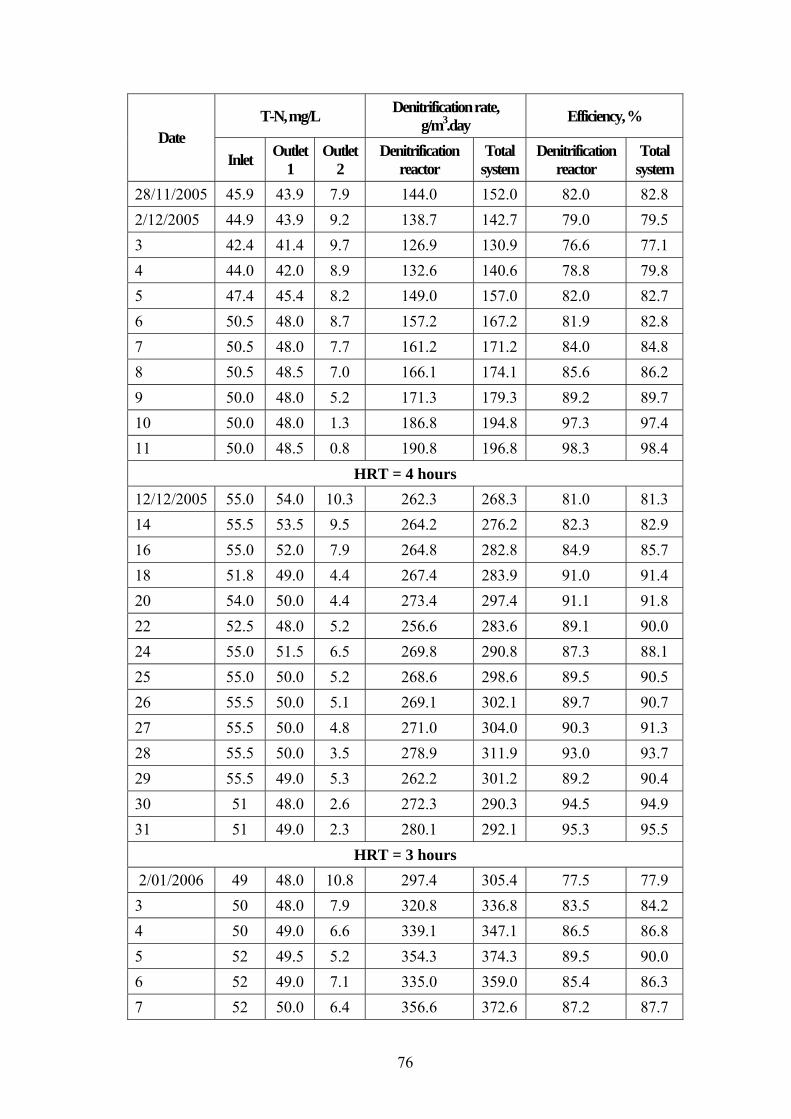
T-N, mg/L Denitrification rate, g/m3.day Efficiency, %
Date Inlet Outlet
1 Outlet
2 Denitrification
reactor Total
systemDenitrification
reactor Total
system 28/11/2005 45.9 43.9 7.9 144.0 152.0 82.0 82.8 2/12/2005 44.9 43.9 9.2 138.7 142.7 79.0 79.5 3 42.4 41.4 9.7 126.9 130.9 76.6 77.1 4 44.0 42.0 8.9 132.6 140.6 78.8 79.8 5 47.4 45.4 8.2 149.0 157.0 82.0 82.7 6 50.5 48.0 8.7 157.2 167.2 81.9 82.8 7 50.5 48.0 7.7 161.2 171.2 84.0 84.8 8 50.5 48.5 7.0 166.1 174.1 85.6 86.2 9 50.0 48.0 5.2 171.3 179.3 89.2 89.7 10 50.0 48.0 1.3 186.8 194.8 97.3 97.4 11 50.0 48.5 0.8 190.8 196.8 98.3 98.4
HRT = 4 hours 12/12/2005 55.0 54.0 10.3 262.3 268.3 81.0 81.3 14 55.5 53.5 9.5 264.2 276.2 82.3 82.9 16 55.0 52.0 7.9 264.8 282.8 84.9 85.7 18 51.8 49.0 4.4 267.4 283.9 91.0 91.4 20 54.0 50.0 4.4 273.4 297.4 91.1 91.8 22 52.5 48.0 5.2 256.6 283.6 89.1 90.0 24 55.0 51.5 6.5 269.8 290.8 87.3 88.1 25 55.0 50.0 5.2 268.6 298.6 89.5 90.5 26 55.5 50.0 5.1 269.1 302.1 89.7 90.7 27 55.5 50.0 4.8 271.0 304.0 90.3 91.3 28 55.5 50.0 3.5 278.9 311.9 93.0 93.7 29 55.5 49.0 5.3 262.2 301.2 89.2 90.4 30 51 48.0 2.6 272.3 290.3 94.5 94.9 31 51 49.0 2.3 280.1 292.1 95.3 95.5
HRT = 3 hours 2/01/2006 49 48.0 10.8 297.4 305.4 77.5 77.9 3 50 48.0 7.9 320.8 336.8 83.5 84.2 4 50 49.0 6.6 339.1 347.1 86.5 86.8 5 52 49.5 5.2 354.3 374.3 89.5 90.0 6 52 49.0 7.1 335.0 359.0 85.4 86.3 7 52 50.0 6.4 356.6 372.6 87.2 87.7
76

T-N, mg/L Denitrification rate, g/m3.day Efficiency, %
Date Inlet Outlet
1 Outlet
2 Denitrification
reactor Total
systemDenitrification
reactor Total
system 8/1/2006 50 48.0 6.2 334.3 350.3 87.0 87.6 9 48 47.0 5.1 335.1 343.1 89.1 89.4 10 50 48.0 8.0 319.8 335.8 83.3 83.9 Average 50.33 48.5 7.03 332.5 347.2 85.5 86
HRT = 2 hours 11/1/2006 50 48.0 17.8 362.1 386.1 62.9 64.4 12 50 48.0 13.5 413.7 437.7 71.8 73.0 13 48 47.0 16.1 370.4 382.4 65.7 66.4 14 48 47.0 15.4 378.7 390.7 67.2 67.8 15 50 48.0 18.0 359.5 383.5 62.4 63.9 16 50 48.0 17.0 371.5 395.5 64.5 65.9 17 51.5 50.0 17.0 395.5 413.5 65.9 66.9 18 51.5 50 19.0 371.5 389.5 61.9 63.0 Average 50 48.3 16.7 378 397 65.3 66.4
77

Table B4. Calculated value of T-N and denitrification rate when HRT of 3 hours
T-N, mg/L Denitrification rate, g/m3.day Efficiency, % Date
Inlet Outlet 1 Outlet 2 Denitrification reactor
Total system
Denitrification reactor
Total system
20/1/2006 52.0 50.5 6.9 349.0 361.0 86.4 86.8 21 51.0 50 8.0 336.0 344.0 84.0 84.3 22 51.0 49.5 9.0 324.0 336.0 81.8 82.4 23 50.0 48 12.6 283.2 299.2 73.8 74.8 24 50.0 48 14.1 271.2 287.2 70.6 71.8 25 50.0 49 20.8 225.6 233.6 57.6 58.4 26 52.0 50 17.2 262.4 278.4 65.6 66.9 27 52.0 50.5 19.0 252.0 264.0 62.4 63.5 29 52.0 50 19.7 242.4 258.4 60.6 62.1 30 50.5 49 5.7 346.4 358.4 88.4 88.7 31 50.5 48 4.6 347.2 367.2 90.4 90.9
78
Appendix C
Analysis results of experiment run 3
79

Table C1 Analysis result of using CO2
COD, mg/L NO3--N, mg/L
Date pH Inlet Outlet
1 Outlet
2 Inlet Outlet 1
Outlet 2
NO2--N,
mg/L
HRT = 3 hours 1/2/2006 7.4 48.0 14.0 24.0 50.0 48 6.8 0 2 7.4 50.0 14.0 21.0 50.0 48.5 4.0 0 3 7.7 49.0 15.0 20.0 51.5 50 6.4 0 4 7.7 46.2 13.8 23.6 51.5 49 4.2 0.1 5 7.5 46.2 13.8 22.6 52.0 50 5.1 0 6 7.3 48.2 14.8 22.6 52.0 49.5 4.2 0 7 7.3 46.2 12.8 23.6 50.0 48 5.0 0 8 7.6 47.2 13.8 23.6 50.0 47 5.5 0 9 7.4 47.2 11.8 20.7 49.0 47 5.1 0 10 7.8 47.2 12.8 19.7 49.0 48 6.3 0.1 11 7.3 48.0 14.0 23.0 51.0 49 5.9 0 12 7.3 50.2 14.8 21.6 51.0 50 8.9 0.6 Average 47.8 13.78 22.17 50.58 48.67 5.62 0.1
HRT = 2 hours 15/2/2006 7.5 52.5 49 17.5 2.6 16 7.5 50 15 24 52.5 50 18.1 3.0 17 7.6 50.0 48 16 2.5 18 7.5 50.0 47 12 1.2 19 7.5 51.0 50 13.7 2.0 20 7.6 48 14.7 22.5 51.0 49 15.9 2.6 21 7.6 50.0 48 13 1.8 22 7.8 50.0 47 12.7 1.3 23 8.0 50.5 48.5 12.2 1.2 24 7.7 46 14 23.3 50.5 48 16 2.6 Average 48 14.6 23.3 50.8 48.45 14.71 2.1
HRT = 2.5 hours 25/2/2006 8.0 51 15.5 23.7 54.5 51 13.9 0.05 26 8.3 54.5 51 12.0 0.3 27 7.2 54.5 50 7.9 0.2 28 7.0 48 14.2 23.3 54.5 50 8.4 0.76 1/3/2006 7.1 50.0 48 6.1 0.17 02 7.0 50.0 48 10.8 1.8 03 7.1 47 14.4 22.5 52.0 50 9.8 0.8 04 6.4 52.0 50 9.2 1 5 7.8 52.0 51 9.2 1.3 06 7.5 52.0 51 13 1.4 Average 48.7 14.7 23.2 52.6 50 10.03 0.78
80
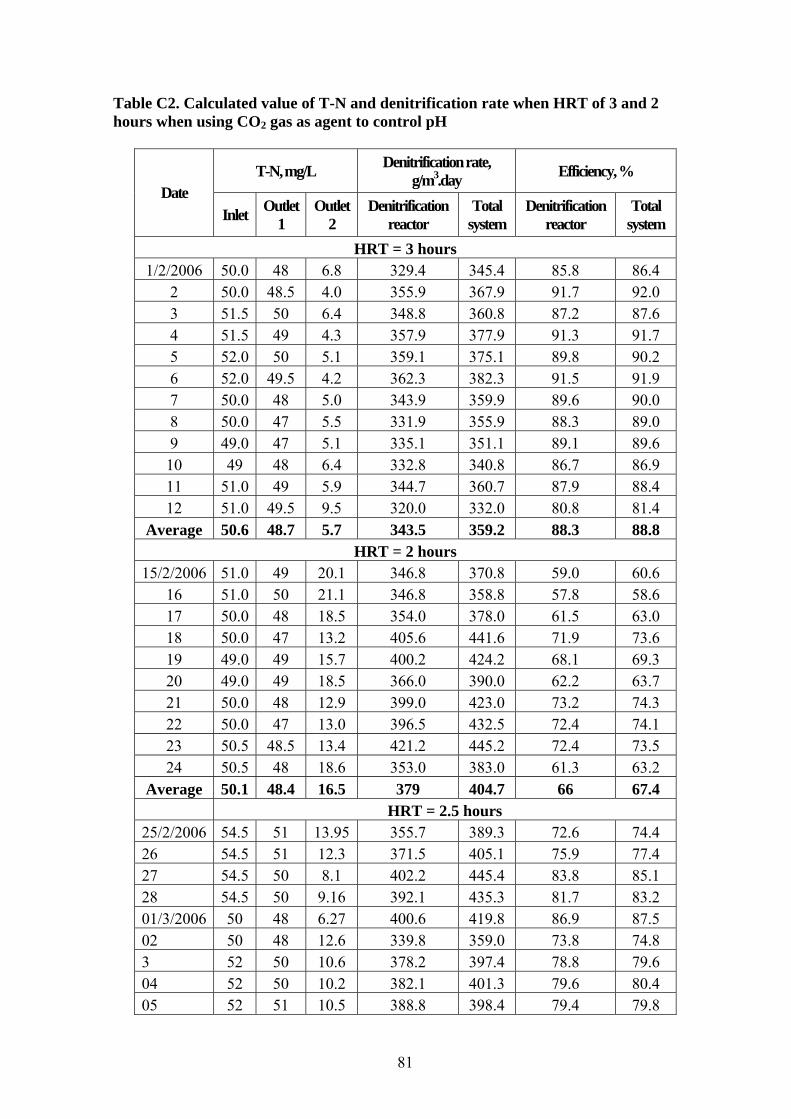
Table C2. Calculated value of T-N and denitrification rate when HRT of 3 and 2 hours when using CO2 gas as agent to control pH
T-N, mg/L Denitrification rate, g/m3.day Efficiency, %
Date Inlet Outlet
1 Outlet
2 Denitrification
reactor Total
system Denitrification
reactor Total
system HRT = 3 hours
1/2/2006 50.0 48 6.8 329.4 345.4 85.8 86.4 2 50.0 48.5 4.0 355.9 367.9 91.7 92.0 3 51.5 50 6.4 348.8 360.8 87.2 87.6 4 51.5 49 4.3 357.9 377.9 91.3 91.7 5 52.0 50 5.1 359.1 375.1 89.8 90.2 6 52.0 49.5 4.2 362.3 382.3 91.5 91.9 7 50.0 48 5.0 343.9 359.9 89.6 90.0 8 50.0 47 5.5 331.9 355.9 88.3 89.0 9 49.0 47 5.1 335.1 351.1 89.1 89.6 10 49 48 6.4 332.8 340.8 86.7 86.9 11 51.0 49 5.9 344.7 360.7 87.9 88.4 12 51.0 49.5 9.5 320.0 332.0 80.8 81.4
Average 50.6 48.7 5.7 343.5 359.2 88.3 88.8 HRT = 2 hours
15/2/2006 51.0 49 20.1 346.8 370.8 59.0 60.6 16 51.0 50 21.1 346.8 358.8 57.8 58.6 17 50.0 48 18.5 354.0 378.0 61.5 63.0 18 50.0 47 13.2 405.6 441.6 71.9 73.6 19 49.0 49 15.7 400.2 424.2 68.1 69.3 20 49.0 49 18.5 366.0 390.0 62.2 63.7 21 50.0 48 12.9 399.0 423.0 73.2 74.3 22 50.0 47 13.0 396.5 432.5 72.4 74.1 23 50.5 48.5 13.4 421.2 445.2 72.4 73.5 24 50.5 48 18.6 353.0 383.0 61.3 63.2
Average 50.1 48.4 16.5 379 404.7 66 67.4 HRT = 2.5 hours
25/2/2006 54.5 51 13.95 355.7 389.3 72.6 74.4 26 54.5 51 12.3 371.5 405.1 75.9 77.4 27 54.5 50 8.1 402.2 445.4 83.8 85.1 28 54.5 50 9.16 392.1 435.3 81.7 83.2 01/3/2006 50 48 6.27 400.6 419.8 86.9 87.5 02 50 48 12.6 339.8 359.0 73.8 74.8 3 52 50 10.6 378.2 397.4 78.8 79.6 04 52 50 10.2 382.1 401.3 79.6 80.4 05 52 51 10.5 388.8 398.4 79.4 79.8
81

T-N, mg/L Denitrification rate, g/m3.day Efficiency, %
Date Inlet Outlet
1 Outlet
2 Denitrification
reactor Total
system Denitrification
reactor Total
system 06/3/2006 52 51 14.4 351.4 361.0 71.8 72.3 Average 51.3 49.1 13.8 377.6 403.0 72 73
82
Appendix D
Experimental results after changing the sequence of reactors
83

Table D1 Analysis result
COD, mg/L NO3--N, mg/L NO2
--N, mg/L Date pH
Inlet Outlet1
Outlet2 Inlet Outlet
1 Outlet
2 Outlet
1 Outlet
2
TMP, kPa
HRT = 3 hours 8/3/2006 6.7 49.5 30.5 5.7 53.0 4.2 4.1 0 0 1.8 9 7.1 49.5 26.7 5.8 52.0 5 4.7 0 0 1.8 10 7.5 49.5 28.6 5.8 52.0 4.5 4.8 0 0 1.8 11 6.7 48.3 41.7 6.8 50.0 4.3 4.2 0 0 1.8 12 7.6 48.3 40.0 6.8 50.0 4.2 5.0 0 0 1.8 13 8.3 48.3 35.0 6.8 53.0 4.9 5.7 0 0 1.8 14 7.1 45.9 30.0 6.2 50.0 4.5 4.0 0 0 1.8 15 7.2 45.9 31.8 6.2 50.0 5.0 4.3 0.0 0 1.8 16 7.2 48.0 37.7 6.7 50.0 5.2 5.3 0.2 0 1.8 17 7.3 48.0 29.1 6.7 48.0 3.7 4.0 0.2 0 1.8 18 7.2 48.0 30.9 6.7 48.0 4.7 5.0 0.3 0 1.8 19 6.9 48.0 32.6 6.7 48.0 4.9 4.5 0.3 0 1.8 20 7.2 53.3 33.3 6.7 48.0 3.9 3.1 0.1 0 1.8 21 7.1 53.3 35.0 6.7 50.0 5.0 4.5 0.3 0 1.8 Average 49 33 6.5 50.1 4.6 4.5 0.1 0 HRT = 2.5 hours 23/3/2006 7.1 50.8 31.7 10.0 47 8.3 4.9 1.8 0 1.9 24 8.0 50.8 31.7 8.3 47 5.9 5.9 1.3 0 1.9 25 6.8 53.3 33.3 6.7 46 5.7 5.7 0.9 0.1 1.9 26 7.1 53.3 35.0 10.0 46 4.1 5.7 0.5 0 1.9 27 7.1 48.3 35.0 8.3 48 5.3 5.7 0.4 0 1.9 28 6.9 48.3 31.7 8.3 48 6.4 6.7 1.5 0 1.9 29 7.6 49 7 6.8 1.8 0.15 1.9 30 7.5 49 7.5 7.8 1.7 0.1 1.9 Average 47.5 6.28 6.15 1.24 0.04 HRT = 2.0 hours 31/3/2006 7.6 48 35 8.1 47 18 12.4 4.2 0.75 2.0 1/4/2006 7.6 47 16 15.8 3.5 0.5 2.0 2 8.1 51 38 8.2 47.5 14.7 13.8 3.1 0.02 2.0 3 7.4 51 35 8.2 47.5 12.7 12.1 2.7 0.02 2.0 4 7.3 48 13 12.3 2.5 0.02 2.0 Average 47.4 14.9 13.3 3.2 0.3
HRT = 3.0 hours 5/4/2006 - - - - - - - - - 2.0 6 - - - - - - - - - 2.0 7 - - - - - - - - - 2.0 8 - - - - - - - - - 2.0
84
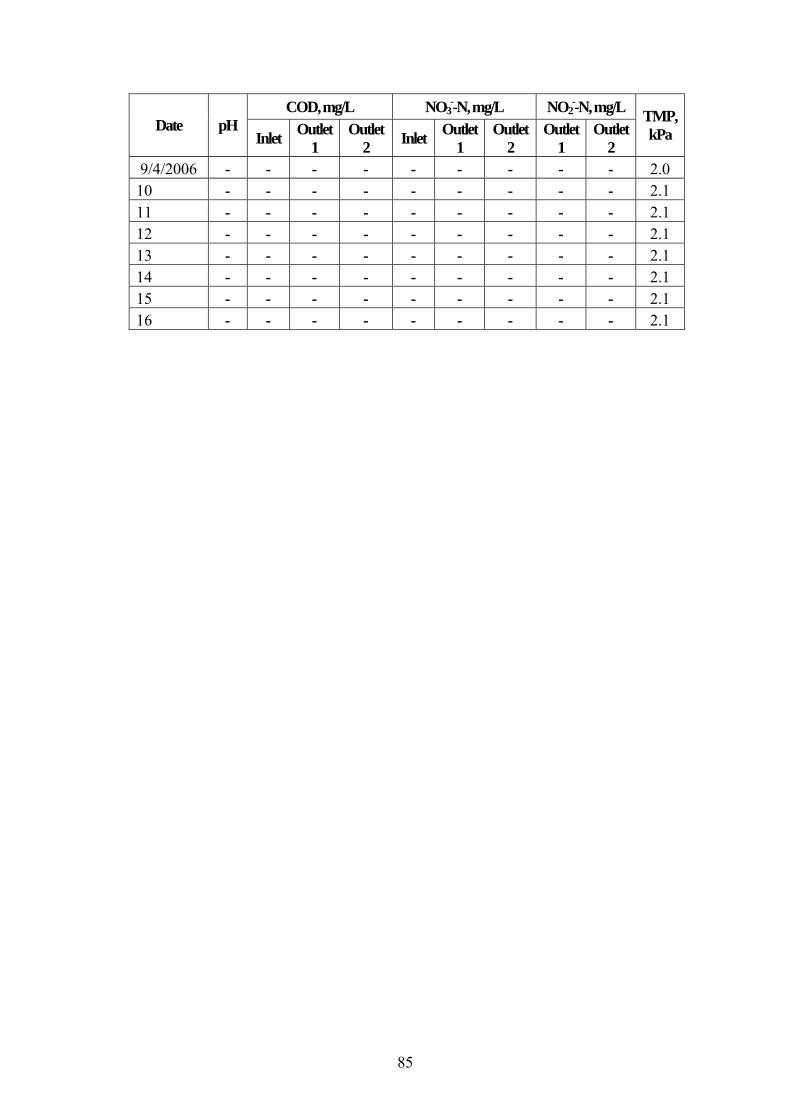
COD, mg/L NO3--N, mg/L NO2
--N, mg/L Date pH
Inlet Outlet1
Outlet2 Inlet Outlet
1 Outlet
2 Outlet
1 Outlet
2
TMP, kPa
9/4/2006 - - - - - - - - - 2.0 10 - - - - - - - - - 2.1 11 - - - - - - - - - 2.1 12 - - - - - - - - - 2.1 13 - - - - - - - - - 2.1 14 - - - - - - - - - 2.1 15 - - - - - - - - - 2.1 16 - - - - - - - - - 2.1
85

Table D2Calculated value of T-N, denitrification rate and efficiency of removal
T-N, mg/L Denitrification rate, g/m3.day Efficiency, %
Inlet Outlet 1
Outlet 2
Denitrification reactor
Total system
Denitrification reactor
Total system
Date
HRT = 3 hours 8/3/2006 53.0 4.2 4.1 390.4 391.2 92 92 9 52.0 5.0 4.7 376.0 378.4 91 91 10 52.0 4.5 4.8 380.0 377.6 92 91 11 50.0 4.3 4.2 365.6 366.4 92 92 12 50.0 4.2 5 366.4 360.0 92 91 13 53.0 4.9 5.7 384.8 378.4 91 89 14 50.0 4.5 4 364.0 368.0 92 92 15 50.0 5.0 4.3 360.0 365.6 91 92 16 50.0 5.4 5.3 356.8 357.6 90 90 17 48.0 3.9 4 352.6 352.0 93 92 18 48.0 5.0 5 344.3 344.0 91 91 19 48.0 5.2 4.5 342.5 348.0 90 92 20 48.0 4.0 3.1 351.9 359.2 92 94 21 50.0 5.3 4.5 357.6 364.0 90 92 Average 50 4.7 4.5 363.7 365 91.4 91.5 HRT = 2.5 hours 23/3/2006 47.0 8.3 4.9 354.2 403.7 81 91 24 47.0 7.2 5.9 382.6 394.4 87 89 25 46.0 6.6 5.8 378.0 385.9 87 89 26 46.0 4.6 5.7 397.1 386.4 91 89 27 48.0 5.7 5.7 406.1 406.0 89 89 28 48.0 7.9 6.7 385.0 396.4 85 87 29 49.0 8.8 7.0 385.9 403.7 83.4 87 30 49.0 9.2 7.9 382.1 394.6 82.6 85 Average 47.5 7.29 6.2 383.88 396.39 85.75 88.25
HRT = 2 hours 31/3/2006 47.0 22.2 13.2 297.6 406.2 58.1 75 1/4/2006 47.0 19.5 16.3 330.0 368.4 63.2 69 2 47.5 17.8 13.8 356.4 404.2 66.4 74 3 47.5 15.4 12.1 385.2 424.6 70.9 77 4 48.0 15.5 12.3 390.0 428.2 71.7 77 Average 47.4 18.1 13.5 351.8 406.3 66.1 74.4
86

Appendix E
Membrane resistance measurement
87

Membrane resistance measurement Membrane surface area 0.42m2
Dynamic viscosity of water at 30oC: 7.98 x 10⁻³ N.s/m2
1. Membrane resistance of membrane used in aeration reactor after clean with chemical
Table E1 Results of membrane initial resistance
No Flux, mL/min Filtration Flux, L/m2.h TMP, kPa
1 52 7.4 1.65
2 100 14.3 2.45
3 142 20.3 3.1
4 210 30.0 4.2
5 250 35.7 5
y = 0.1168x + 0.7639R2 = 0.9985
0123456
0 10 20 30
Filtration flux, L/m2.h
TM
P, k
Pa
40
Figure E1 Relationship between TMP and filtration flux The membrane resistance was derived from the slope of the linear curve of ∆P versus J. With dynamic viscosity of pure water is 0.798*10-3 Pa.s (or N.s/m2), initial membrane resistance was calculated as following:
111
32
31026917.5
).(10798.0).
(
)(1000)(3600)(1000)(1168.0−
−×== m
sPaxxhm
LmLx
hsx
kPaPaxkPa
Rm
88

2. Membrane resistance of membrane used in denitrification reactor for diffusion
Table E2 Results of membrane initial resistance after chemical cleaning
No Flux, mL/min Filtration Flux, L/m2.h TMP, kPa 1 51 7.3 2.1 2 100 14.3 2.8 3 140 20.0 3.5 4 202 28.9 4.6 5 240 34.3 5.2
y = 0.1168x + 1.1942R2 = 0.9986
01
23
45
6
0 10 20 30 4
Filtration flux, L/m2.h
TM
P, k
Pa
0
Figure E2. Relationship between TMP and filtration flux Calculation as Section 1, Rm = 5.26917x10¹¹m-1
Table E3 Membrane resistance with cake after 15 days of diffusion
No Flux, mL/min Filtration Flux, L/m2.h TMP, kPa 1 20 2.9 6.9 2 34 4.9 7.2 3 62 8.9 7.7 4 81 11.6 8.1 5 112 16.0 9.1 6 156 22.3 10 7 198 28.3 11.1 8 218 31.1 11.6 9 259 37.0 12.6
89

y = 0.1691x + 6.306R2 = 0.9979
02468
101214
0 10 20 30
Filtration flux, L/m2.h
TM
P, k
Pa40
Figure E3 Relationship between TMP and filtration flux with cake Calculation as Section 1, Rm = 7.62857x10¹¹m-1
Table E3 Membrane resistance after removed cake
No Flux , mL/min Filtration Flux, L/m2.h TMP, kPa
1 20 2.9 6.75 2 36 5.1 7.3 3 57 8.1 7.9 4 78 11.1 8.2 5 102 14.6 8.7 6 152 21.7 9.7 7 208 29.7 10.7 8 266 38.0 12
y = 0.143x + 6.5599R2 = 0.9956
02468
101214
0 10 20 30
Filtration flux, L/m2.h
TM
P, k
Pa
40
Figure F4 Relationship between TMP and filtration flux without cake
Calculation as Section 1, Rm = 6.54113x10¹¹m-1
Table E4 Membrane resistance after cleaning with chemical
90

No Flux , mL/min Filtration Flux, L/m2.h TMP, kPa 1 14 2.0 6.8 2 42 6.0 7.4 3 75 10.7 8.1 4 110 15.7 8.8 5 168 24.0 9.7 6 216 30.9 10.6 7 267 38.1 11.2
y = 0.1226x + 6.7109R2 = 0.9934
02468
1012
0 10 20 30 40 5
Filtration flux, L/m2.h
TM
P, k
Pa
0
Figure E5 Relationship between TMP and filtration flux after cleaning with chemical
Calculation as Section 1, Rm = 5.53083x10¹¹ m-1
Percent of recovery:
5.53083x10¹¹ -5.26917x1011= (1- 5.26917x10¹¹ )x100% = 95 %
91

Appendix F
Cost analysis
92
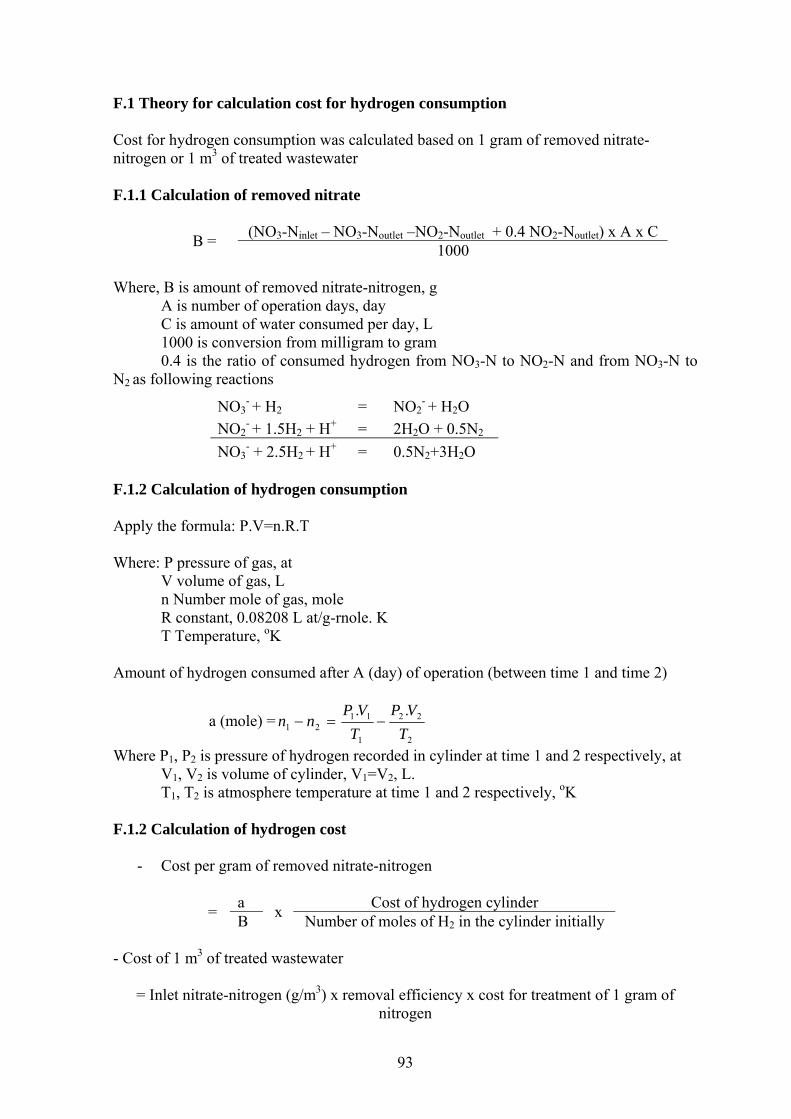
F.1 Theory for calculation cost for hydrogen consumption Cost for hydrogen consumption was calculated based on 1 gram of removed nitrate-nitrogen or 1 m3 of treated wastewater F.1.1 Calculation of removed nitrate
(NO3-Ninlet – NO3-Noutlet –NO2-Noutlet + 0.4 NO2-Noutlet) x A x C B = 1000 Where, B is amount of removed nitrate-nitrogen, g
A is number of operation days, day C is amount of water consumed per day, L 1000 is conversion from milligram to gram 0.4 is the ratio of consumed hydrogen from NO3-N to NO2-N and from NO3-N to
N2 as following reactions F.1.2 Calculation of hydrogen consumption Apply the formula: P.V=n.R.T Where: P pressure of gas, at
V volume of gas, L n Number mole of gas, mole R constant, 0.08208 L at/g-rnole. K T Temperature, oK
Amount of hydrogen consumed after A (day) of operation (between time 1 and time 2)
a (mole) =2
22
1
1121
..T
VPTVP
nn −=−
Where P1, P2 is pressure of hydrogen recorded in cylinder at time 1 and 2 respectively, at V1, V2 is volume of cylinder, V1=V2, L. T1, T2 is atmosphere temperature at time 1 and 2 respectively, oK
F.1.2 Calculation of hydrogen cost
- Cost per gram of removed nitrate-nitrogen
a Cost of hydrogen cylinder = B x Number of moles of H2 in the cylinder initially - Cost of 1 m3 of treated wastewater
= Inlet nitrate-nitrogen (g/m3) x removal efficiency x cost for treatment of 1 gram of nitrogen
NO3- + H2 = NO2
- + H2O
NO2- + 1.5H2 + H+ = 2H2O + 0.5N2
NO3- + 2.5H2 + H+ = 0.5N2+3H2O
93

F.2 Calculation F.2.1 Total nitrogen removed
Date HRT NO3-N inlet, mg/L
NO3-N outlet, mg/L
NO2-N outlet, mg/L
Nitrogen removed, mg
1/02/2006 48 6.8 0.0 411.9 02 48.5 4.0 0.0 444.9 03 50 6.4 0.0 436.0 04 49 4.2 0.1 447.6 05 50 5.1 0.0 449.0 06 49.5 4.2 0.0 453.0 07 48 5.0 0.0 429.9 08 47 5.5 0.0 415.0 09 47 5.1 0.0 419.0 10 48 6.3 0.1 416.4 11 49 5.9 0.0 430.9 12 49.5 8.9 0.6 402.4 13 429.7*
14
HRT =3 hours
429.7*
Subtotal 6011.3 15/02/2006 49 17.5 2.6 449.1 16 50 18.1 3 451.5 17 48 16 2.5 457.5 18 47 12 1.2 514.2 19 48 13.7 1.95 497.0 20 49 15.9 2.6 473.1 21 48 13 1.75 509.3 22 47 12.7 1.26 503.2 23 47.5 12.2 1.2 518.7 24
HRT = 2 hours
48 16 2.58 456.8 Subtotal 4830.2
25/02/2006 51 13.9 0.05 444.8 26 51 12 0.3 465.8 27 50 7.9 0.2 503.8 28 50 8.4 0.76 493.7 01/03/2006 48 6.1 0.17 501.6 02 48 10.8 1.8 433.4 03 50 9.8 0.8 476.6 04 50 9.2 1 482.4 05 51 9.2 1.3 492.2 06/03/2006 51 13 1.4 445.9 07
HRT = 2.5
hours
474.0*
Subtotal 5214.422 08/03/2006 53.0 4.2 0 488.0 09 52.0 5 0 470.0 10 52.0 4.5 0 475.0 11 50.0 4.3 0 457.0 12
HRT = 3 hours
50.0 4.2 0 458.0
94

Date HRT NO3-N inlet, mg/L
NO3-N outlet, mg/L
NO2-N outlet, mg/L
Nitrogen removed, mg
13/03/2006 53.0 4.9 0 481.0 14 50.0 4.5 0 455.0 15 50.0 5 0.0 450.0 16 50.0 5.2 0.2 446.8 17 48 3.7 0.2 441.6 18 48 4.7 0.3 431.4 19 48 4.9 0.3 429.3 20 48 3.4 0.1 439.3 21 50 4.2 0.3 448.2 22 455.4*
Subtotal 6825.7 23/03/2006 47 8.3 1.8 451.4 24 47 5.9 1.3 484.2 25 46 5.7 0.9 476.9 26 46 4.1 0.5 498.9 27 48 5.3 0.4 509.5 28
HRT = 2.5
hours
48 6.4 1.5 488.4 Subtotal 2909.4
Total 25795.1 *This was calculated based on the average value of above days F.2.2 Total hydrogen consumed Recorded pressure on 01 February, 2006 is 98 bar (96.7atm), temperature 25 oCRecorded pressure on 28 March, 2006 is 95 bar (93.8atm), temperature 30oC
a (mol moleRT
VPRT
VPnnmolea 6.8)27330(082.0
478.93)27325(082.0
477.96..,2
22
1
1121 =
+××
−+×
×=−=−=
Amount of hydrogen required for 1 gram of removed nitrate-nitrogen Amount of hydrogen required for treatment of 1 m3 of wastewater (if Inlet nitrate-nitrogen is 50 mg/L and efficiency is 90%): = 0.95x50x90 = 42.8 g/m3
F.2.3 Cost for hydrogen consumed Volume of hydrogen gas in cylinder: 6m3 = 6000L Cost of 1 cylinder: 630Baht Number of moles:
6000 = 22.4 =267.8 mole
Cost of 1 mole:
8.6x1000 = 25795.1 = 0.33 mole H2/g NO3-N or 0.66 g H2/g NO3-N
630 = 267..9 =2.35 (Baht/mole)
95
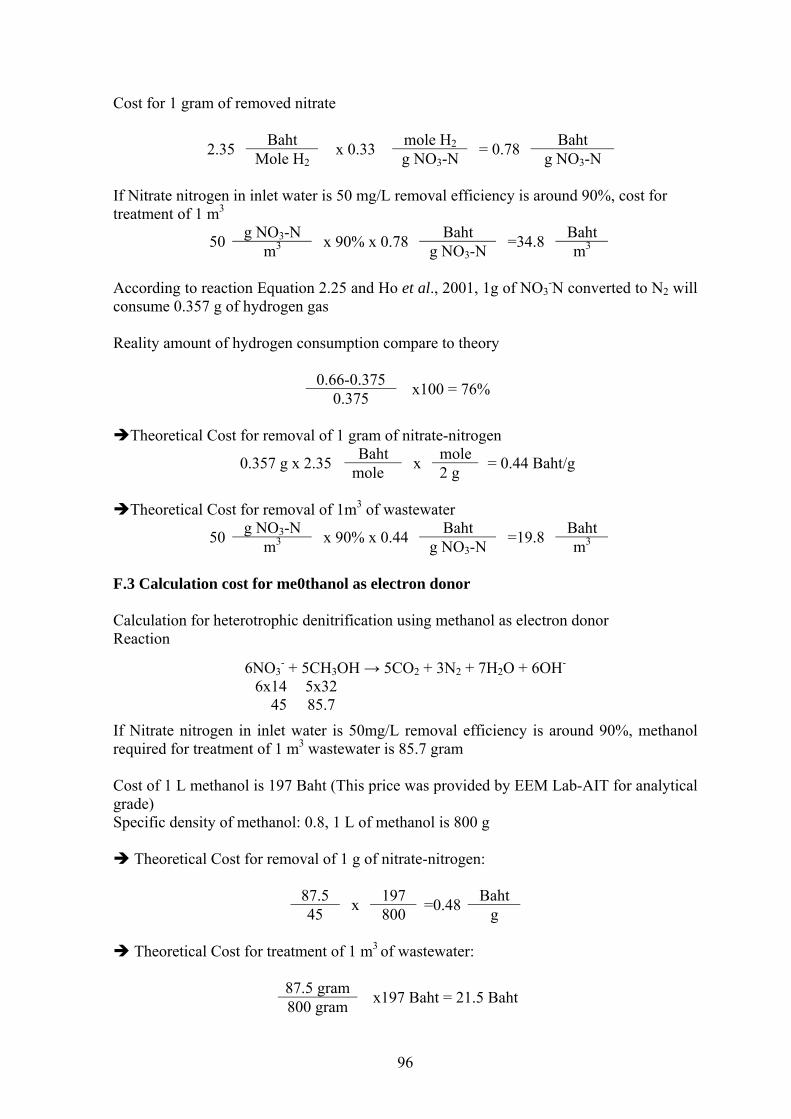
Cost for 1 gram of removed nitrate
Baht mole H2 Baht 2.35 Mole H2x 0.33 g NO3-N = 0.78 g NO3-N
If Nitrate nitrogen in inlet water is 50 mg/L removal efficiency is around 90%, cost for treatment of 1 m3
g NO3-N Baht Baht 50 m3 x 90% x 0.78 g NO3-N =34.8 m3
According to reaction Equation 2.25 and Ho et al., 2001, 1g of NO3
-N converted to N2 will consume 0.357 g of hydrogen gas Reality amount of hydrogen consumption compare to theory
0.66-0.375 0.375 x100 = 76%
Theoretical Cost for removal of 1 gram of nitrate-nitrogen
Baht mole0.357 g x 2.35 mole x 2 g = 0.44 Baht/g
Theoretical Cost for removal of 1m3 of wastewater
g NO3-N Baht Baht 50 m3 x 90% x 0.44 g NO3-N =19.8 m3
F.3 Calculation cost for me0thanol as electron donor Calculation for heterotrophic denitrification using methanol as electron donor Reaction If Nitrate nitrogen in inlet water is 50mg/L removal efficiency is around 90%, methanol required for treatment of 1 m3 wastewater is 85.7 gram Cost of 1 L methanol is 197 Baht (This price was provided by EEM Lab-AIT for analytical grade) Specific density of methanol: 0.8, 1 L of methanol is 800 g
Theoretical Cost for removal of 1 g of nitrate-nitrogen:
87.5 197 Baht 45 x 800 =0.48 g
Theoretical Cost for treatment of 1 m3
of wastewater:
87.5 gram 800 gram
x197 Baht = 21.5 Baht
6NO3- + 5CH3OH → 5CO2 + 3N2 + 7H2O + 6OH-
6x14 5x32 45 85.7
96

Appendix J
Biomass production
97

Biomass production Initial Biomass in reactor + Biomass generation in a period of time = Biomass in reactor after a period of time + Biomass washed out Biomass production was calculated 2 times from 01/02/2006 to 12/02/2006 and from 15/02/2006 to 24/02/2006 1. From 01/02/2006 to 12/02/2006 1.1 Initial biomass in reactor Volume of reactor: V = 1.25L MLVSS: 1965 mg/L Total Biomass in reactor: 1965 x 1.25 = 2456.25 mg 1.2 Biomass in reactor after 12 days of operation Volume of reactor: V = 1.25L MLVSS: 2336 mg/L Total biomass in reactor: 2336 x1.25 = 2920 mg 1.3 Biomass washed out Biomass washed out = MLVSS in effluent (mg/L) x L water/day x time (day) They are summarized as following:
Date T-N Inlet, mg/L
T-N Outlet, mg/L
Nitrogen consumed,
mg/d
Biomass washed out, mgVSS/L
Biomass washed out, mgVSS/d
1/2/2006 48 6.8 411.8 14 140 2 48.5 4.0 444.9 9 90 3 50 6.4 436.0 10 100 4 49 4.3 447.4 7 70 5 50 5.1 448.9 8 80 6 49.5 4.2 452.9 10 100 7 48 5.0 429.9 14 140 8 47 5.5 414.9 10 100 9 47 5.1 418.9 8 80 10 48 6.4 416.0 11 110 11 49 5.9 430.9 15 150 12 49.5 9.5 400.0 13 130 Total 5152.6 1290
1.4 Biomass generation Biomass generation in a period of time = Biomass in reactor after a period of time + Biomass washed out - Initial Biomass in reactor
= 2920 mg +1290 mg - 2456.25 mg = 1753.75 mg
98
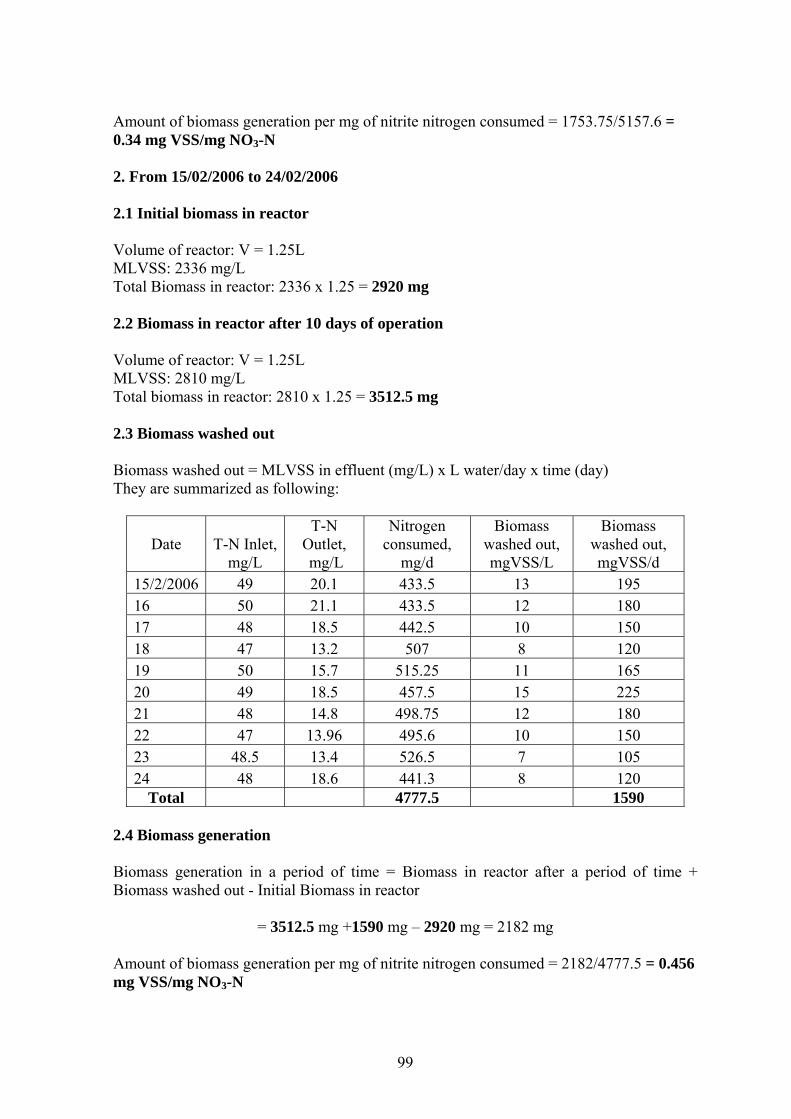
Amount of biomass generation per mg of nitrite nitrogen consumed = 1753.75/5157.6 = 0.34 mg VSS/mg NO3-N 2. From 15/02/2006 to 24/02/2006 2.1 Initial biomass in reactor Volume of reactor: V = 1.25L MLVSS: 2336 mg/L Total Biomass in reactor: 2336 x 1.25 = 2920 mg 2.2 Biomass in reactor after 10 days of operation Volume of reactor: V = 1.25L MLVSS: 2810 mg/L Total biomass in reactor: 2810 x 1.25 = 3512.5 mg 2.3 Biomass washed out Biomass washed out = MLVSS in effluent (mg/L) x L water/day x time (day) They are summarized as following:
Date T-N Inlet, mg/L
T-N Outlet, mg/L
Nitrogen consumed,
mg/d
Biomass washed out, mgVSS/L
Biomass washed out, mgVSS/d
15/2/2006 49 20.1 433.5 13 195 16 50 21.1 433.5 12 180 17 48 18.5 442.5 10 150 18 47 13.2 507 8 120 19 50 15.7 515.25 11 165 20 49 18.5 457.5 15 225 21 48 14.8 498.75 12 180 22 47 13.96 495.6 10 150 23 48.5 13.4 526.5 7 105 24 48 18.6 441.3 8 120
Total 4777.5 1590 2.4 Biomass generation Biomass generation in a period of time = Biomass in reactor after a period of time + Biomass washed out - Initial Biomass in reactor
= 3512.5 mg +1590 mg – 2920 mg = 2182 mg Amount of biomass generation per mg of nitrite nitrogen consumed = 2182/4777.5 = 0.456 mg VSS/mg NO3-N
99

Appendix I
Photos of experimental setup
100
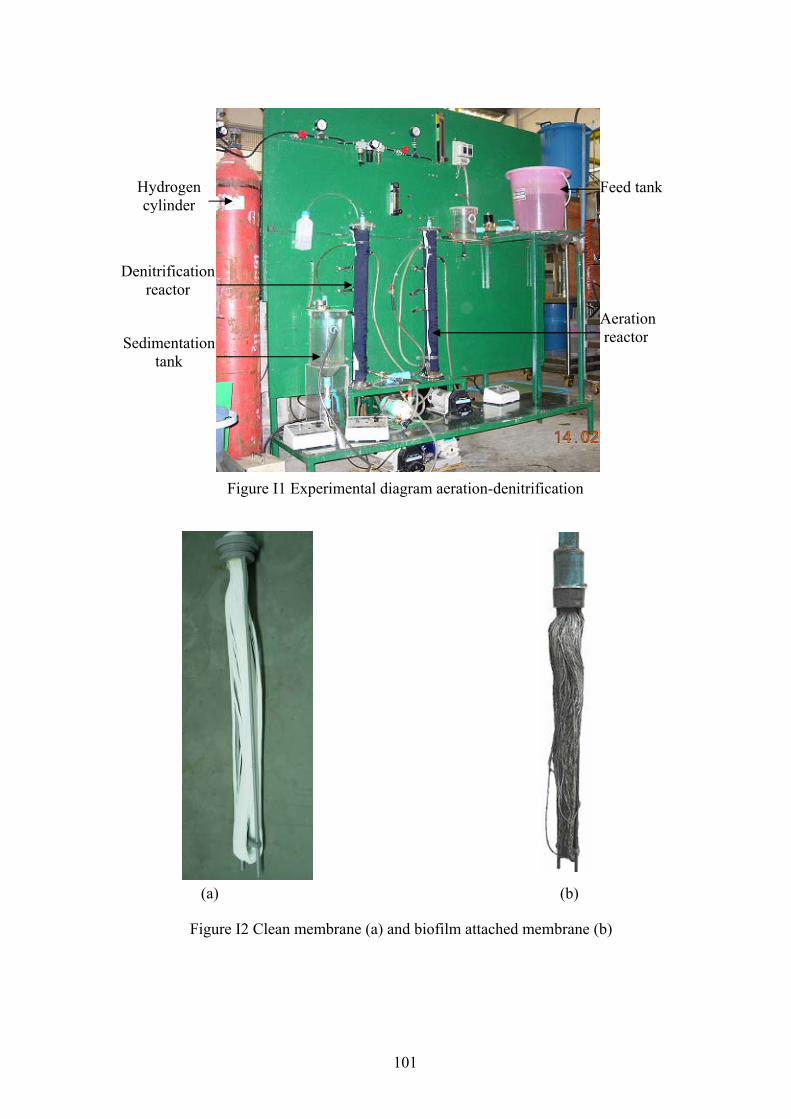
101
Figure I1 Experimental diagram aeration-denitrification
Figure I2 Clean membrane (a) and biofilm attached membrane (b)
(a) (b)
Denitrification reactor
Aeration reactor
Hydrogen cylinder
Sedimentation tank
Feed tank
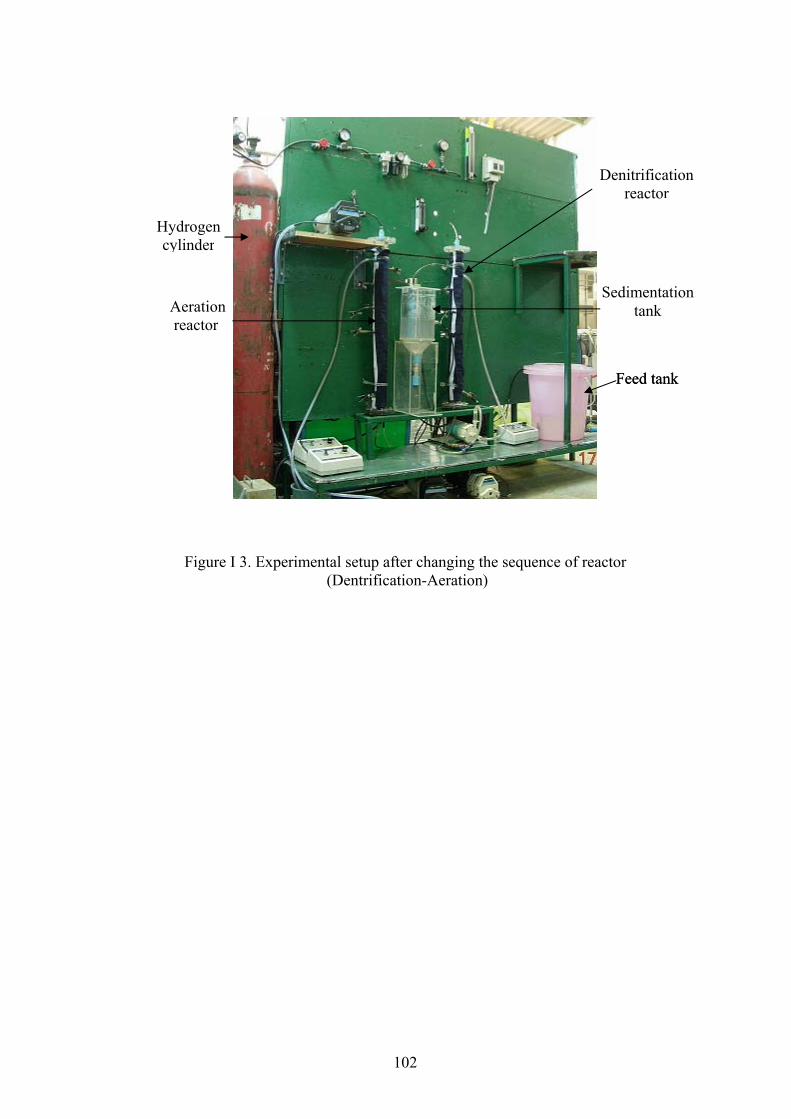
102
Figure I 3. Experimental setup after changing the sequence of reactor (Dentrification-Aeration)
Sedimentationtank
Hydrogen cylinder
Aeration reactor
Denitrificationreactor
Feed tank Feed tank