HYDROGEN PRODUCTION DISRUPTION...hazergroup.com.au *Economic modelling as per previous ASX...
24
HYDROGEN PRODUCTION DISRUPTION HAZER GROUP LTD ASX:HZR July 2018 1 hazergroup.com.au For personal use only
Transcript of HYDROGEN PRODUCTION DISRUPTION...hazergroup.com.au *Economic modelling as per previous ASX...

HYDROGEN PRODUCTION DISRUPTIONHAZER GROUP LTD ASX:HZR
July 2018
1hazergroup.com.au
For
per
sona
l use
onl
y

VALUE PROPOSITION
Disruptive, global and scalable low cost, low emission solution to a
decarbonised hydrogen future.
Technical development successfully progressed to enable transitioning into
commercial phase with a strong focus on additional partnerships and offtake.
Multiple potential revenue streams.
2hazergroup.com.au
For
per
sona
l use
onl
y
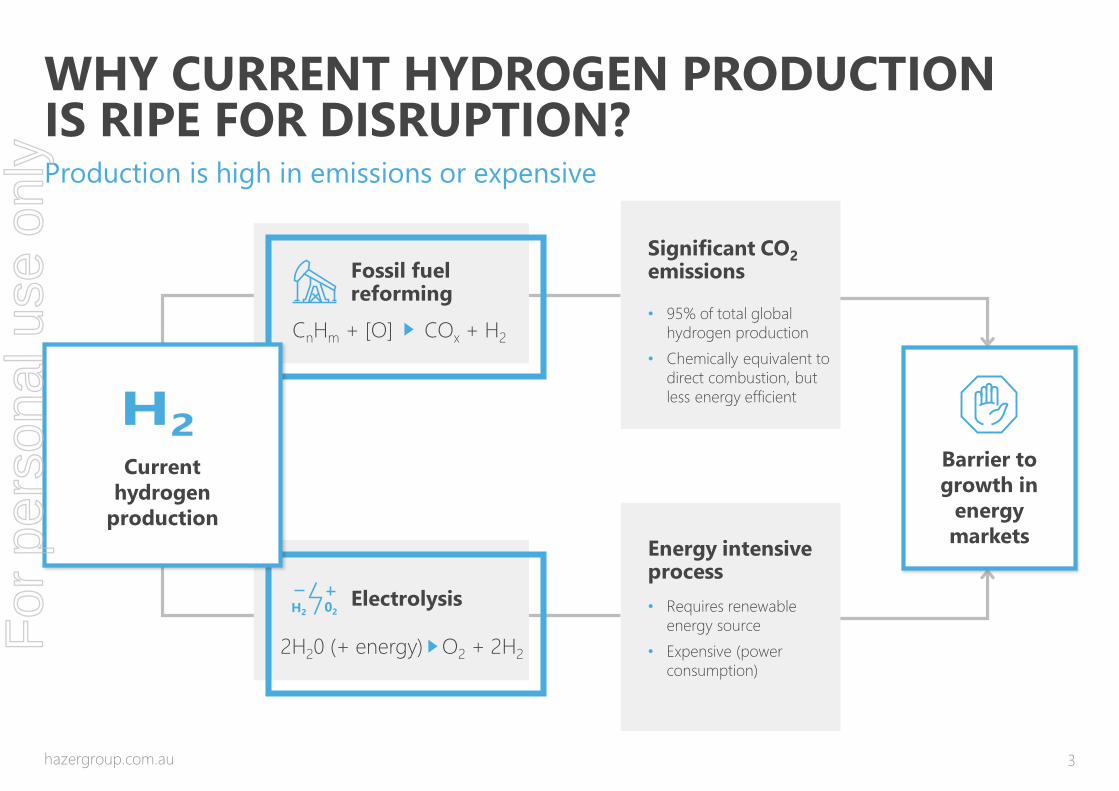
WHY CURRENT HYDROGEN PRODUCTION IS RIPE FOR DISRUPTION?Production is high in emissions or expensive
CnHm + [O]
Fossil fuel reforming
COx + H2
2H20 (+ energy)
Electrolysis
O2 + 2H2
Significant CO2
emissions
• 95% of total global
hydrogen production
• Chemically equivalent to
direct combustion, but
less energy efficient
Energy intensive process
• Requires renewable
energy source
• Expensive (power
consumption)
Current
hydrogen
production
Barrier to
growth in
energy
markets
3hazergroup.com.au
For
per
sona
l use
onl
y

THE HAZER ADVANTAGE Capturing more value of feedstock gas and dual revenue streams
4hazergroup.com.au
Natural gas composition
25% Hydrogen
75% Carbon
Hazer Process
Steam Methane Reforming(SMR)
Graphite (carbon)
Hydrogen gas
$
$
-$
For
per
sona
l use
onl
y

5hazergroup.com.au
Raw catalytic
material
Add
digestion
Add support
(ie. Ceramic)
Catalyst
precipitation
Catalyst
reduction
Supported
nano-catalyst
Raw catalytic
material
Catalyst creation
Graphite
encapsulating
catalyst
Natural gas Hydrogen
Catalyst Synthesis Decomposition reaction Catalyst recovery
THE BREAKTHROUGH
Decomposition reaction
Natural gas Hydrogen
Traditional methane decomposition research
Hazer Group
• Reaction creates catalyst from
cheap material
• No need for catalyst synthesis
• No need for catalyst recovery and reuse
Methane Decomposition - Simplified approach to old science
Graphite encapsulating
catalyst
For
per
sona
l use
onl
y

CH4 2H2 + C
THE HAZER PROCESSHydrogen and graphite from natural gas
Natural gas
Hydrogen
~US$100 billion pa*
Iron-ore
6hazergroup.com.au
Synthetic graphite
~US$14 billion pa^
* “Hydrogen Generation Market – Global Trends
and Forecasts to 2019”, Market to Markets report,
pg 45
^ “Global Market Study of Graphite Market”,
Persistence Market Report, pg 14
For
per
sona
l use
onl
y

0
HAZER HYDROGEN COMPARISON Positioning as a low cost, low emission alterative
Electrolysis
(4%)
Greater CO2 emissions (per kWhr)
than direct combustion of fossil
fuel^
CO2
Emissions
(per tonne
of H2)
Hydrogen Production Cost ($/tonne H2)
Hazer
Coal
Gasification
(18%)
Partial
Oxidation
(30%)
Steam
Methane
Reformation
(SMR)
(30%)
Targeting low cost, low
emission hydrogen production
Significant emissions reductions.
Emissions can be reduced further by
harnessing clean energy options.
Lower operating cost* through graphite
sales to enable access to US$100 Billion
Industrial hydrogen market.
7hazergroup.com.au *Economic modelling as per previous ASX Announcement 28th February 2018 ̂ Conceptual diagram only with numbers in brackets showing best estimates current market share
For
per
sona
l use
onl
y

OPPORTUNITIES IN THREEMAJOR GLOBAL MARKETS
Low emission, low cost
alternative
Currently primarily addressed by
fossil fuel reformation processes
(high CO2 byproduct).
Hazer has potential to deliver
significant cost savings with
graphite revenue offset.
Industry is beginning to turn
toward cleaner solutions.
Multiple applications
Clean (low carbon) hydrogen
has price or value premium to
standard hydrogen.
Key component of clean energy
future (H2 => H2O + energy).
Fundamental cost, energy
limitations for existing clean
hydrogen production options.
High quality, low cost
graphite source
Growth - energy storage (batteries)
Graphite has a wide range of
desirable properties and is used
in a range of industrial materials
applications.
Current methods of graphite
production (natural or synthetic)
are costly and have significant
environmental impacts.
Industrial hydrogen
US$100 billion*Clean hydrogen and energy
US$12 billiona by 2023 (FCV)
Synthetic graphite
US$14 billion^
8hazergroup.com.au
* “Hydrogen Generation Market – Global Trends and Forecasts to 2019”, Market to Markets report, pg 45
^ “Global Market Study of Graphite Market”, Persistence Market Report, pg 14a “Hydrogen Fuel Cell Vehicle Market Overview”, Allied Market Research
For
per
sona
l use
onl
y

MULTIPLE CLEANHYDROGEN APPLICATIONS
Fuel Cell Vehicle (FCV) models
being developed.
Potential distribution via
traditional clean energy systems,
including hydrogen injection into
gas pipelines
Cost, energy and carbon
emission barriers for existing
hydrogen production methods .
An alternative to CCS (Carbon
Capture and Storage), where
CO2 emissions can be captured
and used as feedstock for other
chemical products.
These include methanol and
liquid fuel (diesel).
Low cost, low emission hydrogen
will be in demand as a key
additional feedstock.
Traditional industrial hydrogen
users are seeking cleaner
alternatives.
This offers opportunities to disrupt
the large and growing industrial
hydrogen market
Recent attention has been in iron
production, and green ammonia.
Clean energy – Vehicle
fuel and stationary power
Carbon Capture
and Utilisation (CCU)Clean Industrial
Hydrogen Market
9hazergroup.com.au
For
per
sona
l use
onl
y

INDUSTRIAL HYDROGEN MARKETS TRANSITIONING TO LOW CARBON HYDROGEN
Conceptual Hazer plant integration into steel production with CCU
10hazergroup.com.au
Natural Gas
Iron Ore
Steel
Plant
Hazer
Plant
Graphite Steel Methanol
CCU/
Methanol
plant
3 Products = 3 Revenue Streams
CO2 Emissions
Hydrogen
(CCU Usage)
Hydrogen
(Reductant)
Graphite
(Coke Replacement and electrodes)
Carbon Capture and Utilization (CCU) Waste to energy
For
per
sona
l use
onl
y

hazergroup.com.au
HAZER GRAPHITE
VERSATILE PROPERTIES – MANY OPPORTUNITIES
• Current graphite market value in excess of US$ 14 Billion per annum^
• Hazer graphite structure and properties can be altered to potentially suit different market by changing the process conditions
• Graphite purity ex reactor can range between 80-95%wt, and can be purified to 99.9%> with standard purification techniques
• Promising preliminary results in using Hazer Graphite in Li-ion batteries
^ “Global Market Study of Graphite Market”, Persistence Market Report, pg 14
For
per
sona
l use
onl
y

HYDROGEN & GRAPHITE SYNERGYPotential to be a major part of the revolution in future mobility
Electric Vehicle Fuel Cell Vehicle
Low carbon Hydrogen
in Storage Tank
Graphite in
Power
Unit
Graphite in Fuel
Cell Stack
Graphite in
Lithium-Ion
Batteries
Graphite in
Power
Unit
Graphite in
Lithium-Ion
Batteries
12hazergroup.com.au
For
per
sona
l use
onl
y

STRONG COMMERCIAL PROGRESS SINCE IPOMilestones
HZR listed on ASX in Dec 2015
Non-binding MoU with Primetals
Technologies GmbH
(Siemens and Mitsubishi Heavy Industry)
to investigate integration of Hazer Process
in steel production
Research begins Binding Co-Operation Agreement with
$4bn Mineral Resources Ltd (ASX:MIN)
for development of a commercial scale
synthetic graphite plant
Design options begin for small
hydrogen demonstration plant with
potential offtake
13hazergroup.com.au
Hazer Group Pty Ltd formed 2010
2007
2010 20172015 2018
2016
Non-binding MoU with Pan American Hydrogen
to investigate integration of Hazer Process
in hydrogen production
2017
For
per
sona
l use
onl
y
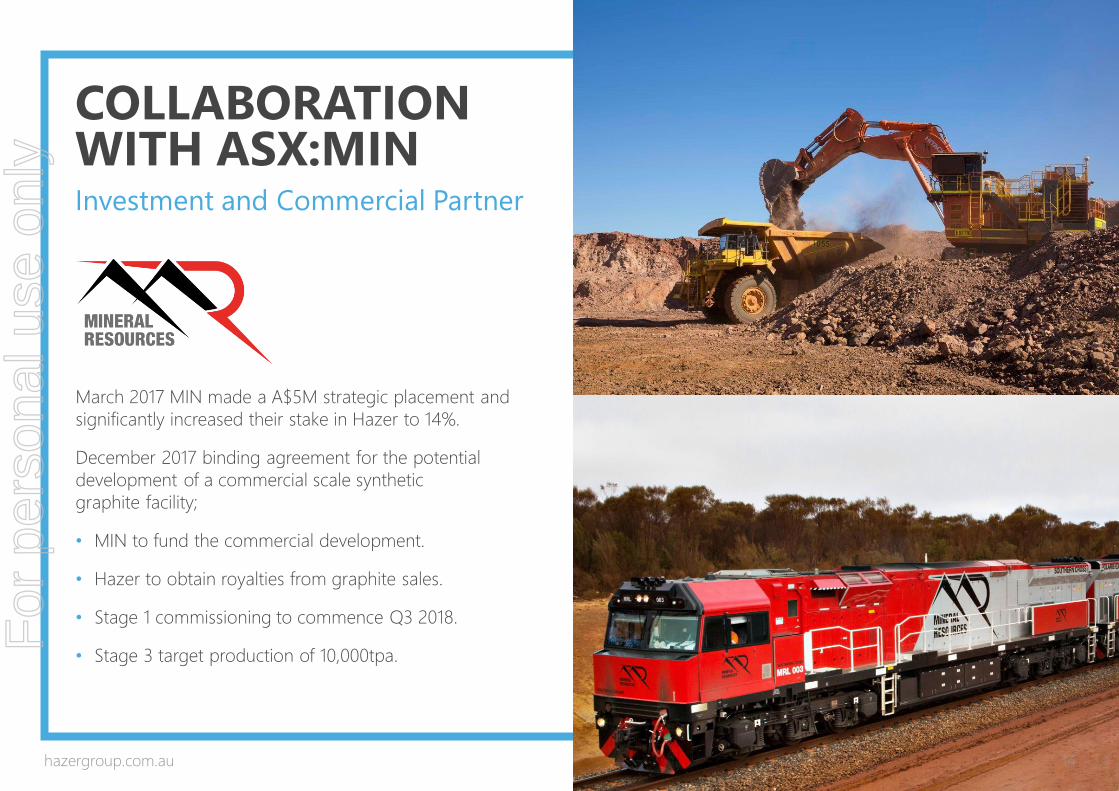
COLLABORATIONWITH ASX:MINInvestment and Commercial Partner
March 2017 MIN made a A$5M strategic placement and
significantly increased their stake in Hazer to 14%.
December 2017 binding agreement for the potential
development of a commercial scale synthetic
graphite facility;
• MIN to fund the commercial development.
• Hazer to obtain royalties from graphite sales.
• Stage 1 commissioning to commence Q3 2018.
• Stage 3 target production of 10,000tpa.
14hazergroup.com.au
For
per
sona
l use
onl
y

MULTIPLE REACTOR OPTIONSUsing Hazer Process
MRL/HZR Reactor
Paddle Tube Reactor
PTR
Reactor tailored towards
production of high purity
graphite for battery
applications with good
hydrogen potential.
Hazer Reactor
Fluidised Bed Reactor
FBR
Reactor flexibility allowing
for a range of graphite
purity options and high
hydrogen production
with best productivity
for reactor size.
External Reactor
Rotary Tube Reactor
RTR
Alternative off the shelf
reactor design identified for
a range of graphite purity
options, medium hydrogen
production but lower
productivity for reactor size.
15hazergroup.com.au
For
per
sona
l use
onl
y
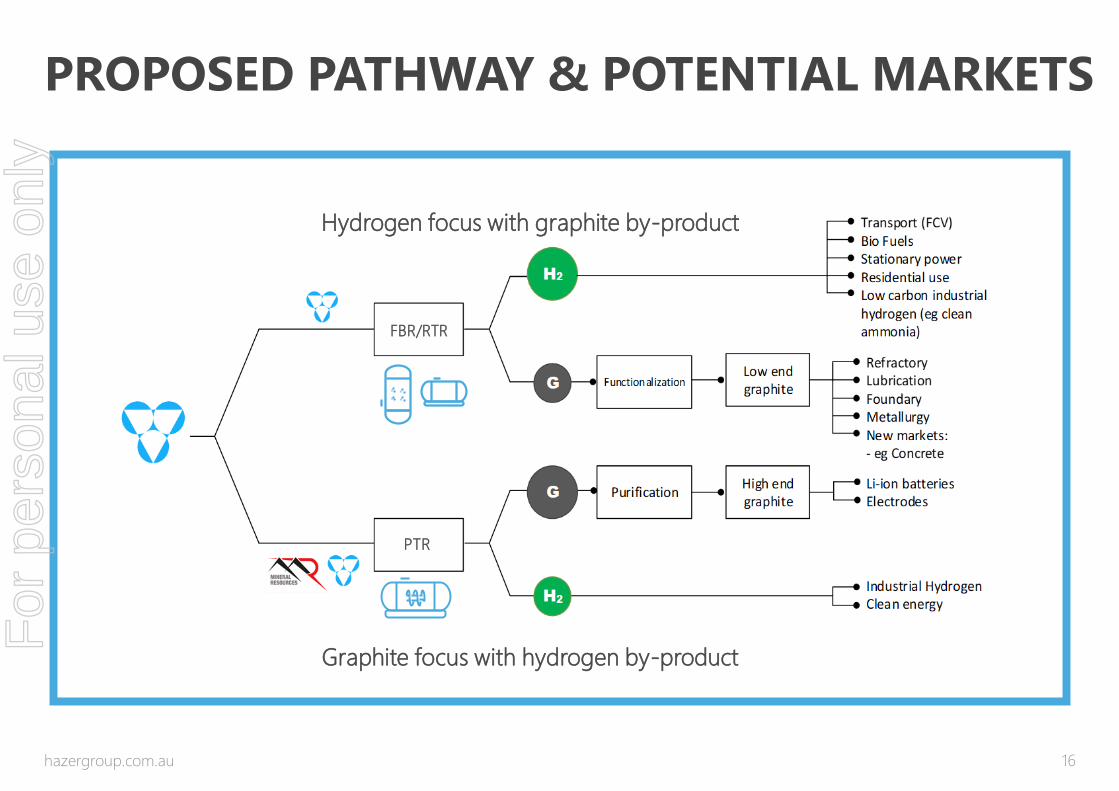
PROPOSED PATHWAY & POTENTIAL MARKETS
16hazergroup.com.au
FBR/RTR
PTR
Hydrogen focus with graphite by-product
Graphite focus with hydrogen by-product
For
per
sona
l use
onl
y

SCALE UP TECHNICAL DEVELOPMENT
17hazergroup.com.au
^ Actual equivalent graphite capacity rate achieved (unpurified)* Nominal graphite target capacity (unpurified)a Nominal graphite target capacity (purified)
These rates are given in terms of graphite capacity for comparative purposes only. Each plant will inherently produce hydrogen in addition to graphite. The ratio of hydrogen to graphite is approximately 1:4.
FBRLab scale
1ST Gen FBRPre-Pilot Plant
2nd Gen FBRPre-Pilot Plant
FBR/RTRDemonstration
Plant
RTR
PTRPilot Plant
PTRDemonstration
Plant
Q3 2018 TBA - 2019/2020
Q3 2018PTR
Commercial Plant
1 kg/day^ ~100 - 500 kg/day*
1000 t/yeara10,000 t/yeara
FBR
Q3 2018
FBR
4.5 kg/day^
4.8 kg/day^ 4 - 10 kg/day*
5 - 20 kg/day*
5.9 kg/day^
1 t/yeara
External testing
External testing
Fluidised Bed Reactor (FBR)
Rotary Tube Reactor (RTR)
Paddle Tube Reactor (PTR)
External testing
TBA
COMPLETED COMPLETED
RESULTS PENDING
COMPLETED
TBA
Fluidised Bed Reactor (FBR) FBR/RTRCommercial
Plant
TBA
~10 t/day*
For
per
sona
l use
onl
y

MULTIPLE COMMERCIAL OPTIONSUsing Hazer Process
License
License IP to 3rd parties and
generate high margin royalty
Partnership
Share capital & operating
costs with hydrogen or
graphite partners
Build, Own & Operate
Hazer can construct own and
operate plants and sell products
Currently investigating multiple options across different business models
18hazergroup.com.au
For
per
sona
l use
onl
y

REDUCE CASHBURN & INCREASE NEWSFLOW
Scale Up Development
• Increase production rates and product quality for PPP
• Begin design process for demonstration plant and
identify offtake potential
• Operation of 1 tpa PTR in Q4 2018 with MRL
Graphite Development
• Ongoing development in Li-
ion batteries
• Ongoing testing in other
markets
19hazergroup.com.au * Does not include major capital. Refer HZR ASX Announcement June 18 2018
Reduce Operating
Costs
• Cash burn reduced in
budget forecast to below
$1M/quarter by Q4 2018*
$
For
per
sona
l use
onl
y

STRONG LEADERSHIPCommercial, Technical, Contract & Regulatory expertise
Mr Tim GoldsmithChairman
• Over 20 years as Partner with global
professional services group PwC
• Leader of PwC’s Mining Group, and
National China Desk leader at PwC
• Over 30 years corporate and
commercial experience across
international mining and industrial
business operations
Mr Simon Rushton NED
• Executive General Manager -
Corporate Development at Mineral
Resources Limited
• 18 years global corporate experience
in financial, advisory and legal roles
• Corporate contracts including M&A
expertise within the mining sector
Ms Danielle LeeNED
• Corporate lawyer with more than 23
years’ experience shared between
private law firms and the ASX
• Main practice areas are corporate
advisory, governance and equity
capital markets; regularly advises on
issues relating to the Corporations
Act and ASX Listing Rules
Dr Andrew Harris NED
• Lead Director of the Engineering
Excellence Group, Laing O’Rouke
• Professor of Chemical and
Biomolecular Engineering at the
University of Sydney
• Previously the CTO of Zenogen, a
hydrogen production technology
company, and a co-founder of Oak
Nano, a start-up commercialising
novel carbon nanotube technology
20hazergroup.com.au
For
per
sona
l use
onl
y

Substantial Shareholders
Top 20 ex substantial
shareholders holding >5%
Mineral Resources Ltd
Geoff Pocock Entities
Andrew Cornejo
Other
TIGHTLY HELD REGISTERTop 20 own 42%
Capital Structure
Current Shares on Issue 88.3m
Market Capitalisation @$0.265 $23.4m
Cash @ 31 March 2018 $7m
Total Options 68.4m
<$0.30 Options Exercise Dec 2018 30.2m
Diluted Market Cap (<$0.30 options) $31.4m
Total Cash From <$0.30 Options Exercise Dec 2018 $8.8m
Total Cash From all options $33.6m
Share Price & Volume
21hazergroup.com.au
0.0
0.1
0.2
0.4
0.5
0.6
0
0.5
1
1.5
2
2.5
3
3.5
24
-Ju
l-1
7
21
-Au
g-1
7
18
-Se
p-1
7
16
-Oct-
17
13
-Nov-1
7
11
-Dec-1
7
08
-Ja
n-1
8
05
-Fe
b-1
8
05
-Ma
r-18
02
-Ap
r-1
8
30
-Ap
r-1
8
28
-Ma
y-1
8
25
-Ju
n-1
8
23
-Ju
l-1
8
Share
pric
e ($
)Volu
me (
m)
Volume Period average volume Share Price
For
per
sona
l use
onl
y

Why Invest?
Disruptive, global and scalable low cost low energy solution to a Decarbonised
hydrogen future.
Technical development successfully progressed to enable transitioning into
commercial phase with a strong focus on additional partnerships and offtake
Multiple potential revenue streams.
22hazergroup.com.au
For
per
sona
l use
onl
y

DISCLAIMERImportant Information
This presentation has been prepared by Hazer Group Limited (“Hazer” or “the Company”)
This presentation is not a financial product or investment advice or recommendation, offer or invitation by any person or to any
person to sell or purchase securities in Hazer in any jurisdiction. This presentation contains general information only and does
not consider the investment objectives, financial situation and needs of individual investors. Investors should make their own
independent assessment of the information in this presentation and obtain their own independent advice from a qualified
financial adviser having regard to their personal objectives, financial situation and needs before taking any action
No representation or warranty, express or implied, is made as to the accuracy, completeness, reliability or adequacy of any
statements, estimates, opinions or other information, or the reasonableness of any assumption or other statement, contained in
this presentation. Nor is any representation or warranty (express or implied) given as to the accuracy, completeness, likelihood of
achievement or reasonableness of any forecasts, prospective statements or returns contained in this presentation. Such
forecasts, prospective statements or returns are by their nature subject to significant uncertainties and contingencies, many of
which are outside the control of Hazer
To the maximum extent permitted by law, Hazer and its related bodies corporate, directors, officers, employees, advisers and
agents disclaim all liability and responsibility (including without limitation any liability arising from fault or negligence) for any
direct or indirect loss or damage which may arise or be suffered through use or reliance on anything contained in, or omitted
from, this presentation. An investment in Hazer securities should be considered speculative and is subject to investment and
other known and unknown risks, some of which are beyond the control of Hazer. Hazer does not guarantee any rate of return
or the absolute or relative investment performance of Hazer securities. The distribution of this presentation including in
jurisdictions outside Australia, may be restricted by law. Any person who receives this presentation must seek advice on and
observe any such restrictions
23hazergroup.com.au
For
per
sona
l use
onl
y

HAZER GRAPHITE SHOWS PROMISE IN LI-ION BATTERIES
Preliminary testing of Hazer
graphite in coin cell Li-ion
batteries show equivalent
performance to commercial
synthetic spherical graphite.
24hazergroup.com.au
For
per
sona
l use
onl
y