
Hydrogen Peroxide as an Oxidant for Microfluidic Fuel Cells
7
Hydrogen Peroxide as an Oxidant for Microfluidic Fuel Cells Erik Kjeang, a,c, * Alexandre G. Brolo, b,c, ** David A. Harrington, b,c, ** Ned Djilali, a,c and David Sinton a,c,z a Department of Mechanical Engineering, b Department of Chemistry, and c Institute for Integrated Energy Systems, University of Victoria, Victoria, British Columbia, Canada V8W 3P6 We demonstrate a microfluidic fuel cell incorporating hydrogen peroxide oxidant. Hydrogen peroxide H 2 O 2 is available at high concentrations, is highly soluble and exhibits a high standard reduction potential. It also enables fuel cell operation where natural convection of air is limited or anaerobic conditions prevail, as in submersible and space applications. As fuel cell performance critically depends on both electrode and channel architecture, several different prototype cells are developed and results are compared. High-surface area electrodeposited platinum and palladium electrodes are evaluated both ex situ and in situ for the combination of direct H 2 O 2 reduction and oxygen reduction via the decomposition reaction. Oxygen gas bubbles produced at the fuel cell cathode introduce an unsteady two-phase flow component that, if not controlled, can perturb the co-laminar flow interface and reduce fuel cell performance. A grooved channel design is developed here that restricts gas bubble growth and transport to the vicinity of the cathodic active sites, enhancing the rate of oxygen reduction, and limiting crossover effects. The proof-of-concept microfluidic fuel cell produced power densities up to 30 mW cm -2 and a maximum current density of 150 mA cm -2 , when operated on 2 M H 2 O 2 oxidant together with formic acid-based fuel at room temperature. © 2007 The Electrochemical Society. DOI: 10.1149/1.2784185 All rights reserved. Manuscript submitted March 23, 2007; revised manuscript received August 13, 2007. Available electronically October 3, 2007. Small fuel cells have received much interest in recent years as potential power supplies for the next generation of portable elec- tronic devices. 1 Overall fuel cell performance based on two- or three-phase interface catalysis is enhanced with miniaturization, pro- vided the active surface-to-volume ratio is inversely proportional to the characteristic length. One class of microstructured power supply is microfluidic fuel cells, 2-16 also called laminar flow-based fuel cells and membraneless fuel cells. A microfluidic fuel cell is defined here as a device that confines all fundamental components of a fuel cell to a single microstructured manifold. An image and schematic of a microfluidic fuel cell are shown in Fig. 1. In the case of non- specific catalysts or active sites, these fuel cells exploit the charac- teristics of microfluidic co-laminar flow to separate anolyte and catholyte without the requirement of a physical barrier, i.e., mem- brane. Both streams contain supporting electrolyte that provides high conductivity for ionic transport. Interdiffusion between the two streams is restricted to an hourglass-shaped zone in the center of the channel, with maximum width at the channel walls scaling as the cube root of diffusion coefficient, channel height, downstream posi- tion, and inverse mean velocity. 17 Fuel and oxidant crossover is limited by positioning the anode and cathode on channel walls with adequate separation from the co-laminar interdiffusion zone. Given low rates of interdiffusion, the co-laminar configuration allows anolyte and catholyte compositions to be optimized independently 7 in order to improve kinetics and cell potential. Microfluidic fuel cells avoid some commonly encountered challenges in polymer electrolyte membrane-based fuel cells, 18 including membrane hu- midification control, membrane degradation, and liquid water man- agement. Proof-of-concept microfluidic fuel cells have been developed based on a variety of fuels: vanadium redox species, 2,3,11 formic acid, 6,10,14 methanol, 7,8,13 hydrogen, 9,15,16 and hydrogen peroxide. 12 The current density of these fuel cells was predominantly controlled by the rate of mass transport to the active sites, 5 typically in the cathodic half-cell. 8 Fuel cells based on dissolved oxygen were par- ticularly limited by the low solubility of oxygen 2–4 mM. 6,7,9,10 Jayashree et al. 14 developed an integrated air-breathing cathode that allows gaseous oxygen transport from the ambient air, a source of oxygen that has significantly higher diffusivity and concentration than dissolved oxygen. The highest power density of air-breathing microfluidic fuel cells to date 26 mW cm -2 14 was achieved using 1 M formic acid fuel and a graphite plate anode covered with Pd black nanoparticles. Air-breathing designs require a blank cathodic electrolyte stream that prevents fuel crossover and facilitates ionic transport between the electrodes. They are also dependent on free convection of oxygen from the ambient air which may reduce flex- ibility with respect to operating environments and scale-up opportu- nities. The performance of microfluidic fuel cells can be improved by employing aqueous oxidants that are soluble at higher concentra- tions than dissolved oxygen. For example, power densities up to 38 mW cm -2 11 and 70 mW cm -2 2 have been obtained using vana- dium redox couples as both fuel and oxidant. These redox fuel cells benefit from balanced anodic and cathodic streams. Similarly, Hase- gawa et al. 12 demonstrated a microfluidic fuel cell employing hydro- gen peroxide H 2 O 2 as both fuel and oxidant. The operation of that * Electrochemical Society Student Member. ** Electrochemical Society Active Member. z E-mail: [email protected] Figure 1. Color online Image of a microfluidic fuel cell with Pd electrodes using formic acid HCOOH fuel and hydrogen peroxide H 2 O 2 oxidant. The schematic cross-sectional view of the channel shows the interdiffusion of anolyte and catholyte that is characteristic of co-laminar flow. The chan- nels employed here were 2 mm wide and 70–170 m high, and the elec- trodes were 0.5 mm wide and 10 mm in active length. Journal of The Electrochemical Society, 154 12 B1220-B1226 2007 0013-4651/2007/15412/B1220/7/$20.00 © The Electrochemical Society B1220 Downloaded 11 Sep 2009 to 142.104.145.4. Redistribution subject to ECS license or copyright; see http://www.ecsdl.org/terms_use.jsp
Transcript of Hydrogen Peroxide as an Oxidant for Microfluidic Fuel Cells
Journal of The Electrochemical Society, 154 �12� B1220-B1226 �2007�B1220
Hydrogen Peroxide as an Oxidant for Microfluidic Fuel CellsErik Kjeang,a,c,* Alexandre G. Brolo,b,c,** David A. Harrington,b,c,**Ned Djilali,a,c and David Sintona,c,z
aDepartment of Mechanical Engineering, bDepartment of Chemistry, and cInstitute for Integrated EnergySystems, University of Victoria, Victoria, British Columbia, Canada V8W 3P6
We demonstrate a microfluidic fuel cell incorporating hydrogen peroxide oxidant. Hydrogen peroxide �H2O2� is available at highconcentrations, is highly soluble and exhibits a high standard reduction potential. It also enables fuel cell operation where naturalconvection of air is limited or anaerobic conditions prevail, as in submersible and space applications. As fuel cell performancecritically depends on both electrode and channel architecture, several different prototype cells are developed and results arecompared. High-surface area electrodeposited platinum and palladium electrodes are evaluated both ex situ and in situ for thecombination of direct H2O2 reduction and oxygen reduction via the decomposition reaction. Oxygen gas bubbles produced at thefuel cell cathode introduce an unsteady two-phase flow component that, if not controlled, can perturb the co-laminar flow interfaceand reduce fuel cell performance. A grooved channel design is developed here that restricts gas bubble growth and transport to thevicinity of the cathodic active sites, enhancing the rate of oxygen reduction, and limiting crossover effects. The proof-of-conceptmicrofluidic fuel cell produced power densities up to 30 mW cm−2 and a maximum current density of 150 mA cm−2, whenoperated on 2 M H2O2 oxidant together with formic acid-based fuel at room temperature.© 2007 The Electrochemical Society. �DOI: 10.1149/1.2784185� All rights reserved.
Manuscript submitted March 23, 2007; revised manuscript received August 13, 2007. Available electronically October 3, 2007.
0013-4651/2007/154�12�/B1220/7/$20.00 © The Electrochemical Society
Small fuel cells have received much interest in recent years aspotential power supplies for the next generation of portable elec-tronic devices.1 Overall fuel cell performance based on two- orthree-phase interface catalysis is enhanced with miniaturization, pro-vided the active surface-to-volume ratio is inversely proportional tothe characteristic length. One class of microstructured power supplyis microfluidic fuel cells,2-16 also called laminar flow-based fuelcells and membraneless fuel cells. A microfluidic fuel cell is definedhere as a device that confines all fundamental components of a fuelcell to a single microstructured manifold. An image and schematicof a microfluidic fuel cell are shown in Fig. 1. In the case of non-specific catalysts or active sites, these fuel cells exploit the charac-teristics of microfluidic co-laminar flow to separate anolyte andcatholyte without the requirement of a physical barrier, i.e., mem-brane. Both streams contain supporting electrolyte that provideshigh conductivity for ionic transport. Interdiffusion between the twostreams is restricted to an hourglass-shaped zone in the center of thechannel, with maximum width at the channel walls scaling as thecube root of diffusion coefficient, channel height, downstream posi-tion, and inverse mean velocity.17 Fuel and oxidant crossover islimited by positioning the anode and cathode on channel walls withadequate separation from the co-laminar interdiffusion zone. Givenlow rates of interdiffusion, the co-laminar configuration allowsanolyte and catholyte compositions to be optimized independently7
in order to improve kinetics and cell potential. Microfluidic fuelcells avoid some commonly encountered challenges in polymerelectrolyte membrane-based fuel cells,18 including membrane hu-midification control, membrane degradation, and liquid water man-agement.
Proof-of-concept microfluidic fuel cells have been developedbased on a variety of fuels: vanadium redox species,2,3,11 formicacid,6,10,14 methanol,7,8,13 hydrogen,9,15,16 and hydrogen peroxide.12
The current density of these fuel cells was predominantly controlledby the rate of mass transport to the active sites,5 typically in thecathodic half-cell.8 Fuel cells based on dissolved oxygen were par-ticularly limited by the low solubility of oxygen �2–4 mM�.6,7,9,10
Jayashree et al.14 developed an integrated air-breathing cathode thatallows gaseous oxygen transport from the ambient air, a source ofoxygen that has significantly higher diffusivity and concentrationthan dissolved oxygen. The highest power density of air-breathingmicrofluidic fuel cells to date �26 mW cm−2�14 was achieved using
* Electrochemical Society Student Member.** Electrochemical Society Active Member.
z E-mail: [email protected]
Downloaded 11 Sep 2009 to 142.104.145.4. Redistribution subject to E
1 M formic acid fuel and a graphite plate anode covered with Pdblack nanoparticles. Air-breathing designs require a blank cathodicelectrolyte stream that prevents fuel crossover and facilitates ionictransport between the electrodes. They are also dependent on freeconvection of oxygen from the ambient air which may reduce flex-ibility with respect to operating environments and scale-up opportu-nities.
The performance of microfluidic fuel cells can be improved byemploying aqueous oxidants that are soluble at higher concentra-tions than dissolved oxygen. For example, power densities up to38 mW cm−2 11 and 70 mW cm−2 2 have been obtained using vana-dium redox couples as both fuel and oxidant. These redox fuel cellsbenefit from balanced anodic and cathodic streams. Similarly, Hase-gawa et al.12 demonstrated a microfluidic fuel cell employing hydro-gen peroxide �H2O2� as both fuel and oxidant. The operation of that
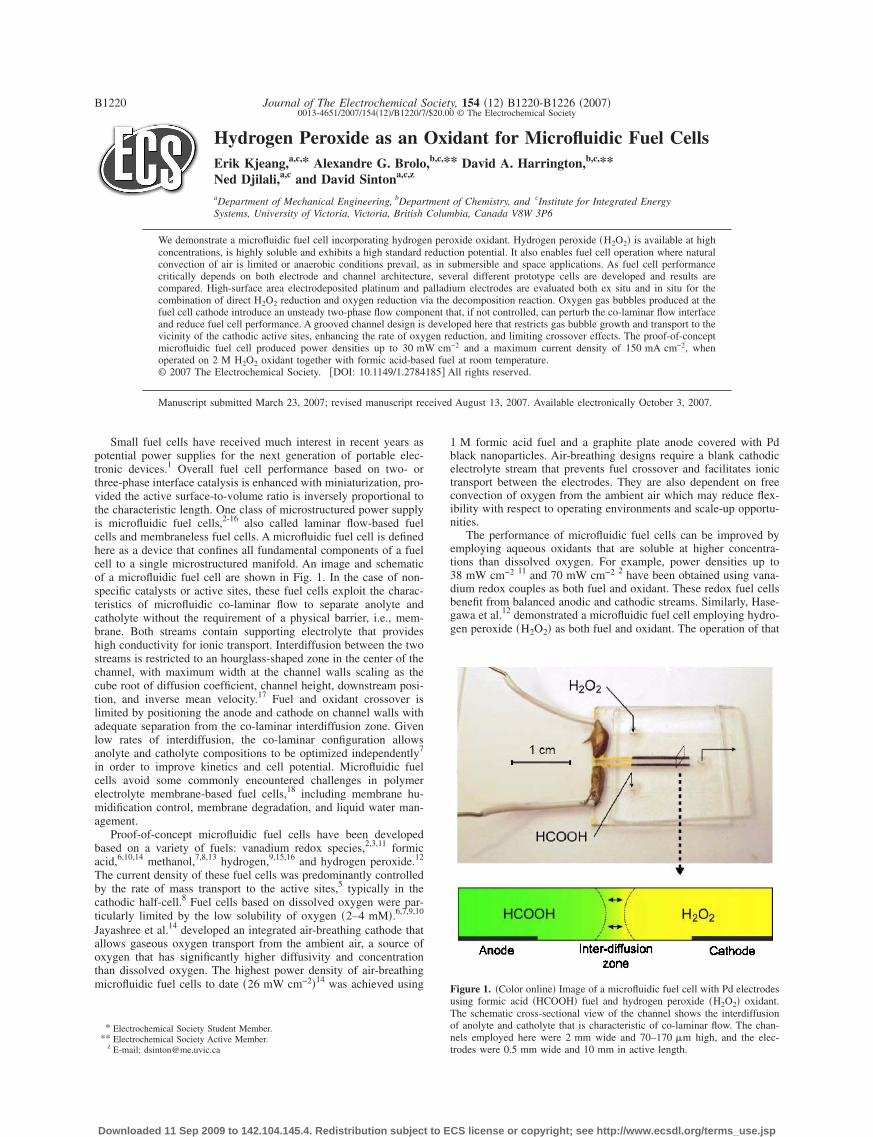
Figure 1. �Color online� Image of a microfluidic fuel cell with Pd electrodesusing formic acid �HCOOH� fuel and hydrogen peroxide �H2O2� oxidant.The schematic cross-sectional view of the channel shows the interdiffusionof anolyte and catholyte that is characteristic of co-laminar flow. The chan-nels employed here were 2 mm wide and 70–170 �m high, and the elec-trodes were 0.5 mm wide and 10 mm in active length.
CS license or copyright; see http://www.ecsdl.org/terms_use.jsp
B1221Journal of The Electrochemical Society, 154 �12� B1220-B1226 �2007� B1221
cell, however, was dependent on net consumption of supportingelectrolyte, with low overall energy density as a result.7,12 Like com-mon fuels methanol and formic acid, H2O2 is available at high con-centrations and has high solubility in aqueous media, enabling bal-anced half-cell configurations. A microfluidic fuel cell design isdeveloped here with the goal of harnessing these advantages. Estab-lished soft lithography techniques are employed for channel fabrica-tion and electrode masking. H2O2 cathodes with different catalystcompositions and surface morphologies are produced via elec-trodeposition, and their electrochemical performance is evaluatedboth ex situ in a three-electrode electrochemical cell and in situ in amicrofluidic fuel cell coupled with a generic formic acid-based an-ode.
Experimental
Electrochemistry.— Formic acid anolyte and hydrogen peroxidecatholyte of different compositions were prepared using phosphatesupporting electrolyte in Millipore Milli-Q water �Millipore, Bil-lerica, MA�. Specifically, the anolyte was prepared from potassiumhydrogen phosphate �K2HPO4; ACP Chemicals Inc., Montreal,Canada� and concentrated formic acid �HCOOH; Sigma-Aldrich,Oakville, Canada� to the desired concentrations of 1 M HCOOH in1–3 M phosphate �pH 6–8�, and the catholyte was prepared fromphosphoric acid �H3PO4; ACP� and 30% hydrogen peroxide �H2O2;EMD Chemicals Inc., Gibbstown, NJ� to 1–3 M H2O2 in 1–2 Mphosphate �pH 0–1�. All electrochemical experiments were drivenby a PARSTAT 2263 potentiostat �Princeton Applied Research, OakRidge, TN� using a Ag�AgCl �sat. KCl� reference electrode �0.190 Vvs SHE� and a platinum mesh counter electrode, where applicable.Individual electrode potentials in this article are given vs theAg�AgCl reference electrode unless otherwise stated. Planar goldelectrodes subject to catalyst electrodeposition were cleaned in pira-nha etch �3:1 w/w H2SO4:H2O2� for 2 min, followed by rinsing inMillipore water, and electrochemical cycling in 1 M hydrochloricacid �HCl; Anachemia, Montreal, Canada� between −0.5 and 0.6 Vat 100 mV s−1 for 20 cycles. Platinum �Pt� was electrodepositedfrom a near-neutral plating bath containing 1.0% w/w chloroplatinicacid �H2PtCl6; Sigma-Aldrich� and 6.0% w/w ammonium phos-phate �pH 8� prepared from ammonium hydroxide �NH4OH; EMD�and H3PO4 in Millipore water. The plating solution was heated to75°C and sonicated for 2 h until the bright yellow precipitateformed upon mixing of the constituents was fully dissolved and thesolution turned into a uniform clear orange color. Palladium �Pd�was plated from an acidic plating bath consisting of 1.0% w/w pal-ladium�II� chloride �PdCl2; Sigma-Aldrich� and 1 M HCl in Milli-pore water, dissolved as a clear brown solution after 30 min sonica-tion. The target Au electrode was immersed in the plating bath, andcharacterized by cyclic voltammetry at 50 mV s−1. Electroplatingwas carried out under potentiostatic control until the desired loadingwas deposited, assuming 60% coulombic deposition efficiency.19
The obtained electrodes were rinsed thoroughly with Millipore wa-ter before further use. Scanning electron micrographs were capturedby a Hitachi S-3500N scanning electron microscope with a tungstenfilament operated at 15 kV.
Fuel cell fabrication and testing.— Proof-of-concept microflu-idic fuel cells were assembled using in-house microfabrication tech-niques. The fuel cell shown in Fig. 1 comprises two layers: a sub-strate upon which electrodes are formed, and a polymeric top layerhousing the channel structure. The substrate was a 1 in. � 1 in.commercial 1000 Å gold slide �EMF Corp., Ithaca, NY� subject togold etching combined with photolithography to attain the desiredelectrode structure. The electrode structures were patterned withnegative photoresist �SU-8 25; Microchem, Newton, MA� over thegold, as previously reported,20 and the uncovered parts were re-moved by immersion in gold etching solution �Type TFA; TranseneCompany Inc., Danvers, MA� for 20 min and chromium etchingsolution �0.8 M K3�Fe�CN�6� in 3 M NaOH� for 1 min followed bythorough rinsing in Millipore water. The remainder of the photore-
Downloaded 11 Sep 2009 to 142.104.145.4. Redistribution subject to E
sist was removed by sonication in acetone, until the desired goldelectrodes were revealed. Wires were attached to the electrodes us-ing conductive epoxy �Circuit Works CW2400; ITW Chemtronics,Kennesaw, GA� prior to catalyst electrodeposition. The T-channelstructure required for the co-laminar flow was molded in poly�di-methylsiloxane� �PDMS; Dow Corning, Midland, MI�, followingestablished soft-lithographic protocols21 and in-house developedprocedures.22 Ports for fluid handling were punched in the PDMSprior to assembly. The electrodeposited substrate and PDMS channelstructure were plasma treated �PDC-32G; Harrick Sci., Pleasantville,NY� for 30 s to yield silanol surface groups that covalently bindglass to PDMS and render hydrophilic channel walls. When the twowere aligned under a microscope and brought into contact, an irre-versible seal was obtained.
Steady co-laminar flow of aqueous fuel and oxidant solutionsrequired for fuel cell operation was driven by a syringe pump �PHD2000; Harvard Apparatus, Holliston, MA� via Teflon tubing �Up-church Sci., Oak Harbor, WA�. Polarization data were obtained atroom temperature by chronoamperometry under stepwise potentio-static control from 0.0 V to the open-circuit voltage by 0.1 V incre-ments. The cell current was monitored for 60 s at each potential toensure steady state conditions. Current densities and power densitiesreported here were time averaged over the 60 s measurement inter-val and calculated based on the planar active area of the electrodes�0.05 cm2�.
Results and Discussion
The half-cell reaction scheme for a cathode based on hydrogenperoxide in acidic media includes a combination of direct hydrogenperoxide reduction and indirect oxygen reduction following decom-position. The reactions and associated standard potentials at 298 Kare23
H2O2 + 2H+ + 2e− � 2H2O E° = 1.776 V vs SHE �1�
H2O2 � O2 + 2H+ + 2e− E° = 0.682 V vs SHE �2�
O2 + 4H+ + 4e− � 2H2O E° = 1.229 V vs SHE �3�The standard potential for direct hydrogen peroxide reduction, Re-action 1, is more positive than most other oxidizers �e.g., oxygen orpermanganate�, therefore potentially establishing a higher electro-motive force for fuel cell operation. However, the oxidation of per-oxide to oxygen, Reaction 2, is facile on both Pt and Pd, and bothReactions 1 and 2 occur together. The effect of this is that the opencircuit potential is a mixed potential, occurring at about 0.85 V onPt in acid solution. Net reduction of hydrogen peroxide occurs onlynegative of this, so the actual overpotential for direct hydrogen per-oxide reduction is relatively high. The combination of the two reac-tions is the catalyzed decomposition of hydrogen peroxide to oxy-gen and water, 2H2O2 → 2H2O + O2. �The uncatalyzed reaction,not requiring a Pt or Pd surface, is very slow on the time scale ofthese experiments.� Downstream recapture of O2 and its reduction towater, Reaction 3, can reduce some of the losses from Reaction 2.
In order to evaluate the feasibility of hydrogen peroxide oxidantfor microfluidic fuel cells, a suitable anodic half cell that does notconstrain the overall fuel cell performance was required. Anodicsystems based on formic acid have previously exhibited relativelyhigh performance in terms of both current density and power densityin microfluidic fuel cells14 as well as polymer electrolyte membranefuel cells based on liquid fuels, such as the direct formic acid fuelcell.24 The half-cell reaction and standard potential at 298 K of aformic acid-based anode are23
CO2 + 2H+ + 2e− � HCOOH E° = − 0.199 V vs SHE �4�A fuel cell based on hydrogen peroxide reduction and formic acidoxidation thus has a standard cell potential of 1.975 V.
Electrocatalytic analysis.— Pure Pt and Pd electrodes wereplated on gold and the electrochemical response of the deposits was
CS license or copyright; see http://www.ecsdl.org/terms_use.jsp
B1222 Journal of The Electrochemical Society, 154 �12� B1220-B1226 �2007�B1222
characterized ex situ in typical formic acid and hydrogen peroxidesolutions. Bath electroplating generally progresses via a three-dimensional nucleation and growth model.25 Nucleation can be ei-ther instantaneous or progressive: for instantaneous nucleation, allnuclei form at the same instant and grow with time; for progressivenucleation, on the other hand, new nuclei are formed as older nucleigrow and overlap. Since nucleation usually occurs at defects, dislo-cations, or edges, it is possible to control this behavior and synthe-size specific morphologies by using substrates with known surfacestructure. The shape and size of the deposit also depends on kineticparameters, e.g., whether the process is rate controlled or masstransport controlled. By careful tuning of the overpotential, one canobtain fractal growth leading to high surface area deposits.19 Thecombination of the high catalytic surface area and the absence ofadhesive agent �e.g., Nafion� makes this tuned electroplating meth-odology particularly suitable for microfluidic fuel cell applications.
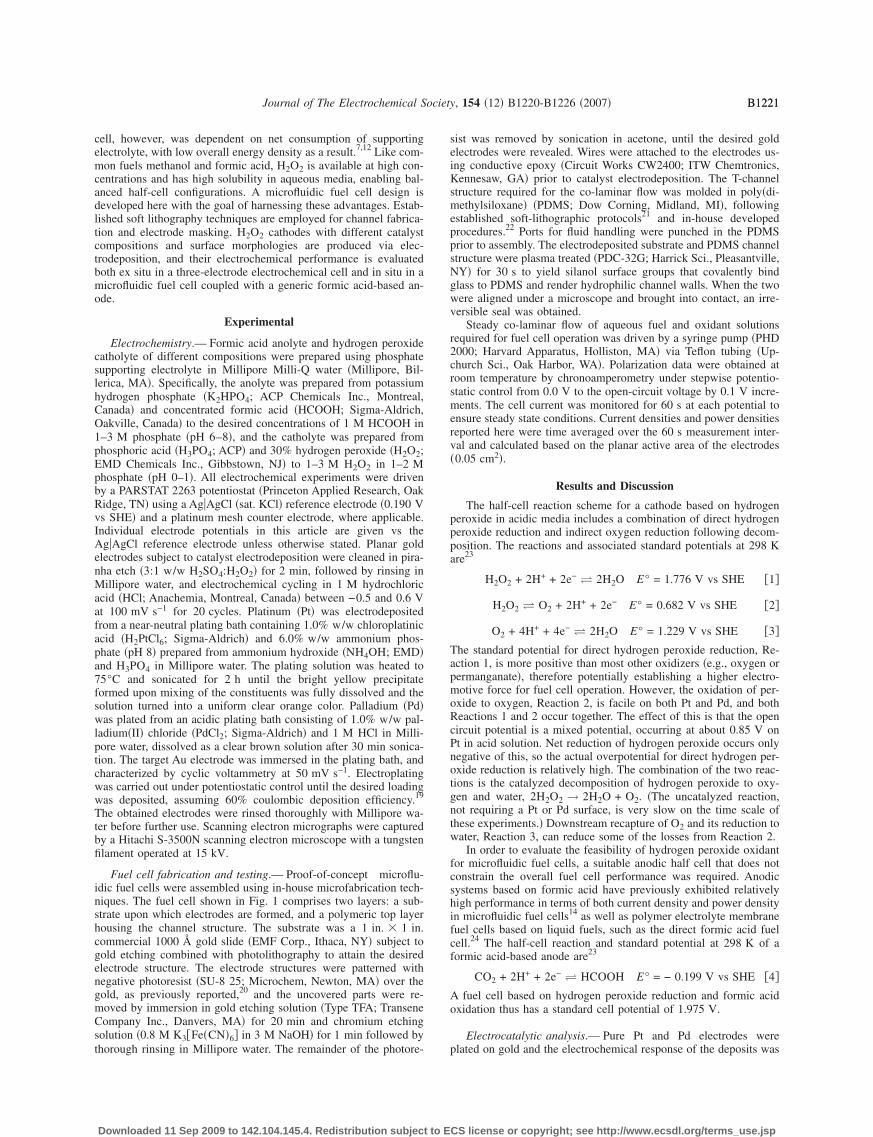
Cyclic voltammograms shown in Fig. 2 were measured for Ptand Pd electrodeposition on planar Au electrodes from the open-circuit potential �OCP; 0.35 V� to −0.70 V �Pt�, and from OCP�0.36 V� to −0.10 V �Pd�. The large potential shift between the twocurves was primarily caused by the pH difference of the platingbaths. Deposition of Pt was expected to start around −0.3 V, with anincreasing current toward the peak at −0.5 V. This is a well-knowncharacteristic for nucleation and diffusion controlled growth.19 Atthe peak, the active sites available on the WE surface limit thedeposition current, forcing it back down toward a steady, diffusion-limited value. However, at −0.6 V there was a sharp increase incurrent due to the onset of hydrogen evolution, which concealed thedeposition current. At these potentials, co-deposition of hydrogentook place, which can interfere with the quality and efficiency of thePt deposition. As shown in Fig. 2, operation at near-neutral pH en-abled the separation of Pt deposition and hydrogen evolution, a fea-ture that was not possible in acidic solution due to the positive shiftof the hydrogen standard potential. The plating bath employed forPd was of a standard acidic type, in which it was not possible tocompletely separate Pd deposition and hydrogen evolution peaks�Fig. 2�. An alkaline plating bath for Pd �not shown here� was alsoevaluated, however, the obtained catalyst structures had lower elec-trocatalytic activity than the ones from the more commonly usedacidic bath.
The electrodeposition of Pt and Pd was carried out under poten-tiostatic control at −0.5 V and 0.0 V, respectively, where the depo-
Figure 2. �Color online� Cyclic voltammograms for Pt and Pd electrodepo-sition on planar Au electrodes, measured at 50 mV s−1 scan rate �fourth cycleshown�.
Downloaded 11 Sep 2009 to 142.104.145.4. Redistribution subject to E
sition current was essentially transport limited in both cases andhydrogen co-deposition was negligible. The deposition charge wasmonitored until the desired catalyst loading was obtained�0.5–10 mg cm−2�. The current generally increased with time,which corresponded to the growth of the active surface area duringthe plating process. Figure 3 shows scanning electron micrographsof the obtained surface morphologies. The Pt morphology �Fig. 3a�
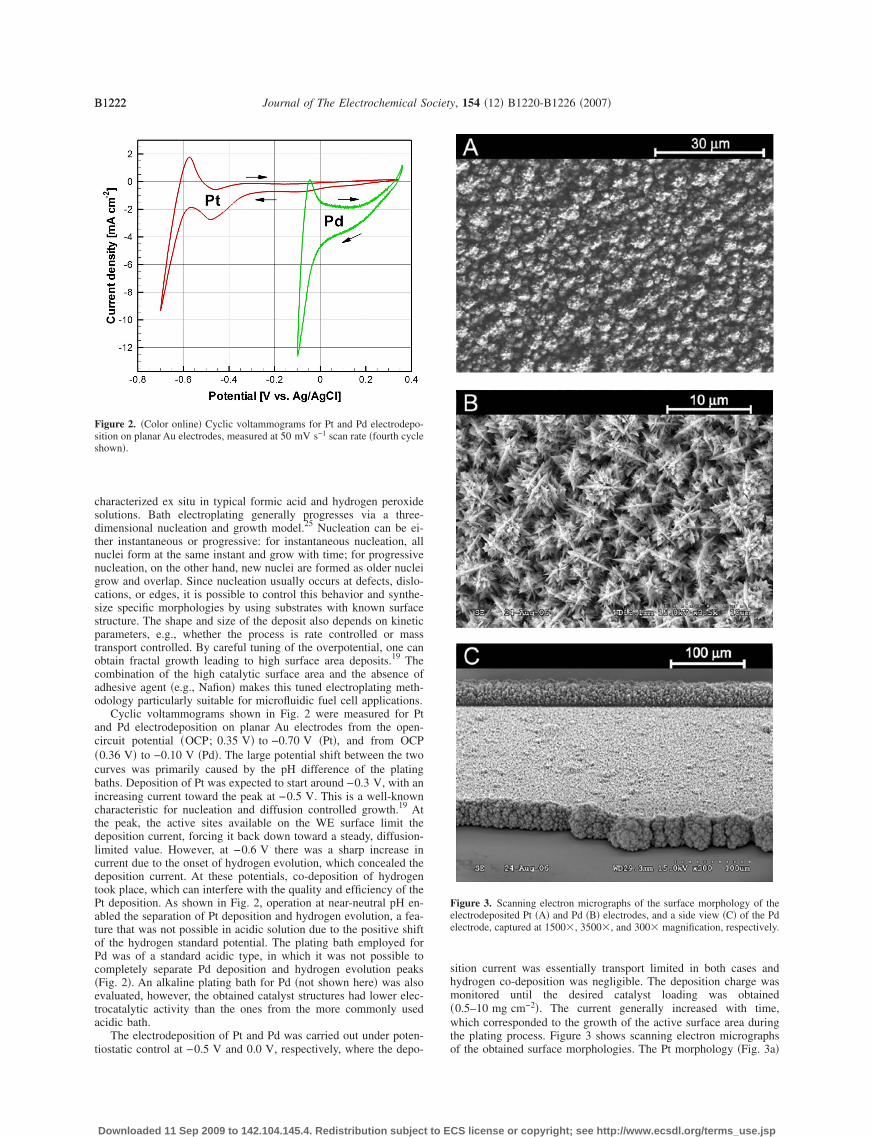
Figure 3. Scanning electron micrographs of the surface morphology of theelectrodeposited Pt �A� and Pd �B� electrodes, and a side view �C� of the Pdelectrode, captured at 1500�, 3500�, and 300� magnification, respectively.
CS license or copyright; see http://www.ecsdl.org/terms_use.jsp
B1223Journal of The Electrochemical Society, 154 �12� B1220-B1226 �2007� B1223
was quite smooth with uniformly distributed grains and pores on theorder of a few micrometers. The Pd surface structure �Fig. 3b� ex-hibited a more distinct fractal character with large features on theorder of micrometers as well as features on the order of hundreds ofnanometers and smaller. The active surface areas of the obtained Pdelectrodes were therefore generally higher than for the Pt deposits.The expanded view of the Pd electrode �Fig. 3c� shows preferredgrowth at the edges of the gold and at some defects in the center,which reflects nucleation and diffusion-controlled fractal growth.Moreover, the edges of the electrode are exposed to a higher rate ofdiffusive transport that further promotes local growth undertransport-limited plating conditions. The edge formations were�40 �m high in the case of 5 mg cm−2 Pd loading.
The electrocatalytic activity of the Pt and Pd electrodes towardhydrogen peroxide reduction and formic acid oxidation was ana-lyzed by cyclic voltammetry and chronoamperometry. Polarizationdata for individual electrode performance in a three-electrode elec-trochemical cell containing either H2O2 or HCOOH in phosphateelectrolyte are shown in Fig. 4. The potential gap between the twosets of curves indicates that this fuel and oxidant combination isfeasible for fuel cell operation. The Pt and Pd deposits were equallyeffective catalysts for H2O2 reduction. The OCP for this half cellwas relatively low, owing to the parasitic nature of Reaction 2. Theobserved rate of gaseous oxygen evolution via Reactions 1 and 2upon immersion of the electrodes in the H2O2 solution was higherfor Pd than for Pt. The activation overpotential for HCOOH oxida-tion was essentially zero. Pd showed significantly higher activitythan Pt in this case, in agreement with previous reports.24,26
Fuel cell testing.— Planar microfluidic fuel cells were fabricatedaccording to the procedure outlined in the experimental section. Thecell design is shown schematically in Fig. 1; fuel �HCOOH� andoxidant �H2O2� solutions enter the main channel via separate inletsand flow in a co-laminar configuration in parallel with the anode andcathode downstream toward the single outlet. The high-aspect ratiocross-sectional geometry of the channel �2 mm wide and70–170 �m high� with electrodes placed perpendicularly to the co-laminar flow interface delays interdiffusion of the streams and en-ables high fuel utilization.4 The supporting electrolyte provides highionic conductivity within the streams, which facilitates rapid ioniccharge transport between the electrodes. An array of different fuelcells was fabricated to study fuel cell performance as a function of
Figure 4. �Color online� Separate anode and cathode polarization data mea-sured in a three-electrode electrochemical cell with electrodeposited Pt andPd working electrodes. The anolyte was 0.2 M HCOOH in 0.2 M phosphate�pH 4� and the catholyte was 0.2 M H2O2 in 0.2 M phosphate �pH 1�.
Downloaded 11 Sep 2009 to 142.104.145.4. Redistribution subject to E
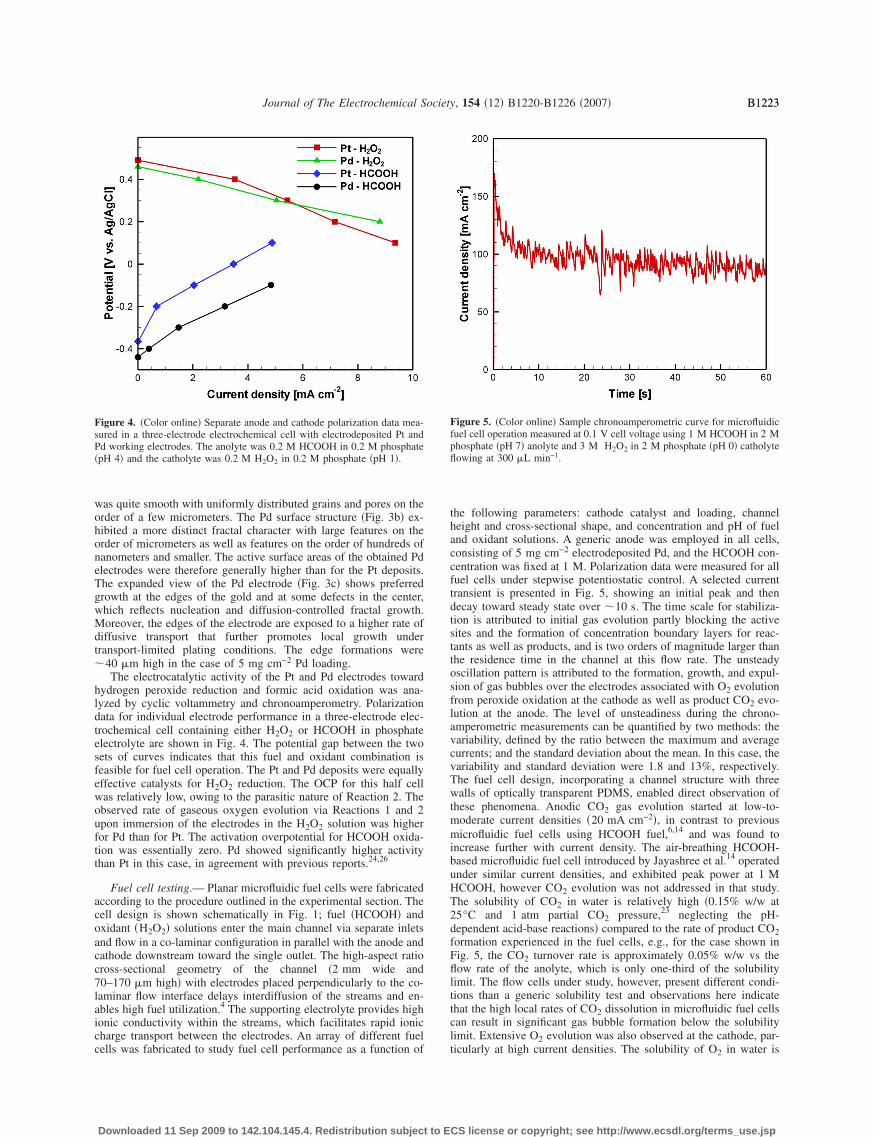
the following parameters: cathode catalyst and loading, channelheight and cross-sectional shape, and concentration and pH of fueland oxidant solutions. A generic anode was employed in all cells,consisting of 5 mg cm−2 electrodeposited Pd, and the HCOOH con-centration was fixed at 1 M. Polarization data were measured for allfuel cells under stepwise potentiostatic control. A selected currenttransient is presented in Fig. 5, showing an initial peak and thendecay toward steady state over �10 s. The time scale for stabiliza-tion is attributed to initial gas evolution partly blocking the activesites and the formation of concentration boundary layers for reac-tants as well as products, and is two orders of magnitude larger thanthe residence time in the channel at this flow rate. The unsteadyoscillation pattern is attributed to the formation, growth, and expul-sion of gas bubbles over the electrodes associated with O2 evolutionfrom peroxide oxidation at the cathode as well as product CO2 evo-lution at the anode. The level of unsteadiness during the chrono-amperometric measurements can be quantified by two methods: thevariability, defined by the ratio between the maximum and averagecurrents; and the standard deviation about the mean. In this case, thevariability and standard deviation were 1.8 and 13%, respectively.The fuel cell design, incorporating a channel structure with threewalls of optically transparent PDMS, enabled direct observation ofthese phenomena. Anodic CO2 gas evolution started at low-to-moderate current densities �20 mA cm−2�, in contrast to previousmicrofluidic fuel cells using HCOOH fuel,6,14 and was found toincrease further with current density. The air-breathing HCOOH-based microfluidic fuel cell introduced by Jayashree et al.14 operatedunder similar current densities, and exhibited peak power at 1 MHCOOH, however CO2 evolution was not addressed in that study.The solubility of CO2 in water is relatively high �0.15% w/w at25°C and 1 atm partial CO2 pressure,23 neglecting the pH-dependent acid-base reactions� compared to the rate of product CO2formation experienced in the fuel cells, e.g., for the case shown inFig. 5, the CO2 turnover rate is approximately 0.05% w/w vs theflow rate of the anolyte, which is only one-third of the solubilitylimit. The flow cells under study, however, present different condi-tions than a generic solubility test and observations here indicatethat the high local rates of CO2 dissolution in microfluidic fuel cellscan result in significant gas bubble formation below the solubilitylimit. Extensive O2 evolution was also observed at the cathode, par-ticularly at high current densities. The solubility of O in water is
Figure 5. �Color online� Sample chronoamperometric curve for microfluidicfuel cell operation measured at 0.1 V cell voltage using 1 M HCOOH in 2 Mphosphate �pH 7� anolyte and 3 M H2O2 in 2 M phosphate �pH 0� catholyteflowing at 300 �L min−1.
2
CS license or copyright; see http://www.ecsdl.org/terms_use.jsp
B1224 Journal of The Electrochemical Society, 154 �12� B1220-B1226 �2007�B1224
one order of magnitude less than for CO2,23 and thus the extensiveO2 bubble evolution is expected from H2O2 oxidation.
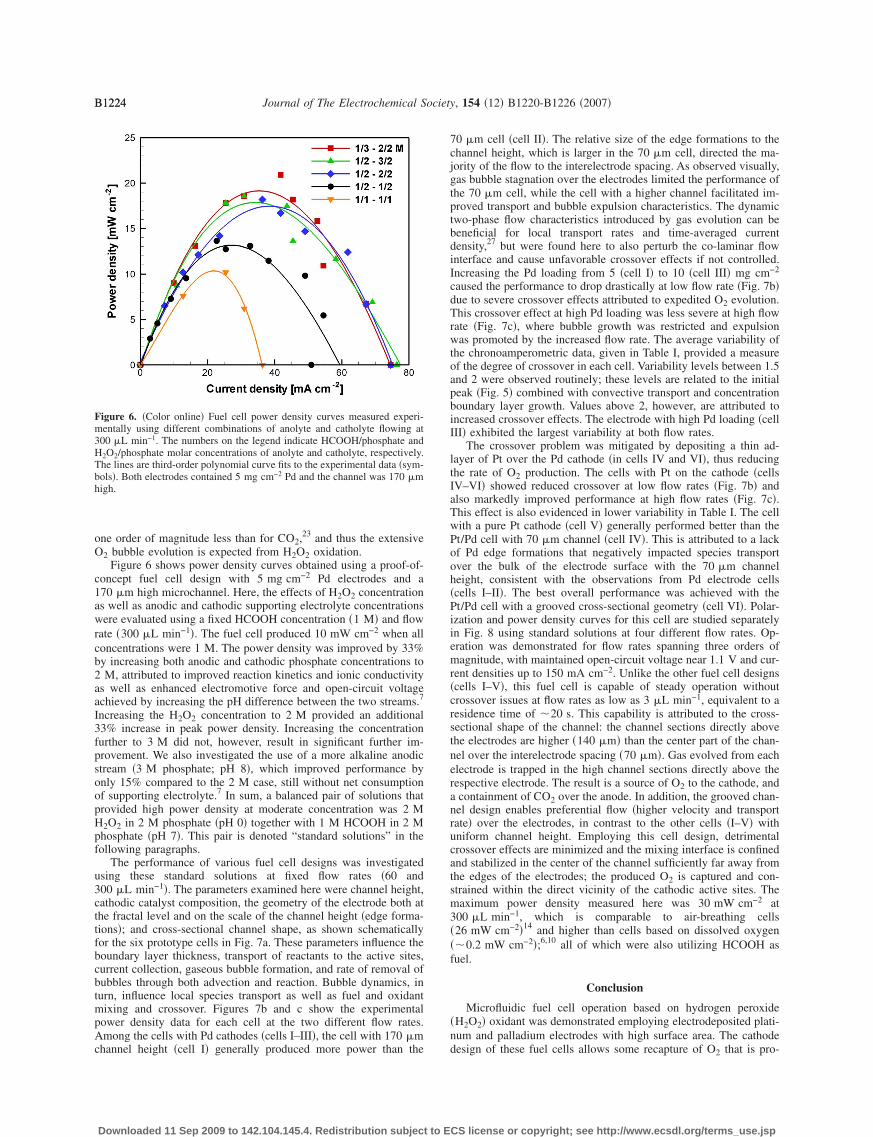
Figure 6 shows power density curves obtained using a proof-of-concept fuel cell design with 5 mg cm−2 Pd electrodes and a170 �m high microchannel. Here, the effects of H2O2 concentrationas well as anodic and cathodic supporting electrolyte concentrationswere evaluated using a fixed HCOOH concentration �1 M� and flowrate �300 �L min−1�. The fuel cell produced 10 mW cm−2 when allconcentrations were 1 M. The power density was improved by 33%by increasing both anodic and cathodic phosphate concentrations to2 M, attributed to improved reaction kinetics and ionic conductivityas well as enhanced electromotive force and open-circuit voltageachieved by increasing the pH difference between the two streams.7
Increasing the H2O2 concentration to 2 M provided an additional33% increase in peak power density. Increasing the concentrationfurther to 3 M did not, however, result in significant further im-provement. We also investigated the use of a more alkaline anodicstream �3 M phosphate; pH 8�, which improved performance byonly 15% compared to the 2 M case, still without net consumptionof supporting electrolyte.7 In sum, a balanced pair of solutions thatprovided high power density at moderate concentration was 2 MH2O2 in 2 M phosphate �pH 0� together with 1 M HCOOH in 2 Mphosphate �pH 7�. This pair is denoted “standard solutions” in thefollowing paragraphs.
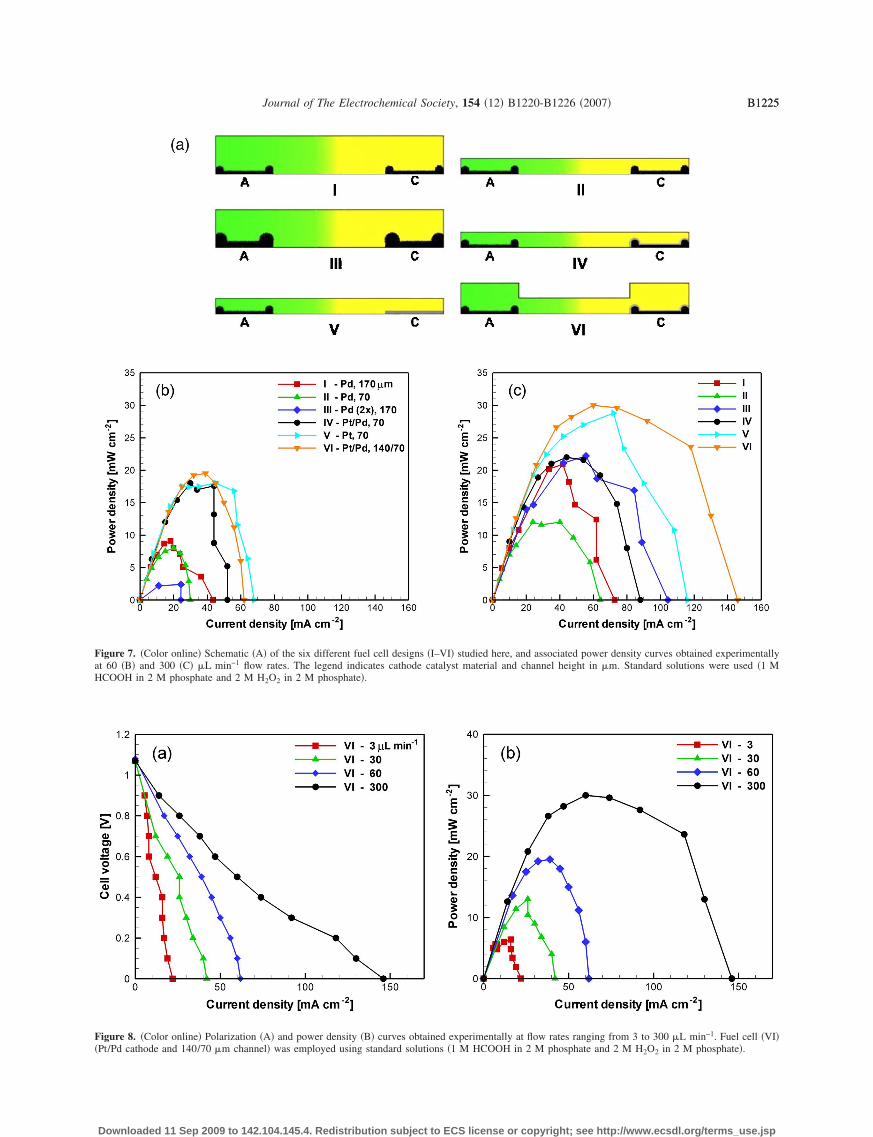
The performance of various fuel cell designs was investigatedusing these standard solutions at fixed flow rates �60 and300 �L min−1�. The parameters examined here were channel height,cathodic catalyst composition, the geometry of the electrode both atthe fractal level and on the scale of the channel height �edge forma-tions�; and cross-sectional channel shape, as shown schematicallyfor the six prototype cells in Fig. 7a. These parameters influence theboundary layer thickness, transport of reactants to the active sites,current collection, gaseous bubble formation, and rate of removal ofbubbles through both advection and reaction. Bubble dynamics, inturn, influence local species transport as well as fuel and oxidantmixing and crossover. Figures 7b and c show the experimentalpower density data for each cell at the two different flow rates.Among the cells with Pd cathodes �cells I–III�, the cell with 170 �mchannel height �cell I� generally produced more power than the
Figure 6. �Color online� Fuel cell power density curves measured experi-mentally using different combinations of anolyte and catholyte flowing at300 �L min−1. The numbers on the legend indicate HCOOH/phosphate andH2O2/phosphate molar concentrations of anolyte and catholyte, respectively.The lines are third-order polynomial curve fits to the experimental data �sym-bols�. Both electrodes contained 5 mg cm−2 Pd and the channel was 170 �mhigh.
Downloaded 11 Sep 2009 to 142.104.145.4. Redistribution subject to E
70 �m cell �cell II�. The relative size of the edge formations to thechannel height, which is larger in the 70 �m cell, directed the ma-jority of the flow to the interelectrode spacing. As observed visually,gas bubble stagnation over the electrodes limited the performance ofthe 70 �m cell, while the cell with a higher channel facilitated im-proved transport and bubble expulsion characteristics. The dynamictwo-phase flow characteristics introduced by gas evolution can bebeneficial for local transport rates and time-averaged currentdensity,27 but were found here to also perturb the co-laminar flowinterface and cause unfavorable crossover effects if not controlled.Increasing the Pd loading from 5 �cell I� to 10 �cell III� mg cm−2
caused the performance to drop drastically at low flow rate �Fig. 7b�due to severe crossover effects attributed to expedited O2 evolution.This crossover effect at high Pd loading was less severe at high flowrate �Fig. 7c�, where bubble growth was restricted and expulsionwas promoted by the increased flow rate. The average variability ofthe chronoamperometric data, given in Table I, provided a measureof the degree of crossover in each cell. Variability levels between 1.5and 2 were observed routinely; these levels are related to the initialpeak �Fig. 5� combined with convective transport and concentrationboundary layer growth. Values above 2, however, are attributed toincreased crossover effects. The electrode with high Pd loading �cellIII� exhibited the largest variability at both flow rates.
The crossover problem was mitigated by depositing a thin ad-layer of Pt over the Pd cathode �in cells IV and VI�, thus reducingthe rate of O2 production. The cells with Pt on the cathode �cellsIV–VI� showed reduced crossover at low flow rates �Fig. 7b� andalso markedly improved performance at high flow rates �Fig. 7c�.This effect is also evidenced in lower variability in Table I. The cellwith a pure Pt cathode �cell V� generally performed better than thePt/Pd cell with 70 �m channel �cell IV�. This is attributed to a lackof Pd edge formations that negatively impacted species transportover the bulk of the electrode surface with the 70 �m channelheight, consistent with the observations from Pd electrode cells�cells I–II�. The best overall performance was achieved with thePt/Pd cell with a grooved cross-sectional geometry �cell VI�. Polar-ization and power density curves for this cell are studied separatelyin Fig. 8 using standard solutions at four different flow rates. Op-eration was demonstrated for flow rates spanning three orders ofmagnitude, with maintained open-circuit voltage near 1.1 V and cur-rent densities up to 150 mA cm−2. Unlike the other fuel cell designs�cells I–V�, this fuel cell is capable of steady operation withoutcrossover issues at flow rates as low as 3 �L min−1, equivalent to aresidence time of �20 s. This capability is attributed to the cross-sectional shape of the channel: the channel sections directly abovethe electrodes are higher �140 �m� than the center part of the chan-nel over the interelectrode spacing �70 �m�. Gas evolved from eachelectrode is trapped in the high channel sections directly above therespective electrode. The result is a source of O2 to the cathode, anda containment of CO2 over the anode. In addition, the grooved chan-nel design enables preferential flow �higher velocity and transportrate� over the electrodes, in contrast to the other cells �I–V� withuniform channel height. Employing this cell design, detrimentalcrossover effects are minimized and the mixing interface is confinedand stabilized in the center of the channel sufficiently far away fromthe edges of the electrodes; the produced O2 is captured and con-strained within the direct vicinity of the cathodic active sites. Themaximum power density measured here was 30 mW cm−2 at300 �L min−1, which is comparable to air-breathing cells�26 mW cm−2�14 and higher than cells based on dissolved oxygen��0.2 mW cm−2�;6,10 all of which were also utilizing HCOOH asfuel.
Conclusion
Microfluidic fuel cell operation based on hydrogen peroxide�H2O2� oxidant was demonstrated employing electrodeposited plati-num and palladium electrodes with high surface area. The cathodedesign of these fuel cells allows some recapture of O that is pro-
2CS license or copyright; see http://www.ecsdl.org/terms_use.jsp
B1225Journal of The Electrochemical Society, 154 �12� B1220-B1226 �2007� B1225
Figure 7. �Color online� Schematic �A� of the six different fuel cell designs �I–VI� studied here, and associated power density curves obtained experimentallyat 60 �B� and 300 �C� �L min−1 flow rates. The legend indicates cathode catalyst material and channel height in �m. Standard solutions were used �1 M
HCOOH in 2 M phosphate and 2 M H2O2 in 2 M phosphate�.Figure 8. �Color online� Polarization �A� and power density �B� curves obtained experimentally at flow rates ranging from 3 to 300 �L min−1. Fuel cell �VI�
�Pt/Pd cathode and 140/70 �m channel� was employed using standard solutions �1 M HCOOH in 2 M phosphate and 2 M H2O2 in 2 M phosphate�.Downloaded 11 Sep 2009 to 142.104.145.4. Redistribution subject to ECS license or copyright; see http://www.ecsdl.org/terms_use.jsp

B1226 Journal of The Electrochemical Society, 154 �12� B1220-B1226 �2007�B1226
duced by parasitic oxidations of H2O2. We developed a membrane-less microfluidic fuel cell design with a grooved channel geometrythat �i� utilizes gas evolution and unsteady two-phase flow charac-teristics to enhance local transport rates and time-averaged currentdensity, and �ii� restricts oxygen bubble growth and expulsion to thechannel section directly above the cathode in order to enhance therate of oxygen reduction and prevent detrimental fuel and oxidantcrossover effects. Our proof-of-concept H2O2-based microfluidicfuel cell demonstrated competitive power density and current den-sity levels that were comparable to air-breathing designs and signifi-cantly higher than cells based on dissolved oxygen. In addition,H2O2-based cells are acquiescent to operation where natural convec-tion of air is limited and anaerobic conditions prevail, for example,in submersible and space applications. The performance ofH2O2-based cathodes, as well as overall fuel cell performance,would further benefit from a catalyst optimization study within theframework of a microfluidic fuel cell, including Pt and Pd nanopar-ticles and various high-surface area Au electrodes.
Acknowledgments
Funding for this research provided by the Canadian Natural Sci-ences and Engineering Research Council �NSERC� and AngstromPower, Inc., is highly appreciated.
University of Victoria assisted in meeting the publication costs of this
Table I. Average variability measured for fuel cells (I–VI) usingstandard solutions at 60 and 300 �L min−1.
Flow rate��L/min�
Variability
I II III IV V VI
60 3.1 2.1 6.5 1.8 1.6 2.0300 1.8 1.7 2.5 1.7 1.5 1.6
article.
Downloaded 11 Sep 2009 to 142.104.145.4. Redistribution subject to E
References1. C. K. Dyer, J. Power Sources, 106, 31 �2002�.2. E. Kjeang, B. T. Proctor, A. G. Brolo, D. A. Harrington, N. Djilali, and D. Sinton,
Electrochim. Acta, 52, 4942 �2007�.3. E. Kjeang, J. McKechnie, D. Sinton, and N. Djilali, J. Power Sources, 168, 379
�2007�.4. A. Bazylak, D. Sinton, and N. Djilali, J. Power Sources, 143, 57 �2005�.5. M. H. Chang, F. Chen, and N. S. Fang, J. Power Sources, 159, 810 �2006�.6. E. R. Choban, L. J. Markoski, A. Wieckowski, and P. J. A. Kenis, J. Power
Sources, 128, 54 �2004�.7. E. R. Choban, J. S. Spendelow, L. Gancs, A. Wieckowski, and P. J. A. Kenis,
Electrochim. Acta, 50, 5390 �2005�.8. E. R. Choban, P. Waszczuk, and P. J. A. Kenis, Electrochem. Solid-State Lett., 8,
A348 �2005�.9. J. L. Cohen, D. J. Volpe, D. A. Westly, A. Pechenik, and H. D. Abruna, Langmuir,
21, 3544 �2005�.10. J. L. Cohen, D. A. Westly, A. Pechenik, and H. D. Abruna, J. Power Sources, 139,
96 �2005�.11. R. Ferrigno, A. D. Stroock, T. D. Clark, M. Mayer, and G. M. Whitesides, J. Am.
Chem. Soc., 124, 12930 �2002�.12. S. Hasegawa, K. Shimotani, K. Kishi, and H. Watanabe, Electrochem. Solid-State
Lett., 8, A119 �2005�.13. R. S. Jayashree, D. Egas, J. S. Spendelow, D. Natarajan, L. J. Markoski, and P. J.
A. Kenis, Electrochem. Solid-State Lett., 9, A252 �2006�.14. R. S. Jayashree, L. Gancs, E. R. Choban, A. Primak, D. Natarajan, L. J. Markoski,
and P. J. A. Kenis, J. Am. Chem. Soc., 127, 16758 �2005�.15. S. M. Mitrovski, L. C. C. Elliott, and R. G. Nuzzo, Langmuir, 20, 6974 �2004�.16. S. M. Mitrovski, and R. G. Nuzzo, Lab Chip, 6, 353 �2006�.17. R. F. Ismagilov, A. D. Stroock, P. J. A. Kenis, G. Whitesides, and H. A. Stone,
Appl. Phys. Lett., 76, 2376 �2000�.18. E. Kjeang, N. Djilali, and D. Sinton, Microfluidic Fuel Cells, in the Encyclopedia
of Micro- and Nanofluidics, D. Li, Editor, Springer, Berlin.19. J. J. Whalen, J. D. Weiland, and P. C. Searson, J. Electrochem. Soc., 152, C738
�2005�.20. E. Kjeang, B. Roesch, J. McKechnie, D. A. Harrington, N. Djilali, and D. Sinton,
Microfluid. Nanofluid., 3, 403 �2007�.21. D. C. Duffy, J. C. McDonald, O. J. A. Schueller, and G. M. Whitesides, Anal.
Chem., 70, 4974 �1998�.22. J. T. Coleman, J. McKechnie, and D. Sinton, Lab Chip, 6, 1033 �2006�.23. CRC Handbook of Chemistry and Physics, CRC Press, Boca Raton, FL �2002�.24. Y. M. Zhu, Z. Khan, and R. I. Masel, J. Power Sources, 139, 15 �2005�.25. A. Milchev, Electrocrystallization Fundamentals of Nucleation and Growth, Klu-
wer, Boston �2002�.26. R. S. Jayashree, J. S. Spendelow, J. Yeom, C. Rastogi, M. A. Shannon, and P. J. A.
Kenis, Electrochim. Acta, 50, 4674 �2005�.
27. A. Gunther and K. F. Jensen, Lab Chip, 6, 1487 �2006�.CS license or copyright; see http://www.ecsdl.org/terms_use.jsp