Hydrogen Generation from Electrolysis DOE Award # DE-FC36 ...
83
Teledyne Energy Systems, Inc. Page 1 of 83 Hydrogen Generation from Electrolysis DOE Award # DE-FC36-04GO13028; Amendment No. A002 Final Technical Report Reporting Period: 02/01/2004 to 09/30/2007 Technical Contact: Samir Ibrahim Teledyne Energy Systems Inc. 10707 Gilroy Road Hunt Valley, MD 21031 Phone: (410) 891 2222; Fax (410) 771- 8620; E-mail: [email protected] Report Compiled by Michael Stichter E-mail: [email protected] DOE Project Officer: Lea Yancey U.S. Department of Energy EERE Hydrogen, Fuel Cells and Infrastructure Technologies Program Golden Field Office Phone: 303-275-4944 Fax: 303-275-4753 E-mail: [email protected]
Transcript of Hydrogen Generation from Electrolysis DOE Award # DE-FC36 ...

Teledyne Energy Systems, Inc. Page 1 of 83
Hydrogen Generation from Electrolysis DOE Award # DE-FC36-04GO13028; Amendment No. A002 Final Technical Report Reporting Period: 02/01/2004 to 09/30/2007 Technical Contact: Samir Ibrahim Teledyne Energy Systems Inc. 10707 Gilroy Road Hunt Valley, MD 21031 Phone: (410) 891 2222; Fax (410) 771- 8620; E-mail: [email protected] Report Compiled by Michael Stichter E-mail: [email protected] DOE Project Officer: Lea Yancey U.S. Department of Energy EERE Hydrogen, Fuel Cells and Infrastructure Technologies Program Golden Field Office Phone: 303-275-4944 Fax: 303-275-4753 E-mail: [email protected]

Teledyne Energy Systems, Inc. Page 2 of 83
Executive Summary This report is a summary of the work performed by Teledyne Energy Systems to understand high pressure electrolysis (up to 5000 psi) mechanisms, investigate and address safety concerns related to high pressure electrolysis, develop methods to test components and systems of a high pressure electrolyzer, and produce design specifications for a low cost high pressure electrolysis system using lessons learned throughout the project. Included in this report are data on separator materials, electrode materials, structural cell design, and dissolved gas tests. Also included are the results of trade studies for active area, component design analysis, high pressure hydrogen/oxygen reactions, and control systems design. Several key pieces of a high pressure electrolysis system were investigated in this project and the results will be useful in further attempts at high pressure and/or low cost hydrogen generator projects. An important portion of the testing and research performed in this study are the safety issues that are present in a high pressure electrolyzer system and that they can not easily be simplified to a level where units can be manufactured at the cost goals specified, or operated by other than trained personnel in a well safeguarded environment. The two key objectives of the program were to develop a system to supply hydrogen at a rate of at least 10,000 scf/day (25.5 kg/day) at a pressure of 5000psi, and to meet cost goals of $600/ kW in production quantities of 10,000/year. On these two points TESI was not successful. The project was halted due to concerns over safety of high pressure gas electrolysis and the associated costs of a system. At pressure approaching 5000 psi, 316 Stainless Steel vessels which are typically used in production alkaline electrolysis systems, would not be able to sufficiently contain an ignition event, if one were to occur. Designing vessels to contain such an event would add a considerable cost to the system and deviate from the cost target of the finished product.

Teledyne Energy Systems, Inc. Page 3 of 83
TABLE OF CONTENTS
Executive Summary.................................................................................................................................. 2 List of Tables ............................................................................................................................................ 5 Engineering & Safety Analyses of TESIs High-Pressure Electrolyzer .................................................... 6
Task 1.................................................................................................................................................... 6 SUMMARY...................................................................................................................................... 6
CANDIDATE SEPARATOR MATERIALS....................................................................................... 7 TESTING.............................................................................................................................................. 7
Chemical Compatibility with the Electrolyte ................................................................................... 7 Strength after Exposure to Hot Electrolyte....................................................................................... 8 Electrolyte Absorption...................................................................................................................... 8
Contact Angle ............................................................................................................................... 8 Optical Microscopy ...................................................................................................................... 8 Gas Permeability........................................................................................................................... 8 Electrical Resistance..................................................................................................................... 9 MacMullin Number & Effective Thickness ................................................................................. 9
EVALUATION AND RESULTS ........................................................................................................ 9 Chemical Compatibility with the Electrolyte ................................................................................. 10 Strength after Exposure to Hot Electrolyte..................................................................................... 10 Electrolyte Absorption.................................................................................................................... 10
Electrolyte Wicking Rate............................................................................................................ 10 Gravimetric/Volumetric Electrolyte Absorption Rate................................................................ 11
Contact Angle ................................................................................................................................. 11 Optical Microscopy ........................................................................................................................ 12 Gas Permeability............................................................................................................................. 12 Electrical Resistance....................................................................................................................... 13 MacMullin Number & Effective Thickness ................................................................................... 16
CONCLUSIONS ................................................................................................................................ 17 Task 2...................................................................................................................................................... 18
SUMMARY........................................................................................................................................ 18 SAFETY OVERVIEW....................................................................................................................... 18
Background..................................................................................................................................... 18 High Pressure Electrolyzer (System Definition) ............................................................................ 18 Approach to Safety ......................................................................................................................... 19 System Design and Development................................................................................................... 21
SAFETY STUDIES OF BENCH-TOP DESIGNS ............................................................................ 21 Results of the Failure Modes and Effects Analyses (FMEA)......................................................... 21 Results of the First HazOp Study ................................................................................................... 21 Design Changes: ............................................................................................................................. 21 Modification of the control system................................................................................................. 22 Recommendations........................................................................................................................... 24 Results of the Second HazOp Iteration........................................................................................... 24 Third HazOp Iteration..................................................................................................................... 24
Results and Conclusions ..................................................................................................................... 25 Results............................................................................................................................................. 25 Results Details ................................................................................................................................ 27 Major Recommendations Resulting From Hazop Iteration 3......................................................... 28 Revised Emergency Shutdown ....................................................................................................... 29

Teledyne Energy Systems, Inc. Page 4 of 83
Startup After Being Shutdown For Some Time: ............................................................................ 29 Acute Failure of the Separation Media:.......................................................................................... 32 Revisit Use of Pressure-Relief Valves for Ultimate Protection of Gas Separators and Modules: . 32
SUMMARY........................................................................................................................................ 33 Recommendations for Future Research.................................................................................................. 33 Comments made in Letter from DOE dated July 23, 2007 .................................................................... 34 Appendix A - Bench-top 2 System Objectives....................................................................................... 35
Benchtop System II............................................................................................................................. 35 Specifications and Objectives:........................................................................................................ 35
Appendix B - Inputs to HazOp 3. ........................................................................................................... 36 Definition of Deviations: .................................................................................................................... 36 Definition of the Risk Matrix ............................................................................................................. 37
Appendix C - Results of HazOp 3 .......................................................................................................... 38 Priority A Recommendations: ............................................................................................................ 38 Priority B Recommendations:............................................................................................................. 39 Priority C Recommendations:............................................................................................................. 39
Appendix D – Pressure Control Logic.................................................................................................... 40 Appendix E – Cell and Manifold Stress Analysis .................................................................................. 43 Appendix F – Warpage During Cell Overmolding................................................................................. 44 Appendix G – Trade Study for Active Area........................................................................................... 45 Appendix I – Receiver Tank Sizing Trade Study................................................................................... 53 Appendix J – Hydrogen-Oxygen Combustion Events in High Pressure Hydrogen Generators ............ 54 Appendix K: Gas Cross-Contamination Concentration Sensing............................................................ 66 Appendix L – Experimental Setup for Gas Solubility and Evolution in Potassium Hydroxide............. 68 Appendix M – Notes on a gas lift electrolyte circulation system........................................................... 72 Appendix N – Electrode Testing ............................................................................................................ 78
Table of Figures Figure 1: Comparative Electrolyte Uptake for Candidate Matrix Materials .......................................... 10 Figure 2: Compression vs. H2 Permeation Curve for Material F ........................................................... 12 Figure 3: Compression vs. H2 Permeation Curve for Material A........................................................... 13 Figure 4: Compression vs. H2 Permeation Curve for Material H........................................................... 13 Figure 5: Cell Potential for Matrix Materials ......................................................................................... 14 Figure 6: Cell Potential for Matrix Materials A and B at Various Thicknesses..................................... 15 Figure 7: Cell Potential for Matrix Material F at Various Compressions .............................................. 15 Figure 8: Cell Potential for Matrix Material H at Various Compressions.............................................. 16 Figure 9: P&ID 1 .................................................................................................................................... 23 Figure 10: Benchtop II - P&ID 2............................................................................................................ 26 Figure 11: Benchtop II HazOp - Initial SxL Matrix ............................................................................... 28 Figure 12: BT2 Hazop - P&ID 3 ............................................................................................................ 31 Figure 13: Ideal Current Density ............................................................................................................ 47 Figure 14: Performance at 65°C ............................................................................................................. 48 Figure 15: Performance at 85°C ............................................................................................................. 49 Figure 16: Stack Nickel Weight ............................................................................................................. 50 Figure 17: Percent Ni Weight Difference............................................................................................... 51 Figure 18: Pressure Rating...................................................................................................................... 52 Figure 19: Final Pressure vs. Hydrogen Concentration.......................................................................... 56 Figure 20: Final Temperature vs. H2 Concentration .............................................................................. 57

Teledyne Energy Systems, Inc. Page 5 of 83
Figure 21: Detonation Wave Pressure vs. H2 in O2............................................................................... 62 Figure 22: Detonation Wave Velocity vs. H2 in O2 .............................................................................. 63 Figure 23: Detonation Wave Temperature vs. H2 in O2........................................................................ 64 Figure 24: Gas Lift Circulation Loop ..................................................................................................... 73 Figure 25: Expected Electrolyte Flow for H2 Using Gas Lift................................................................ 75 Figure 26: Expected Electrolyte Flow for O2 Using Gas Lift................................................................ 76 Figure 27: Electrode Testing - Cell Voltage........................................................................................... 80 Figure 28: Electrode Testing - Cell Voltage INEOS CHLOR ............................................................... 81 Figure 29: NRK Electrochem Coated Nickel Screen SEM .................................................................... 81 Figure 30: NRK Electrochem Coated Screen EDS Results.................................................................... 82 Figure 31: C-AN Coated Nickel Screen SEM Image............................................................................. 82 Figure 32: C-AN Coated Nickel Screen EDS Results............................................................................ 83 List of Tables Table 1: Candidate Materials Tested ........................................................................................................ 7 Table 2: Summary of Potassium Hydroxide Absorption for Candidate Matrix Materials..................... 11 Table 3: Contact Angles for Candidate Matrix Materials ...................................................................... 11 Table 4: MacMullin Number and Effective Thickness for Candidate Matrix Materials ....................... 16 Table 5: Conclusions from Matrix Material Analysis ............................................................................ 17 Table 6: Breakdown by Node in P&ID 2 ............................................................................................... 27 Table 7: Press. and temperatures for gas blowdown into a 114 liter (30 gallon) receiver tank. ............ 53 Table 8: Press. and temperatures for gas blowdown into a 57 liter (15 gallon) receiver tank. .............. 53 Table 9: Final Pressure and Temperature for 4% H2 in O2 ................................................................... 58 Table 10: Final Pressure and Temperature for 94% H2 in O2 ............................................................... 59 Table 11: H2 in O2 for Maximum Final Pressure .................................................................................. 60

Teledyne Energy Systems, Inc. Page 6 of 83
Engineering & Safety Analyses of TESIs High-Pressure Electrolyzer
Task 1
SUMMARY The objectives of this study were to evaluate commercially available material, explore the development and commercialization of alternative matrix materials for use in Teledyne Energy Systems’ (TESI) next generation alkaline electrolyzers, and to test a TESI formulated membrane to characterize performance at high pressure. The underlying purpose of this study was to identify material(s) with characteristics that would support large scale manufacture, thereby providing a significant reduction in cost of the electrolysis module. This matrix evaluation study was comprehensive and exhaustive in its entirety, and was funded internally by TESI. This report presents the results of the study. There was no testing carried out at high pressure.

Teledyne Energy Systems, Inc. Page 7 of 83
CANDIDATE SEPARATOR MATERIALS Table 1: Candidate Materials Tested
ID Material A Treadwell Board B Treadwell fabric, 60 mil C Treadwell fabric, 90 mil D Asbestos E Not-disclosed F Polyramix G Porex H Tephram
The general descriptions of the material evaluated are as follows: Material A: Ryton polymer in board form. Material B: Ryton polymer in fabric form. Material C: Not tested Material D: TESIs baseline material. TESI has a lot of history with its use and this material was selected as the control sample for this study. Material E: An industrial composite that is commercially available. Material F: Composite material consisting of synthetic and naturally occurring materials. Used historically for chlor-alkali production. Material G: An all Teflon membrane material, available in different pore sizes. It is widely used in the pharmaceutical, biotech and chemical industry as a filtration media. Material H: Comprised of Teflon fiber, a second polymeric fiber and a binder, used in chlor-alkali plants.
TESTING Materials A through H (with the exception of Material C) were subjected to various tests to determine their suitability for the application. The tests are summarized below.
Chemical Compatibility with the Electrolyte

Teledyne Energy Systems, Inc. Page 8 of 83
A 2”x2” rectangular shaped sample of each candidate material was placed in 25% KOH solution (this is the electrolyte) at 95°C temperature for 24 hours. At the end of this period the samples were inspected for integrity and signs of corrosion or attack by the electrolyte.
Strength after Exposure to Hot Electrolyte At the conclusion of the above chemical compatibility tests each wet sample was hung by one edge for 24 hours. This test was intended to determine if a wet sample could fail by tear when it is under its own weight.
Electrolyte Absorption Two types of tests were conducted to evaluate electrolyte absorption characteristics for the candidate matrix materials. These tests were as follows: Electrolyte Wicking Rate A 4”x1/2” strip of each material was suspended while its lower edge was immersed in 25% KOH. The wicking or electrolyte uptake was recorded as a function of time for each sample. A sample of Material D was also tested for baseline comparison. Gravimetric/Volumetric Electrolyte Absorption Rate In these tests candidate matrix samples were weighed before and after they were soaked in the electrolyte. The difference in weight measured before and after soaking in electrolyte was the amount of electrolyte absorbed in the sample.
Contact Angle The contact angle is a measure of wetting tendency of a solid substrate by a liquid. It is the angle between the tangent line to the surface of a liquid droplet at its outer edge and the substrate under the liquid droplet. A contact angle of zero degrees represents complete wetting, while a contact angle of 180 degrees indicates the complete absence of wetting.
Optical Microscopy All five candidate materials were examined under an optical microscope for fiber and pore size/size distribution and other microstructural features specific to each material.
Gas Permeability This is the most important characteristic of a membrane material in water electrolysis, as high gas permeability leads to a cross leak of hydrogen and/or oxygen. A cross leak results in a

Teledyne Energy Systems, Inc. Page 9 of 83
contaminated/impure product and subsequently leads to the combustion of hydrogen. This test required a special instrument, which was available from our West Palm Beach, FL, R&D Division (WPB) for permeability measurements involving non-corrosive environments. A new instrument modeled after the WPB unit was built using stainless steel as construction material. This allowed hydrogen permeability measurements in a KOH environment. An 80-mesh nickel screen was installed on one side (the wet side) of the test fixture to simulate the structural support found in a typical electrolysis cell.
Electrical Resistance The electrical (Ohmic) resistance (R) of the matrix material influences the electrical power consumption in a hydrogen generator. A high electrical resistance increases the power demand in water electrolysis. To measure this characteristic a small electrolytic cell was constructed with one (1) cm2 electrode area for each of the oxygen and the hydrogen electrodes. Both electrodes were made of 80 mesh nickel screen, each spot welded to a nickel wire lead. The spacing between the electrodes is maintained by a plastic frame, which holds the two electrodes and the matrix material together. The electrolyte used was a solution of 25% KOH at 65° C and the current density was 0.5A/cm2 To evaluate a matrix material a 1cm x 1cm x 0.9mm sample of the material was placed in between the two (2) nickel screen electrodes. Throughout the test the assembly was tightly held together by the small plastic frame. The cell potential was measured every 30 minutes during the two hour long test. The average of four cell potential readings was assigned as the cell potential for the given membrane material. This value is directly related to the electrical resistance of the membrane material (R = E/I = E/0.5 = 2E). The cell potential was also determined when no matrix material was present, i.e. the reference cell potential (or resistance). This test was repeated with Material D as the matrix material to determine the baseline value.
MacMullin Number & Effective Thickness MacMullin number, NM, is the ratio of the specific resistivity of the electrolyte-saturated matrix material to the resistance of the same volume of electrolyte. A better measure of the efficiency of a separator matrix is the Effective Thickness, which is the product of MacMullin number and thickness for the matrix material (t.NM). The MacMullin number is measured through Electrochemical Impedance Spectroscopy (EIS). A low MacMullin number corresponds to a more effective separator matrix. Similarly a low effective thickness is an indicator of an effective separator material.
EVALUATION AND RESULTS The results of the tests conducted during Task 1 are presented below.

Teledyne Energy Systems, Inc. Page 10 of 83
Chemical Compatibility with the Electrolyte None of the candidate material samples showed any sign of corrosion or attack by the electrolyte during this test. All samples passed this test.
Strength after Exposure to Hot Electrolyte At the conclusion of this 24 hour test, the dry samples were inspected for any sign of failure. All candidate materials passed this test. The Material E sample showed some loss of ductility after drying.
Electrolyte Absorption
Electrolyte Wicking Rate The results of this test, depicted in Figure 1, show that Material A, B and H have the highest electrolyte wicking rates. Material G showed zero wicking rate while Material F and Material E exhibited low wicking rates. The control sample, Material D showed a moderate wicking rate.
00.5
11.5
22.5
33.5
4
0 0.2 0.4 0.6 0.8 1TIME (HOURS)
UPTA
KE
DIS
TAN
CE (I
NCHE
S) Mat. A
Mat. B (60 mil)
Mat. B (90 mil)
Mat. D
Mat. E
Mat. F
Mat. G
Mat. H
Figure 1: Comparative Electrolyte Uptake for Candidate Matrix Materials

Teledyne Energy Systems, Inc. Page 11 of 83
Gravimetric/Volumetric Electrolyte Absorption Rate
Table 2: Summary of Potassium Hydroxide Absorption for Candidate Matrix Materials
Material ID KOH Uptake (g KOH/g sample)
KOH Uptake (g KOH/cm3 of sample)
Material A 2.13 0.89 Material B 2.69 0.91 Material D 7.12 5.78 Material E 0.61 0.89 Material F
46% compressed 0.46 0.45
Material F 56% compressed
0.46 0.40
Material G 0.02 0.02
Material H, Lab produced sample
0.61 0.38
Material H, Commercially procured sample
1.22 0.74
Contact Angle Table 3: Contact Angles for Candidate Matrix Materials
Material ID Contact Angle (o) Extent of Wetting
Material A 0 Complete Material B 0 Complete Material D 0 Complete Material E 0 Complete Material F 0 Complete Material F 0 Complete Material H,
Lab produced sample 74 Moderate
Material H, Commercially procured sample
123 Poor

Teledyne Energy Systems, Inc. Page 12 of 83
Optical Microscopy Photomicrographs were prepared for each material to document their integrity and structural characteristics. All samples passed this test.
Gas Permeability The 80-mesh nickel screen installed in the test fixture was instrumental in this test, to replicate the structural support the matrix barrier would have in an electrolyzer. For example, without the nickel screen, a Material D matrix wetted by a solution of 25% KOH burst at a pressure differential of 1 to 1.5 psi. With the nickel screen, it required over 60 psi to permeate hydrogen gas. Material D matrix wetted by water and with nickel screen on one side, required a differential pressure of 40 psi to permeate hydrogen gas. The hydrogen permeability for Material E wetted with water or with 25% KOH was 70 psi and 60 psi respectively. The results for Material F, Material A and Material H are given in Figures 2, 3 and 4. All three materials are highly permeable to hydrogen gas in as received/as manufactured condition. However, for all three materials the gas permeability could be reduced when material was compressed hydraulically. Material F exhibited the highest potential for low gas permeability when compressed, followed by Material A and Material H, as shown in Figures 2 through 4.
0
2
4
6
8
10
12
14
0 10 20 30 40 50 60
% COMPRESSION
H 2 P
ERM
EATI
ON
PR
ESSU
RE (P
SI)
Figure 2: Compression vs. H2 Permeation Curve for Material F
Material B exhibited very high gas permeability and subsequent compression could not result in any improvement. No permeability test was conducted on the Material G membrane as it was eliminated as a candidate material because of its non-wetting behavior with 25% KOH solution.

Teledyne Energy Systems, Inc. Page 13 of 83
0
1
2
3
4
5
6
0 10 20 30 40 50 60 70
% COMPRESSION
H 2 P
ERM
EATI
ON
PR
ESSU
RE (P
SI)
Figure 3: Compression vs. H2 Permeation Curve for Material A
0
0.2
0.4
0.6
0.8
1
1.2
1.4
1.6
0 10 20 30 40 50 60
% COMPRESSION
H 2 P
ERM
EATI
ON
PR
ESSU
RE (P
SI)
Figure 4: Compression vs. H2 Permeation Curve for Material H
Electrical Resistance The results for various matrix materials are presented in Figure 5. Material E offers the lowest cell potential, with Material H resulting in the highest cell potential. It should be noted that higher cell potential translates to lower cell efficiency.
The results are also presented for Material A, Material B, Material F and Material H (Figures 6, 7 and 8 respectively) at various levels of compression. Higher compression levels result in higher cell potentials. For instance, the Material A at 61% compression (0.090” to 0.035”), which can handle a minimum pressure differential of 5 psi, results in a cell potential of 2.231 volts, which is 4.5% higher

Teledyne Energy Systems, Inc. Page 14 of 83
than that of Material D (2.136 volts). Material F with about 45% compression, which can accommodate a minimum pressure differential of 5 psi, results in cell potential of about 2.250 volts, which is about 5.5% higher than that of Material D. Similarly, Material H at about 55% compression, which can handle a minimum pressure differential of 1.5 psi, results in a cell potential of 2.38 volts, which is about 11.5% higher than that of Material D.
2.07
2.121
2.194
2.243 2.251
2.136
1.95
2
2.05
2.1
2.15
2.2
2.25
2.3
No Matrix Mat. D Mat. E Mat. A Mat. F Mat. H
CEL
L P
OTE
NTI
AL
(VO
LTS
)
Figure 5: Cell Potential for Matrix Materials

Teledyne Energy Systems, Inc. Page 15 of 83
2.07
2.222 2.231
2.186
2.1382.1382.136
1.95
2
2.05
2.1
2.15
2.2
2.25
No Matrix Mat. D Mat.A/0.036
Mat.B/0.060
Mat.A/0.065
Mat.A/0.070
Mat.A/0.090
CE
LL P
OTE
NTI
AL
(VO
LTS)
Figure 6: Cell Potential for Matrix Materials A and B at Various Thicknesses
2.07
2.136
2.171
2.207
2.242 2.239
2.272.254
1.95
2
2.05
2.1
2.15
2.2
2.25
2.3
NoMatrix
Mat D Mat F8%
Mat F24%
Mat F34%
Mat F39%
Mat F46%
Mat F49%
CELL
PO
TENT
IAL
(VO
LTS
)
Figure 7: Cell Potential for Matrix Material F at Various Compressions

Teledyne Energy Systems, Inc. Page 16 of 83
2.07
2.136
2.1892.169
2.198 2.213
2.382.357
2.2662.2632.261
1.9
1.95
2
2.05
2.1
2.15
2.2
2.25
2.3
2.35
2.4
2.45
No Matr
ix
Materia
l D
Mat H 0%
(P)
Mat H 20
% (P)
Mat H 38
% (P)
Mat H 45
% (P)
Mat H 50
% (P)
Mat H 55
% (P)
Mat H 0%
(L)
Mat H 26
% (L)
Mat H 36
% (L)
CELL
PO
TENT
IAL
(VO
LTS)
Figure 8: Cell Potential for Matrix Material H at Various Compressions
(P=commercial sample, L=lab produced sample)
MacMullin Number & Effective Thickness A low MacMullin number corresponds to a more effective separator matrix. Similarly a low effective thickness is an indicator of an effective separator material. The results for the MacMullin number and the effective thickness are summarized in Table 4.
Table 4: MacMullin Number and Effective Thickness for Candidate Matrix Materials Material ID MacMullin Number, NM Effective Thickness
t.NM Material A 2.23 0.53 Material B 1.85 0.35 Material D 1.75 0.45 Material E 2.87 0.17 Material F
46% compressed 11.77 1.24
Material F 56% compressed
9.16 1.18
Material H 7.22 1.29

Teledyne Energy Systems, Inc. Page 17 of 83
CONCLUSIONS Based on the results of this study, considering material compatibility, cost and availability, the following is concluded: Table 5: Conclusions from Matrix Material Analysis Material ID Conclusion Comment Relative Cost
(based on current quantities)
Material A Disqualified Availability Issue 10 Material B Disqualified Failed Gas Permeability
Test 10
Material C n/a n/a n/a Material D Baseline Control Sample 1 Material E Qualified Passed all tests 4 Material F
Disqualified Failed MacMullin
Number test. 1.5
Material G Disqualified Failed Electrolyte Wicking Test
1.25
Material H
Disqualified Failed MacMullin Number test.
1.1
Material A is a possible candidate for TESIs alkaline electrolysis matrix material, however commercial availability from the primary vendor is uncertain at the time of this study. By process of elimination, it is concluded that Material E is the best available alternative for purposes of alkaline electrolysis, including electrolysis at elevated pressures. In present-use quantities (a few hundred square feet per year) Material E is significantly more expensive than the baseline material. However, manufacture of this material in large production-volume quantities, utilizing economies of scale will alleviate this problem and contribute towards the reduction in capital costs of electrolysis equipment. After the completion of this study, in-situ testing of some of the materials evaluated in this report was conducted. These follow up tests consisted of evaluating the candidate materials in an actual (bench-top size, 0.5 L/min production rate) electrolysis module. Currently, TESI has established Material E as matrix material for use in its next generation of electrolyzers. A semi-automated, small scale production line has been set up to produce this material in-house. Continual testing is being conducted and improvements are being implemented to fine tune its properties and functionality.

Teledyne Energy Systems, Inc. Page 18 of 83
Task 2
SUMMARY The objective of this study is to contribute towards design and development of an alkaline electrolysis system, capable of producing hydrogen at up to 1500 psi, before being fed into a compressor. The ultimate delivery pressure of this system is 5000 psi. The design of this high pressure system is based on a commercially available Teledyne Energy Systems Inc. (TESI) EC model generator. The EC model, installed and operated worldwide, has an excellent track record for customer satisfaction. Basing the design on this proven product helps the engineering team keep product commercialization, reliability and cost reduction in mind, while designing a new platform. Safety is a priority among the product requirements of the high pressure electrolyzer. The developmental approach and designs to date have been conceived with this priority in mind. So far, a failure modes and effects analysis (FMEA) and various iterations of a hazard and operability analysis (HazOp) have been performed for bench-top versions of the electrolyzer. The bench-top versions are being used to acquire information on basic electrochemical behavior at high pressures and to examine safety aspects at the component and system levels. Analyses: thermal, stress, chemical, thermodynamic, etc, have been performed to support the design process and safety analyses. Safety analyses have redefined the control system and designed-in control system actuated safeguards greatly mitigate risk. A development unit termed Benchtop II was designed and assembled under this contract. Although initially built for testing purposes, no testing was performed on it due to pre-start up safety issues that came up. The Benchtop II system was not a deliverable under this contract; it was a proof-of-concept device and proved that the cost target would be a problem to attain with the desired level of safety.
SAFETY OVERVIEW
Background This project is co-funded by DOE and TESI. The key objectives of the 3-year program are to: Develop a system to supply hydrogen at a rate of at least 10,000 scf/day at a pressure of 5000 psi. Meet cost goals of $600/ kW in production quantities of 10,000/year
High Pressure Electrolyzer (System Definition) In this project, the process chosen for the production of hydrogen is electrolysis and for that TESI elected to develop an alkaline-based system, similar to the traditional TESI product line.

Teledyne Energy Systems, Inc. Page 19 of 83
TESIs EC model generator (depicted here) served as a starting point for this development work.
Approach to Safety The most significant hazard is one where there is the potential for a combustible mixture of hydrogen and oxygen and an ignition source. The most prominent scenario for this hazard is one where the separation media, (the membrane separating the hydrogen from oxygen gases) in the electrolyzer module fails during operation, thereby allowing mixing of oxygen and hydrogen, (possibly stoichiometric) while the current is being applied to the module.1 Should this ever occur, the consequence would be severe and would be aggravated by high pressure. Furthermore, the reaction propagation speed is high and increases the potential for the reaction to spread to hydrogen stored under pressure, causing further destruction. Our plan is to eliminate this hazardous scenario from occurring. Measures to mitigate the response to this hazard should it start, will be addressed at the full product design stage and include system layout, on-demand production to minimize quantities of stored gas, containment structures, etc. At the developmental stage, we will design the system to minimize the amount of stored gas and mitigate the severity of consequence. This latter approach is a routine reason for in situ generation of hydrogen in that hazards associated with storing and transportation of gas are either reduced or eliminated. In general, our safety plan is to identify all potential hazards, analyze them as to their likelihood, (L) of occurrence and severity, (S) of consequence, and then design in preventative measures and safeguards for those with the highest risk. Should a damaging event threaten or occur, the designed in safeguards would interrupt its progress and mitigate the consequences.
1 Because there is an abundance of charged radicals in the electrolyte traveling around the system and ongoing charging and discharging, there is a potential for ignition. The current inside the module provides opportunities for Joulean heating and induced discharging.

Teledyne Energy Systems, Inc. Page 20 of 83
The procedural approach involves:
• component design or selection to build safety margins between design capability and operational needs: for example, by limiting:
the operational differential pressures of the electrolyzer to well within the differential pressure capability of the cell separation media, so that in the worst case the media will not rupture.
the operational pressure to well within the pressure capability of the module itself. The pressure of the electrolyzer system will be limited as needed to give safe margins. The required final hydrogen storage pressure will be achieved by a compressor stage.
• Elimination of potential external ignition sources by use of Class1 Div 2 compliant electrical equipment and by limiting surface temperatures.
• FMEA of components (reference)
• Supporting design analyses. (reference stress analyses)
• Quality assurance in manufacture and in pressure testing of 100% of electrolyzer modules and systems.
• Automated monitoring of the process/system by a well designed control system, e.g. oxygen sensors in the hydrogen output lines and hydrogen sensors in the oxygen lines set to 50% LEL are safeguards, accompanied by rapid safe shutdown of the electrolysis process would prevent gas mixing from reaching combustible levels in chronic module degradation failure scenarios. Continuous monitoring of pressures and pressure differentials, with redundancy where appropriate will reduce risk to acceptable levels by reducing the probability of occurrence. If measured parameters exceed preset limits, the control system will activate an emergency shutdown and render the system safe. The system responds in a power outage situation in the same way as the control-system activated response.
Damage from sources external to the generator will be addressed at the product design stage and the most likely accident scenario for the product has yet to be studied and identified. The product design process will likely include mechanical protection of the module, protective enclosures for the system and stored gases, etc. The likelihood of various accidents, e.g., vehicular impact, fire, etc, depends on many factors. So far we have studied scenarios appropriate for a bench-top model in a laboratory environment. As a result of the study and accompanying analyses, the steps outlined above will be adopted, as a minimum, for both the bench-top model and the product.

Teledyne Energy Systems, Inc. Page 21 of 83
System Design and Development An initial design was developed along the lines of a conventional TESI electrolyzer (EC model), complete with a module of electrochemical cells, phase separators to separate the generated gases, O2 and H2 from the electrolyte. The electrolyte is a solution of potassium hydroxide (KOH) and water. Conventionally each cell in the module has a separation medium to prevent the remixing of O2 and H2 in the cell as the gases are liberated by electrolysis. The cells are connected in series electrically and in parallel flow-wise. The adopted approach for recirculation eliminates the cost and unreliability of two expensive electrolyte recirculation pumps and the power to drive them. The fluid motive technique used in lieu of pumps is a vapor-lift mechanism. This principle is based on the difference in density in the nearly 100% liquid downcomer tube compared to that of the vapor/liquid aggregate of the riser side. The P & ID of the initial system is attached as Figure 9.
SAFETY STUDIES OF BENCH-TOP DESIGNS
Results of the Failure Modes and Effects Analyses (FMEA) The FMEA guided component specification and selection of purchased components and factored into the design of fabricated parts. Pressure-related stress analyses were performed for the design of the fabricated parts, especially the separation tanks and the module itself.
Results of the First HazOp Study Results of Preliminary Study • design changes
• modification to the system control strategy
• recommendations:
1. strategy for experiments 2. direction of development effort.
Design Changes: The reactions in the module are:
Cathode: 4 H2O (l) + 4 e- → 2 H2 (g) + 4 OH־ (aq) Anode: 4 OH־ (aq) - 4e- → O2 (g) + 2 H2O (l) Net: 2 H2O (l) → 2 H2 (g) + O2 (g)
As can be seen hydrogen is produced at the cathode, oxygen at the anode, and water is produced in the anode side and lost in the cathode side (at twice the anode-side gain rate) with a net loss of water as shown. The design was changed to feed makeup water to the cathode (hydrogen) side of the system only, as that is the side in which water is consumed and the approach is intended to reduce the complexity of the control system. At the anode side water is produced and dilutes the concentration of
Teledyne Energy Systems, Inc. Page 22 of 83
KOH. The cathode side loses water and the KOH concentration increases so the system needs a mechanism to transfer water from the anode to the cathode2; the amount to be transferred equals the amount of make-up water. The solenoid control valves in the liquid line connecting the O2 to the H2 separator tank, (T1 and T2 respectively) which were originally closed in operation are now opened in steady-state operation to allow equalization of the KOH concentration between anode and cathode sides of the process. Unfortunately this same pipe, now with valves normally open, continuously connects both sides (O2 and H2) pressure-wise. The O2 and H2 sides of the system are always indirectly connected through the media membrane separators in the electrolyzer cells, but the differential pressure capability of the separation media is much greater than that due to difference in liquid heights in the separators, so the differential pressure issue became acute. The allowable differential pressure is very small compared to the intended operational pressure.
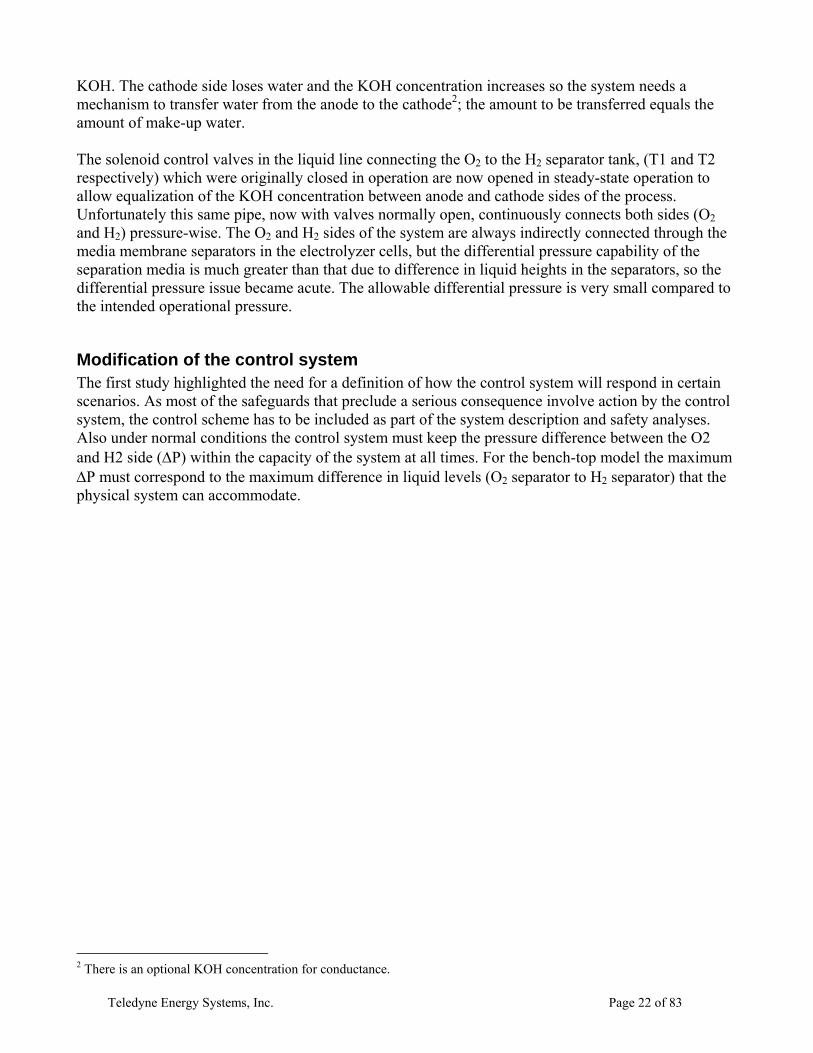
Modification of the control system The first study highlighted the need for a definition of how the control system will respond in certain scenarios. As most of the safeguards that preclude a serious consequence involve action by the control system, the control scheme has to be included as part of the system description and safety analyses. Also under normal conditions the control system must keep the pressure difference between the O2 and H2 side (∆P) within the capacity of the system at all times. For the bench-top model the maximum ∆P must correspond to the maximum difference in liquid levels (O2 separator to H2 separator) that the physical system can accommodate.
2 There is an optional KOH concentration for conductance.

HPE-061305June 13, 2005
Teledyne Energy Systems, Inc. Page 23 of 83
Figure 9: P&ID 1

Teledyne Energy Systems, Inc. Page 24 of 83
Recommendations 1. Strategy of Experiments:
It was recommended that the investigation of the pressure dependence on electrochemical performance start by a series of experiments using TESIs baseline separator in the bench-top module, when the control system is developed. TESIs baseline separator gives a more comfortable margin on ∆P and allows comparison to a 30-year database of 100 psig performance than does the use of an alternative separator. In this way risk is managed and performance with TESIs baseline separator at traditional pressures can act as a control experiment.
2. Development effort direction:
The major concern from the aspect of safety was the differential pressure issue, which makes a versatile pressure control system critical. Therefore it was recommended that the program should:
Emphasize the development of a membrane to withstand a much higher differential pressure (than at present) even if its efficiency is somewhat lowered.
Determine what the membrane DP (delta pressure) capability has to be, in a parallel effort to develop a control system to handle the pressure ramp up within the DP (using inert gases if needed.)
As a result of this study, Bench-top 1 was built to develop and test the efficacy of the control system in measuring and controlling the ∆P. It turns out that for the bench-top systems, and will probably be true for the product, that the ∆P limit is set by the system constraints on liquid-level difference rather than by the capability of the separation media. Bench-top 1 used the real differential pressure meters at design pressures and confirmed that the control system could maintain pressure control to within 3 inch of water column (WC).
Results of the Second HazOp Iteration For the second HazOp study flow conditions at each point of reference (POR) of each node were identified so that deviations from the design intent would be more easily identified. These values were transferred to the HazOp analysis software file.
Third HazOp Iteration For this iteration, the system was well defined and the system description included the control algorithm for the software. (Reference 4). This was a thorough HazOp analyses run on HPA Pro-6 software from Dyadem and using a standard HazOp template. The study initially took the conservative approach:
• Likelihood (L) of consequence was estimated without safeguards in place

Teledyne Energy Systems, Inc. Page 25 of 83
• The severity (S) of the consequence of an event was estimated without the mitigation benefit of safeguards.
This approach gives much higher risk results than the real case but shows where safeguards are most needed and their effects. For simplicity we limited the study to single faults only, i.e. only one failure (component failure or operator error) at a time. The input to this study is given as Appendix B and includes:
• Definition of deviations from design intent
• Definition of the risk matrix, values of risk from combinations of likelihood and severity of consequence,
• P&ID2.
Results and Conclusions
Results The results of the HazOp study are presented as follows:
1. Breakdown by node
2. Initial S x L Matrix
Severity (S) and likelihood (L) are quantified in discrete integers
Risk is the product of S x L (in units of consequence).
3. Major Recommendation
New emergency shutdown
Revised Nodes 11 and 12, eliminates the original level-16 risk.
4. Other recommendations
Verification of safeguards.

Teledyne Energy Systems, Inc. Page 26 of 83
Figure 10: Benchtop II - P&ID 2

Teledyne Energy Systems, Inc. Page 27 of 83
Results Details Table 6: Breakdown by Node in P&ID 2
Number of Study Items Node Description
Deviations Causes Consequences Safeguards
1. DI Water Supply up to CV1 18 50 58 57
2. CV1 to Gas Separator T2 (Hydrogen) 20 40 41 62
3. Liquid Feed To Cathode (Hydrogen) 22 57 67 58
4. Liquid Feed To Anode (Oxygen) 26 57 66 64
5. Cathode to Gas Separator T2 (Hydrogen) 20 44 56 60
6. Anode to Gas Separator T1 (Oxygen) 20 44 56 60
7. Wet H2 Feed to Dropout Tank T4 (Hydrogen) 26 60 85 80
8. Wet O2 Feed to Dropout Tank T3 (Oxygen) 26 59 84 78
9. Dropout Tank T4 KOH Return Line (Hydrogen) 24 34 32 21
10. Dropout Tank T3 KOH Return Line (Oxygen) 24 30 28 19
11. Dropout Tank T4 to H2 Vent 26 52 50 84
12. Dropout Tank T3 to O2 Vent 26 50 48 76
TOTALS 278 577 671 719

Teledyne Energy Systems, Inc. Page 28 of 83
Figure 11: Benchtop II HazOp - Initial SxL Matrix
The results show almost 250 consequences with risk equal to 1 (1 x 1). We deem this risk very low and acceptable and therefore the causes need no particular safeguards. At the opposite end of the matrix there is a risk of 16 and several of 12, 9, 8, and 6 etc. These risks need safeguards.
Major Recommendations Resulting From Hazop Iteration 3. It became clear that the control system is responsible for the majority of the safeguards. The most common safeguard was a control-system actuated shutdown and simultaneous release of pressure from both sides of the generator system. The safeguard is triggered by several inputs, e.g. high pressures, liquids out-of-level etc (see Reference 1, Control System for a table of same).

Teledyne Energy Systems, Inc. Page 29 of 83
Revised Emergency Shutdown The emergency shutdown differs from the normal shutdown process. The normal shutdown shuts off power to the module, closes the interconnecting solenoid valves between T1 and T2, and releases pressure, via solenoid valves, from each side keeping the ∆P within 3 inch of water column (WC). The pressure release is controlled through PV1 and PV2. The emergency shutdown also includes a release of pressure from both sides (O2 and H2) simultaneously by control-actuated solenoid valves. The original plan was to size the orifices of the solenoid valves to precisely control flow rates so that the ∆P would be maintained and maintaining the liquid levels in T1 and T2 would keep the gases separated until both sides were completely depressurized, thus preventing the gases from mixing to a combustible ratio (possibly stoichiometric). The HazOp process uncovered two situations where this safeguard would not work. The first one was a clog, (with a definite likelihood of a clogged filter), in either the O2 or H2 output lines. Since the blockage would be upstream of the flow control system the system could not correct the flow imbalance, i.e. unclog the line. The second situation was one where a flow element in either the O2 or H2 line fails (open when it should be closed or vice versa), and the flow valves, PV1 and PV2 cannot maintain the ∆P because flow control would be lost. This situation led to a rethink of the emergency shutdown design. The new emergency shutdown is an instant discharge of the contents of O2 side and the H2 side into separate inerted pressure controlled vessels (T5 and T6). The captured materials include the pressurized gases and entrained KOH. The revised P & ID is as shown where nodes 11 and 12 are redesigned with the new shutdown concept. The reason for inerting the collection reservoirs with nitrogen is to preclude the possibility of a combustible mixture with air (on the H2 side). The rapid depressurization also serves to relieve the threat to the integrity of the separation media in the module from high differential pressure. This approach is attractive for the Bench-top Model but it may not be practical or attractive for the product capacities. The original control bleed-down approach has not yet been validated in practice and so it remains to be resolved what design of emergency shutdown is appropriate for the product. We predict that the use of the new emergency shutdown process (which also works by default in a power outage situation) and the control system will reduce the Level 12 and Level 16 risks to Level 4. The safeguards envisioned have yet to be confirmed or validated in practice in Bench-top 2. There are three other hazard scenarios that need further investigation:
Startup after being shutdown for some time
Acute failure of the separation media
Revisit use of relief valves
Startup After Being Shutdown For Some Time: There is always a very small amount of oxygen in the hydrogen stream and vice versa from the solubility of these gases in KOH solution and the KOH solution is common to both sides of the

Teledyne Energy Systems, Inc. Page 30 of 83
electrolyzer. At the generation rates of the gases, the amount of the “wrong” gas that can come out of solution into the reservoir of the other gas is below the LEL of either mixture. The O2 in H2 sensor and the H2 in O2 sensor are used to monitor for this effect and will also detect the effects of a slow cross-over in the module. A routine scenario where this may become an issue is in the product where the volumes of gas stored in the separators are large and in the shutdown mode. At shutdown the system becomes quasi-static but the gases continue to come out of solution (albeit at a decreasing rate as the KOH cools down) and it may be possible to reach the LEL. In this mode the electrical power to the module is turned off and the electrical charges dissipating so there is a much lower probability of ignition. Nevertheless if analyses show that a mixture could reach its LEL, we could inert the stored volumes with nitrogen as is done on the larger EC products, regardless of ignition potential.

Teledyne Energy Systems, Inc. Page 31 of 83
Figure 12: BT2 Hazop - P&ID 3

Teledyne Energy Systems, Inc. Page 32 of 83
Acute Failure of the Separation Media: An accident scenario with as yet an unknown probability is one where the cross-over develops quickly while the power is applied to the module. This scenario is a more acute form of a slow cross-over scenario (combined with trace out-gassing) and is distinguished by the rate of breakdown of separation membrane in the module. Analyses to date by Borthwick (Appendix K) clearly show that in the slow leak scenario as the mixtures in the separator tanks tend towards their relative LEL, the sensors would detect that the 50% LEL set-point has been reached and shutdown the system before the LEL in either separator tank has been reached. There is a small margin for the sizes of tanks presently chosen for Bench-top 2 in that if the module mixture suddenly exceeded LEL, the present detection margins are so slim that a more acute leak in the module would be a problem. More acute is therefore a leak which would instantly produce a mixture greater than the LEL. Even with the sensors in place, there is a significant probability that the mixture upstream of the sensors could reach LEL before the sensors detect the situation. Rather than spend resources on addressing the location and /or sensitivity of the sensors (e.g. ideally the sensors would be placed on the module manifolds but such locations expose them to higher concentrations of KOH), we need to characterize media failure and improve the reliability of the media to the extent needed to mitigate the occurrence of this risk. Presently we speculate that failure of the separation medium, even gradual failure, not only provides the opportunity for the gases to mix but may also provide the means for ignition of the mixture at the site of the medium failure. See Appendix J for discussion on detonation phenomena possible with high pressure H2 and O2
Revisit Use of Pressure-Relief Valves for Ultimate Protection of Gas Separators and Modules: As a result of the first HazOp iteration the team removed the pressure relief valves from the separators (T1 and T2). It was concluded that the scenario of mixing the gases was more hazardous than a pressure burst of a separator (or piping). Now having reached a design for emergency shutdowns etc., and a control system that complements and safeguards the system, it is time to revisit the possibility of using pressure-relief valves, not as the first line of defense but the last, in that the relieving pressure is set well above the design maximum operating pressure but below the burst pressure of the pressure vessels and module. The rationale is that although the valves would not preclude mixing of gases, they would direct the flow to an area that is less hazardous in that it may be designed to be free of ignition sources and personnel. An alternative to this approach is the use of a special analog control system independent of the digital control system that would also vent both sides of the electrolyzer system to the inerted receivers (T5 and T6) presently designed for the emergency dump system. The analog dump valve would be activated by very high pressures in either the O2 or H2 sides of the system. We might also consider a high pressure actuated solenoid switch that would open the power circuit to the module.

Teledyne Energy Systems, Inc. Page 33 of 83
SUMMARY
The objective of this study was to lay the groundwork for the development of an alkaline system capable of delivering hydrogen, ultimately at 5000 psi. The starting point for this design was one of TESI’s commercially available generator, the EC model. The study has provided an Engineering Model system which will be an invaluable tool for safely studying alkaline electrolysis at elevated pressures. Some of the key conclusions of this study are summarized below.
• TESIs commercial alkaline electrolysis units operate at 100 psi. To make a one step
transition to (at or around) 1500 psi is a significant engineering task which will involve technical barriers and cost which will be best elucidated by an experimental, engineering model system, also referred to as Benchtop 2, in this report.
• It is recommended via the course of this study to design and build a Benchtop system
which operates at (or around) 500 psi and to use this model as a tool to understand system dynamics at elevated pressures.
• It is further recommended to design the Engineering Model as a versatile system which
will be able to operate at pressures greater than 500 psi with only minor modifications.
• Based on test data and lessons learned from testing of the Engineering Model system at 500 psi, it must be decided if raising the electrolysis pressure further will be feasible within the cost constraints of the delivered hydrogen, as dictated by this contract with US-Department of Energy.
• This study has presented an Engineering Model system design that can be constructed
and safely used in one of TESIs laboratories to test 500 psi alkaline electrolysis system.
_______________________________________
Recommendations for Future Research Future research must include methods of delta pressure control across the electrolysis membrane and a parallel investigation into electrolysis membranes that can resist significant delta pressure differentials. This is particularly important at high pressures because current production membranes have a delta pressure limit of approximately 1 psi. When the operating pressure is up around 5000 psi, controlling delta pressure to this 1 psi resolution becomes difficult and expensive. Another recommendation for future research is to design the reaction of a high pressure electrolysis system to an ignition event. Current technology is designed to contain the pressure wave that is generated, but attempting to do this at pressures in the 5000 psi range is not feasible within the US-DOE cost objectives.

Teledyne Energy Systems, Inc. Page 34 of 83
Comments made in Letter from DOE dated July 23, 2007 Task 1 and 2 Reports submitted 1/1/07 and 12/18/06 respectively.
1. The membrane formulations and reinforcing substrates that were tested were not identified explicitly. Response: This report includes an identifying name and description of each of the materials selected for testing. This data is proprietary and labeled as such.
2. The report does not show any characterization testing was done at high
pressure. Response:
There was no high pressure testing performed during this contract. Most of the testing was at ambient pressure with one test at 70-80 psi.
3. No information was reported on the different electrodes that were used to provide performance data. Response:
The data from testing of electrodes is attached in the Appendices.
4. The report does not provide information on the optimum pressure based on overall efficiency, cost of components, and their manufacturability. Response:
Development was stopped before this analysis was finished.
5. The report does not provide a preliminary concept for a high pressure system, preliminary specifications for a compressor, specifications for the hydrogen purification system, and cost targets for system components. Response:
Development was stopped before this analysis was finished.

Teledyne Energy Systems, Inc. Page 35 of 83
Appendix A - Bench-top 2 System Objectives
DW/SI Jan 20, 2005
Benchtop System II
Specifications and Objectives:
1. Generate gaseous H2 at 200 –1300 (+/- 10 psig) from 0-3 SLPM
2. Maintain pressure differential between cathode and anode of 3” H2O or less during startup
3. Maintain pressure differential between cathode and anode of 3” H2O or less during normal operation
4. Maintain pressure differential between cathode and anode of 10psid or less during shutdown
5. Maintain stack temperature of 65 C (+/- 5C)
6. Contain KOH with no measurable liquid discharge over life of test.
7. Maintain overboard leakage of <10 sccm when pressurized with gaseous helium at 1300 psig
8. Maintain KOH concentration at 25 wt % (+/- 2 %) over the life of the test.
9. Prevent formation of combustible environments
10. Protect facility and operator from contact with following hazards:
• Over temperature
• Electrical
11. Prevent O2 produced from contacting any material nto suitable for O2 service
12. Record following data for system analysis:
• Anode temperature inlet
• Anode temperature outlet
• Cathode temperature inlet
• Cathode temperature outlet
• Anode pressure inlet
• Cathode pressure inlet
• Differential pressure between anode gas separator and cathode gas separator
• Stack voltage
• Stack current
Note: This testing was not carried out due to safety concerns that were identified with the system prior to startup.

Teledyne Energy Systems, Inc. Page 36 of 83
Appendix B - Inputs to HazOp 3.
Definition of Deviations:
Deviations Guide Word Parameter
1. No Flow at Steady State No Flow
2. More Flow at Steady State More Flow
3. Less Flow at Steady State Less Flow
4. Reverse Flow at Steady State Reverse Flow
5. More Pressure at Steady State More Pressure
6. Less Pressure at Steady State Less Pressure
7. Higher Temperature at Steady State Higher Temperature
8. Lower Temperature at Steady State Lower Temperature
9. As Well As Composition at Steady State As Well As Composition
10. No Level at Steady State No Level
11. Higher Level at Steady State Higher Level
12. Lower Level at Steady State Lower Level
13. Other Than Composition at Steady State Other Than Composition

Teledyne Energy Systems, Inc. Page 37 of 83
Definition of the Risk Matrix
Severity Description
1 No injury or health impacts
2 Minor injury or minor health impacts
3 Injury or moderate health impacts
4 Death or severe injury
4
3
2
1
8
6
4
2
12
9
6
3
16
12
8
4
1 2 3 4
4
3
2
1
LIKELIHOOD
SEVE
RIT
Y
Likelihood Description
1 Not expected to occur during facility life
2 Could occur once during facility life
3 Could occur several times during facility life
4 Could occur on an annual basis (or more often)

Teledyne Energy Systems, Inc. Page 38 of 83
Appendix C - Results of HazOp 3
Priority A Recommendations:
Recommendations Place(s) Used - Causes Responsibility
1. Determine if Pump3 runs dry is a safety concern 1.1.1, 1.8.1 Samir
6. Calculate equilibrium temperature inside T2 with the tank empty and heater on before heater burnout 3.1.1 Ron
7. Add TC to monitor skin temperature of T2 near heater 3.1.1 Yan (software) Ron
8. Add the ability to monitor temperature difference between tanks and module and shutdown if too large a difference
3.1.3, 3.3.2, 4.1.2, 4.3.1 Yan
10. Determine likelihood of reaching LEL of oxygen in hydrogen. 3.6.2, 3.19.2 Paul
11. Verify that the location of S2 is sufficient to monitor mixture in gas separator 3.9.3, 3.21.2, 9.9.3, 9.23.3 Paul
12. Develop priming procedure for filling and draining KOH. 3.10.1, 3.22.1, 4.13.1 Ron
13. Compare DPT1 and DPT2. Compare this common differential pressure and difference between L1 and L2 3.12.5, 3.13.5, 4.11.4 Yan
14. Use Uninterrupted power supply (UPS) if no power shutdown produces intolerably high differential pressure
3.15.1, 4.15.1 Samir
15. Calculate equilibrium temperature inside T1 wth the tank empty and heater on before heater burnout 4.1.1 Ron
16. Add TC to monitor skin temperature of T1 near heater 4.1.1 Yan (software) , Ron
17. Determine likelihood of reaching LEL of hydrogen in oxygen. 4.6.2, 4.19.2 Paul
18. Verify that the location of S1 and S2 is sufficient to monitor mixture in gas separator and module 4.9.1, 4.25.1, 10.9.1, 10.23.1 Paul
19. Tie in facility H2 sensor into test stand control system (interlock) 5.1.2, 5.3.2, 5.11.2, 5.13.2 Samir
20. Ensure vent valves are properly sized 5.5.1, 6.5.1 Stu
21. Maintain module within 1500 psig 5.6.2, 5.16.2, 6.6.2, 6.16.2 Yan

Teledyne Energy Systems, Inc. Page 39 of 83
Priority B Recommendations:
Recommendations Place(s) Used - Causes Responsibility
3. Verify facilities meet specifications 1.6.1, 1.7.1, 1.13.1, 1.14.1, 1.17.1, 1.18.1, 2.10.1, 3.9.1, 9.9.1, 9.23.1
Stu
9. Check orientation of J-tube at installation 3.4.1, 4.4.1, 4.17.1 Samir
22. Quality control on module assembly, include hydrostatic test with water 5.6.2, 5.16.2, 6.6.2, 6.16.2 Pete
Priority C Recommendations:
Recommendations Place(s) Used - Causes Responsibility
2. Flush system per specifications 1.6.2, 1.13.2, 1.17.2, 2.19.1 Pete
5. Check program algorithm prior to implementation 1.5.1 Yan
25. Periodically monitor facility DI meter 5.9.3, 5.19.3, 6.9.3, 6.19.3 Pete
29. Periodic C2 and C1 filter maintenance 11.1.1 Pete
32. Perform system leak check/ pressure decay at least after each module exchange.
2.3.3, 2.6.4, 2.16.4, 11.3.5, 11.16.5, 12.3.5, 12.16.5 Pete

Teledyne Energy Systems, Inc. Page 40 of 83
Appendix D – Pressure Control Logic Benchtop II, Pressure Control Logic
Accompanying Documents: Visio file; High Pressure Electrolysis, Rev. 03/01/2005 BACKGROUND
• The system will be run in stages. • The first stage of operation is 200 psig • The maximum pressure this system will be run at is 500 psig. • The system has been designed for 1500 psig operation. • HAZOP I will encompass operation up to a maximum of 500 psig.
CONTROL HARDWARE PV1
• Proportional valve from Badger Meter • Controlled by 4-20 mA signal from data acquisition system. • Cv of 0.3 • Used on O2 side – Coarse tuning • Will use USER for SETPOINT • Will use PT1 as FEEDBACK
PV3
• Proportional valve from Badger Meter • Controlled by 4-20mA signal from data acquisition system. • (Not ordered) Cv of 0.3 – Coarse tuning • Used on H2 side • Will use PT1 for SETPOINT • Will use PT2 as FEEDBACK
PV2
• Proportional valve from Badger Meter • Controlled by 4-20 mA signal from data acquisition system. • (Not ordered) Cv of 0.03 – Fine tuning • Used on H2 side • Will use USER for SETPOINT (within x inches of water) • Will use DPT1 as FEEDBACK
DPT1
• Rosemount, differential pressure transducer • -10 to +10 inches water resolution, over 4-20mA output signal • Rated for system pressure up to 3000 psig

Teledyne Energy Systems, Inc. Page 41 of 83
PT1/PT2/PT3/PT4
• Noshok, pressure transducer • 1-500 psig range, 4-20mA output signal, accuracy: 0.25% of full scale • Rated for system pressure up to 2000 psig
SV3 and SV4 (Tank interconnect valves)
• Normally Open solenoid valves • When closed (energized), will prevent the anode and cathode KOH reservoirs from
“seeing” each other. • These valves will only open when the system has been de-energized and shut down – or-
when the anode and cathode sides have a delta pressure within x inches of water. SV5 and SV6 (System Vent Valves)
• Normally Open solenoid valves • These valves will be open when the system has been de-energized and shut down – or-
when a shutdown has been initiated. • Orifices will be located upstream of these valves to allow for a calculated
depressurization of the system, in an effort to minimize the delta pressure between the anode and the cathode.
STEADY-STATE RUN SCENARIO:
• PV1 will be controlling the O2 subsystem to the USER ENTERED pressure (eg 200 psig).
• Accuracy of the pressure transducer (PT) is +/- 0.25% of F.S (F.S of 500 psig). • So PT1 can read +/- 1.25 psig (or 198.75 psig to 201.75 psig)
• PV2 will control the H2 system to the same pressure, as registered on PT1. The error on
this will be +/-2.5 psig (cumulative error between PT1 and PT2). • At this time the DPT1 will be reading OUT OF SCALE since its max resolution is: -10
inches to +10 inches of water • Now PV2 will start searching and observing response on DPT1. • Once DPT1 comes within scale it will aim to control it within x inches of water. • Once it is within the x inches of water, SV3 and SV4 will be de-energized.
STARTUP SITUATION: Assume tanks are filled with KOH and water. We will just examine the gas controls here.
• SV3, SV4, SV5, SV6 energized (closed) • PV1, PV2 and PV3 closed

Teledyne Energy Systems, Inc. Page 42 of 83
• USER SETPOINT entered (200 psig) • Gas generation started by applying current • Allow PID controls to work, while watching |PT2-PT1| < 20 psig. • If |PT2-PT1| ever exceeds 20 psig, system will shutdown and we will come up with a new
pressurization logic (Some examples are – start out with PV1 and PV3 open –or- pressurize the system in 50psig increments…etc)
• System is now at 200 psig +/- 2.5 psig SHUTDOWN SITUATION: Anytime a shutdown is triggered (watchdog timer, system delta pressure or user activated shutdown), system will completely de-energize. This will, among other things, open SV5 and SV6 and vent the system down to ambient pressure. GENERAL NOTES:
• Control logic will be cascaded. Fine tuning valve PV2 will always default to its center position (half-open/half-closed) before the Coarse tuning valve PV3 moves.
• PV3 will only operate when PV1 and PV2 have reached their setpoints.
• The Cv s of these valve can be easily modified by dropping in a different “Cv kit” so
there may be some trial and error to get it working perfectly.

Teledyne Energy Systems, Inc. Page 43 of 83
Appendix E – Cell and Manifold Stress Analysis This is an abbreviated summary of the stress analysis done for the High-Pressure Electrolyzer cell. Desktop Engineer stress & deflection software was used. 1,500 psi was used as the tensile strength limit. This was the most conservative tensile strength number I found published by AMOCO/Solvay for the polysulfone 1700 polymer, for use in hot (80° C) water. Other values (up to 3,000 psi) are also published in their website and paper design manuals and material specifications. If it becomes critical, I will contact AMOCO/Solvay and try to get a definitive number. The cells and manifolds were analyzed as separate items. Both were treated as thick-walled cylinders with capped ends. The initial cell analysis was very conservative, and assumed no balancing pressure in the manifold cavity, given the thinnest cell wall section to be .325. This approach was discarded and the analysis was rerun, assuming equal pressures in the cell and manifold. Cases were run at 250, 500, 750 and 1,000 psi manifold pressures. Summary of Stresses Cell and Manifold 250 psi 500 psi 750 psi 1,000 psi Cell 385 810 1,235 1,665 Manifold 342 721 1,100 1,479 Only the 1,000 psi manifold pressure case exceeded the 1,500 psi tensile working stress limit. Rich Pazar May 24, 2004

Teledyne Energy Systems, Inc. Page 44 of 83
Appendix F – Warpage During Cell Overmolding This is a brief analysis of the warping problem observed when an attempt was made to make high-pressure electrolyzer cells with ABS. I have compared some of the pertinent physical properties of the polysulfone compound we are planning to use in making the high pressure electrolyzer cells with a generic ABS compound. I found the ABS properties on the World Wide Web at http://www.polymerweb.com/_datash/pcabs.html. I found properties for polysulfone in several websites, but I am using data from http://www.polymerweb.com/_datash/pso.html for this analysis. I am doing this because the units are completely consistent and it allows me to compare apples to apples. The relevant properties are shrinkage, coefficient of thermal expansion (CTE) and heat deflection temperatures. Shrinkage and CTE numbers are very similar and I believe that the differences are not significant. There is a large difference in the heat deflection temperatures that may be part of the warping problem. The heat deflection temperature @ 66 psi of ABS is 250° F. The heat deflection temperature @ 66 psi of polysulfone is 358° F. This is a difference of 108° and I believe that it is significant. The difference of the heat deflection temperatures at 264 psi is even greater. I believe that this problem has several causes. The first is that the cells are removed from the mold before the cell temperature has dropped below the critical heat deflection temperature. Since the heat deflection temperatures for polysulfone are much higher than for ABS, it may be that a polysulfone molding will have much less distortion even if there are no other changes to the molding process. In other words, a polysulfone cell will have good resistance to warping >100° hotter than an ABS cell. Another likely cause of the warping is that the cells may be cooled too rapidly when they are removed from the mold. It may help to allow the cell to cool in the mold for a longer period of time, lessening thermal shock when the cells are hit with ambient air. Warping is caused when there is a significant ∆T across a cooling part, and so a delta also exists in the heat deflection stresses across the part that corresponds to the ∆T. Anything we can do to minimize the ∆T during cool-down will help. Finally, preheating the nickel sheet prior to molding should help too. It will allow the polymer to flow through the holes in the nickel more freely and for a longer period of time. This will slow hardening of the polymer, allowing it to remelt and flow around the nickel during cool-down. It will also prevent any warping that may be caused by the cold metal insert chilling the liquid polymer when the polymer is shot into the mold. Preheating the nickel and allowing the cell to stay in the mold longer will slow the production rate and tie up the injection molding machine for a longer period of time per part. The molder may need to charge more for each part, or he may not be willing or able to do these things at all. If the molder is willing, I believe another attempt to produce cells with a molded in insert is worthwhile. Rich Pazar July 9, 2004

Teledyne Energy Systems, Inc. Page 45 of 83
Appendix G – Trade Study for Active Area Active Area Trade-off for 200 slm
The effect of active cell area on several electrolysis stack characteristics is shown in the charts below. These charts were created for a stack producing 200 slm. Standard conditions are defined as one atmosphere and 20 degrees C. The voltage and current requirements for producing 200 SLM are based on polarization data from the ART unit #1. The data used was taken on 2/23/04 and 2/24/04 for a single cell stack built with TESI in house membrane 85/10/5 membranes and standard HM nickel electrodes and flow screens. The active area of the stack tested is a nominal 50 cm2 with an active area diameter of 3.125 inches. The stack was operated in the dual-irriguous mode with a 25% KOH electrolyte flow of approximately 220 cc/min (fmi setting of 4) on the hydrogen and oxygen sides of the system. Polarization data collected at 65 and 85 degrees C was used to generate the performance charts.
Figure 13 – The ideal current density for production of 200 slm is shown for stacks of various
numbers of cells and varying active area diameter. The ideal current density is calculated according to the water electrolysis reaction, with hydrogen production directly proportional to the electrical current and number cells. Constant stack size plots of 75, 110, 150 and 200 cells are shown. The 110-cell HM stack is shown for reference as the single diamond point. The ideal current for the HM200 is 243 amps. The current density is 360 mA/cm2. The single-irriguous HM200 is actually rated at 280 amps and 417 mA/cm2.
As expected, smaller active area requires higher current density for equivalent capacity and a greater cell number allows a smaller active area for the equivalent current density at the same capacity. The chart shows possible stack configurations for current densities as high as 1000 mA/cm2. The dual-irriguous EC typically runs at 1000 mA/cm2 and ART stacks with TESI in-house membranes have also been operated at that current density.
Figure 14– Expected voltage performance for a 200 slm capacity stack operating at 65 degrees C
is plotted for the same variation of stack cell numbers and active area diameter presented in Figure 1. The voltage efficiency is based on the actual ART polarization data for the TESI in-house 85/5/10 membrane and nickel electrodes. Again, the 110-cell HM stack is shown for reference as the single diamond point. Larger active areas, from increased cell diameter or more cells, or both, lead to higher efficiencies. At increasingly larger total areas, voltage efficiencies level out at about 85% at this temperature. Current densities below 150 mA/cm2 are required to achieve this level of efficiency (refer to Figure 14).
The resulting heat loads have also been plotted on the opposite y-axis. When operating at 65 degrees C the heat loads plotted are always greater then 5kW. Active process cooling is required for heat loads of this magnitude. The heat loads increase significantly with a relatively small drop in efficiency percentage. A drop of 5% in the reference HM efficiency (78 to 73%) results in a 35% increase in heat load (11 to 15kW). In order to consider passively cooling the process, the voltage efficiency must be higher and the

Teledyne Energy Systems, Inc. Page 46 of 83
operating temperature higher to provide a larger temperature difference to the system heat sink.
Figure 15– The effect of using catalyzed electrodes and increasing the operating temperature on
both voltage performance and the resulting heat load is shown here. The basic configuration and conditions for the creation of this chart are the same as Figure 2 except the testing was done at 85 degrees C with CAN electrodes. Voltage efficiencies greater then 90% are possible and even at smaller active area diameters efficiencies can be greater then 85%.
Heat loads less then 5 kW are easily possible. Loads as low as 2kW together with a higher surface-to-sink temperature difference, could make passive process cooling a possibility. However with the performance benefits of higher temperature come the increase in material problems associated with degradation and corrosion.
Figure 16– The amount of nickel required for the various stack configurations is plotted. The
area to diameter relationship makes these simple exponential plots. The weights are based on HM electrode, flow screen and bipolar shape and thickness. Using an estimate of $15 per pound of finished nickel, the cost of nickel for the reference HM stack configuration (70 kg) is approximately $2300.
Figure 17– This is the same plot as Figure 4 except the nickel weight is expressed in a percent
difference from the HM reference (70kg). Figure 18– An estimated pressure rating is plotted for a stack of un-reinforced polysulfone cell
frames. The calculation is a simple cylindrical hoop stress using three different safety factors. The cell wall thickness is assumed to always be 1 inch. The yield strength of the polysufone was taken at 12,000 psi.
The primary trade-off in the decision on active area is between efficiency and material cost, the secondary trade-off is efficiency versus temperature. Larger active areas allow higher efficiencies, but at a higher material cost. Higher operating temperatures allow higher efficiencies with smaller active areas, but the risk associated with material degradation and corrosion (black crud) is increased. At least two additional effects, not examined here, should be considered. The use of catalyzed electrodes could further complicate the efficiency versus material cost trade-off. Secondly, the risk associated with longer stacks needs to be evaluated.. A manifold flow analysis model is needed to determine the feasibility of operating stacks with larger numbers of cells.
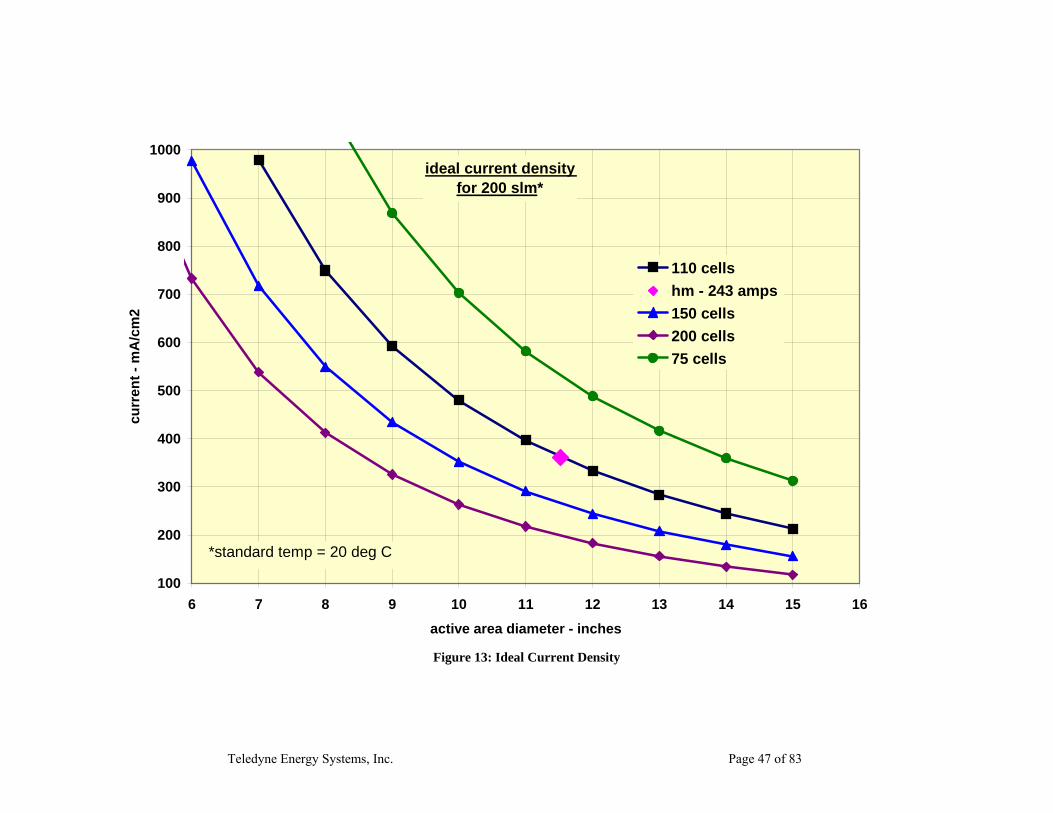
Teledyne Energy Systems, Inc. Page 47 of 83
ideal current density for 200 slm*
100
200
300
400
500
600
700
800
900
1000
6 7 8 9 10 11 12 13 14 15 16
active area diameter - inches
curr
ent -
mA
/cm
2
110 cellshm - 243 amps150 cells200 cells75 cells
*standard temp = 20 deg C
Figure 13: Ideal Current Density

Teledyne Energy Systems, Inc. Page 48 of 83
voltage performance 65 deg C* ZrO2 membrane, hm ni electrodes, 200 slm
60
65
70
75
80
85
90
6 7 8 9 10 11 12 13 14 15 16active area diameter - inches
volta
ge e
ff -
%
5
10
15
20
25
30
35
40
45
50
heat
- kW
110hm15020075110hm15020075
*based on single cell art data 022404
no. of cells
Figure 14: Performance at 65°C

Teledyne Energy Systems, Inc. Page 49 of 83
voltage performance 85 deg C* ZrO2 membrane, can electrodes, 200 slm
65
70
75
80
85
90
95
100
6 7 8 9 10 11 12 13 14 15 16active area diameter - inches
volta
ge e
ff -
%
0
5
10
15
20
25
30
35
40
heat
- kW
1101502007511015020075
*based on single cell art data 022304
no. of cells
Figure 15: Performance at 85°C

Teledyne Energy Systems, Inc. Page 50 of 83
nickel weighthm electrodes, flow screens and bipolars
0
50
100
150
200
250
6 7 8 9 10 11 12 13 14 15 16
active area diameter - inches
wgt
- kg
110 cells hm - 70 kg150 cells200 cells75 cells
Figure 16: Stack Nickel Weight
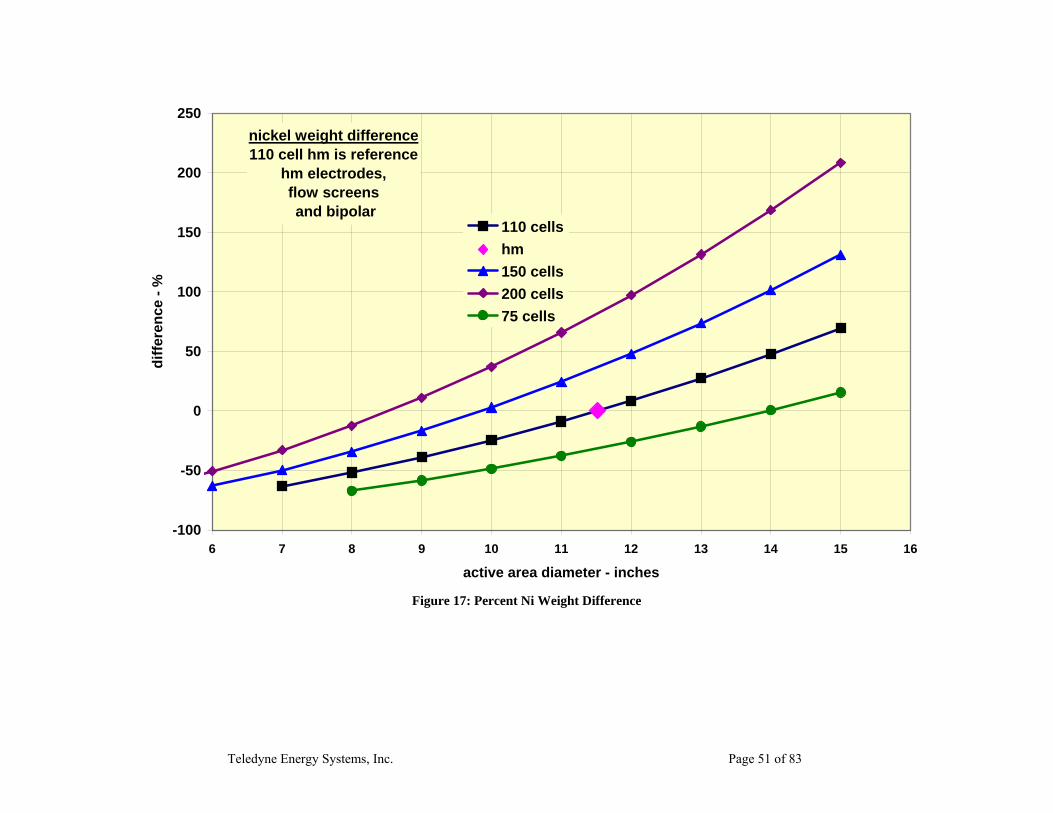
Teledyne Energy Systems, Inc. Page 51 of 83
nickel weight difference110 cell hm is reference
hm electrodes, flow screens and bipolar
-100
-50
0
50
100
150
200
250
6 7 8 9 10 11 12 13 14 15 16
active area diameter - inches
diffe
renc
e - %
110 cellshm150 cells200 cells75 cells
Figure 17: Percent Ni Weight Difference

Teledyne Energy Systems, Inc. Page 52 of 83
pressure rating12,000 psi tensile
1 inch wall
0
200
400
600
800
1000
1200
1400
1600
1800
6 7 8 9 10 11 12 13 14 15 16active area diameter - inches
pers
sure
- ps
ig SF = 3SF = 5SF = 10
thin wall, cylindrical hoop stress
Figure 18: Pressure Rating

Teledyne Energy Systems, Inc. Page 53 of 83
Appendix I – Receiver Tank Sizing Trade Study Blowdown Receiver Tanks Brief on the expected physical parameters after a sudden blow down from the phase separators and drop out tanks into a large receiver tank that is vented to the atmosphere. The assumption is that the blowdown from the system into the receiver is infinitely fast such that isentropic thermodynamics govern. For simplicity sake, the models for both hydrogen and oxygen blowdown dump into a tank with a nitrogen blanket gas at approximately 1 PSIG. The assumptions are the electrolysis system has a clearance volume of 800mL and is running at a temperature of 65°C. The receiving tank, as stated has a blanket gas of 1 PSIG nitrogen and is at room temperature of 27°C. The model was run for two volumes, 15 and 30 gallons which converts to 57 and 114 liters respectively. The following tables summarize the results and show peak pressures when the transfer process would cease (ignoring acoustic and other resonant effects) instantly after a blowdown assuming gas has not been allowed to vent to the atmosphere. Table 7: Predicted pressures and temperatures for gas blowdown into a 114 liter (30 gallon) receiver tank. 30 Gallon Case 500 PSI System Pressure 1500 PSI System Pressure PSIG Temp PSIG Temp H2 4.5 35C 11.5 49C O2 3.0 11C 6.0 <-20C Table 8: Predicted pressures and temperatures for gas blowdown into a 57 liter (15 gallon) receiver tank. 15 Gallon Case 500 PSI System Pressure 1500 PSI System Pressure PSIG Temp PSIG Temp H2 7.9 42C 21.4 52C O2 4.7 -3C 13.2 <-20C Overall, either tank size would be safe and reasonable for our purposes. The single biggest requirement for this safety system to be effective is a dump pipe that is large in diameter and short in length. By Paul Borthwick

Teledyne Energy Systems, Inc. Page 54 of 83
Appendix J – Hydrogen-Oxygen Combustion Events in High Pressure Hydrogen Generators March 8, 2005 Revised May 23, 2005 By Paul Borthwick Results of a hydrogen-oxygen combustion events within the high pressure hydrogen generator Introduction: In the generation of hydrogen by electrolysis there will always be some trace impurity of the product gasses. The impurity could be due to the phenomenon of manifold electrolysis or possibly gas migration through the membrane or through other sealing areas of the electrolysis module. Additionally, some other component failures could conceivably cause the two gasses to mix in potentially dangerous ratios. For the purpose of this memo, dangerous ratio refers to mixtures that are between 4% to 94% hydrogen by volume. These mixtures are considered flammable if not also detonable. The best safeguards on an electrolysis system are first to prevent the cause of the gasses mixing, the next safeguard is the mitigation of the consequences of a flammable mixture being ignited. Sensors are typically installed in the gas streams to monitor product gas contamination and insure that it stays not only within desirable but also safe limits. While the sensors are the first line of protection against a hydrogen-oxygen combustion event, further understanding of the magnitude of the pressure and temperature transients, should a combustion event occur, will provide for design of tanks vessels and shielding systems that will afford a second line of protection against harm or damage from a hydrogen-oxygen combustion event. Combustion in fixed volume chambers: There are two types of combustion event considered in this brief. First is that of low speed hydrogen-oxygen combustion, classified as a deflagration, where either by the nature of the energy release, or some physical aspect of the system, the combustion event proceeds at subsonic speeds. The second is a detonation event, a detonation can occur when the energy release from the reaction exceeds that required to maintain a shock wave and the expanding gasses are contained by the physical boundaries of system. A hydrogen-oxygen detonation will proceed through the system at five to ten times the local speed of sound. Basics of the model: Both combustion phenomena are examined with a fixed starting temperature of 338 K, (65oC) and are modeled at a series of operation pressures from 100 to 1500 pounds per square inch, gauge. The solutions are obtained by the use of Engineering Equation Solver worksheets. The prediction of the final state after combustion of the gasses is found by solving the chemical equilibrium reaction for a hydrogen, oxygen reaction simultaneously

Teledyne Energy Systems, Inc. Page 55 of 83
with the energy equation in a closed fixed-volume vessel. The detonation solution adds the additional parameter of the Rankine-Hugoniot curve and the solution for the upper Chapman-Jouguet point. During detonations the physics of the shock wave included in the Hugoniot equation override the effects of either the volume or physical shape of the system, therefore there is no fixed volume vessel restriction in the detonation model. It is assumed that prior to the combustion event there is no water present in the system. The presence of water vapor at these temperatures and pressures would serve to accelerate the reaction, but also limit the extent of the reaction to a minor degree leading to slightly lower final temperatures and pressures. The entire chemical system is considered to consist of two common hydrogen-oxygen reactions and one hydrogen-hydrogen reaction.
)1(22 222 OHOH ⇔+
)2(22 22 OHHOH +⇔
)3(22 HH ⇔ The last two reactions are considered in the modeling system due to the temperatures reached during hydrogen-oxygen combustion. At or near room temperature equation 1 is the dominant reaction to the point where the system can be described by the single equation and the system will react virtually to completion consuming all available hydrogen or oxygen. As the temperature is increased the system will cease to react directly into water and the reactants will remain either in their unreacted state or dissociate into other species. While the secondary reactions shown in equation 2 and 3 will not change the basic combustion event they will have an effect on final temperature and pressure or in the case of a detonation, on the magnitude and velocity of the detonation wave through the system. Deflagration, subsonic combustion event: The first type of event that is considered is that of combustion that does not progress into a detonation. Regardless of the physical system, combustion without possibility of detonation will occur at either the extreme lean limits of mixture (4% to 15% hydrogen) or at the extreme rich limits of mixture (90% to 94% hydrogen). For a hydrogen electrolysis system, combustion events on the extreme lean or rich limits are considered most likely on the assumption that as the gasses are never mixed intentionally, any combustible mixture would likely be on either of the extreme limits of the flammability range. Figures 19 and 20 provide an overview of final pressures and temperatures immediately following a combustion event in a closed vessel across the entire range of flammable hydrogen concentrations for a series of starting pressures. The assumption here, even for the extreme peak pressures, is that the tank, vessel or in general, the containment does not rupture.
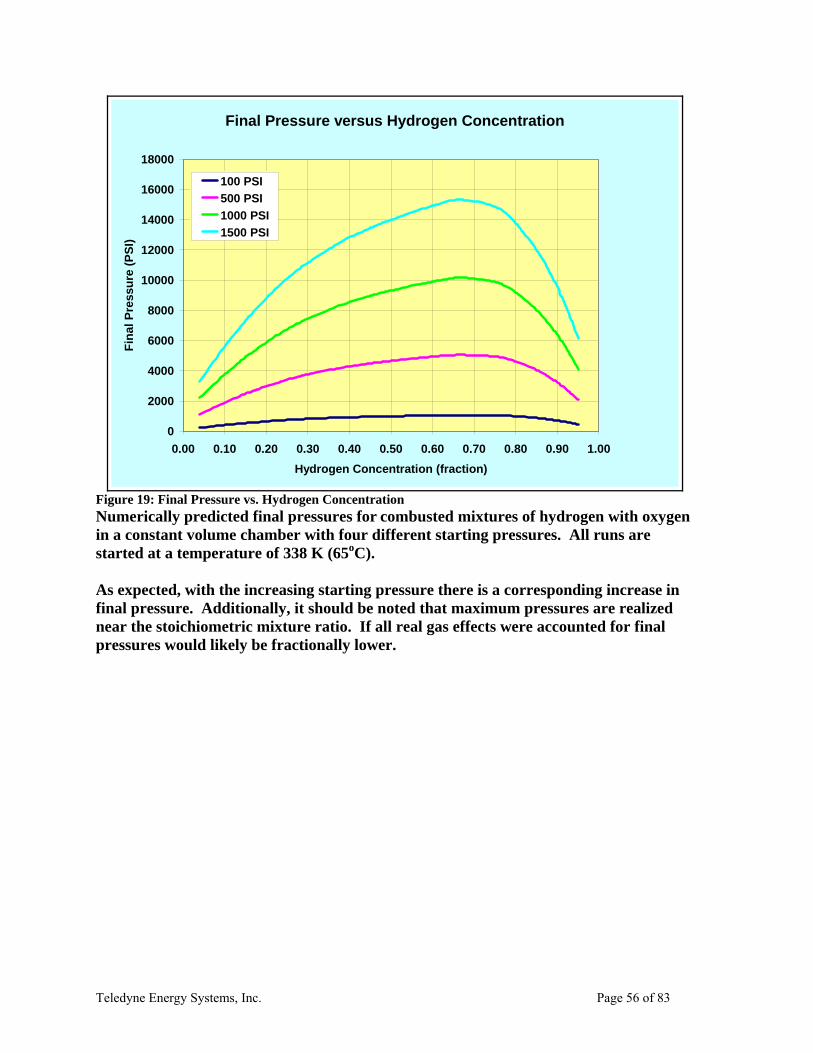
Teledyne Energy Systems, Inc. Page 56 of 83
Final Pressure versus Hydrogen Concentration
0
2000
4000
6000
8000
10000
12000
14000
16000
18000
0.00 0.10 0.20 0.30 0.40 0.50 0.60 0.70 0.80 0.90 1.00Hydrogen Concentration (fraction)
Fina
l Pre
ssur
e (P
SI)
100 PSI500 PSI1000 PSI1500 PSI
Figure 19: Final Pressure vs. Hydrogen Concentration Numerically predicted final pressures for combusted mixtures of hydrogen with oxygen in a constant volume chamber with four different starting pressures. All runs are started at a temperature of 338 K (65oC). As expected, with the increasing starting pressure there is a corresponding increase in final pressure. Additionally, it should be noted that maximum pressures are realized near the stoichiometric mixture ratio. If all real gas effects were accounted for final pressures would likely be fractionally lower.
Teledyne Energy Systems, Inc. Page 57 of 83
Final Temperature versus Hydrogen Concentration
0
500
1000
1500
2000
2500
3000
3500
4000
4500
5000
0.00 0.10 0.20 0.30 0.40 0.50 0.60 0.70 0.80 0.90 1.00Hydrogen Concentration (fraction)
Fina
l Tem
pera
ture
(Kel
vin)
100 PSI500 PSI1000 PSI1500 PSI
Figure 20: Final Temperature vs. H2 Concentration Numerically predicted final temperatures for combusted mixtures of hydrogen with pure oxygen in a constant volume chamber with four different starting pressures. All runs are started at a temperature of 338 K (65oC). It should be noted that, final temperature is only a weak function of starting pressure. Similar to the predicted pressure curves in figure 1, maximum predicted temperatures are realized near the stoichiometric mixture ratio. If all real gas effects were accounted for final temperatures would likely be fractionally lower. As seen in Figure 19, an increase in the initial or starting pressure results in a corresponding increase in final pressure. Additionally, it should be noted that maximum pressures are realized near the stoichiometric mixture ratio as this is the point of greatest energy release per unit volume. The predicted temperature plots shown in Figure 20 have a similar shape to the pressure curves from Figure 19. It should be noted that, final temperature is only a weak function of starting pressure. If the model did not allow for additional hydrogen-oxygen chemistry other than reaction 1 the temperature plots would be expected to be identical. Similar to the predicted pressure curves, maximum predicted temperatures are realized near the stoichiometric mixture ratio. If all real gas effects were accounted for final pressures and temperatures would likely be fractionally lower. Examining results of combustion near the lean and rich limits in greater detail, Table 9 considers the calculated results for combustion of a 4% mixture of hydrogen immediately after the reaction has terminated. In the lean mixture case the global reaction would cease upon the exhaustion of hydrogen reactant. This model is appropriate for the oxygen side of a

Teledyne Energy Systems, Inc. Page 58 of 83
hydrogen generation system. Following termination of the combustion event, the mixture cools through heat transfer to the environment, the pressure and temperature will decay accordingly. The most important aspect with regard to a lean combustion event is the modest increase in final pressure, especially at the lower initial pressures. On an absolute pressure scale, the ratio of final pressure to initial pressure is a constant 2.197. While combustion events are undesirable, this result shows that for current Teledyne commercial systems, if lean combustion occurs soon after flammable mixture is created, damage would likely be minimal. Additionally, damage is more likely to be caused by the sudden rush of expanding gasses through ports and valves rather than by the pressure increase itself. Table 9: Final Pressure and Temperature for 4% H2 in O2
Initial Pressure
Final Pressure
Final Temperature
PSIG PSIG Kelvin 100 237.2 757.5 200 456.8 757.5 300 676.5 757.5 400 896.1 757.5 500 1116 757.5 600 1335 757.5 700 1555 757.5 800 1775 757.5 900 1994 757.5
1000 2214 757.5 1100 2434 757.5 1200 2653 757.5 1300 2873 757.5 1400 3092 757.5 1500 3312 757.5
Numerical results for model combusting a mixture of 4% hydrogen with pure oxygen in a constant volume chamber. All runs are started at a temperature of 338 K. As expected, with the increasing starting pressure there is a corresponding increase in final pressure. If table were resolved in terms of absolute pressure the ratio of final to initial pressure is a constant 2.197 regardless of initial pressure. The constant value of the final temperature is a model artifact from the assumption of ideal gas behavior for all constituents. If all real gas effects were allowed, final temperatures would likely vary slightly and pressures would likely be fractionally lower. Table 10 considers a combustion event at the rich end of the flammability range, that of a 94% mixture of hydrogen in oxygen. In this case the global reaction would cease upon the exhaustion of oxygen. This model represents the scenario where oxygen leaks into the hydrogen side of the generation system and there is an immediately available ignition source, so that the mixture would ignite as soon as flammability limits were reached. The predicted

Teledyne Energy Systems, Inc. Page 59 of 83
results in table 2 are notable for the higher peak pressures and temperatures predicted as compared to the lean (4%) limit case. Even at 100 PSIG, the lowest operating pressure modeled, the pressure immediately following a combustion event is 510 PSIG. Regardless of the temperature, pressures of that magnitude could be expected to create permanent damage if not rupture the system. Similar to the lean combustion case, when absolute pressures are considered there is a roughly constant ratio of 4.06 between the final and initial pressure. Table 10: Final Pressure and Temperature for 94% H2 in O2
Initial Pressure
Final Pressure
Final Temperature
PSIG PSIG Kelvin 100 509.5 1643 200 966.4 1643 300 1423 1643 400 1880 1643 500 2337 1643 600 2794 1643 700 3251 1643 800 3708 1643 900 4165 1643
1000 4622 1643 1100 5079 1643 1200 5536 1643 1300 5993 1643 1400 6450 1643 1500 6907 1643
Numerical results for a model combusting a mixture of 94% hydrogen with oxygen in a constant volume chamber. As noted in the text, 94% is the upper flammability limit for hydrogen in oxygen. All runs are started at a temperature of 338 K. As expected with increasing starting pressure, there is a corresponding increase in final pressure. The constant value of the final temperature is a model artifact from the assumption of ideal gas behavior for all constituents. If all real gas effects were allowed, final temperatures would likely vary slightly and pressures would likely be fractionally lower. An additional scenario considered is that of the worst possible combustion event, i.e. what if the hydrogen and oxygen mixture were to mix to the most energetic possible mixture? While such a perfect mixture is not likely to occur unless deliberately created, Table 11 provides the maximum predicted pressures and temperatures possible should a situation of freely mixing gasses occur. Intuitively, and as seen in Figures 19 and 20, the worst case is very near a two-to-one ratio of hydrogen to oxygen. Both in practice and predicted by this model the absolute worst case is with hydrogen in a slight excess of the stoichiometric ratio. Shown in Table 11, for a range of initial pressures the ratio of hydrogen to oxygen for maximum energy release is reported along with the final pressure and temperatures. As would be expected from the additional energy that is released during combustion of stoichoimetrically
Teledyne Energy Systems, Inc. Page 60 of 83
correct mixtures the end pressures and temperatures are higher than for the lean or rich limit cases. The final peak pressures predicted are destructive. Table 11: H2 in O2 for Maximum Final Pressure
Initial Pressure Hydrogen Oxygen
Fraction Hydrogen in Oxygen
Final Pressure
Final Temperature
PSIG mols mols PSIG Kelvin 100 2.275 1 0.6947 1069 4082 200 2.250 1 0.6923 2052 4199 300 2.236 1 0.6909 3048 4272 400 2.225 1 0.6899 4052 4325 500 2.217 1 0.6891 5063 4367 600 2.210 1 0.6885 6078 4401 700 2.205 1 0.688 7098 4430 800 2.200 1 0.6875 8121 4455 900 2.196 1 0.6871 9147 4478 1000 2.192 1 0.6867 10176 4497 1100 2.189 1 0.6864 11207 4517 1200 2.186 1 0.6861 12240 4533 1300 2.183 1 0.6858 13275 4548 1400 2.180 1 0.6856 14312 4561 1500 2.178 1 0.6853 15351 4574
Numerical results for model combusting a mixture of hydrogen and oxygen in a constant volume chamber mixed in a manner to achieve the maximum possible final pressure. All runs are started at a temperature of 338 K. As expected, with the increasing starting pressure there is a corresponding increase in final pressure and temperature. The model used for these predictions is based on an ideal gas assumption. If all real gas effects were accounted for the final pressures would likely be slightly lower. Deflagration versus Detonation: It should be recognized that there can be significant differences not only in the final pressure and temperature but also in the manner or nature in which the combustion occurs. As discussed earlier, at very lean or rich limits, the combustion, although rapid will proceed at subsonic speeds in a combustion regime referred to as deflagration. For a hydrogen-oxygen system the limits for detonation are from approximately 16% to 90% hydrogen by volume. We can envision system failure scenarios where mixtures would fall within this range. The subtle but important difference between an explosion and a detonation is the velocity of the combustion wave and the magnitude of the change in pressure. An explosion is an event characterized by very rapid combustion and energy release but will not necessarily involve a compressible shock wave or supersonic speeds. A detonation, is also characterized by very rapid combustion but also produces a shock wave, defined by a sudden pressure, density and temperature jump, traveling in excess of the local speed of sound. (For reference the typical
Teledyne Energy Systems, Inc. Page 61 of 83
speed of sound for a “perfect” H2-O2 mixture at operating temperature is approximately 572 meters per second) A detonation, is an extremely dynamic event that can generate peak absolute pressures upward of twenty times greater than the starting absolute pressure. In addition to the destructive effect of the peak pressure, is the small physical thickness of the shock wave. The extremely high pressure gradients coupled with the supersonic velocities of the wave exacerbate the destructive effects of this phenomenon. In short, a detonation wave will create very high stresses in the wall of the tube or vessel, easily great enough to shatter or splinter tubes made from hard or brittle materials or burst those of softer materials. Finally, for a hydrogen-oxygen system, detonation wave velocities on the order of 3000 meters per second are typical. During a detonation, pressures within the shock wave will be significantly higher than those predicted for the final resting pressure shown in Figure 19. Although not a fixed ratio, the pressure within a detonation shock wave is roughly a factor of two times that of the predicted final resting pressure, should the system remain intact to come to a final resting pressure. If the two product gasses were to mix in the most unfavorable ratios a starting pressure of 1500 PSIG gauge will support a shock wave with pressures approaching 30,000 PSIG. At any given location in the system the pressure increase from 1500 PSIG to 30,000 PSIG would occur on a time scale measured in microseconds. Considering the short time domain and the extreme peak pressures, regardless of the final resting pressure, a shock wave has amazing destructive potential. Two things are required for a detonation to occur; first a gaseous or particulate suspension mixture that will combust with greater energy release than that required to sustain a shock wave and second a vessel closed on at least one end. A pipe open on both ends typically will not allow a detonation shock wave to be initiated, whereas a pipe closed on one or both ends will. The proposed high pressure alkaline electrolysis generator will simultaneously generate hydrogen and oxygen. These two gasses are known to be detonable from 16% to 90% hydrogen concentration by volume. The generator also has a collection of vessels and tubes that could easily support a detonation wave, should one be initiated. Figures 21 through 23 show some of the predicted results should a detonation be initiated not just within the high pressure hydrogen generator but in reality, any hydrogen generator. In Figure 21 the trend is very similar to that seen in Figure 19 with the shock wave pressures for any given mixture increasing with increasing initial pressure. Also as seen in Figure 19 the maximum pressures are realized very near stoichiometric mixture ratios. Figure 23, the predicted wave temperature plot is also very similar to its static counter part showing only detonation wave temperature as a strong function of mixture ratio but a weak function of pressure. Maximum wave temperatures occur as expected near stoichiometric mixture ratios.

Teledyne Energy Systems, Inc. Page 62 of 83
Detonation Wave Pressure versus Hydrogen Concentration
0
5000
10000
15000
20000
25000
30000
35000
0.00 0.10 0.20 0.30 0.40 0.50 0.60 0.70 0.80 0.90 1.00Hydrogen Concentration (fraction)
Wav
e Pr
essu
re (P
SI)
100 PSI500 PSI1000 PSI1500 PSI
Figure 21: Detonation Wave Pressure vs. H2 in O2 Numerical predictions for the detonation wave pressures for mixtures of hydrogen with oxygen with four different starting pressures. All runs are started at a temperature of 338 K. (65oC). As expected, with the increasing starting pressure there is a corresponding increase in detonation wave pressure. Additionally, it should be noted that maximum pressures are realized near the stoichiometric mixture ratio. If all real gas effects were accounted for, final pressures would likely be fractionally, but not significantly, lower.

Teledyne Energy Systems, Inc. Page 63 of 83
Detonation Wave Velocity versus Hydrogen Concentration
0
500
1000
1500
2000
2500
3000
3500
4000
4500
0.00 0.10 0.20 0.30 0.40 0.50 0.60 0.70 0.80 0.90 1.00Hydrogen Concentration (fraction)
Wav
e Ve
loci
ty (m
/s)
100 PSI500 PSI1000 PSI1500 PSI
Figure 22: Detonation Wave Velocity vs. H2 in O2 Numerical predictions for the detonation wave velocities for mixtures of hydrogen with oxygen with four different starting pressures. All runs are started at a temperature of 338 K (65oC). Velocity is more a function of mixture ratio than of starting pressure. Although shock wave temperature plays a part, the biggest reason for the increase in wave velocity at the higher concentrations of hydrogen is due to the dominance of the ratio of specific heats for hydrogen and their effect on the speed of sound.

Teledyne Energy Systems, Inc. Page 64 of 83
Detonation Wave Temperature versusHydrogen Concentration
0
1000
2000
3000
4000
5000
6000
0.00 0.10 0.20 0.30 0.40 0.50 0.60 0.70 0.80 0.90 1.00Hydrogen Concentration (fraction)
Wav
e Te
mpe
ratu
re (K
elvi
n)
100 PSI500 PSI1000 PSI1500 PSI
Figure 23: Detonation Wave Temperature vs. H2 in O2 Numerical predictions for the detonation wave temperatures for mixtures of hydrogen with oxygen with four different starting pressures. All runs are started at a temperature of 338 K (65oC). As can be seen, wave temperature is only a weak function of initial pressure. The extreme temperatures (in excess of 3000K for most of the detonable mixture range) do provide some insight as to how much energy is released during hydrogen-oxygen combustion and how this reaction can drive a destructive shock wave. Similar to the static case, maximum temperatures are realized near the stoichiometric mixture ratio. If all real gas effects were allowed for, wave temperatures would likely be fractionally, but not significantly, lower. Conclusions: There are some aspects of the potential for a combustion event in a hydrogen-oxygen system that would give pause to wonder if electrolysis systems should even be built. Clearly if the two gasses were never generated near one another the chances of them becoming accidentally mixed in combustible or detonable ratios is reduced to virtually nil. Adding concern to the predicted pressures and temperatures from the numerical analysis is the contemplation of a system that will operate at pressures perhaps as high as 1500 PSIG. The predicted pressure spikes for a system operating at 1500 PSIG could be as high as 30,000 PSIG if everything went as absolutely wrong as possible. It is unlikely a hydrogen electrolysis system would be built that would, of its own strength, remain physically intact under such a pressure spike, regardless of how brief.

Teledyne Energy Systems, Inc. Page 65 of 83
On the other hand, alkaline electrolysis hydrogen generators have been manufactured and operated safely for decades. Where there have been incidents they can usually be traced back to equipment not being properly maintained, operator error or negligence. There are two main issues to be addressed. The first issue would be: Can a high pressure generator, of any type, be built with enough safeguards that the conditions for combustion are never met? Extending beyond that, if combustion were to occur, is the generator strong enough and well enough contained that the worst possible scenario for a detonation would not present a hazard to persons and property in the vicinity of the unit when the detonation occurred. The second issue: Can such a practical system be built so that a general operator could not, even deliberately, cause the product gasses to become mixed at ratios and pressures that would present a hazard? The answer to the first question regarding system safety, monitors and safeguards, starts with a cost benefit analysis where the statement and question of, “Yes, but at what cost?” is addressed. To a ridiculous extreme a generator could be built and encased in a six inch thick hardened steel box with a very minimum of tubes and wires passing through a reinforced bulkhead. A system with such brute force protection would be very expensive from the materials required standpoint and could easily cost even more to transport to the operation site. It would be more appropriate to place greater emphasis on a system with redundant sensors that were known to function with “several nines” reliability at the intended operating pressures. While appropriate sensors and interlocks are definitely the “finesse” solution, it is also likely the cost effective solution from both the manufacture and transport perspective. Assuming the “finesse” solution is chosen, given the potential consequences, the gravity of employment of effective sensors and meaningful safeguards cannot be understated. Unfortunately, for the second issue, deliberate tampering, it is unlikely that a system could be built that could not in some way be breached. That would be much more of a controlled access and minimum two persons only access issue at the point of installation. Although design features such as missing or defeated sensor detection could be included in the control system and left hand threads and special connectors included to make the module or tanks more difficult to cross plumb, it is unlikely the system could be engineered to the point where it would be impervious to deliberate tampering.

Teledyne Energy Systems, Inc. Page 66 of 83
Appendix K: Gas Cross-Contamination Concentration Sensing Dear Samir et al, I have a contamination gas propagation model built up and working. While there are things I would like to improve I can say that this at least the “90%” solution, given the time scales probably better than that. This gives some idea as to how long it will take a small failure at the module to show up at the contamination sensor. The idea of a 4% breach in the module describes a phenomenon where there is a sudden failure in the module and it begins producing gas with a 4% concentration of the other gas present. We will have to discuss this and see what kinds of rates we are comfortable with. Paul Borthwick
Time versus H2 in O2 Concentration at SensorFollowing 4% Breach in Module
0
0.005
0.01
0.015
0.02
0.025
0.03
0.035
0.04
0.045
0 250 500 750 1000 1250 1500 1750 2000 2250Seconds
Frac
tion
Con
cent
ratio
n
125 PSI250 PSI500 PSI1000 PSI1500 PSILimit

Teledyne Energy Systems, Inc. Page 67 of 83
Time versus O2 in H2 Concentration at SensorFollowing 4% Breach in Module
0
0.005
0.01
0.015
0.02
0.025
0.03
0.035
0.04
0.045
0 250 500 750 1000 1250 1500 1750 2000 2250Seconds
Frac
tion
Con
cent
ratio
n
125 PSI250 PSI500 PSI1000 PSI1500 PSILimit

Teledyne Energy Systems, Inc. Page 68 of 83
Appendix L – Experimental Setup for Gas Solubility and Evolution in Potassium Hydroxide By Paul Borthwick Experimental setup for testing hydrogen and oxygen solubility and evolution in potassium hydroxide (KOH) electrolyte in a high pressure heated environment. The purpose of this experimental apparatus is to evaluate the solubility and the nature of release from solution of hydrogen, and oxygen in a 25% (by weight) potassium hydroxide solution. The experimental apparatus is intended to duplicate the operating conditions for the stated materials that will be encountered in the high pressure hydrogen electrolysis generator operating up to 1500 PSIG hydrogen delivery pressures. The ultimate intent is to characterize the gas-electrolyte system such that under a blowdown conditions the two gasses, which can easily be of different trapped volumes, can be vented without active control in such a way that will avoid excessive differential pressures within the electrolysis module and that will avoid releasing gas at such a rate that gas evolved out of solution with the electrolyte causes the electrolyte to be carried out of the system. The proposed apparatus for the experimental system will closely mimic the proposed electrolysis system by utilizing vapor lift as a means of circulating the electrolyte and then having a two tank “product” gas separation and dropout system. Replacing the electrolysis module are a series of valves, regulators and other flow mechanisms to allow for gas introduction and exhaust from the system.

Teledyne Energy Systems, Inc. Page 69 of 83
Gas Inlet
Sapphire SightGlass
Heater
Aerator
T/C
GasOutlet
GasOutlet
T/CBackpressure
Regulator
ChokingOrifice
PressureGauge
BlowdownValve
SaturatingValve
BubbleChamber
DropoutTank
PhaseSeparation
Tank Gas
Electrolyte
GasElectrolyte
Mixture
Gas InletValve

Teledyne Energy Systems, Inc. Page 70 of 83
General operation: Saturation: The backpressure regulator will be set to the desired test pressure and the saturating valve opened while the blowdown valve is insured closed. The gas inlet valve is opened. Introduction of gas to the system will cause electrolyte circulation from the separation tank to the bubble chamber and back to the separation tank. Pressure in the system will be expected to increase until the limit set by the backpressure regulator. During this process some fraction of the bubbling gas will be adsorbed into the electrolyte until saturation is reached. While it is conceivable that a system for establishing when there is no further gas being adsorbed into the electrolyte could be attached to this experimental system (mass flow comparison between the inlet and outlet comes to mind.) the initial recommendation will be to operate the system at desired pressure and temperature for a reasonable period of time (15 minutes comes to mind) before acquiring data during a blowdown condition. Blowdown: The emphasis of this system is that blowdown is not actively controlled but regulated by the choking of gaseous flow through an orifice. Blowdown is initiated by closing the inlet valve and opening the blowdown valve. Treating either of the subject gasses as an ideal gas, it can be established that mass flow rate through a choked orifice can be established by the relation,
AT
kPdtdm
o
o=
( )( )[ ]12
1
2
211
−+
⎟⎠⎞
⎜⎝⎛ −+
=γγ
γ
γ
M
MR
k
v
p
CC
=γ
Where dm/dt is the mass flow rate of the subject gas, Po is the static pressure and To is the static temperature upstream of the flow orifice and A is the area of the flow orifice. Referencing the second equation, M refers to the Mach number, 1 in this case and R is the mass based ideal gas constant for the gas of interest. In the final equation, Cp is the specific heat at constant pressure and Cv is the specific heat at constant volume, again for the gas of interest. During blowdown the electrolyte can be observed through the sight glass. Should the normally clear electrolyte appear as opaque and/or foaming this is an indication that gas is evolving from the electrolyte at a rate that may begin to transport electrolyte from the system through the gas vent passages.

Teledyne Energy Systems, Inc. Page 71 of 83
In the simplest form, the experiment is repeated with successively larger discharge orifices until the electrolyte is observed to change physically with bubbles present in the body of the liquid. This would be considered the maximum allowable discharge rate. Reducing this data, a maximum pressure release rate dP/dt could be determined that could applied to the design of larger systems operating at similar pressures. Other Phenomena: There are three data sensors on the apparatus, two thermocouples and a pressure gauge. By using the pressure gage and thermocouple exposed to the gas the upstream static pressure and temperature of the gas can be determined. By datalogging gas pressure and temperature the mass flow rate can be determined (by the above equation) without subjecting expensive mass flow meters to potential exposure to KOH. The thermocouple that is submerged in the liquid serves two purposes, first during the saturation phase it is used to ensure that the electrolyte is at the desired datapoint temperature. (Typically 65o C) Second, during blowdown it is reasonable to expect a temperature change in the electrolyte as the gas is evolved out of solution. (I have not done the background on this yet to determine if it will be endothermic or exothermic and if so, to what degree.) Such information along with pressure, temperature and derived mass flow information can give insight as to the rate of gas being evolved from the electrolyte with or without optical cues from the sight glass. At this time there are numerical models built in EES that will predict the mass flow rate and pressure trace of the blowdown phenomena without gas being evolved. This is done two ways, isentropically and isothermally. If there was no gas being evolved the real pressure trace would land between these two theoretical traces. With gas being evolved, things will likely stretch out in time.

Teledyne Energy Systems, Inc. Page 72 of 83
Appendix M – Notes on a gas lift electrolyte circulation system By Paul Borthwick The current plan for the high pressure “DOE” hydrogen electrolysis system is to utilize a two phase flow phenomenon called a gas or vapor lift pump. As the name implies, this pumping system utilizes the gas or vapor in a liquid to motivate the liquid within a system. A common example of such a system is circulation in a pot of boiling water. The water vapor rising from the bottom of the pot results in a displacement of liquid throughout the system. Although the boiling water example shows that the presence of gas or vapor in a liquid can cause circulation of the system the bulk flows are turbulent, disorganized and of little utility other than to cause the bulk of the boiling liquid to be effectively isothermal. If a flow system is properly designed, the creation or introduction of a gas into the liquid can be utilized to achieve organized circulation, useful either for concentration replenishment or heat transfer purposes. Such is the case with the proposed gas lift system in the high pressure hydrogen generator. The gas lift system was proposed in lieu of active pumps for reasons of reliability and cost. Although the required pressure increase to maintain circulation is relatively small the overall operating environment is stipulated to be at pressures of up to 1500 PSI-gauge. These high internal pressures require pump casing strengths that are not readily available. The additional requirement of being able to pump a Ph 14 solution of 25% Potassium Hydroxide (KOH) further limits the availability of pumps capable of operating in the hostile environment. Given the limitations of active pumping systems, a passive system offering significantly lower cost an increase in reliability becomes desirable. A gas or vapor lift pumping system utilizes the potential energy of buoyancy and differences in bulk density to achieve circulation in the system. With one of the energy sources being buoyancy of a submerged bubble, the greater the vertical height of a gas or vapor lift system, the greater the pumping effectiveness. The second, somewhat intuitive, necessary design feature, is for clear separation of regions and flows, on a traditional active pump this would be the inlet and outlet pipe, due to the vertical nature of a gas lift system the inlet pipe will be referred to as a downcomer while the outlet will be referred to as a riser. Figure one shows a basic schematic of the system as it exists in the high pressure generator.

Teledyne Energy Systems, Inc. Page 73 of 83
Figure 24: Gas Lift Circulation Loop
Schematic of the gas lift circulation loop for the high pressure hydrogen generator. Important pieces are: The downcomer, this tall tube forms the input line for the pumping system. Height of the downcomer is important to provide the system with vertical displacement that becomes part of the driving energy for the system. Next in the flow path is a trap. The trap must be in place to insure the system always flows in a predictable direction. Next is the electrolysis module, all gas generation takes place in the module. Coming out of the module the gas laden electrolyte enters the riser. The riser is the height compliment to the downcomer. The riser empties into the gas separator. The gas separator has two outlets, the gas rises out the top while electrolyte drains out the bottom into the downcomer. There are two sets of physics that drive the fluid flow in a gas lift system. The major effect is from the difference in the density between the downcomer and the riser. Similar to a manometer that has been filled with fluids of different densities on the two sides the side with the less dense fluid will settle at a level higher than that with the denser fluid. In the case of this gas lift system, the overall fluid level in the system is above the outlet of the riser into the gas separator. Rising from the electrolysis module the gas laden electrolyte in the riser

Teledyne Energy Systems, Inc. Page 74 of 83
ascends to compensate for its lower density compared to the continuous electrolyte in the downcomer. The gas bubble laden electrolyte will enter the separator tank. Due to the quiescent nature of flow in the separator, the gas will separate out of the electrolyte and vent out of the gas outlet while the electrolyte drains from the gas separator to the downcomer and is returned to the electrolysis module. As noted in the caption for figure 1, the trap at the bottom of the system insures that the system will flow in the desired direction. The trap functions on the simple principle that upon system startup the gasses will not descend downward in a quiescent liquid column. A secondary effect that will increase the effectiveness of system is that of the viscous drag of the bubble on the electrolyte as it ascends in the riser. Due to the physics of low Reynolds Number drag, the viscous drag of the bubbles will have the greatest effect if the bubbles remain large in number but small in size compared to the diameter of the riser tube. Modeling the flows: Two phase flow systems can be difficult to model. The interaction between the multiple phases and resulting flow regimes is often dependent on the exact physical parameters (velocities, viscosities, volume fractions, surface tensions, diameters or hydraulic diameters etc.) of the flow situation. A model of one specific flow situation for this system was created in FLUENT while a second more general model was created using EES. While the FLUENT model provided very granular information regarding velocity profiles and gas/electrolyte concentration gradients it also required about 8 hours to create and 72 hours to completely solve. The EES model required about 20 hours to create and would provide one or two pieces of general information and the electrolyte flow rate however could solve any specific case in several seconds. This provides the ability to quickly examine the effects of numerous production rates, delivery pressures, tubing diameters and tubing. The EES model accounted only for the difference in densities in the two columns. While not modeled, the effect of viscous drag on the electrolyte in the riser column will serve to improve the electrolyte flow in the system over that which is being predicted in these models. Electrolyte flow was predicted at a variety of system operating pressures and heights. The results for expected electrolyte flow on both the hydrogen and oxygen side generated by the EES models are presented below:

Teledyne Energy Systems, Inc. Page 75 of 83
Electrolyte Flow versus System HeightHydrogen Side
0.50
1.00
1.50
2.00
2.50
0.0 0.5 1.0 1.5 2.0 2.5 3.0 3.5 4.0 4.5System Height (m)
Elec
trol
yte
Flow
(lpm
)100 PSI500 PSI1000 PSI1500 PSI
Figure 25: Expected Electrolyte Flow for H2 Using Gas Lift
Plots of expected electrolyte flow on the hydrogen side in liters per minute for the benchtop high pressure hydrogen generator for a variety of both system heights and product delivery pressures. Hydrogen production rate is set at 1.5 Standard Liters Per Minute with riser and downcomer set to be 0.402 inches inside diameter.

Teledyne Energy Systems, Inc. Page 76 of 83
Electrolyte Flow versus System HeightOxygen Side
0.50
1.00
1.50
2.00
2.50
0.0 0.5 1.0 1.5 2.0 2.5 3.0 3.5 4.0 4.5System Height (m)
Elec
trol
yte
Flow
(lpm
)100 PSI500 PSI1000 PSI1500 PSI
Figure 26: Expected Electrolyte Flow for O2 Using Gas Lift
Plots of expected electrolyte flow on the oxygen side in liters per minute for the benchtop high pressure hydrogen generator for a variety of both system heights and product delivery pressures. Hydrogen production rate is set at 1.5 Standard Liters Per Minute, therefore the oxygen production rate is 0.75 Standard Liters Per Minute with riser and downcomer set to be 0.402 inches inside diameter. System Adequacy: An important criteria with regard to the electrolyte flow within the system becomes, does the proposed gas or vapor lift system provide enough circulation to avoid damage to the electrolysis module. The electrolysis module is the critical component in the hydrogen electrolysis system as it is the component where not only are the gasses generated but also the main source of waste heat. The electrolyte plays an important role not only in the production of the gasses but also as the coolant for the module. It is the cooling function that dominates how much electrolyte must flow to maintain system temperatures and integrity. At this time the membrane performance is still being fully characterized however it is estimated that for the current “ART” module will “waste” 48 Watts of heat per cell. Given the heat capacity of the potassium hydroxide electrolyte under these worst case conditions each cell will require 0.07 liters per minute of electrolyte to operate with a temperature rise no greater than 10 degrees Celsius. The stated required electrolyte flow is representative of the combined flows from the hydrogen and oxygen side. The planned test module for the 1.5 SLPM hydrogen production rate will be 10 cells. Given the estimated total flow of approximately 2 liters per minute combined electrolyte flow the system will provide 0.2 liters per minute of electrolyte flow per cell. Given the worst case estimated requirement of 0.07 liters per minute, each cell will be provided with 2.85 times greater the necessary amount of electrolyte required to maintain internal temperature rise within acceptable limits.

Teledyne Energy Systems, Inc. Page 77 of 83
Conclusion: Given construction with adequate height and tube diameters, it is reasonable to expect that a gas or vapor lift electrolyte circulation system will meet the electrolyte flow requirements for the benchtop high pressure hydrogen generator. This will result in both a cost savings as well as simplification of the design and control requirements. Should this technique be further developed for larger production units it could potentially result in a significant cost savings per unit as well as improved unit reliability.

Teledyne Energy Systems, Inc. Page 78 of 83
Appendix N – Electrode Testing To: Joe Poindexter, Stuart Pass, Mike Miller, Samir Ibrahim, and Chris Kuehn From: Ben Heshmatpour, Al Vargas, Teresa Bausum CC: Charlie Wolf, Rhett Ross, Robert Bottoms Date: May 18, 2006 Subject: Evaluation of NRK Pt-Ru catalyst coated nickel screen ________________________________________________________________________ Nickel screen samples coated by a special platinum-ruthenium catalyst, developed and applied by NRK Electrochem of Cornwall, UK, was evaluated via our standard water electrolysis cell voltage measurement (C-AN coated screen qualification) test and SEM/EDS analysis. Two separate nickel screen samples, each 5” x 5” in dimensions, were sand blasted and detergent cleaned per our normal pre-coating cleaning process before sending to NRK Electrochem for catalyst coating. NRK Electrochem offers only one type of Pt-Ru based catalytic coating for electrode (cathode and anode) application. Al Vargas conducted all the standard cell voltage measurement tests. The normal electrodes configuration in our standard C-AN coated screen qualification test is: uncoated cleaned nickel screen (+ electrode)/C-AN coated nickel screen (-electrode). The NRK Electrochem coated nickel screen samples were ran as positive (+) or negative (–) electrodes in conjunction with uncoated cleaned nickel screen, C-AN coated nickel screen, or NRK Electrochem coated nickel screens. The results of these electrochemical tests are shown in Figure 27 The NRK Electrochem coated nickel screen is identified as UK in this chart. The two NRK Electrochem coated nickel screen samples are identified as (A) and (B) screens in this chart. The values reported are the averages of four (4) separate measurements. As is seen, only NRK Electrochem coated nickel screen (B) passed (1.92 volts) our voltage specification (1.965 volts), while the (A) screen failed (2.041 volts) this specification. It is also seen that the qualified (B) screen was inferior to our C-AN coated nickel screen (1.883 volts) in these tests. When NRK Electrochem coated nickel screen was used as anode as well as cathode the cell voltage was comparable to or better than our plain uncoated nickel screen/C-AN coated nickel screen electrodes configuration. The best combination was when C-AN coated nickel screen was used as anode in conjunction with NRK Electrochem coated nickel screen used as cathode. You may recall that we also evaluated a relatively similar Pt-based catalytic coating from another UK source (INEOS CHLOR) a few years ago. The results for those tests are shown in Figure 28 INEOS CHLOR offered two separate catalytic coatings, one each for anode and cathode applications. The corresponding INEOS CHLOR coated anode and cathode samples

Teledyne Energy Systems, Inc. Page 79 of 83
in Figure 28 are identified as “Anode” and “Cathode” and were used as (+) electrode (anode) or (-) electrode (cathode) in those tests. As is seen the INEOS CHLOR coated nickel screen when used properly in conjunction with plain uncoated nickel screen, C-AN coated nickel screen, or with itself was superior to the NRK coated nickel screen. It is also seen that C-AN coated nickel screen used as both anode and cathode results in excellent performance (better than when NRK Electrochem coating is used for both anode and cathode, but not as good as when INEOS CHLOR coatings are used as both anode and cathode). SEM/EDS analysis conducted by Teresa Bausum confirmed Pt as the majority and Ru as the minority species in the NRK Electrochem coating. Examples of SEM images and EDS analysis results for the NRK Electrochem coated (identified as UK) and C-AN coated nickel screens are shown in figures 29/30 and 31/32, respectively. Conclusions & Recommendations In general, replacement of the C-AN coating with the NRK Electrochem coating is not recommended unless one wishes to use the latter in conjunction with the C-AN coating to minimize the electrolysis voltage. The latter approach will produce even better results (smaller electrolysis voltage) if the INEOS CHLOR coating rather than the NRK Electrochem coating is used. The ideal move would be to obtain licensing from INEOS CHLOR for their “cathode” coating only and carry out the plating of the Pt catalyst here at TESI. In this case, both cathode and anode nickel screen electrodes are plated with INOS CHLOR’s “cathode” coating (see Figure 28 for 1.76 volts cell voltage for the cathode (+)/cathode (-) electrode configuration). We are currently C-AN coating only the cathode nickel screen. Under the above scenario both anode and cathode nickel screens will be plated with INEOS CHLOR’s “cathode” Pt coating.

Teledyne Energy Systems, Inc. Page 80 of 83
NRK ELECTRO( UK ) SAMPLING CHART
1.965
2.2212.199
2.041
1.921.891.8831.8831.8821.875
1.8231.818
1.5
1.6
1.7
1.8
1.9
2
2.1
2.2
2.3C/A
N(+)/U
K(-)(
B)C/A
N(+)/U
K(-)(
A)UK(
-)(A)
/UK(
+)(B
)UK(
+)(A
)/C/A
N(-)Nick
el(+)
/C/A
N(-)UK(
+)(B
)/C/A
N(-)UK(
+)(A
)/UK(
-)(B)
Nickel(
+)/U
K(-)(
B)Nick
el(+)
/UK(
-)(A)
UK(+)
(B)/N
ickel(
-)UK(
+)(A
)/Nick
el(-)
Cell sp
ec
Cel
l pot
entia
l
Figure 27: Electrode Testing - Cell Voltage
Cell voltage measured in standard electrode qualification test for various combinations of
electrode coatings and configurations.

Teledyne Energy Systems, Inc. Page 81 of 83
Figure 28: Electrode Testing - Cell Voltage INEOS CHLOR
Cell voltage measured in standard electrode qualification test for various combinations of
electrode coatings and configurations.
Figure 29: NRK Electrochem Coated Nickel Screen SEM
NRK Electrochem coated nickel screen SEM image
(the area for EDS analysis is shown within the red frame)

Teledyne Energy Systems, Inc. Page 82 of 83
Figure 30: NRK Electrochem Coated Screen EDS Results
Figure 31: C-AN Coated Nickel Screen SEM Image
(the area for EDS analysis is shown within the red frame)

Teledyne Energy Systems, Inc. Page 83 of 83
Figure 32: C-AN Coated Nickel Screen EDS Results
Ben Heshmatpour 5/18/06