Hydrogen, Fuel Cells & Infrastructure Technologies Program · Hydrogen, Fuel Cells & Infrastructure...
332
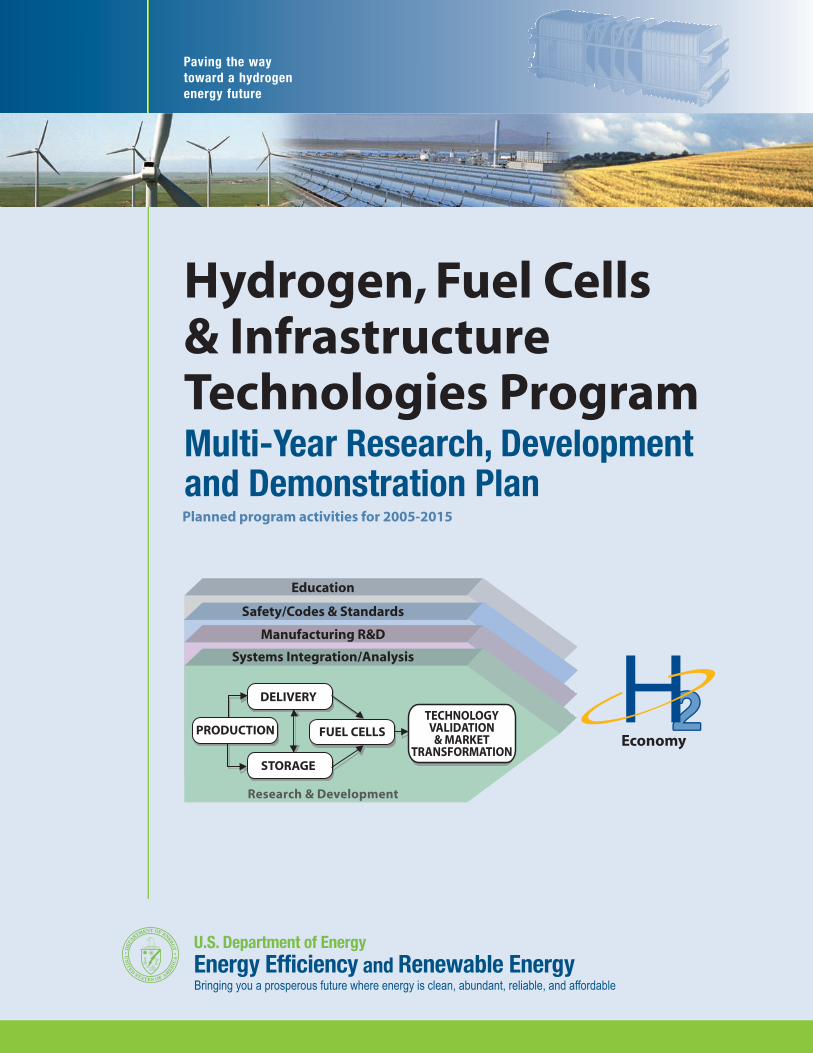
Economy Hydrogen, Fuel Cells & Infrastructure Technologies Program Multi-Year Research, Development and Demonstration Plan Planned program activities for 2005-2015 Paving the way toward a hydrogen energy future 2 2 Safety/Codes & Standards Education Manufacturing R&D Systems Integration/Analysis Research & Development PRODUCTION DELIVERY STORAGE FUEL CELLS TECHNOLOGY VALIDATION & MARKET TRANSFORMATION H
Transcript of Hydrogen, Fuel Cells & Infrastructure Technologies Program · Hydrogen, Fuel Cells & Infrastructure...
Economy
Hydrogen, Fuel Cells & Infrastructure Technologies Program Multi-Year Research, Development and Demonstration Plan Planned program activities for 2005-2015
Paving the way
toward a hydrogen
energy future
22
Safety/Codes & Standards
Education
Manufacturing R&D
Systems Integration/Analysis
Research & Development
PRODUCTION
DELIVERY
STORAGE
FUEL CELLS TECHNOLOGY VALIDATION
& MARKET TRANSFORMATION
H

NOTICE
This report was prepared as an account of work sponsored by an agency of the United States government. Neither the United States government nor any agency thereof, nor any of their employees, makes any warranty, express or implied, or assumes any legal liability or responsibility for the accuracy, completeness, or usefulness of any information, apparatus, product, or process disclosed, or represents that its use would not infringe privately owned rights. Reference herein to any specific commercial product, process, or service by trade name, trademark, manufacturer, or otherwise does not necessarily constitute or imply its endorsement, recommendation, or favoring by the United States government or any agency thereof. The views and opinions of authors expressed herein do not necessarily state or reflect those of the United States government or any agency thereof.
2007
Foreword
Foreword
In his 2003 State of the Union Address, President Bush announced the Hydrogen Fuel Initiative to reverse America’s growing dependence on foreign oil by developing the technology needed for commercially viable hydrogen-powered fuel cells — a way to power cars, trucks, homes and businesses that could significantly reduce pollution and greenhouse gas emissions. The HFI is also part of the Advanced Energy Initiative, launched by the President in 2006, to expand alternative energy research and development (R&D) to biofuels and plug-in hybrids for transportation, and renewable, clean coal, and nuclear energy technologies for stationary power generation. To implement the Initiative, the U.S. Department of Energy has established a coordinated and focused Hydrogen Program to overcome the challenges to commercialization of hydrogen and fuel cell technologies. The Program integrates R&D activities in hydrogen production, delivery, storage, and fuel cells within DOE’s Offices of Energy Efficiency and Renewable Energy (EERE); Nuclear Energy, Science and Technology; Fossil Energy; and Science.
This Multi-Year Research, Development and Demonstration Plan details the goals, objectives, technical targets, tasks and schedule for EERE’s contribution to the DOE Hydrogen Program - the Hydrogen, Fuel Cells and Infrastructure Technologies Program. Similar detailed plans exist for the other DOE offices and can be found at http://www.hydrogen.energy.gov. The DOE Hydrogen Posture Plan is the integrated plan for all four offices and can be found at http://www.hydrogen.energy.gov/pdfs/hydrogen_posture_plan_dec06.pdf.
The Hydrogen, Fuel Cells and Infrastructure Technologies R&D Plan is a living document and will be updated periodically to reflect advances in technology and changes in the Program scope. The first draft of the Plan was released in June 2003 and was reviewed by the National Research Council and the National Academy of Engineering, leading to the first revision in January 2005. This present version reflects the progress made since then. Details on every project funded by the Program can be found in the Annual Progress Report available at http://www.hydrogen.energy.gov/annual_progress06.html.
Multi-Year Research, Development and Demonstration Plan Page i
2007
Foreword
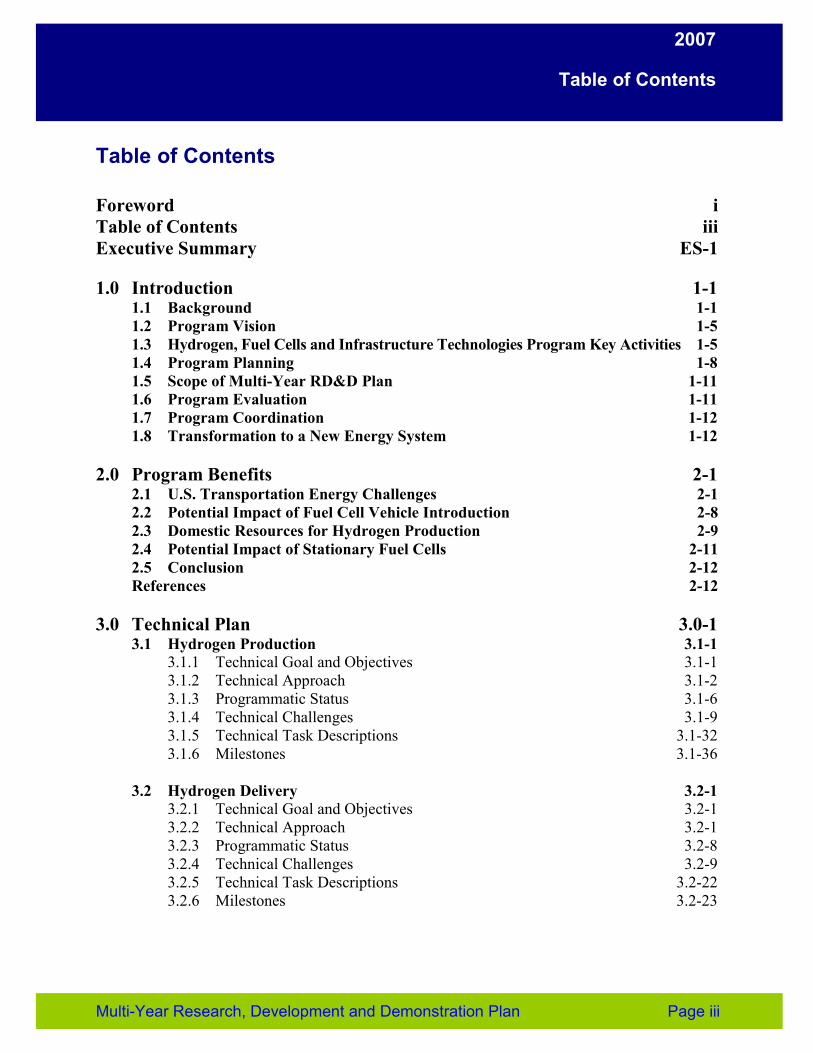
Document Revision History
This table summarizes the revisions to the Hydrogen, Fuel Cells and Infrastructure Technologies Program Multi-Year Research, Development and Demonstration Plan.
Date Description
June 6, 2003 Draft prepared for review by the National Academies’ Committee on Alternatives and Strategies for Future
Hydrogen Production and Use
January 21, 2005 Revised plan reflecting recommendations made by the National Academies and progress made since the 2003 draft release.
October 2007 Updated edition reflecting technical progress and changes in Program scope since the 2005 release.
NOTICE
This report was prepared as an account of work sponsored by an agency of the United States government. Neither the United States government nor any agency thereof, nor any of their employees, makes any warranty, express or implied, or assumes any legal liability or responsibility for the accuracy, completeness, or usefulness of any information, apparatus, product, or process disclosed, or represents that its use would not infringe privately owned rights. Reference herein to any specific commercial product, process, or service by trade name, trademark, manufacturer, or otherwise does not necessarily constitute or imply its endorsement, recommendation, or favoring by the United States government or any agency thereof. The views and opinions of authors expressed herein do not necessarily state or reflect those of the United States government or any agency thereof.
Page ii Multi-Year Research, Development and Demonstration Plan
2007
Table of Contents
Table of Contents
Foreword i Table of Contents iii Executive Summary ES-1
1.0 Introduction 1-1 1.1 Background 1-1 1.2 Program Vision 1-5 1.3 Hydrogen, Fuel Cells and Infrastructure Technologies Program Key Activities 1-5 1.4 Program Planning 1-8 1.5 Scope of Multi-Year RD&D Plan 1-11 1.6 Program Evaluation 1-11 1.7 Program Coordination 1-12 1.8 Transformation to a New Energy System 1-12
2.0 Program Benefits 2-1 2.1 U.S. Transportation Energy Challenges 2-1 2.2 Potential Impact of Fuel Cell Vehicle Introduction 2-8 2.3 Domestic Resources for Hydrogen Production 2-9 2.4 Potential Impact of Stationary Fuel Cells 2-11 2.5 Conclusion 2-12 References 2-12
3.0 Technical Plan 3.0-1 3.1 Hydrogen Production 3.1-1
3.1.1 Technical Goal and Objectives 3.1-1 3.1.2 Technical Approach 3.1-2 3.1.3 Programmatic Status 3.1-6 3.1.4 Technical Challenges 3.1-9 3.1.5 Technical Task Descriptions 3.1-32 3.1.6 Milestones 3.1-36
3.2 Hydrogen Delivery 3.2-1 3.2.1 Technical Goal and Objectives 3.2-1 3.2.2 Technical Approach 3.2-1 3.2.3 Programmatic Status 3.2-8 3.2.4 Technical Challenges 3.2-9 3.2.5 Technical Task Descriptions 3.2-22 3.2.6 Milestones 3.2-23
Multi-Year Research, Development and Demonstration Plan Page iii
2007
Table of Contents
3.3 Hydrogen Storage 3.3-1 3.3.1 Technical Goal and Objectives 3.3-1 3.3.2 Technical Approach 3.3-1 3.3.3 Programmatic Status 3.3-3 3.3.4 Technical Challenges 3.3-8 3.3.5 Technical Task Descriptions 3.3-16 3.3.6 Milestones 3.3-17
3.4 Fuel Cells 3.4-1 3.4.1 Technical Goal and Objectives 3.4-1 3.4.2 Technical Approach 3.1-2 3.4.3 Programmatic Status 3.4-3 3.4.4 Technical Challenges 3.4-11 3.4.5 Technical Task Descriptions 3.4-29 3.4.6 Milestones 3.4-32
3.5 Manufacturing R&D 3.5-1 3.5.1 Technical Goal and Objectives 3.5-1 3.5.2 Approach 3.5-2 3.5.3 Programmatic Status 3.5-4 3.5.4 Technical Challenges 3.5-7 3.5.5 Barriers 3.5-10 3.5.6 Technical Task Descriptions 3.5-13 3.5.7 Milestones 3.5-14
3.6 Technology Validation 3.6-1 3.6.1 Technical Goal and Objectives 3.6-1 3.6.2 Technical Approach 3.6-2 3.6.3 Programmatic Status 3.6-6 3.6.4 Technical Challenges 3.6-7 3.6.5 Technical Task Descriptions 3.6-10 3.6.6 Milestones 3.6-12
3.7 Hydrogen Codes and Standards 3.7-1 3.7.1 Goal and Objectives 3.7-1 3.7.2 Technical Approach 3.7-2 3.7.3 Programmatic Status 3.7-8 3.7.4 Challenges 3.7-16 3.7.5 Task Descriptions 3.7-19 3.7.6 Milestones 3.7-20
3.8. Hydrogen Safety 3.8-1 3.8.1 Goal and Objectives 3.8-1 3.8.2 Approach 3.8-2
Page iv Multi-Year Research, Development and Demonstration Plan
2007
Table of Contents
3.8.3 Programmatic Status 3.8-3 3.8.4 Challenges 3.8-6 3.8.5 Task Descriptions 3.8-8 3.8.6 Milestones 3.8-9
3.9 Education 3.9-1 3.9.1 Goal and Objectives 3.9-1 3.9.2 Approach 3.9-2 3.9.3 Programmatic Status 3.9-5 3.9.4 Challenges 3.9-7 3.9.5 Barriers 3.9-8 3.9.6 Task Descriptions 3.9-9 3.9.7 Milestones 3.9-10
4.0 Systems Analysis 4-1 4.1 Technical Goal and Objectives 4-1 4.2 Technical Approach 4-2 4.3 Systems Analysis Collaboration 4-6 4.4 Programmatic Status 4-8 4.5 Technical Challenges 4-11 4.6 Technical Task Descriptions 4-12 4.7 Milestones 4-12
5.0 Systems Integration 5-1 5.1 Goal and Objectives 5-1 5.2 Approach 5-2 5.3 Programmatic Status 5-9 5.4 Challenges 5-10 5.5 Task Descriptions 5-10 5.6 Milestones 5-11
6.0 Program Management and Operations 6-1 6.1 Program Organization 6-1 6.2 Program Management Approach 6-7 6.3 Program Elements 6-8 6.4 Program Implementation 6-9
Appendices Appendix A – Budgetary Information A-1 Appendix B – Input-Output Matrix B-1 Appendix C – Hydrogen Quality C-1 Appendix D – 2006 Annual Program Review Project Evaluation Form D-1 Appendix E – Acronyms E-1
Multi-Year Research, Development and Demonstration Plan Page v
2007
Executive Summary
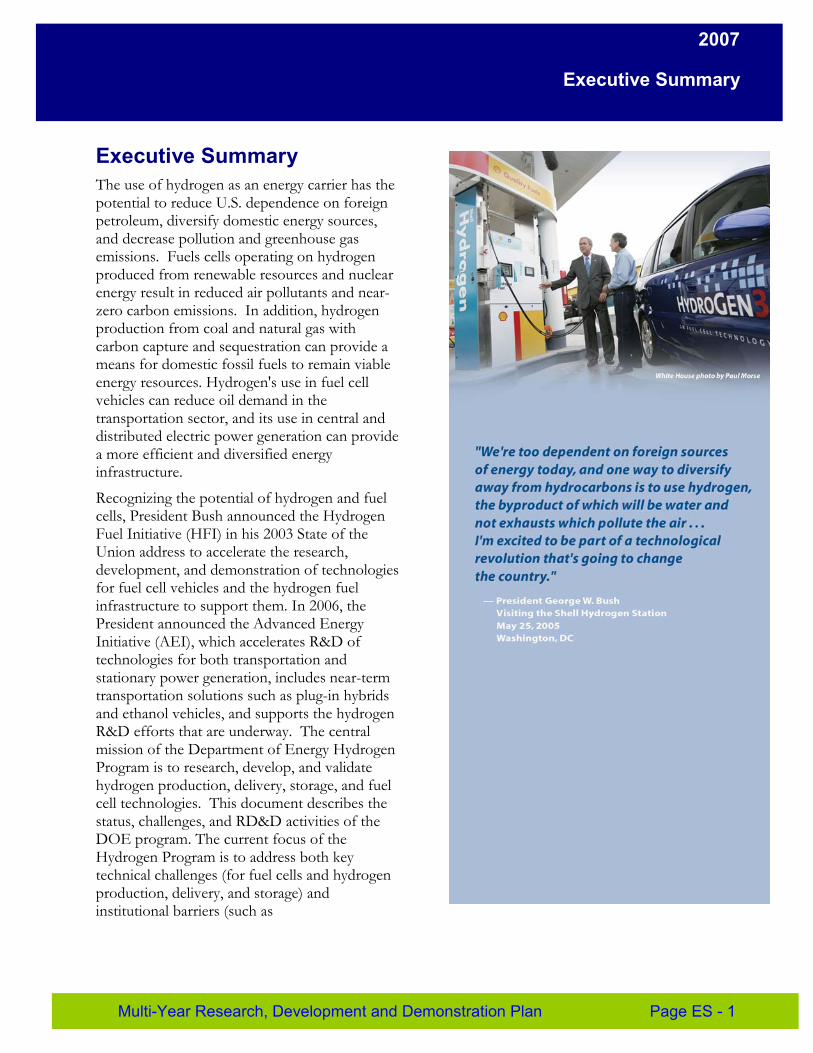
Executive Summary The use of hydrogen as an energy carrier has the potential to reduce U.S. dependence on foreign petroleum, diversify domestic energy sources, and decrease pollution and greenhouse gas emissions. Fuels cells operating on hydrogen produced from renewable resources and nuclear energy result in reduced air pollutants and near-zero carbon emissions. In addition, hydrogen production from coal and natural gas with carbon capture and sequestration can provide a means for domestic fossil fuels to remain viable energy resources. Hydrogen's use in fuel cell vehicles can reduce oil demand in the transportation sector, and its use in central and distributed electric power generation can provide a more efficient and diversified energy infrastructure.
Recognizing the potential of hydrogen and fuel cells, President Bush announced the Hydrogen Fuel Initiative (HFI) in his 2003 State of the Union address to accelerate the research, development, and demonstration of technologies for fuel cell vehicles and the hydrogen fuel infrastructure to support them. In 2006, the President announced the Advanced Energy Initiative (AEI), which accelerates R&D of technologies for both transportation and stationary power generation, includes near-term transportation solutions such as plug-in hybrids and ethanol vehicles, and supports the hydrogen R&D efforts that are underway. The central mission of the Department of Energy Hydrogen Program is to research, develop, and validate hydrogen production, delivery, storage, and fuel cell technologies. This document describes the status, challenges, and RD&D activities of the DOE program. The current focus of the Hydrogen Program is to address both key technical challenges (for fuel cells and hydrogen production, delivery, and storage) and institutional barriers (such as
Multi-Year Research, Development and Demonstration Plan Page ES - 1
2007
Executive Summary
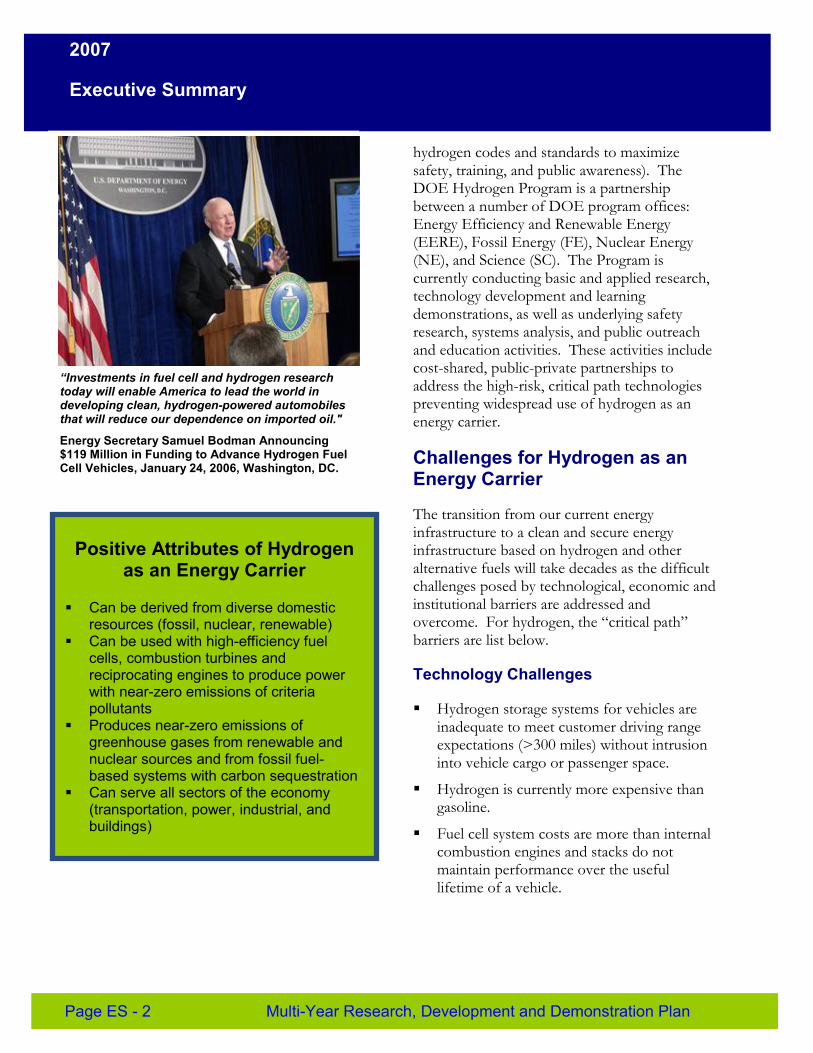
“Investments in fuel cell and hydrogen research today will enable America to lead the world in developing clean, hydrogen-powered automobiles that will reduce our dependence on imported oil."
Energy Secretary Samuel Bodman Announcing $119 Million in Funding to Advance Hydrogen Fuel Cell Vehicles, January 24, 2006, Washington, DC.
Positive Attributes of Hydrogen as an Energy Carrier
� Can be derived from diverse domestic resources (fossil, nuclear, renewable)
� Can be used with high-efficiency fuel cells, combustion turbines and reciprocating engines to produce power with near-zero emissions of criteria pollutants
� Produces near-zero emissions of greenhouse gases from renewable and nuclear sources and from fossil fuel-based systems with carbon sequestration
� Can serve all sectors of the economy (transportation, power, industrial, and buildings)
hydrogen codes and standards to maximize safety, training, and public awareness). The DOE Hydrogen Program is a partnership between a number of DOE program offices: Energy Efficiency and Renewable Energy (EERE), Fossil Energy (FE), Nuclear Energy (NE), and Science (SC). The Program is currently conducting basic and applied research, technology development and learning demonstrations, as well as underlying safety research, systems analysis, and public outreach and education activities. These activities include cost-shared, public-private partnerships to address the high-risk, critical path technologies preventing widespread use of hydrogen as an energy carrier.
Challenges for Hydrogen as an Energy Carrier
The transition from our current energy infrastructure to a clean and secure energy infrastructure based on hydrogen and other alternative fuels will take decades as the difficult challenges posed by technological, economic and institutional barriers are addressed and overcome. For hydrogen, the “critical path” barriers are list below.
Technology Challenges
� Hydrogen storage systems for vehicles are inadequate to meet customer driving range expectations (>300 miles) without intrusion into vehicle cargo or passenger space.
� Hydrogen is currently more expensive than gasoline.
� Fuel cell system costs are more than internal combustion engines and stacks do not maintain performance over the useful lifetime of a vehicle.
Page ES - 2 Multi-Year Research, Development and Demonstration Plan
2007
Executive Summary
Economic and Institutional Challenges
� Investment risk of developing a hydrogen delivery infrastructure is high, given technology status and current absence of hydrogen vehicle demand.
� Investment risk of developing manufacturing capability for hydrogen and fuel cell technologies is high.
� Uniform model codes and standards to ensure safety and insurability do not exist.
� Local code officials, policy makers and the general public lack education on hydrogen benefits and on safe handling and use.
Hydrogen Program Progress
� As a result of the Hydrogen Program, significant progress in overcoming the “critical path” challenges has been made over the past 3 years. The accomplishments include:
� Cost of polymer electrolyte membrane fuel cell systems has been reduced to $100/kW, 4x (in high volume) that of internal combustion engines.
� Cost of distributed hydrogen production from natural gas has been reduced to $3.00/gallon of gas equivalent (gge).
� New materials with potential for high hydrogen storage capacity have been identified and are under development.
� Learning demonstrations have provided valuable data on the current performance of fuel cell vehicles and hydrogen stations in real world applications.
"The prospect of massive penetration of renewable sources like wind, solar, geothermal, biomass, biofuels, hydrogen as well as new engine, battery storage, and vehicle efficiency technologies, is not only possible, it is something that is quantifiable; goals that can be planned, and pursued, and managed and funded. If we are willing to do what Americans do best: embrace innovation and entrepreneurship, marry science and commerce, think dynamically, and not be consumed by the seemingly static nature of the status quo."
DOE/EERE Assistant Secretary Alexander Karsner's remarks at the Advancing Renewable Energy Conference in St. Louis, Missouri, October 12, 2006.
“Critical-Path” Technologies Necessary for Developing a
Hydrogen Infrastructure
� More compact, lighter weight, lower cost, safe, and efficient higher storage systems
� Lower cost, more durable materials for advanced conversion technologies, especially fuel cells
� Lower cost methods for producing and delivering hydrogen
� Technologies for low cost carbon capture and containment for fossil-based production (a separate DOE program coordinated with the Hydrogen Program)
� Designs and materials that maximize the safety of hydrogen use
Multi-Year Research, Development and Demonstration Plan Page ES - 3

2007
Executive Summary
Developing hydrogen as a major energy carrier will require a combination of technological breakthroughs, market acceptance, and large investments in infrastructure. Success will be incremental over decades; and it will require an evolutionary process that phases hydrogen in, assisted by government policies, as the technologies and their markets mature.
Early market and niche applications (e.g., forklifts, stationary and portable power) can help pave the way for automotive fuel cells by accelerating development of manufacturing capability and facilitating customer acceptance. The successful development of hydrogen energy from diverse domestic resources will ensure that the United States has an abundant, reliable, and affordable supply of clean energy to maintain the nation’s prosperity throughout the 21st Century.
Page ES - 4 Multi-Year Research, Development and Demonstration Plan
2007
Introduction
1.0 Introduction The central mission of the Hydrogen Program is to research, develop, and validate hydrogen production, delivery, storage, and fuel cell technologies. Development of hydrogen as an energy carrier from diverse domestic resources will ensure that the United States has an abundant, reliable, and affordable supply of clean energy to maintain the nation’s prosperity throughout the 21st century.
The current focus of the Hydrogen Program is on addressing key technical challenges (for fuel cells and hydrogen production, delivery, and storage) and institutional barriers (such as hydrogen codes and standards to maximize safety, training, and public awareness). The Program is currently conducting basic and applied research, technology development and learning demonstrations, as well as safety research, systems analysis, and public outreach and education activities. These activities include cost-shared, public-private partnerships to address the high-risk, critical technology barriers preventing widespread use of hydrogen as an energy carrier. Public and private partners include automotive and power equipment manufacturers, energy and chemical companies, electric and natural gas utilities, building designers, standards development organizations, other Federal agencies, state government agencies, universities, national laboratories, and other national and international stakeholder organizations. The Hydrogen Program encourages the formation of collaborative partnerships to conduct RD&D and other activities that support Program goals.
The Program addresses the development of hydrogen energy systems for transportation, stationary power, and portable power applications. Transportation applications include fuel cell vehicles and hydrogen refueling infrastructure. Hydrogen used for back-up emergency power and residential electric power generation is included in stationary power applications. Consumer electronics such as cellular phones, hand-held computers, radios, and laptop computers are among portable power applications. The Department of Energy (DOE) is funding RD&D efforts that will provide the basis for the near-, mid-, and long-term production, delivery, storage, and use of hydrogen derived from diverse energy sources, including fossil fuel, nuclear energy, and renewable sources. This document describes the status, challenges, and RD&D activities of the DOE program.
1.1 Background
In the early 1970s, concern over the United States’ growing dependence on imported petroleum, coupled with concerns about our deteriorating air quality as a result of emissions from combustion of fossil fuels, prompted initial DOE activity supporting hydrogen technology. In the late 1980s, DOE initiated the Fuel Cells for Transportation Program to develop polymer electrolyte membrane fuel cells (PEMFCs) for automotive use. The DOE Hydrogen Program utilizes the results of these past efforts and incorporates the direction and guidance of the National Energy Policy (May 2001), the DOE Strategic Plan (November 2006), the FreedomCAR and Fuel Partnership (March 2006), the National Hydrogen Vision (February 2002), the National Hydrogen Energy Roadmap (November 2002), the President’s Hydrogen Fuel Initiative (January 2003), the Energy Policy Act of 2005 (August 2005) and the Advanced Energy Initiative (January 2006). In addition, the DOE Hydrogen Program has incorporated the contributions and ideas of hundreds of experts from U.S. and international industry, government, and academia. The DOE Hydrogen Program includes activities being conducted by a
Multi-Year Research, Development and Demonstration Plan Page 1 - 1
2007
Introduction
number of DOE program offices: Energy Efficiency and Renewable Energy (EERE), Fossil Energy (FE), Nuclear Energy (NE), and Science (SC).
Key Drivers for a Hydrogen-Based Energy System
Three major factors require new approaches to the way the United States produces, delivers, and uses energy. These drivers are as follows:
� Energy security
� Environmental quality
� Economic vitality.
Energy Security
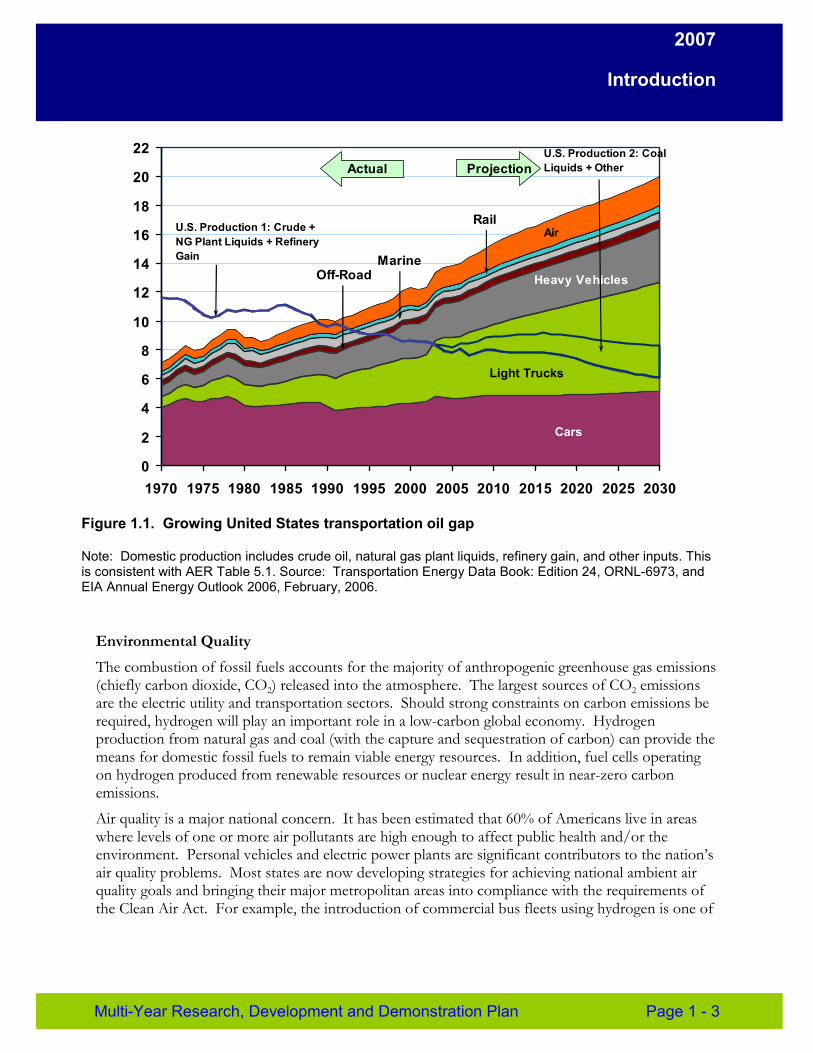
The need to expand the supply of domestically produced energy is significant. America’s transportation sector relies almost exclusively on refined petroleum products. As shown in Figure 1.1, more than 60% of the petroleum consumed for transportation in the United States is imported, and that percentage is expected to rise steadily for the foreseeable future. On a global scale, petroleum supplies will be in increasingly higher demand as highly populated developing countries expand their economies and become more energy-intensive. Hydrogen-powered fuel cell vehicles would virtually eliminate imports of foreign oil, because the hydrogen fuel can be produced almost entirely from the diverse domestic energy sources of fossil fuel, renewable resources, and nuclear power. Hydrogen’s role as a major energy carrier would also provide the United States with a more efficient and diversified energy infrastructure that includes a variety of options for fueling central and distributed electric power generation systems.
Page 1 - 2 Multi-Year Research, Development and Demonstration Plan
2007
Introduction
22
20
18
16
14
12
10
8
6
4
2
0
Actual Projection Liquids + Other U.S. Production 2: Coal
U.S. Production 1: Crude + Rail Air
Marine NG Plant Liquids + Refinery Gain
Off-Road Heavy Vehicles
Light Trucks
Cars
1970 1975 1980 1985 1990 1995 2000 2005 2010 2015 2020 2025 2030
Figure 1.1. Growing United States transportation oil gap
Note: Domestic production includes crude oil, natural gas plant liquids, refinery gain, and other inputs. This is consistent with AER Table 5.1. Source: Transportation Energy Data Book: Edition 24, ORNL-6973, and EIA Annual Energy Outlook 2006, February, 2006.
Environmental Quality
The combustion of fossil fuels accounts for the majority of anthropogenic greenhouse gas emissions (chiefly carbon dioxide, CO2) released into the atmosphere. The largest sources of CO2 emissions are the electric utility and transportation sectors. Should strong constraints on carbon emissions be required, hydrogen will play an important role in a low-carbon global economy. Hydrogen production from natural gas and coal (with the capture and sequestration of carbon) can provide the means for domestic fossil fuels to remain viable energy resources. In addition, fuel cells operating on hydrogen produced from renewable resources or nuclear energy result in near-zero carbon emissions.
Air quality is a major national concern. It has been estimated that 60% of Americans live in areas where levels of one or more air pollutants are high enough to affect public health and/or the environment. Personal vehicles and electric power plants are significant contributors to the nation’s air quality problems. Most states are now developing strategies for achieving national ambient air quality goals and bringing their major metropolitan areas into compliance with the requirements of the Clean Air Act. For example, the introduction of commercial bus fleets using hydrogen is one of
Multi-Year Research, Development and Demonstration Plan Page 1 - 3
2007
Introduction
the approaches that local governments are taking to improve air quality. The State of California, where 90% of the population breathes unhealthy levels of one or more air pollutants during some part of the year, has been one of the most aggressive states in its strategies and has launched a number of programs targeted at improving urban air quality.
Economic Vitality
It is clear that national economic security is heavily dependent on our energy security. It is also clear that there is growing worldwide interest in hydrogen and fuel cell technology, as reflected in the dramatic increase in public and private spending since the mid-1990s. In 2001, the Japanese government nearly doubled its fuel cell R&D budget to $220 million and launched a joint government/industry demonstration of hydrogen fuel cell vehicles, including the deployment of more than seven new hydrogen refueling stations. The Japanese fuel cell budget has continued to grow and was $354 million in 2005. Governments and industries in Canada, Europe, and Asia are also investing heavily in hydrogen research, development, and demonstration. For example, 29 new hydrogen refueling stations will be built across Europe over the next few years to fuel hydrogen-powered buses: www.fuelcells.org/info/charts/h2fuelingstations.pdf The U.S. must be a leader in hydrogen and fuel cell technology development and commercialization in order to secure a competitive position for future energy technology innovations, new products, and service offerings.
Challenges for Hydrogen as an Energy Carrier
The transition from our current energy infrastructure to a clean and secure energy infrastructure based on hydrogen and other alternative fuels will take decades as the difficult challenges posed by technological, economic and institutional barriers are addressed and overcome. For hydrogen, the “critical path” barriers are summarized in the following sections.
Technology Challenges
� Hydrogen storage systems for vehicles are inadequate to meet customer driving range expectations (>300 miles) without intrusion into vehicle cargo or passenger space.
� Hydrogen is currently more expensive than gasoline.
� Fuel cells stacks do not maintain performance over the full useful lifetime of a vehicle.
Economic and Institutional Challenges
� Investment risk of developing a hydrogen delivery infrastructure is high, given technology status and current lack of hydrogen vehicle demand.
� Uniform model codes and standards to ensure safety and insurability do not exist.
� Local code officials, policy makers and the general public lack education on hydrogen benefits and on safe handling and use.
� Developing a manufacturing and component supplier base for hydrogen and fuel cell technologies.
Page 1 - 4 Multi-Year Research, Development and Demonstration Plan
2007
Introduction
1.2 Program Vision
Today, after decades of dependence on imported petroleum to fuel the United States’ transportation sector, our nation has a new vision for our energy future: forms of domestically derived, clean energy to power not only our vehicles but our industries, buildings and homes. In addition to clean coal (with carbon sequestration) and nuclear energy, the energy carriers of the future will include electricity from renewable sources, alternative liquid fuels (e.g., bio-based or renewable fuels), and hydrogen.
In the long-term vision, which will take several decades to achieve, hydrogen will be available in all regions of the country and will serve all sectors of the economy. It will be produced from fossil fuels (with carbon capture and sequestration), renewable resources, and nuclear energy. It will be used in the transportation, electric power, and consumer sectors. Hydrogen will be produced in centralized facilities and in distributed facilities at fueling stations, rural areas, and community locations. Hydrogen production and storage costs will be competitive; the basic components of a national hydrogen delivery and distribution network will be in place; and hydrogen-powered fuel cells, engines, and turbines will have become mature technologies in mass production for use in cars, homes, offices, and factories.
Hydrogen will be a fuel for government and commercial vehicle fleets, as well as personal vehicles and light-duty trucks. It will be used in fuel cells for both mobile and stationary applications. U.S. companies that invested for decades to commercialize hydrogen technologies will be exporting products and services around the world.
1.3 Hydrogen, Fuel Cells and Infrastructure Technologies Program Key Activities
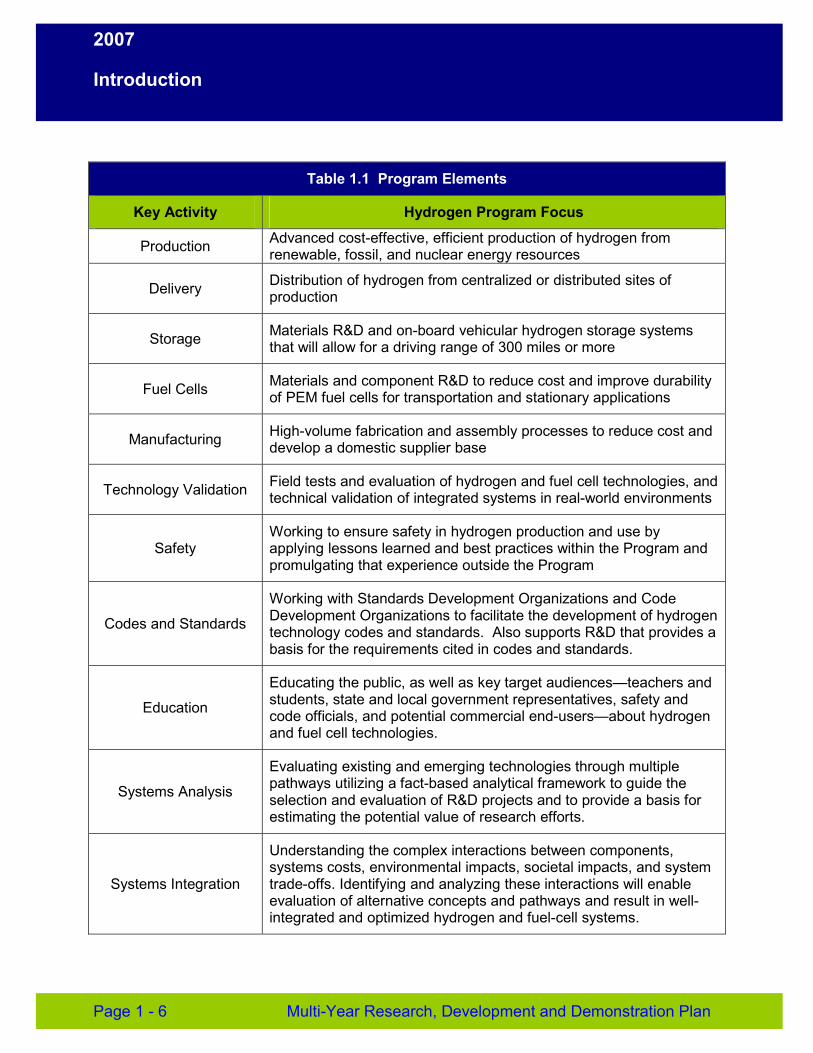
The DOE Office of Energy Efficiency and Renewable Energy’s Hydrogen, Fuel Cells and Infrastructure Technologies (HFCIT) Program is facilitating the research and technology development efforts needed for hydrogen and fuel cell technology readiness. The HFCIT Program is the lead for directing and integrating R&D and deployment activities in hydrogen production, storage, delivery and end use for transportation and stationary applications. Table 1.1 lists the elements that are part of HFCIT. This Program responds to recommendations in the President’s National Energy Policy, the National Hydrogen Energy Vision and Roadmap, DOE Strategic Plans, the National Academies, the Hydrogen Technical Advisory Committee, and the Energy Policy Act of 2005.
The HFCIT Program collaborates in partnership with industry, academia and national laboratories, as well as closely coordinates activities with the FreedomCAR and Vehicle Technologies Program and other DOE Programs to achieve four of EERE’s strategic goals relevant to the HFCIT Program, as follows:
� Dramatically reduce dependence on foreign oil
� Promote the use of diverse, domestic and sustainable energy resources
� Reduce carbon emissions from energy production and consumption
� Increase the reliability and efficiency of electricity generation.
Multi-Year Research, Development and Demonstration Plan Page 1 - 5
2007
Introduction
Table 1.1 Program Elements
Key Activity Hydrogen Program Focus
Production Advanced cost-effective, efficient production of hydrogen from renewable, fossil, and nuclear energy resources
Delivery Distribution of hydrogen from centralized or distributed sites of production
Storage Materials R&D and on-board vehicular hydrogen storage systems that will allow for a driving range of 300 miles or more
Fuel Cells Materials and component R&D to reduce cost and improve durability of PEM fuel cells for transportation and stationary applications
Manufacturing High-volume fabrication and assembly processes to reduce cost and develop a domestic supplier base
Technology Validation Field tests and evaluation of hydrogen and fuel cell technologies, and technical validation of integrated systems in real-world environments
Safety Working to ensure safety in hydrogen production and use by applying lessons learned and best practices within the Program and promulgating that experience outside the Program
Codes and Standards
Working with Standards Development Organizations and Code Development Organizations to facilitate the development of hydrogen technology codes and standards. Also supports R&D that provides a basis for the requirements cited in codes and standards.
Education
Educating the public, as well as key target audiences—teachers and students, state and local government representatives, safety and code officials, and potential commercial end-users—about hydrogen and fuel cell technologies.
Systems Analysis
Evaluating existing and emerging technologies through multiple pathways utilizing a fact-based analytical framework to guide the selection and evaluation of R&D projects and to provide a basis for estimating the potential value of research efforts.
Systems Integration
Understanding the complex interactions between components, systems costs, environmental impacts, societal impacts, and system trade-offs. Identifying and analyzing these interactions will enable evaluation of alternative concepts and pathways and result in well-integrated and optimized hydrogen and fuel-cell systems.
Page 1 - 6 Multi-Year Research, Development and Demonstration Plan
2007
Introduction
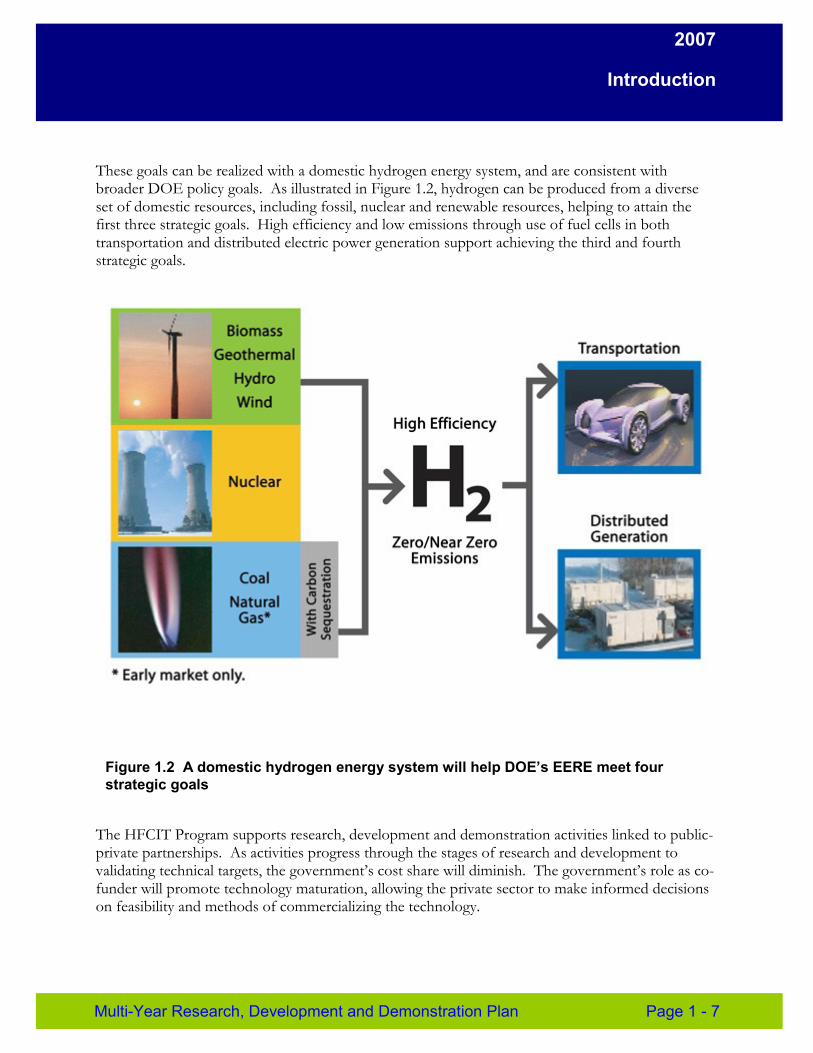
These goals can be realized with a domestic hydrogen energy system, and are consistent with broader DOE policy goals. As illustrated in Figure 1.2, hydrogen can be produced from a diverse set of domestic resources, including fossil, nuclear and renewable resources, helping to attain the first three strategic goals. High efficiency and low emissions through use of fuel cells in both transportation and distributed electric power generation support achieving the third and fourth strategic goals.
Figure 1.2 A domestic hydrogen energy system will help DOE’s EERE meet four strategic goals
The HFCIT Program supports research, development and demonstration activities linked to public-private partnerships. As activities progress through the stages of research and development to validating technical targets, the government’s cost share will diminish. The government’s role as co-funder will promote technology maturation, allowing the private sector to make informed decisions on feasibility and methods of commercializing the technology.
Multi-Year Research, Development and Demonstration Plan Page 1 - 7
2007
Introduction
1.4 Program Planning
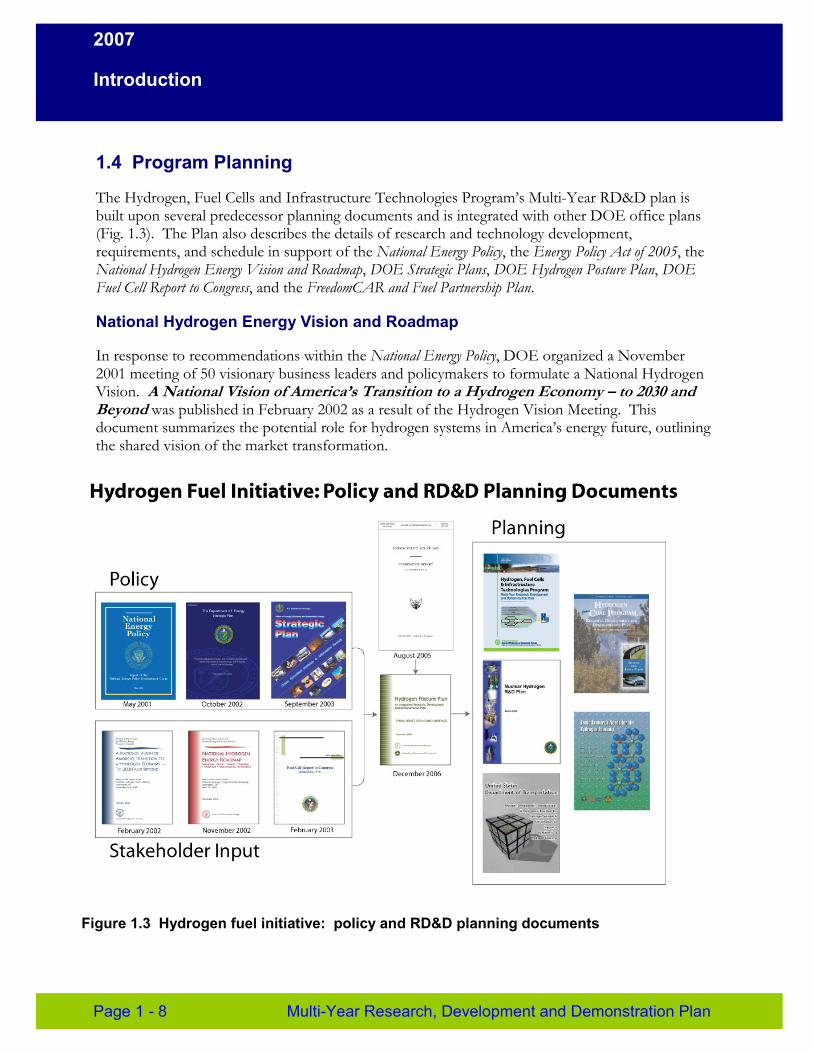
The Hydrogen, Fuel Cells and Infrastructure Technologies Program’s Multi-Year RD&D plan is built upon several predecessor planning documents and is integrated with other DOE office plans (Fig. 1.3). The Plan also describes the details of research and technology development, requirements, and schedule in support of the National Energy Policy, the Energy Policy Act of 2005, the National Hydrogen Energy Vision and Roadmap, DOE Strategic Plans, DOE Hydrogen Posture Plan, DOE Fuel Cell Report to Congress, and the FreedomCAR and Fuel Partnership Plan.
National Hydrogen Energy Vision and Roadmap
In response to recommendations within the National Energy Policy, DOE organized a November 2001 meeting of 50 visionary business leaders and policymakers to formulate a National Hydrogen Vision. A National Vision of America’s Transition to a Hydrogen Economy – to 2030 and Beyond was published in February 2002 as a result of the Hydrogen Vision Meeting. This document summarizes the potential role for hydrogen systems in America’s energy future, outlining the shared vision of the market transformation.
Figure 1.3 Hydrogen fuel initiative: policy and RD&D planning documents
Page 1 - 8 Multi-Year Research, Development and Demonstration Plan
2007
Introduction
In April 2002, DOE followed up with a larger group of over 200 technical experts from industry, academia, and the national laboratories to develop a National Hydrogen Energy Roadmap. This roadmap, released in November 2002, describes the principal challenges to be overcome and recommends paths forward to achieve the vision.
DOE Strategic Planning
Building on the recommendations of the National Energy Policy and the National Hydrogen Energy Vision and Roadmap, DOE’s and EERE’s strategic plans provide the broad direction under which the Multi-Year RD&D Plan was formulated.
A central goal in the Department of Energy’s Strategic Plan (October 2006) is to protect our national and economic security by promoting a diverse supply and delivery of reliable, affordable and environmentally sound energy. Development of hydrogen and fuel cell technologies is identified as a key strategy in attaining this strategic goal.
EERE’s Strategic Plan (November 2006) supports DOE’s Strategic Plan. In its response to the DOE Secretary’s challenge, the EERE Plan states its approach is to “leapfrog the status quo” and to pursue “dramatic environmental benefits” in energy efficiency and renewable energy technologies. As discussed in Section 1.3 above, four goals specified in EERE’s Strategic Plan are particularly relevant to the HFCIT Program and guide its focus on the areas of dependence on foreign oil, energy resources, carbon emissions, and electricity generation.
Hydrogen Posture Plan
In February 2004, DOE published its Hydrogen Posture Plan, which describes DOE’s “plan for successfully integrating and implementing technology research, development and demonstration activities needed to cost-effectively produce, store and distribute hydrogen for use in fuel cell vehicles and electricity generation.” Research, development and demonstration efforts across the DOE Offices of EERE, Nuclear Energy, Fossil Energy, and Science, and the Department of Transportation are described and are consistent with the recommendations in the National Hydrogen Energy Roadmap. The Hydrogen Posture Plan is the key supporting document underpinning the President’s Hydrogen Fuel Initiative. It was updated in fiscal year 2007 to reflect progress and to address the implications of EPACT 2005.
DOE Fuel Cell Report to Congress
Another document that provides a framework for the Multi-Year RD&D Plan is DOE’s Fuel Cell Report to Congress (February 2003). This report summarizes the technical and economic barriers to the use of fuel cells in transportation, portable power, stationary and distributed power generation applications, and also provides a preliminary assessment of the need for public-private cooperative programs to demonstrate the use of fuel cells in commercial-scale applications by 2015. Specifically, the report recommends federally sponsored programs to do the following:
� Focus on advanced materials, manufacturing techniques and other advancements that will lower costs, increase longevity, and improve reliability of fuel cell systems
Multi-Year Research, Development and Demonstration Plan Page 1 - 9
2007
Introduction
� Increase emphasis on hydrogen production and delivery infrastructure, storage, codes and standards development, and education
� Develop public-private learning demonstrations, namely, a transportation and infrastructure partnership, as an integrated means of addressing commercialization barriers through collaboration between energy and auto industries.
FreedomCAR and Fuel Partnership
In January 2002, the FreedomCAR Partnership was established as a research and development collaboration between the Department of Energy and the U.S. Council for Automotive Research (USCAR), a partnership formed by Ford Motor Company, DaimlerChrysler Corporation, and General Motors Corporation. In September 2003, the Partnership was expanded to the FreedomCAR and Fuel Partnership by bringing the major energy companies (BP America, Chevron Corporation, ConocoPhillips, ExxonMobil Corporation and Shell Hydrogen) to the table.
The Partnership examines the pre-competitive, high-risk research required to develop the vehicle and infrastructure technologies that will enable a full range of affordable cars and light trucks. These technologies will reduce the dependence of the nation’s personal transportation system on imported oil and minimize harmful vehicle emissions, without sacrificing freedom of mobility and freedom of vehicle choice. The “freedom” principle is framed by the following:
� Freedom from dependence on imported oil
� Freedom from pollutant emissions
� Freedom for Americans to choose the kind of vehicle they want to drive, and to drive where they want, when they want
� Freedom to obtain fuel affordably and conveniently.
Energy Policy Act of 2005
The Multi-Year RD&D Plan also directly supports the Energy Policy Act of 2005 (EPACT 2005). The Plan serves not only to establish the milestones and tasks of the programs, but also reports goals, challenges, and progress to the Secretary of Energy, Congress, and stakeholders.
President Bush signed EPACT 2005 into law in August 2005 (Public Law 109-058). This historic legislation supports many of the principles outlined in the National Energy Policy to strengthen our nation's electricity infrastructure, reduce dependence on foreign oil, increase conservation, and expand the use of clean, renewable energy.
Title VIII of EPACT 2005 focuses on hydrogen and reflects strong Congressional support for research and development of hydrogen and fuel cell technologies. The alignment of EPACT 2005 with the President’s Hydrogen Fuel Initiative demonstrates the unified commitment of the nation’s leaders to reducing dependence on foreign oil through the development of a hydrogen-based energy system. EPACT 2005 makes the long-term commitment necessary for a market transformation by authorizing the Program through 2020 and requires coordinated plans and documentation of the Program’s activities.
Page 1 - 10 Multi-Year Research, Development and Demonstration Plan
2007
Introduction
1.5 Scope of Multi-Year RD&D Plan
Implementation of the Hydrogen, Fuel Cells and Infrastructure Technologies Program will be governed by its Multi-Year Research, Development and Demonstration (RD&D) Plan, which covers the period 2004 through 2017 and describes the activities that the HFCIT Program will undertake to implement the President’s initiative. The Plan addresses technologies for hydrogen production, delivery, storage and infrastructure, as well as fuel cells for transportation, stationary, and portable power applications. Government resources for these RD&D activities will be fully leveraged through partnerships with industry as the nation moves toward hydrogen as an energy carrier. The Plan’s aim is to bring technologies to the point where early adopters can begin to implement them and manufacturers can invest in plant and capital equipment with confidence that markets are emerging.
Planned activities are focused on technologies for hydrogen production, delivery, and storage; fuel cells for transportation and stationary applications; technology validation; codes and standards; safety; education; systems analysis; systems integration; and manufacturing and market transformation. Goals, objectives and technical targets are identified through 2017 for each of these Program elements, and milestones and schedules are identified for the years 2004 through 2017. While the government’s role is essential to advancing hydrogen and fuel cell technologies in the early stages of development, once the technical targets are validated in a systems context, the government’s role will diminish and industry will take over commercialization. The government will help by promoting market transformation through policy and incentives, and support of early adopter activities. To continue moving efficiently toward the goal of technology readiness, the Plan will be updated periodically to reflect technological advances, system changes, and policy decisions.
1.6 Program Evaluation
The Department of Energy commissioned the National Academies to review the June 2003 draft RD&D Plan. Almost all of the resulting report’s recommendations have been or will be incorporated into the Program. Some of the significant points in the report were as follows:
� Establish a comprehensive systems analysis capability to drive technology development decisions relevant to energy, environmental and economic criteria
� Establish an independent systems integration effort to ensure that the various Program elements (such as production, delivery, and storage) fit together seamlessly
� Increase emphasis on hydrogen safety to understand how hydrogen systems must be designed, built and operated differently from today’s vehicles and infrastructure
� Engage universities to play a much bigger role in the research program.
The actions taken in response to these recommendations include the enhancement of the Program's systems analysis capabilities, establishment of a Systems Integration Office, creation of a hydrogen safety experts panel to help DOE audit safety plans and practices within the Program; and the competitive selection of numerous universities to carry out hydrogen production, storage, and fuel cell research.
Multi-Year Research, Development and Demonstration Plan Page 1 - 11
2007
Introduction
In addition, DOE created the Hydrogen and Fuel Cell Technical Advisory Committee (HTAC) in 2006 to review the Program. The Committee's responsibility, as required by EPACT, is to provide technical and programmatic advice to the Energy Secretary on hydrogen research, development, and demonstration efforts. The Annual Merit Review and Peer Evaluation provides an additional means of Program assessment. At this annual meeting, most of the projects within the Hydrogen Program are reviewed by experts. These reviews may be used to make changes in the scope and direction of the projects.
1.7 Program Coordination
The DOE Hydrogen Program coordinates its activities with other Federal agencies through the Interagency Task Force, with States and regional entities by participating in organizations such as the California Fuel Cell Partnership and the Upper Midwest Hydrogen Initiative, and with other countries through the International Partnership for the Hydrogen Economy (IPHE) and the International Energy Agency.
In November 2003, the United States hosted the inaugural Ministerial meeting of IPHE, which brought together 16 countries and the European Union and helped launch international cooperation on vital hydrogen-related research activities. The IPHE provides a mechanism to organize, evaluate and coordinate multinational research, development and deployment programs that advance the transition to a global market transformation. The IPHE leverages resources; identifies promising directions for RD&D and commercial use; provides technical assessments for policy decisions; prioritizes, identifies gaps and develops common recommendations for international codes, standards and safety protocols. Additionally, the IPHE maintains communications with the key stakeholders to foster public-private collaboration that addresses the technological, financial and institutional barriers to a cost-competitive, standardized, widely accessible, safe and environmentally benign market transformation.
In accordance with the Energy Policy Act of 2005, the Interagency Hydrogen and Fuel Cell Technical Task Force works toward a safe, economical, and environmentally sound hydrogen fuel infrastructure by coordinating the efforts of the Office of Science and Technology Policy; the Departments of Energy, Transportation, Defense, Commerce, and Agriculture; the Office of Management and Budget; National Science Foundation; Environmental Protection Agency; National Aeronautics and Space Administration; and other agencies as appropriate. In 2005, the Task Force created a website at www.hydrogen.gov to provide information on all Federal hydrogen and fuel cell activities.
1.8 Transformation to a New Energy System
The transition to non-petroleum fuels such as hydrogen will take several decades, and this transition will require strong public and private partnerships, substantial investment, and unwavering resolve. In the next two decades, conservation and increased efficiency through the use of gasoline-electric hybrid vehicles is the near-term approach to reducing oil use and emissions in transportation. Ultimately, however, gasoline substitution using fuels such as ethanol and hydrogen will be required to achieve energy independence while minimizing environmental impacts. Government can foster further growth by playing the role of “early adopter” and by creating policies and incentives that further stimulate the market.
Page 1 - 12 Multi-Year Research, Development and Demonstration Plan
2007
Benefits
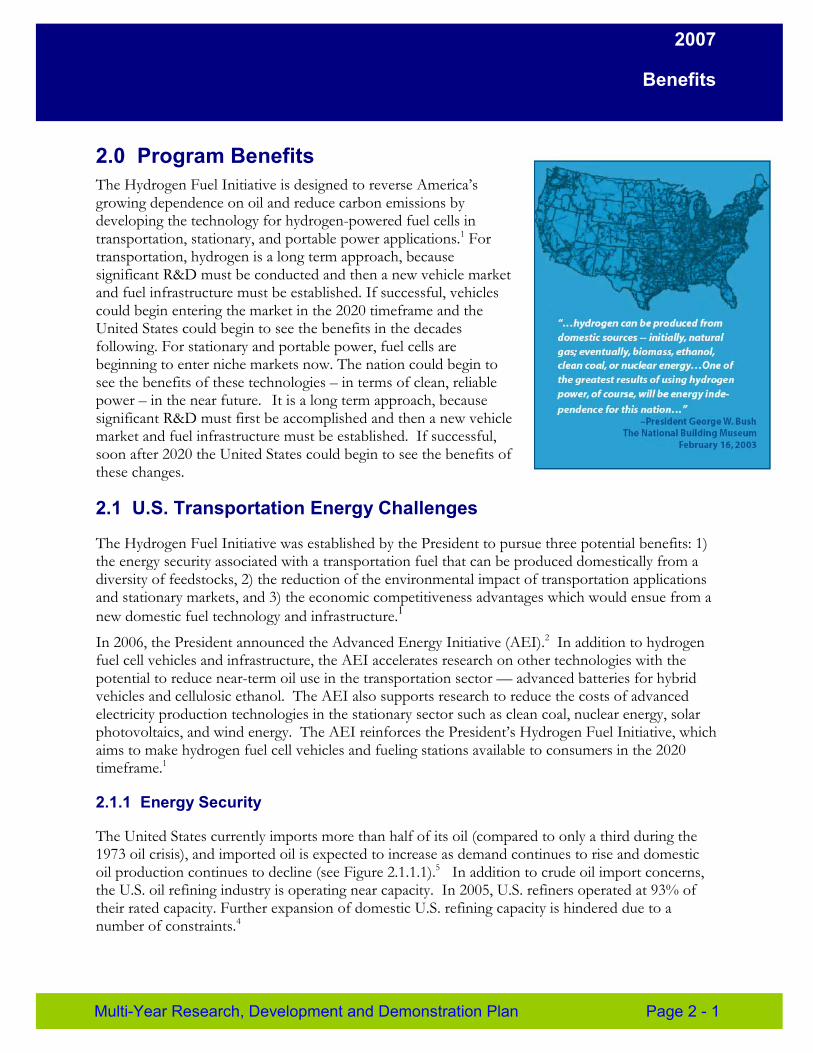
2.0 Program Benefits The Hydrogen Fuel Initiative is designed to reverse America’s growing dependence on oil and reduce carbon emissions by developing the technology for hydrogen-powered fuel cells in transportation, stationary, and portable power applications.1 For transportation, hydrogen is a long term approach, because significant R&D must be conducted and then a new vehicle market and fuel infrastructure must be established. If successful, vehicles could begin entering the market in the 2020 timeframe and the United States could begin to see the benefits in the decades following. For stationary and portable power, fuel cells are beginning to enter niche markets now. The nation could begin to see the benefits of these technologies – in terms of clean, reliable power – in the near future. It is a long term approach, because significant R&D must first be accomplished and then a new vehicle market and fuel infrastructure must be established. If successful, soon after 2020 the United States could begin to see the benefits of these changes.
2.1 U.S. Transportation Energy Challenges
The Hydrogen Fuel Initiative was established by the President to pursue three potential benefits: 1) the energy security associated with a transportation fuel that can be produced domestically from a diversity of feedstocks, 2) the reduction of the environmental impact of transportation applications and stationary markets, and 3) the economic competitiveness advantages which would ensue from a new domestic fuel technology and infrastructure.1
In 2006, the President announced the Advanced Energy Initiative (AEI).2 In addition to hydrogen fuel cell vehicles and infrastructure, the AEI accelerates research on other technologies with the potential to reduce near-term oil use in the transportation sector — advanced batteries for hybrid vehicles and cellulosic ethanol. The AEI also supports research to reduce the costs of advanced electricity production technologies in the stationary sector such as clean coal, nuclear energy, solar photovoltaics, and wind energy. The AEI reinforces the President’s Hydrogen Fuel Initiative, which aims to make hydrogen fuel cell vehicles and fueling stations available to consumers in the 2020 timeframe.1
2.1.1 Energy Security
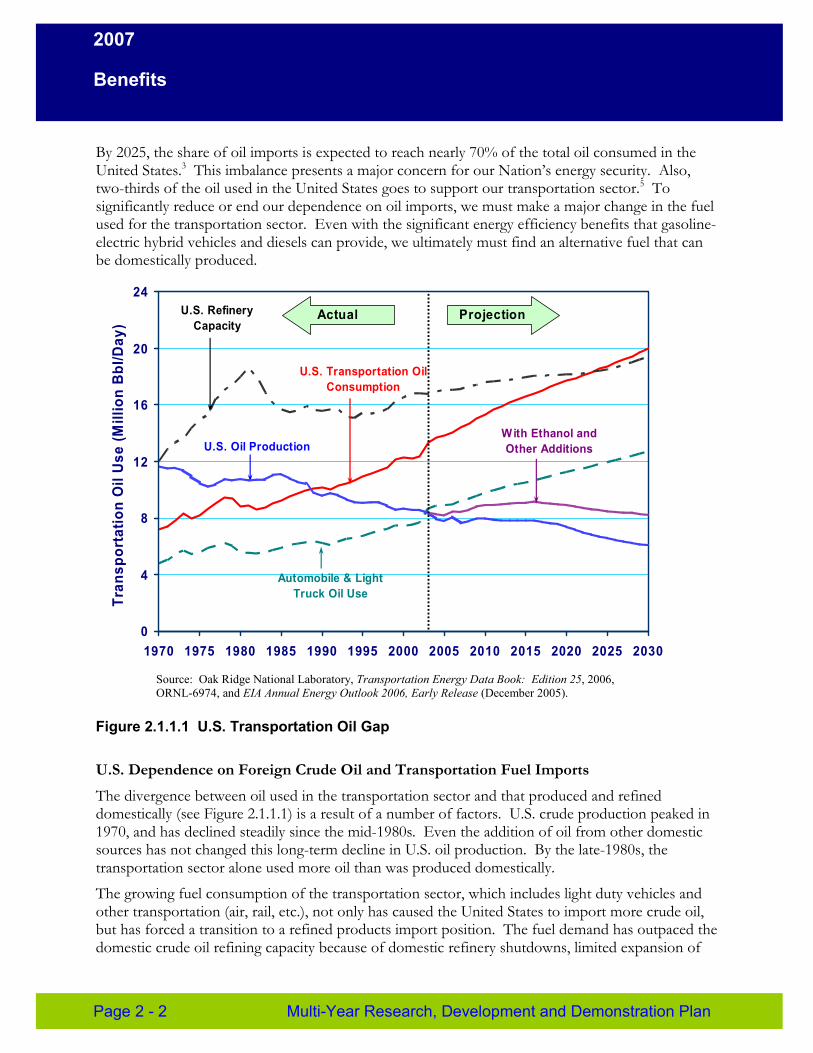
The United States currently imports more than half of its oil (compared to only a third during the 1973 oil crisis), and imported oil is expected to increase as demand continues to rise and domestic oil production continues to decline (see Figure 2.1.1.1).5 In addition to crude oil import concerns, the U.S. oil refining industry is operating near capacity. In 2005, U.S. refiners operated at 93% of their rated capacity. Further expansion of domestic U.S. refining capacity is hindered due to a number of constraints.4
Multi-Year Research, Development and Demonstration Plan Page 2 - 1
2007
Benefits
By 2025, the share of oil imports is expected to reach nearly 70% of the total oil consumed in the United States.3 This imbalance presents a major concern for our Nation’s energy security. Also, two-thirds of the oil used in the United States goes to support our transportation sector.5 To significantly reduce or end our dependence on oil imports, we must make a major change in the fuel used for the transportation sector. Even with the significant energy efficiency benefits that gasoline-electric hybrid vehicles and diesels can provide, we ultimately must find an alternative fuel that can be domestically produced.
Tran
spor
tatio
n O
il U
se (M
illio
n B
bl/D
ay)
24
20
16
12
8
4
0
U.S. Refinery Capacity
Actual Projection
U.S. Transportation Oil Consumption
U.S. Oil Production With Ethanol and Other Additions
Automobile & Light Truck Oil Use
1970 1975 1980 1985 1990 1995 2000 2005 2010 2015 2020 2025 2030
Source: Oak Ridge National Laboratory, Transportation Energy Data Book: Edition 25, 2006, ORNL-6974, and EIA Annual Energy Outlook 2006, Early Release (December 2005).
Figure 2.1.1.1 U.S. Transportation Oil Gap
U.S. Dependence on Foreign Crude Oil and Transportation Fuel Imports
The divergence between oil used in the transportation sector and that produced and refined domestically (see Figure 2.1.1.1) is a result of a number of factors. U.S. crude production peaked in 1970, and has declined steadily since the mid-1980s. Even the addition of oil from other domestic sources has not changed this long-term decline in U.S. oil production. By the late-1980s, the transportation sector alone used more oil than was produced domestically.
The growing fuel consumption of the transportation sector, which includes light duty vehicles and other transportation (air, rail, etc.), not only has caused the United States to import more crude oil, but has forced a transition to a refined products import position. The fuel demand has outpaced the domestic crude oil refining capacity because of domestic refinery shutdowns, limited expansion of
Page 2 - 2 Multi-Year Research, Development and Demonstration Plan
2007
Benefits
existing refineries, and a lack of construction of new domestic refineries (the last new domestic refinery was constructed in the 1970s). As a result, increasing amounts of oil supplied for the U.S. transportation sector will be in the form of refined transportation fuels.
In an effort to offset the growing fuel demand, an increase in the average fuel efficiency for light-duty vehicles would only slow the rate of oil consumption for a short period of time. Continued growth in the number of vehicles and the amount of travel would overwhelm the beneficial effects within a few years without continued vehicle fuel economy improvements. The combination of efficiency improvements and increased domestic oil production does not close the transportation oil gap, which will widen again unless the transportation system eventually moves to a non-petroleum fuel.3, 5
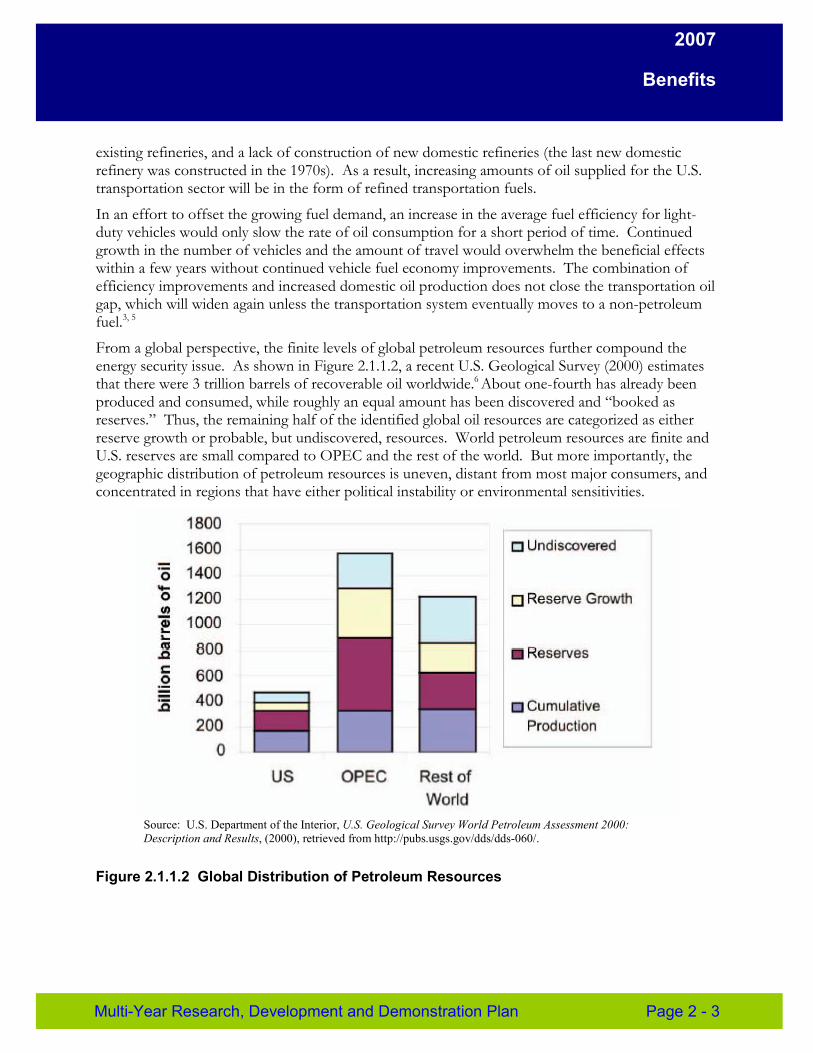
From a global perspective, the finite levels of global petroleum resources further compound the energy security issue. As shown in Figure 2.1.1.2, a recent U.S. Geological Survey (2000) estimates that there were 3 trillion barrels of recoverable oil worldwide.6 About one-fourth has already been produced and consumed, while roughly an equal amount has been discovered and “booked as reserves.” Thus, the remaining half of the identified global oil resources are categorized as either reserve growth or probable, but undiscovered, resources. World petroleum resources are finite and U.S. reserves are small compared to OPEC and the rest of the world. But more importantly, the geographic distribution of petroleum resources is uneven, distant from most major consumers, and concentrated in regions that have either political instability or environmental sensitivities.
Source: U.S. Department of the Interior, U.S. Geological Survey World Petroleum Assessment 2000: Description and Results, (2000), retrieved from http://pubs.usgs.gov/dds/dds-060/.
Figure 2.1.1.2 Global Distribution of Petroleum Resources
Multi-Year Research, Development and Demonstration Plan Page 2 - 3
2007
Benefits
Global Transportation Trends
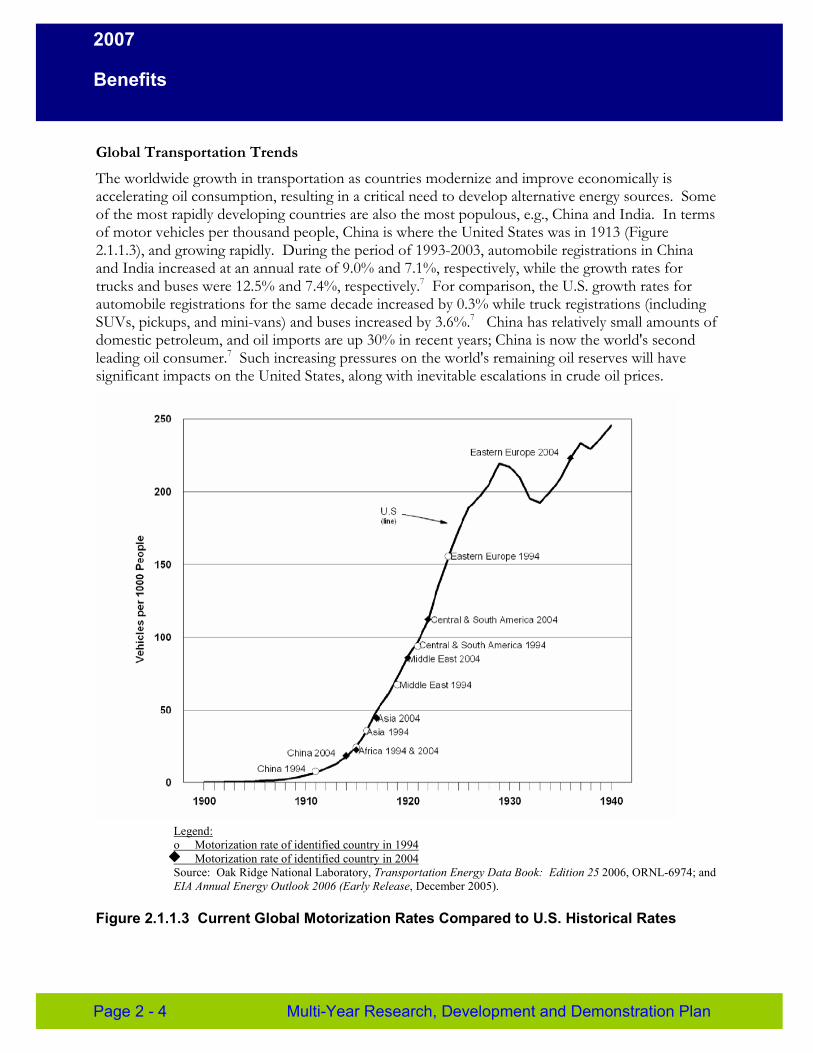
The worldwide growth in transportation as countries modernize and improve economically is accelerating oil consumption, resulting in a critical need to develop alternative energy sources. Some of the most rapidly developing countries are also the most populous, e.g., China and India. In terms of motor vehicles per thousand people, China is where the United States was in 1913 (Figure 2.1.1.3), and growing rapidly. During the period of 1993-2003, automobile registrations in China and India increased at an annual rate of 9.0% and 7.1%, respectively, while the growth rates for trucks and buses were 12.5% and 7.4%, respectively.7 For comparison, the U.S. growth rates for automobile registrations for the same decade increased by 0.3% while truck registrations (including SUVs, pickups, and mini-vans) and buses increased by 3.6%.7 China has relatively small amounts of domestic petroleum, and oil imports are up 30% in recent years; China is now the world's second leading oil consumer.7 Such increasing pressures on the world's remaining oil reserves will have significant impacts on the United States, along with inevitable escalations in crude oil prices.
Legend: o Motorization rate of identified country in 1994
Motorization rate of identified country in 2004 Source: Oak Ridge National Laboratory, Transportation Energy Data Book: Edition 25 2006, ORNL-6974; and EIA Annual Energy Outlook 2006 (Early Release, December 2005).
Figure 2.1.1.3 Current Global Motorization Rates Compared to U.S. Historical Rates
Page 2 - 4 Multi-Year Research, Development and Demonstration Plan
2007
Benefits
Advanced Vehicles Technologies Comparison
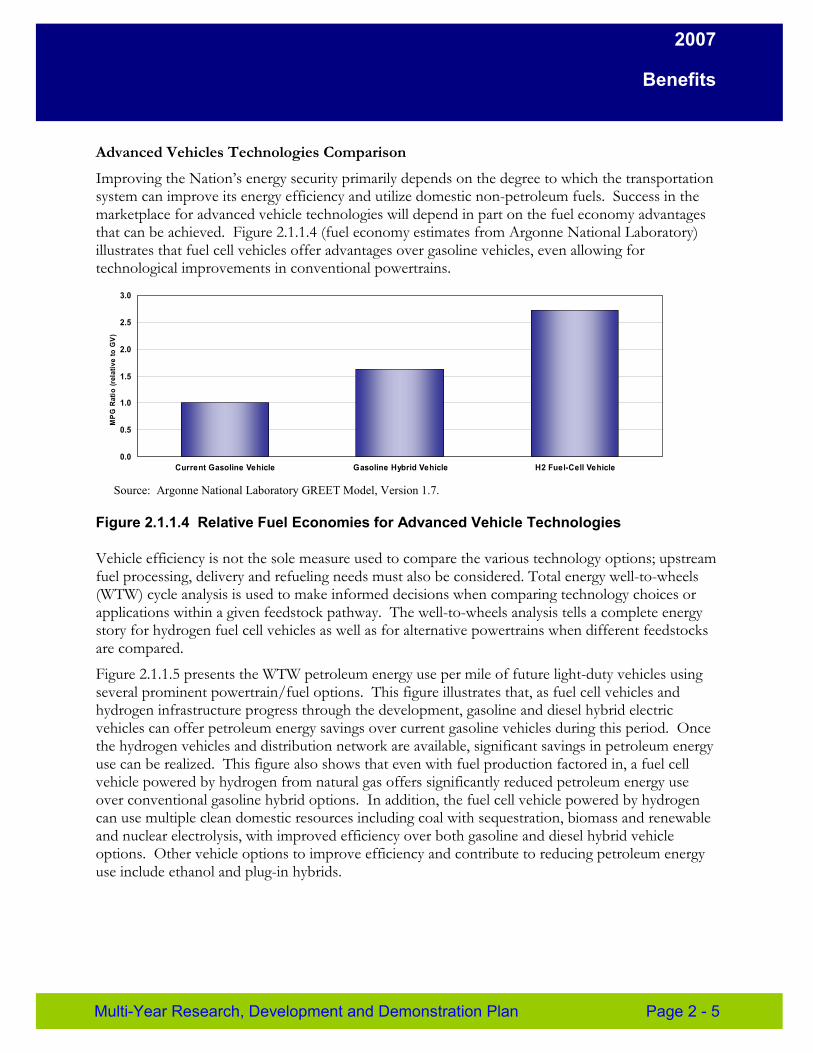
Improving the Nation’s energy security primarily depends on the degree to which the transportation system can improve its energy efficiency and utilize domestic non-petroleum fuels. Success in the marketplace for advanced vehicle technologies will depend in part on the fuel economy advantages that can be achieved. Figure 2.1.1.4 (fuel economy estimates from Argonne National Laboratory) illustrates that fuel cell vehicles offer advantages over gasoline vehicles, even allowing for technological improvements in conventional powertrains.
0.0
0.5
1.0
1.5
2.0
2.5
3.0
MP
G R
atio
(rel
ativ
e to
GV
)
Current Gasoline Vehicle Gasoline Hybrid Vehicle H2 Fuel-Cell Vehicle
Source: Argonne National Laboratory GREET Model, Version 1.7.
Figure 2.1.1.4 Relative Fuel Economies for Advanced Vehicle Technologies
Vehicle efficiency is not the sole measure used to compare the various technology options; upstream fuel processing, delivery and refueling needs must also be considered. Total energy well-to-wheels (WTW) cycle analysis is used to make informed decisions when comparing technology choices or applications within a given feedstock pathway. The well-to-wheels analysis tells a complete energy story for hydrogen fuel cell vehicles as well as for alternative powertrains when different feedstocks are compared.
Figure 2.1.1.5 presents the WTW petroleum energy use per mile of future light-duty vehicles using several prominent powertrain/fuel options. This figure illustrates that, as fuel cell vehicles and hydrogen infrastructure progress through the development, gasoline and diesel hybrid electric vehicles can offer petroleum energy savings over current gasoline vehicles during this period. Once the hydrogen vehicles and distribution network are available, significant savings in petroleum energy use can be realized. This figure also shows that even with fuel production factored in, a fuel cell vehicle powered by hydrogen from natural gas offers significantly reduced petroleum energy use over conventional gasoline hybrid options. In addition, the fuel cell vehicle powered by hydrogen can use multiple clean domestic resources including coal with sequestration, biomass and renewable and nuclear electrolysis, with improved efficiency over both gasoline and diesel hybrid vehicle options. Other vehicle options to improve efficiency and contribute to reducing petroleum energy use include ethanol and plug-in hybrids.
Multi-Year Research, Development and Demonstration Plan Page 2 - 5

2007
Benefits
Current GV
Gasoline HEV
Diesel HEV
NG Distributed H2 FCV
Distributed Wind Electro to H2 FCV
Centra l Biomass to H2 FCV
Central Wind Electro to H2 FCV
H2 from Central Coal w ith Seq. to H2 FCV
H2 from Central Nuclear to H2 FCV
Well to Pump Pump to Wheel
0 1,000 2,000 3,000 4,000 5,000 6,000 Well-to-Wheel Petroleum Energy Use (Btu/mi.)
Source: Argonne National Laboratory GREET Model, Version 1.7.
Figure 2.1.1.5 Comparative Vehicle Technologies: Well-to-Wheels Petroleum Energy Use
2.1.2 Environmental Benefits
While addressing the energy security issue, we must also address our environmental viability. Air quality is a major national concern. It has been estimated that 60% of Americans live in areas where levels of one or more air pollutants are high enough to affect public health and/or the environment.8, 26
As shown in Figure 2.1.2.1, personal vehicles and electric power plants are significant contributors to the Nation’s air quality problems. Most states are now developing strategies for reaching national ambient air quality goals and bringing their major metropolitan areas into attainment with the requirements of the Clean Air Act. The State of California has been one of the most aggressive in their strategies and has launched a number of programs targeted at improving urban air quality.
Emissions from Fossil Fuel Combustion
0
20
40
60
80
100
Carbon Monoxide (CO)
Nitrogen Oxides (NOx)
Volatile Organic Compounds
(VOCs)
Carbon Dioxide (CO2)
MM
T Pe
r Yea
r
0
1500
3000
4500
6000
MM
T C
O 2
Per
Year
Others Electrical Industrial Transportation
Source: Oak Ridge National Laboratory, Transportation Energy Data Book: Edition 25, 2006.
Figure 2.1.2.1 Emissions from Fossil Fuel Combustion
Page 2 - 6 Multi-Year Research, Development and Demonstration Plan
2007
Benefits
Criteria Pollutants
Internal combustion engines (both conventional and hybrid vehicles) will continue to have some on-road emissions. Also, emission control technologies such as on-board diagnosis (OBD) systems can reduce the likelihood of vehicles that have high emission rates due to on-road deterioration of engine performance and emission control devices. However, some emissions will still continue from older conventional ICE vehicles that do not have advanced emission control devices or improved engine performance. The use of fuel cell vehicles, because they are zero-emission vehicles, would eliminate nitrogen oxides, volatile organic compounds, and particulate matter produced by light-duty vehicles. Although hydrogen production from certain feedstocks will generate some pollutants, emissions from stationary sources such as central hydrogen production plants are easier to control and monitor than is deterioration in emissions control on vehicles.
Greenhouse Gases
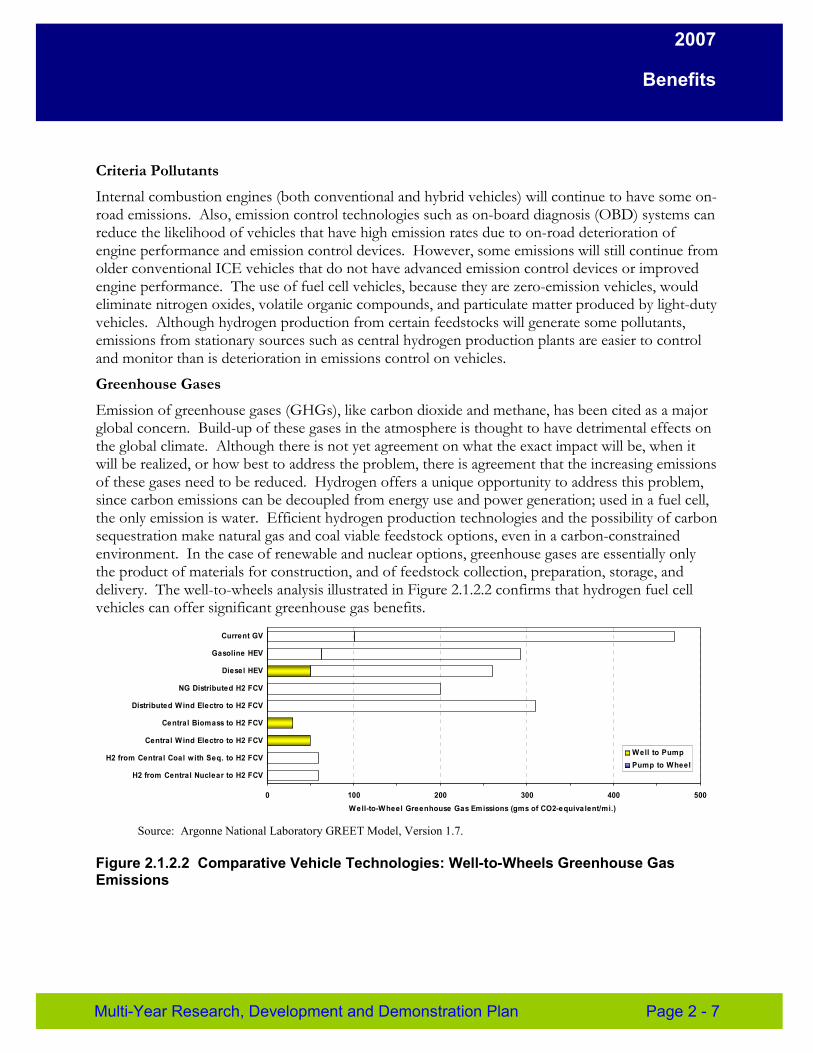
Emission of greenhouse gases (GHGs), like carbon dioxide and methane, has been cited as a major global concern. Build-up of these gases in the atmosphere is thought to have detrimental effects on the global climate. Although there is not yet agreement on what the exact impact will be, when it will be realized, or how best to address the problem, there is agreement that the increasing emissions of these gases need to be reduced. Hydrogen offers a unique opportunity to address this problem, since carbon emissions can be decoupled from energy use and power generation; used in a fuel cell, the only emission is water. Efficient hydrogen production technologies and the possibility of carbon sequestration make natural gas and coal viable feedstock options, even in a carbon-constrained environment. In the case of renewable and nuclear options, greenhouse gases are essentially only the product of materials for construction, and of feedstock collection, preparation, storage, and delivery. The well-to-wheels analysis illustrated in Figure 2.1.2.2 confirms that hydrogen fuel cell vehicles can offer significant greenhouse gas benefits.
Current GV
Gasoline HEV
Diesel HEV
NG Distributed H2 FCV
Distributed Wind Electro to H2 FCV
Central Biomass to H2 FCV
Central Wind Electro to H2 FCV
H2 from Central Coal with Seq. to H2 FCV
H2 from Central Nuclear to H2 FCV
Well to Pump Pump to Wheel
0 100 200 300 400 500 Well-to-Wheel Greenhouse Gas Emissions (gms of CO2-equivalent/mi.)
Source: Argonne National Laboratory GREET Model, Version 1.7.
Figure 2.1.2.2 Comparative Vehicle Technologies: Well-to-Wheels Greenhouse Gas Emissions
Multi-Year Research, Development and Demonstration Plan Page 2 - 7
2007
Benefits
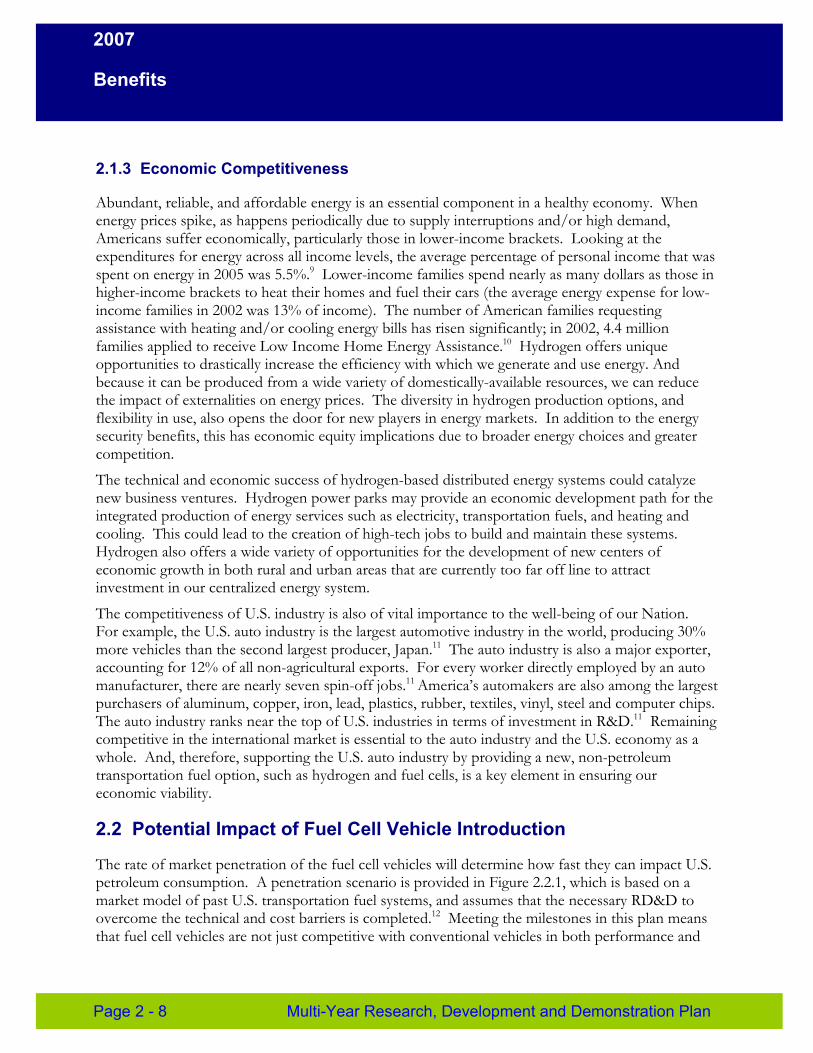
2.1.3 Economic Competitiveness
Abundant, reliable, and affordable energy is an essential component in a healthy economy. When energy prices spike, as happens periodically due to supply interruptions and/or high demand, Americans suffer economically, particularly those in lower-income brackets. Looking at the expenditures for energy across all income levels, the average percentage of personal income that was spent on energy in 2005 was 5.5%.9 Lower-income families spend nearly as many dollars as those in higher-income brackets to heat their homes and fuel their cars (the average energy expense for low-income families in 2002 was 13% of income). The number of American families requesting assistance with heating and/or cooling energy bills has risen significantly; in 2002, 4.4 million families applied to receive Low Income Home Energy Assistance.10 Hydrogen offers unique opportunities to drastically increase the efficiency with which we generate and use energy. And because it can be produced from a wide variety of domestically-available resources, we can reduce the impact of externalities on energy prices. The diversity in hydrogen production options, and flexibility in use, also opens the door for new players in energy markets. In addition to the energy security benefits, this has economic equity implications due to broader energy choices and greater competition.
The technical and economic success of hydrogen-based distributed energy systems could catalyze new business ventures. Hydrogen power parks may provide an economic development path for the integrated production of energy services such as electricity, transportation fuels, and heating and cooling. This could lead to the creation of high-tech jobs to build and maintain these systems. Hydrogen also offers a wide variety of opportunities for the development of new centers of economic growth in both rural and urban areas that are currently too far off line to attract investment in our centralized energy system.
The competitiveness of U.S. industry is also of vital importance to the well-being of our Nation. For example, the U.S. auto industry is the largest automotive industry in the world, producing 30% more vehicles than the second largest producer, Japan.11 The auto industry is also a major exporter, accounting for 12% of all non-agricultural exports. For every worker directly employed by an auto manufacturer, there are nearly seven spin-off jobs.11 America’s automakers are also among the largest purchasers of aluminum, copper, iron, lead, plastics, rubber, textiles, vinyl, steel and computer chips. The auto industry ranks near the top of U.S. industries in terms of investment in R&D.11 Remaining competitive in the international market is essential to the auto industry and the U.S. economy as a whole. And, therefore, supporting the U.S. auto industry by providing a new, non-petroleum transportation fuel option, such as hydrogen and fuel cells, is a key element in ensuring our economic viability.
2.2 Potential Impact of Fuel Cell Vehicle Introduction
The rate of market penetration of the fuel cell vehicles will determine how fast they can impact U.S. petroleum consumption. A penetration scenario is provided in Figure 2.2.1, which is based on a market model of past U.S. transportation fuel systems, and assumes that the necessary RD&D to overcome the technical and cost barriers is completed.12 Meeting the milestones in this plan means that fuel cell vehicles are not just competitive with conventional vehicles in both performance and
Page 2 - 8 Multi-Year Research, Development and Demonstration Plan
2007
Benefits
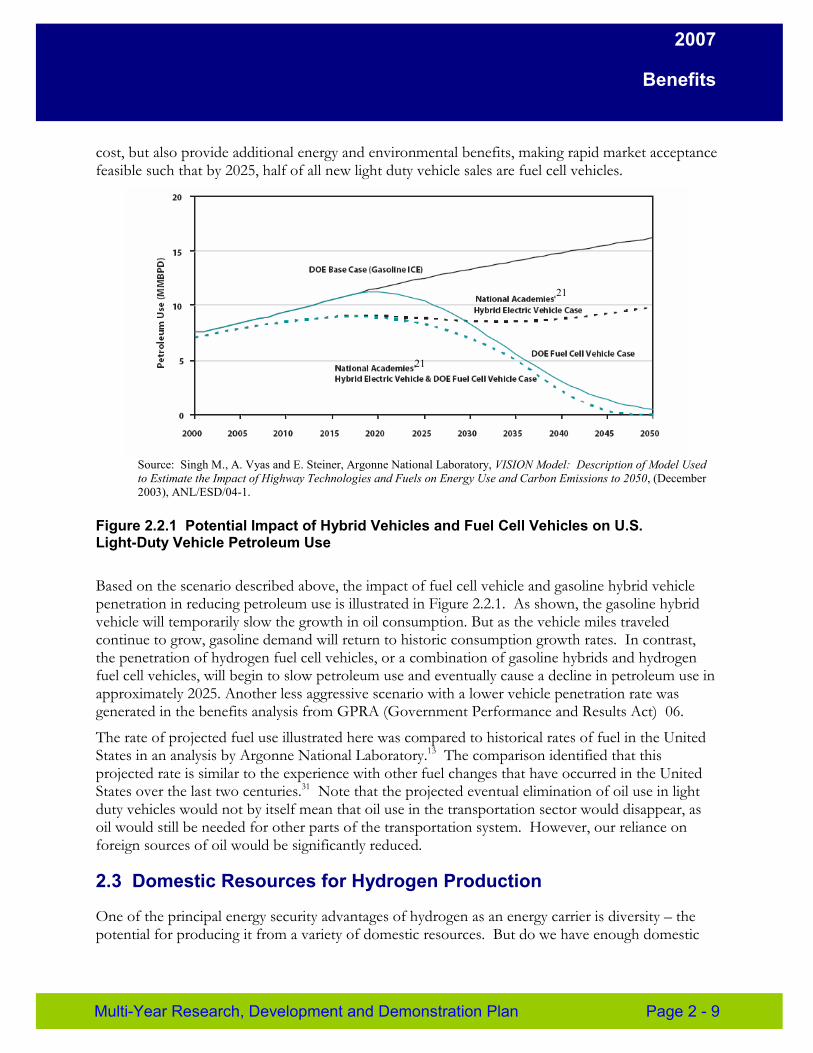
cost, but also provide additional energy and environmental benefits, making rapid market acceptance feasible such that by 2025, half of all new light duty vehicle sales are fuel cell vehicles.
21
21
Source: Singh M., A. Vyas and E. Steiner, Argonne National Laboratory, VISION Model: Description of Model Used to Estimate the Impact of Highway Technologies and Fuels on Energy Use and Carbon Emissions to 2050, (December 2003), ANL/ESD/04-1.
Figure 2.2.1 Potential Impact of Hybrid Vehicles and Fuel Cell Vehicles on U.S. Light-Duty Vehicle Petroleum Use
Based on the scenario described above, the impact of fuel cell vehicle and gasoline hybrid vehicle penetration in reducing petroleum use is illustrated in Figure 2.2.1. As shown, the gasoline hybrid vehicle will temporarily slow the growth in oil consumption. But as the vehicle miles traveled continue to grow, gasoline demand will return to historic consumption growth rates. In contrast, the penetration of hydrogen fuel cell vehicles, or a combination of gasoline hybrids and hydrogen fuel cell vehicles, will begin to slow petroleum use and eventually cause a decline in petroleum use in approximately 2025. Another less aggressive scenario with a lower vehicle penetration rate was generated in the benefits analysis from GPRA (Government Performance and Results Act) 06.
The rate of projected fuel use illustrated here was compared to historical rates of fuel in the United States in an analysis by Argonne National Laboratory.13 The comparison identified that this projected rate is similar to the experience with other fuel changes that have occurred in the United States over the last two centuries.31 Note that the projected eventual elimination of oil use in light duty vehicles would not by itself mean that oil use in the transportation sector would disappear, as oil would still be needed for other parts of the transportation system. However, our reliance on foreign sources of oil would be significantly reduced.
2.3 Domestic Resources for Hydrogen Production
One of the principal energy security advantages of hydrogen as an energy carrier is diversity – the potential for producing it from a variety of domestic resources. But do we have enough domestic
Multi-Year Research, Development and Demonstration Plan Page 2 - 9
2007
Benefits
resources to provide the hydrogen we need? It is assumed the required hydrogen will come from a portfolio of domestic resources. Based on an average fuel cell vehicle efficiency of 60 mpg, the total hydrogen demand would be ~64 million metric tons, which represents the amount of hydrogen needed in 2040 for the potential hydrogen fuel cell vehicle market penetration rate (corresponding to 300 million hydrogen fuel cell light duty vehicles on the road) depicted in Figure 2.2.1. In a diverse resource portfolio where 20% of the hydrogen demand is produced from a single resource, for example, ~13 million metric tons of hydrogen must be produced from each resource annually.14
The following discussion provides the resource information to produce this amount of hydrogen.
If natural gas is used to produce this hydrogen requirement, the natural gas usage would increase by ~2 trillion cubic feet per year.15 In 2004, the annual U.S. consumption was 22.4 trillion cubic feet of natural gas.16 As of January 2004, the remaining technically recoverable natural gas reserves in the United States were estimated at 189 trillion cubic feet16, or 8 times the needed annual consumption. Producing 13 million tons of hydrogen from our abundant domestic coal resources with carbon sequestration, (approximately 267 billion recoverable tons17), would increase annual coal consumption by less than 10%.
Other options to individually produce 13 million metric tons of hydrogen include:
� Biomass: Depending on the type of biomass used for hydrogen production, approximately 140-280 million dry metric tons annually would be required to satisfy the hydrogen demand.27 The current agricultural and forest products residues, primary and secondary mills, organic municipal solid waste, urban tree residues, livestock residues and potential energy crops available are between 512 million14 and 1.3 billion18 dry metric tons annually.
� Wind-Electrolysis: 200 GW of installed wind would be needed to produce 13 million tons of hydrogen.27 Only around 7 GW of wind is currently installed in the United States, but this figure is growing rapidly with improved designs and lowering costs.19 The estimated wind capacity in the United States is around 2,300 GW 28.
� Solar-Electrolysis: 260 GW of flat-plate photovoltaics would be needed to produce 13 million tons of hydrogen.27 The estimated solar capacity for hydrogen is 5,400 GWe for the United States.29
� Nuclear Energy: Nuclear power can also provide electricity to produce hydrogen via electrolysis of water. Around 80 conventional 1 GWe reactors would be needed to produce 13 million tons of hydrogen annually.27
The following provides a brief description of the key attributes of some of the various resources from which hydrogen can be produced.
Natural Gas. Reforming of natural gas makes up nearly 50% of the world’s hydrogen production and is the source of 95% of the hydrogen produced in the United States.21 Steam reforming is a thermal process, typically carried out over a nickel-based catalyst that involves reacting natural gas or other light hydrocarbons with steam. Large-scale commercial units capable of producing hydrogen are available as standard “turn-key” packages.
Coal. Currently, more than 70 gasification plants are operating throughout the world using coal or petroleum coke as a feedstock. Advanced systems are also the subject of RD&D. DOE’s FutureGen Initiative, led by the Office of Fossil Energy, is a plan to build a prototype of the fossil
Page 2 - 10 Multi-Year Research, Development and Demonstration Plan
2007
Benefits
fuel power plant of the future—a plant that combines electricity generation and hydrogen production with the virtual total elimination of harmful emissions and greenhouse gases. Current plans call for the 275 MW plant to be designed and built over the next ten years, then operated as a test and demonstration facility for at least five years.22
Biomass. Renewable feedstocks can be used to produce hydrogen, either directly or through intermediate carriers (e.g., ethanol). Some biological organisms can produce hydrogen through fermentation. Alternatively, fermentation could be used to produce methane or sugar alcohols that can be reformed to hydrogen. Thermal processing (pyrolysis or gasification) can also be used and the techniques for biomass and fossil fuels (reforming, water gas shift, gas separation) are similar. Approximately 12-14 kg of biomass are required to produce 1 kg of hydrogen.27
Wind. In some parts of the country, wind energy is supplementing more conventional forms of electricity production. California now produces more than 3% of the world’s wind-generated electricity.23, 30 Wind turbines have been connected to electrolysis systems that can operate with high efficiency (~70%) to produce hydrogen. Construction costs have dropped to about $1 million per MW, supporting electricity generation at 4 to 6 cents per kWh and this price is expected to drop even further in the coming years.23
Solar. Sunlight can provide the necessary energy to split water into hydrogen and oxygen. Photovoltaic arrays can be used to generate electricity that can then be used by an electrolyzer to produce hydrogen. Some semiconductor materials can also be used to directly split water in a single monolithic device, eliminating the need for separate electricity-generation and hydrogen-production steps. Similarly, a number of biological organisms have the ability to directly produce hydrogen as a product of metabolic activity. Finally, solar concentrators can be used to drive high-temperature chemical cycles that split water. Like wind, there are huge solar resources in the United States, especially in the southwestern portion of the Nation.
Nuclear Energy. Current nuclear technology generates electricity that can be used to produce hydrogen via electrolysis of water. Advanced nuclear reactor concepts (Gen IV) are also being developed that will be more efficient in the production of hydrogen. These advanced technologies provide heat at a temperature that permits high-temperature electrolysis (where heat energy replaces a portion of the electrical energy needed to dissociate water) or thermochemical cycles that use heat and a chemical process to dissociate water. The thermodynamic efficiencies of thermochemical cycles for the direct production of hydrogen with GenIV reactors may be as high as 45%. This contrasts with the 33% efficiency of the existing reactors for electric power production.24 By bypassing the inefficiencies of electric power production and electrolysis losses, the overall efficiency of converting heat energy to hydrogen energy is increased significantly.
2.4 Potential Impact of Stationary Fuel Cells
In addition to addressing the major challenge of energy security, hydrogen fuel cell systems can address many of our Nation’s other energy-related needs. To meet our growing electrical demands, it is estimated that electricity generation will have to increase by ~1.1% per year.3 The projected increased electrical generation capacity needed by 2030 is approximately 310 GW3. Along with an aging transmission and production infrastructure, requirements for reliable premium power and market deregulation, this increasing demand opens the door for hydrogen power systems.
Multi-Year Research, Development and Demonstration Plan Page 2 - 11
2007
Benefits
Hydrogen power systems provide unique opportunities for increasing the diversity of the electricity market. Currently, grid stability and intermittency issues are major limitations for the penetration of renewables like wind and solar into the electricity market. By combining these generation technologies with hydrogen production and storage, intermittent renewables could potentially capture a larger share of the power production market without major upgrades to the existing grid.
Hydrogen power systems such as hydrogen fuel cells for electricity and heat generation can be extremely efficient over a large range of sizes (from one kilowatt to hundreds of megawatts). Some systems can achieve high efficiencies when heat production is combined with power generation. Additionally, smaller-scale distributed hydrogen systems offer combined heat, power and fuel opportunities. Fuel cell systems integrated with hydrogen production and storage can provide fuel for vehicles, energy for heating and cooling, and electricity to power our communities. These clean systems offer a unique opportunity for energy independence, highly reliable energy services, environmental and economic benefits.
Another form of hydrogen power system would be a power park. This system enables the utility costs for hydrogen production to be optimized by integrating the distributed hydrogen production/fueling system with the fuel cell power and heat generation system of the facility. The facility would produce hydrogen for fueling vehicles and provide hydrogen for the stationary fuel cells to meet the ancillary electrical demands. The onsite storage of the facility will enable hydrogen to be produced during periods of off-peak power demand and power rates, and supplement the facilities with low cost power.
2.5 Conclusion
The benefits of a hydrogen infrastructure cannot be realized overnight. To realize the benefits, several things must occur. Fuel cell technologies and hydrogen storage systems must be advanced so that hydrogen fuel cells can be a cost-competitive choice for consumers when they purchase new vehicles or when communities evaluate energy options. Hydrogen production options require additional research to achieve cost parity with today’s fuels. Hydrogen and fuel cell technologies need to be developed and downselected with consideration for complete life cycle economic, environmental and energy efficiency impact. And the existing hydrogen infrastructure needs to grow to a point where all consumers can conveniently obtain hydrogen. If we are successful in developing hydrogen technologies to their full potential, we could significantly reduce U.S. oil consumption and greenhouse gas emissions.
References
1. U.S. Department of Energy (Hydrogen Program), “Record 5027: Hydrogen Fuel Initiative,” http://www.hydrogen.energy.gov/program records.html.
2. U.S. Department of Energy (Hydrogen Program), “Record 5025: Advanced Energy Initiative,” http://www.hydrogen.energy.gov/program_records.html.
3. U.S. Department of Energy, Energy Information Administration, Annual Energy Outlook 2006: With Projections to 2030, (February 2006), DOE/EIA-0383(2006), retrieved August 8, 2006 from http://www.eia.doe.gov/oiaf/archive/aeo05/pdf/0383(2005).pdf.
Page 2 - 12 Multi-Year Research, Development and Demonstration Plan
2007
Benefits
4. American Petroleum Institute, API Petroleum Facts at a Glance – July 2006, 6, retrieved August 8, 2006 from http://www.api.org/Newsroom/archive/upload/Petroleum-Facts-at-a-Glance-June-2006.pdf.
5. Oak Ridge National Laboratory, Transportation Energy Data Book: Edition 25, 2006, “Table 1.13 Consumption of Petroleum by End-Use Sector, 1973-2003,” 1-17.
6. U.S. Department of the Interior, U.S. Geological Survey, World Petroleum Assessment 2000: Description and Results, (2000), retrieved August 8, 2006 from http://pubs.usgs.gov/dds/dds-060/
7. Oak Ridge National Laboratory, Transportation Energy Data Book: Edition 25, 2006, ORNL-6974; and EIA Annual Energy Outlook 2006.
8. U.S. Environmental Protection Energy. The Plain English Guide to the Clean Air Act: Glossary (2006), retrieved August 8, 2006 from http://www.epa.gov/air/caa/peg/peg.pdf
9. U.S. Department of Commerce, Bureau of Economic Analysis. “Table 2.3.5. Personal Consumption Expenditures by Major Type of Product and Table 2.1. Personal Income and Its Disposition,” retrieved August 11, 2006 from http://www.bea.gov/bea/dn/nipaweb/SelectTable.asp?Selected=N#S2.
10. Low Income Home Energy Assistance Program (LIHEAP), “The LIHEAP Databook,” 3, retrieved August 11, 2006 from http://www.liheap.org/databook02/LIHEAPdatabook02.pdf.
11. Ward’s Communications, Ward’s World Motor Vehicle Data, Southfield, MI. http://wardsauto.com/home/index.htm.
12. Singh M., A. Vyas and E. Steiner, Argonne National Laboratory, VISION Model: Description of Model Used to Estimate the Impact of Highway Technologies and Fuels on Energy Use and Carbon Emissions to 2050, (December 2003), ANL/ESD/04-1.
13. Danilo J. Santini, Anant Vyas, and Margaret Singh. The U.S. Department of Energy Scenario for the Replacement of Oil by Hydrogen Fuel Cell Vehicles in an Historical Context, (May 2004), Argonne National Laboratory (Draft).
14. U.S. Department of Energy Hydrogen Program, "Record 5008: FCV Hydrogen Demand in 2040," http://www.hydrogen.energy.gov/program_records.html.
15. U.S. Department of Energy (Hydrogen Program), “Record 6005: Natural Gas Required to Produce 13 million Metric Tons of Hydrogen,” http://www.hydrogen.energy.gov/program_records.html
16. Oak Ridge National Laboratory, Transportation Energy Data Book: Edition 25, 2006, ORNL-6974; and EIA Annual Energy Outlook 2005 (Gas data also appears at http://www.eia.doe.gov/oiaf/archive/aeo05/gas.html ).
17. U.S. Department of Energy, Energy Information Administration, Annual Coal Report – 2005, (November 2005), DOE/EIA-0584(2004), Table 15: “Recoverable Coal Reserves at Producing Mines, Estimated Recoverable Reserves, and Demonstrated Reserve Base by Mining Method, 2004,” 31, retrieved January 23, 2006 from http://www.eia.doe.gov/cneaf/coal/page/acr/table15.html
18. Walsh, M.E. et al., Biomass Feedstock Availability in the United States: 999 State Level Analysis, (2000), retrieved September 29, 2005, from http://bioenergy.ornl.gov/resourcedata/index.html.
19. U.S. Department of Energy and National Renewable Energy Laboratory, “United States 2005 Installed Wind Power Capacity,” (as of September 30, 2005), retrieved January 23, 2006 from http://www.eere.energy.gov/windandhydro/windpoweringamerica/wind_installed_capacity.asp.
Multi-Year Research, Development and Demonstration Plan Page 2 - 13
2007
Benefits
20. Elliott, D.L. and M.N. Schwartz., Wind Energy Potential in the United States, (Richland, WA: Pacific Northwest National Laboratory, September 1993), PNL-SA-23109, retrieved from http://www.osti.gov/bridge/servlets/purl/10189966-jo0aEC/native/10189966.pdf.
21. National Academies’ National Research Council and National Academy of Engineering, The Hydrogen Economy: Opportunities, Costs, Barriers, and R&D Needs, National Academies Press, Washington (2004).
22. United States Department of Energy, Office of Fossil Energy, FutureGen - A Sequestration and Hydrogen Research Initiative (2006), retrieved August 14, 2006 from http://www.fossil.energy.gov/programs/powersystems/futuregen/futuregen_factsheet.pdf.
23. America Wind Energy Association, Wind Energy Costs, retrieved August 15, 2006 from http://www.awea.org/faq/wwt_costs.html.
24. Buongiorno, J. The Supercritical-Water-Cooled Reactor (SCWR), Idaho National Engineer and Environmental Laboratory, retrieved August 14, 2006 from http://inl.gov/featurestories/2002-12-15.shtml.
25. U.S. Department of Energy (Hydrogen Program), “Record 5028: State of the Union 2003,” http://www.hydrogen.energy.gov/program_records.html.
26. U.S. Department of Energy (Hydrogen Program), “Record 5017: Air Quality and Population,” http://www.hydrogen.energy.gov/program_records.html.
27. The National Renewable Energy Laboratory H2A Production Model, version 1.09. http://www.hydrogen.energy.gov/h2a_analysis.html.
28. Assuming standard inversion factors.
29. U.S. Department of Energy (Hydrogen Program), “Record 5006: Solar Resources in the U.S.,” http://www.hydrogen.energy.gov/program_records.html.
30. World Policy Institute, December 2005, http://www.earth-policy.org/Indicators/Wind/2006_data.htm#table4.
31. Santini, D., “Transitions of Technology: Past Transportation Fuel Switches Relative to the DOE H2 Scenario”, Presented to the Hydrogen Demand Workshop Institute of Transportation Studies, University of California, Davis, June 21-23, 2004
Page 2 - 14 Multi-Year Research, Development and Demonstration Plan
2007
Technical Plan
3.0 Technical Plan This section of the Plan provides a detailed outline of the various activities occurring within the technical Program elements of the Hydrogen, Fuel Cells & Infrastructure Technologies Program, as follows:
3.1 Hydrogen Production
3.2 Hydrogen Delivery
3.3 Hydrogen Storage
3.4 Fuel Cells
3.5 Manufacturing R&D
3.6 Technology Validation
3.7 Hydrogen Codes and Standards
3.8 Hydrogen Safety
3.9 Education.
For each section, a brief introduction is followed by the specific goal and objectives of the Program element. The remainder of the section presents the Program element’s strategy for achieving success and measuring progress. This begins with an overview of the technical approach and review of the current activities within the Program element. Next, each section lays out specific targets that will lead a pathway toward the objectives, the barriers to achieving these targets, and the specific tasks and milestones used to direct their efforts and gauge their progress.
Activities within each of the Program elements must be coordinated and integrated to achieve the technology readiness goals of the Program. Interrelationships between all Program elements, including Systems Analysis and Systems Integration, are represented in Figure 3.0.1; specific inputs and outputs between Program elements are identified in the milestone charts and tables. Systems Analysis and Systems Integration (see Chapters 4 and 5) will be used to identify, analyze, and evaluate these complex interdependencies and to guide decision making for the Hydrogen, Fuel Cells & Infrastructure Technologies Program Manager. Program Management and Operations are covered in Chapter 6.
Multi-Year Research, Development and Demonstration Plan Page 3.0 - 1
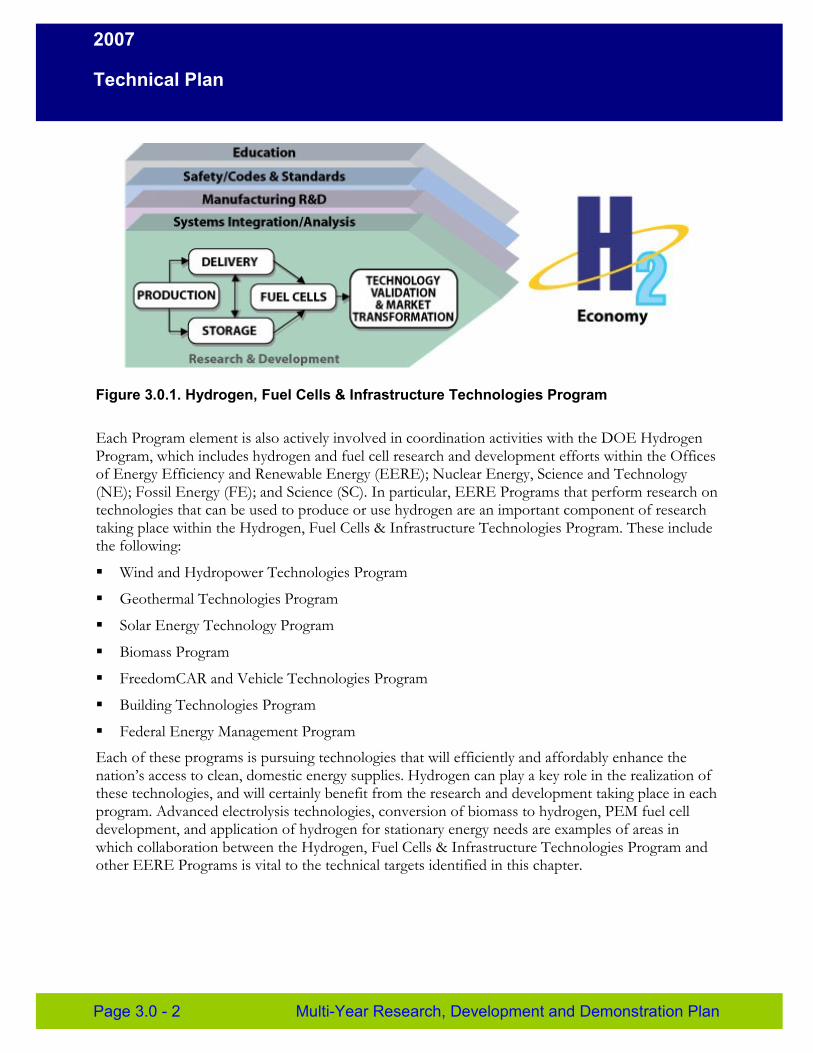
2007
Technical Plan
Figure 3.0.1. Hydrogen, Fuel Cells & Infrastructure Technologies Program
Each Program element is also actively involved in coordination activities with the DOE Hydrogen Program, which includes hydrogen and fuel cell research and development efforts within the Offices of Energy Efficiency and Renewable Energy (EERE); Nuclear Energy, Science and Technology (NE); Fossil Energy (FE); and Science (SC). In particular, EERE Programs that perform research on technologies that can be used to produce or use hydrogen are an important component of research taking place within the Hydrogen, Fuel Cells & Infrastructure Technologies Program. These include the following:
� Wind and Hydropower Technologies Program
� Geothermal Technologies Program
� Solar Energy Technology Program
� Biomass Program
� FreedomCAR and Vehicle Technologies Program
� Building Technologies Program
� Federal Energy Management Program
Each of these programs is pursuing technologies that will efficiently and affordably enhance the nation’s access to clean, domestic energy supplies. Hydrogen can play a key role in the realization of these technologies, and will certainly benefit from the research and development taking place in each program. Advanced electrolysis technologies, conversion of biomass to hydrogen, PEM fuel cell development, and application of hydrogen for stationary energy needs are examples of areas in which collaboration between the Hydrogen, Fuel Cells & Infrastructure Technologies Program and other EERE Programs is vital to the technical targets identified in this chapter.
Page 3.0 - 2 Multi-Year Research, Development and Demonstration Plan
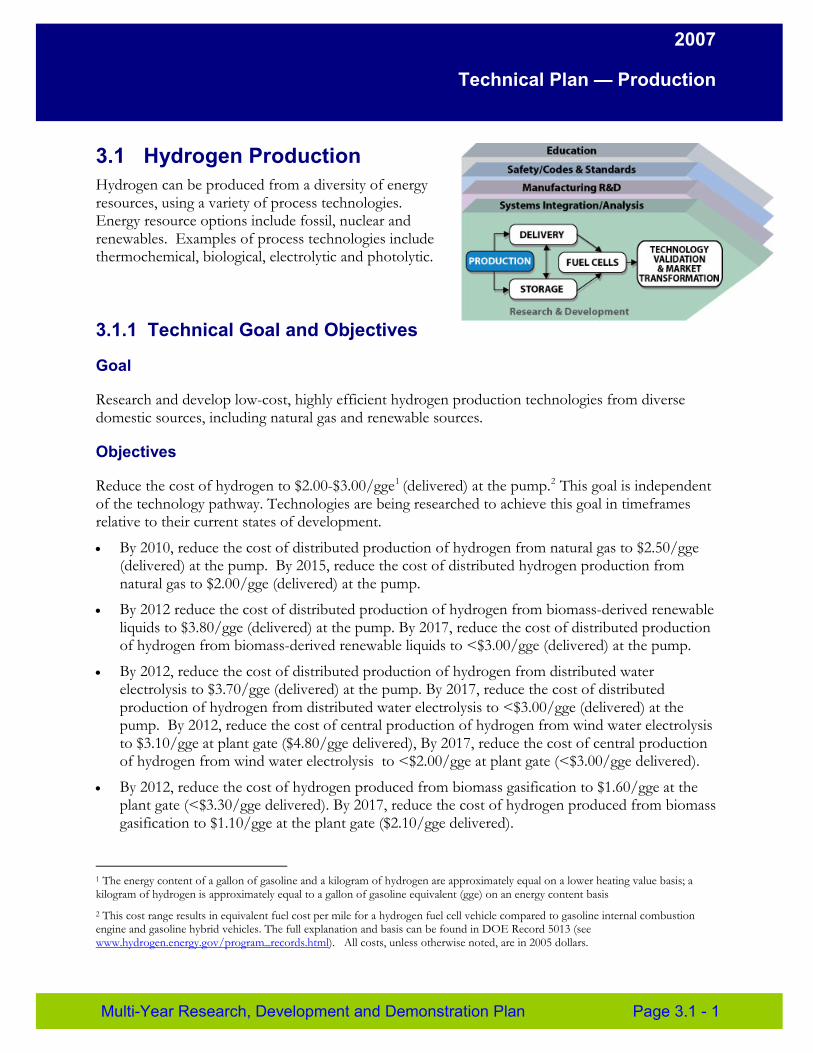
2007
Technical Plan — Production
3.1 Hydrogen Production Hydrogen can be produced from a diversity of energy resources, using a variety of process technologies. Energy resource options include fossil, nuclear and renewables. Examples of process technologies include thermochemical, biological, electrolytic and photolytic.
3.1.1 Technical Goal and Objectives
Goal
Research and develop low-cost, highly efficient hydrogen production technologies from diverse domestic sources, including natural gas and renewable sources.
Objectives
Reduce the cost of hydrogen to $2.00-$3.00/gge1 (delivered) at the pump.2 This goal is independent of the technology pathway. Technologies are being researched to achieve this goal in timeframes relative to their current states of development.
• By 2010, reduce the cost of distributed production of hydrogen from natural gas to $2.50/gge (delivered) at the pump. By 2015, reduce the cost of distributed hydrogen production from natural gas to $2.00/gge (delivered) at the pump.
• By 2012 reduce the cost of distributed production of hydrogen from biomass-derived renewable liquids to $3.80/gge (delivered) at the pump. By 2017, reduce the cost of distributed production of hydrogen from biomass-derived renewable liquids to <$3.00/gge (delivered) at the pump.
• By 2012, reduce the cost of distributed production of hydrogen from distributed water electrolysis to $3.70/gge (delivered) at the pump. By 2017, reduce the cost of distributed production of hydrogen from distributed water electrolysis to <$3.00/gge (delivered) at the pump. By 2012, reduce the cost of central production of hydrogen from wind water electrolysis to $3.10/gge at plant gate ($4.80/gge delivered), By 2017, reduce the cost of central production of hydrogen from wind water electrolysis to <$2.00/gge at plant gate (<$3.00/gge delivered).
• By 2012, reduce the cost of hydrogen produced from biomass gasification to $1.60/gge at the plant gate (<$3.30/gge delivered). By 2017, reduce the cost of hydrogen produced from biomass gasification to $1.10/gge at the plant gate ($2.10/gge delivered).
1 The energy content of a gallon of gasoline and a kilogram of hydrogen are approximately equal on a lower heating value basis; a kilogram of hydrogen is approximately equal to a gallon of gasoline equivalent (gge) on an energy content basis 2 This cost range results in equivalent fuel cost per mile for a hydrogen fuel cell vehicle compared to gasoline internal combustion engine and gasoline hybrid vehicles. The full explanation and basis can be found in DOE Record 5013 (see www.hydrogen.energy.gov/program_records.html). All costs, unless otherwise noted, are in 2005 dollars.
Multi-Year Research, Development and Demonstration Plan Page 3.1 - 1
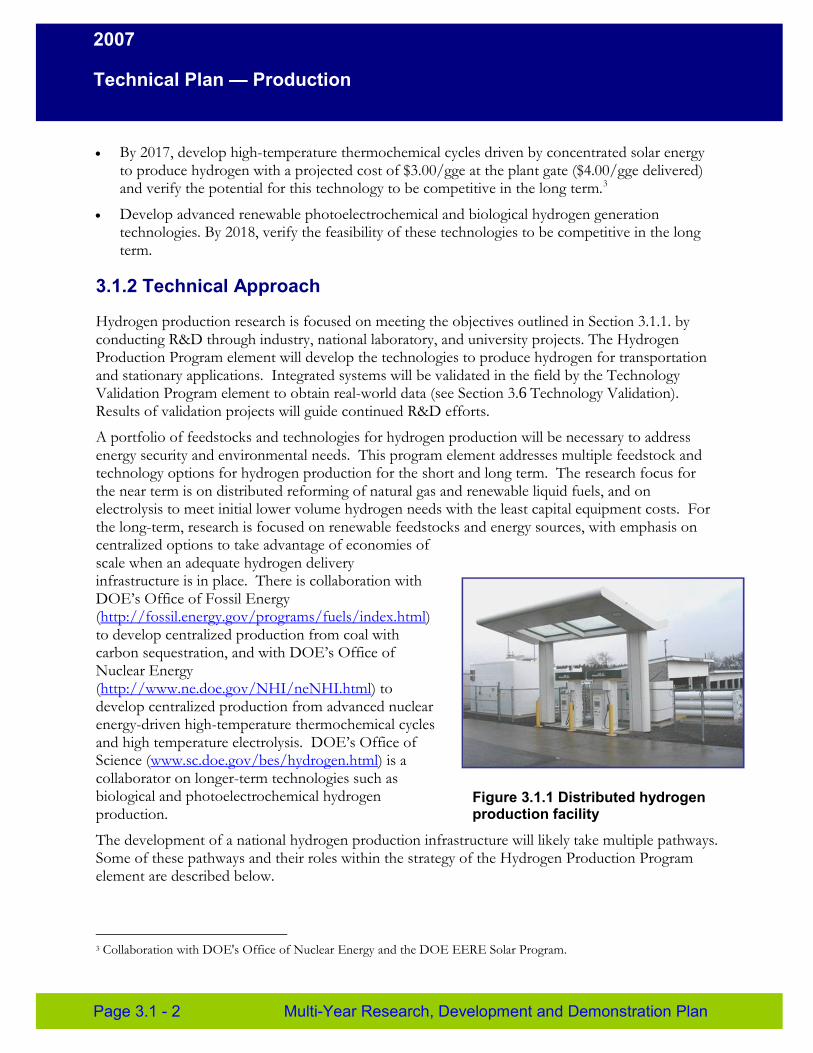
2007
Technical Plan — Production
• By 2017, develop high-temperature thermochemical cycles driven by concentrated solar energy to produce hydrogen with a projected cost of $3.00/gge at the plant gate ($4.00/gge delivered) and verify the potential for this technology to be competitive in the long term.3
• Develop advanced renewable photoelectrochemical and biological hydrogen generation technologies. By 2018, verify the feasibility of these technologies to be competitive in the long term.
3.1.2 Technical Approach
Hydrogen production research is focused on meeting the objectives outlined in Section 3.1.1. by conducting R&D through industry, national laboratory, and university projects. The Hydrogen Production Program element will develop the technologies to produce hydrogen for transportation and stationary applications. Integrated systems will be validated in the field by the Technology Validation Program element to obtain real-world data (see Section 3.6 Technology Validation). Results of validation projects will guide continued R&D efforts.
A portfolio of feedstocks and technologies for hydrogen production will be necessary to address energy security and environmental needs. This program element addresses multiple feedstock and technology options for hydrogen production for the short and long term. The research focus for the near term is on distributed reforming of natural gas and renewable liquid fuels, and on electrolysis to meet initial lower volume hydrogen needs with the least capital equipment costs. For the long-term, research is focused on renewable feedstocks and energy sources, with emphasis on centralized options to take advantage of economies of scale when an adequate hydrogen delivery infrastructure is in place. There is collaboration with DOE’s Office of Fossil Energy (http://fossil.energy.gov/programs/fuels/index.html) to develop centralized production from coal with carbon sequestration, and with DOE’s Office of Nuclear Energy (http://www.ne.doe.gov/NHI/neNHI.html) to develop centralized production from advanced nuclear energy-driven high-temperature thermochemical c ycles and high temperature electrolysis. DOE’s Office of Science ( www.sc.doe.gov/bes/hydrogen.html) is a collaborator on longer-term technologies su ch as biological and photoelectrochemical hydrogen production.
The developm ent of a national hydrogen production infrastructure will likely take multiple pathways. Some of these pathways and their roles within the strategy of the Hydrogen Production Program element are described below.
3 Collaboration with DOE's Office of Nuclear Energy and the DOE EERE Solar Program.
Figure 3.1.1 Distributed hydrogen production facility
Page 3.1 - 2 Multi-Year Research, Development and Demonstration Plan
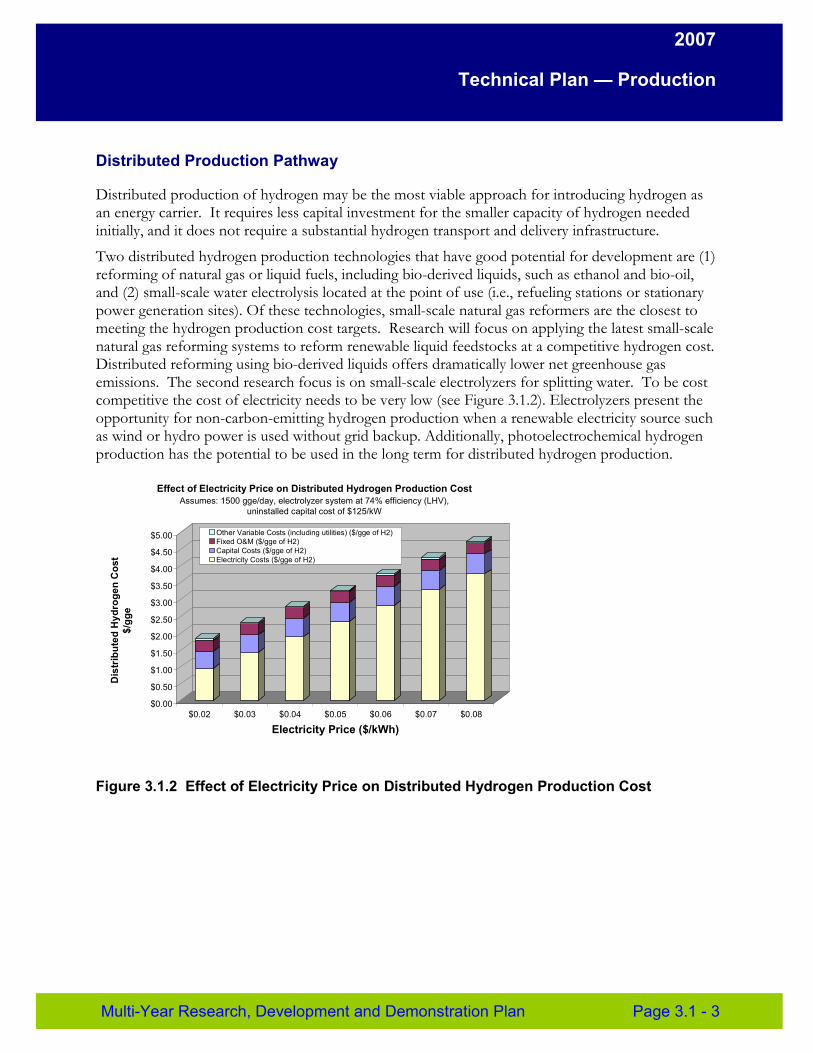
2007
Technical Plan — Production
Distributed Production Pathway
Distributed production of hydrogen may be the most viable approach for introducing hydrogen as an energy carrier. It requires less capital investment for the smaller capacity of hydrogen needed initially, and it does not require a substantial hydrogen transport and delivery infrastructure.
Two distributed hydrogen production technologies that have good potential for development are (1) reforming of natural gas or liquid fuels, including bio-derived liquids, such as ethanol and bio-oil, and (2) small-scale water electrolysis located at the point of use (i.e., refueling stations or stationary power generation sites). Of these technologies, small-scale natural gas reformers are the closest to meeting the hydrogen production cost targets. Research will focus on applying the latest small-scale natural gas reforming systems to reform renewable liquid feedstocks at a competitive hydrogen cost. Distributed reforming using bio-derived liquids offers dramatically lower net greenhouse gas emissions. The second research focus is on small-scale electrolyzers for splitting water. To be cost competitive the cost of electricity needs to be very low (see Figure 3.1.2). Electrolyzers present the opportunity for non-carbon-emitting hydrogen production when a renewable electricity source such as wind or hydro power is used without grid backup. Additionally, photoelectrochemical hydrogen production has the potential to be used in the long term for distributed hydrogen production.
Effect of Electricity Price on Distributed Hydrogen Production Cost Assumes: 1500 gge/day, electrolyzer system at 74% efficiency (LHV),
uninstalled capital cost of $125/kW
$5.00 Other Variable Costs (including utilities) ($/gge of H2) Fixed O&M ($/gge of H2)
$4.50 Capital Costs ($/gge of H2) Electricity Costs ($/gge of H2)
$4.00
st
$3.50
Co
$3.00
Hyd
roge
n
$2.50
$/gg
e
$2.00
$1.50
ted
ibu
$1.00
Dis
tr
$0.50
$0.00 $0.02 $0.03 $0.04 $0.05 $0.06 $0.07 $0.08
Electricity Price ($/kWh)
Figure 3.1.2 Effect of Electricity Price on Distributed Hydrogen Production Cost
Multi-Year Research, Development and Demonstration Plan Page 3.1 - 3
2007
Technical Plan — Production
Centralized Production Pathway
Large hydrogen production facilities that can take advantage of economies of scale will be needed in the long term to meet increases in hydrogen fuel demand. Central hydrogen production allows management of greenhouse gas emissions through strategies like carbon sequestration. In parallel with the distributed production effort, DOE is pursuing central production of hydrogen from a variety of resources - fossil, nuclear and renewable.
• Coal (DOE Office of Fossil Energy) and natural gas are possibly the least expensive feedstocks, and carbon sequestration is required to reduce or eliminate greenhouse gas emissions. Centralized natural gas reforming is not being pursued because it is already commercially viable and because there are limited domestic natural gas resources for the long term.
• Biomass gasification offers the potential of a renewable option and near-zero greenhouse gas emissions.
• Centralized wind-based water electrolysis is a viable approach - as the cost of capital equipment is reduced through advanced development.
• DOE’s Office of Nuclear Energy (http://www.ne.doe.gov/NHI/neNHI.html) is developing high-temperature electrolysis technology.
• High-temperature thermochemical hydrogen production that uses concentrated solar energy may be viable with the development of efficient water-splitting chemical process cycles and materials.
• Photoelectrochemical and biological hydrogen production are long-term technologies that have the potential to produce hydrogen with sunlight, but they can currently only produce small amounts of hydrogen at high cost.
Other feedstocks and technologies for hydrogen production that show promise may also be considered. Central production of hydrogen includes a wide diversity of feedstocks, but to be viable it would require development of a distribution and delivery infrastructure for hydrogen. DOE is pursuing projects to identify a cost-effective, energy-efficient, safe infrastructure for the delivery of hydrogen or hydrogen carriers from centrally located production facilities to the point of use (see Section 3.2).
Semi-Central/City-Gate Production Pathway
Another option for hydrogen production is semi-central facilities that could be located, for example, on the edge of urban areas. These would be intermediate in production capacity. They would have limited economies of scale while being located only a short distance from refueling sites and thus reduce the cost and infrastructure needed for hydrogen delivery. Several technologies may be well suited to this scale of production including wind or solar driven electrolysis, reforming of renewable bio-derived liquids, natural gas reforming and photoelectrochemical hydrogen production. Although many of the technologies currently under development are applicable to the semi-central concept, it is not a major focus of the program to emphasize development at the semi-central scale.
Page 3.1 - 4 Multi-Year Research, Development and Demonstration Plan
2007
Technical Plan — Production
Co-Production Pathways
Other production pathways being explored combine production of hydrogen fuel, heat, and electric power. In these scenarios, hydrogen fuel could be produced for use: (1) in stationary fuel cells to produce electricity and heat and (2) as a transportation fuel in fuel cell vehicles or hydrogen internal combustion engine vehicles. This allows two markets for the hydrogen that could help to initiate the use of hydrogen when hydrogen demand is small. As the demand grows, more of the hydrogen could be produced for vehicle fuel rather than used for power production.
Separations
Hydrogen separation is a key technology that cross-cuts hydrogen production options. Both dense metallic and microporous separation membranes are being developed as part of distributed and central hydrogen production systems. Dense metallic and microporous separation membranes have multiple applications that include an array of system configurations. Reducing the cost of membrane materials, achieving higher flux rates, increasing hydrogen recovery, developing durable membranes, and purifying hydrogen to levels similar to that of pressure swing adsorption (PSA) purification will be measured based on analysis of actual system configurations and requirements. Thus, the technology targets presented in Section 3.1.4 are guideposts for membrane developers.
Separations systems that best reduce the cost to produce hydrogen more efficiently from diverse feedstocks will be down-selected. These separations sub-system components must be optimized to achieve the cost and hydrogen quality requirements. In collaboration with the Office of Fossil Energy, Energy Efficiency and Renewable Energy (EERE) sponsored the DOE Workshop on Hydrogen Separations and Purification where input on hydrogen membrane separation performance targets was provided by industry, government researchers, and academia (Report of the DOE Workshop on Hydrogen Separations and Purification, September 8-9, 2004 Arlington VA. U.S. Department of Energy Office of Hydrogen, Fuel Cells & Infrastructure Technologies)4
In addition to hydrogen separation membranes, oxygen separation membranes are being developed by the DOE Office of Fossil Energy (http://fossil.energy.gov/programs/fuels/index.html). These could be used to replace expensive oxygen cryogenic separation technologies, reducing the cost of hydrogen production from processes that use oxygen such as coal gasification, potentially biomass gasification, or even auto-thermal distributed reforming.
4 DOE’s Office of Fossil Energy (http://fossil.energy.gov/programs/fuels/index.html) is responsible for developing coal to hydrogen membrane separations systems that will operate in large-scale integrated gasification combined cycle plants to separate hydrogen and to capture and sequester carbon dioxide.
Multi-Year Research, Development and Demonstration Plan Page 3.1 - 5
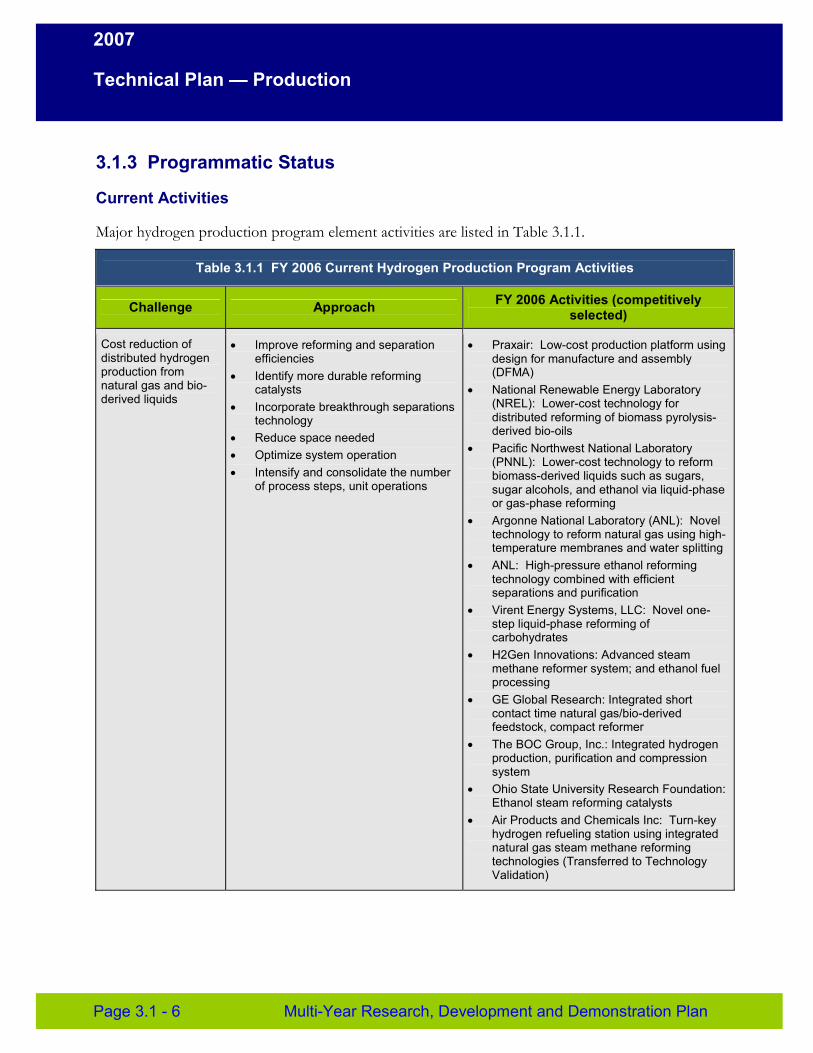
2007
Technical Plan — Production
3.1.3 Programmatic Status
Current Activities
Major hydrogen production program element activities are listed in Table 3.1.1.
Table 3.1.1 FY 2006 Current Hydrogen Production Program Activities
Challenge Approach FY 2006 Activities (competitively selected)
• Praxair: Low-cost production platform using Cost reduction of • Improve reforming and separation distributed hydrogen efficiencies design for manufacture and assembly production from • Identify more durable reforming (DFMA) natural gas and bio- catalysts • National Renewable Energy Laboratory derived liquids
• Incorporate breakthrough separations technology
• Reduce space needed • Optimize system operation • Intensify and consolidate the number
of process steps, unit operations
(NREL): Lower-cost technology for distributed reforming of biomass pyrolysis-derived bio-oils
• Pacific Northwest National Laboratory (PNNL): Lower-cost technology to reform biomass-derived liquids such as sugars, sugar alcohols, and ethanol via liquid-phase or gas-phase reforming
• Argonne National Laboratory (ANL): Novel technology to reform natural gas using high-temperature membranes and water splitting
• ANL: High-pressure ethanol reforming technology combined with efficient separations and purification
• Virent Energy Systems, LLC: Novel one-step liquid-phase reforming of carbohydrates
• H2Gen Innovations: Advanced steam methane reformer system; and ethanol fuel processing
• GE Global Research: Integrated short contact time natural gas/bio-derived feedstock, compact reformer
• The BOC Group, Inc.: Integrated hydrogen production, purification and compression system
• Ohio State University Research Foundation: Ethanol steam reforming catalysts
• Air Products and Chemicals Inc: Turn-key hydrogen refueling station using integrated natural gas steam methane reforming technologies (Transferred to Technology Validation)
Page 3.1 - 6 Multi-Year Research, Development and Demonstration Plan
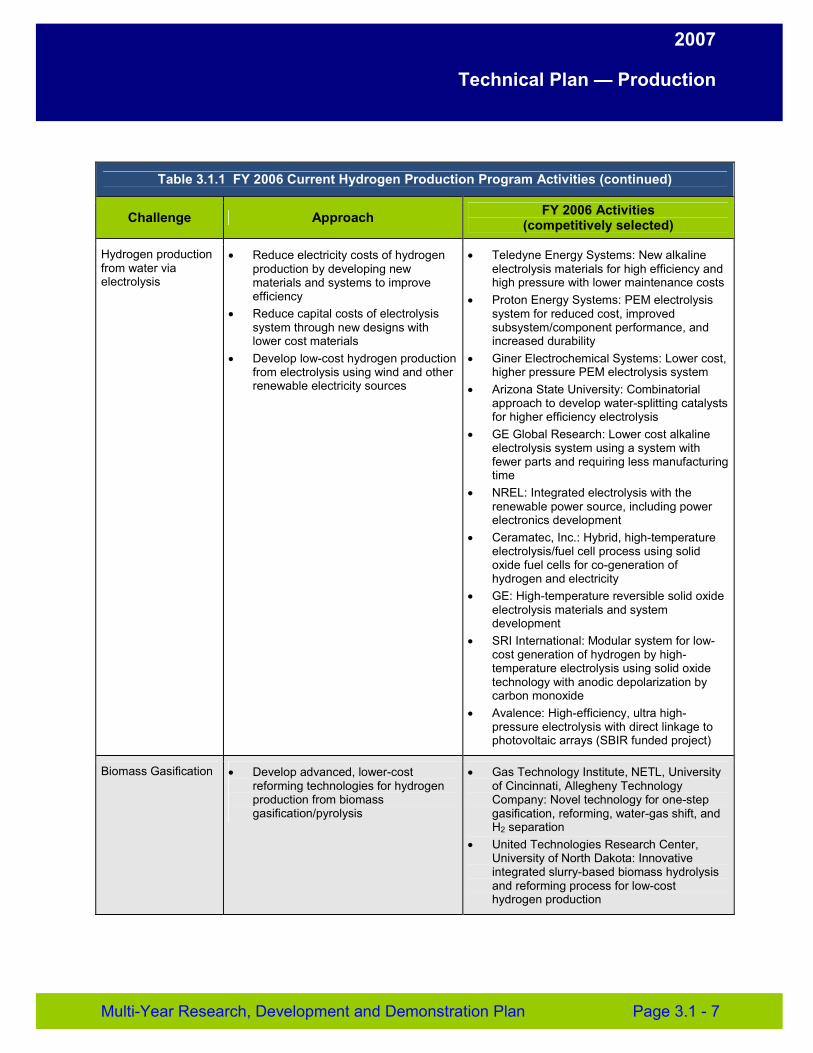
2007
Technical Plan — Production
Table 3.1.1 FY 2006 Current Hydrogen Production Program Activities (continued)
Challenge Approach FY 2006 Activities (competitively selected)
Hydrogen production • Reduce electricity costs of hydrogen • Teledyne Energy Systems: New alkaline from water via production by developing new electrolysis materials for high efficiency and electrolysis materials and systems to improve
efficiency • Reduce capital costs of electrolysis
system through new designs with lower cost materials
• Develop low-cost hydrogen production from electrolysis using wind and other renewable electricity sources
high pressure with lower maintenance costs • Proton Energy Systems: PEM electrolysis
system for reduced cost, improved subsystem/component performance, and increased durability
• Giner Electrochemical Systems: Lower cost, higher pressure PEM electrolysis system
• Arizona State University: Combinatorial approach to develop water-splitting catalysts for higher efficiency electrolysis
• GE Global Research: Lower cost alkaline electrolysis system using a system with fewer parts and requiring less manufacturing time
• NREL: Integrated electrolysis with the renewable power source, including power electronics development
• Ceramatec, Inc.: Hybrid, high-temperature electrolysis/fuel cell process using solid oxide fuel cells for co-generation of hydrogen and electricity
• GE: High-temperature reversible solid oxide electrolysis materials and system development
• SRI International: Modular system for low-cost generation of hydrogen by high-temperature electrolysis using solid oxide technology with anodic depolarization by carbon monoxide
• Avalence: High-efficiency, ultra high-pressure electrolysis with direct linkage to photovoltaic arrays (SBIR funded project)
Biomass Gasification • Develop advanced, lower-cost reforming technologies for hydrogen production from biomass gasification/pyrolysis
• Gas Technology Institute, NETL, University of Cincinnati, Allegheny Technology Company: Novel technology for one-step gasification, reforming, water-gas shift, and H2 separation
• United Technologies Research Center, University of North Dakota: Innovative integrated slurry-based biomass hydrolysis and reforming process for low-cost hydrogen production
Multi-Year Research, Development and Demonstration Plan Page 3.1 - 7
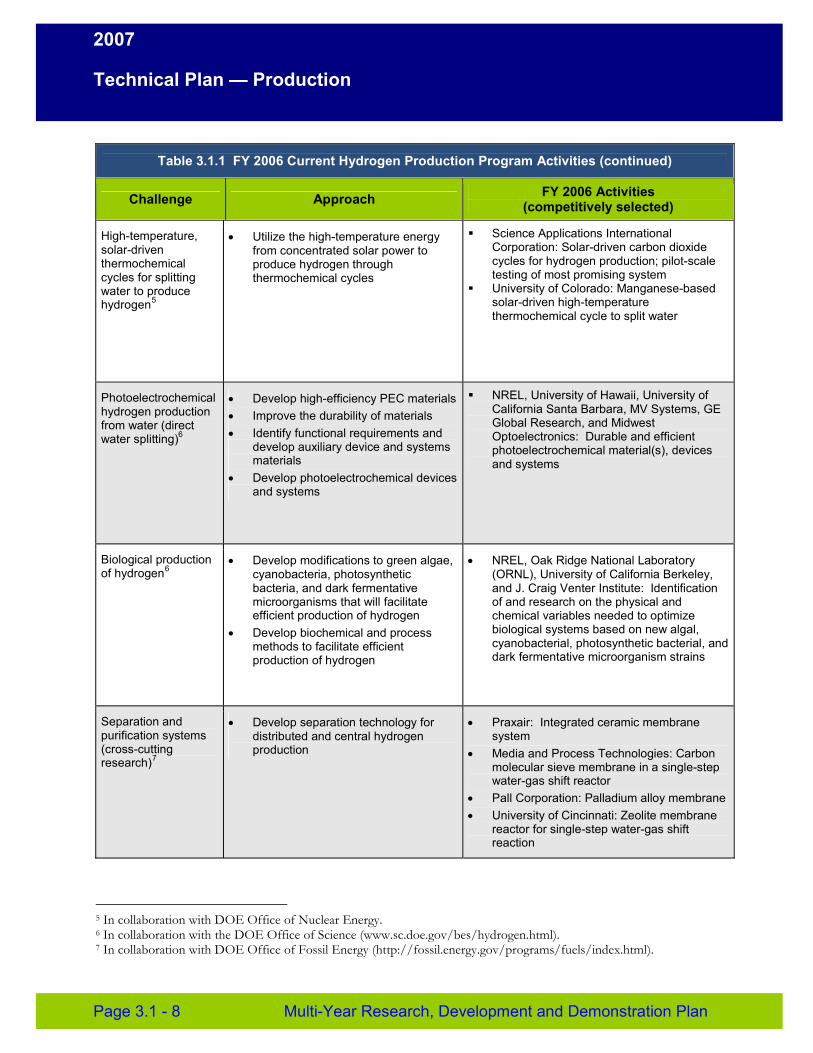
2007
Technical Plan — Production
Table 3.1.1 FY 2006 Current Hydrogen Production Program Activities (continued)
Challenge Approach FY 2006 Activities (competitively selected)
High-temperature, • Utilize the high-temperature energy � Science Applications International solar-driven from concentrated solar power to Corporation: Solar-driven carbon dioxide thermochemical produce hydrogen through cycles for hydrogen production; pilot-scale cycles for splitting water to produce
thermochemical cycles testing of most promising system � University of Colorado: Manganese-based
hydrogen5 solar-driven high-temperature thermochemical cycle to split water
Photoelectrochemical • Develop high-efficiency PEC materials � NREL, University of Hawaii, University of hydrogen production from water (direct water splitting)6
• Improve the durability of materials • Identify functional requirements and
develop auxiliary device and systems materials
• Develop photoelectrochemical devices and systems
California Santa Barbara, MV Systems, GE Global Research, and Midwest Optoelectronics: Durable and efficient photoelectrochemical material(s), devices and systems
Biological production • Develop modifications to green algae, • NREL, Oak Ridge National Laboratory of hydrogen6 cyanobacteria, photosynthetic (ORNL), University of California Berkeley,
bacteria, and dark fermentative and J. Craig Venter Institute: Identification microorganisms that will facilitate of and research on the physical and efficient production of hydrogen chemical variables needed to optimize
• Develop biochemical and process biological systems based on new algal, methods to facilitate efficient cyanobacterial, photosynthetic bacterial, and production of hydrogen dark fermentative microorganism strains
Separation and • Develop separation technology for • Praxair: Integrated ceramic membrane purification systems distributed and central hydrogen system (cross-cutting research)7
production • Media and Process Technologies: Carbon molecular sieve membrane in a single-step water-gas shift reactor
• Pall Corporation: Palladium alloy membrane • University of Cincinnati: Zeolite membrane
reactor for single-step water-gas shift reaction
5 In collaboration with DOE Office of Nuclear Energy. 6 In collaboration with the DOE Office of Science (www.sc.doe.gov/bes/hydrogen.html). 7 In collaboration with DOE Office of Fossil Energy (http://fossil.energy.gov/programs/fuels/index.html).
Page 3.1 - 8 Multi-Year Research, Development and Demonstration Plan
2007
Technical Plan — Production
3.1.4 Technical Challenges
The overarching technical challenge to hydrogen production is reducing cost. Hydrogen (as of 2003) 8 costs $5/gge delivered to a car at a refueling station based on distributed production using natural gas (see Table 3.1.2). This is significantly higher than the 2015 goal of $2.00/gge (the cost in 2006 is estimated to be $3.00/gge9). Estimates of the delivered cost of hydrogen using currently available technology for all production feedstocks is considerably higher than that required for hydrogen to be a cost-competitive primary energy carrier.
The capital costs of current water electrolysis systems, along with the high cost of electricity in many regions, limit widespread adoption of electrolysis technology for hydrogen production. Water electrolyzer capital cost reductions and efficiency improvements are required along with the design of utility-scale electrolyzers capable of grid integration and compatible with low-cost, near-zero emission electricity sources. Electrolytic production of hydrogen, where coal is the primary energy resource, will not lead to carbon emission reduction without carbon sequestration technologies.
Hydrogen can be produced from biomass either by distributed reforming of bio-derived liquids or through gasification or pyrolysis of biomass feedstocks. The costs of currently available bio-derived liquids such as ethanol or sugar alcohols (e.g., sorbitol) need to be reduced. Significant improvements in ethanol reforming and improved technologies need to be developed for other bioderived liquids to reduce the capital and operating costs for this distributed production option to become competitive. The efficiencies of biomass gasification, pyrolysis and reforming need to be increased and the capital costs need to be reduced by developing improved technologies and approaches.
High-temperature, solar-driven, thermochemical hydrogen production using water-splitting chemical cycles is in an early stage of research. Research is also needed to cost-effectively couple the thermochemical cycles with advanced concentrated solar energy technology. If these efforts are successful, high-temperature thermochemical processes may provide a clean, efficient, and sustainable route for producing hydrogen from water.
Photoelectrochemical hydrogen production (direct water splitting), also in an early stage of development, depends on a breakthrough in materials development and could require large areas of land. Research in this area is progressing on three fronts: (1) the study of high-efficiency materials in order to attain the fundamental understanding needed for improving lower-efficiency lower-cost materials; (2) the study of low-cost durable materials in order to attain the fundamental understanding needed for modifying higher-efficiency lower-durability materials; and 3) the
8 This cost for hydrogen in 2003 is based on analysis of distributed production utilizing natural gas reforming technology available in 2003. Details can be found in DOE Record 5030 (see www.hydrogen.energy.gov/program_records.html). A cost of hydrogen of $3.60/gge has been projected based on 2004 technology for an energy station producing both hydrogen and electricity (U.S. Department of Energy, Hydrogen Program 2004 Annual Progress Report (December 2004), “Research and Development of a PEM Fuel Cell, Hydrogen Reformer, and Vehicle Refueling Facility” (Air Products and Chemicals, Inc.), 701, retrieved September 15, 2005, from http://www.hydrogen.energy.gov/pdfs/progress04/vd5_wait.pdf. 9 The 2006 current status of $3.00/gge was estimated through H2A analysis (see Table 3.1.2) and confirmed by the 2006 Independent Assessment of the Status of Distributed Natural Gas Reforming (http://www.hydrogen.energy.gov/peer_review_production.html).
Multi-Year Research, Development and Demonstration Plan Page 3.1 - 9
2007
Technical Plan — Production
development of multijunction devices incorporating multiple material layers to achieve efficient water splitting.
Biological hydrogen production is in an early stage of research and presents many technical challenges, beginning with bioengineering of microorganisms that can produce hydrogen at high rates. Some of the challenges are related to increased light utilization efficiency, increased rate of hydrogen production, improved continuity of photoproduction, and increased hydrogen molar yield. The advantages of biological hydrogen production are that high-purity water is not required and toxic or polluting by-products are not generated.
Technical Targets
A variety of feedstocks and processes are being researched and developed for producing hydrogen fuel. Each technology is in a different stage of development, and each offers unique opportunities, benefits, and challenges. Economics favor certain technologies more than others in the near term, but other technologies are expected to become economically viable as the technologies mature and market drivers shift.
Tables 3.1.2 through 3.1.13 list the DOE technical targets for hydrogen production from a variety of feedstocks. The targets and timeline for each technology reflect a number of factors, including the expected size/capacity of a production unit, the current stage of technology development, and the costs and characteristics of the feedstock. Where appropriate, target tables are accompanied by another table that details the estimated cost breakdown as determined using the H2A hydrogen production cost models. This accompanying table is provided as an example only. The cost breakdown are not targets.
Out-year targets are R&D milestones for measuring progress. For hydrogen to become a major energy carrier, the combination of its cost and that of the power system it is used in, must be competitive with the alternatives available in the marketplace. For light duty vehicles, this means that the combination of the hydrogen cost, and its use in a hydrogen fuel cell vehicle, must be competitive with conventional fuels used in internal combustion engine and hybrid vehicles on a cost per mile basis to the consumer. The estimated cost of hydrogen needed to be competitive (with gasoline ICE or hybrid) is $2.00-$3.00/gge (untaxed) at the dispenser. This estimate will be periodically re-evaluated to reflect projected fuel costs and vehicle power system energy efficiencies on a cost-per-mile basis. The ultimate target for all of the production technologies being researched is a hydrogen cost that will be competitive for transportation on a well-to-wheels basis, regardless of the production method.
Tables 3.1.6 and 3.1.7 on membrane technology have been included for completeness. The Program has a limited amount of work on membrane materials in support of hydrogen separation processes associated with renewable pathways and is evaluating work being funded by the Office of Fossil Energy (http://fossil.energy.gov/programs/fuels/index.html).
Although not listed in each table, it is understood that the quality of the hydrogen produced by each of these production technologies must meet the rigorous hydrogen quality requirements as described in Appendix C.
Page 3.1 - 10 Multi-Year Research, Development and Demonstration Plan
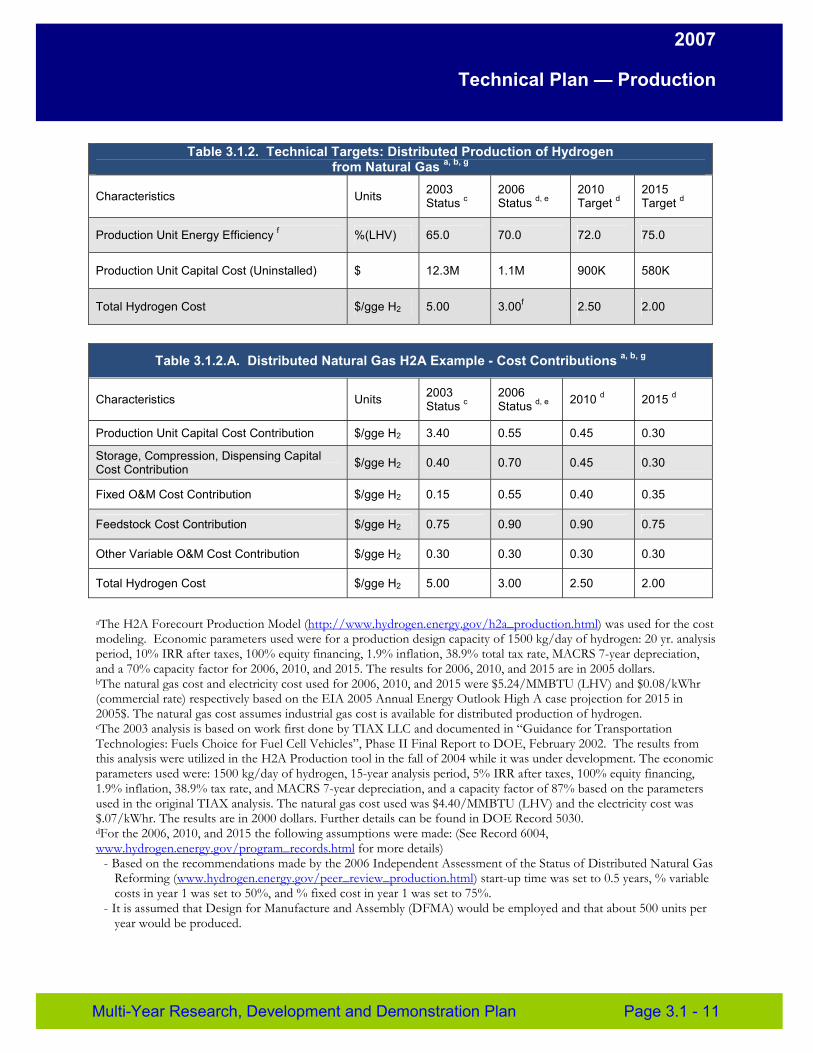
2007
Technical Plan — Production
Table 3.1.2. Technical Targets: Distributed Production of Hydrogen from Natural Gas a, b, g
Characteristics Units 2003 Status c
2006 Status d, e
2010 Target d
2015 Target d
Production Unit Energy Efficiency f %(LHV) 65.0 70.0 72.0 75.0
Production Unit Capital Cost (Uninstalled) $ 12.3M 1.1M 900K 580K
Total Hydrogen Cost $/gge H2 5.00 3.00f 2.50 2.00
Table 3.1.2.A. Distributed Natural Gas H2A Example - Cost Contributions a, b, g
Characteristics Units 2003 Status c
2006 Status d, e 2010 d 2015 d
Production Unit Capital Cost Contribution $/gge H2 3.40 0.55 0.45 0.30
Storage, Compression, Dispensing Capital Cost Contribution $/gge H2 0.40 0.70 0.45 0.30
Fixed O&M Cost Contribution $/gge H2 0.15 0.55 0.40 0.35
Feedstock Cost Contribution $/gge H2 0.75 0.90 0.90 0.75
Other Variable O&M Cost Contribution $/gge H2 0.30 0.30 0.30 0.30
Total Hydrogen Cost $/gge H2 5.00 3.00 2.50 2.00
aThe H2A Forecourt Production Model (http://www.hydrogen.energy.gov/h2a_production.html) was used for the cost modeling. Economic parameters used were for a production design capacity of 1500 kg/day of hydrogen: 20 yr. analysis period, 10% IRR after taxes, 100% equity financing, 1.9% inflation, 38.9% total tax rate, MACRS 7-year depreciation, and a 70% capacity factor for 2006, 2010, and 2015. The results for 2006, 2010, and 2015 are in 2005 dollars. bThe natural gas cost and electricity cost used for 2006, 2010, and 2015 were $5.24/MMBTU (LHV) and $0.08/kWhr (commercial rate) respectively based on the EIA 2005 Annual Energy Outlook High A case projection for 2015 in 2005$. The natural gas cost assumes industrial gas cost is available for distributed production of hydrogen. cThe 2003 analysis is based on work first done by TIAX LLC and documented in “Guidance for Transportation Technologies: Fuels Choice for Fuel Cell Vehicles”, Phase II Final Report to DOE, February 2002. The results from this analysis were utilized in the H2A Production tool in the fall of 2004 while it was under development. The economic parameters used were: 1500 kg/day of hydrogen, 15-year analysis period, 5% IRR after taxes, 100% equity financing, 1.9% inflation, 38.9% tax rate, and MACRS 7-year depreciation, and a capacity factor of 87% based on the parameters used in the original TIAX analysis. The natural gas cost used was $4.40/MMBTU (LHV) and the electricity cost was $.07/kWhr. The results are in 2000 dollars. Further details can be found in DOE Record 5030. dFor the 2006, 2010, and 2015 the following assumptions were made: (See Record 6004, www.hydrogen.energy.gov/program_records.html for more details)
- Based on the recommendations made by the 2006 Independent Assessment of the Status of Distributed Natural Gas Reforming (www.hydrogen.energy.gov/peer_review_production.html) start-up time was set to 0.5 years, % variable costs in year 1 was set to 50%, and % fixed cost in year 1 was set to 75%.
- It is assumed that Design for Manufacture and Assembly (DFMA) would be employed and that about 500 units per year would be produced.
Multi-Year Research, Development and Demonstration Plan Page 3.1 - 11
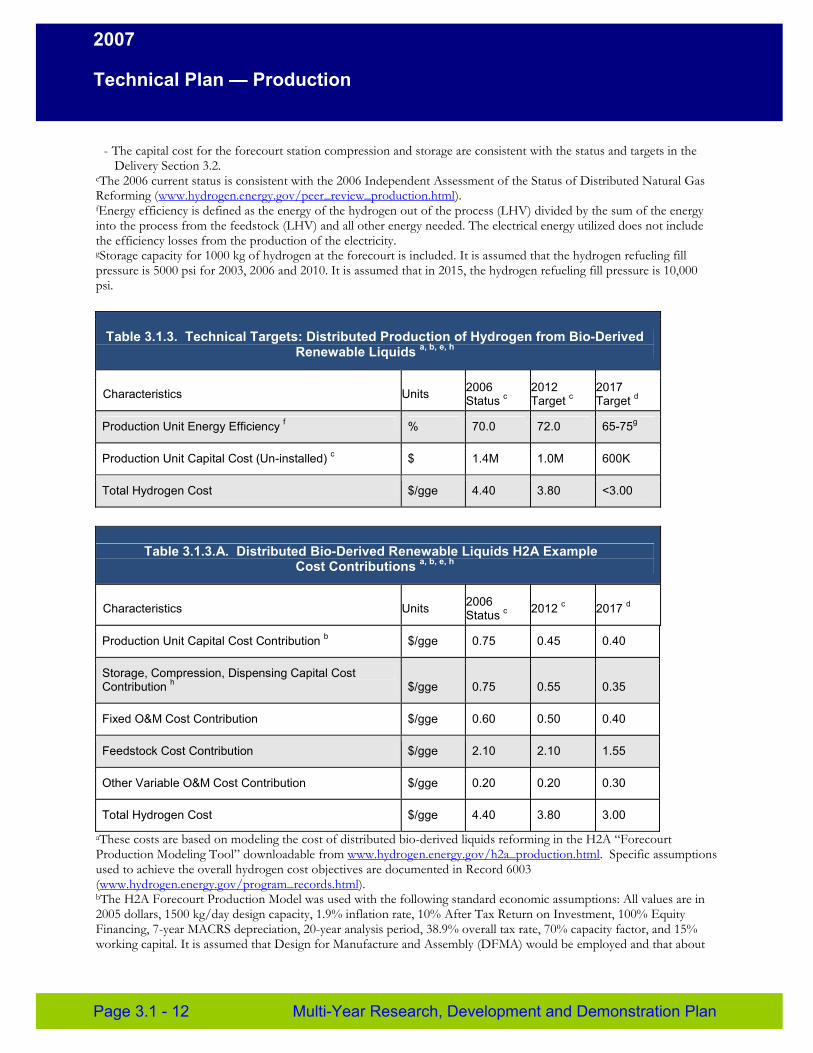
2007
Technical Plan — Production
- The capital cost for the forecourt station compression and storage are consistent with the status and targets in the Delivery Section 3.2.
eThe 2006 current status is consistent with the 2006 Independent Assessment of the Status of Distributed Natural Gas Reforming (www.hydrogen.energy.gov/peer_review_production.html). fEnergy efficiency is defined as the energy of the hydrogen out of the process (LHV) divided by the sum of the energy into the process from the feedstock (LHV) and all other energy needed. The electrical energy utilized does not include the efficiency losses from the production of the electricity. gStorage capacity for 1000 kg of hydrogen at the forecourt is included. It is assumed that the hydrogen refueling fill pressure is 5000 psi for 2003, 2006 and 2010. It is assumed that in 2015, the hydrogen refueling fill pressure is 10,000 psi.
Table 3.1.3. Technical Targets: Distributed Production of Hydrogen from Bio-Derived Renewable Liquids a, b, e, h
Characteristics Units 2006 Status c
2012 Target c
2017 Target d
Production Unit Energy Efficiency f % 70.0 72.0 65-75g
Production Unit Capital Cost (Un-installed) c $ 1.4M 1.0M 600K
Total Hydrogen Cost $/gge 4.40 3.80 <3.00
Table 3.1.3.A. Distributed Bio-Derived Renewable Liquids H2A Example Cost Contributions a, b, e, h
Characteristics Units 2006 Status c 2012 c 2017 d
Production Unit Capital Cost Contribution b $/gge 0.75 0.45 0.40
Storage, Compression, Dispensing Capital Cost Contribution h $/gge 0.75 0.55 0.35
Fixed O&M Cost Contribution $/gge 0.60 0.50 0.40
Feedstock Cost Contribution $/gge 2.10 2.10 1.55
Other Variable O&M Cost Contribution $/gge 0.20 0.20 0.30
Total Hydrogen Cost $/gge 4.40 3.80 3.00
aThese costs are based on modeling the cost of distributed bio-derived liquids reforming in the H2A “Forecourt Production Modeling Tool” downloadable from www.hydrogen.energy.gov/h2a_production.html. Specific assumptions used to achieve the overall hydrogen cost objectives are documented in Record 6003 (www.hydrogen.energy.gov/program_records.html). bThe H2A Forecourt Production Model was used with the following standard economic assumptions: All values are in 2005 dollars, 1500 kg/day design capacity, 1.9% inflation rate, 10% After Tax Return on Investment, 100% Equity Financing, 7-year MACRS depreciation, 20-year analysis period, 38.9% overall tax rate, 70% capacity factor, and 15% working capital. It is assumed that Design for Manufacture and Assembly (DFMA) would be employed and that about
Page 3.1 - 12 Multi-Year Research, Development and Demonstration Plan
2007
Technical Plan — Production
of 500 units per year would be produced. The capital cost for the forecourt station compression and storage are consistent with the status and targets in the Delivery Section 3.2. Based on the recommendations made by the 2006 Independent Assessment of the Status of Distributed Natural Gas Reforming (www.hydrogen.energy.gov/peer_review_production.html) start-up time was set to 0.5 years, % variable costs in year 1 was set to 50%, and percent fixed cost in year 1 was set to 75%. cThe 2006 Status and 2012 values are based on the H2A distributed ethanol reforming analyses Current and Advanced cases respectively (www.hydrogen.energy.gov/h2a_production.html) with respect to the production unit capital and operating efficiency. The cost of ethanol utilized is $1.07/gal (no tax credit assumed). This is the DOE EERE Biomass Program target for cellulosic based ethanol in 2012. The electricity cost utilized is $.08/kWh (commercial rate) based on the EIA 2005 Annual Energy Outlook High A case projection for 2015 in 2005$. dThe 2017 Target has been set to achieve <$3.00/gge hydrogen. Aqueous phase reforming of sugars is a technology being researched that has the potential to reach this target and was used as the example H2A Distributed Production case run. The cost of sugar used was $.07/lb which is consistent with the target cost of cellulosic sugar for ethanol production in 2012 in the DOE EERE Biomass Program. The electricity cost utilized is $.08/kWh (commercial rate) based on the EIA 2005 Annual Energy Outlook High A case projection for 2015 in 2005$. The capital cost and energy efficiency of the production unit are based on preliminary analyses and projections for what could be achieved with successful development of this technology. (See record 6003, www.hydrogen.energy.gov/program_records.html for more details.) Alternatively, the target of <$3.00/gge could be achieved with ethanol reforming if the cost of ethanol could be reduced to <$.90/gal. This ethanol cost is consistent with the longer term (>2015) DOE EERE Biomass Program cost target for cellulosic ethanol. eFor the 2006, 2010, and 2015 the following assumptions were made: (See Record 6003, www.hydrogen.energy.gov/program_records.html for more details.)
- Based on the recommendations made by the 2006 Independent Assessment of the Status of Distributed Natural Gas Reforming (www.hydrogen.energy.gov/peer_review_production.html) start-up time was set to 0.5 years, % variable costs in year 1 was set to 50%, and % fixed cost in year 1 was set to 75%.
- It is assumed that Design for Manufacture and Assembly (DFMA) would be employed and that on the order of 500 units per year would be produced.
- The capital cost for the forecourt station compression and storage are consistent with the status and targets in the Delivery Section 3.2.
fEnergy efficiency is defined as the energy in the hydrogen produced (on a LHV basis) divided the sum of the feedstock energy (LHV) plus all other energy used in the process gProduction unit energy efficiency may vary (as low as 65%) as the capital cost, feedstock costs and other costs associated with aqueous phase reforming are low enough to still achieve the target of <$3.00/gge hydrogen cost. hStorage capacity for 1000 kg of hydrogen at the forecourt is included. It is assumed that the hydrogen refueling fill pressure is 5000 psi for 2006 and 2012. It is assumed that in 2017, the hydrogen refueling fill pressure is 10,000 psi.
Multi-Year Research, Development and Demonstration Plan Page 3.1 - 13
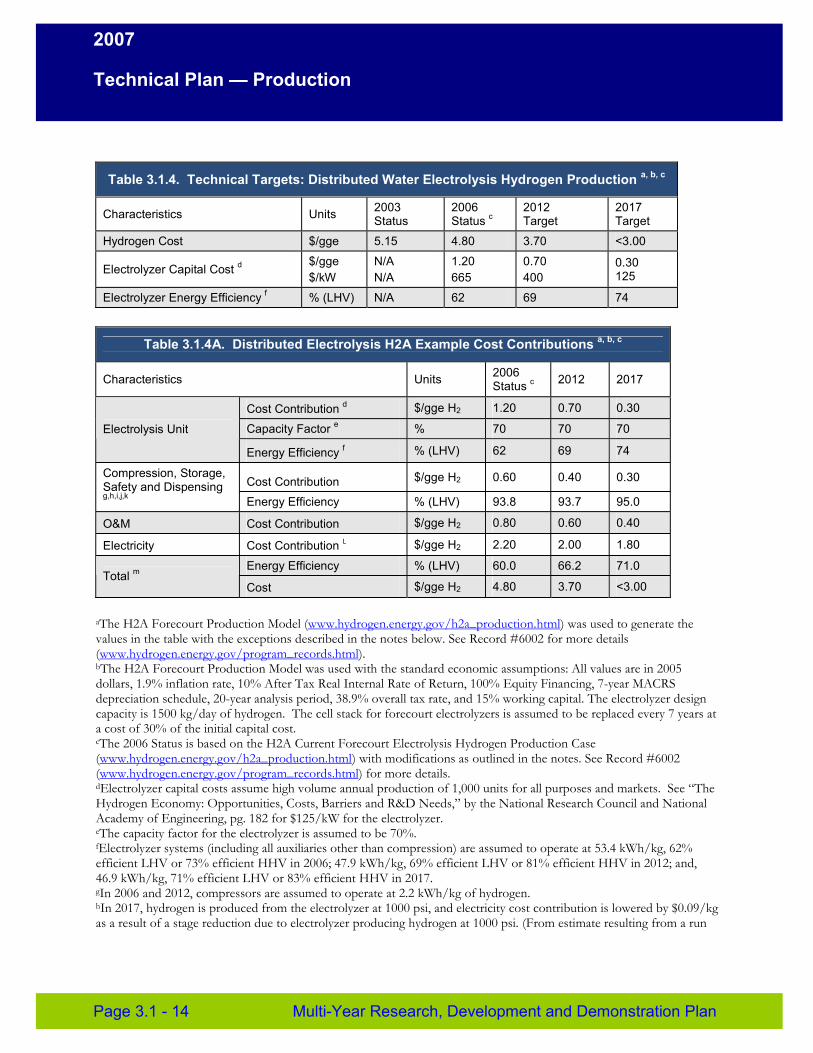
2007
Technical Plan — Production
Table 3.1.4. Technical Targets: Distributed Water Electrolysis Hydrogen Production a, b, c
Characteristics Units 2003 Status
2006 Status c
2012 Target
2017 Target
Hydrogen Cost $/gge 5.15 4.80 3.70 <3.00
Electrolyzer Capital Cost d $/gge $/kW
N/A N/A
1.20 665
0.70 400
0.30 125
Electrolyzer Energy Efficiency f % (LHV) N/A 62 69 74
Table 3.1.4A. Distributed Electrolysis H2A Example Cost Contributions a, b, c
Characteristics Units 2006 Status c 2012 2017
Electrolysis Unit
Cost Contribution d $/gge H2 1.20 0.70 0.30
Capacity Factor e % 70 70 70
Energy Efficiency f % (LHV) 62 69 74
Compression, Storage, Safety and Dispensingg,h,i,j,k
Cost Contribution $/gge H2 0.60 0.40 0.30
Energy Efficiency % (LHV) 93.8 93.7 95.0
O&M Cost Contribution $/gge H2 0.80 0.60 0.40
Electricity Cost Contribution L $/gge H2 2.20 2.00 1.80
Total m Energy Efficiency % (LHV) 60.0 66.2 71.0
Cost $/gge H2 4.80 3.70 <3.00
aThe H2A Forecourt Production Model (www.hydrogen.energy.gov/h2a_production.html) was used to generate the values in the table with the exceptions described in the notes below. See Record #6002 for more details (www.hydrogen.energy.gov/program_records.html). bThe H2A Forecourt Production Model was used with the standard economic assumptions: All values are in 2005 dollars, 1.9% inflation rate, 10% After Tax Real Internal Rate of Return, 100% Equity Financing, 7-year MACRS depreciation schedule, 20-year analysis period, 38.9% overall tax rate, and 15% working capital. The electrolyzer design capacity is 1500 kg/day of hydrogen. The cell stack for forecourt electrolyzers is assumed to be replaced every 7 years at a cost of 30% of the initial capital cost. cThe 2006 Status is based on the H2A Current Forecourt Electrolysis Hydrogen Production Case (www.hydrogen.energy.gov/h2a_production.html) with modifications as outlined in the notes. See Record #6002 (www.hydrogen.energy.gov/program_records.html) for more details. dElectrolyzer capital costs assume high volume annual production of 1,000 units for all purposes and markets. See “The Hydrogen Economy: Opportunities, Costs, Barriers and R&D Needs,” by the National Research Council and National Academy of Engineering, pg. 182 for $125/kW for the electrolyzer. eThe capacity factor for the electrolyzer is assumed to be 70%. fElectrolyzer systems (including all auxiliaries other than compression) are assumed to operate at 53.4 kWh/kg, 62% efficient LHV or 73% efficient HHV in 2006; 47.9 kWh/kg, 69% efficient LHV or 81% efficient HHV in 2012; and, 46.9 kWh/kg, 71% efficient LHV or 83% efficient HHV in 2017. gIn 2006 and 2012, compressors are assumed to operate at 2.2 kWh/kg of hydrogen. hIn 2017, hydrogen is produced from the electrolyzer at 1000 psi, and electricity cost contribution is lowered by $0.09/kg as a result of a stage reduction due to electrolyzer producing hydrogen at 1000 psi. (From estimate resulting from a run
Page 3.1 - 14 Multi-Year Research, Development and Demonstration Plan
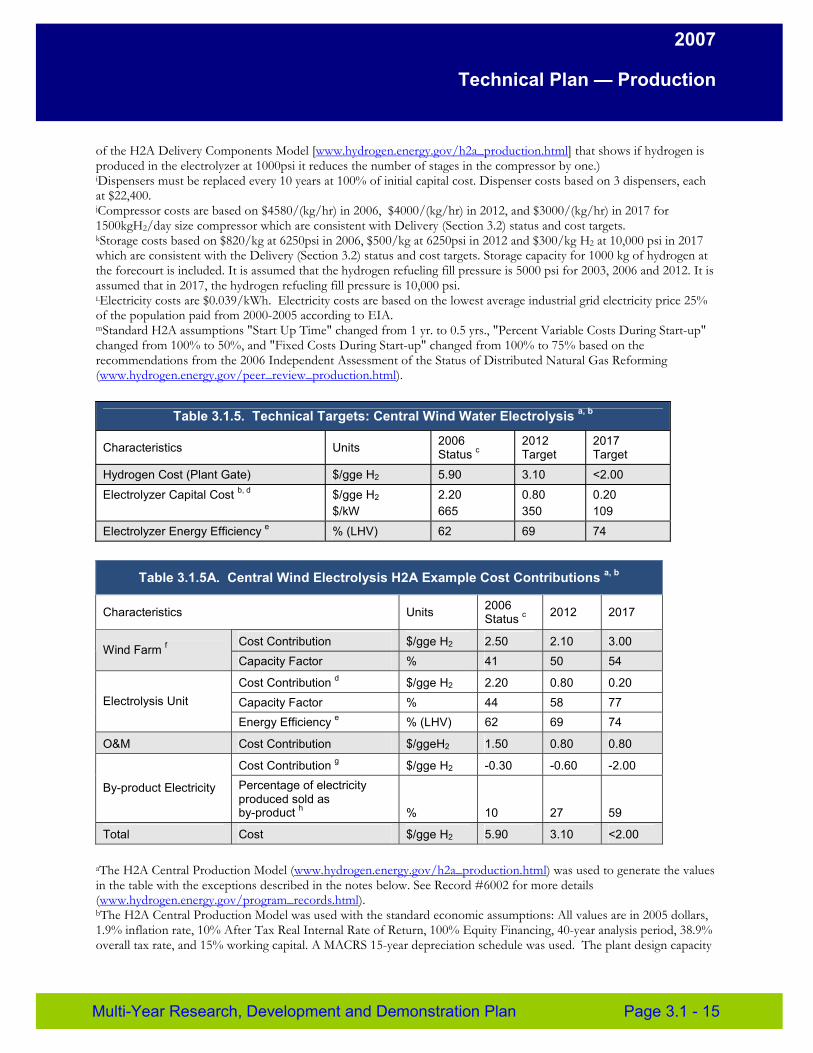
2007
Technical Plan — Production
of the H2A Delivery Components Model [www.hydrogen.energy.gov/h2a_production.html] that shows if hydrogen is produced in the electrolyzer at 1000psi it reduces the number of stages in the compressor by one.) iDispensers must be replaced every 10 years at 100% of initial capital cost. Dispenser costs based on 3 dispensers, each at $22,400. jCompressor costs are based on $4580/(kg/hr) in 2006, $4000/(kg/hr) in 2012, and $3000/(kg/hr) in 2017 for 1500kgH2/day size compressor which are consistent with Delivery (Section 3.2) status and cost targets. kStorage costs based on $820/kg at 6250psi in 2006, $500/kg at 6250psi in 2012 and $300/kg H2 at 10,000 psi in 2017 which are consistent with the Delivery (Section 3.2) status and cost targets. Storage capacity for 1000 kg of hydrogen at the forecourt is included. It is assumed that the hydrogen refueling fill pressure is 5000 psi for 2003, 2006 and 2012. It is assumed that in 2017, the hydrogen refueling fill pressure is 10,000 psi. LElectricity costs are $0.039/kWh. Electricity costs are based on the lowest average industrial grid electricity price 25% of the population paid from 2000-2005 according to EIA. mStandard H2A assumptions "Start Up Time" changed from 1 yr. to 0.5 yrs., "Percent Variable Costs During Start-up" changed from 100% to 50%, and "Fixed Costs During Start-up" changed from 100% to 75% based on the recommendations from the 2006 Independent Assessment of the Status of Distributed Natural Gas Reforming (www.hydrogen.energy.gov/peer_review_production.html).
Table 3.1.5. Technical Targets: Central Wind Water Electrolysis a, b
Characteristics Units 2006 Status c
2012 Target
2017 Target
Hydrogen Cost (Plant Gate) $/gge H2 5.90 3.10 <2.00
Electrolyzer Capital Cost b, d $/gge H2
$/kW 2.20 665
0.80 350
0.20 109
Electrolyzer Energy Efficiency e % (LHV) 62 69 74
Table 3.1.5A. Central Wind Electrolysis H2A Example Cost Contributions a, b
Characteristics Units 2006 Status c 2012 2017
Wind Farm f Cost Contribution $/gge H2 2.50 2.10 3.00 Capacity Factor % 41 50 54
Electrolysis Unit Cost Contribution d $/gge H2 2.20 0.80 0.20 Capacity Factor % 44 58 77 Energy Efficiency e % (LHV) 62 69 74
O&M Cost Contribution $/ggeH2 1.50 0.80 0.80
By-product Electricity
Cost Contribution g $/gge H2 -0.30 -0.60 -2.00 Percentage of electricity produced sold as by-product h % 10 27 59
Total Cost $/gge H2 5.90 3.10 <2.00
aThe H2A Central Production Model (www.hydrogen.energy.gov/h2a_production.html) was used to generate the values in the table with the exceptions described in the notes below. See Record #6002 for more details (www.hydrogen.energy.gov/program_records.html). bThe H2A Central Production Model was used with the standard economic assumptions: All values are in 2005 dollars, 1.9% inflation rate, 10% After Tax Real Internal Rate of Return, 100% Equity Financing, 40-year analysis period, 38.9% overall tax rate, and 15% working capital. A MACRS 15-year depreciation schedule was used. The plant design capacity
Multi-Year Research, Development and Demonstration Plan Page 3.1 - 15
2007
Technical Plan — Production
is 50,000 kg/day of hydrogen. The plant gate hydrogen pressure is 300 psi. The cell stacks for central electrolyzers are assumed to be replaced every 10 years at a cost of 30% of the initial capital cost. Assumes no grid assistance. cThe 2006 Status is based on the H2A Current Central Hydrogen Production from Wind Electrolysis Case (www.hydrogen.energy.gov/h2a_production.html) with modifications as outlined in the other footnotes. See Record #6002 for more details (www.hydrogen.energy.gov/program_records.html). dElectrolyzer capital costs assume high volume annual production of 1,000 units for all purposes and markets. The 2012 electrolyzer capital costs assume a 12.5% savings on a standard H2A assumption for advanced electrolyzer cost of $400/kW (see “Modeling the Market Potential of Hydrogen from Wind and Competing Sources,” by W. Short, N. Blair, and D. Heimiller, p. 6 for 12.5% reduction of electrolyzer cost for combined wind/electrolyzer electronic controls). 2017 electrolyzer capital costs assume a 12.5% savings on a $125/kW system (see “The Hydrogen Economy: Opportunities, Costs, Barriers and R&D Needs,” by the National Research Council and National Academy of Engineering, pg. 182 for $125/kW for the electrolyzer). eElectrolyzer systems (including all auxiliaries other than compression) are assumed to operate at 53.4 kWh/kg, 62% efficient LHV or 73% efficient HHV in 2006; 47.9 kWh/kg, 69% efficient LHV or 81% efficient HHV in 2012; and, 44.7 kWh/kg, 74% efficient LHV or 87% efficient HHV in 2017. fWind farm is 303 MW in the 2006 case, 276 MW in the 2012 case, and 423 MW in the 2017 case. Sizes are based on optimization as outlined in WindPOWER report, “An Economic Analysis of Hydrogen Production from Wind” by J. Levene. Wind capital costs are assumed to be $873/kW installed in 2006, $754/kW in 2012, and $706/kW in 2017. The wind capacity factor is 0.41 in 2006, 0.50 in 2012, and 0.54 in 2017 based on class 6 wind regimes. The wind farm cost contribution ($/gge) increases in 2017 to accommodate an increase in the capacity factor of the electrolyzer unit. The increase in capacity factor requires a higher capacity wind farm, but lowers the overall hydrogen cost due to the value of the electricity not needed by the electrolyzer. It is assumed the wind turbine rotor will need to be replaced after 20 years at 20% of initial investment. gIn the 2006 case, a production tax credit (PTC) of $0.018/kWh is applied to the by-product electricity produced for the first 10 years. hIn 2006, 10% of the electricity produced is sold as a by product; in 2012, 27% of the electricity produced is sold as a byproduct; in 2017, 59% of the electricity produced is sold as a by-product.
Page 3.1 - 16 Multi-Year Research, Development and Demonstration Plan
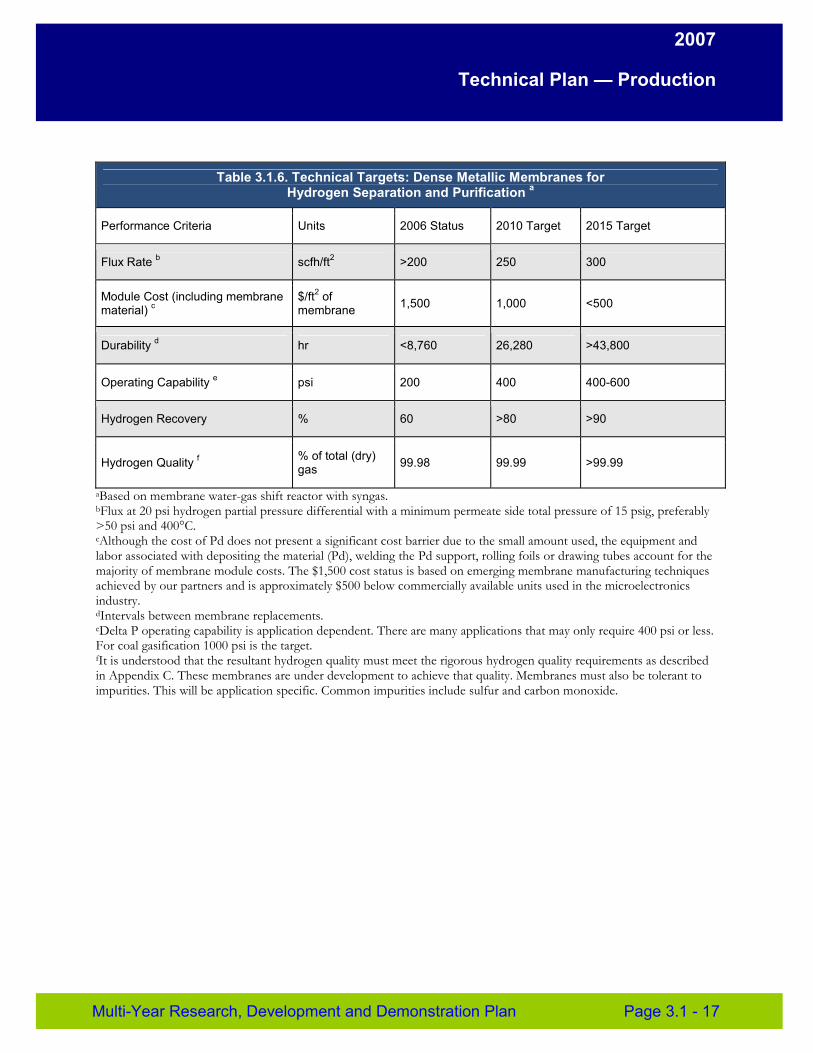
2007
Technical Plan — Production
Table 3.1.6. Technical Targets: Dense Metallic Membranes for Hydrogen Separation and Purification a
Performance Criteria Units 2006 Status 2010 Target 2015 Target
Flux Rate b scfh/ft2 >200 250 300
Module Cost (including membrane material) c
$/ft2 of membrane 1,500 1,000 <500
Durability d hr <8,760 26,280 >43,800
Operating Capability e psi 200 400 400-600
Hydrogen Recovery % 60 >80 >90
Hydrogen Quality f % of total (dry) gas 99.98 99.99 >99.99
aBased on membrane water-gas shift reactor with syngas. bFlux at 20 psi hydrogen partial pressure differential with a minimum permeate side total pressure of 15 psig, preferably >50 psi and 400°C. cAlthough the cost of Pd does not present a significant cost barrier due to the small amount used, the equipment and labor associated with depositing the material (Pd), welding the Pd support, rolling foils or drawing tubes account for the majority of membrane module costs. The $1,500 cost status is based on emerging membrane manufacturing techniques achieved by our partners and is approximately $500 below commercially available units used in the microelectronics industry. dIntervals between membrane replacements. eDelta P operating capability is application dependent. There are many applications that may only require 400 psi or less. For coal gasification 1000 psi is the target. fIt is understood that the resultant hydrogen quality must meet the rigorous hydrogen quality requirements as described in Appendix C. These membranes are under development to achieve that quality. Membranes must also be tolerant to impurities. This will be application specific. Common impurities include sulfur and carbon monoxide.
Multi-Year Research, Development and Demonstration Plan Page 3.1 - 17
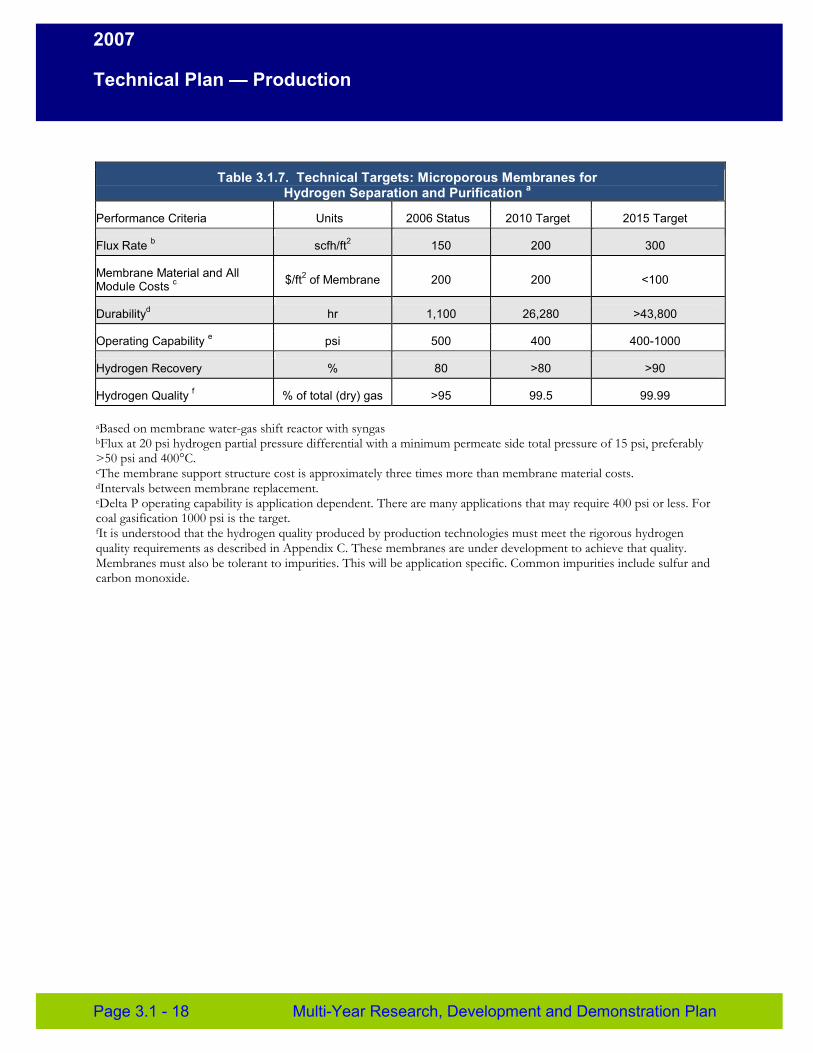
2007
Technical Plan — Production
Table 3.1.7. Technical Targets: Microporous Membranes for Hydrogen Separation and Purification a
Performance Criteria Units 2006 Status 2010 Target 2015 Target
Flux Rate b scfh/ft2 150 200 300
Membrane Material and All Module Costs c $/ft2 of Membrane 200 200 <100
Durabilityd hr 1,100 26,280 >43,800
Operating Capability e psi 500 400 400-1000
Hydrogen Recovery % 80 >80 >90
Hydrogen Quality f % of total (dry) gas >95 99.5 99.99
aBased on membrane water-gas shift reactor with syngas bFlux at 20 psi hydrogen partial pressure differential with a minimum permeate side total pressure of 15 psi, preferably >50 psi and 400°C. cThe membrane support structure cost is approximately three times more than membrane material costs. dIntervals between membrane replacement. eDelta P operating capability is application dependent. There are many applications that may require 400 psi or less. For coal gasification 1000 psi is the target. fIt is understood that the hydrogen quality produced by production technologies must meet the rigorous hydrogen quality requirements as described in Appendix C. These membranes are under development to achieve that quality. Membranes must also be tolerant to impurities. This will be application specific. Common impurities include sulfur and carbon monoxide.
Page 3.1 - 18 Multi-Year Research, Development and Demonstration Plan
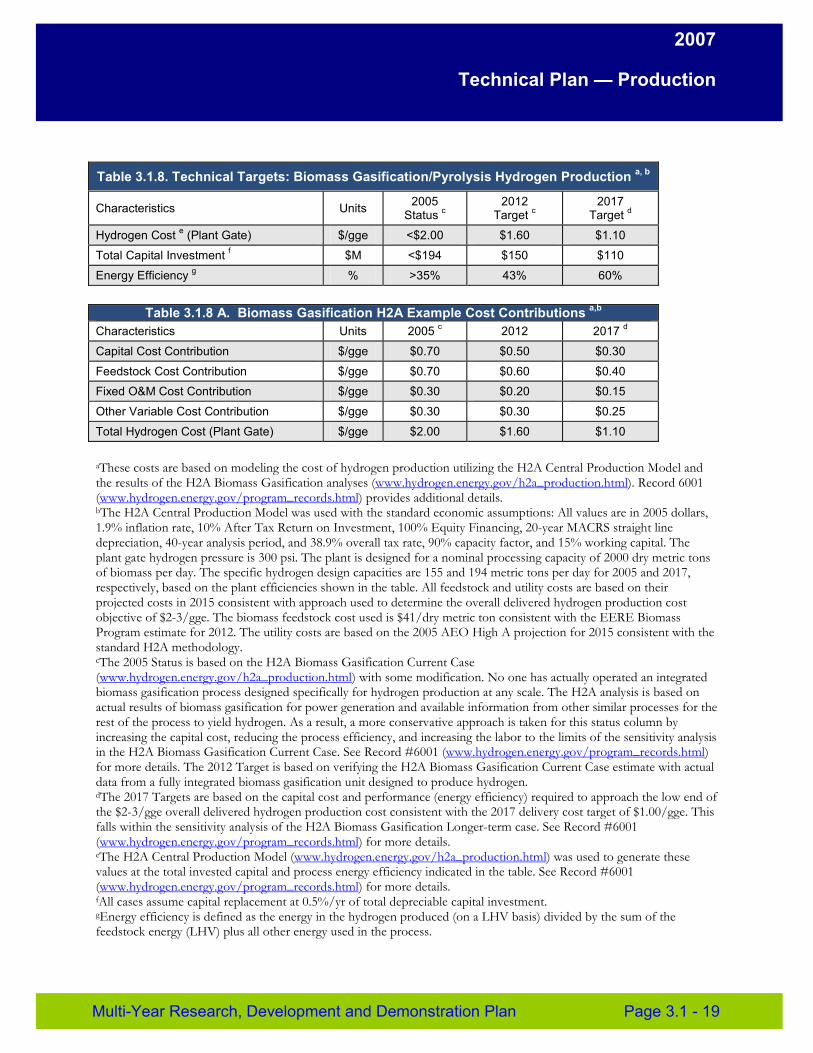
2007
Technical Plan — Production
Table 3.1.8. Technical Targets: Biomass Gasification/Pyrolysis Hydrogen Production a, b
Characteristics Units 2005 Status c
2012 Target c
2017 Target d
Hydrogen Cost e (Plant Gate) $/gge <$2.00 $1.60 $1.10
Total Capital Investment f $M <$194 $150 $110
Energy Efficiency g % >35% 43% 60%
Table 3.1.8 A. Biomass Gasification H2A Example Cost Contributions a,b
Characteristics Units 2005 c 2012 2017 d
Capital Cost Contribution $/gge $0.70 $0.50 $0.30
Feedstock Cost Contribution $/gge $0.70 $0.60 $0.40
Fixed O&M Cost Contribution $/gge $0.30 $0.20 $0.15
Other Variable Cost Contribution $/gge $0.30 $0.30 $0.25
Total Hydrogen Cost (Plant Gate) $/gge $2.00 $1.60 $1.10
aThese costs are based on modeling the cost of hydrogen production utilizing the H2A Central Production Model and the results of the H2A Biomass Gasification analyses (www.hydrogen.energy.gov/h2a_production.html). Record 6001 (www.hydrogen.energy.gov/program_records.html) provides additional details. bThe H2A Central Production Model was used with the standard economic assumptions: All values are in 2005 dollars, 1.9% inflation rate, 10% After Tax Return on Investment, 100% Equity Financing, 20-year MACRS straight line depreciation, 40-year analysis period, and 38.9% overall tax rate, 90% capacity factor, and 15% working capital. The plant gate hydrogen pressure is 300 psi. The plant is designed for a nominal processing capacity of 2000 dry metric tons of biomass per day. The specific hydrogen design capacities are 155 and 194 metric tons per day for 2005 and 2017, respectively, based on the plant efficiencies shown in the table. All feedstock and utility costs are based on their projected costs in 2015 consistent with approach used to determine the overall delivered hydrogen production cost objective of $2-3/gge. The biomass feedstock cost used is $41/dry metric ton consistent with the EERE Biomass Program estimate for 2012. The utility costs are based on the 2005 AEO High A projection for 2015 consistent with the standard H2A methodology. cThe 2005 Status is based on the H2A Biomass Gasification Current Case (www.hydrogen.energy.gov/h2a_production.html) with some modification. No one has actually operated an integrated biomass gasification process designed specifically for hydrogen production at any scale. The H2A analysis is based on actual results of biomass gasification for power generation and available information from other similar processes for the rest of the process to yield hydrogen. As a result, a more conservative approach is taken for this status column by increasing the capital cost, reducing the process efficiency, and increasing the labor to the limits of the sensitivity analysis in the H2A Biomass Gasification Current Case. See Record #6001 (www.hydrogen.energy.gov/program_records.html) for more details. The 2012 Target is based on verifying the H2A Biomass Gasification Current Case estimate with actual data from a fully integrated biomass gasification unit designed to produce hydrogen. dThe 2017 Targets are based on the capital cost and performance (energy efficiency) required to approach the low end of the $2-3/gge overall delivered hydrogen production cost consistent with the 2017 delivery cost target of $1.00/gge. This falls within the sensitivity analysis of the H2A Biomass Gasification Longer-term case. See Record #6001 (www.hydrogen.energy.gov/program_records.html) for more details. eThe H2A Central Production Model (www.hydrogen.energy.gov/h2a_production.html) was used to generate these values at the total invested capital and process energy efficiency indicated in the table. See Record #6001 (www.hydrogen.energy.gov/program_records.html) for more details. fAll cases assume capital replacement at 0.5%/yr of total depreciable capital investment. gEnergy efficiency is defined as the energy in the hydrogen produced (on a LHV basis) divided by the sum of the feedstock energy (LHV) plus all other energy used in the process.
Multi-Year Research, Development and Demonstration Plan Page 3.1 - 19
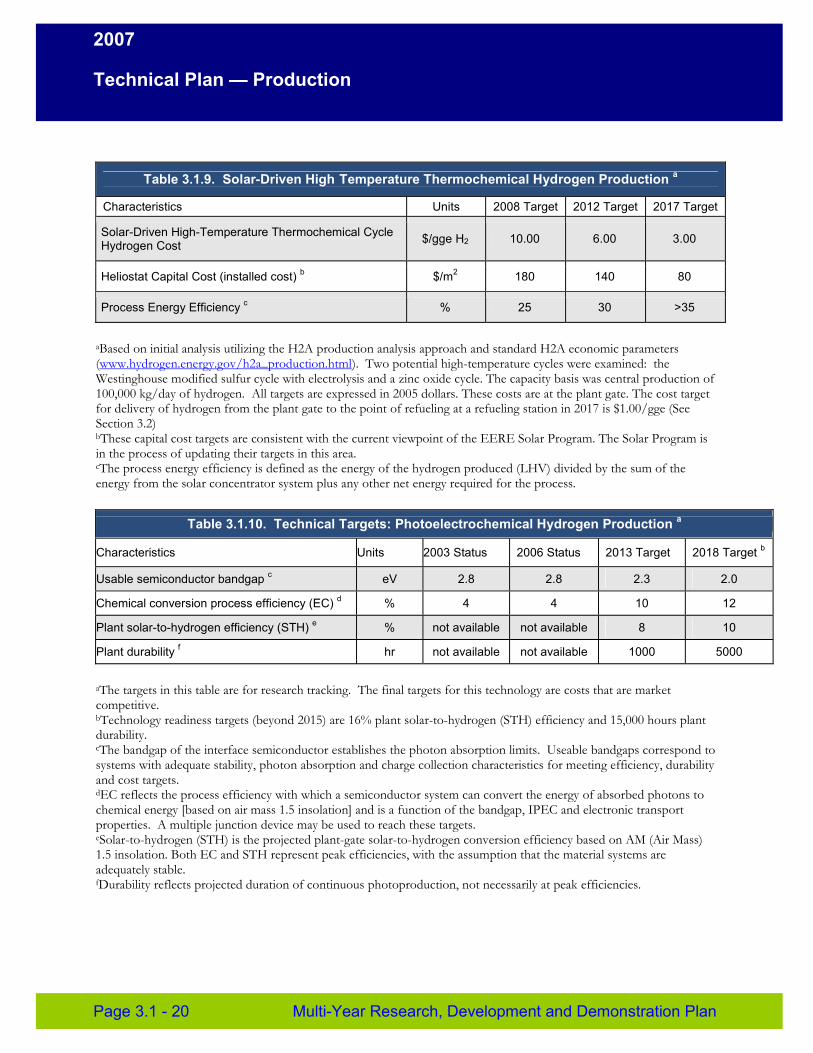
2007
Technical Plan — Production
Table 3.1.9. Solar-Driven High Temperature Thermochemical Hydrogen Production a
Characteristics Units 2008 Target 2012 Target 2017 Target
Solar-Driven High-Temperature Thermochemical Cycle Hydrogen Cost $/gge H2 10.00 6.00 3.00
Heliostat Capital Cost (installed cost) b $/m2 180 140 80
Process Energy Efficiency c % 25 30 >35
aBased on initial analysis utilizing the H2A production analysis approach and standard H2A economic parameters (www.hydrogen.energy.gov/h2a_production.html). Two potential high-temperature cycles were examined: the Westinghouse modified sulfur cycle with electrolysis and a zinc oxide cycle. The capacity basis was central production of 100,000 kg/day of hydrogen. All targets are expressed in 2005 dollars. These costs are at the plant gate. The cost target for delivery of hydrogen from the plant gate to the point of refueling at a refueling station in 2017 is $1.00/gge (See Section 3.2) bThese capital cost targets are consistent with the current viewpoint of the EERE Solar Program. The Solar Program is in the process of updating their targets in this area. cThe process energy efficiency is defined as the energy of the hydrogen produced (LHV) divided by the sum of the energy from the solar concentrator system plus any other net energy required for the process.
Table 3.1.10. Technical Targets: Photoelectrochemical Hydrogen Production a
Characteristics Units 2003 Status 2006 Status 2013 Target 2018 Target b
Usable semiconductor bandgap c eV 2.8 2.8 2.3 2.0
Chemical conversion process efficiency (EC) d % 4 4 10 12
Plant solar-to-hydrogen efficiency (STH) e % not available not available 8 10
Plant durability f hr not available not available 1000 5000
aThe targets in this table are for research tracking. The final targets for this technology are costs that are market competitive. bTechnology readiness targets (beyond 2015) are 16% plant solar-to-hydrogen (STH) efficiency and 15,000 hours plant durability. cThe bandgap of the interface semiconductor establishes the photon absorption limits. Useable bandgaps correspond to systems with adequate stability, photon absorption and charge collection characteristics for meeting efficiency, durability and cost targets. dEC reflects the process efficiency with which a semiconductor system can convert the energy of absorbed photons to chemical energy [based on air mass 1.5 insolation] and is a function of the bandgap, IPEC and electronic transport properties. A multiple junction device may be used to reach these targets. eSolar-to-hydrogen (STH) is the projected plant-gate solar-to-hydrogen conversion efficiency based on AM (Air Mass) 1.5 insolation. Both EC and STH represent peak efficiencies, with the assumption that the material systems are adequately stable. fDurability reflects projected duration of continuous photoproduction, not necessarily at peak efficiencies.
Page 3.1 - 20 Multi-Year Research, Development and Demonstration Plan
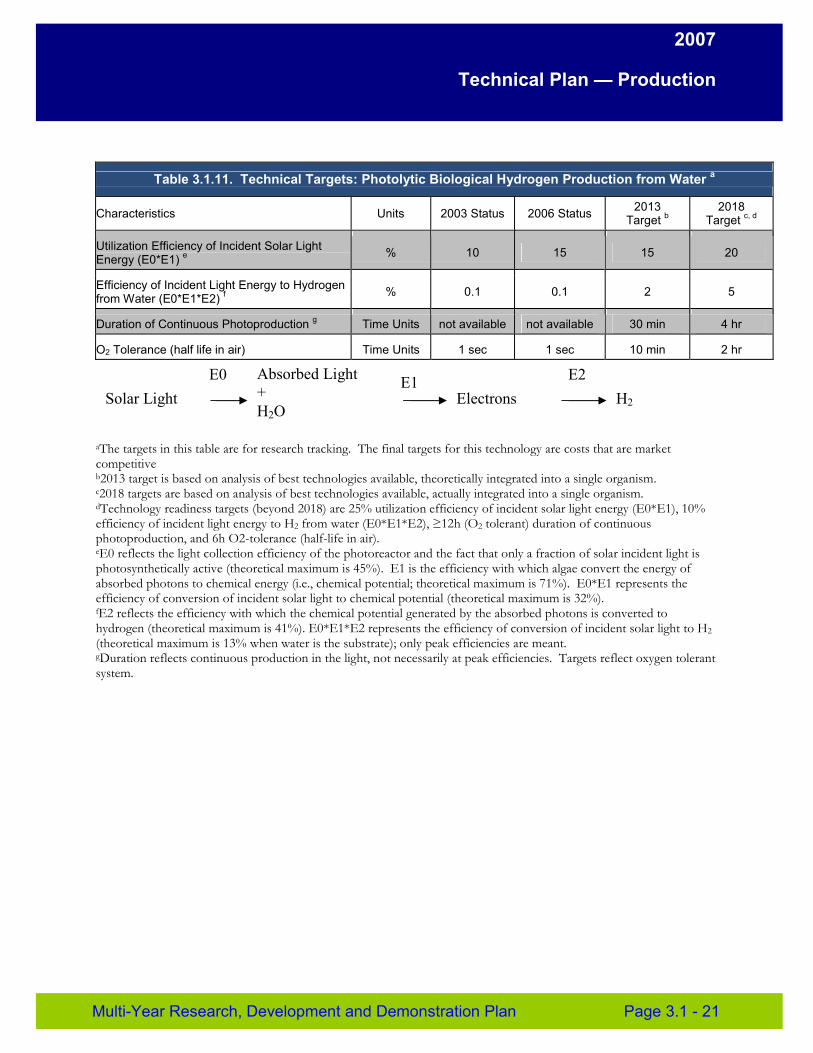
2007
Technical Plan — Production
Table 3.1.11. Technical Targets: Photolytic Biological Hydrogen Production from Water a
Characteristics Units 2003 Status 2006 Status 2013 Target b
2018 Target c, d
Utilization Efficiency of Incident Solar Light % 10 15 15 20Energy (E0*E1) e
Efficiency of Incident Light Energy to Hydrogen from Water (E0*E1*E2) f % 0.1 0.1 2 5
Duration of Continuous Photoproduction g Time Units not available not available 30 min 4 hr
O2 Tolerance (half life in air) Time Units 1 sec 1 sec 10 min 2 hr
E0 Absorbed Light E2E1+Solar Light Electrons H2H2O
aThe targets in this table are for research tracking. The final targets for this technology are costs that are market competitive b2013 target is based on analysis of best technologies available, theoretically integrated into a single organism. c2018 targets are based on analysis of best technologies available, actually integrated into a single organism. dTechnology readiness targets (beyond 2018) are 25% utilization efficiency of incident solar light energy (E0*E1), 10% efficiency of incident light energy to H2 from water (E0*E1*E2), ≥12h (O2 tolerant) duration of continuous photoproduction, and 6h O2-tolerance (half-life in air). eE0 reflects the light collection efficiency of the photoreactor and the fact that only a fraction of solar incident light is photosynthetically active (theoretical maximum is 45%). E1 is the efficiency with which algae convert the energy of absorbed photons to chemical energy (i.e., chemical potential; theoretical maximum is 71%). E0*E1 represents the efficiency of conversion of incident solar light to chemical potential (theoretical maximum is 32%). fE2 reflects the efficiency with which the chemical potential generated by the absorbed photons is converted to hydrogen (theoretical maximum is 41%). E0*E1*E2 represents the efficiency of conversion of incident solar light to H2 (theoretical maximum is 13% when water is the substrate); only peak efficiencies are meant. gDuration reflects continuous production in the light, not necessarily at peak efficiencies. Targets reflect oxygen tolerant system.
Multi-Year Research, Development and Demonstration Plan Page 3.1 - 21
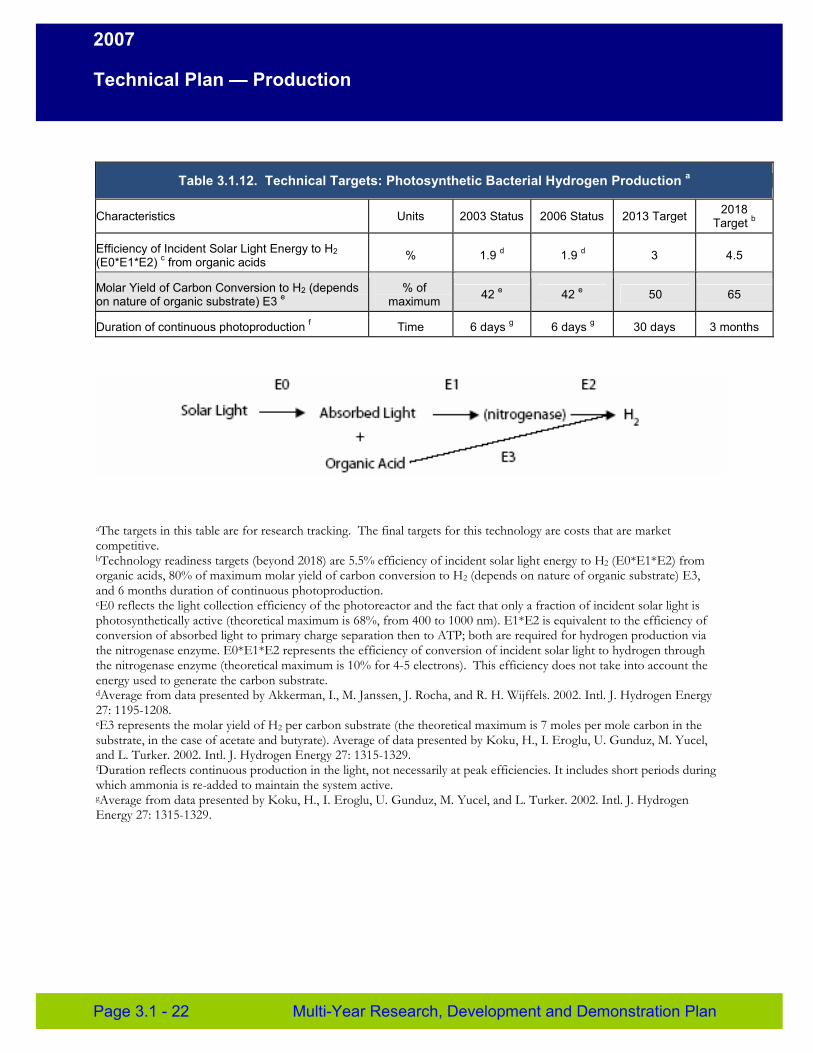
2007
Technical Plan — Production
Table 3.1.12. Technical Targets: Photosynthetic Bacterial Hydrogen Production a
Characteristics Units 2003 Status 2006 Status 2013 Target 2018 Target b
Efficiency of Incident Solar Light Energy to H2 (E0*E1*E2) c from organic acids % 1.9 d 1.9 d 3 4.5
Molar Yield of Carbon Conversion to H2 (depends on nature of organic substrate) E3 e
% of maximum 42 e 42 e 50 65
Duration of continuous photoproduction f Time 6 days g 6 days g 30 days 3 months
aThe targets in this table are for research tracking. The final targets for this technology are costs that are market competitive. bTechnology readiness targets (beyond 2018) are 5.5% efficiency of incident solar light energy to H2 (E0*E1*E2) from organic acids, 80% of maximum molar yield of carbon conversion to H2 (depends on nature of organic substrate) E3, and 6 months duration of continuous photoproduction. cE0 reflects the light collection efficiency of the photoreactor and the fact that only a fraction of incident solar light is photosynthetically active (theoretical maximum is 68%, from 400 to 1000 nm). E1*E2 is equivalent to the efficiency of conversion of absorbed light to primary charge separation then to ATP; both are required for hydrogen production via the nitrogenase enzyme. E0*E1*E2 represents the efficiency of conversion of incident solar light to hydrogen through the nitrogenase enzyme (theoretical maximum is 10% for 4-5 electrons). This efficiency does not take into account the energy used to generate the carbon substrate. dAverage from data presented by Akkerman, I., M. Janssen, J. Rocha, and R. H. Wijffels. 2002. Intl. J. Hydrogen Energy 27: 1195-1208. eE3 represents the molar yield of H2 per carbon substrate (the theoretical maximum is 7 moles per mole carbon in the substrate, in the case of acetate and butyrate). Average of data presented by Koku, H., I. Eroglu, U. Gunduz, M. Yucel, and L. Turker. 2002. Intl. J. Hydrogen Energy 27: 1315-1329. fDuration reflects continuous production in the light, not necessarily at peak efficiencies. It includes short periods during which ammonia is re-added to maintain the system active. gAverage from data presented by Koku, H., I. Eroglu, U. Gunduz, M. Yucel, and L. Turker. 2002. Intl. J. Hydrogen Energy 27: 1315-1329.
Page 3.1 - 22 Multi-Year Research, Development and Demonstration Plan
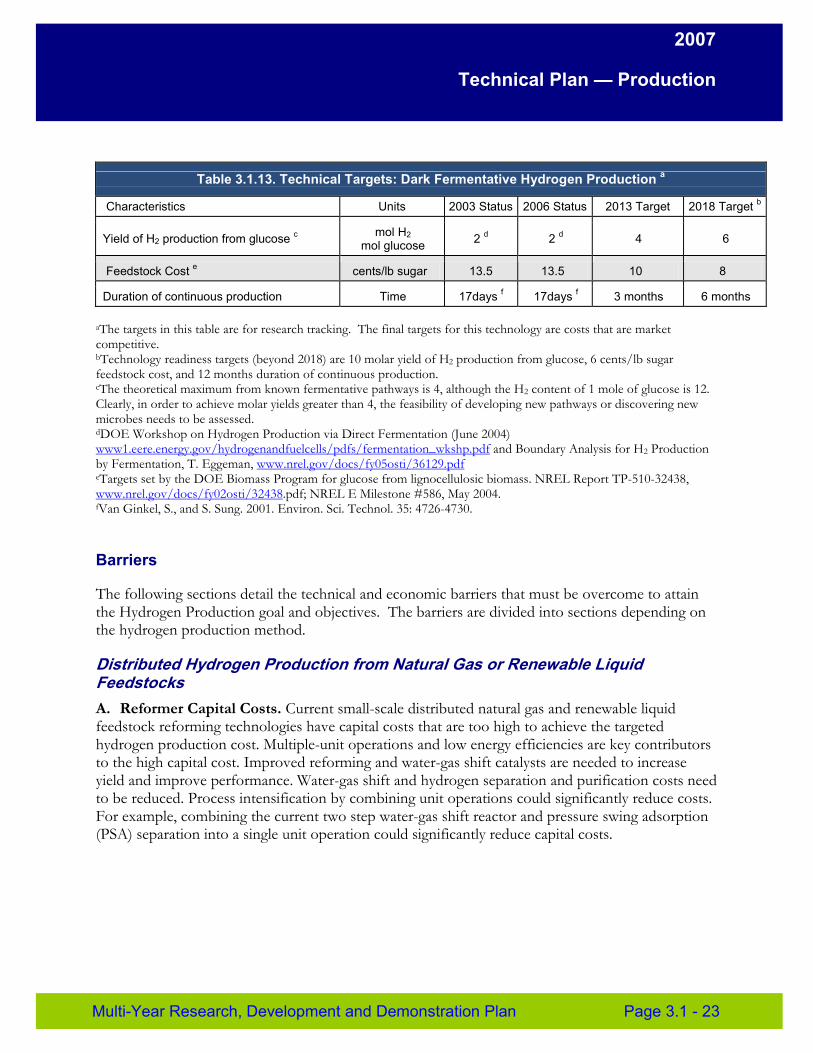
2007
Technical Plan — Production
Table 3.1.13. Technical Targets: Dark Fermentative Hydrogen Production a
Characteristics Units 2003 Status 2006 Status 2013 Target 2018 Target b
Yield of H2 production from glucose c mol H2 mol glucose 2 d 2 d 4 6
Feedstock Cost e cents/lb sugar 13.5 13.5 10 8
Duration of continuous production Time 17days f 17days f 3 months 6 months
aThe targets in this table are for research tracking. The final targets for this technology are costs that are market competitive. bTechnology readiness targets (beyond 2018) are 10 molar yield of H2 production from glucose, 6 cents/lb sugar feedstock cost, and 12 months duration of continuous production. cThe theoretical maximum from known fermentative pathways is 4, although the H2 content of 1 mole of glucose is 12. Clearly, in order to achieve molar yields greater than 4, the feasibility of developing new pathways or discovering new microbes needs to be assessed. dDOE Workshop on Hydrogen Production via Direct Fermentation (June 2004) www1.eere.energy.gov/hydrogenandfuelcells/pdfs/fermentation_wkshp.pdf and Boundary Analysis for H2 Production by Fermentation, T. Eggeman, www.nrel.gov/docs/fy05osti/36129.pdf eTargets set by the DOE Biomass Program for glucose from lignocellulosic biomass. NREL Report TP-510-32438, www.nrel.gov/docs/fy02osti/32438.pdf; NREL E Milestone #586, May 2004. fVan Ginkel, S., and S. Sung. 2001. Environ. Sci. Technol. 35: 4726-4730.
Barriers
The following sections detail the technical and economic barriers that must be overcome to attain the Hydrogen Production goal and objectives. The barriers are divided into sections depending on the hydrogen production method.
Distributed Hydrogen Production from Natural Gas or Renewable Liquid Feedstocks A. Reformer Capital Costs. Current small-scale distributed natural gas and renewable liquid feedstock reforming technologies have capital costs that are too high to achieve the targeted hydrogen production cost. Multiple-unit operations and low energy efficiencies are key contributors to the high capital cost. Improved reforming and water-gas shift catalysts are needed to increase yield and improve performance. Water-gas shift and hydrogen separation and purification costs need to be reduced. Process intensification by combining unit operations could significantly reduce costs. For example, combining the current two step water-gas shift reactor and pressure swing adsorption (PSA) separation into a single unit operation could significantly reduce capital costs.
Multi-Year Research, Development and Demonstration Plan Page 3.1 - 23
2007
Technical Plan — Production
B. Reformer Manufacturing. Distributed reforming units are currently designed and built one at a time. Efforts such as Design for Manufacture and Assembly (DFMA) need to be applied to develop more compact, skid mounted units that can be produced using currently available low-cost, high-throughput manufacturing methods (see the Manufacturing section of this plan).
C. Operation and Maintenance (O&M). O&M costs for distributed reforming hydrogen production from natural gas and renewable feedstocks are too high. Robust systems that require little maintenance and that include remote monitoring capability need to be developed.
D. Feedstock Issues. Availability of some feedstocks is limited in certain areas. Feedstock-flexible reformers are needed to address location-specific feedstock supply issues. Effects of impurities on the system from multiple feedstocks as well as the effects of impurities from variations in single feedstocks need to be addressed in the reformer design.
E. Greenhouse Gas Emissions. Distributed natural gas reformers emit greenhouse gases. Feedstocks and/or technologies that can approach near zero net greenhouse gas emissions are needed.
F. Control and Safety. Control and safety issues are associated with natural gas and renewable feedstock reforming, including on-off cycling. Effective operation control strategies are needed to minimize cost and emissions, maximize efficiency, and enhance safety. Hydrogen leakage is addressed within the Delivery and Safety Program elements.
Hydrogen Generation by Water Electrolysis G. Capital Cost. The capital costs of water electrolysis systems are prohibitive to widespread adoption of electrolysis technology for hydrogen production. R&D is needed to develop lower cost materials with improved manufacturing capability to lower capital while improving the efficiency and durability of the system. Development of larger systems is also needed to take advantage of economies of scale. Technically viable systems for low-cost manufacturing need to be developed for this technology (see the Manufacturing section of this plan).
H. System Efficiency. New membrane, electrode and system designs are needed to improve system efficiency and durability. Mechanical high-pressure compression technology exhibits low energy efficiency and may introduce impurities while adding significantly to the capital and operating cost. Efficiency gains can be realized using compression in the cell stack. Development is needed for low-cost cell stack optimization addressing efficiency, compression, and durability.
I. Grid Electricity Emissions (for distributed). The current grid electricity mix in most locations results in greenhouse gas emissions in large-scale electrolysis systems. Low-cost, carbon-free electricity generation is needed. Electrolysis systems that can produce both hydrogen and electricity need to be evaluated. (Renewable electricity costs are being addressed by the DOE EERE renewable power programs – Solar, Wind, Hydropower, Geothermal and Biomass.)
J. Renewable Electricity Generation Integration (for central). More efficient integration with renewable electricity generation is needed to reduce costs and improve performance. Development of integrated renewable electrolysis systems is needed, including optimization of power conversion and other system components from renewable electricity to provide high-efficiency, low-cost integrated renewable hydrogen production.
Page 3.1 - 24 Multi-Year Research, Development and Demonstration Plan
2007
Technical Plan — Production
Hydrogen Separations There are a number of technology options available that can be used to separate and purify hydrogen. The following is a set of broad, cross-cutting barriers that must be overcome to reduce the cost and increase the efficiency of these separation technologies. This plan currently focuses on hydrogen separation technologies for thermochemical processes including distributed reforming and biomass gasification. In the future, additional separations technologies may be necessary for other production technologies.
K. Durability. Hydrogen embrittlement can reduce the durability and effectiveness of metallic membrane systems. Thermal cycling can cause failure, reducing durability and operating life. This is especially problematic in distributed applications that may be subject to frequent start-up and shutdown cycles. Support structures with more uniform pore sizes and less surface roughness are needed to avoid membrane defects. Interactions between membrane and support structure materials need to be better understood. Materials science research is needed to understand microstructural evolution during operation and its effect on membrane permeability, selectivity, and failure modes. Combinatorial methods are needed for rapid testing and evaluation of novel materials and alloys.
L. Impurities. The presence of trace contaminants as well as CO, water, and CO2 in the product stream from a gasifier or reformer can reduce the hydrogen flux across different types of membranes. It is not understood whether these effects are caused by competitive adsorption, poisoning, or compositional changes on the membrane surface. Additionally, some membranes exhibit poor thermochemical stability in carbon dioxide environments, resulting in the conversion of membrane materials into carbonates.
M. Membrane Defects. Oxidizing gas mixtures (oxygen, steam, and carbon oxides) have been observed to cause metallic membranes to rearrange their atomic structure at temperatures greater than 450ºC. This results in the formation of permanent defects that reduce membrane selectivity for hydrogen. High-temperature and high-pressure seals can be an issue with membrane systems. Seals and joints are a weak link in membrane module construction and one of the most common points of membrane system failure. The chemical deposition of thin palladium or palladium-alloy membranes onto support structures is also an important technical challenge.
N. Hydrogen Selectivity. The hydrogen selectivity of microporous membranes is lower than desired for cost-effective use, especially for zeolite-supported membranes where selectivity decreases with increasing temperature (inadequate above 150ºC). Process stream temperatures typically are greater than 300ºC in various applications.
O. Operating Temperature. Membrane modules that can be designed to operate at or near process conditions, without the need for cooling and/or re-heating, will be more efficient. For example, dense ceramic proton hydrogen separation membranes currently operate only at high temperatures (~900ºC).
P. Flux. Flux rates for membranes need to be improved to reduce the membrane size and lower overall cost of hydrogen separation and purification systems.
Q. Testing and Analysis. Better information is needed to guide researchers and membrane technology developers towards performance targets that are application specific. Standard methods for evaluating and screening membrane materials and modules are needed to provide a solid basis
Multi-Year Research, Development and Demonstration Plan Page 3.1 - 25
2007
Technical Plan — Production
for comparison of alternatives and to conduct needed tests such as accelerated durability tests. Testing under real-world operating conditions is needed to demonstrate durability and robust, reliable performance. Additionally, there is currently a lack of understanding of tradeoffs between different system configurations and operating parameters. Operation at higher temperatures and partial pressure differentials can increase flux rates but results in more expensive membrane modules. Very thin membranes increase flux but they are harder to fabricate defect-free. Analysis is also needed to understand options and tradeoffs for process intensification in different applications.
R. Cost. In addition to precious metals, membrane materials and support structures are costly. Fabrication of high quality (ultra-thin) membranes dominates membrane systems cost.
Biomass Gasification/Pyrolysis Hydrogen Production S. Feedstock Cost and Availability. Feedstock costs are high. Improved feedstock/agriculture technology (higher yields per acre, etc.), lower cost feedstock collection, and improved feedstock preparation are needed. Because biomass feedstocks are seasonal in nature, feedstock-flexible processes and cost-effective feedstock storage are needed. (Tasks to overcome these barriers are the responsibility of the DOE Biomass Program and the U.S. Department of Agriculture.)
T. Capital Cost and Efficiency of Biomass Gasification/Pyrolysis Technology. The capital cost for biomass gasification/pyrolysis needs to be reduced. Process intensification by combining unit operations can significantly reduce capital costs. This could range from combining the current two step water-gas shift and PSA separation to a one step water-gas shift with integrated separation, to integrating gasification, reforming, water-gas shift and separation all in one unit operation. Improved process efficiency and higher hydrogen yields and selectivities through catalyst research, better heat integration, and alternative gas clean-up approaches are needed. Improved catalysts or engineering approaches for tar cracking are also needed.
High-Temperature Thermochemical, Solar-Driven Production of Hydrogen10
U. High-Temperature Thermochemical Technology. There are over 200 potential thermochemical cycles for solar-driven water splitting. These cycles have been evaluated and ranked for their suitability. The most promising cycles need to be fully explored and verified to down select to a few cycles. The most promising cycles will require extensive research and development efforts.
V. High-Temperature Robust Materials. High temperatures are required for these thermochemical systems (500-2000°C). Cost-effective, durable materials are needed that can withstand these high temperatures and the thermal duty cycles present in solar concentrator systems.
W. Concentrated Solar Energy Capital Cost. Concentrated solar energy collection is currently expensive and requires large areas of land. Improved, lower-cost solar concentrator/collection technology, including materials, is needed.11
10 DOE's Office of Nuclear Energy has the lead responsibility for hydrogen production utilizing nuclear energy for high-temperature (700°-1000°C) thermochemical water-splitting chemical cycles. The Office of Hydrogen, Fuel Cells & Infrastructure Technologies will collaborate with Nuclear Energy on the thermochemical hydrogen production R&D activities. 11 The Hydrogen Program will rely on and collaborate with the DOE EERE Solar Program for the advancement of concentrated solar energy technology.
Page 3.1 - 26 Multi-Year Research, Development and Demonstration Plan
2007
Technical Plan — Production
X. Coupling Concentrated Solar Energy and Thermochemical Cycles. Coupling concentrated solar energy with thermochemical cycles presents many challenges. Receivers, heat transfer and systems, as well as reactors need to be developed and engineered. Cost effective approaches and systems to deal effectively with the diurnal nature of sunlight need to be researched and developed.
Photoelectrochemical Hydrogen Production Photoelectrochemical hydrogen production is in an early stage of development and requires breakthroughs in materials development. The primary research in this area is progressing on three fronts: (1) the study of high-efficiency materials to attain the fundamental understanding needed for improving lower-efficiency, low-cost materials; (2) the study of low-cost durable materials to attain the fundamental understanding needed for modifying higher-efficiency, lower-durability materials; and (3) the development of multijunction devices incorporating multiple material layers to achieve efficient water splitting. Methods of engineering and manufacturing these systems need to be developed in conjunction with the materials and device research (see the Manufacturing section of this plan).
Current materials for photoelectrochemical hydrogen production can be broadly divided into three categories, each with its own characteristics and research challenges. These groupings are: (i) stable materials with low visible light absorption efficiency (e.g., oxides), (ii) highly efficient light absorbers with low lifetimes (e.g., Group III-Vs), and (iii) hybrid and multijunction systems which combine multiple materials in multi-photon devices. The group (i) materials are characterized by high bandgaps and low integrated incident-photon-to-electron conversion (IPEC) over the solar spectrum; the group (ii) materials have very high IPEC (better than 90% throughout the visible spectra), but have low corrosion resistance and poor energetics; and the group (iii) systems can have very high efficiency and long lifetime, depending on the material set, but can be complicated and expensive to build. Research in all three categories is necessary for developing systems that meet the targets reflected in the PEC target table. To date, a range of materials and material systems have met individual 2010 targets of chemical efficiency or durability, but no single material/system has simultaneously met efficiency, durability and cost targets. This is the primary research challenge for photoelectrochemical hydrogen production.
Y. Materials Efficiency. Materials with smaller bandgaps more efficiently utilize the solar spectrum, but are often less energetically favorable for hydrogen production because of the bandedge mismatch with respect to either hydrogen or oxygen redox potentials. Materials with appropriate bandedge and bandgap for hydrogen production must be developed.
Z. Materials Durability. Durable materials with the appropriate characteristics for photoelectrochemical hydrogen production that meet the program goals have not been identified. The high-efficiency materials currently available corrode quickly during operation, and the most durable materials are very inefficient for hydrogen production.
AA. PEC Device and System Auxiliary Material. The functional requirements for auxiliary materials must be determined and materials discovered, developed, and tested to facilitate PEC device and systems development. The auxiliary materials may include protective coatings, catalytic coatings, photoelectrode substrates, hydrogen impervious materials, and photovoltaic layer materials.
Multi-Year Research, Development and Demonstration Plan Page 3.1 - 27
2007
Technical Plan — Production
AB. Bulk Materials Synthesis. Fabrication techniques for materials identified to have potential for high efficiency, durability and low cost need to be developed on scales consistent with implementation in commercial reactors.
AC. Device Configuration Designs. Hybrid and other device designs that combine multiple layers of materials could address issues of durability and efficiency. Techniques are needed for manufacturing appropriate photoelectrochemical materials in these device configurations at commercial scales (see the Manufacturing section of this plan).
AD. Systems Design and Evaluation. System designs incorporating the most promising device configurations, and using cost-effective, hydrogen-impermeable, transparent materials are also needed to implement photolytic production routes. The complete systems evaluation will need to consider a range of important operational constraints and parameters, including the diurnal operation limitations and the effects of water purity on performance and lifetime. Engineering options need to be carefully analyzed to minimize capital requirements.
AE. Diurnal Operation Limitations. Photolytic processes are discontinuous because they depend on sunlight, which is unavailable at night and available only at low intensities on cloudy days. This results in increased capital costs for larger facilities to accommodate higher short-term production rates and larger hydrogen storage needs.
Biological Hydrogen Production A number of technologies for biological H2 production are available, but they are not mature at present. Technical barriers related to each individual technology must be overcome, integrated models must be developed, and barriers related to an integrated system must be identified before economic barriers can be meaningfully considered. Methods for engineering and manufacturing these systems have not been fully evaluated.
AF. Lack of Naturally Occurring Microorganism Characterization. Only a small fraction of the world’s microorganisms have been discovered and functionally characterized. Research is needed to discover naturally occurring microorganisms with characteristics necessary for biological hydrogen production.
Barriers are listed below for each technology, followed by a model for how these different technologies could be integrated and a list of barriers for the integrated process.
Photolytic H2 Production from Water (green algae or cyanobacteria): AG. Light Utilization Efficiency. The microorganisms used for photobiological H2 production possess large arrays of light-capturing antenna pigment molecules. Under bright sunlight, pigment antennae absorb much more light than can be utilized by the photosynthetic electron transport apparatus, resulting in heat dissipation and loss of up to 80% of the absorbed sunlight. Research is needed to identify ways to increase the light conversion efficiency, including the identification of better and/or modified photosynthetic organisms for H2 production.
AH. Rate of Hydrogen Production. The current H2 production rate from photosynthetic microorganisms is too low for commercial viability. The low rates have been attributed to (a) the non-dissipation of a proton gradient across the photosynthetic membrane, which is established
Page 3.1 - 28 Multi-Year Research, Development and Demonstration Plan
2007
Technical Plan — Production
during electron transport from water to the hydrogenase (the H2-producing enzyme) under anaerobic conditions, and (b) the existence of competing metabolic flux pathways for reductant. Genetic means to overcome the restricting metabolic pathways, such as the insertion of a proton channel across the thylakoid membrane, must be used to significantly increase the rate of H2 production. Under aerobic conditions, with an O2-tolerant hydrogenase catalyzing H2 production, the competition between CO2 fixation and hydrogenase will have to be addressed.
AI. Continuity of Photoproduction. Hydrogen-producing algae co-produce oxygen, which inhibits the hydrogenase enzyme activity. This inhibition needs to be alleviated, possibly by (a) identifying or engineering a less O2-sensitive enzyme; (b) separating the oxygen and hydrogen production cycles; or (c) affecting the ratio of photosynthesis to respiration by a variety of means, such that O2 does not accumulate in the medium, the quantum yield of photosynthesis is maintained, and full hydrogenase activity is achieved (see details under Integrated System).
AJ. Systems Engineering. System requirements for cost-effective implementation of photolytic hydrogen-production technologies have not been adequately evaluated. Analysis and research are needed on inexpensive/transparent materials for H2 containment, H2 collection systems, prevention of the build-up of H2/O2 gas mixtures, separation of co-produced H2 and O2 gases, continuous bioreactor operation, monoculture maintenance, land area requirements and capital costs.
AK. Diurnal Operation Limitations. The same issues apply as for photolytic systems (see Barrier AE).
Photosynthetic Bacterial Hydrogen Production, Required for an Integrated System: AL. Light Utilization Efficiency. Same issues apply as for photolytic systems (see Barrier X).
AM. Rate of Hydrogen Production. Photosynthetic bacteria can metabolize a variety of organic substrates that are waste by-products of various fermentative processes. However, the metabolism of acetic and lactic acids to H2 also generates by-products such as the polymer polyhydroxyalkanoate (PHA). Synthesis of PHA competes with H2 production for the same source of electron donors. Genes controlling PHA synthesis and perhaps other pathways must be inactivated to maximize H2 production. Alternative types of nitrogenase are needed to produce larger stoichiometric amounts of H2/ammonia.
AN. Hydrogen Re-oxidation. Most photosynthetic bacteria contain an H2-oxidation pathway catalyzed by an uptake hydrogenase enzyme. This enzyme will recycle the H2 produced by the nitrogenase to support cell growth. Uptake hydrogenase enzyme(s) must be inactivated to ensure net H2 accumulation by photosynthetic bacteria.
AO. Carbon/Nitrogen Ratio. To maximize nitrogenase activity, the proper ratio of carbon to nitrogen (C/N) nutrients must be maintained. The C/N nutrient content in the photoreactor (algal and cyanobacteria) and in the dark fermentor needs to be evaluated to assess whether the media composition is suitable for subsequent photosynthetic bacterial hydrogen production. Enzyme engineering approaches may be needed to alleviate inhibition of nitrogenase by elevated levels of nitrogen nutrient.
Multi-Year Research, Development and Demonstration Plan Page 3.1 - 29
2007
Technical Plan — Production
AP. Systems Engineering. The same issues apply as for photolytic systems (see above), except for the mixture of gases. Photosynthetic bacteria do not co-evolve H2 and O2 but release H2 and CO2. The cost of H2 and CO2 separation must be evaluated.
AQ. Diurnal Operation Limitation. The same issues apply as for photolytic systems (see Barrier AE).
Dark Fermentative Hydrogen Production, Required for an Integrated System: AR. H2 Molar Yield. Up to 4 moles of H2 can theoretically be produced per mole of glucose through the known fermentative pathways. However, various biological limitations such as H2-endproduct inhibition and waste-acid and solvent accumulation limit the molar yield to around 2 moles per mole glucose consumed. Hydrogen molar yields must be increased significantly through metabolic engineering efforts. New pathways must be discovered to directly take full advantage of the 12 moles of H2 available in a mole of glucose.
AS. Waste Acid Accumulation. Organic acids such as acetic and butyric acids are waste by-products of the fermentation process. The production of these acids poses several challenges such as lowering the molar yield of H2 by diverting the metabolic pathway toward solvent production and requiring subsequent wastewater treatment. Elimination of this pathway or subsequent processing (such as in an integrated biological hydrogen production system) of the organic acids by photosynthetic bacteria is needed to increase hydrogen yields. Potential release of toxins during dark fermentation and their inhibition of the subsequent steps (such as in an integrated system) will need to be evaluated.
AT. Feedstock Cost. The glucose feedstock is the major cost driver for economic H2 production via fermentation. For renewable H2 to be cost competitive with traditional transportation fuels, the glucose cost must be around $0.05 per pound and provide a molar yield of H2 approaching 10 (see Barrier AI and Target Table 3.1.9). Lower-cost methods for producing glucose from whole biomass are needed. Cellulolytic microbes with a high rate of H2 production are also needed to use the cell biomass of the green algal/cyanobacterial and photosythetic bacterial co-culture (in an integrated biological H2 production system).
AU. Systems Engineering. The same issues apply as above, plus prevention of methanogen contamination is needed.
Integrated Biological Hydrogen Production System (many configurations arepossible, Figure 3.1.3): AV. Photosynthesis/Respiration Capacity Ratio. Green algae and cyanobacteria become anaerobic when their P/R (photosynthesis/respiration) capacity ratio is 1 or less. Under such anaerobic conditions, photosynthetic water oxidation produces H2 (instead of starch), and the O2 evolved by photosynthesis is consumed by respiration, producing CO2. Currently, this process is achieved by nutrient deprivation, with the drawback that the resulting P/R ≤ 1 ratio is achieved by partially decreasing the quantum yield of photosynthesis. Alternative mechanisms to bring the P/R ratio to 1 need to be investigated, particularly those methods that focus on achieving a P/R ratio of 1 without changing the quantum yield of photosynthesis. Two further issues will need to be investigated under these conditions: (a) rate limitations due to the non-dissipation of the proton
Page 3.1 - 30 Multi-Year Research, Development and Demonstration Plan
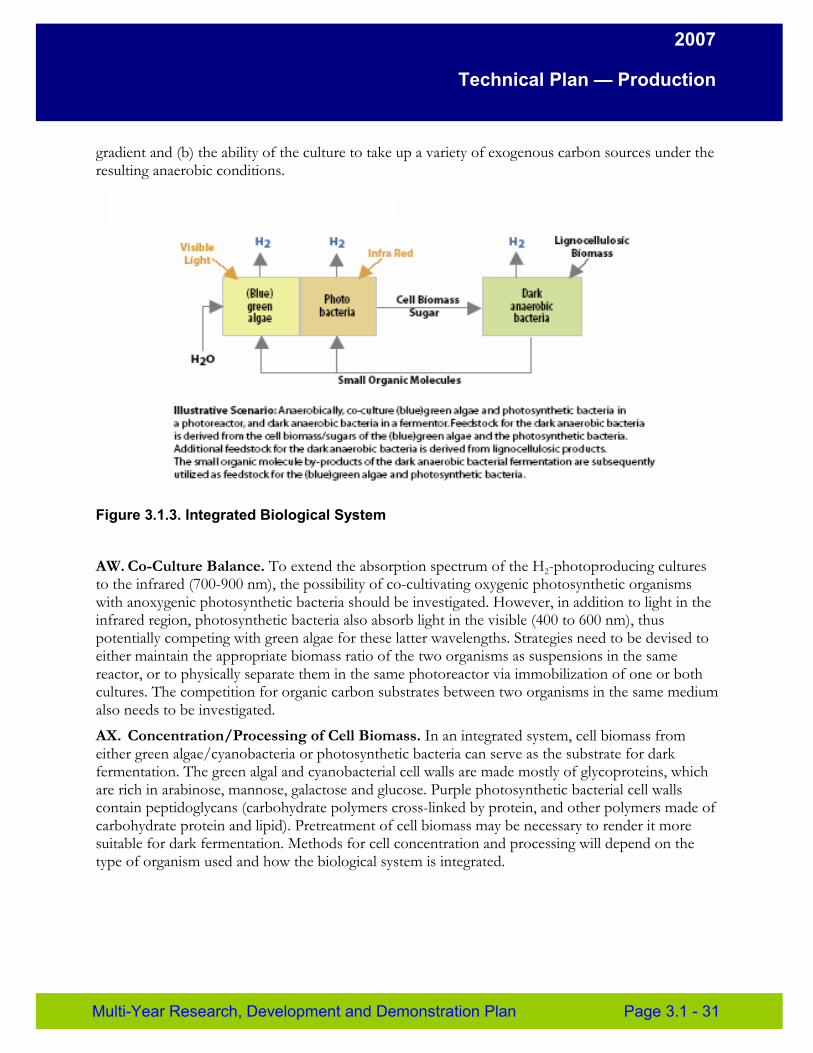
2007
Technical Plan — Production
gradient and (b) the ability of the culture to take up a variety of exogenous carbon sources under the resulting anaerobic conditions.
Figure 3.1.3. Integrated Biological System
AW. Co-Culture Balance. To extend the absorption spectrum of the H2-photoproducing cultures to the infrared (700-900 nm), the possibility of co-cultivating oxygenic photosynthetic organisms with anoxygenic photosynthetic bacteria should be investigated. However, in addition to light in the infrared region, photosynthetic bacteria also absorb light in the visible (400 to 600 nm), thus potentially competing with green algae for these latter wavelengths. Strategies need to be devised to either maintain the appropriate biomass ratio of the two organisms as suspensions in the same reactor, or to physically separate them in the same photoreactor via immobilization of one or both cultures. The competition for organic carbon substrates between two organisms in the same medium also needs to be investigated.
AX. Concentration/Processing of Cell Biomass. In an integrated system, cell biomass from either green algae/cyanobacteria or photosynthetic bacteria can serve as the substrate for dark fermentation. The green algal and cyanobacterial cell walls are made mostly of glycoproteins, which are rich in arabinose, mannose, galactose and glucose. Purple photosynthetic bacterial cell walls contain peptidoglycans (carbohydrate polymers cross-linked by protein, and other polymers made of carbohydrate protein and lipid). Pretreatment of cell biomass may be necessary to render it more suitable for dark fermentation. Methods for cell concentration and processing will depend on the type of organism used and how the biological system is integrated.
Multi-Year Research, Development and Demonstration Plan Page 3.1 - 31
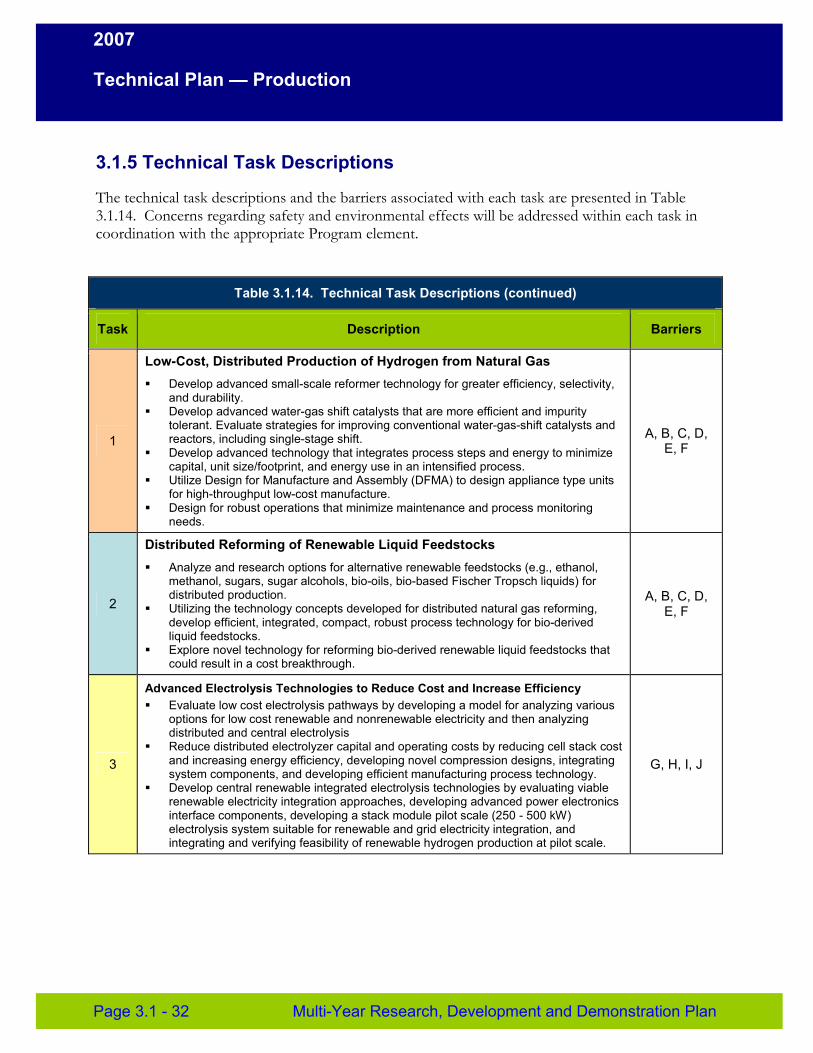
2007
Technical Plan — Production
3.1.5 Technical Task Descriptions
The technical task descriptions and the barriers associated with each task are presented in Table 3.1.14. Concerns regarding safety and environmental effects will be addressed within each task in coordination with the appropriate Program element.
Table 3.1.14. Technical Task Descriptions (continued)
Task Description Barriers
1
Low-Cost, Distributed Production of Hydrogen from Natural Gas � Develop advanced small-scale reformer technology for greater efficiency, selectivity,
and durability. � Develop advanced water-gas shift catalysts that are more efficient and impurity
tolerant. Evaluate strategies for improving conventional water-gas-shift catalysts and reactors, including single-stage shift.
� Develop advanced technology that integrates process steps and energy to minimize A, B, C, D,
E, F capital, unit size/footprint, and energy use in an intensified process.
� Utilize Design for Manufacture and Assembly (DFMA) to design appliance type units for high-throughput low-cost manufacture.
� Design for robust operations that minimize maintenance and process monitoring needs.
2
Distributed Reforming of Renewable Liquid Feedstocks � Analyze and research options for alternative renewable feedstocks (e.g., ethanol,
methanol, sugars, sugar alcohols, bio-oils, bio-based Fischer Tropsch liquids) for distributed production.
� Utilizing the technology concepts developed for distributed natural gas reforming, develop efficient, integrated, compact, robust process technology for bio-derived liquid feedstocks.
� Explore novel technology for reforming bio-derived renewable liquid feedstocks that could result in a cost breakthrough.
A, B, C, D, E, F
3
Advanced Electrolysis Technologies to Reduce Cost and Increase Efficiency � Evaluate low cost electrolysis pathways by developing a model for analyzing various
options for low cost renewable and nonrenewable electricity and then analyzing distributed and central electrolysis
� Reduce distributed electrolyzer capital and operating costs by reducing cell stack cost and increasing energy efficiency, developing novel compression designs, integrating system components, and developing efficient manufacturing process technology.
� Develop central renewable integrated electrolysis technologies by evaluating viable renewable electricity integration approaches, developing advanced power electronics interface components, developing a stack module pilot scale (250 - 500 kW) electrolysis system suitable for renewable and grid electricity integration, and integrating and verifying feasibility of renewable hydrogen production at pilot scale.
G, H, I, J
Page 3.1 - 32 Multi-Year Research, Development and Demonstration Plan
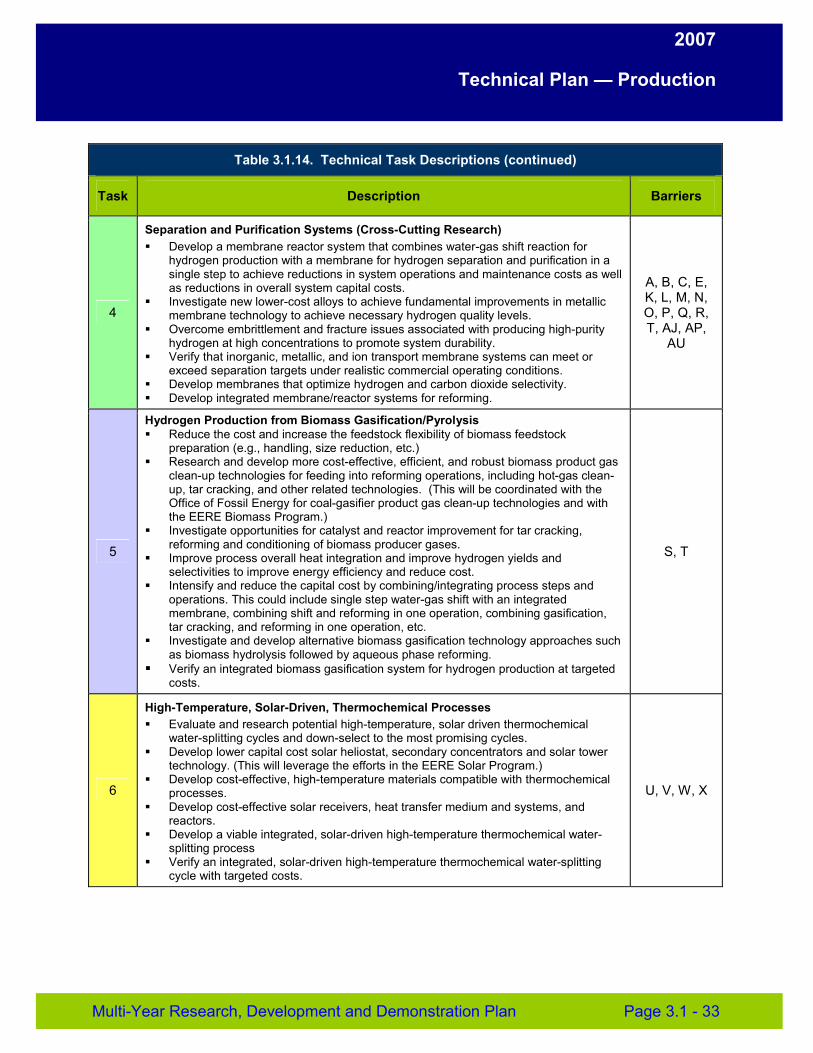
2007
Technical Plan — Production
Table 3.1.14. Technical Task Descriptions (continued)
Task Description Barriers
Separation and Purification Systems (Cross-Cutting Research) � Develop a membrane reactor system that combines water-gas shift reaction for
hydrogen production with a membrane for hydrogen separation and purification in a single step to achieve reductions in system operations and maintenance costs as well as reductions in overall system capital costs.
� Investigate new lower-cost alloys to achieve fundamental improvements in metallic A, B, C, E, K, L, M, N,
4 membrane technology to achieve necessary hydrogen quality levels. � Overcome embrittlement and fracture issues associated with producing high-purity
hydrogen at high concentrations to promote system durability. � Verify that inorganic, metallic, and ion transport membrane systems can meet or
exceed separation targets under realistic commercial operating conditions. � Develop membranes that optimize hydrogen and carbon dioxide selectivity. � Develop integrated membrane/reactor systems for reforming.
O, P, Q, R, T, AJ, AP,
AU
5
Hydrogen Production from Biomass Gasification/Pyrolysis � Reduce the cost and increase the feedstock flexibility of biomass feedstock
preparation (e.g., handling, size reduction, etc.) � Research and develop more cost-effective, efficient, and robust biomass product gas
clean-up technologies for feeding into reforming operations, including hot-gas clean-up, tar cracking, and other related technologies. (This will be coordinated with the Office of Fossil Energy for coal-gasifier product gas clean-up technologies and with the EERE Biomass Program.)
� Investigate opportunities for catalyst and reactor improvement for tar cracking, reforming and conditioning of biomass producer gases.
� Improve process overall heat integration and improve hydrogen yields and selectivities to improve energy efficiency and reduce cost.
� Intensify and reduce the capital cost by combining/integrating process steps and operations. This could include single step water-gas shift with an integrated membrane, combining shift and reforming in one operation, combining gasification, tar cracking, and reforming in one operation, etc.
� Investigate and develop alternative biomass gasification technology approaches such as biomass hydrolysis followed by aqueous phase reforming.
� Verify an integrated biomass gasification system for hydrogen production at targeted costs.
S, T
6
High-Temperature, Solar-Driven, Thermochemical Processes � Evaluate and research potential high-temperature, solar driven thermochemical
water-splitting cycles and down-select to the most promising cycles. � Develop lower capital cost solar heliostat, secondary concentrators and solar tower
technology. (This will leverage the efforts in the EERE Solar Program.) � Develop cost-effective, high-temperature materials compatible with thermochemical
processes. � Develop cost-effective solar receivers, heat transfer medium and systems, and
reactors. � Develop a viable integrated, solar-driven high-temperature thermochemical water-
splitting process � Verify an integrated, solar-driven high-temperature thermochemical water-splitting
cycle with targeted costs.
U, V, W, X
Multi-Year Research, Development and Demonstration Plan Page 3.1 - 33
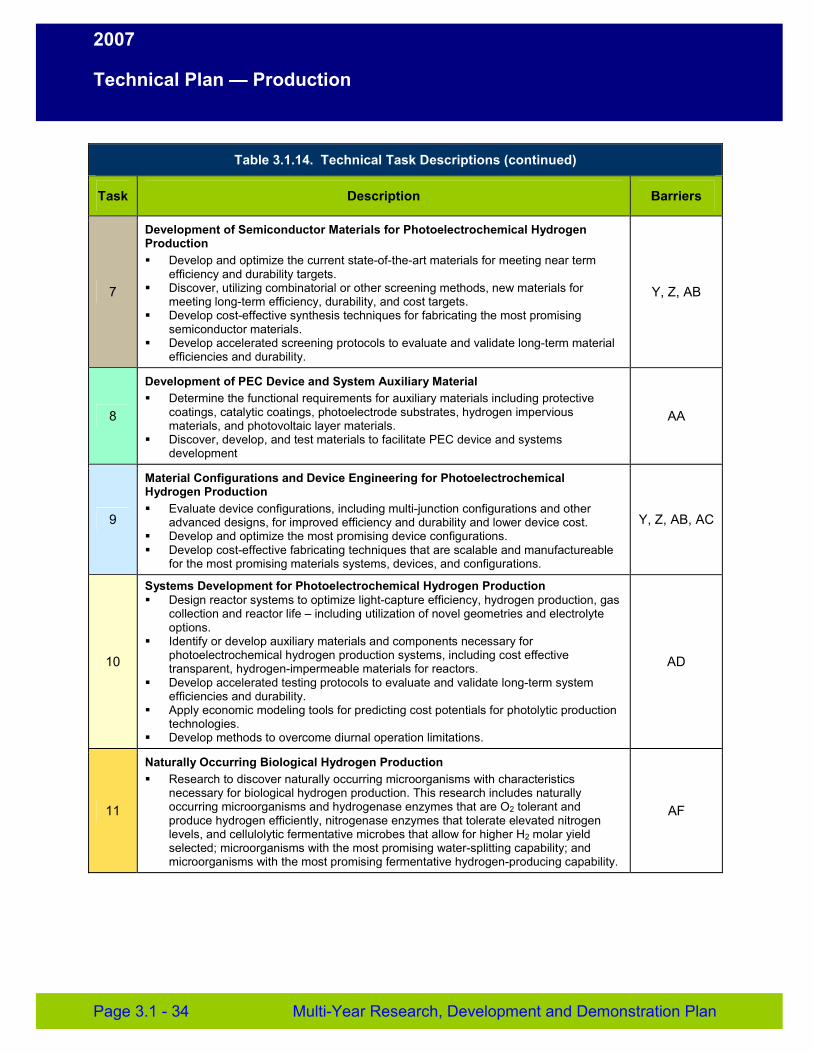
2007
Technical Plan — Production
Table 3.1.14. Technical Task Descriptions (continued)
Task Description Barriers
7
Development of Semiconductor Materials for Photoelectrochemical Hydrogen Production � Develop and optimize the current state-of-the-art materials for meeting near term
efficiency and durability targets. � Discover, utilizing combinatorial or other screening methods, new materials for
meeting long-term efficiency, durability, and cost targets. � Develop cost-effective synthesis techniques for fabricating the most promising
semiconductor materials. � Develop accelerated screening protocols to evaluate and validate long-term material
efficiencies and durability.
Y, Z, AB
8
Development of PEC Device and System Auxiliary Material � Determine the functional requirements for auxiliary materials including protective
coatings, catalytic coatings, photoelectrode substrates, hydrogen impervious materials, and photovoltaic layer materials.
� Discover, develop, and test materials to facilitate PEC device and systems development
AA
9
Material Configurations and Device Engineering for Photoelectrochemical Hydrogen Production � Evaluate device configurations, including multi-junction configurations and other
advanced designs, for improved efficiency and durability and lower device cost. � Develop and optimize the most promising device configurations. � Develop cost-effective fabricating techniques that are scalable and manufactureable
for the most promising materials systems, devices, and configurations.
Y, Z, AB, AC
10
Systems Development for Photoelectrochemical Hydrogen Production � Design reactor systems to optimize light-capture efficiency, hydrogen production, gas
collection and reactor life – including utilization of novel geometries and electrolyte options.
� Identify or develop auxiliary materials and components necessary for photoelectrochemical hydrogen production systems, including cost effective transparent, hydrogen-impermeable materials for reactors.
� Develop accelerated testing protocols to evaluate and validate long-term system efficiencies and durability.
� Apply economic modeling tools for predicting cost potentials for photolytic production technologies.
� Develop methods to overcome diurnal operation limitations.
AD
11
Naturally Occurring Biological Hydrogen Production � Research to discover naturally occurring microorganisms with characteristics
necessary for biological hydrogen production. This research includes naturally occurring microorganisms and hydrogenase enzymes that are O2 tolerant and produce hydrogen efficiently, nitrogenase enzymes that tolerate elevated nitrogen levels, and cellulolytic fermentative microbes that allow for higher H2 molar yield selected; microorganisms with the most promising water-splitting capability; and microorganisms with the most promising fermentative hydrogen-producing capability.
AF
Page 3.1 - 34 Multi-Year Research, Development and Demonstration Plan
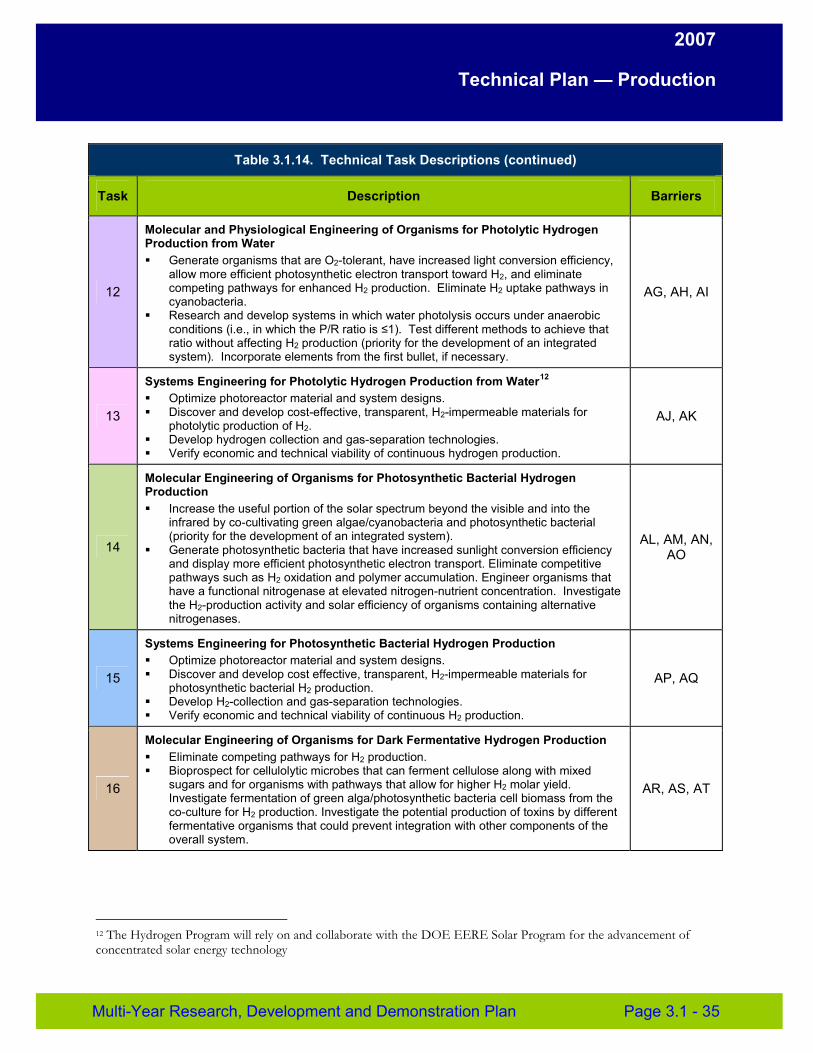
2007
Technical Plan — Production
Table 3.1.14. Technical Task Descriptions (continued)
Task Description Barriers
12
Molecular and Physiological Engineering of Organisms for Photolytic Hydrogen Production from Water � Generate organisms that are O2-tolerant, have increased light conversion efficiency,
allow more efficient photosynthetic electron transport toward H2, and eliminate competing pathways for enhanced H2 production. Eliminate H2 uptake pathways in cyanobacteria.
� Research and develop systems in which water photolysis occurs under anaerobic conditions (i.e., in which the P/R ratio is ≤1). Test different methods to achieve that ratio without affecting H2 production (priority for the development of an integrated system). Incorporate elements from the first bullet, if necessary.
AG, AH, AI
13
Systems Engineering for Photolytic Hydrogen Production from Water12
� Optimize photoreactor material and system designs. � Discover and develop cost-effective, transparent, H2-impermeable materials for
photolytic production of H2. � Develop hydrogen collection and gas-separation technologies. � Verify economic and technical viability of continuous hydrogen production.
AJ, AK
14
Molecular Engineering of Organisms for Photosynthetic Bacterial Hydrogen Production � Increase the useful portion of the solar spectrum beyond the visible and into the
infrared by co-cultivating green algae/cyanobacteria and photosynthetic bacterial (priority for the development of an integrated system).
� Generate photosynthetic bacteria that have increased sunlight conversion efficiency and display more efficient photosynthetic electron transport. Eliminate competitive
AL, AM, AN, AO
pathways such as H2 oxidation and polymer accumulation. Engineer organisms that have a functional nitrogenase at elevated nitrogen-nutrient concentration. Investigate the H2-production activity and solar efficiency of organisms containing alternative nitrogenases.
15
Systems Engineering for Photosynthetic Bacterial Hydrogen Production � Optimize photoreactor material and system designs. � Discover and develop cost effective, transparent, H2-impermeable materials for
photosynthetic bacterial H2 production. � Develop H2-collection and gas-separation technologies. � Verify economic and technical viability of continuous H2 production.
AP, AQ
16
Molecular Engineering of Organisms for Dark Fermentative Hydrogen Production � Eliminate competing pathways for H2 production. � Bioprospect for cellulolytic microbes that can ferment cellulose along with mixed
sugars and for organisms with pathways that allow for higher H2 molar yield. Investigate fermentation of green alga/photosynthetic bacteria cell biomass from the co-culture for H2 production. Investigate the potential production of toxins by different fermentative organisms that could prevent integration with other components of the overall system.
AR, AS, AT
12 The Hydrogen Program will rely on and collaborate with the DOE EERE Solar Program for the advancement of concentrated solar energy technology
Multi-Year Research, Development and Demonstration Plan Page 3.1 - 35
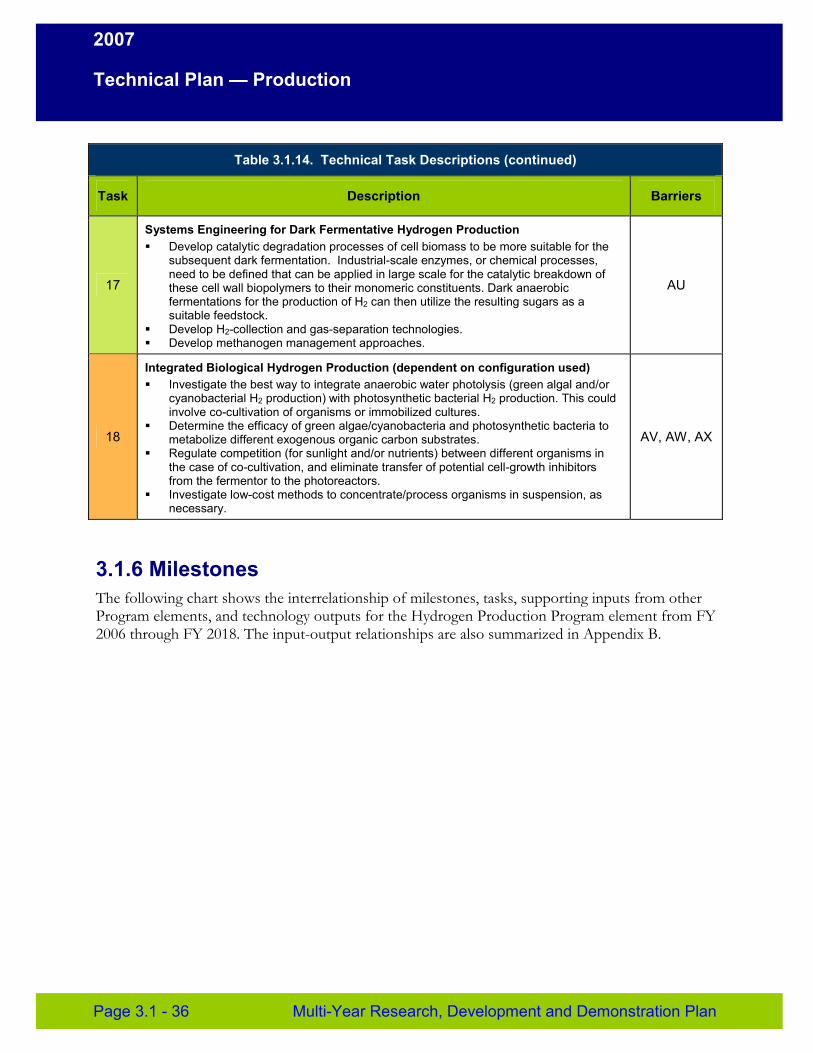
2007
Technical Plan — Production
Table 3.1.14. Technical Task Descriptions (continued)
Task Description Barriers
17
Systems Engineering for Dark Fermentative Hydrogen Production � Develop catalytic degradation processes of cell biomass to be more suitable for the
subsequent dark fermentation. Industrial-scale enzymes, or chemical processes, need to be defined that can be applied in large scale for the catalytic breakdown of these cell wall biopolymers to their monomeric constituents. Dark anaerobic fermentations for the production of H2 can then utilize the resulting sugars as a suitable feedstock.
� Develop H2-collection and gas-separation technologies. � Develop methanogen management approaches.
AU
18
Integrated Biological Hydrogen Production (dependent on configuration used) � Investigate the best way to integrate anaerobic water photolysis (green algal and/or
cyanobacterial H2 production) with photosynthetic bacterial H2 production. This could involve co-cultivation of organisms or immobilized cultures.
� Determine the efficacy of green algae/cyanobacteria and photosynthetic bacteria to metabolize different exogenous organic carbon substrates.
� Regulate competition (for sunlight and/or nutrients) between different organisms in the case of co-cultivation, and eliminate transfer of potential cell-growth inhibitors from the fermentor to the photoreactors.
� Investigate low-cost methods to concentrate/process organisms in suspension, as necessary.
AV, AW, AX
3.1.6 Milestones The following chart shows the interrelationship of milestones, tasks, supporting inputs from other Program elements, and technology outputs for the Hydrogen Production Program element from FY 2006 through FY 2018. The input-output relationships are also summarized in Appendix B.
Page 3.1 - 36 Multi-Year Research, Development and Demonstration Plan
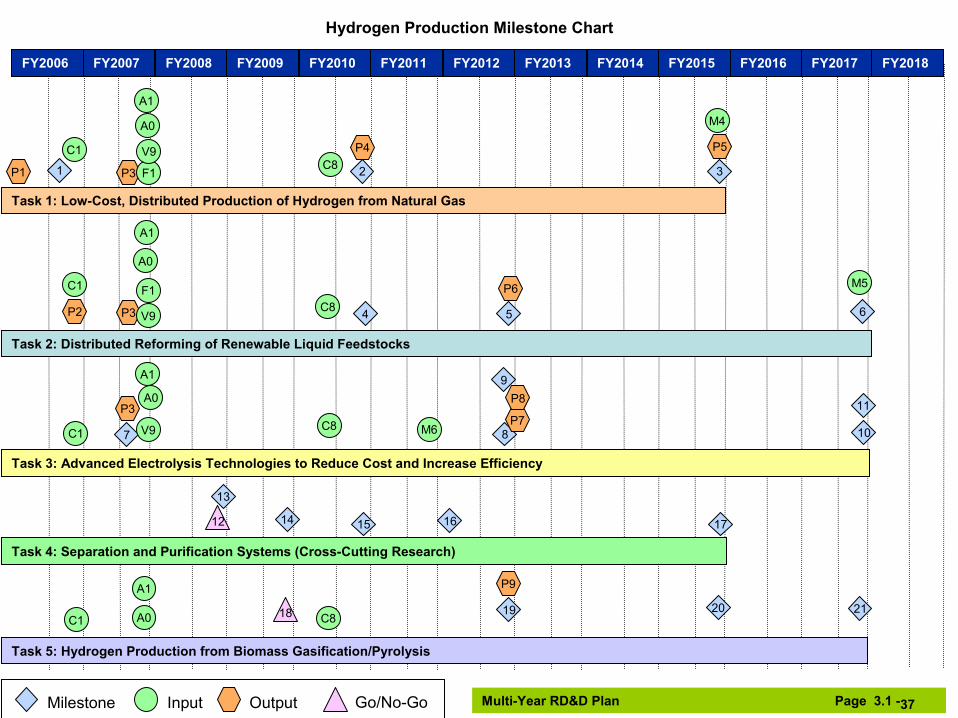
Hydrogen Production Milestone Chart
Milestone Input Output Go/No-Go
FY2006 FY2007 FY2008 FY2009 FY2010 FY2011 FY2012 FY2013 FY2014 FY2015 FY2016 FY2017 FY2018
Task 1: Low-Cost, Distributed Production of Hydrogen from Natural Gas
1 2 3
Task 2: Distributed Reforming of Renewable Liquid Feedstocks
4
Task 3: Advanced Electrolysis Technologies to Reduce Cost and Increase Efficiency
5 6
7 8
9 10
11
12
Task 4: Separation and Purification Systems (Cross-Cutting Research)
13
14 15 16 17
Task 5: Hydrogen Production from Biomass Gasification/Pyrolysis
18 19 20 21
P1
P2
P3
P3
P3
P4 P5
P6
P7
P8
P9
C1
C1
C1
C1
M6
F1
F1
V9
V9
V9
A1
A1
A1
A1
A0
A0
A0
A0
C8
C8
C8 C8
M5
M4
Multi-Year RD&D Plan Page 3.1 -37

Hydrogen Production Milestone Chart
FY2006 FY2007 FY2008 FY2009 FY2010 FY2011 FY2012 FY2013 FY2014 FY2015 FY2016 FY2017 FY2018
Task 8: Development of PEC Device and System Auxiliary Material
29 30 31 32
Task 9: Material Configurations and Device Engineering for Photoelectrochemical Hydrogen Production
29 30 31 32
Task 10: Systems Development for Photoelectrochemical Hydrogen Production
29 30 31 32
Task 11: Naturally Occurring Biological Hydrogen Production
33 34 35
36
37
Task 12: Molecular and Physiological Engineering of Organisms for Photolytic Hydrogen Production from Water
38 39 40 41
42
43
44
45
Task 7: Development of Semiconductor Materials for Photoelectrochemical Hydrogen Production
26
27 2829 30 31 32
Task 6: High-Temperature, Solar-Driven, Thermochemical Processes
22 23 24 25
Multi-Year RD&D Plan Page 3.1 -38Milestone Input Output Go/No-Go
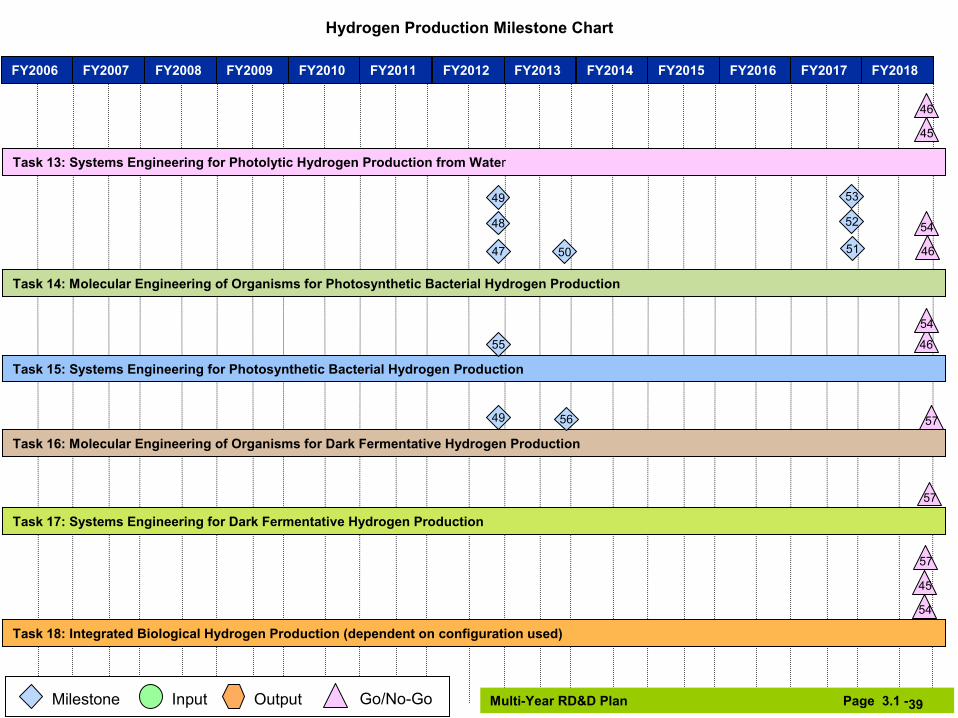
39
Hydrogen Production Milestone Chart
FY2006 FY2007 FY2008 FY2009 FY2010 FY2011 FY2012 FY2013 FY2014 FY2015 FY2016 FY2017 FY2018
Task 15: Systems Engineering for Photosynthetic Bacterial Hydrogen Production
Task 16: Molecular Engineering of Organisms for Dark Fermentative Hydrogen Production
Task 18: Integrated Biological Hydrogen Production (dependent on configuration used)
Task 17: Systems Engineering for Dark Fermentative Hydrogen Production
46
49
54
54
45
55
56 57
57
57
Task 14: Molecular Engineering of Organisms for Photosynthetic Bacterial Hydrogen Production
4647
48
49
50 51
52
53
54
Multi-Year RD&D Plan Page 3.1 -39Milestone Input Output Go/No-Go
Task 13: Systems Engineering for Photolytic Hydrogen Production from Water
45
46
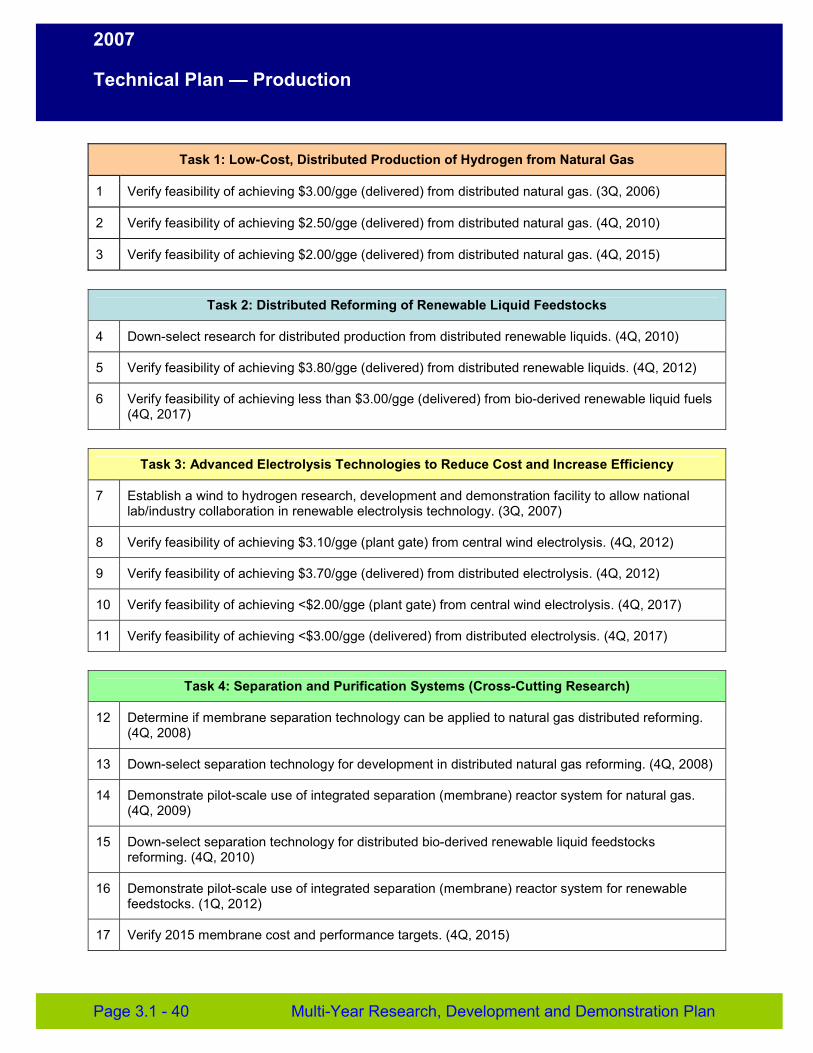
2007
Technical Plan — Production
Task 1: Low-Cost, Distributed Production of Hydrogen from Natural Gas
1 Verify feasibility of achieving $3.00/gge (delivered) from distributed natural gas. (3Q, 2006)
2 Verify feasibility of achieving $2.50/gge (delivered) from distributed natural gas. (4Q, 2010)
3 Verify feasibility of achieving $2.00/gge (delivered) from distributed natural gas. (4Q, 2015)
Task 2: Distributed Reforming of Renewable Liquid Feedstocks
4 Down-select research for distributed production from distributed renewable liquids. (4Q, 2010)
5 Verify feasibility of achieving $3.80/gge (delivered) from distributed renewable liquids. (4Q, 2012)
6 Verify feasibility of achieving less than $3.00/gge (delivered) from bio-derived renewable liquid fuels (4Q, 2017)
Task 3: Advanced Electrolysis Technologies to Reduce Cost and Increase Efficiency
7 Establish a wind to hydrogen research, development and demonstration facility to allow national lab/industry collaboration in renewable electrolysis technology. (3Q, 2007)
8 Verify feasibility of achieving $3.10/gge (plant gate) from central wind electrolysis. (4Q, 2012)
9 Verify feasibility of achieving $3.70/gge (delivered) from distributed electrolysis. (4Q, 2012)
10 Verify feasibility of achieving <$2.00/gge (plant gate) from central wind electrolysis. (4Q, 2017)
11 Verify feasibility of achieving <$3.00/gge (delivered) from distributed electrolysis. (4Q, 2017)
Task 4: Separation and Purification Systems (Cross-Cutting Research)
12 Determine if membrane separation technology can be applied to natural gas distributed reforming. (4Q, 2008)
13 Down-select separation technology for development in distributed natural gas reforming. (4Q, 2008)
14 Demonstrate pilot-scale use of integrated separation (membrane) reactor system for natural gas. (4Q, 2009)
15 Down-select separation technology for distributed bio-derived renewable liquid feedstocks reforming. (4Q, 2010)
16 Demonstrate pilot-scale use of integrated separation (membrane) reactor system for renewable feedstocks. (1Q, 2012)
17 Verify 2015 membrane cost and performance targets. (4Q, 2015)
Page 3.1 - 40 Multi-Year Research, Development and Demonstration Plan
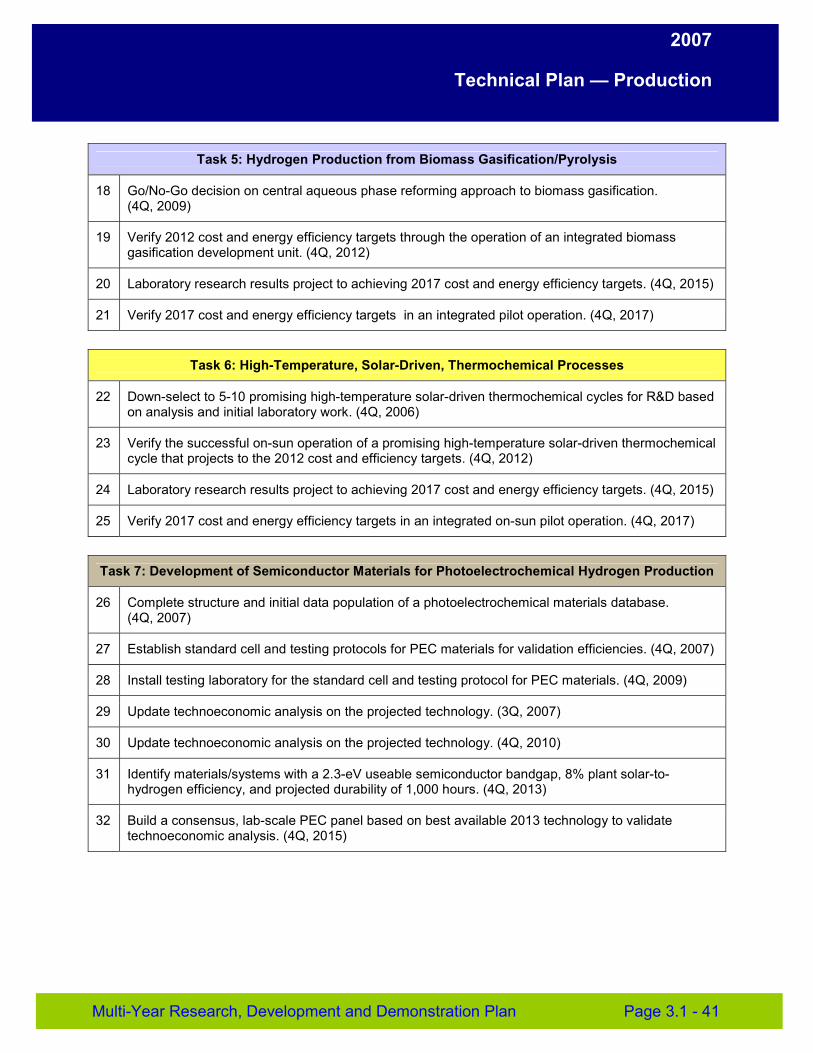
2007
Technical Plan — Production
Task 5: Hydrogen Production from Biomass Gasification/Pyrolysis
18 Go/No-Go decision on central aqueous phase reforming approach to biomass gasification. (4Q, 2009)
19 Verify 2012 cost and energy efficiency targets through the operation of an integrated biomass gasification development unit. (4Q, 2012)
20 Laboratory research results project to achieving 2017 cost and energy efficiency targets. (4Q, 2015)
21 Verify 2017 cost and energy efficiency targets in an integrated pilot operation. (4Q, 2017)
Task 6: High-Temperature, Solar-Driven, Thermochemical Processes
22 Down-select to 5-10 promising high-temperature solar-driven thermochemical cycles for R&D based on analysis and initial laboratory work. (4Q, 2006)
23 Verify the successful on-sun operation of a promising high-temperature solar-driven thermochemical cycle that projects to the 2012 cost and efficiency targets. (4Q, 2012)
24 Laboratory research results project to achieving 2017 cost and energy efficiency targets. (4Q, 2015)
25 Verify 2017 cost and energy efficiency targets in an integrated on-sun pilot operation. (4Q, 2017)
Task 7: Development of Semiconductor Materials for Photoelectrochemical Hydrogen Production
26 Complete structure and initial data population of a photoelectrochemical materials database. (4Q, 2007)
27 Establish standard cell and testing protocols for PEC materials for validation efficiencies. (4Q, 2007)
28 Install testing laboratory for the standard cell and testing protocol for PEC materials. (4Q, 2009)
29 Update technoeconomic analysis on the projected technology. (3Q, 2007)
30 Update technoeconomic analysis on the projected technology. (4Q, 2010)
31 Identify materials/systems with a 2.3-eV useable semiconductor bandgap, 8% plant solar-to-hydrogen efficiency, and projected durability of 1,000 hours. (4Q, 2013)
32 Build a consensus, lab-scale PEC panel based on best available 2013 technology to validate technoeconomic analysis. (4Q, 2015)
Multi-Year Research, Development and Demonstration Plan Page 3.1 - 41
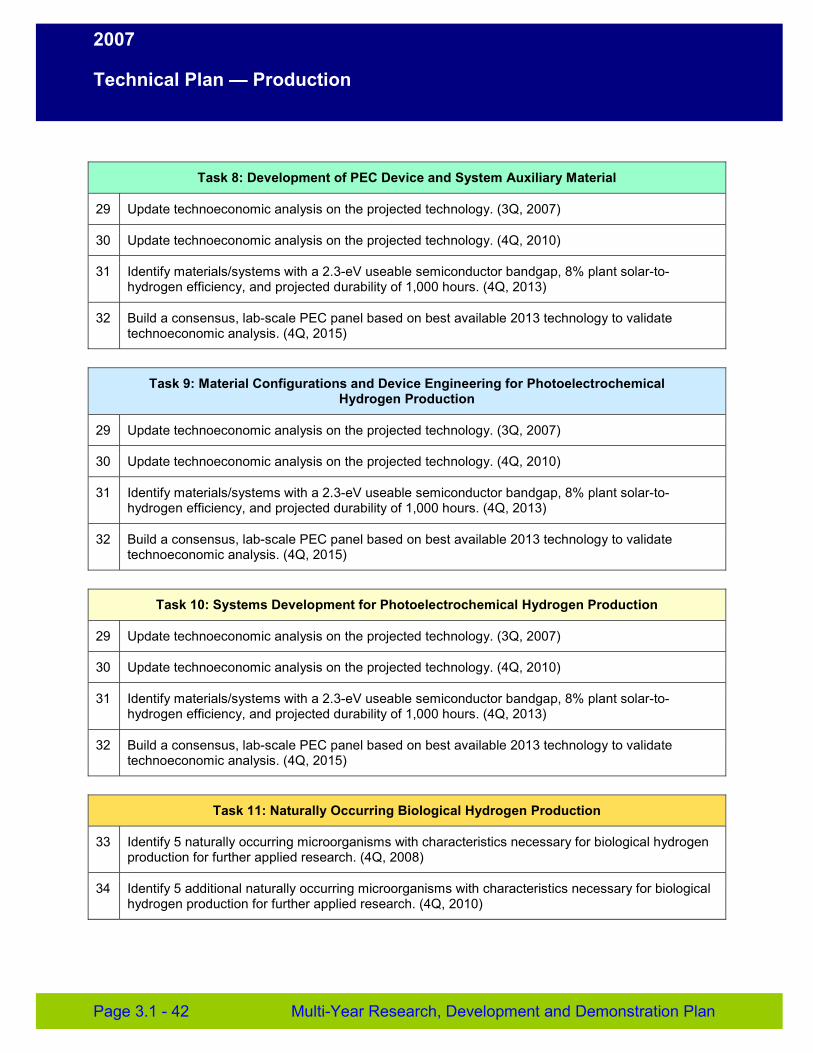
2007
Technical Plan — Production
Task 8: Development of PEC Device and System Auxiliary Material
29 Update technoeconomic analysis on the projected technology. (3Q, 2007)
30 Update technoeconomic analysis on the projected technology. (4Q, 2010)
31 Identify materials/systems with a 2.3-eV useable semiconductor bandgap, 8% plant solar-to-hydrogen efficiency, and projected durability of 1,000 hours. (4Q, 2013)
32 Build a consensus, lab-scale PEC panel based on best available 2013 technology to validate technoeconomic analysis. (4Q, 2015)
Task 9: Material Configurations and Device Engineering for Photoelectrochemical Hydrogen Production
29 Update technoeconomic analysis on the projected technology. (3Q, 2007)
30 Update technoeconomic analysis on the projected technology. (4Q, 2010)
31 Identify materials/systems with a 2.3-eV useable semiconductor bandgap, 8% plant solar-to-hydrogen efficiency, and projected durability of 1,000 hours. (4Q, 2013)
32 Build a consensus, lab-scale PEC panel based on best available 2013 technology to validate technoeconomic analysis. (4Q, 2015)
Task 10: Systems Development for Photoelectrochemical Hydrogen Production
29 Update technoeconomic analysis on the projected technology. (3Q, 2007)
30 Update technoeconomic analysis on the projected technology. (4Q, 2010)
31 Identify materials/systems with a 2.3-eV useable semiconductor bandgap, 8% plant solar-to-hydrogen efficiency, and projected durability of 1,000 hours. (4Q, 2013)
32 Build a consensus, lab-scale PEC panel based on best available 2013 technology to validate technoeconomic analysis. (4Q, 2015)
Task 11: Naturally Occurring Biological Hydrogen Production
33 Identify 5 naturally occurring microorganisms with characteristics necessary for biological hydrogen production for further applied research. (4Q, 2008)
34 Identify 5 additional naturally occurring microorganisms with characteristics necessary for biological hydrogen production for further applied research. (4Q, 2010)
Page 3.1 - 42 Multi-Year Research, Development and Demonstration Plan
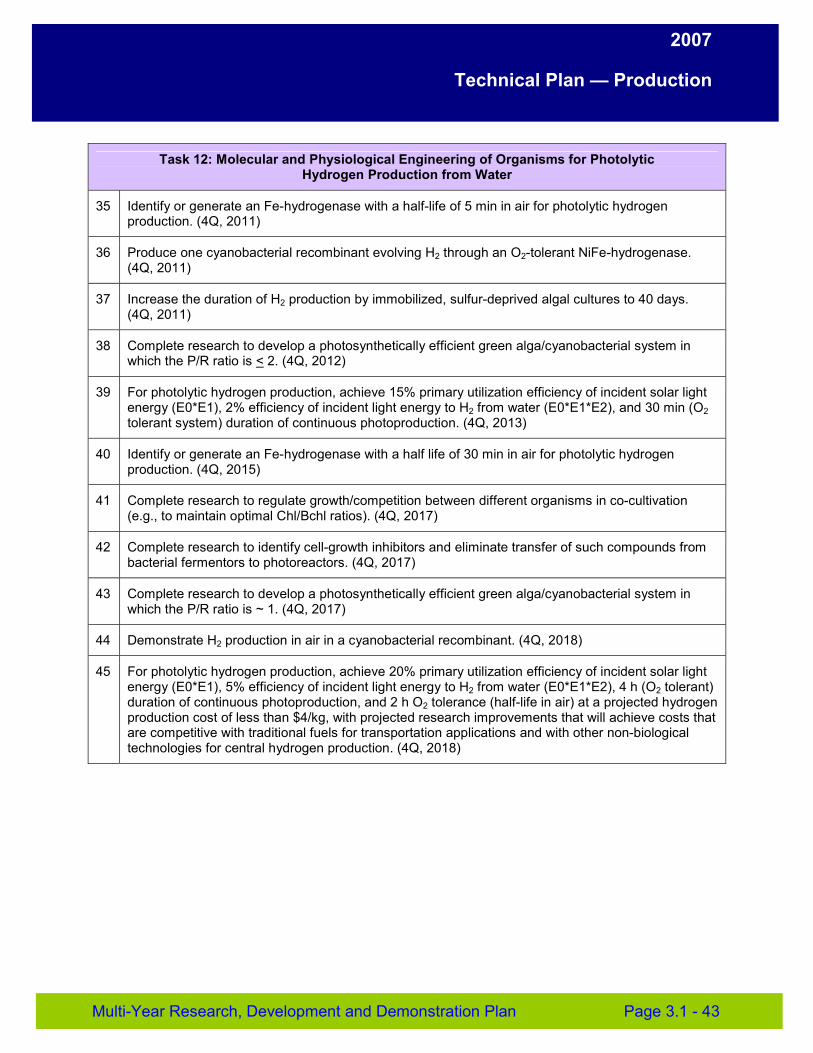
2007
Technical Plan — Production
Task 12: Molecular and Physiological Engineering of Organisms for Photolytic Hydrogen Production from Water
35 Identify or generate an Fe-hydrogenase with a half-life of 5 min in air for photolytic hydrogen production. (4Q, 2011)
36 Produce one cyanobacterial recombinant evolving H2 through an O2-tolerant NiFe-hydrogenase. (4Q, 2011)
37 Increase the duration of H2 production by immobilized, sulfur-deprived algal cultures to 40 days. (4Q, 2011)
38 Complete research to develop a photosynthetically efficient green alga/cyanobacterial system in which the P/R ratio is < 2. (4Q, 2012)
39 For photolytic hydrogen production, achieve 15% primary utilization efficiency of incident solar light energy (E0*E1), 2% efficiency of incident light energy to H2 from water (E0*E1*E2), and 30 min (O2 tolerant system) duration of continuous photoproduction. (4Q, 2013)
40 Identify or generate an Fe-hydrogenase with a half life of 30 min in air for photolytic hydrogen production. (4Q, 2015)
41 Complete research to regulate growth/competition between different organisms in co-cultivation (e.g., to maintain optimal Chl/Bchl ratios). (4Q, 2017)
42 Complete research to identify cell-growth inhibitors and eliminate transfer of such compounds from bacterial fermentors to photoreactors. (4Q, 2017)
43 Complete research to develop a photosynthetically efficient green alga/cyanobacterial system in which the P/R ratio is ~ 1. (4Q, 2017)
44 Demonstrate H2 production in air in a cyanobacterial recombinant. (4Q, 2018)
45 For photolytic hydrogen production, achieve 20% primary utilization efficiency of incident solar light energy (E0*E1), 5% efficiency of incident light energy to H2 from water (E0*E1*E2), 4 h (O2 tolerant) duration of continuous photoproduction, and 2 h O2 tolerance (half-life in air) at a projected hydrogen production cost of less than $4/kg, with projected research improvements that will achieve costs that are competitive with traditional fuels for transportation applications and with other non-biological technologies for central hydrogen production. (4Q, 2018)
Multi-Year Research, Development and Demonstration Plan Page 3.1 - 43
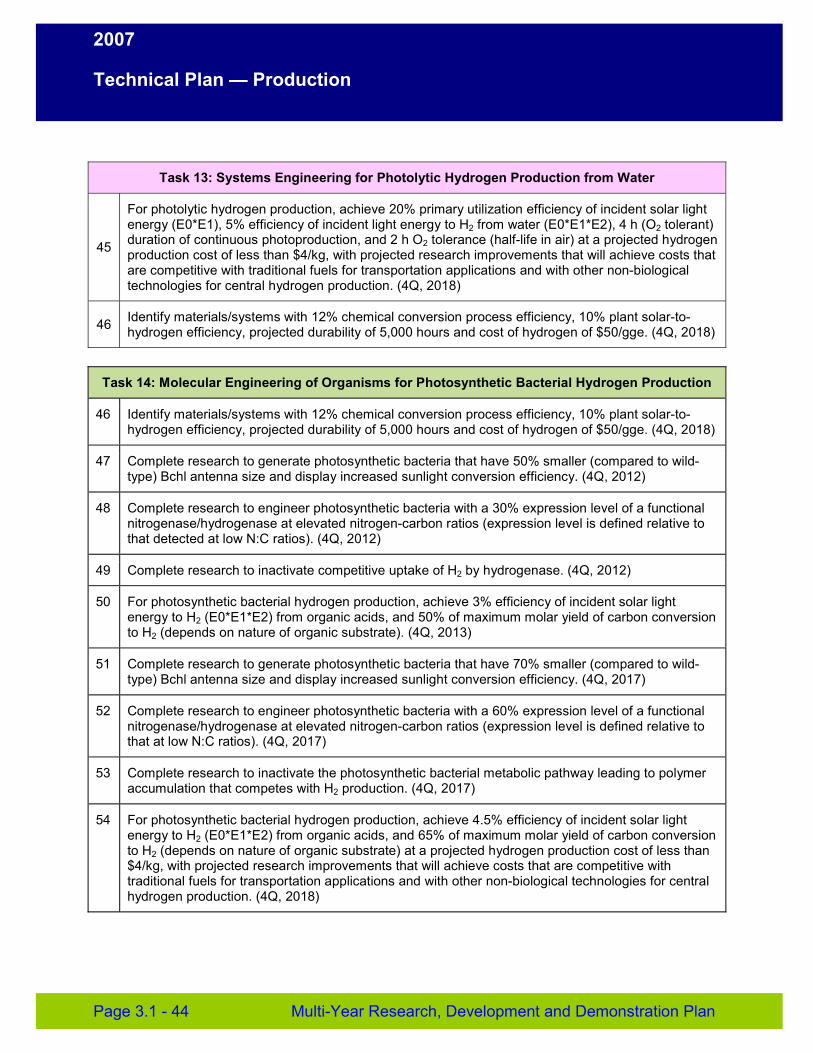
2007
Technical Plan — Production
Task 13: Systems Engineering for Photolytic Hydrogen Production from Water
45
For photolytic hydrogen production, achieve 20% primary utilization efficiency of incident solar light energy (E0*E1), 5% efficiency of incident light energy to H2 from water (E0*E1*E2), 4 h (O2 tolerant) duration of continuous photoproduction, and 2 h O2 tolerance (half-life in air) at a projected hydrogen production cost of less than $4/kg, with projected research improvements that will achieve costs that are competitive with traditional fuels for transportation applications and with other non-biological technologies for central hydrogen production. (4Q, 2018)
46 Identify materials/systems with 12% chemical conversion process efficiency, 10% plant solar-to-hydrogen efficiency, projected durability of 5,000 hours and cost of hydrogen of $50/gge. (4Q, 2018)
Task 14: Molecular Engineering of Organisms for Photosynthetic Bacterial Hydrogen Production
46 Identify materials/systems with 12% chemical conversion process efficiency, 10% plant solar-to-hydrogen efficiency, projected durability of 5,000 hours and cost of hydrogen of $50/gge. (4Q, 2018)
47 Complete research to generate photosynthetic bacteria that have 50% smaller (compared to wild-type) Bchl antenna size and display increased sunlight conversion efficiency. (4Q, 2012)
48 Complete research to engineer photosynthetic bacteria with a 30% expression level of a functional nitrogenase/hydrogenase at elevated nitrogen-carbon ratios (expression level is defined relative to that detected at low N:C ratios). (4Q, 2012)
49 Complete research to inactivate competitive uptake of H2 by hydrogenase. (4Q, 2012)
50 For photosynthetic bacterial hydrogen production, achieve 3% efficiency of incident solar light energy to H2 (E0*E1*E2) from organic acids, and 50% of maximum molar yield of carbon conversion to H2 (depends on nature of organic substrate). (4Q, 2013)
51 Complete research to generate photosynthetic bacteria that have 70% smaller (compared to wild-type) Bchl antenna size and display increased sunlight conversion efficiency. (4Q, 2017)
52 Complete research to engineer photosynthetic bacteria with a 60% expression level of a functional nitrogenase/hydrogenase at elevated nitrogen-carbon ratios (expression level is defined relative to that at low N:C ratios). (4Q, 2017)
53 Complete research to inactivate the photosynthetic bacterial metabolic pathway leading to polymer accumulation that competes with H2 production. (4Q, 2017)
54 For photosynthetic bacterial hydrogen production, achieve 4.5% efficiency of incident solar light energy to H2 (E0*E1*E2) from organic acids, and 65% of maximum molar yield of carbon conversion to H2 (depends on nature of organic substrate) at a projected hydrogen production cost of less than $4/kg, with projected research improvements that will achieve costs that are competitive with traditional fuels for transportation applications and with other non-biological technologies for central hydrogen production. (4Q, 2018)
Page 3.1 - 44 Multi-Year Research, Development and Demonstration Plan
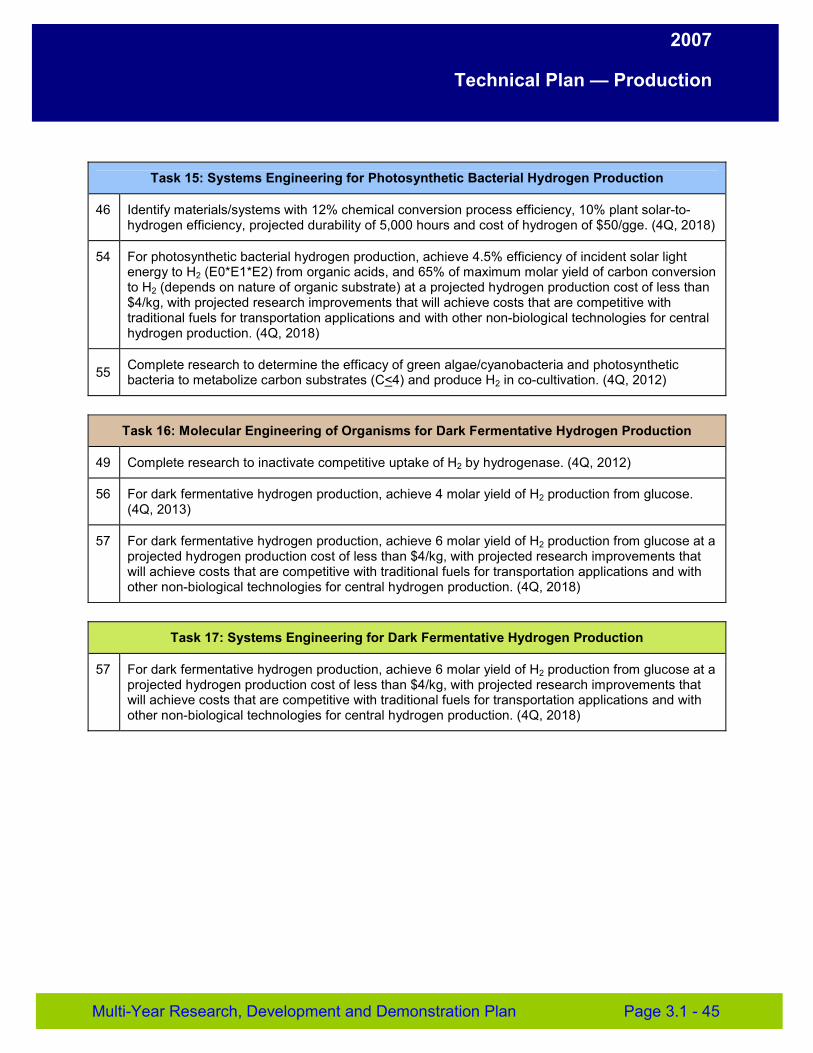
2007
Technical Plan — Production
Task 15: Systems Engineering for Photosynthetic Bacterial Hydrogen Production
46 Identify materials/systems with 12% chemical conversion process efficiency, 10% plant solar-to-hydrogen efficiency, projected durability of 5,000 hours and cost of hydrogen of $50/gge. (4Q, 2018)
54 For photosynthetic bacterial hydrogen production, achieve 4.5% efficiency of incident solar light energy to H2 (E0*E1*E2) from organic acids, and 65% of maximum molar yield of carbon conversion to H2 (depends on nature of organic substrate) at a projected hydrogen production cost of less than $4/kg, with projected research improvements that will achieve costs that are competitive with traditional fuels for transportation applications and with other non-biological technologies for central hydrogen production. (4Q, 2018)
55 Complete research to determine the efficacy of green algae/cyanobacteria and photosynthetic bacteria to metabolize carbon substrates (C<4) and produce H2 in co-cultivation. (4Q, 2012)
Task 16: Molecular Engineering of Organisms for Dark Fermentative Hydrogen Production
49 Complete research to inactivate competitive uptake of H2 by hydrogenase. (4Q, 2012)
56 For dark fermentative hydrogen production, achieve 4 molar yield of H2 production from glucose. (4Q, 2013)
57 For dark fermentative hydrogen production, achieve 6 molar yield of H2 production from glucose at a projected hydrogen production cost of less than $4/kg, with projected research improvements that will achieve costs that are competitive with traditional fuels for transportation applications and with other non-biological technologies for central hydrogen production. (4Q, 2018)
Task 17: Systems Engineering for Dark Fermentative Hydrogen Production
57 For dark fermentative hydrogen production, achieve 6 molar yield of H2 production from glucose at a projected hydrogen production cost of less than $4/kg, with projected research improvements that will achieve costs that are competitive with traditional fuels for transportation applications and with other non-biological technologies for central hydrogen production. (4Q, 2018)
Multi-Year Research, Development and Demonstration Plan Page 3.1 - 45
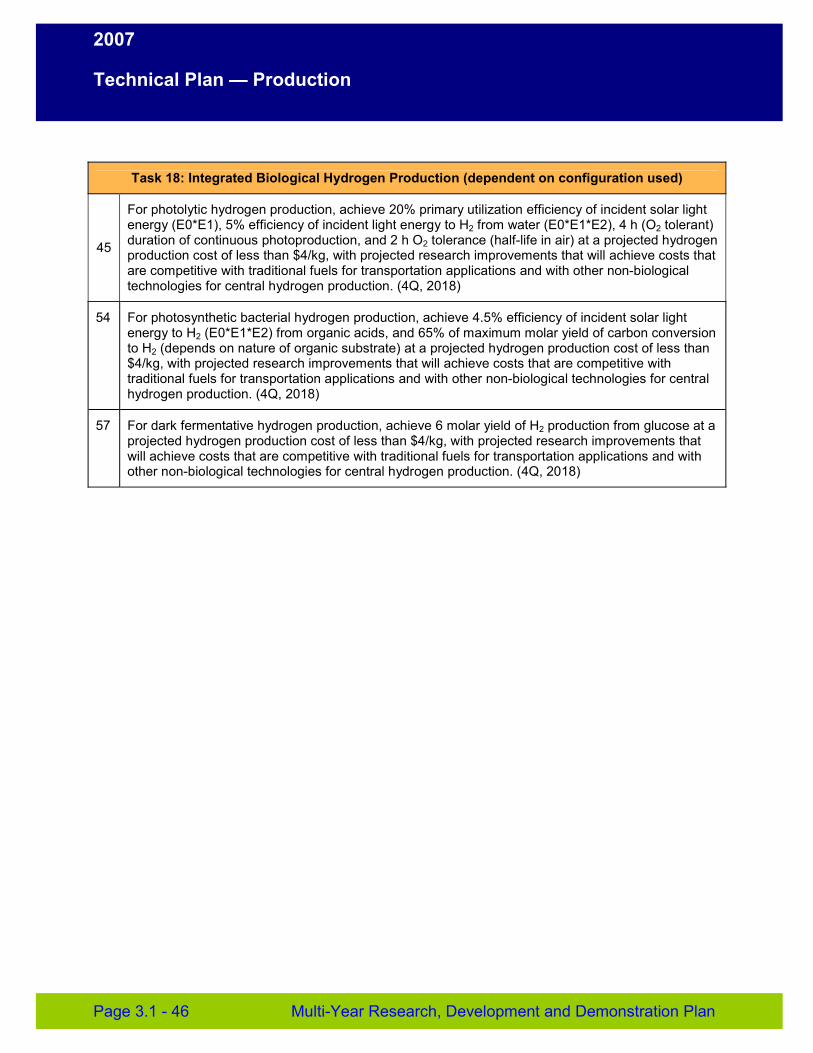
2007
Technical Plan — Production
Task 18: Integrated Biological Hydrogen Production (dependent on configuration used)
45
For photolytic hydrogen production, achieve 20% primary utilization efficiency of incident solar light energy (E0*E1), 5% efficiency of incident light energy to H2 from water (E0*E1*E2), 4 h (O2 tolerant) duration of continuous photoproduction, and 2 h O2 tolerance (half-life in air) at a projected hydrogen production cost of less than $4/kg, with projected research improvements that will achieve costs that are competitive with traditional fuels for transportation applications and with other non-biological technologies for central hydrogen production. (4Q, 2018)
54 For photosynthetic bacterial hydrogen production, achieve 4.5% efficiency of incident solar light energy to H2 (E0*E1*E2) from organic acids, and 65% of maximum molar yield of carbon conversion to H2 (depends on nature of organic substrate) at a projected hydrogen production cost of less than $4/kg, with projected research improvements that will achieve costs that are competitive with traditional fuels for transportation applications and with other non-biological technologies for central hydrogen production. (4Q, 2018)
57 For dark fermentative hydrogen production, achieve 6 molar yield of H2 production from glucose at a projected hydrogen production cost of less than $4/kg, with projected research improvements that will achieve costs that are competitive with traditional fuels for transportation applications and with other non-biological technologies for central hydrogen production. (4Q, 2018)
Page 3.1 - 46 Multi-Year Research, Development and Demonstration Plan
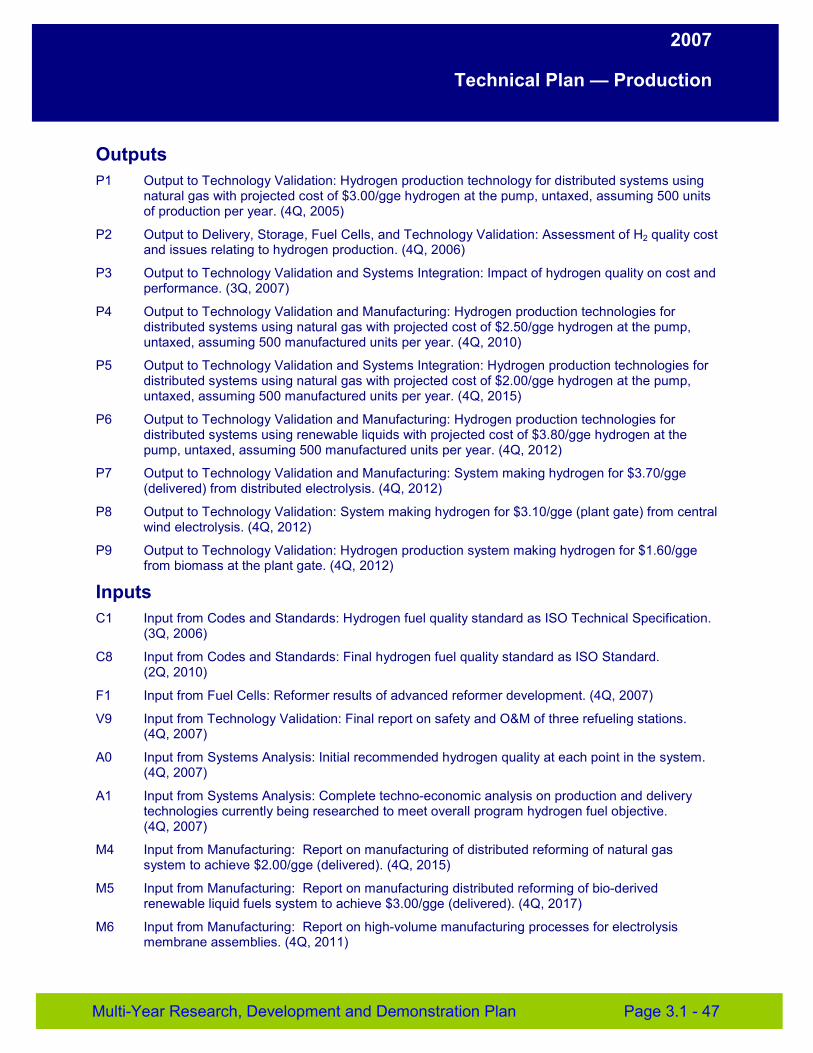
2007
Technical Plan — Production
Outputs P1 Output to Technology Validation: Hydrogen production technology for distributed systems using
natural gas with projected cost of $3.00/gge hydrogen at the pump, untaxed, assuming 500 units of production per year. (4Q, 2005)
P2 Output to Delivery, Storage, Fuel Cells, and Technology Validation: Assessment of H2 quality cost and issues relating to hydrogen production. (4Q, 2006)
P3 Output to Technology Validation and Systems Integration: Impact of hydrogen quality on cost and performance. (3Q, 2007)
P4 Output to Technology Validation and Manufacturing: Hydrogen production technologies for distributed systems using natural gas with projected cost of $2.50/gge hydrogen at the pump, untaxed, assuming 500 manufactured units per year. (4Q, 2010)
P5 Output to Technology Validation and Systems Integration: Hydrogen production technologies for distributed systems using natural gas with projected cost of $2.00/gge hydrogen at the pump, untaxed, assuming 500 manufactured units per year. (4Q, 2015)
P6 Output to Technology Validation and Manufacturing: Hydrogen production technologies for distributed systems using renewable liquids with projected cost of $3.80/gge hydrogen at the pump, untaxed, assuming 500 manufactured units per year. (4Q, 2012)
P7 Output to Technology Validation and Manufacturing: System making hydrogen for $3.70/gge (delivered) from distributed electrolysis. (4Q, 2012)
P8 Output to Technology Validation: System making hydrogen for $3.10/gge (plant gate) from central wind electrolysis. (4Q, 2012)
P9 Output to Technology Validation: Hydrogen production system making hydrogen for $1.60/gge from biomass at the plant gate. (4Q, 2012)
Inputs C1 Input from Codes and Standards: Hydrogen fuel quality standard as ISO Technical Specification.
(3Q, 2006)
C8 Input from Codes and Standards: Final hydrogen fuel quality standard as ISO Standard. (2Q, 2010)
F1 Input from Fuel Cells: Reformer results of advanced reformer development. (4Q, 2007)
V9 Input from Technology Validation: Final report on safety and O&M of three refueling stations. (4Q, 2007)
A0 Input from Systems Analysis: Initial recommended hydrogen quality at each point in the system. (4Q, 2007)
A1 Input from Systems Analysis: Complete techno-economic analysis on production and delivery technologies currently being researched to meet overall program hydrogen fuel objective. (4Q, 2007)
M4 Input from Manufacturing: Report on manufacturing of distributed reforming of natural gas system to achieve $2.00/gge (delivered). (4Q, 2015)
M5 Input from Manufacturing: Report on manufacturing distributed reforming of bio-derived renewable liquid fuels system to achieve $3.00/gge (delivered). (4Q, 2017)
M6 Input from Manufacturing: Report on high-volume manufacturing processes for electrolysis membrane assemblies. (4Q, 2011)
Multi-Year Research, Development and Demonstration Plan Page 3.1 - 47
2007
Technical Plan — Delivery
3.2 Hydrogen Delivery Hydrogen must be transported from the point of production to the point of use. It also must be compressed, stored, and dispensed at refueling stations o r stationary power facilities. Due to its relatively low volumetric energy density, transportation, storage, and dispensing at the point of use can be one of the significant cost and energy inefficiencies associated with using hydrogen as an energy carrier.
3.2.1 Technical Goal and Objectives
Goal
Develop hydrogen delivery technologies that enable the introduction and long-term viability of hydrogen as an energy carrier for transportation and stationary power.
Objectives
� By 2007, define criteria for a cost-effective and energy-efficient hydrogen delivery infrastructure for the initial and long-term use of hydrogen for transportation and stationary power.
� By 2010, reduce the cost of compression, storage, and dispensing at refueling stations and stationary power facilities to <$0.80/gge of hydrogen (independent of transport).1
� By 2012, reduce the cost of hydrogen transport from central and semi-central production facilities to the gate of refueling stations and other end users to <$0.90/gge of hydrogen.1
� By 2015, reduce the cost of compression, storage, and dispensing at refueling stations and stationary power facilities to <$0.40/gge of hydrogen (independent of transport).1
� By 2017, reduce the cost of hydrogen delivery from the point of production to the point of use in vehicles or stationary power units to <$1.00/gge of hydrogen in total.1
3.2.2 Technical Approach
The Hydrogen Delivery Program element is focused on meeting the hydrogen delivery objectives outlined in Section 3.2.1 by conducting R&D through industry, national laboratory, and university projects. Projects will address the barriers outlined in Section 3.2.4, and progress toward meeting the objectives will be measured against the technical targets. Delivery efforts will be coordinated with any related activities by the U.S. Department of Transportation (DOT).
1 These targets are based on a well-established hydrogen market demand for transportation. The specific scenario examined assumed central production of hydrogen servicing small (~200,000 people) and large (~1,000,000 people) cities.
Multi-Year Research, Development and Demonstration Plan Page 3.2 - 1
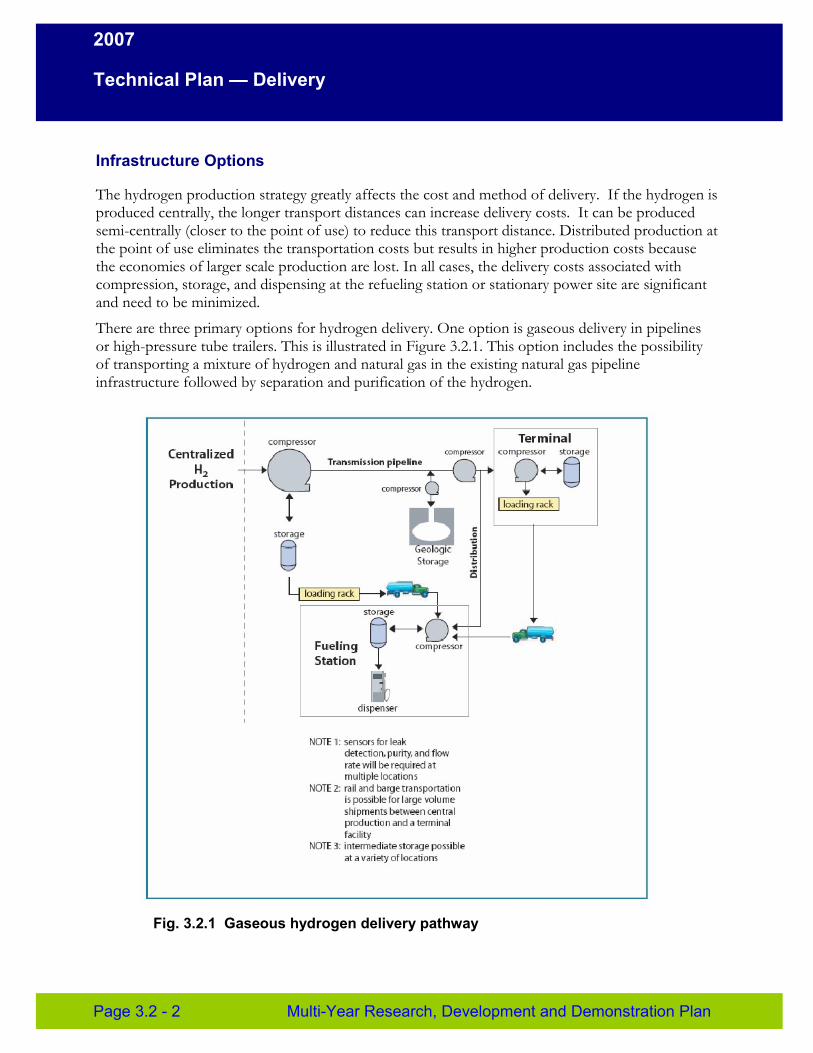
2007
Technical Plan — Delivery
Infrastructure Options
The hydrogen production strategy greatly affects the cost and method of delivery. If the hydrogen is produced centrally, the longer transport distances can increase delivery costs. It can be produced semi-centrally (closer to the point of use) to reduce this transport distance. Distributed production at the point of use eliminates the transportation costs but results in higher production costs because the economies of larger scale production are lost. In all cases, the delivery costs associated with compression, storage, and dispensing at the refueling station or stationary power site are significant and need to be minimized.
There are three primary options for hydrogen delivery. One option is gaseous delivery in pipelines or high-pressure tube trailers. This is illustrated in Figure 3.2.1. This option includes the possibility of transporting a mixture of hydrogen and natural gas in the existing natural gas pipeline infrastructure followed by separation and purification of the hydrogen.
Fig. 3.2.1 Gaseous hydrogen delivery pathway
Page 3.2 - 2 Multi-Year Research, Development and Demonstration Plan
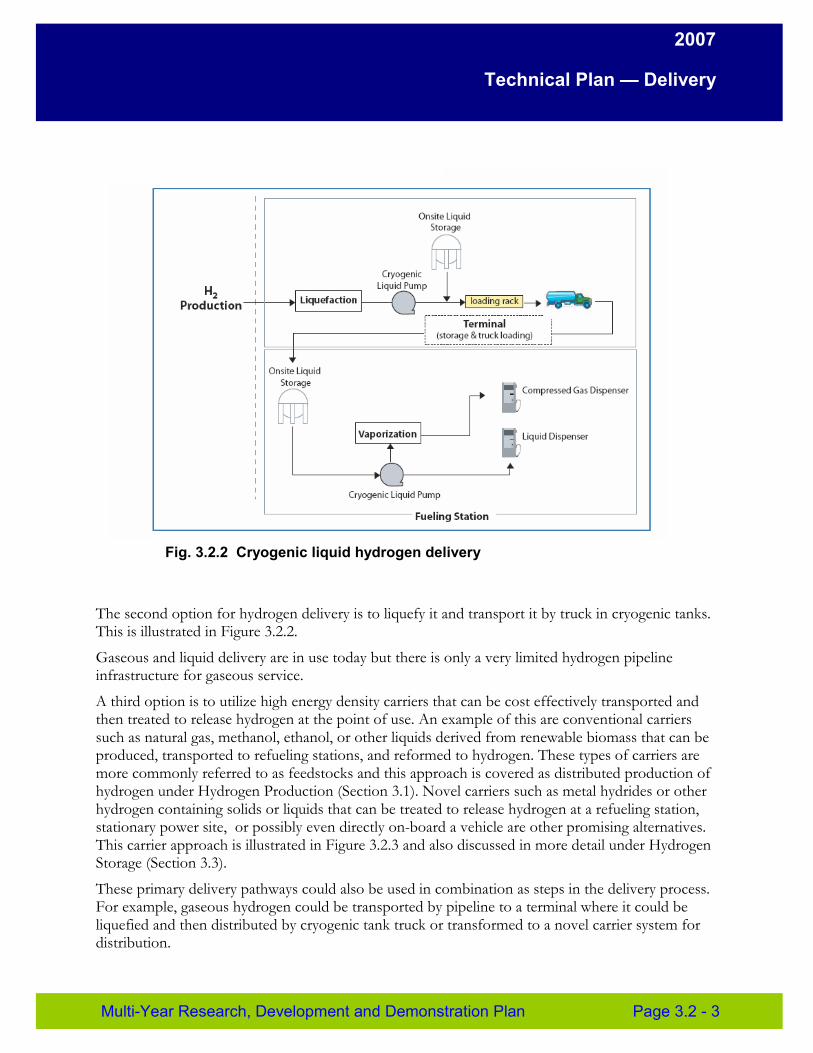
2007
Technical Plan — Delivery
Fig. 3.2.2 Cryogenic liquid hydrogen delivery
The second option for hydrogen delivery is to liquefy it and transport it by truck in cryogenic tanks. This is illustrated in Figure 3.2.2.
Gaseous and liquid delivery are in use today but there is only a very limited hydrogen pipeline infrastructure for gaseous service.
A third option is to utilize high energy density carriers that can be cost effectively transported and then treated to release hydrogen at the point of use. An example of this are conventional carriers such as natural gas, methanol, ethanol, or other liquids derived from renewable biomass that can be produced, transported to refueling stations, and reformed to hydrogen. These types of carriers are more commonly referred to as feedstocks and this approach is covered as distributed production of hydrogen under Hydrogen Production (Section 3.1). Novel carriers such as metal hydrides or other hydrogen containing solids or liquids that can be treated to release hydrogen at a refueling station, stationary power site, or possibly even directly on-board a vehicle are other promising alternatives. This carrier approach is illustrated in Figure 3.2.3 and also discussed in more detail under Hydrogen Storage (Section 3.3).
These primary delivery pathways could also be used in combination as steps in the delivery process. For example, gaseous hydrogen could be transported by pipeline to a terminal where it could be liquefied and then distributed by cryogenic tank truck or transformed to a novel carrier system for distribution.
Multi-Year Research, Development and Demonstration Plan Page 3.2 - 3
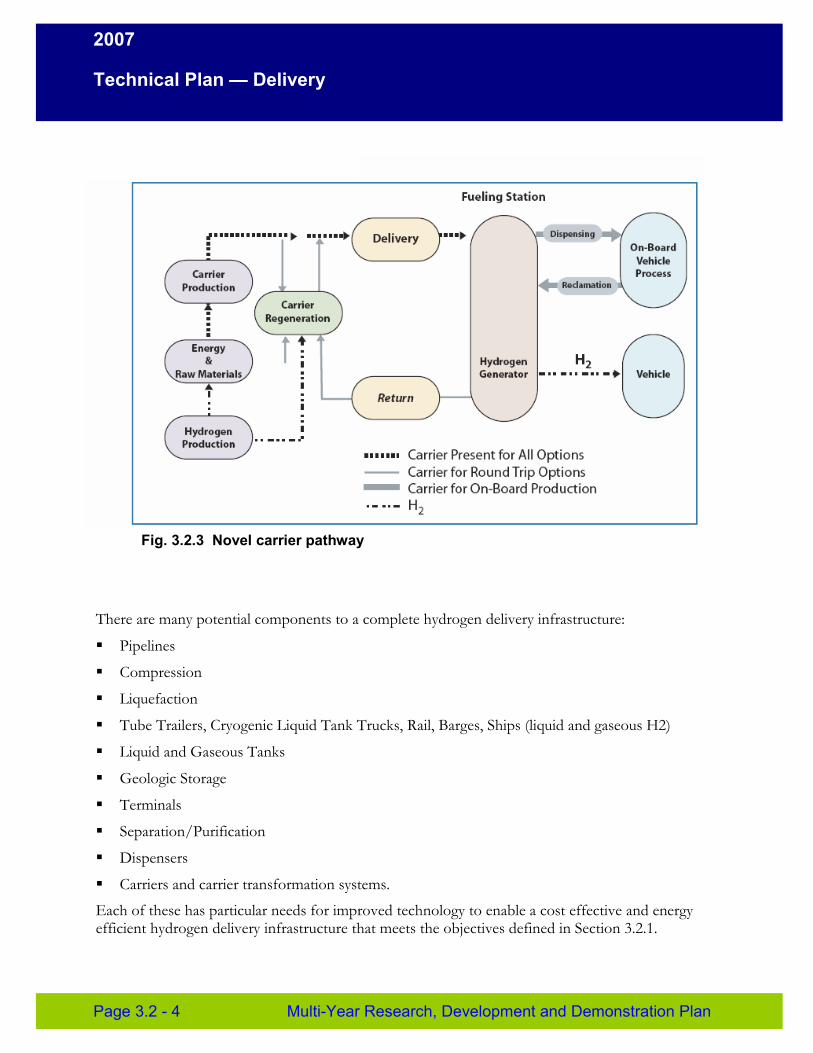
2007
Technical Plan — Delivery
Fig. 3.2.3 Novel carrier pathway
There are many potential components to a complete hydrogen delivery infrastructure:
� Pipelines
� Compression
� Liquefaction
� Tube Trailers, Cryogenic Liquid Tank Trucks, Rail, Barges, Ships (liquid and gaseous H2)
� Liquid and Gaseous Tanks
� Geologic Storage
� Terminals
� Separation/Purification
� Dispensers
� Carriers and carrier transformation systems.
Each of these has particular needs for improved technology to enable a cost effective and energy efficient hydrogen delivery infrastructure that meets the objectives defined in Section 3.2.1.
Page 3.2 - 4 Multi-Year Research, Development and Demonstration Plan
2007
Technical Plan — Delivery
Hydrogen delivery approaches may encompass several options over the short and long term. The initial transportation methods used, when hydrogen volumes are relatively low, may be different than those used when hydrogen is used in large quantities as a primary energy carrier. At very large volumes, an extensive pipeline infrastructure is the most cost-effective and energy efficient known means to transport hydrogen over long distances—as is done with natural gas today. However, other methods such as the use of gaseous tube trailers, cryogenic liquid tank truck delivery, or carriers will be needed for the initial transportation market, and may play a long term role for hydrogen delivery. Different delivery approaches may also be used to best handle the inherent differences between delivery to high population density urban areas, low density rural areas, and interstate refueling stations. In any event, lower cost and more energy-efficient technologies are needed for hydrogen delivery for hydrogen to become a major energy carrier.
Hydrogen Transport / Transmission
Fuels (or energy carriers) must be transported from where they are produced to where they are used. Today, natural gas and petroleum are produced in large central facilities (or imported) and are transported significant distances to cities across the United States. They are moved in large quantities by transmission pipelines as the lowest cost option. Since hydrogen can be produced utilizing a wide variety of feedstocks and technologies, it is likely that hydrogen will be produced in many places and will have, on average, shorter transport distances to the market, once it is established as a major energy carrier.
Pipelines are a low cost option for hydrogen transport. There is currently a small hydrogen pipeline transport infrastructure in the United States (630 miles). It predominantly services refineries along the Gulf coast with some additional pipeline in southern California and Chicago. Research is needed to resolve hydrogen embrittlement concerns for steel pipelines before building a large hydrogen pipeline infrastructure and costs need to be reduced. Alternative materials such as composite pipe are also a consideration that might address these issues. In addition, large volumes of hydrogen are needed to justify the capital investment for transmission pipelines so alternatives will likely be needed to enter the market. Cryogenic liquid tank trucks and gaseous tube trailers are used today, but the costs are very high. Rail and barge transport may also be possible.
Hydrogen Distribution
Once fuels (or energy carriers) are transported to the city, they must be distributed to their point of use. For natural gas, networks of distribution pipelines are used for delivery to end users. Trucks are used to distribute petroleum to refueling stations. For hydrogen, pipelines could be a low-cost approach for distribution. However, the availability and cost of Right of Ways for such an infrastructure in urban areas needs to be carefully examined and safety also needs to be thoroughly addressed. Materials and hydrogen embrittlement issues need to be resolved. Gaseous tube trailers, cryogenic liquid trucks, and carrier approaches are other viable options for hydrogen distribution.
Multi-Year Research, Development and Demonstration Plan Page 3.2 - 5
2007
Technical Plan — Delivery
Bulk Storage
Storage within the hydrogen delivery infrastructure will be important to provide surge capacity for hourly, daily, and seasonal demand variations. Storage could be placed at central production plants, geologic storage sites, terminals, and refueling sites.
The most common pressure vessels for bulk gaseous hydrogen storage are steel tubes. They can be used to store hydrogen at 2,000-6,000 psi or higher, and can be connected through a manifold to allow for larger storage capacity. The development of fiber wound composite high pressure tanks for on-board vehicle hydrogen storage is now being extended to larger off-board stationary bulk hydrogen storage. The cost of these composite tanks must be reduced to make them an attractive bulk storage option.
Another concept being considered is cryo-gas storage where the hydrogen would be cooled to increase its energy density in combination with high pressure. Novel hydrogen carriers might also be useful for off-board hydrogen storage. For example, a solid that could reversibly adsorb and desorb significant amounts of hydrogen and store it at low pressures could reduce the compression costs associated with gaseous storage and might prove to have lower capital cost requirements as well. The technology being considered to reduce the cost and increase the density of bulk hydrogen storage could also be directly applied to storage tanks for gaseous hydrogen truck delivery. If the hydrogen capacity of gaseous trucks could be significantly increased, this approach could be as cost effective as pipelines for hydrogen transport and distribution.
Hydrogen is also stored as a cryogenic liquid due to its higher energy density and thus smaller footprint. This approach is not currently a low cost option due to the high cost and energy penalty of hydrogen liquefaction. A breakthrough in hydrogen liquefaction energy intensity and capital cost could make this approach viable for hydrogen storage.
Geologic storage is routinely used to provide seasonal surge capacity in the natural gas delivery infrastructure. Very large volumes of natural gas are stored in geologic formations such as salt caverns under modest pressure (typically about 2000 psi or less). The hydrogen infrastructure may require similar bulk storage capability. There are currently two hydrogen geologic storage sites. One is a salt cavern operated by ConocoPhillips in Lake Jackson, Texas. The other is in England. Besides naturally-occurring geologic formations, storing hydrogen in specially engineered rock caverns, referred to as lined rock caverns (LRC), offers another possibility. Research into the suitability of geologic storage is needed. Hydrogen is a much smaller molecule than natural gas and has a much higher diffusivity. Containment within geologic storage may be more challenging and potential environmental impacts need to be investigated.
Finally, over-sizing hydrogen transmission pipelines could provide significant bulk storage. The natural gas industry achieves storage within their transmission pipeline infrastructure by increasing its pressure to the maximum allowable prior to its peak demand seasons. This approach, combined with over-sizing the pipelines, can provide significant storage capacity.
Page 3.2 - 6 Multi-Year Research, Development and Demonstration Plan
2007
Technical Plan — Delivery
Interface with On-Board Vehicular Storage of Hydrogen
The technology selected for storing hydrogen on-board vehicles may affect the hydrogen delivery system and infrastructure. Delivery and on-board storage research and development activities will be closely coordinated and need to be integrated at some junction in the system. For example, the on-board storage system could be a solid carrier that receives hydrogen gas directly from a dispenser at a refueling station. On the other hand, if an on-board carrier system requiring off-board regeneration is selected, the hydrogen delivery system will need to cost-effectively accommodate this approach. In this case, the on-board storage technology will inherently be part of the delivery infrastructure.
Refueling Sites
The refueling station or stationary power site itself is part of the delivery infrastructure and can account for as much as half the cost of hydrogen delivery. In a gaseous hydrogen delivery approach, the hydrogen must be compressed, stored, and dispensed at the refueling site. With cryogenic liquid or carrier approaches, there are other operations at the refueling site that need to be considered. Due to the very high purity of hydrogen needed for fuel cell vehicles (see Appendix C), a final/polishing purification might be required at refueling stations as well. This will depend on the degree of purification provided at the point of manufacture and the degree of potential contamination within the delivery infrastructure.
Dispensing hydrogen to vehicles requires appropriate filling protocols and vehicle-dispenser communications for safety and to ensure complete fills. Cooling of the hydrogen at the refueling site might be required for several technologies that are being considered for on-board vehicle storage. These include the use of high pressure (10,000 psi) gaseous storage that may require cooling to compensate for the heat of compression of the gas as the vehicle tank fills, metal hydrides that evolve significant heat as they absorb hydrogen, adsorbents that may require cooling, and cryo-compressed gas storage on the vehicle.
The Hydrogen Delivery milestone chart in Section 3.2.6 and the Hydrogen Storage milestone chart in Section 3.3.6 show inputs and outputs between the Delivery and the Storage Program elements that address the interactions between Hydrogen Delivery and On-Board Hydrogen Storage.
Research Strategy
To enable the introduction of hydrogen as an energy carrier, a key initial focus of the Hydrogen Delivery Program element will be on hydrogen delivery research challenges at refueling stations and stationary power sites with respect to compression, storage, and dispensing technologies. These will be needed in conjunction with distributed hydrogen production for market introduction. The improved technologies necessary for transport of hydrogen from more central production facilities will be researched in a parallel effort but with greater emphasis later in the program.
Multi-Year Research, Development and Demonstration Plan Page 3.2 - 7
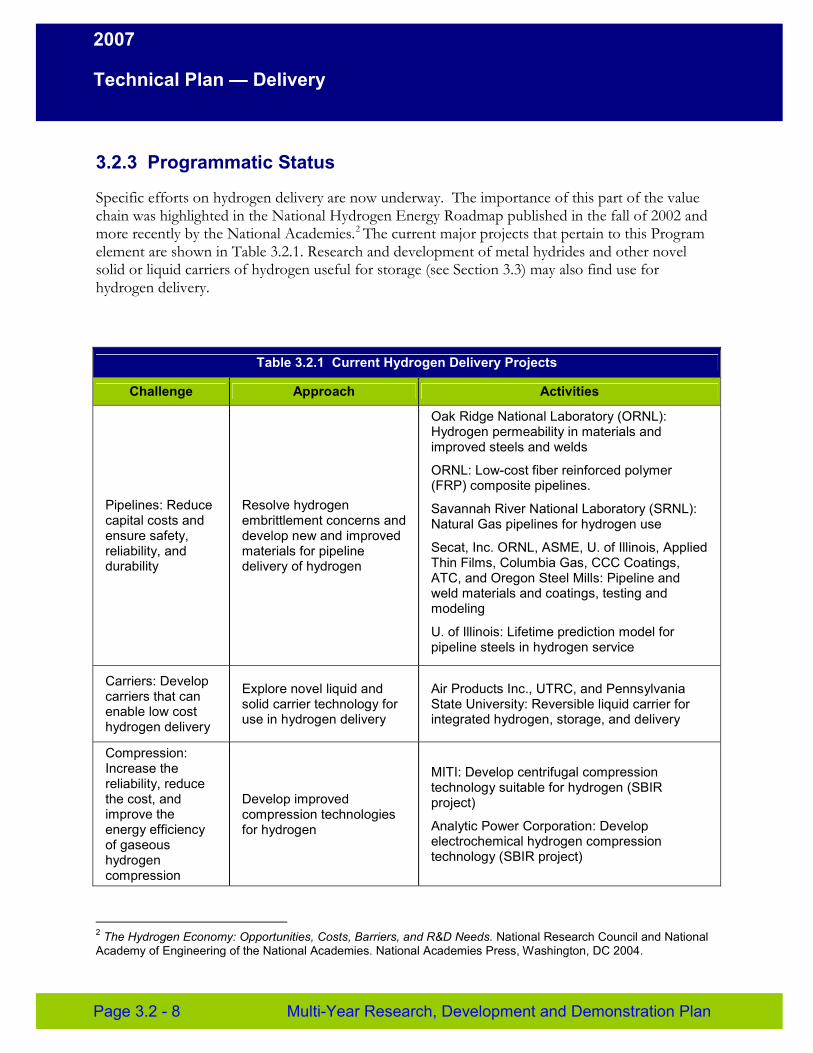
2007
Technical Plan — Delivery
3.2.3 Programmatic Status
Specific efforts on hydrogen delivery are now underway. The importance of this part of the value chain was highlighted in the National Hydrogen Energy Roadmap published in the fall of 2002 and more recently by the National Academies.2 The current major projects that pertain to this Program element are shown in Table 3.2.1. Research and development of metal hydrides and other novel solid or liquid carriers of hydrogen useful for storage (see Section 3.3) may also find use for hydrogen delivery.
Challenge
Table 3.2.1 Current Hydro
Approach
gen Delivery Projects
Activities
Oak Ridge National Laboratory (ORNL): Hydrogen permeability in materials and improved steels and welds
ORNL: Low-cost fiber reinforced polymer (FRP) composite pipelines.
Savannah River National Laboratory (SRNL): Natural Gas pipelines for hydrogen use
Secat, Inc. ORNL, ASME, U. of Illinois, Applied Thin Films, Columbia Gas, CCC Coatings, ATC, and Oregon Steel Mills: Pipeline and weld materials and coatings, testing and modeling
U. of Illinois: Lifetime prediction model for pipeline steels in hydrogen service
Pipelines: Reduce capital costs and ensure safety, reliability, and durability
Resolve hydrogen embrittlement concerns and develop new and improved materials for pipeline delivery of hydrogen
Carriers: Develop carriers that can enable low cost hydrogen delivery
Explore novel liquid and solid carrier technology for use in hydrogen delivery
Air Products Inc., UTRC, and Pennsylvania State University: Reversible liquid carrier for integrated hydrogen, storage, and delivery
Compression: Increase the MITI: Develop centrifugal compression reliability, reduce technology suitable for hydrogen (SBIR the cost, and Develop improved project) improve the compression technologies energy efficiency for hydrogen Analytic Power Corporation: Develop of gaseous electrochemical hydrogen compression hydrogen technology (SBIR project) compression
2 The Hydrogen Economy: Opportunities, Costs, Barriers, and R&D Needs. National Research Council and National Academy of Engineering of the National Academies. National Academies Press, Washington, DC 2004.
Page 3.2 - 8 Multi-Year Research, Development and Demonstration Plan
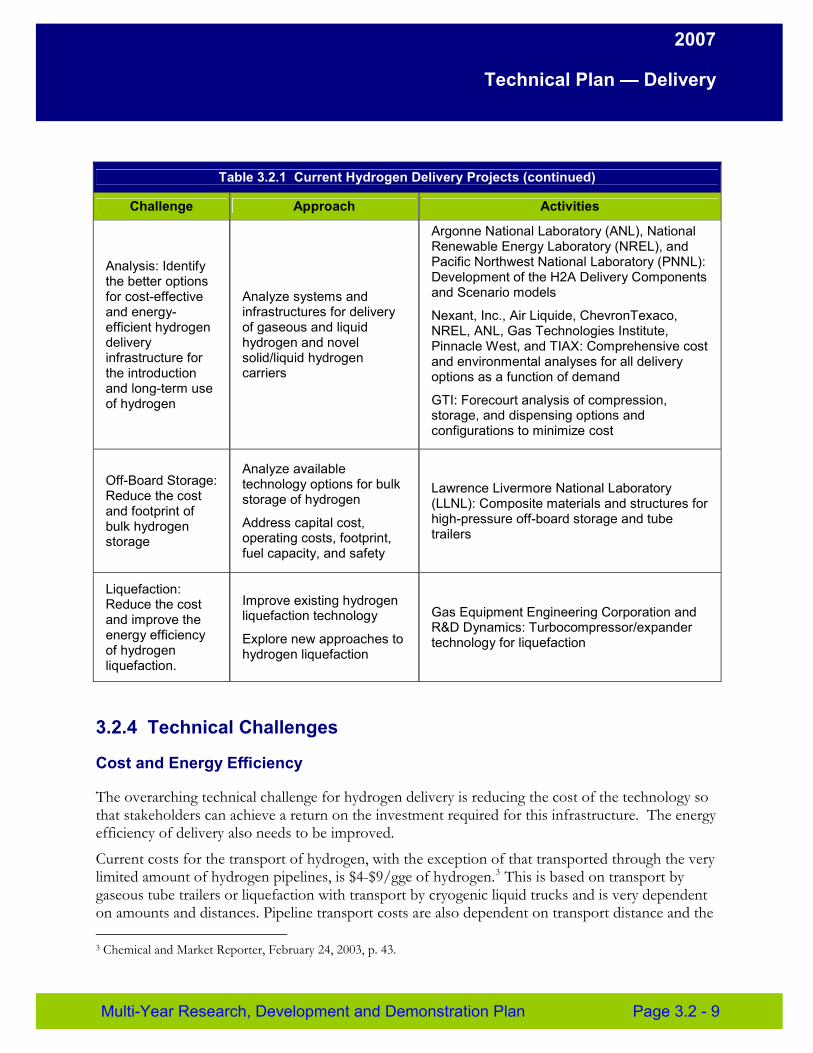
2007
Technical Plan — Delivery
Challenge
Ta
Approach
ble 3.2.1 Current Hydrogen D
Activities
Argonne National Laboratory (ANL), National Renewable Energy Laboratory (NREL), and Pacific Northwest National Laboratory (PNNL): Development of the H2A Delivery Components and Scenario models
Nexant, Inc., Air Liquide, ChevronTexaco, NREL, ANL, Gas Technologies Institute, Pinnacle West, and TIAX: Comprehensive cost and environmental analyses for all delivery options as a function of demand
GTI: Forecourt analysis of compression, storage, and dispensing options and configurations to minimize cost
elivery Projects (continued)
Analysis: Identify the better options for cost-effective and energy-efficient hydrogen delivery infrastructure for the introduction and long-term use of hydrogen
Analyze systems and infrastructures for delivery of gaseous and liquid hydrogen and novel solid/liquid hydrogen carriers
Off-Board Storage: Reduce the cost and footprint of bulk hydrogen storage
Analyze available technology options for bulk storage of hydrogen
Address capital cost, operating costs, footprint, fuel capacity, and safety
Lawrence Livermore National Laboratory (LLNL): Composite materials and structures for high-pressure off-board storage and tube trailers
Liquefaction: Reduce the cost and improve the energy efficiency of hydrogen liquefaction.
Improve existing hydrogen liquefaction technology
Explore new approaches to hydrogen liquefaction
Gas Equipment Engineering Corporation and R&D Dynamics: Turbocompressor/expander technology for liquefaction
3.2.4 Technical Challenges
Cost and Energy Efficiency
The overarching technical challenge for hydrogen delivery is reducing the cost of the technology so that stakeholders can achieve a return on the investment required for this infrastructure. The energy efficiency of delivery also needs to be improved.
Current costs for the transport of hydrogen, with the exception of that transported through the very limited amount of hydrogen pipelines, is $4-$9/gge of hydrogen.3 This is based on transport by gaseous tube trailers or liquefaction with transport by cryogenic liquid trucks and is very dependent on amounts and distances. Pipeline transport costs are also dependent on transport distance and the
3 Chemical and Market Reporter, February 24, 2003, p. 43.
Multi-Year Research, Development and Demonstration Plan Page 3.2 - 9
2007
Technical Plan — Delivery
amount of hydrogen delivered but are typically less than $2/gge. These transport costs do not include the delivery costs associated with compression, storage, and dispensing and/or other delivery operations that may be needed at the refueling site such as hydrogen cooling or final purification.
To reduce the cost of hydrogen delivery to the long term target of <$1.00/gge which includes the costs of operations at the refueling site, significant cost reductions and performance improvements are required. If pipelines are to be used, hydrogen embrittlement concerns need to be addressed and the capital cost for pipelines need to be reduced. Improved hydrogen compression technology needs to be developed that is more reliable and lower in cost. If liquefaction and cryogenic liquid transport is to be used, the capital cost and energy efficiency of liquefaction needs to be improved dramatically. The use of gaseous tube trailers could be very attractive if their carrying capacity could be increased significantly through the use of higher pressure, cooled gas, and/or the use of a novel solid carrier in the tubes. The cost of hydrogen storage needs to be significantly decreased. The use of novel solid or liquid carriers may present an opportunity for lower cost hydrogen transport or storage. Such systems need to be explored.
Hydrogen Purity Requirements
PEM fuel cells for automotive and other uses will likely require very high quality hydrogen (see Appendix C). There also might be additional quality requirements for the final technology developed and adopted for on–board vehicle storage (see Section 3.3). If the hydrogen is produced to these specifications, then the delivery infrastructure must ensure it does not contaminate the hydrogen or else provide a final purification step just prior to dispensing. Alternatively, the hydrogen could be produced to somewhat lower purity levels and then be purified to specifications just prior to dispensing. The optimum purification strategy that will minimize overall costs will depend on the nature of the potential contamination issues and thus the technologies employed across production and delivery. The delivery research plan has several inputs and outputs among Hydrogen Production, Delivery, Storage, Fuel Cells, and Systems Analysis to help optimize this purification strategy. In addition, there is a FreedomCAR and Fuel Partnership Hydrogen Quality Working Group that is addressing hydrogen quality issues in a comprehensive manner.
Hydrogen Leakage
The hydrogen molecule is very small and diffuses rapidly compared with other gases such as natural gas. This makes it more challenging to design equipment, materials, seals, valves, and fittings to avoid hydrogen leakage. Currently hydrogen is used and handled in significant quantities in industrial settings in petroleum refining, ammonia production, and specialty chemicals production without significant leakage issues. Industrial hydrogen operations are monitored and maintained by skilled people. The delivery infrastructure for hydrogen use as a major energy carrier will need to rely heavily on robust system design and engineering.
Page 3.2 - 10 Multi-Year Research, Development and Demonstration Plan
2007
Technical Plan — Delivery
Analysis of Infrastructure Trade-Offs
Options and trade-offs for hydrogen delivery from central, semi-central, and distributed production to the point of use are currently being analyzed. Further analysis is needed to understand the advantages and disadvantages of the various energy sources and production and delivery technology options including life cycle energy, cost, and environmental impacts to guide research and investment efforts for the ultimate hydrogen infrastructure and for the most appropriate infrastructure to be used during the introduction of hydrogen as a primary energy carrier. Examples of some of these trade-offs include:
� Centrally producing a liquid fuel (such as ethanol from biomass) and then transporting this relatively high volumetric energy density fuel to a refueling station for reforming into hydrogen versus centrally producing hydrogen from biomass and then transporting the lower volumetric energy density hydrogen to the refueling station.
� Utilizing liquefaction and liquid truck delivery at low hydrogen demand rates versus installing hydrogen delivery pipelines. The former involves potentially less capital risk while the latter sets the stage for the longer term, lower cost delivery option when hydrogen is in high demand. In addition, the potential for higher capacity gaseous tube trailer technology represents an option that could be cost effective for both the initial commercialization and the longer term.
� Purifying hydrogen at the central production point to required final use specifications and designing the delivery infrastructure to avoid any contamination versus basic purification at the point of manufacture and final polishing purification just prior to the point of use.
� The cost of a novel solid or liquid hydrogen carrier delivery system that might not require compression depending on the on-board vehicle storage technology versus the cost of gaseous delivery with compression.
� The use of high-capacity carriers to reduce the cost of hydrogen transport verses the cost and energy required to return spent carrier to a central site and regenerate it.
Technical Targets
Table 3.2.2 lists the technical targets for the Hydrogen Delivery Program element.
The key to achieving the goal and objectives of the Hydrogen Delivery Program element is to bring down the costs, improve the energy efficiency, and ensure reliable performance of the key delivery technologies: compression, liquefaction, pipelines, and off-board bulk storage. The targets shown in Table 3.2.2 are based on an analysis of current technology and costs, estimates of what might be possible with technology advances, and the market-driven requirements for the total delivery system costs. The current technology costs are based on the H2A Delivery models and efforts.4 Delivery system costs are a complex function of the technology, delivery distances, system architecture, and hydrogen demand. The 2017 cost targets in the table are the estimated costs needed for these technologies to meet the objective of the overall delivery system cost contribution to be <$1.00/gge of hydrogen.
4 H2A Delivery Models can be found at www.hydrogen.energy.gov under Systems Analysis.
Multi-Year Research, Development and Demonstration Plan Page 3.2 - 11
2007
Technical Plan — Delivery
Initial targets are also given for hydrogen solid- or liquid-carrier technologies that could prove useful for hydrogen delivery. There are many possible options for use of hydrogen carriers within the delivery system.
An important emphasis of the Program is the period when hydrogen will start to become utilized in the transportation market. In the Production area, this results in an initial focus on distributed production at refueling stations. Delivery research will support this through an emphasis on the cost of compression and storage at refueling stations. This is also reflected in the targets.
Although not listed in the table, it is understood that the hydrogen purity at the dispenser must meet the rigorous hydrogen quality requirements as described in Appendix C.
Page 3.2 - 12 Multi-Year Research, Development and Demonstration Plan
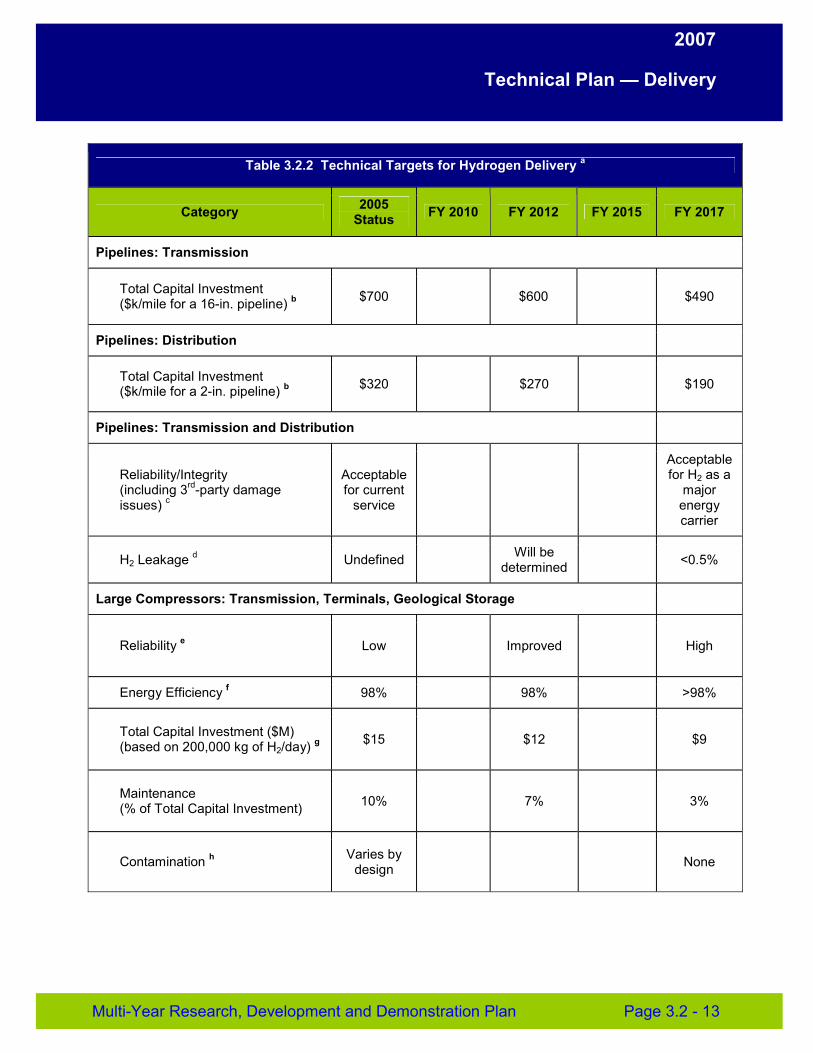
2007
Technical Plan — Delivery
Table 3.2.2 Technical Targets for Hydrogen Delivery a
Category 2005 Status FY 2010 FY 2012 FY 2015 FY 2017
Pipelines: Transmission
Total Capital Investment ($k/mile for a 16-in. pipeline) b $700 $600 $490
Pipelines: Distribution
Total Capital Investment ($k/mile for a 2-in. pipeline) b $320 $270 $190
Pipelines: Transmission and Distribution
Reliability/Integrity (including 3rd-party damage issues) c
Acceptable for current
service
Acceptable for H2 as a
major energy carrier
H2 Leakage d Undefined Will be determined <0.5%
Large Compressors: Transmission, Terminals, Geological Storage
Reliability e Low Improved High
Energy Efficiency f 98% 98% >98%
Total Capital Investment ($M) (based on 200,000 kg of H2/day) g $15 $12 $9
Maintenance (% of Total Capital Investment) 10% 7% 3%
Contamination h Varies by design None
Multi-Year Research, Development and Demonstration Plan Page 3.2 - 13
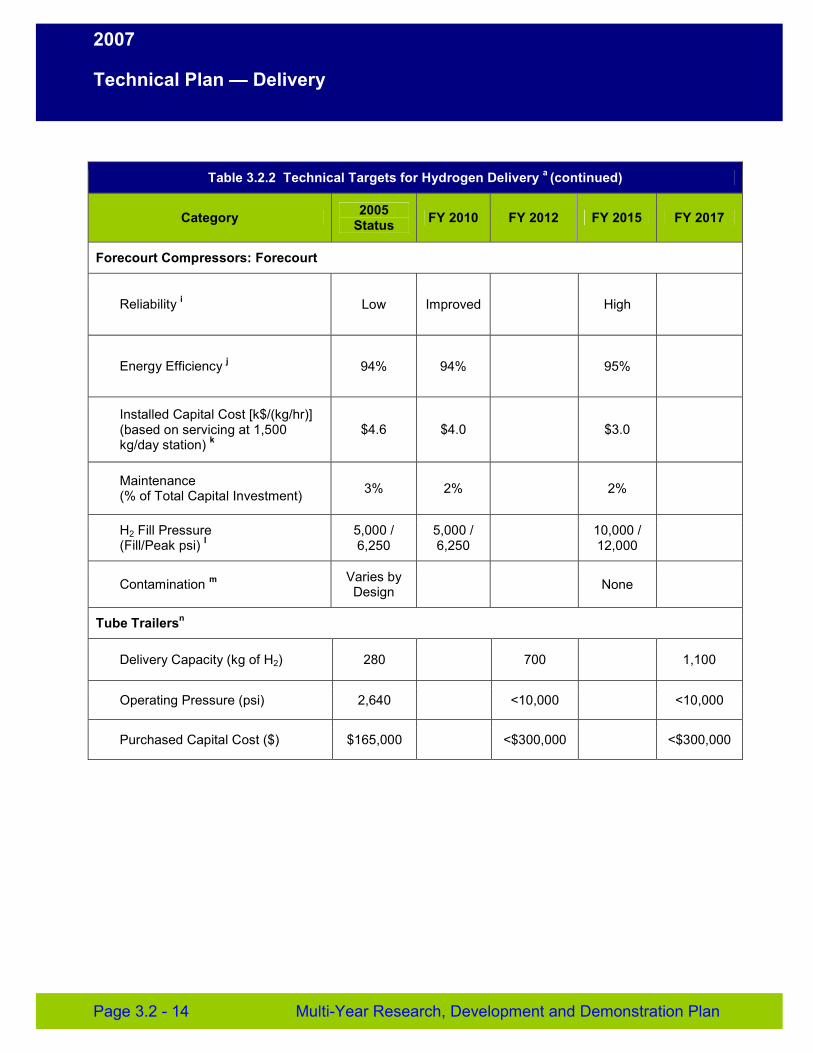
2007
Technical Plan — Delivery
Table 3.2.2 Technical Targets for Hydrogen Delivery a (continued)
Category 2005 Status FY 2010 FY 2012 FY 2015 FY 2017
Forecourt Compressors: Forecourt
Reliability i Low Improved High
Energy Efficiency j 94% 94% 95%
Installed Capital Cost [k$/(kg/hr)] (based on servicing at 1,500 kg/day station) k
$4.6 $4.0 $3.0
Maintenance (% of Total Capital Investment) 3% 2% 2%
H2 Fill Pressure (Fill/Peak psi) l
5,000 / 6,250
5,000 / 6,250
10,000 / 12,000
Contamination m Varies by Design None
Tube Trailersn
Delivery Capacity (kg of H2) 280 700 1,100
Operating Pressure (psi) 2,640 <10,000 <10,000
Purchased Capital Cost ($) $165,000 <$300,000 <$300,000
Page 3.2 - 14 Multi-Year Research, Development and Demonstration Plan
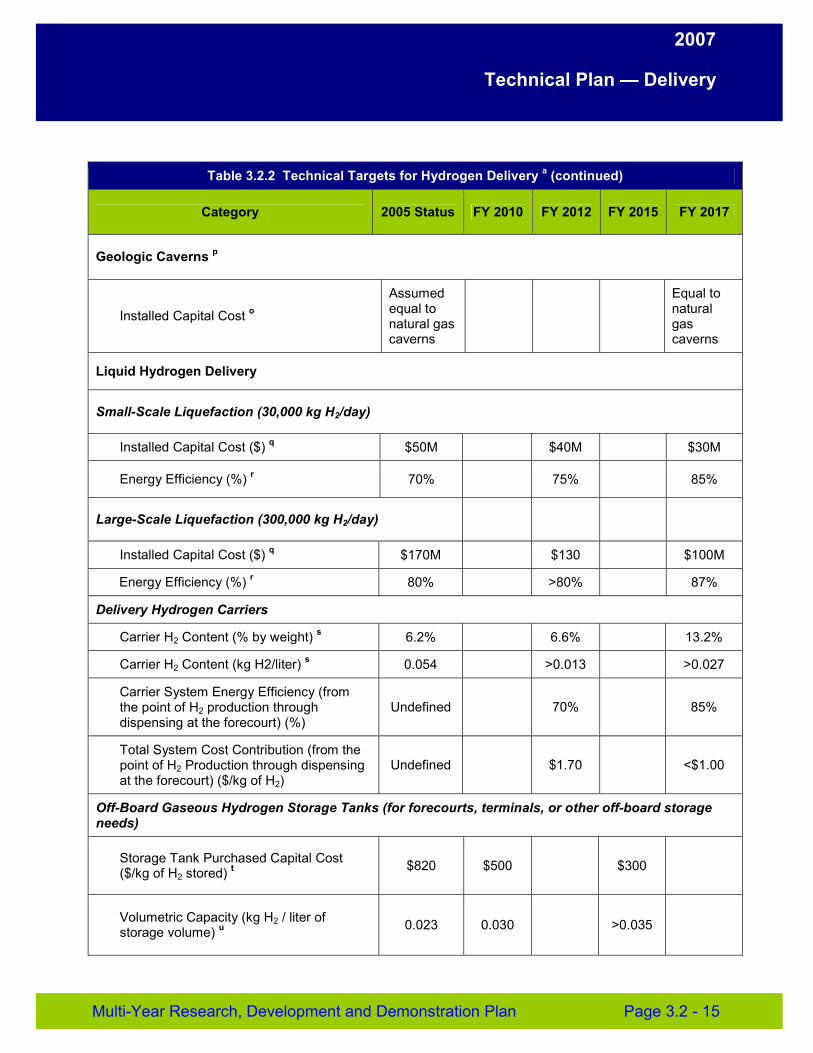
2007
Technical Plan — Delivery
Table 3.2.2 Technical Targets for Hydrogen Delivery a (continued)
Category 2005 Status FY 2010 FY 2012 FY 2015 FY 2017
Geologic Caverns p
Installed Capital Cost o
Assumed equal to natural gas caverns
Equal to natural gas caverns
Liquid Hydrogen Delivery
Small-Scale Liquefaction (30,000 kg H2/day)
Installed Capital Cost ($) q $50M $40M $30M
Energy Efficiency (%) r 70% 75% 85%
Large-Scale Liquefaction (300,000 kg H2/day)
Installed Capital Cost ($) q $170M $130 $100M
Energy Efficiency (%) r 80% >80% 87%
Delivery Hydrogen Carriers
Carrier H2 Content (% by weight) s 6.2% 6.6% 13.2%
Carrier H2 Content (kg H2/liter) s 0.054 >0.013 >0.027
Carrier System Energy Efficiency (from the point of H2 production through dispensing at the forecourt) (%)
Undefined 70% 85%
Total System Cost Contribution (from the point of H2 Production through dispensing at the forecourt) ($/kg of H2)
Undefined $1.70 <$1.00
Off-Board Gaseous Hydrogen Storage Tanks (for forecourts, terminals, or other off-board storage needs)
Storage Tank Purchased Capital Cost ($/kg of H2 stored) t $820 $500 $300
Volumetric Capacity (kg H2 / liter of storage volume) u 0.023 0.030 >0.035
Multi-Year Research, Development and Demonstration Plan Page 3.2 - 15
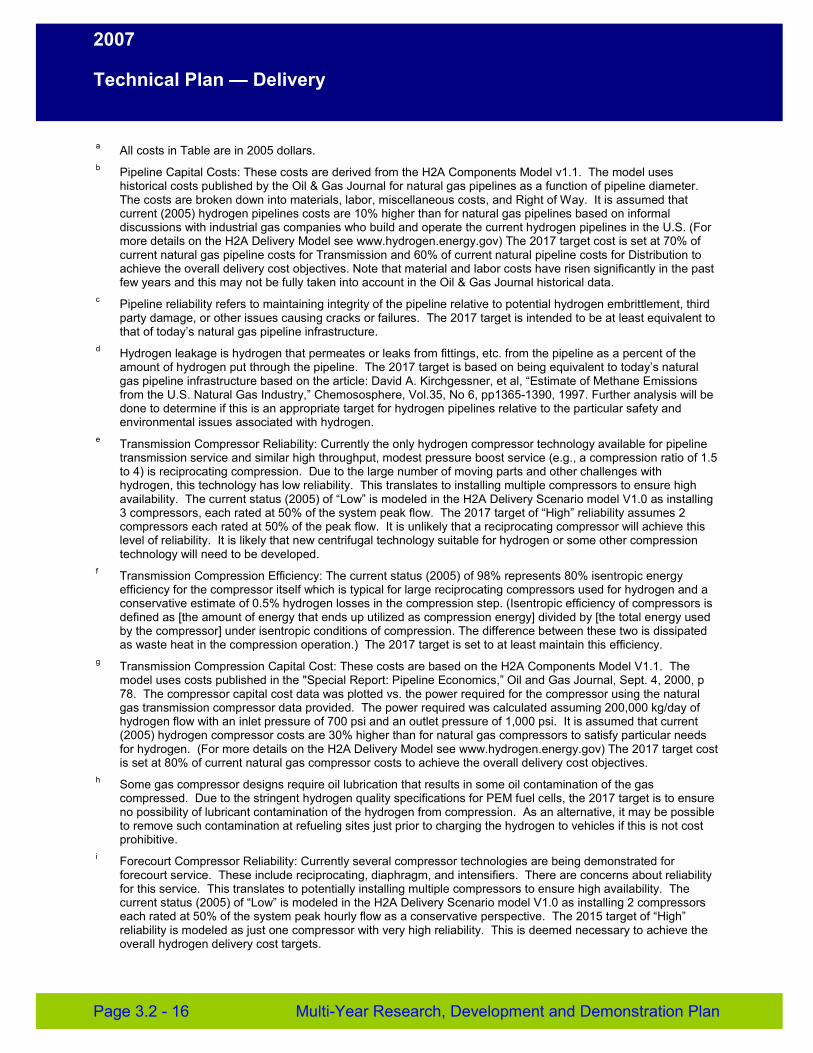
2007
Technical Plan — Delivery
a All costs in Table are in 2005 dollars. b Pipeline Capital Costs: These costs are derived from the H2A Components Model v1.1. The model uses
historical costs published by the Oil & Gas Journal for natural gas pipelines as a function of pipeline diameter. The costs are broken down into materials, labor, miscellaneous costs, and Right of Way. It is assumed that current (2005) hydrogen pipelines costs are 10% higher than for natural gas pipelines based on informal discussions with industrial gas companies who build and operate the current hydrogen pipelines in the U.S. (For more details on the H2A Delivery Model see www.hydrogen.energy.gov) The 2017 target cost is set at 70% of current natural gas pipeline costs for Transmission and 60% of current natural pipeline costs for Distribution to achieve the overall delivery cost objectives. Note that material and labor costs have risen significantly in the past few years and this may not be fully taken into account in the Oil & Gas Journal historical data.
c Pipeline reliability refers to maintaining integrity of the pipeline relative to potential hydrogen embrittlement, third party damage, or other issues causing cracks or failures. The 2017 target is intended to be at least equivalent to that of today’s natural gas pipeline infrastructure.
d Hydrogen leakage is hydrogen that permeates or leaks from fittings, etc. from the pipeline as a percent of the amount of hydrogen put through the pipeline. The 2017 target is based on being equivalent to today’s natural gas pipeline infrastructure based on the article: David A. Kirchgessner, et al, “Estimate of Methane Emissions from the U.S. Natural Gas Industry,” Chemososphere, Vol.35, No 6, pp1365-1390, 1997. Further analysis will be done to determine if this is an appropriate target for hydrogen pipelines relative to the particular safety and environmental issues associated with hydrogen.
e Transmission Compressor Reliability: Currently the only hydrogen compressor technology available for pipeline transmission service and similar high throughput, modest pressure boost service (e.g., a compression ratio of 1.5 to 4) is reciprocating compression. Due to the large number of moving parts and other challenges with hydrogen, this technology has low reliability. This translates to installing multiple compressors to ensure high availability. The current status (2005) of “Low” is modeled in the H2A Delivery Scenario model V1.0 as installing 3 compressors, each rated at 50% of the system peak flow. The 2017 target of “High” reliability assumes 2 compressors each rated at 50% of the peak flow. It is unlikely that a reciprocating compressor will achieve this level of reliability. It is likely that new centrifugal technology suitable for hydrogen or some other compression technology will need to be developed.
f Transmission Compression Efficiency: The current status (2005) of 98% represents 80% isentropic energy efficiency for the compressor itself which is typical for large reciprocating compressors used for hydrogen and a conservative estimate of 0.5% hydrogen losses in the compression step. (Isentropic efficiency of compressors is defined as [the amount of energy that ends up utilized as compression energy] divided by [the total energy used by the compressor] under isentropic conditions of compression. The difference between these two is dissipated as waste heat in the compression operation.) The 2017 target is set to at least maintain this efficiency.
g Transmission Compression Capital Cost: These costs are based on the H2A Components Model V1.1. The model uses costs published in the "Special Report: Pipeline Economics,” Oil and Gas Journal, Sept. 4, 2000, p 78. The compressor capital cost data was plotted vs. the power required for the compressor using the natural gas transmission compressor data provided. The power required was calculated assuming 200,000 kg/day of hydrogen flow with an inlet pressure of 700 psi and an outlet pressure of 1,000 psi. It is assumed that current (2005) hydrogen compressor costs are 30% higher than for natural gas compressors to satisfy particular needs for hydrogen. (For more details on the H2A Delivery Model see www.hydrogen.energy.gov) The 2017 target cost is set at 80% of current natural gas compressor costs to achieve the overall delivery cost objectives.
h Some gas compressor designs require oil lubrication that results in some oil contamination of the gas compressed. Due to the stringent hydrogen quality specifications for PEM fuel cells, the 2017 target is to ensure no possibility of lubricant contamination of the hydrogen from compression. As an alternative, it may be possible to remove such contamination at refueling sites just prior to charging the hydrogen to vehicles if this is not cost prohibitive.
i Forecourt Compressor Reliability: Currently several compressor technologies are being demonstrated for forecourt service. These include reciprocating, diaphragm, and intensifiers. There are concerns about reliability for this service. This translates to potentially installing multiple compressors to ensure high availability. The current status (2005) of “Low” is modeled in the H2A Delivery Scenario model V1.0 as installing 2 compressors each rated at 50% of the system peak hourly flow as a conservative perspective. The 2015 target of “High” reliability is modeled as just one compressor with very high reliability. This is deemed necessary to achieve the overall hydrogen delivery cost targets.
Page 3.2 - 16 Multi-Year Research, Development and Demonstration Plan
2007
Technical Plan — Delivery
j Forecourt Compression Efficiency: Hydrogen energy efficiency is defined as [the hydrogen energy (LHV) out] divided by [the sum of the hydrogen energy in (LHV) plus all other energy needed for the operation of the process]. The current status (2005) of 94% represents 65% isentropic energy efficiency for the compressor itself, which is typical for the size of hydrogen forecourt compressors, and a conservative estimate of 0.5% hydrogen losses in the compression step. (Isentropic efficiency of compressors is defined as [the amount of energy that ends up utilized as compression energy] divided by [the total energy used by the compressor] under isentropic conditions of compression. The difference between these two is dissipated as waste heat in the compression operation.) The 2015 target represents new technology to increase the compressor isentropic energy efficiency to 80%.
k Forecourt Compressor Installed Capital Cost: These costs are based on the H2A Components Model V1.1. The model uses a cost of $4,600 per kg/hr of hydrogen flow for a 1500 kg/day Forecourt compressor based on quotes from vendors for compression from 300 psi to 6250 psi for 5000 psi vehicle fills. (For more details on the H2A Delivery Model see www.hydrogen.energy.gov) The 2015 target cost is set to achieve the overall delivery cost objectives.
L Forecourt Hydrogen Fill Pressure: Most current prototype hydrogen fuel cell vehicles are equipped with hydrogen gas storage tanks rated for 5,000 psi fills with estimated peak filling pressures during filling of 6,250 psi. Technology is being developed and tested for vehicle gas storage tanks rated for 10,000 psi fills with estimated peak filling pressures during filling of 12,000 psi. The long term goal of the DOE is to develop solid or liquid carrier systems for vehicle storage tanks that will allow for at least 300 miles between refueling with low pressure storage (<2,000 psi). The DOE has set targets that include 5,000 psi fills in 2005 and 10,000 psi fills in 2015 to allow for the introduction of hydrogen fuel cell vehicles with high pressure vehicle gas storage technology prior to achieving commercialization of the ultimate goal of low pressure vehicle storage technology utilizing carriers.
m Forecourt Compressor Contamination: Some gas compressor designs require oil lubrication that results in some oil contamination of the gas compressed. Due to the stringent hydrogen quality specifications for PEM fuel cells, the 2015 target is to ensure no possibility of lubricant contamination of the hydrogen from compression.
n Tube Trailers: The current (2005) tube trailer characteristics and costs are based on the H2A Components Model V1.1 which uses available information on tube trailers. (For more details on the H2A Delivery Model see www.hydrogen.energy.gov) The 2017 targets are set to achieve the overall delivery cost objectives. There are several possible technology approaches to achieve these 2017 targets. It may be possible to develop composite structures to increase the working pressure of gaseous tube trailers. Another approach would be to utilize solid carrier technology and/or to employ low temperature hydrogen gas. It may also be possible to utilize some combination of these approaches.
o Geologic Cavern Capital Costs: Based on information from the one U.S. hydrogen geologic storage site in Texas; and it is assumed that hydrogen geologic caverns have the same capital cost as natural gas caverns. However, this is very limited information and is for a salt dome cavern only. This capital cost target is simply stating that hydrogen geologic storage capital costs need to be about the same as current natural gas geologic storage to make geologic storage of hydrogen cost effective and to enable achieving the overall delivery cost objectives.
p Geologic Cavern Capacity Availability: Transportation vehicle fuel demand is significantly higher in the summer than in the winter. To handle this demand surge in the summer without building prohibitively expensive excess production capacity, there will need to be hydrogen storage capacity within the hydrogen delivery system. Geologic storage is a very cost effective storage method for these types of demand swings and is used very effectively for similar demand swings for natural gas. There are only two currently operating geologic storage sites for hydrogen in the world (one in Texas and one in Teeside, England). Greater knowledge needs to be developed on the availability and suitability of hydrogen geologic storage sites. Technology development may also be required to ensure suitability for hydrogen. More information and modeling is required to quantify the amount of hydrogen geologic storage that will be needed.
q Liquefaction Installed Capital: The current (2005) costs are based on the H2A Components Model V1.1. The 2017 target cost is set to achieve the overall delivery cost objectives.
r Liquefaction Energy Efficiency: Hydrogen energy efficiency is defined as [the hydrogen energy (LHV) out] divided by [the sum of the hydrogen energy in (LHV) plus all other energy needed for the operation of the process]. The current (2005) energy efficiencies are based on the H2A Components Model V1.1. The 2017 efficiency target is set to achieve the overall delivery cost objectives.
Multi-Year Research, Development and Demonstration Plan Page 3.2 - 17
2007
Technical Plan — Delivery
s The 2005 status values are based on a liquid hydrocarbon carrier currently under development by Air Products. The 2010 hydrogen content targets are based on transporting 1500 kg of hydrogen in a truck. Although regulations vary to some degree by state, a typical truck is limited to carrying 25,000 kg of load (36,400 kg total loaded weight including the trailer) and/or 113,000 liters of volume. The minimum hydrogen content (% by weight and kg H2/liter) to achieve 1500 kg of hydrogen on the truck is determined by these maximum loads allowable. Trucking costs with this hydrogen payload are such that this transport option would seem attractive relative to the delivery cost objectives. A typical refueling station of 1500 kg/day of hydrogen servicing hydrogen fuel cell vehicles would service the same number of vehicles as typical gasoline stations serve today (about 200 vehicles per day). This delivery option would require one truck delivery per day which is also typical of today’s gasoline stations. The 2017 targets are calculated in the same way but assuming 3000 kg per truck load so that the one truck could service two refueling stations. The total cost and attractiveness of this delivery option would depend on the cost of the total carrier delivery system including the cost of discharging the hydrogen at the refueling station and any carrier regeneration costs. (Note that although the current status for hydrogen content on a volume basis exceeds the 2017 targets, all of the carrier targets must be met simultaneously for a carrier system to be a cost effective and energy efficient delivery pathway.)
t Storage Tank Capital Cost: These costs are based on the H2A Components Model V1.1. The model uses a current cost of $820 per kg of hydrogen stored for a 1,500 kg/day Forecourt station. This is based on quotes from vendors for steel tanks capable of 6,250 psi working pressure. The 2015 target cost is set to achieve the overall delivery cost objectives.
u Forecourt Storage Volumetric Capacity: The 2005 value is based on the specific volume of hydrogen at room temperature and 6,250 psi. The 2015 target is based on the specific volume of hydrogen at room temperature and approximately 12,000 psi. Off-board storage tank technology could use carriers as opposed to or in addition to compressed hydrogen as a means to store hydrogen. The most important target is system capital cost. However, the footprint for the storage must also be taken into consideration where space is limited such as at forecourts. For this reason, it is assumed that the hydrogen volumetric content of the storage volume should be at least as high as for 10,000 psi hydrogen gas.
Barriers
A. Lack of Hydrogen/Carrier and Infrastructure Options Analysis
Options and trade-offs for hydrogen/carrier delivery from central and semi-central production to the point of use are not completely understood. Distributed production of hydrogen is another option. Additional analysis is needed to better understand the advantages and disadvantages of the various possible approaches. Many site-specific and regional issues are associated with integrating production and use of hydrogen. Production and delivery systems need to be integrated to minimize life cycle cost, energy use, and environmental impacts and take full advantage of local resources and situations.
B. Reliability and Costs of Hydrogen Compression
Compression of natural gas is a well-developed technology. The hydrogen molecule is much smaller than methane, which creates significant challenges for compression. Current compression technology used for hydrogen is unreliable, resulting in the need for redundant compressors and thus higher cost. Centrifugal compression is the lowest cost approach for pipeline compression needs but the current technology does not work with hydrogen. Lubricants used in normal compression applications can result in unacceptable contamination of hydrogen for PEM fuel cell use. If high-pressure (5,000 -10,000 psi) on-board hydrogen storage is used for vehicles, this also adds to the compression technology needs for hydrogen. More reliable, lower-cost, and more efficient compression technologies for pipelines, storage and refueling sites are needed.
Page 3.2 - 18 Multi-Year Research, Development and Demonstration Plan
2007
Technical Plan — Delivery
C. High Cost and Low Energy Efficiency of Hydrogen Liquefaction
Cryogenic liquid hydrogen has a much higher volumetric energy density than gaseous hydrogen. As a result, in the absence of a hydrogen pipeline infrastructure, transporting liquid hydrogen by cryogenic tank truck is significantly less costly than transporting compressed hydrogen by gaseous tube trailer. However, the cost of the liquefaction step adds very significantly to the cost of delivered hydrogen. In addition, liquefaction is very energy intensive and inefficient (see Table 3.2.2). Improved liquefaction technology is needed. Possibilities include increasing the scale of these operations and improving heat integration; integrating these operations with hydrogen production, power production, or other operations for improved heat integration and energy efficiency; and completely new liquefaction technologies such as magnetic or acoustic liquefaction or other approaches. In addition, hydrogen boil-off from cryogenic liquid storage tanks and tank trucks needs to be addressed and minimized or eliminated for improved cost and energy efficiency.
D. High Capital Cost and Hydrogen Embrittlement of Pipelines
Existing hydrogen pipelines are very limited and not adequate to broadly distribute hydrogen. Labor, materials, and other associated costs result in a large capital investment for new pipelines. Land acquisition or Right of Way can also be very costly. Hydrogen embrittlement of steel is not completely understood. Current joining technology for steel pipes is a major part of the labor costs and impacts the steel microstructure in a manner that can exacerbate hydrogen embrittlement issues. The use of composite pipelines recently introduced for natural gas for gathering at well heads is a route worth exploring to solve these issues. Hydrogen leakage through the pipe itself, as well as through valves, fittings, and seals is much more problematic than for natural gas due to the very small size of hydrogen molecules. Research is needed to determine suitable steels, and/or coatings, or other materials of construction to provide safe and reliable transport of hydrogen in pipelines while reducing the capital costs. Development of innovative materials and technologies (seals, components, sensors, and safety and control systems) is needed. Approaches for using existing natural gas pipelines to transport mixtures of natural gas and hydrogen without hydrogen embrittlement and leakage will be explored. Technologies for low cost separation and purification of hydrogen from natural gas would need to be developed for this approach to hydrogen delivery. The possibility of utilizing or upgrading natural gas or petroleum pipelines for pure hydrogen use also needs to be examined.
E. Low Cost, High Capacity Solid and Liquid Hydrogen Carrier Systems
Novel solid or liquid carriers that can release hydrogen without significant processing operations are possible options for hydrogen transport or for use in stationary bulk storage. Current solid and liquid hydrogen carrier technologies have high costs, insufficient energy density, and/or poor hydrogen release and regeneration characteristics. Substantial improvements in current technologies or new technologies are needed.
Multi-Year Research, Development and Demonstration Plan Page 3.2 - 19
2007
Technical Plan — Delivery
F. Gaseous Hydrogen Storage and Tube Trailer Delivery Costs
Gaseous hydrogen storage at production facilities, refueling stations, and other points of end use, and for system surge capacity for pipelines, and trucks at terminals, adds cost to the delivery infrastructure. Understanding and minimizing the need for this storage, while not adversely impacting the market daily and seasonal hydrogen demand cycles, will be important to minimizing these costs. Lower cost technologies to satisfy these storage requirements will also reduce overall delivery costs. Hydrogen storage costs could be reduced by developing technology to increase the amount of gaseous hydrogen stored per unit volume while maintaining reasonable storage system capital costs. Approaches include increasing the storage pressure, utilizing cold hydrogen gas, and/or utilizing a solid carrier material in the storage vessel. The same technology approaches could be utilized for gaseous tube trailers making them much more attractive for hydrogen transport and distribution.
G. Storage Tank Materials and Costs
Stationary bulk storage and tube trailer tanks are relatively costly. Steel tanks can be impacted by hydrogen embrittlement, as discussed in Barrier D. This can be exacerbated by pressure cycling. Research into improved yet lower cost steels, the potential use of coatings, and fiber or other composite structures is needed. Costs might also be reduced through the use of Design for Manufacture and Assembly (DFMA) and improved manufacturing technology for high volume production of many identical storage units.
H. Geologic Storage
The feasibility of extensive geologic hydrogen storage needs to be addressed. There are currently two hydrogen geologic storage sites, one in Texas and one in England. Novel approaches may be needed to deal with the higher diffusivity and potentially higher reactivity of hydrogen as compared to natural gas. Identification of geologic structures with particularly promising permeability characteristics may be needed. Potential hydrogen contamination and environmental impacts need to be investigated.
I. Hydrogen Leakage and Sensors
The hydrogen molecule is small and diffuses more rapidly compared with other gases such as natural gas. This makes it more challenging to design equipment, materials, seals, valves, and fittings to avoid hydrogen leakage. Current industrial hydrogen operations are monitored and maintained by skilled people. The delivery infrastructure for hydrogen use as a major energy carrier will need to rely heavily on sensors and robust designs and engineering. Low cost hydrogen leak detector sensors are needed. Specific hydrogen leak detectors will be developed as part of the Safety Program element (see Section 3.8). Suitable odorant technology for hydrogen leak detection may also be needed for hydrogen distribution pipelines. The odorant would need to be completely miscible with hydrogen gas and be easily removed or non-harmful to on-board storage systems and vehicle fuel cells. Use and further development of mechanical integrity sensors that can be built into pipelines and vessels could provide additional protection against mechanical failures that might be caused by third-party damage or other potential mechanical failures.
Page 3.2 - 20 Multi-Year Research, Development and Demonstration Plan

2007
Technical Plan — Delivery
J. Other Refueling Site/Terminal Operations
Other potential operations at refueling sites and terminals need to be low cost and energy efficient. Hydrogen cooling may be required for cold stationary or on-board vehicle storage, for high pressure vehicle fills (10,000 psi), or for thermal management during charging material based on-board storage systems. Final purification may be required at refueling sites. Other systems may be needed for handling particular two-way carrier technologies being explored for on-board vehicle storage. (See Section 3.3.)
K. Safety, Codes and Standards, Permitting
Appropriate codes and standards are needed to ensure a reliable and safe hydrogen delivery infrastructure. Some of the hydrogen delivery elements such as tube trailers and cryogenic liquid hydrogen trucks are in commerce today. Others are not, such as an extensive pipeline infrastructure for transmission and distribution and terminal operations. Applicable codes and standards are needed to facilitate provision for off-board storage at refueling stations and upstream in the hydrogen supply chain. Sighting and permitting hurdles need to be overcome. The plan to address these issues is in the Codes and Standards section (Section 3.7).
Multi-Year Research, Development and Demonstration Plan Page 3.2 - 21
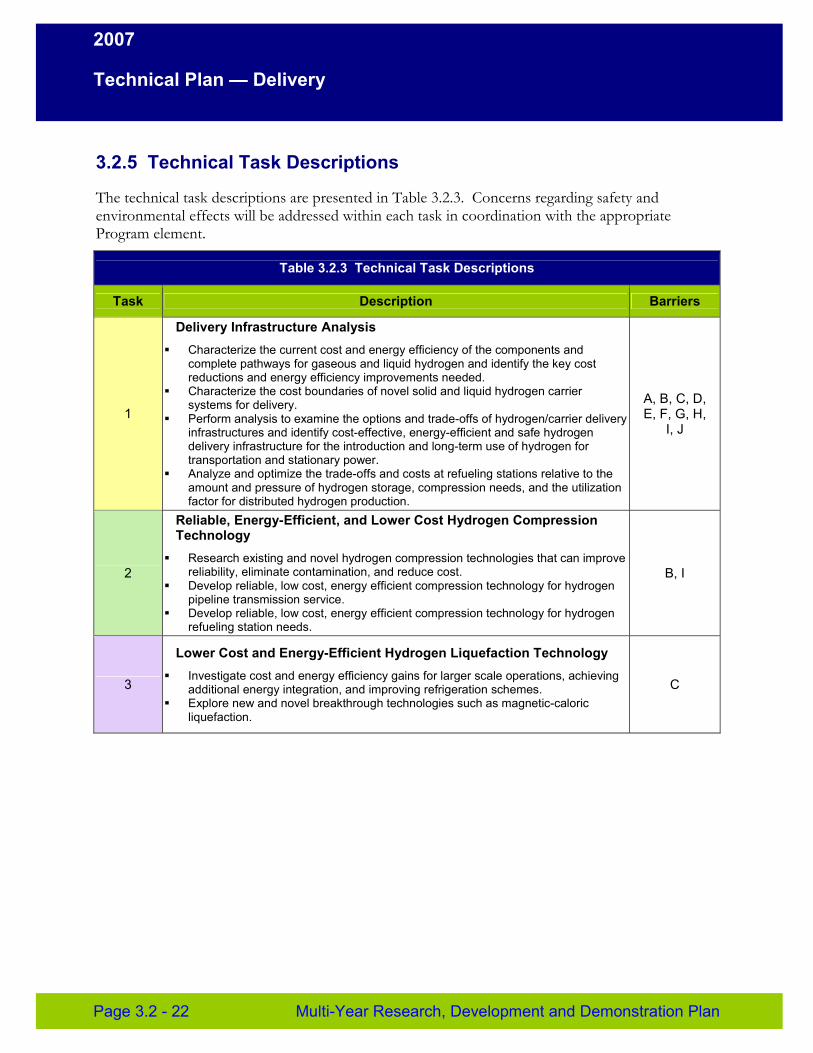
2007
Technical Plan — Delivery
3.2.5 Technical Task Descriptions
The technical task descriptions are presented in Table 3.2.3. Concerns regarding safety and environmental effects will be addressed within each task in coordination with the appropriate Program element.
Table 3.2.3 Technical Task Descriptions
Task Description Barriers
1
Delivery Infrastructure Analysis � Characterize the current cost and energy efficiency of the components and
complete pathways for gaseous and liquid hydrogen and identify the key cost reductions and energy efficiency improvements needed.
� Characterize the cost boundaries of novel solid and liquid hydrogen carrier systems for delivery.
� Perform analysis to examine the options and trade-offs of hydrogen/carrier delivery infrastructures and identify cost-effective, energy-efficient and safe hydrogen delivery infrastructure for the introduction and long-term use of hydrogen for transportation and stationary power.
� Analyze and optimize the trade-offs and costs at refueling stations relative to the amount and pressure of hydrogen storage, compression needs, and the utilization factor for distributed hydrogen production.
A, B, C, D, E, F, G, H,
I, J
2
Reliable, Energy-Efficient, and Lower Cost Hydrogen Compression Technology � Research existing and novel hydrogen compression technologies that can improve
reliability, eliminate contamination, and reduce cost. � Develop reliable, low cost, energy efficient compression technology for hydrogen
pipeline transmission service. � Develop reliable, low cost, energy efficient compression technology for hydrogen
refueling station needs.
B, I
3
Lower Cost and Energy-Efficient Hydrogen Liquefaction Technology � Investigate cost and energy efficiency gains for larger scale operations, achieving
additional energy integration, and improving refrigeration schemes. � Explore new and novel breakthrough technologies such as magnetic-caloric
liquefaction.
C
Page 3.2 - 22 Multi-Year Research, Development and Demonstration Plan
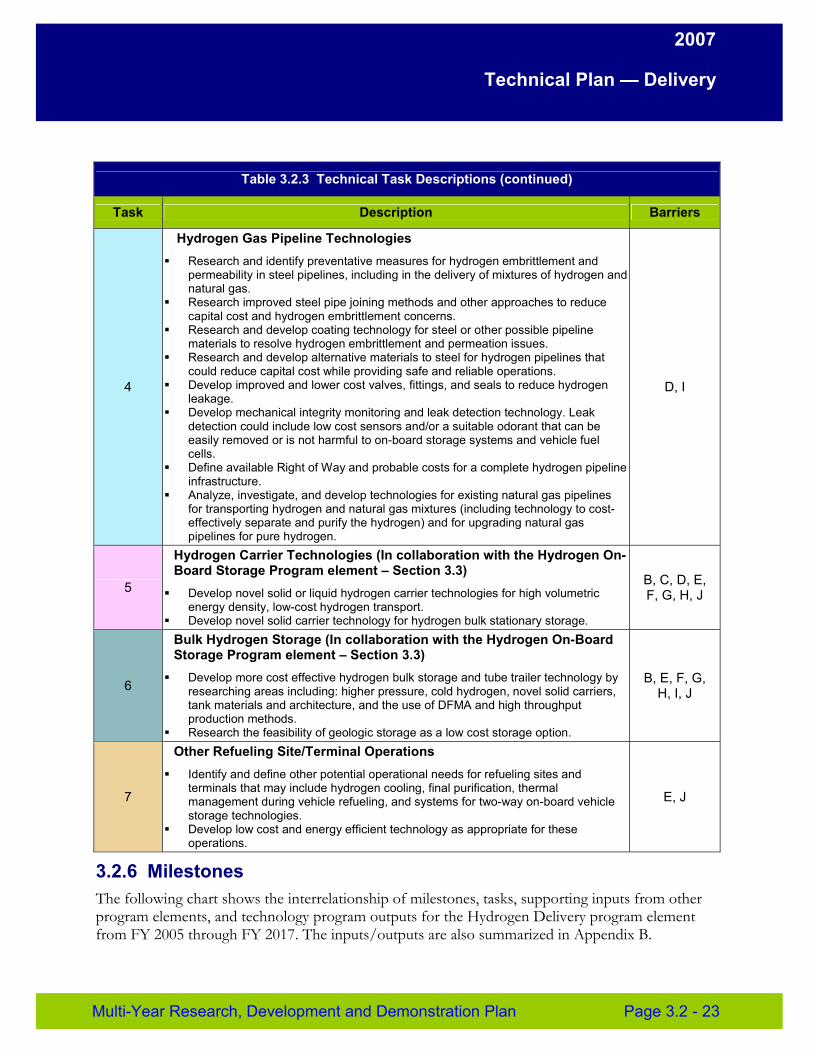
2007
Technical Plan — Delivery
Task
Table 3.2.3 Technical Task Descriptions (continued)
Description Barriers
4
Hydrogen Gas Pipeline Technologies � Research and identify preventative measures for hydrogen embrittlement and
permeability in steel pipelines, including in the delivery of mixtures of hydrogen and natural gas.
� Research improved steel pipe joining methods and other approaches to reduce capital cost and hydrogen embrittlement concerns.
� Research and develop coating technology for steel or other possible pipeline materials to resolve hydrogen embrittlement and permeation issues.
� Research and develop alternative materials to steel for hydrogen pipelines that could reduce capital cost while providing safe and reliable operations.
� Develop improved and lower cost valves, fittings, and seals to reduce hydrogen leakage.
� Develop mechanical integrity monitoring and leak detection technology. Leak detection could include low cost sensors and/or a suitable odorant that can be easily removed or is not harmful to on-board storage systems and vehicle fuel cells.
� Define available Right of Way and probable costs for a complete hydrogen pipeline infrastructure.
� Analyze, investigate, and develop technologies for existing natural gas pipelines for transporting hydrogen and natural gas mixtures (including technology to cost-effectively separate and purify the hydrogen) and for upgrading natural gas pipelines for pure hydrogen.
D, I
5
Hydrogen Carrier Technologies (In collaboration with the Hydrogen On-Board Storage Program element – Section 3.3) � Develop novel solid or liquid hydrogen carrier technologies for high volumetric
energy density, low-cost hydrogen transport. � Develop novel solid carrier technology for hydrogen bulk stationary storage.
B, C, D, E, F, G, H, J
6
Bulk Hydrogen Storage (In collaboration with the Hydrogen On-Board Storage Program element – Section 3.3) � Develop more cost effective hydrogen bulk storage and tube trailer technology by
researching areas including: higher pressure, cold hydrogen, novel solid carriers, tank materials and architecture, and the use of DFMA and high throughput production methods.
� Research the feasibility of geologic storage as a low cost storage option.
B, E, F, G, H, I, J
7
Other Refueling Site/Terminal Operations � Identify and define other potential operational needs for refueling sites and
terminals that may include hydrogen cooling, final purification, thermal management during vehicle refueling, and systems for two-way on-board vehicle storage technologies.
� Develop low cost and energy efficient technology as appropriate for these operations.
E, J
3.2.6 Milestones The following chart shows the interrelationship of milestones, tasks, supporting inputs from other program elements, and technology program outputs for the Hydrogen Delivery program element from FY 2005 through FY 2017. The inputs/outputs are also summarized in Appendix B.
Multi-Year Research, Development and Demonstration Plan Page 3.2 - 23
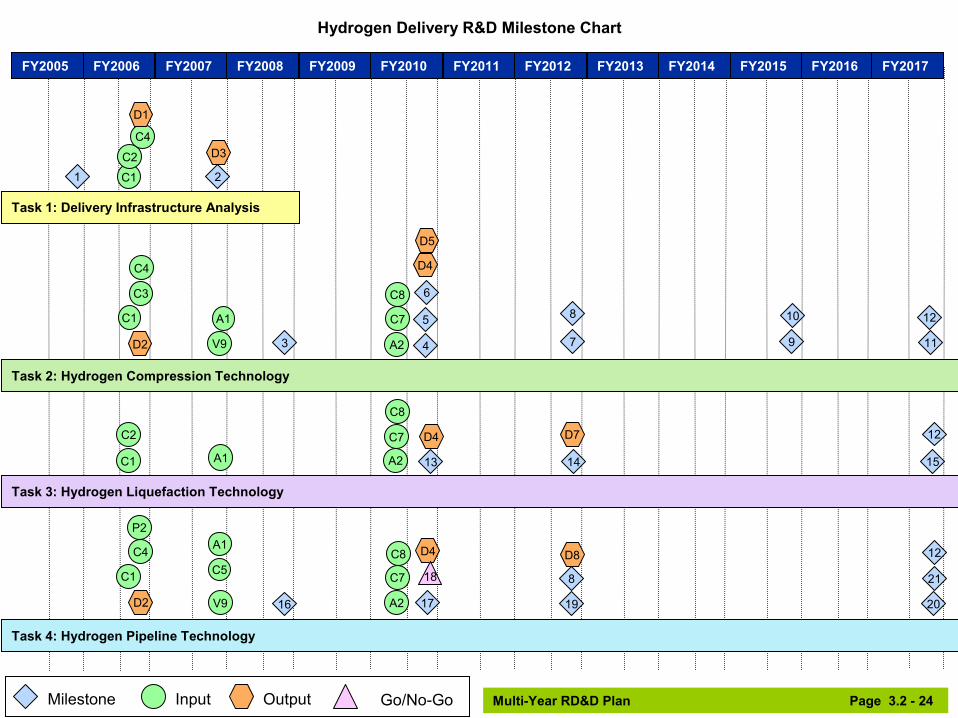
Hydrogen Delivery R&D Milestone Chart
Milestone Input Output Go/No-Go
FY2005 FY2006 FY2007 FY2008 FY2009 FY2010 FY2011 FY2012 FY2013 FY2014 FY2015 FY2016 FY2017
Task 1: Delivery Infrastructure Analysis
1 2
3
Task 2: Hydrogen Compression Technology
4
5
6
7
8
9
10
11
12
Task 3: Hydrogen Liquefaction Technology
13 14 15
12
Task 4: Hydrogen Pipeline Technology
16 17 19
8
20
21
12
D2
D2
D3
D4
D4
D4
D5
D7
D8
C1
C1
C1
C1
C2
C2
C3
C4
C4
C4
A1
A1
A1
V9
V9
A2
A2
A2
C7
C7
C7
C8
C8 C8
P2
C5
D1
18
Multi-Year RD&D Plan Page 3.2 - 24
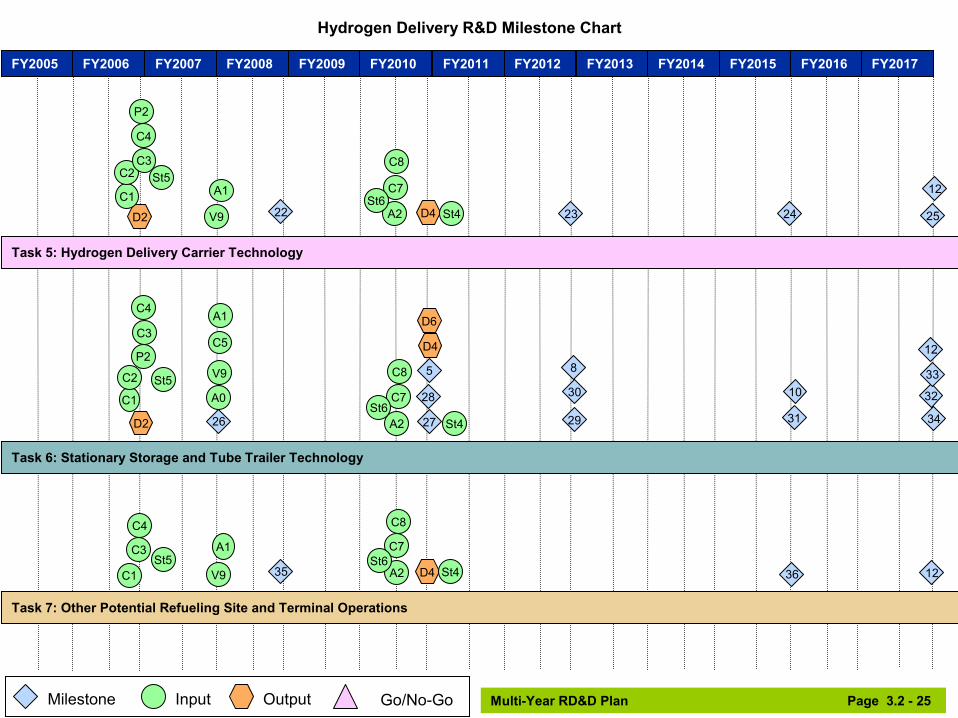
Hydrogen Delivery R&D Milestone Chart
FY2005 FY2006 FY2007 FY2008 FY2009 FY2010 FY2011 FY2012 FY2013 FY2014 FY2015 FY2016 FY2017
Task 6: Stationary Storage and Tube Trailer Technology
26 27
28
5
29
30 8
31
10 32
33
12
34
Task 7: Other Potential Refueling Site and Terminal Operations
35 36 12
D2
Task 5: Hydrogen Delivery Carrier Technology
22 23 24 25
12
D2 D4
D4
D4
D6
C1
C1
C1
C2
C2
P2
C3
C3
C3
C4
C4
C4
A1
A1
A1
A0
V9
V9
V9
A2
A2
A2
C7
C7 C7
C8
C8
C8
P2
C5
St4
St4
St4
St5
St5
St5
St6
St6 St6
Milestone Input Output Go/No-Go Multi-Year RD&D Plan Page 3.2 - 25
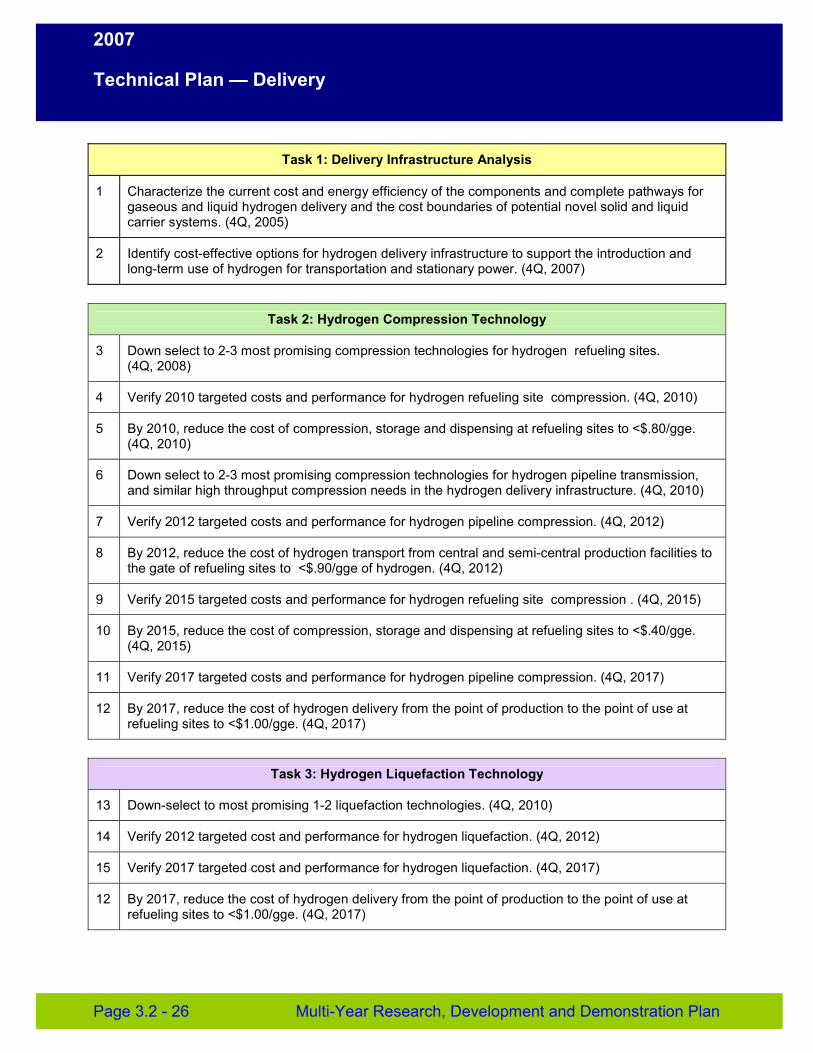
2007
Technical Plan — Delivery
Task 1: Delivery Infrastructure Analysis
1 Characterize the current cost and energy efficiency of the components and complete pathways for gaseous and liquid hydrogen delivery and the cost boundaries of potential novel solid and liquid carrier systems. (4Q, 2005)
2 Identify cost-effective options for hydrogen delivery infrastructure to support the introduction and long-term use of hydrogen for transportation and stationary power. (4Q, 2007)
Task 2: Hydrogen Compression Technology
3 Down select to 2-3 most promising compression technologies for hydrogen refueling sites. (4Q, 2008)
4 Verify 2010 targeted costs and performance for hydrogen refueling site compression. (4Q, 2010)
5 By 2010, reduce the cost of compression, storage and dispensing at refueling sites to <$.80/gge. (4Q, 2010)
6 Down select to 2-3 most promising compression technologies for hydrogen pipeline transmission, and similar high throughput compression needs in the hydrogen delivery infrastructure. (4Q, 2010)
7 Verify 2012 targeted costs and performance for hydrogen pipeline compression. (4Q, 2012)
8 By 2012, reduce the cost of hydrogen transport from central and semi-central production facilities to the gate of refueling sites to <$.90/gge of hydrogen. (4Q, 2012)
9 Verify 2015 targeted costs and performance for hydrogen refueling site compression . (4Q, 2015)
10 By 2015, reduce the cost of compression, storage and dispensing at refueling sites to <$.40/gge. (4Q, 2015)
11 Verify 2017 targeted costs and performance for hydrogen pipeline compression. (4Q, 2017)
12 By 2017, reduce the cost of hydrogen delivery from the point of production to the point of use at refueling sites to <$1.00/gge. (4Q, 2017)
Task 3: Hydrogen Liquefaction Technology
13 Down-select to most promising 1-2 liquefaction technologies. (4Q, 2010)
14 Verify 2012 targeted cost and performance for hydrogen liquefaction. (4Q, 2012)
15 Verify 2017 targeted cost and performance for hydrogen liquefaction. (4Q, 2017)
12 By 2017, reduce the cost of hydrogen delivery from the point of production to the point of use at refueling sites to <$1.00/gge. (4Q, 2017)
Page 3.2 - 26 Multi-Year Research, Development and Demonstration Plan
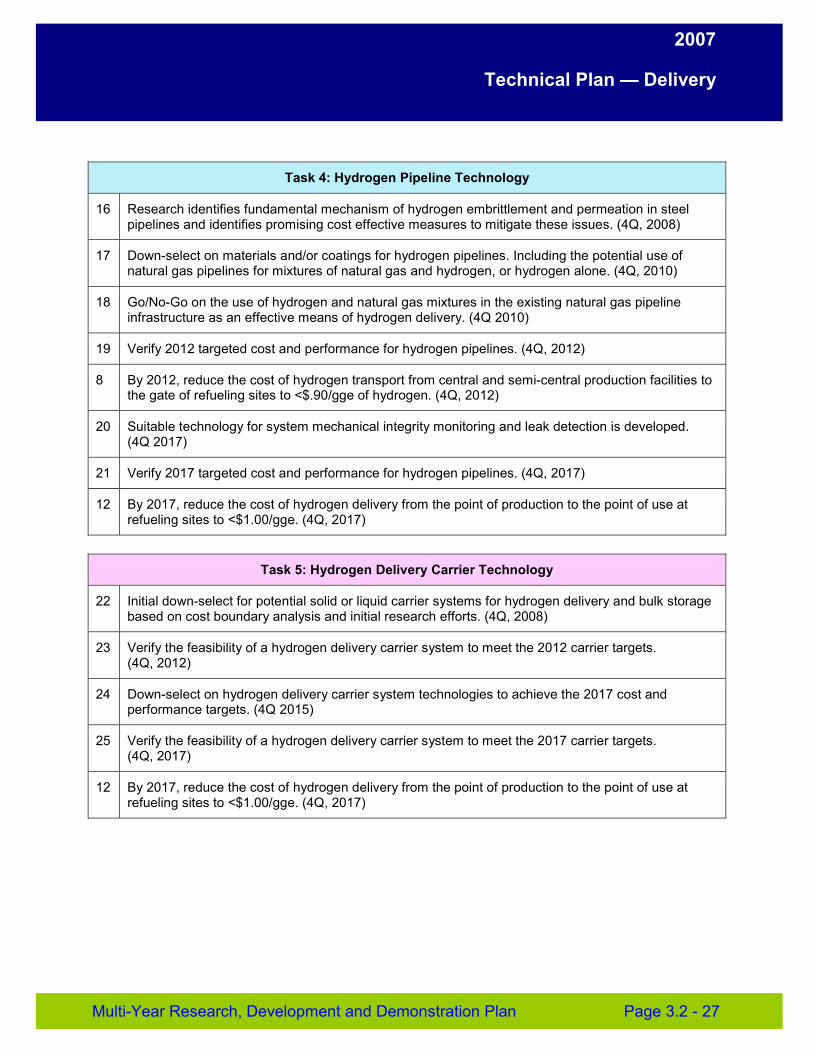
2007
Technical Plan — Delivery
Task 4: Hydrogen Pipeline Technology
16 Research identifies fundamental mechanism of hydrogen embrittlement and permeation in steel pipelines and identifies promising cost effective measures to mitigate these issues. (4Q, 2008)
17 Down-select on materials and/or coatings for hydrogen pipelines. Including the potential use of natural gas pipelines for mixtures of natural gas and hydrogen, or hydrogen alone. (4Q, 2010)
18 Go/No-Go on the use of hydrogen and natural gas mixtures in the existing natural gas pipeline infrastructure as an effective means of hydrogen delivery. (4Q 2010)
19 Verify 2012 targeted cost and performance for hydrogen pipelines. (4Q, 2012)
8 By 2012, reduce the cost of hydrogen transport from central and semi-central production facilities to the gate of refueling sites to <$.90/gge of hydrogen. (4Q, 2012)
20 Suitable technology for system mechanical integrity monitoring and leak detection is developed. (4Q 2017)
21 Verify 2017 targeted cost and performance for hydrogen pipelines. (4Q, 2017)
12 By 2017, reduce the cost of hydrogen delivery from the point of production to the point of use at refueling sites to <$1.00/gge. (4Q, 2017)
Task 5: Hydrogen Delivery Carrier Technology
22 Initial down-select for potential solid or liquid carrier systems for hydrogen delivery and bulk storage based on cost boundary analysis and initial research efforts. (4Q, 2008)
23 Verify the feasibility of a hydrogen delivery carrier system to meet the 2012 carrier targets. (4Q, 2012)
24 Down-select on hydrogen delivery carrier system technologies to achieve the 2017 cost and performance targets. (4Q 2015)
25 Verify the feasibility of a hydrogen delivery carrier system to meet the 2017 carrier targets. (4Q, 2017)
12 By 2017, reduce the cost of hydrogen delivery from the point of production to the point of use at refueling sites to <$1.00/gge. (4Q, 2017)
Multi-Year Research, Development and Demonstration Plan Page 3.2 - 27
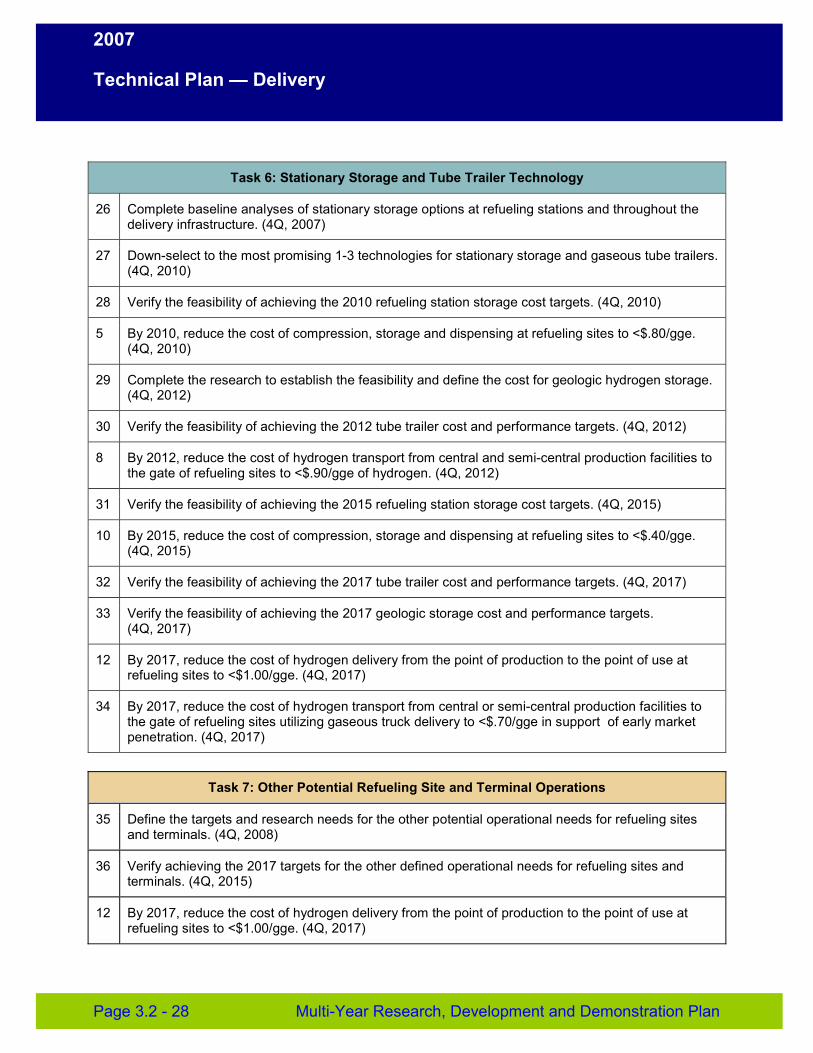
2007
Technical Plan — Delivery
Task 6: Stationary Storage and Tube Trailer Technology
26 Complete baseline analyses of stationary storage options at refueling stations and throughout the delivery infrastructure. (4Q, 2007)
27 Down-select to the most promising 1-3 technologies for stationary storage and gaseous tube trailers. (4Q, 2010)
28 Verify the feasibility of achieving the 2010 refueling station storage cost targets. (4Q, 2010)
5 By 2010, reduce the cost of compression, storage and dispensing at refueling sites to <$.80/gge. (4Q, 2010)
29 Complete the research to establish the feasibility and define the cost for geologic hydrogen storage. (4Q, 2012)
30 Verify the feasibility of achieving the 2012 tube trailer cost and performance targets. (4Q, 2012)
8 By 2012, reduce the cost of hydrogen transport from central and semi-central production facilities to the gate of refueling sites to <$.90/gge of hydrogen. (4Q, 2012)
31 Verify the feasibility of achieving the 2015 refueling station storage cost targets. (4Q, 2015)
10 By 2015, reduce the cost of compression, storage and dispensing at refueling sites to <$.40/gge. (4Q, 2015)
32 Verify the feasibility of achieving the 2017 tube trailer cost and performance targets. (4Q, 2017)
33 Verify the feasibility of achieving the 2017 geologic storage cost and performance targets. (4Q, 2017)
12 By 2017, reduce the cost of hydrogen delivery from the point of production to the point of use at refueling sites to <$1.00/gge. (4Q, 2017)
34 By 2017, reduce the cost of hydrogen transport from central or semi-central production facilities to the gate of refueling sites utilizing gaseous truck delivery to <$.70/gge in support of early market penetration. (4Q, 2017)
Task 7: Other Potential Refueling Site and Terminal Operations
35 Define the targets and research needs for the other potential operational needs for refueling sites and terminals. (4Q, 2008)
36 Verify achieving the 2017 targets for the other defined operational needs for refueling sites and terminals. (4Q, 2015)
12 By 2017, reduce the cost of hydrogen delivery from the point of production to the point of use at refueling sites to <$1.00/gge. (4Q, 2017)
Page 3.2 - 28 Multi-Year Research, Development and Demonstration Plan
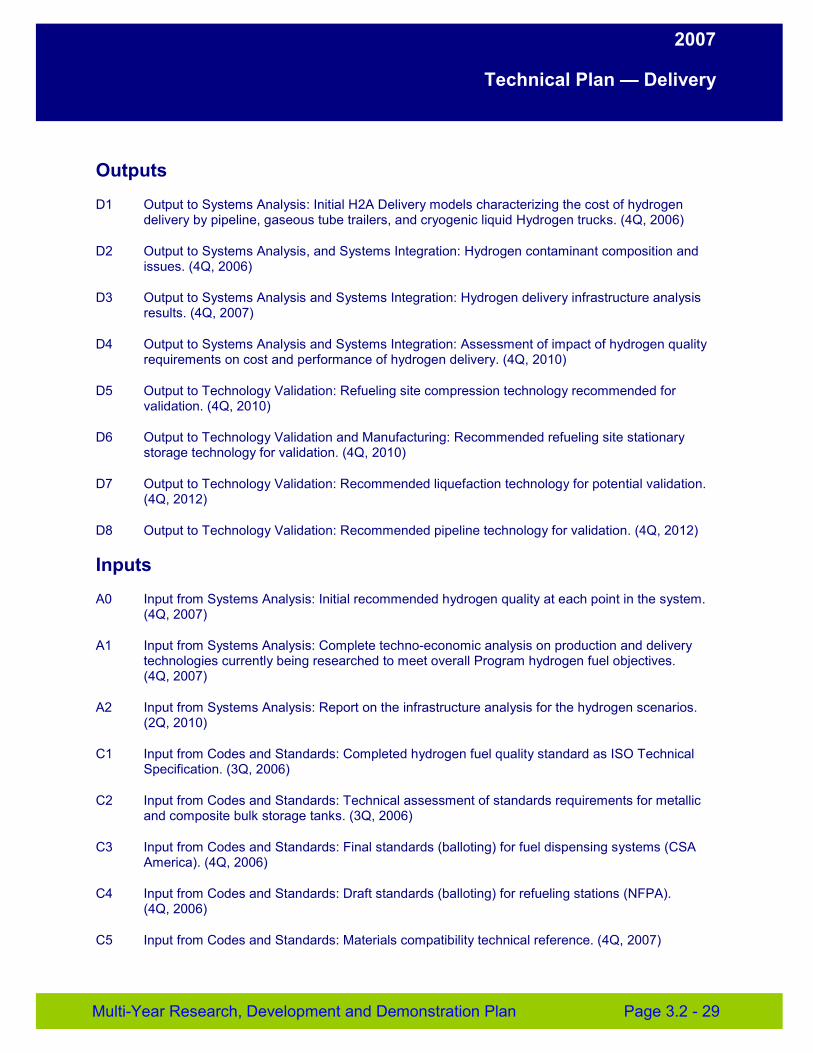
2007
Technical Plan — Delivery
Outputs
D1 Output to Systems Analysis: Initial H2A Delivery models characterizing the cost of hydrogen delivery by pipeline, gaseous tube trailers, and cryogenic liquid Hydrogen trucks. (4Q, 2006)
D2 Output to Systems Analysis, and Systems Integration: Hydrogen contaminant composition and issues. (4Q, 2006)
D3 Output to Systems Analysis and Systems Integration: Hydrogen delivery infrastructure analysis results. (4Q, 2007)
D4 Output to Systems Analysis and Systems Integration: Assessment of impact of hydrogen quality requirements on cost and performance of hydrogen delivery. (4Q, 2010)
D5 Output to Technology Validation: Refueling site compression technology recommended for validation. (4Q, 2010)
D6 Output to Technology Validation and Manufacturing: Recommended refueling site stationary storage technology for validation. (4Q, 2010)
D7 Output to Technology Validation: Recommended liquefaction technology for potential validation. (4Q, 2012)
D8 Output to Technology Validation: Recommended pipeline technology for validation. (4Q, 2012)
Inputs
A0 Input from Systems Analysis: Initial recommended hydrogen quality at each point in the system. (4Q, 2007)
A1 Input from Systems Analysis: Complete techno-economic analysis on production and delivery technologies currently being researched to meet overall Program hydrogen fuel objectives. (4Q, 2007)
A2 Input from Systems Analysis: Report on the infrastructure analysis for the hydrogen scenarios. (2Q, 2010)
C1 Input from Codes and Standards: Completed hydrogen fuel quality standard as ISO Technical Specification. (3Q, 2006)
C2 Input from Codes and Standards: Technical assessment of standards requirements for metallic and composite bulk storage tanks. (3Q, 2006)
C3 Input from Codes and Standards: Final standards (balloting) for fuel dispensing systems (CSA America). (4Q, 2006)
C4 Input from Codes and Standards: Draft standards (balloting) for refueling stations (NFPA). (4Q, 2006)
C5 Input from Codes and Standards: Materials compatibility technical reference. (4Q, 2007)
Multi-Year Research, Development and Demonstration Plan Page 3.2 - 29
2007
Technical Plan — Delivery
C7 Input from Codes and Standards: Codes and Standards for the delivery infrastructure complete. (2Q, 2010)
C8 Input from Codes and Standards: Final hydrogen fuel quality standard as ISO Standard. (2Q, 2010)
P2 Input from Production: Assessment of fuel contaminant composition. (4Q, 2006)
St4 Input from Storage: Report on full-cycle chemical hydrogen system and evaluation against 2010 targets. (1Q, 2011)
St5 Input from Hydrogen Storage: Baseline hydrogen on-board storage system analysis results including hydrogen quality needs and interface issues. (1Q, 2007)
St6 Input from Hydrogen Storage: Final on-board hydrogen storage system analysis results of cost and performance (including pressure, temperature, etc.) and down-select to a primary on-board storage system candidate.(1Q, 2010)
V9 Input from Technology Validation: Final report on safety and O&M of three refueling stations. (4Q, 2007)
Page 3.2 - 30 Multi-Year Research, Development and Demonstration Plan
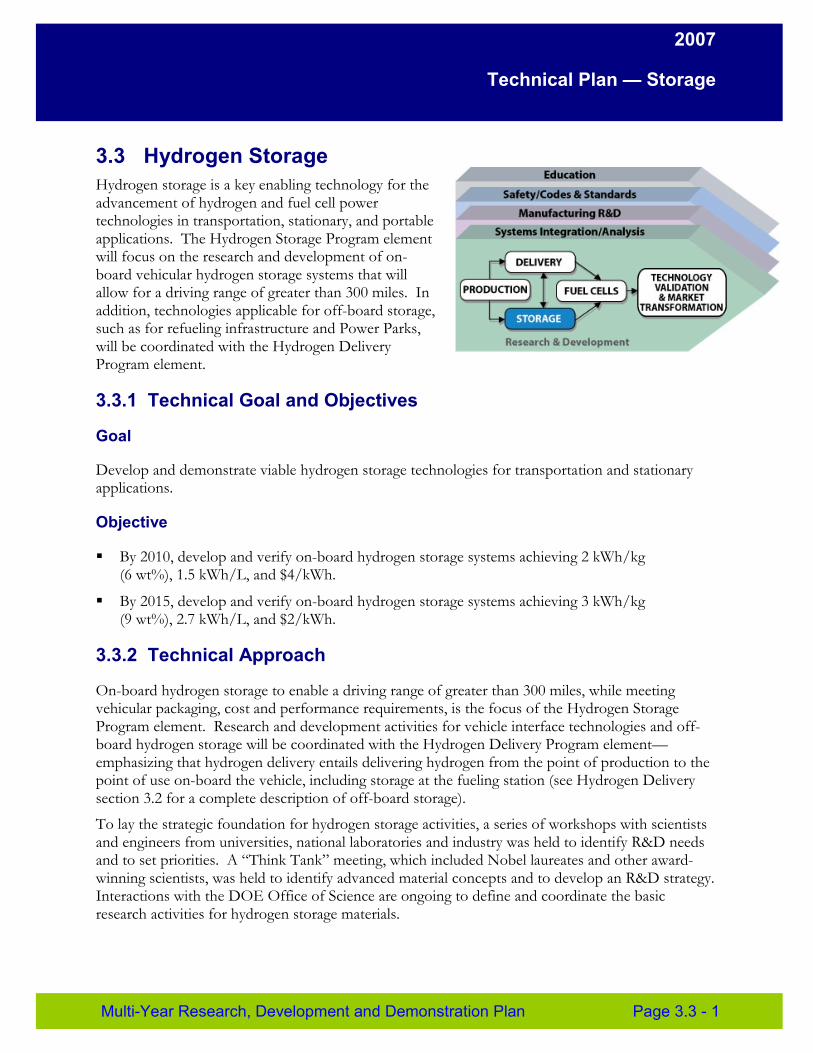
2007
Technical Plan — Storage
3.3 Hydrogen Storage Hydrogen storage is a key enabling technology for the advancement of hydrogen and fuel cell power technologies in transportation, stationary, and portable applications. The Hydrogen Storage Program element will focus on the research and development of on-board vehicular hydrogen storage systems that will allow for a driving range of greater than 300 miles. In addition, technologies applicable for off-board storage, such as for refueling infrastructure and Power Parks, will be coordinated with the Hydrogen Delivery Program element.
3.3.1 Technical Goal and Objectives
Goal
Develop and demonstrate viable hydrogen storage technologies for transportation and stationary applications.
Objective
� By 2010, develop and verify on-board hydrogen storage systems achieving 2 kWh/kg (6 wt%), 1.5 kWh/L, and $4/kWh.
� By 2015, develop and verify on-board hydrogen storage systems achieving 3 kWh/kg (9 wt%), 2.7 kWh/L, and $2/kWh.
3.3.2 Technical Approach
On-board hydrogen storage to enable a driving range of greater than 300 miles, while meeting vehicular packaging, cost and performance requirements, is the focus of the Hydrogen Storage Program element. Research and development activities for vehicle interface technologies and off-board hydrogen storage will be coordinated with the Hydrogen Delivery Program element— emphasizing that hydrogen delivery entails delivering hydrogen from the point of production to the point of use on-board the vehicle, including storage at the fueling station (see Hydrogen Delivery section 3.2 for a complete description of off-board storage).
To lay the strategic foundation for hydrogen storage activities, a series of workshops with scientists and engineers from universities, national laboratories and industry was held to identify R&D needs and to set priorities. A “Think Tank” meeting, which included Nobel laureates and other award-winning scientists, was held to identify advanced material concepts and to develop an R&D strategy. Interactions with the DOE Office of Science are ongoing to define and coordinate the basic research activities for hydrogen storage materials.
Multi-Year Research, Development and Demonstration Plan Page 3.3 - 1
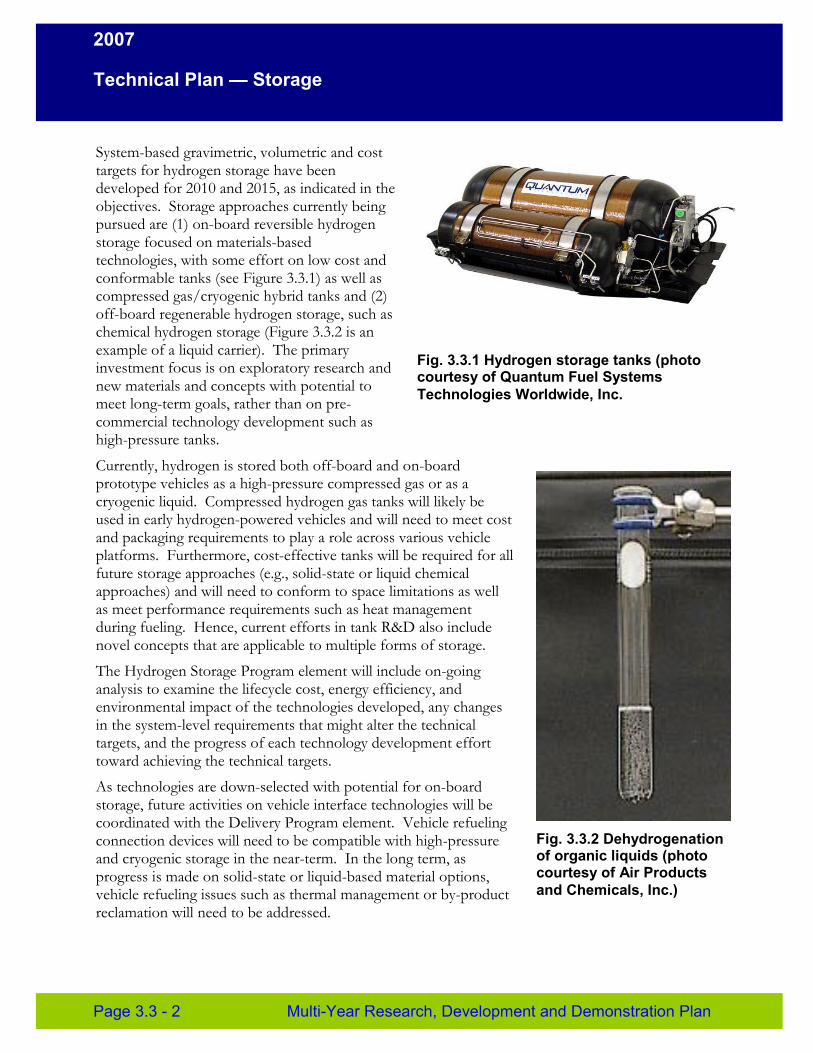
2007
Technical Plan — Storage
System-based gravimetric, volumetric and cost targets for hydrogen storage have been developed for 2010 and 2015, as indicated in t he objectives. Storage approaches currently bein g pursued are (1) on-board reversible hydrog en storage focused on materials-based technologies, with some effort on low cost and conformable tanks (see Figure 3.3.1) as well as compressed gas/cryogenic hybrid tanks and (2) off-board regenerable hydrogen storage, such as chemical hydrogen storage (Figure 3.3.2 is an example of a liquid carrier). The primary
Fig. 3.3.1 Hy drogen storage tanks (photo investment focus is on exploratory research and courtesy of Qu antum Fuel Systems new materials and concepts with potential to Technologies Wor ldwide, Inc. meet long-term goals, rather than on pre-commercial technology development such as high-pressure tanks.
Currently, hydrogen is stored both off-board and on-board prototype vehicles as a high-pressure compressed gas or as a cryogenic liquid. Compressed hydrogen gas tanks will likely be used in early hydrogen-powered vehicles and will need to meet cost and packaging requirements to play a role across various vehicle platforms. Furthermore, cost-effective tanks will be required for all future storage approaches (e.g., solid-state or liquid chemical approaches) and will need to conform to space limitations as well as meet performance requirements such as heat management during fueling. Hence, current efforts in tank R&D also include novel concepts that are applicable to multiple forms of storage.
The Hydrogen Storage Program element will include on-going analysis to examine the lifecycle cost, energy efficiency, and environmental impact of the technologies developed, any changes in the system-level requirements that might alter the technical targets, and the progress of each technology development effort toward achieving the technical targets.
As technologies are down-selected with potential for on-board storage, future activities on vehicle interface technologies will be coordinated with the Delivery Program element. Vehicle refueling connection devices will need to be compatible with high-pressure and cryogenic storage in the near-term. In the long term, as progress is made on solid-state or liquid-based material options, vehicle refueling issues such as thermal management or by-product reclamation will need to be addressed.
Fig. 3.3.2 Dehydrogenation of organic liquids (photo courtesy of Air Products and Chemicals, Inc.)
Page 3.3 - 2 Multi-Year Research, Development and Demonstration Plan
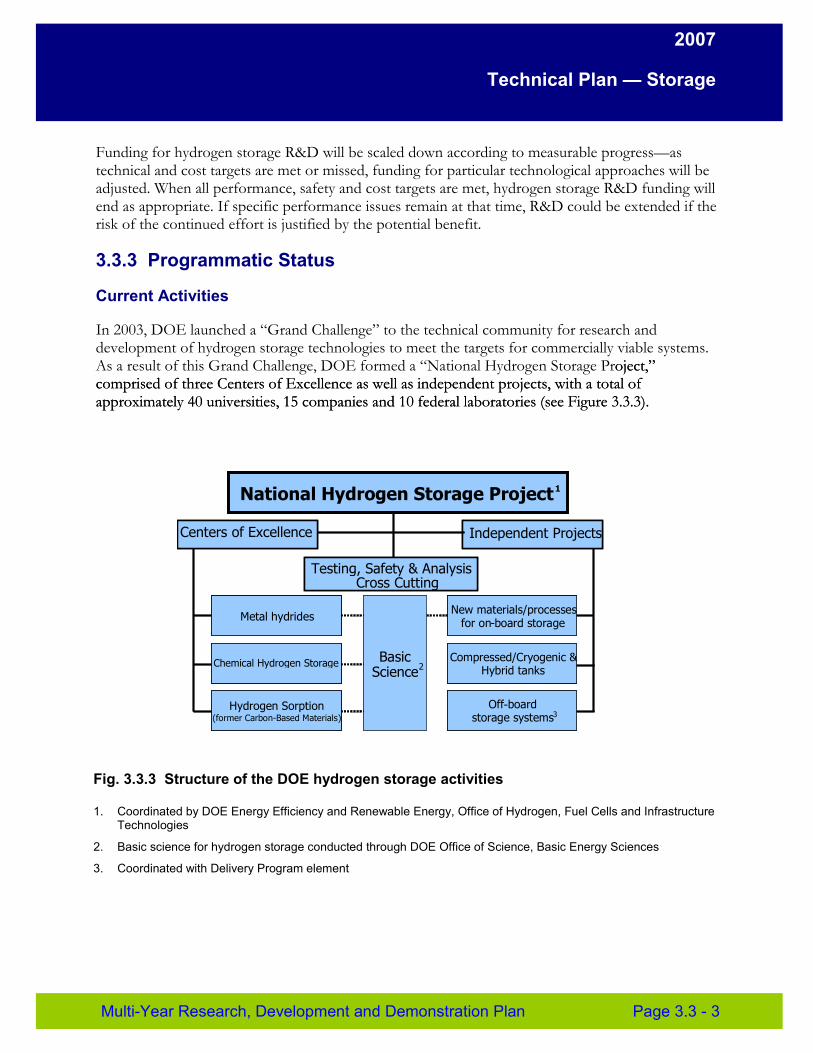
2007
Technical Plan — Storage
Funding for hydrogen storage R&D will be scaled down according to measurable progress—as technical and cost targets are met or missed, funding for particular technological approaches will be adjusted. When all performance, safety and cost targets are met, hydrogen storage R&D funding will end as appropriate. If specific performance issues remain at that time, R&D could be extended if the risk of the continued effort is justified by the potential benefit.
3.3.3 Programmatic Status
Current Activities
In 2003, DOE launched a “Grand Challenge” to the technical community for research and development of hydrogen storage technologies to meet the targets for commercially viable systems. As a result of this Grand Challenge, DOE formed a “National Hydrogen Storage Project,”oject,” comprised of three Centers of Excellence as well as independent projects, with a total ofcomprised of three Centers of Excellence as well as independent projects, with a total ofapproximately 40 universities, 15 companies and 10 federal laboratories (see Figure 3.3.3).approximately 40 universities, 15 companies and 10 federal laboratories (see Figure 3.3.3).
Testing, Safety & Analysis Cross Cutting
Independent Projects
-
-
-
National Hydrogen Storage Project1
Centers of Excellence
Metal hydrides
Chemical Hydrogen Storage
Hydrogen Sorption (former Carbon-Based Materials)
New materials/processes for on-board storage
Compressed/Cryogenic & Hybrid tanks
Off-board storage systems3
Basic Science2
Fig. 3.3.3 Structure of the DOE hydrogen storage activities
1. Coordinated by DOE Energy Efficiency and Renewable Energy, Office of Hydrogen, Fuel Cells and Infrastructure Technologies
2. Basic science for hydrogen storage conducted through DOE Office of Science, Basic Energy Sciences
3. Coordinated with Delivery Program element
Multi-Year Research, Development and Demonstration Plan Page 3.3 - 3
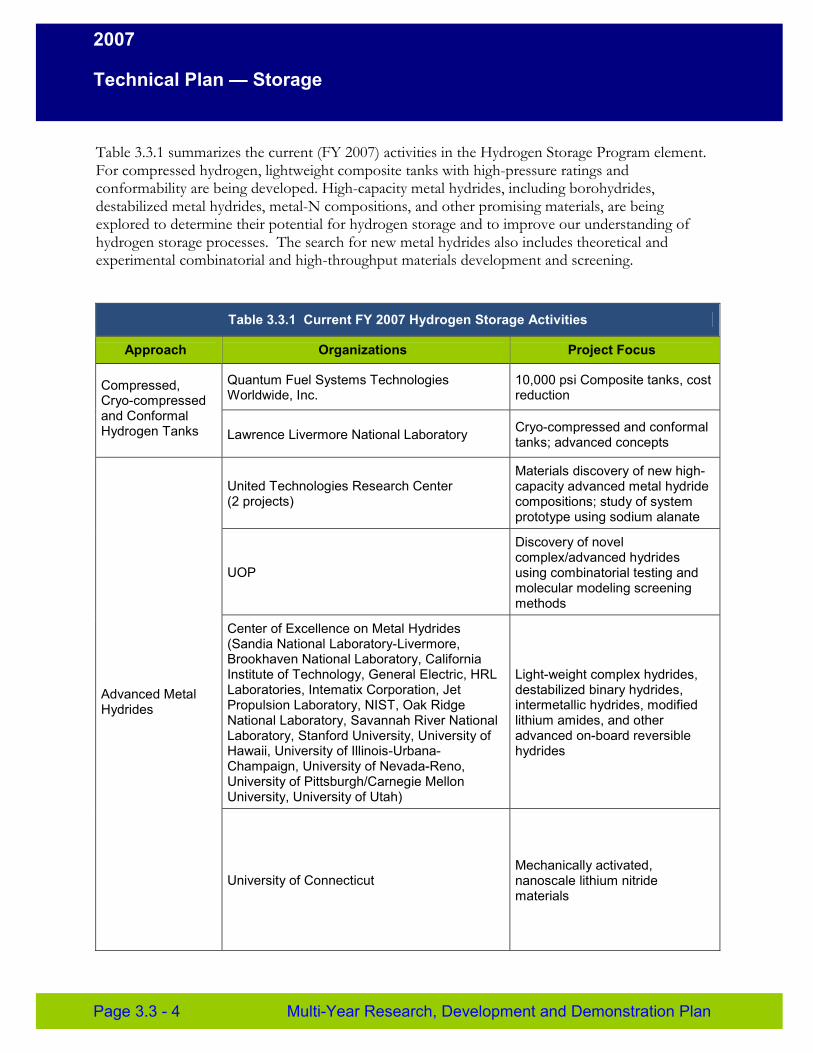
2007
Technical Plan — Storage
Table 3.3.1 summarizes the current (FY 2007) activities in the Hydrogen Storage Program element. For compressed hydrogen, lightweight composite tanks with high-pressure ratings and conformability are being developed. High-capacity metal hydrides, including borohydrides, destabilized metal hydrides, metal-N compositions, and other promising materials, are being explored to determine their potential for hydrogen storage and to improve our understanding of hydrogen storage processes. The search for new metal hydrides also includes theoretical and experimental combinatorial and high-throughput materials development and screening.
Table 3.3.1 Current FY 2007 Hydrogen Storage Activities
Approach Organizations Project Focus
Compressed, Cryo-compressed and Conformal Hydrogen Tanks
Quantum Fuel Systems Technologies Worldwide, Inc.
10,000 psi Composite tanks, cost reduction
Lawrence Livermore National Laboratory Cryo-compressed and conformal tanks; advanced concepts
Advanced Metal Hydrides
United Technologies Research Center (2 projects)
Materials discovery of new high-capacity advanced metal hydride compositions; study of system prototype using sodium alanate
UOP
Discovery of novel complex/advanced hydrides using combinatorial testing and molecular modeling screening methods
Center of Excellence on Metal Hydrides (Sandia National Laboratory-Livermore, Brookhaven National Laboratory, California Institute of Technology, General Electric, HRL Laboratories, Intematix Corporation, Jet Propulsion Laboratory, NIST, Oak Ridge National Laboratory, Savannah River National Laboratory, Stanford University, University of Hawaii, University of Illinois-Urbana-Champaign, University of Nevada-Reno, University of Pittsburgh/Carnegie Mellon University, University of Utah)
Light-weight complex hydrides, destabilized binary hydrides, intermetallic hydrides, modified lithium amides, and other advanced on-board reversible hydrides
University of Connecticut Mechanically activated, nanoscale lithium nitride materials
Page 3.3 - 4 Multi-Year Research, Development and Demonstration Plan
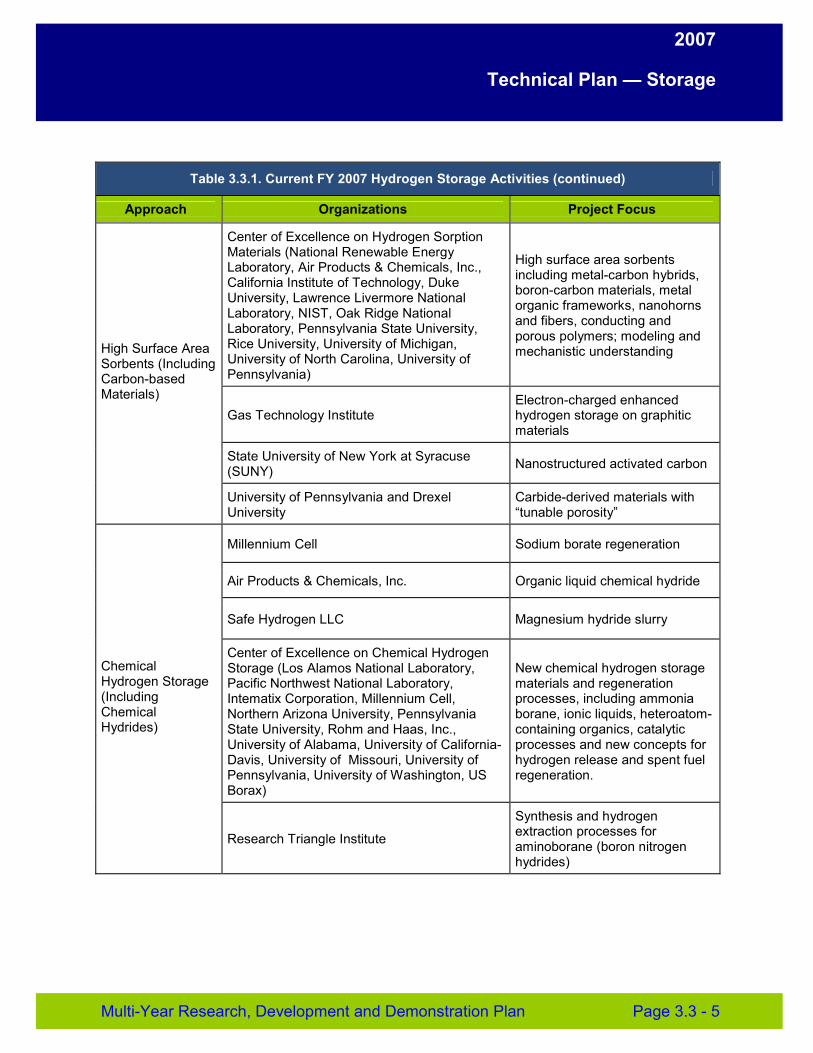
2007
Technical Plan — Storage
Table 3.3.1. Current FY 2007 Hydrogen Storage Activities (continued)
Approach Organizations Project Focus
High Surface Area Sorbents (Including Carbon-based Materials)
Center of Excellence on Hydrogen Sorption Materials (National Renewable Energy Laboratory, Air Products & Chemicals, Inc., California Institute of Technology, Duke University, Lawrence Livermore National Laboratory, NIST, Oak Ridge National Laboratory, Pennsylvania State University, Rice University, University of Michigan, University of North Carolina, University of Pennsylvania)
High surface area sorbents including metal-carbon hybrids, boron-carbon materials, metal organic frameworks, nanohorns and fibers, conducting and porous polymers; modeling and mechanistic understanding
Gas Technology Institute Electron-charged enhanced hydrogen storage on graphitic materials
State University of New York at Syracuse (SUNY) Nanostructured activated carbon
University of Pennsylvania and Drexel University
Carbide-derived materials with “tunable porosity”
Chemical Hydrogen Storage (Including Chemical Hydrides)
Millennium Cell Sodium borate regeneration
Air Products & Chemicals, Inc. Organic liquid chemical hydride
Safe Hydrogen LLC Magnesium hydride slurry
Center of Excellence on Chemical Hydrogen Storage (Los Alamos National Laboratory, Pacific Northwest National Laboratory, Intematix Corporation, Millennium Cell, Northern Arizona University, Pennsylvania State University, Rohm and Haas, Inc., University of Alabama, University of California-Davis, University of Missouri, University of Pennsylvania, University of Washington, US Borax)
New chemical hydrogen storage materials and regeneration processes, including ammonia borane, ionic liquids, heteroatom-containing organics, catalytic processes and new concepts for hydrogen release and spent fuel regeneration.
Research Triangle Institute
Synthesis and hydrogen extraction processes for aminoborane (boron nitrogen hydrides)
Multi-Year Research, Development and Demonstration Plan Page 3.3 - 5
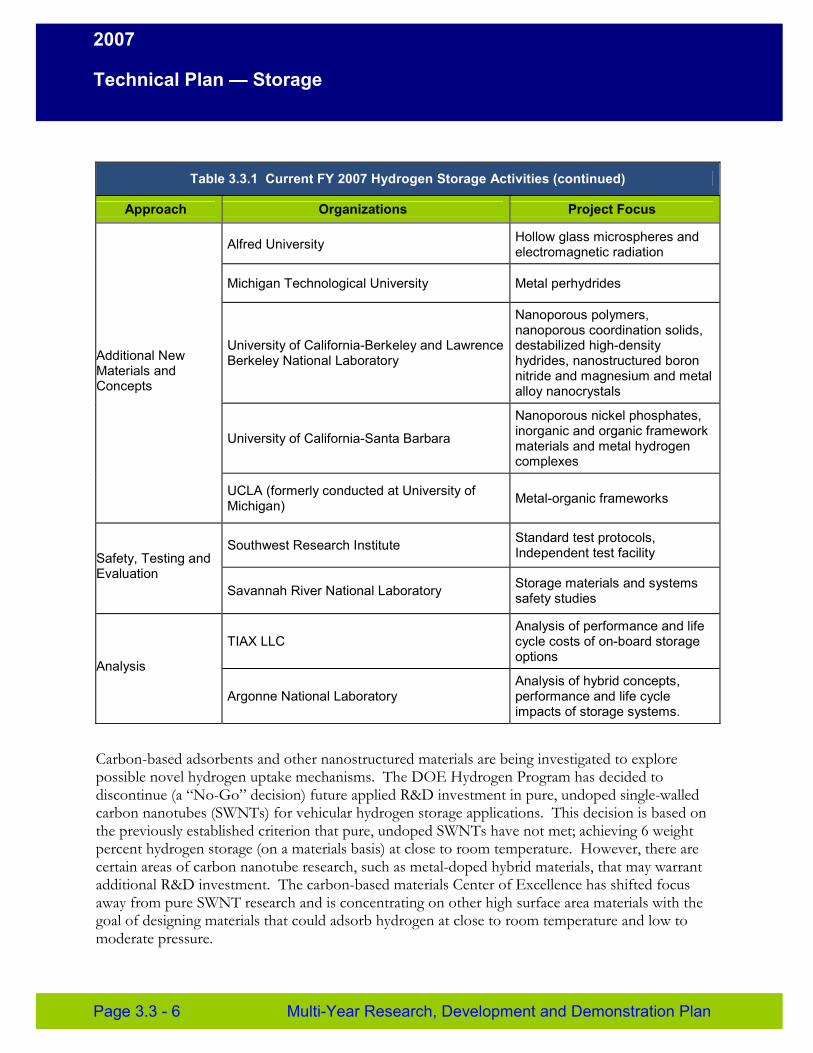
2007
Technical Plan — Storage
Table 3.3.1 Current FY 2007 Hydrogen Storage Activities (continued)
Approach Organizations Project Focus
Additional New Materials and Concepts
Alfred University Hollow glass microspheres and electromagnetic radiation
Michigan Technological University Metal perhydrides
University of California-Berkeley and Lawrence Berkeley National Laboratory
Nanoporous polymers, nanoporous coordination solids, destabilized high-density hydrides, nanostructured boron nitride and magnesium and metal alloy nanocrystals
University of California-Santa Barbara
Nanoporous nickel phosphates, inorganic and organic framework materials and metal hydrogen complexes
UCLA (formerly conducted at University of Michigan) Metal-organic frameworks
Safety, Testing and Evaluation
Southwest Research Institute Standard test protocols, Independent test facility
Savannah River National Laboratory Storage materials and systems safety studies
Analysis
TIAX LLC Analysis of performance and life cycle costs of on-board storage options
Argonne National Laboratory Analysis of hybrid concepts, performance and life cycle impacts of storage systems.
Carbon-based adsorbents and other nanostructured materials are being investigated to explore possible novel hydrogen uptake mechanisms. The DOE Hydrogen Program has decided to discontinue (a “No-Go” decision) future applied R&D investment in pure, undoped single-walled carbon nanotubes (SWNTs) for vehicular hydrogen storage applications. This decision is based on the previously established criterion that pure, undoped SWNTs have not met; achieving 6 weight percent hydrogen storage (on a materials basis) at close to room temperature. However, there are certain areas of carbon nanotube research, such as metal-doped hybrid materials, that may warrant additional R&D investment. The carbon-based materials Center of Excellence has shifted focus away from pure SWNT research and is concentrating on other high surface area materials with the goal of designing materials that could adsorb hydrogen at close to room temperature and low to moderate pressure.
Page 3.3 - 6 Multi-Year Research, Development and Demonstration Plan
2007
Technical Plan — Storage
Projects on chemical hydrogen storage, such as sodium borohydride, magnesium hydride slurries, and organic liquids, were initiated in FY 2004, with a focus on the key issue for chemical hydrogen storage—off-board regeneration of the spent fuel. A project was also initiated on off-board hydrogen storage and will be coordinated with the Delivery Program element (see section 3.2). Also shown below are the new awards on novel materials and concepts that were announced in FY 2004. Projects on systems analysis will address performance, cost and life-cycle analyses of on-board storage options. Finally, a test and evaluation facility has been established to develop standard test protocols and provide independent verification of hydrogen storage performance in on-board reversible solid-state materials.
Three DOE Centers of Excellence were initiated in FY 2005 with coordinated activities involving multiple university, industry and national laboratory partners in the key focus areas of metal hydrides, carbon-based materials and chemical hydrogen storage. New materials and concepts continue to be an emphasis in the FY 2007 storage portfolio. The EERE Hydrogen Storage Program Element also collaborates with the DOE Office of Science on basic science, theory and modeling related to various hydrogen storage technologies and on the new Office of Science Hydrogen Storage awards announced in FY 2005 as well as the core research program. For example, a Theory Focus Session on Hydrogen Storage Materials was co-organized by EERE and BES (Office of Basic Energy Sciences within the Office of Science) to identify key barriers, gaps and critical areas of research in current theory/modeling approaches for hydrogen storage materials (details are available through www.hydrogen.energy.gov or directly at www1.eere.energy.gov/hydrogenandfuelcells/wkshp_theory_focus.html). The Hydrogen Program's 2006 Annual Merit Review included presentations from both EERE and BES and are available at www.hydrogen.energy.gov/annual_review06_proceedings.html.
Technology Status (Demonstrations)
In the area of on-board hydrogen storage, the state-of-the-art is 5,000- and 10,000-psi compressed tanks, and cryogenic liquid hydrogen tanks. Tanks have been certified worldwide according to ISO 11439 (Europe), NGV2 (U.S.), and Reijikijun Betten (Iceland) standards, and approved by TUV (Germany) and KHK (Japan). They have been demonstrated in several prototype fuel cell vehicles and are commercially available at low production volumes. All-composite 10,000-psi tanks have demonstrated a 2.35 safety factor (23,500-psi burst pressure) as required by the European Integrated Hydrogen Project specifications. Liquid hydrogen tanks have also been demonstrated. A sodium borohydride system has been demonstrated in a concept vehicle. A lithium hydride slurry prototype has been demonstrated in a pick up truck with a hydrogen internal combustion engine. Most recently, through DOE's Technology Validation activity (see Section 3.5), data from 63 vehicles in operation to date have demonstrated a driving range of 103 to 190 miles (on road data, corrected for the EPA drive cycle). The hydrogen storage capacity based on primarily 5,000 psi tanks as well as some 10,000 psi tanks and cryogenic tanks, was demonstrated to be between 3.4 and 4.7 wt.% and 14 to 28 g/L. Such data will be periodically updated as new technologies are validated under real-world conditions.
Multi-Year Research, Development and Demonstration Plan Page 3.3 - 7
2007
Technical Plan — Storage
3.3.4 Technical Challenges
For transportation applications, the overarching technical challenge for hydrogen storage is how to store the necessary amount of hydrogen required for conventional driving range (greater than 300 miles), within the constraints of weight, volume, durability, efficiency and total cost. Clearly, many important technical challenges for hydrogen storage must be resolved to meet the ultimate performance and safety targets. Substantial improvements must be made in the weight, volume and cost of these systems, for vehicular applications.
Durability over the performance lifetime of these systems must be verified and validated, and acceptable refueling times must be achieved. Table 3.3.2 lists specific technical targets that the hydrogen storage system must achieve to meet customer-driven requirements for vehicle performance. Following a discussion of the specific technical barriers that must be overcome to achieve the performance targets, Section 3.3.5 describes the tasks that will be carried out to resolve the identified technical barriers.
Technical Targets
The technical performance targets for hydrogen storage systems are summarized in Table 3.3.2. Figure 3.3.4 shows the status of current technologies relative to performance and cost targets. These targets were established through the FreedomCAR and Fuel Partnership between DOE, the U.S. Council for Automotive Research (USCAR) and the energy companies. The targets are subject to change as more is learned about system-level requirements and as fuel cell technology progresses.
Based on the lower heating value (LHV) of hydrogen and greater than 300-mile vehicle range, the targets are for a complete system, including tank, material, valves, regulators, piping, mounting brackets, insulation, added cooling capacity, and/or other balance-of-plant components. The targets are based on the U.S. weighted average corporate vehicle (WACV) that includes minivans, light trucks, economy cars, and SUV/crossover vehicles, in proportion to their sales. A detailed explanation of each target is provided at: www1.eere.energy.gov/hydrogenandfuelcells/storage/current_technology.html.
It should also be noted that unless otherwise indicated in Table 3.3.2, the targets are for both internal combustion engine and fuel cell power plants. In addition, hydrogen storage systems must be energy efficient in delivering hydrogen to the vehicle power plant. For on-board reversible systems, greater than 90% energy efficiency for the energy delivered to the power plant from the on-board storage system is required. For systems regenerated off-board, the overall efficiency is also important. In this case, the energy content of the hydrogen delivered to the automotive power plant should be greater than 60% of the total energy input to the process, including the input energy of hydrogen and any other fuel streams for generating process heat and electrical energy.
Page 3.3 - 8 Multi-Year Research, Development and Demonstration Plan
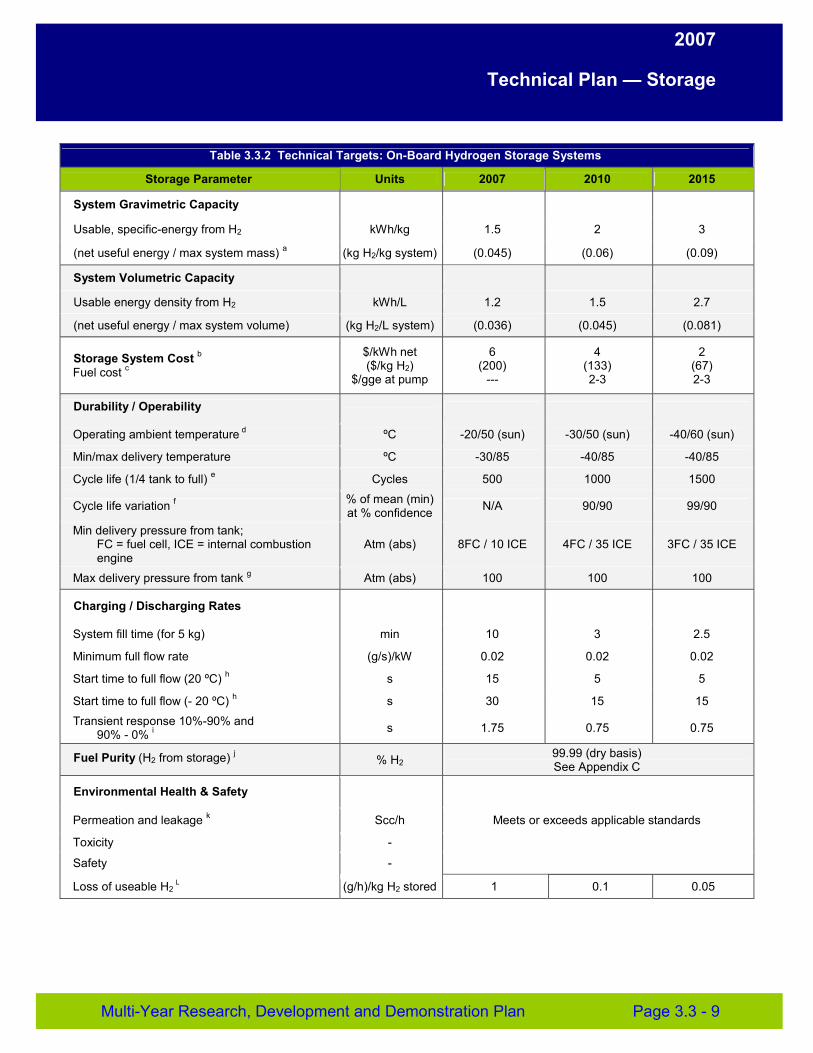
2007
Technical Plan — Storage
Table 3.3.2 Technical Targets: On-Board Hydrogen Storage Systems
Storage Parameter Units 2007 2010 2015
System Gravimetric Capacity
Usable, specific-energy from H2
(net useful energy / max system mass) a
kWh/kg
(kg H2/kg system)
1.5
(0.045)
2
(0.06)
3
(0.09)
System Volumetric Capacity
Usable energy density from H2
(net useful energy / max system volume)
kWh/L
(kg H2/L system)
1.2
(0.036)
1.5
(0.045)
2.7
(0.081)
Storage System Cost b
Fuel cost c
$/kWh net ($/kg H2)
$/gge at pump
6 (200)
---
4 (133) 2-3
2 (67) 2-3
Durability / Operability
Operating ambient temperature d ºC -20/50 (sun) -30/50 (sun) -40/60 (sun)
Min/max delivery temperature ºC -30/85 -40/85 -40/85
Cycle life (1/4 tank to full) e Cycles 500 1000 1500
Cycle life variation f
Min delivery pressure from tank;
% of mean (min) at % confidence N/A 90/90 99/90
FC = fuel cell, ICE = internal combustion engine
Atm (abs) 8FC / 10 ICE 4FC / 35 ICE 3FC / 35 ICE
Max delivery pressure from tank g Atm (abs) 100 100 100
Charging / Discharging Rates
System fill time (for 5 kg) min 10 3 2.5
Minimum full flow rate (g/s)/kW 0.02 0.02 0.02
Start time to full flow (20 ºC) h s 15 5 5
Start time to full flow (- 20 ºC) h s 30 15 15
Transient response 10%-90% and 90% - 0% i s 1.75 0.75 0.75
Fuel Purity (H2 from storage) j % H2 99.99 (dry basis) See Appendix C
Environmental Health & Safety
Permeation and leakage k
Toxicity
Safety
Loss of useable H2 L
Scc/h
-
-
(g/h)/kg H2 stored
Meets or exceeds applicable standards
1 0.1 0.05
Multi-Year Research, Development and Demonstration Plan Page 3.3 - 9
2007
Technical Plan — Storage
Footnotes for Table 3.3.2 Useful constants: 0.2778kWh/MJ, ~33.3kWh/gal gasoline equivalent. a Generally the “full” mass (including hydrogen) is used, for systems that gain weight, the highest mass during
discharge is used. b 2003 US$; total cost includes any component replacement if needed over 15 years or 150,000 mile life. c 2005 US$; includes off-board costs such as liquefaction, compression, regeneration, etc; based on H2 production
cost of $2 to $3/gasoline gallon equivalent untaxed, independent of production pathway. For pathway-dependent interim targets, refer to the Production Section.
d Stated ambient temperature plus full solar load. No allowable performance degradation from -20C to 40C. Allowable degradation outside these limits is TBD.
e Equivalent to 100,000; 200,000; and 300,000 miles respectively (current gasoline tank spec). f All targets must be achieved at end of life. g For delivery to the tank, in the near term, the forecourt should be capable of delivering 10,000 psi compressed
hydrogen, liquid hydrogen, or chilled hydrogen (77 K) at 5,000 psi. In the long term, it is anticipated that delivery pressures will be reduced to between 50 and 150 atm for solid state storage systems, based on today’s knowledge of sodium alanates.
h Flow must initiate within 25% of target time. i At operating temperature. j See Appendix C. The storage system will not provide any purification, but will receive incoming hydrogen at the
purity levels required for the fuel cell. Some storage technologies may produce contaminants for which effects are unknown; these will be addressed as more information becomes available.
k Total hydrogen lost into the environment as H2; relates to hydrogen accumulation in enclosed spaces. Storage system must comply with CSA/NGV2 standards for vehicular tanks. This includes any coating or enclosure that incorporates the envelope of the storage system.
L Total hydrogen lost from the storage system, including leaked or vented hydrogen; relates to loss of range.
The current status for system capacity and cost, as shown in Figure 3.3.4, are estimates provided by technology developers and the R&D community. All targets must be achieved simultaneously; however, status is not necessarily reported from a single system. Because it is challenging to estimate system-level weights and volumes when research is still at the stage of materials development, the current status data will be revisited and updated periodically. However, it is clear that none of the current systems meets the combined gravimetric, volumetric, and system cost targets for either 2010 or 2015. Also note that although recent accomplishments may show materials-based capacities as high as 5 wt%, the targets of 6 wt% by 2010 and 9 wt% by 2015 are system-level capacities that include the material, tank and all balance-of-plant components of the storage system. The system-level data also needs to include the first charge of hydrogen as well as any preconditioning such as purification, liquefaction and regeneration of material, particularly for chemical hydrogen storage, for which the cost of regenerating spent fuel will need to be included.
Page 3.3 - 10 Multi-Year Research, Development and Demonstration Plan
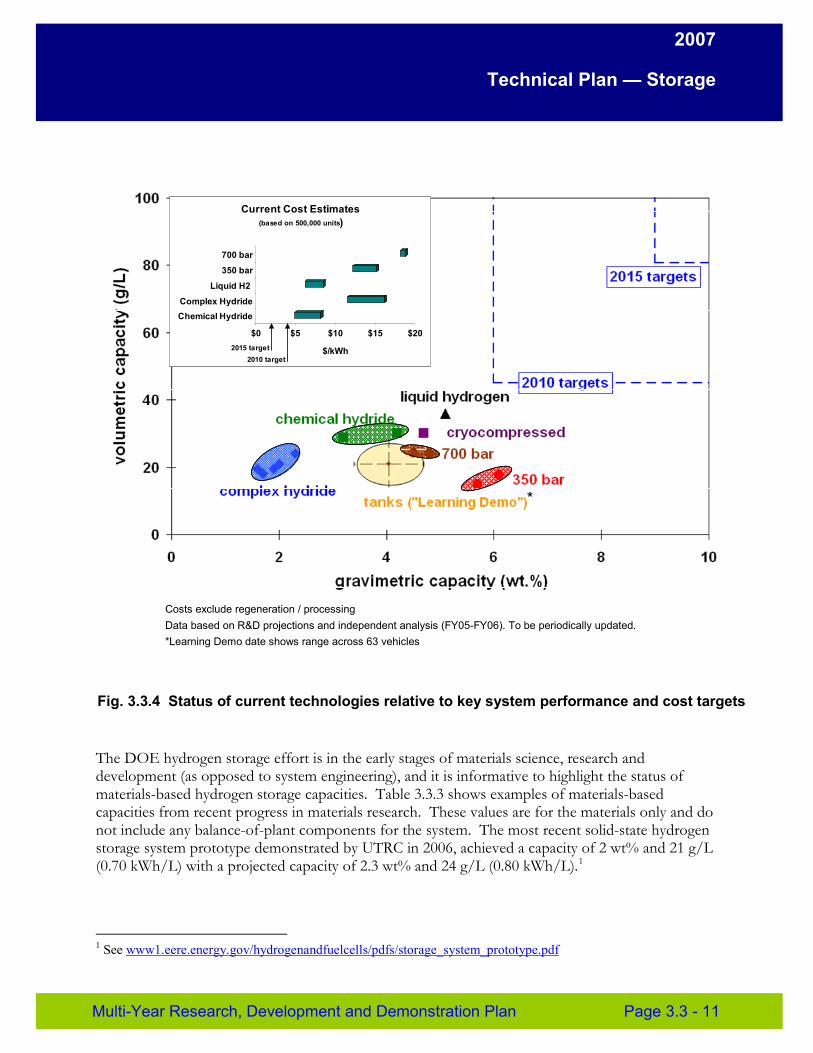
2007
Technical Plan — Storage
$0 $5 $10 $15 $20
$/kWh
Chemical Hydride Complex Hydride
Liquid H2
350 bar
700 bar
Current Cost Estimates (based on 500,000 units)
2010 target 2015 target
*
Costs exclude regeneration / processing Data based on R&D projections and independent analysis (FY05-FY06). To be periodically updated. *Learning Demo date shows range across 63 vehicles
Fig. 3.3.4 Status of current technologies relative to key system performance and cost targets
The DOE hydrogen storage effort is in the early stages of materials science, research and development (as opposed to system engineering), and it is informative to highlight the status of materials-based hydrogen storage capacities. Table 3.3.3 shows examples of materials-based capacities from recent progress in materials research. These values are for the materials only and do not include any balance-of-plant components for the system. The most recent solid-state hydrogen storage system prototype demonstrated by UTRC in 2006, achieved a capacity of 2 wt% and 21 g/L (0.70 kWh/L) with a projected capacity of 2.3 wt% and 24 g/L (0.80 kWh/L).1
1 See www1.eere.energy.gov/hydrogenandfuelcells/pdfs/storage_system_prototype.pdf
Multi-Year Research, Development and Demonstration Plan Page 3.3 - 11
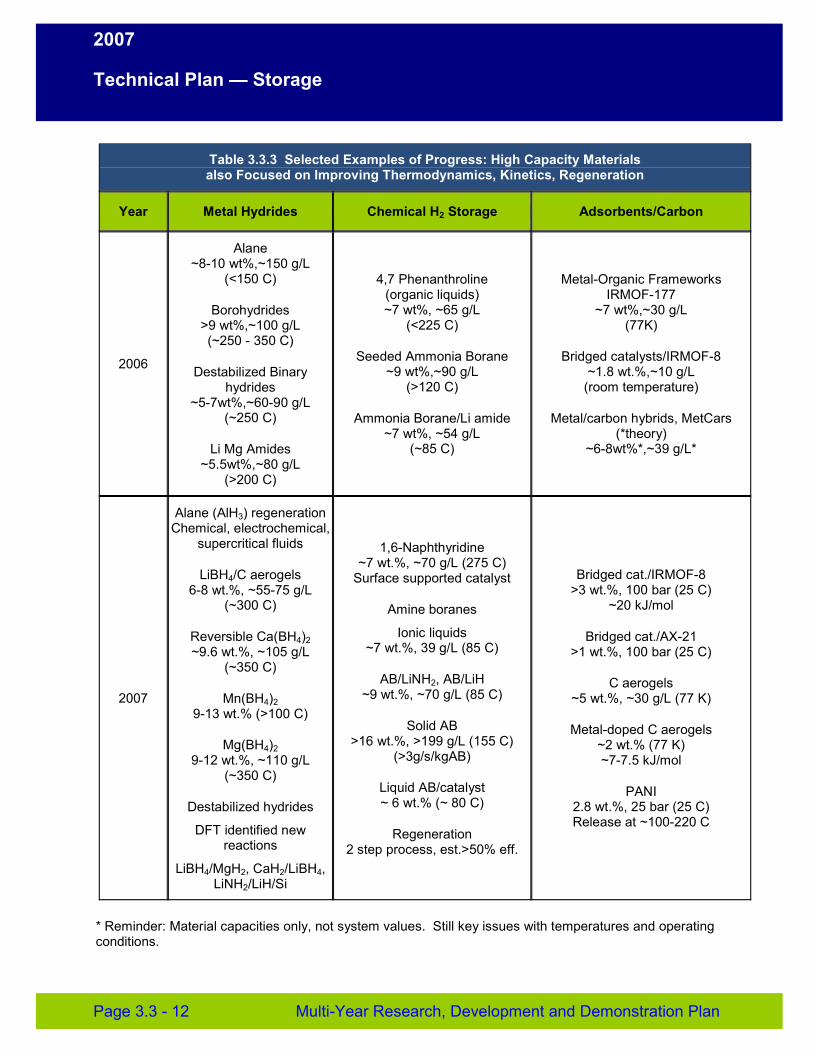
2007
Technical Plan — Storage
Table 3.3.3 Selected Examples of Progress: High Capacity Materials also Focused on Improving Thermodynamics, Kinetics, Regeneration
Year Metal Hydrides Chemical H2 Storage Adsorbents/Carbon
2006
Alane ~8-10 wt%,~150 g/L
(<150 C)
Borohydrides >9 wt%,~100 g/L (~250 - 350 C)
Destabilized Binary hydrides
~5-7wt%,~60-90 g/L (~250 C)
Li Mg Amides ~5.5wt%,~80 g/L
(>200 C)
4,7 Phenanthroline (organic liquids) ~7 wt%, ~65 g/L
(<225 C)
Seeded Ammonia Borane ~9 wt%,~90 g/L
(>120 C)
Ammonia Borane/Li amide ~7 wt%, ~54 g/L
(~85 C)
Metal-Organic Frameworks IRMOF-177
~7 wt%,~30 g/L (77K)
Bridged catalysts/IRMOF-8 ~1.8 wt.%,~10 g/L
(room temperature)
Metal/carbon hybrids, MetCars (*theory)
~6-8wt%*,~39 g/L*
2007
Alane (AlH3) regeneration Chemical, electrochemical,
supercritical fluids
LiBH4/C aerogels 6-8 wt.%, ~55-75 g/L
(~300 C)
Reversible Ca(BH4)2 ~9.6 wt.%, ~105 g/L
(~350 C)
Mn(BH4)2 9-13 wt.% (>100 C)
Mg(BH4)2 9-12 wt.%, ~110 g/L
(~350 C)
Destabilized hydrides
DFT identified new reactions
LiBH4/MgH2, CaH2/LiBH4, LiNH2/LiH/Si
1,6-Naphthyridine ~7 wt.%, ~70 g/L (275 C)
Surface supported catalyst
Amine boranes
Ionic liquids ~7 wt.%, 39 g/L (85 C)
AB/LiNH2, AB/LiH ~9 wt.%, ~70 g/L (85 C)
Solid AB >16 wt.%, >199 g/L (155 C)
(>3g/s/kgAB)
Liquid AB/catalyst ~ 6 wt.% (~ 80 C)
Regeneration 2 step process, est.>50% eff.
Bridged cat./IRMOF-8 >3 wt.%, 100 bar (25 C)
~20 kJ/mol
Bridged cat./AX-21 >1 wt.%, 100 bar (25 C)
C aerogels ~5 wt.%, ~30 g/L (77 K)
Metal-doped C aerogels ~2 wt.% (77 K) ~7-7.5 kJ/mol
PANI 2.8 wt.%, 25 bar (25 C) Release at ~100-220 C
* Reminder: Material capacities only, not system values. Still key issues with temperatures and operating conditions.
Page 3.3 - 12 Multi-Year Research, Development and Demonstration Plan
2007
Technical Plan — Storage
On-Board Hydrogen Storage Technical Barriers
General to All Storage Approaches A. System Weight and Volume
The weight and volume of hydrogen storage systems are presently too high, resulting in inadequate vehicle range compared to conventional petroleum fueled vehicles. Storage media, materials of construction and balance-of-plant components are needed that allow compact, lightweight, hydrogen storage systems while enabling greater than 300-mile range in all light-duty vehicle platforms. Reducing weight and volume of thermal management components is also required.
B. System Cost
The cost of on-board hydrogen storage systems is too high, particularly in comparison with conventional storage systems for petroleum fuels. Low-cost media, materials of construction and balance-of-plant components are needed, as well as low-cost, high-volume manufacturing methods.
C. Efficiency
Energy efficiency is a challenge for all hydrogen storage approaches. The energy required to transfer hydrogen into and out of the storage media or material is an issue for all material options. Life-cycle energy efficiency may be a challenge for chemical hydrogen storage technologies in which the spent media and by-products are typically regenerated off-board the vehicle. In addition, the energy associated with compression of and liquefaction of hydrogen must be considered for compressed and liquid hydrogen technologies. Thermal management for charging and releasing hydrogen from the storage system needs to be optimized to increase overall efficiency for all approaches.
D. Durability/Operability
Durability of hydrogen storage systems is inadequate. Storage media, materials of construction and balance-of-plant components are needed that allow hydrogen storage systems with a lifetime of at least 1500 cycles and with tolerance to hydrogen fuel contaminants. An additional durability issue for material-based approaches is the delivery of sufficient quality hydrogen for the vehicle power plant.
E. Charging/Discharging Rates
In general and especially for material-based approaches, hydrogen refueling times are too long. There is a need to develop hydrogen storage systems with refueling times of less than three minutes for a 5-kg hydrogen charge, over the lifetime of the system. Thermal management that enables quicker refueling is a critical issue that must be addressed. Also, all storage system approaches must be able to supply sufficient flow rate of hydrogen to the vehicle power plant (e.g. fuel cell or internal combustion engine) to meet the required power demand.
F. Codes and Standards
Applicable codes and standards for hydrogen storage systems and interface technologies, which will facilitate implementation/commercialization and assure safety and public acceptance, have not been established. Standardized hardware and operating procedures, and applicable codes and standards, are required.
Multi-Year Research, Development and Demonstration Plan Page 3.3 - 13
2007
Technical Plan — Storage
G. Materials of Construction
High-pressure containment for compressed gas and other high-pressure approaches limits the choice of construction materials and fabrication techniques, within weight, volume, performance, and cost constraints. For all approaches of hydrogen storage, vessel containment that is resistant to hydrogen permeation and corrosion is required. Research into new materials of construction such as metal ceramic composites, improved resins, and engineered fibers is needed to meet cost targets without compromising performance. Materials to meet performance and cost requirements for hydrogen delivery and off-board storage are also needed (see Hydrogen Delivery section 3.2).
H. Balance of Plant (BOP) Components
Light-weight, cost-effective balance-of-plant components are needed for all approaches of hydrogen storage, especially those requiring high-pressure or extensive thermal management. These include tubing, fittings, check valves, regulators, filters, relief and shut-off valves, heat exchangers, and sensors. System design and optimal packaging of components to meet overall volumetric targets are also required.
I. Dispensing Technology
Requirements for dispensing hydrogen to and from the storage system have not been defined. This includes meeting heat rejection requirements during fueling especially for on-board reversible material-based approaches. For chemical hydrogen approaches, methods and technology to recover spent material from the fuel tank for regeneration during "refueling" are needed. Activities will be coordinated with the Delivery Program element
J. Thermal Management
For all approaches of hydrogen storage; compressed gas, cryogenic and materials-based, thermal management is a key issue. In general, the main technical challenge is heat removal upon re-filling of hydrogen for compressed gas and on-board reversible materials within fueling time requirements. On-board reversible materials typically require heat to release hydrogen on board the vehicle. Heat must be provided to the storage media at reasonable temperatures to meet the flow rates needed by the vehicle power plant, preferably using the waste heat of the power plant. Depending upon the chemistry, chemical hydrogen approaches often are exothermic upon release of hydrogen to the power plant, or optimally thermal neutral. By virtue of the chemistry used, chemical hydrogen approaches require significant energy to regenerate the spent material and by-products prior to re-use; this is done off the vehicle.
K. System Life-Cycle Assessments
Assessments of the full life cycle, cost, efficiency, and environmental impact for hydrogen storage systems are lacking. An understanding of infrastructure implications, particularly for chemical hydrogen storage, and approaches to reduce primary energy inputs, is lacking.
Compressed Gas Systems L. High-pressure Conformability
Conformable high-pressure tanks will be required for compressed gas and other high-pressure approaches for hydrogen storage to meet the space constraints of light-duty vehicle applications.
Page 3.3 - 14 Multi-Year Research, Development and Demonstration Plan
2007
Technical Plan — Storage
M. Lack of Tank Performance Data and Understanding of Failure Mechanisms
An understanding of the fundamental mechanisms that govern composite tank operating cycle life and failure due to accident or to neglect is lacking. Research on tank performance and failure are needed to optimize tank structure for performance and cost. In addition, sensors and associated prediction correlations are needed to predict lifetime and catastrophic tank failure.
Cryogenic Liquid Systems N. Liquefaction Energy Penalty
The energy penalty associated with hydrogen liquefaction, typically 30% of the lower heating value of hydrogen, is an issue. Methods to reduce the energy requirements for liquefaction are needed.
O. Hydrogen Boil-Off
The boil-off of liquid hydrogen requires venting, reduces driving range and presents a potential safety/environmental hazard, particularly when the vehicle is in an enclosed environment. Materials and methods to reduce boil-off in cryogenic tanks are needed.
Reversible Materials-Based Storage Systems (Reversible On Board) P. Lack of Understanding of Hydrogen Physisorption and Chemisorption
Fundamental understanding of hydrogen physisorption and chemisorption processes is lacking. Improved understanding and optimization of adsorption/absorption and desorption kinetics is needed to optimize hydrogen uptake and release capacity rates. An understanding of chemical reactivity and material properties, particularly with respect to exposure under different conditions (air, moisture, etc.) is also lacking.
Q. Reproducibility of Performance
Standard test protocols for evaluation of hydrogen storage materials are lacking. Reproducibility of performance both in synthesis of the material/media and measurement of key hydrogen storage performance metrics is an issue. Standard test protocols related to performance over time such as accelerated aging tests as well as protocols evaluating materials safety properties and reactivity over time are also lacking.
Chemical Hydrogen Storage Systems (Typically Regenerated Off Board) R. Regeneration Processes
Low-cost, energy-efficient regeneration processes have not been established. Full life-cycle analyses need to be performed to understand cost, efficiency and environmental impacts.
S. By-Product/Spent Material Removal
The refueling process is potentially complicated by removal of the by-product and/or spent material. System designs must be developed to address this issue and the infrastructure requirements for off-board regeneration.
Multi-Year Research, Development and Demonstration Plan Page 3.3 - 15
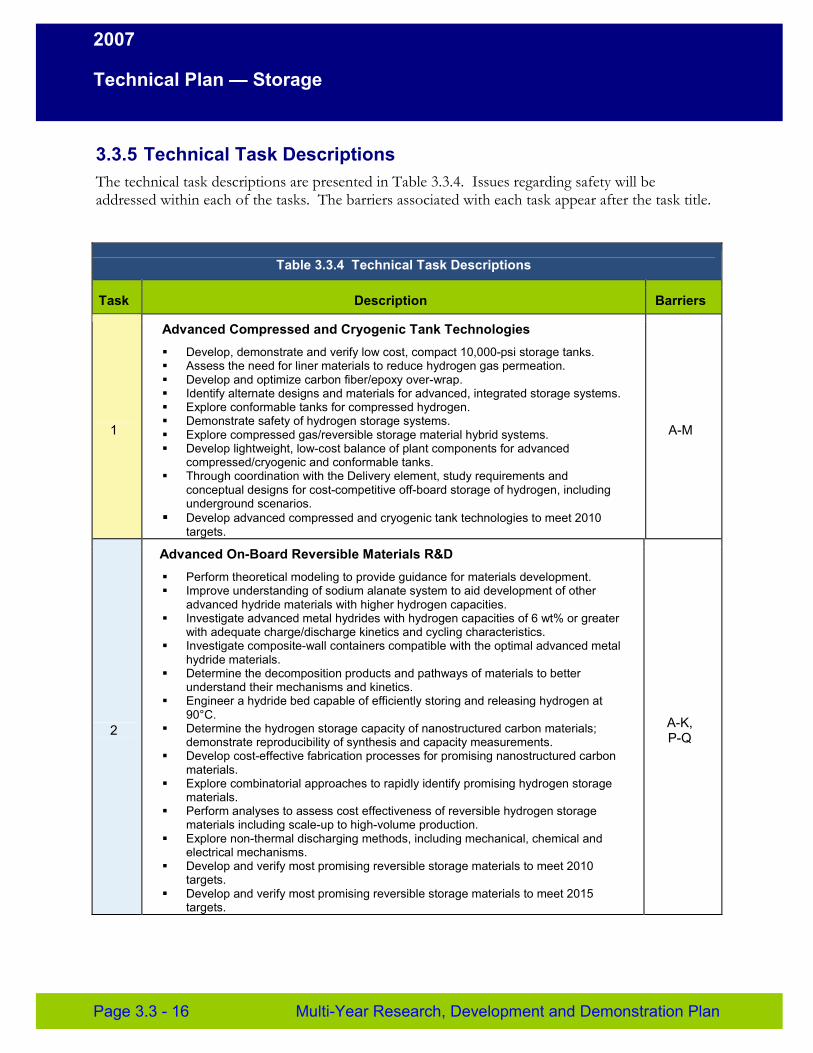
2007
Technical Plan — Storage
3.3.5 Technical Task Descriptions The technical task descriptions are presented in Table 3.3.4. Issues regarding safety will be addressed within each of the tasks. The barriers associated with each task appear after the task title.
Table 3.3.4 Technical Task Descriptions
Task Description Barriers
1
Advanced Compressed and Cryogenic Tank Technologies � Develop, demonstrate and verify low cost, compact 10,000-psi storage tanks. � Assess the need for liner materials to reduce hydrogen gas permeation. � Develop and optimize carbon fiber/epoxy over-wrap. � Identify alternate designs and materials for advanced, integrated storage systems. � Explore conformable tanks for compressed hydrogen. � Demonstrate safety of hydrogen storage systems. � Explore compressed gas/reversible storage material hybrid systems. � Develop lightweight, low-cost balance of plant components for advanced
compressed/cryogenic and conformable tanks. � Through coordination with the Delivery element, study requirements and
conceptual designs for cost-competitive off-board storage of hydrogen, including underground scenarios.
� Develop advanced compressed and cryogenic tank technologies to meet 2010 targets.
A-M
2
Advanced On-Board Reversible Materials R&D � Perform theoretical modeling to provide guidance for materials development. � Improve understanding of sodium alanate system to aid development of other
advanced hydride materials with higher hydrogen capacities. � Investigate advanced metal hydrides with hydrogen capacities of 6 wt% or greater
with adequate charge/discharge kinetics and cycling characteristics. � Investigate composite-wall containers compatible with the optimal advanced metal
hydride materials. � Determine the decomposition products and pathways of materials to better
understand their mechanisms and kinetics. � Engineer a hydride bed capable of efficiently storing and releasing hydrogen at
90°C. � Determine the hydrogen storage capacity of nanostructured carbon materials;
demonstrate reproducibility of synthesis and capacity measurements. A-K, P-Q
� Develop cost-effective fabrication processes for promising nanostructured carbon materials.
� Explore combinatorial approaches to rapidly identify promising hydrogen storage materials.
� Perform analyses to assess cost effectiveness of reversible hydrogen storage materials including scale-up to high-volume production.
� Explore non-thermal discharging methods, including mechanical, chemical and electrical mechanisms.
� Develop and verify most promising reversible storage materials to meet 2010 targets.
� Develop and verify most promising reversible storage materials to meet 2015 targets.
Page 3.3 - 16 Multi-Year Research, Development and Demonstration Plan
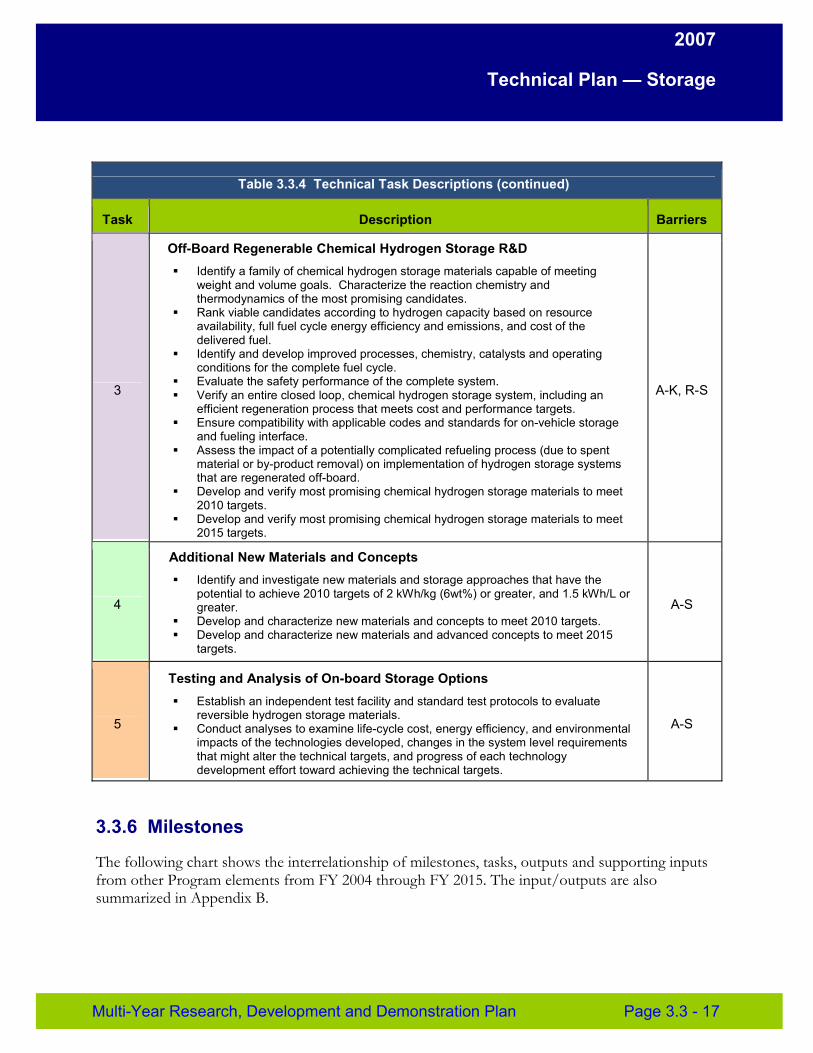
2007
Technical Plan — Storage
Table 3.3.4 Technical Task Descriptions (continued)
Task Description Barriers
3
Off-Board Regenerable Chemical Hydrogen Storage R&D � Identify a family of chemical hydrogen storage materials capable of meeting
weight and volume goals. Characterize the reaction chemistry and thermodynamics of the most promising candidates.
� Rank viable candidates according to hydrogen capacity based on resource availability, full fuel cycle energy efficiency and emissions, and cost of the delivered fuel.
� Identify and develop improved processes, chemistry, catalysts and operating conditions for the complete fuel cycle.
� Evaluate the safety performance of the complete system. � Verify an entire closed loop, chemical hydrogen storage system, including an
efficient regeneration process that meets cost and performance targets. � Ensure compatibility with applicable codes and standards for on-vehicle storage
and fueling interface. � Assess the impact of a potentially complicated refueling process (due to spent
material or by-product removal) on implementation of hydrogen storage systems that are regenerated off-board.
� Develop and verify most promising chemical hydrogen storage materials to meet 2010 targets.
� Develop and verify most promising chemical hydrogen storage materials to meet 2015 targets.
A-K, R-S
4
Additional New Materials and Concepts � Identify and investigate new materials and storage approaches that have the
potential to achieve 2010 targets of 2 kWh/kg (6wt%) or greater, and 1.5 kWh/L or greater.
� Develop and characterize new materials and concepts to meet 2010 targets. � Develop and characterize new materials and advanced concepts to meet 2015
targets.
A-S
5
Testing and Analysis of On-board Storage Options � Establish an independent test facility and standard test protocols to evaluate
reversible hydrogen storage materials. � Conduct analyses to examine life-cycle cost, energy efficiency, and environmental
impacts of the technologies developed, changes in the system level requirements that might alter the technical targets, and progress of each technology development effort toward achieving the technical targets.
A-S
3.3.6 Milestones
The following chart shows the interrelationship of milestones, tasks, outputs and supporting inputs from other Program elements from FY 2004 through FY 2015. The input/outputs are also summarized in Appendix B.
Multi-Year Research, Development and Demonstration Plan Page 3.3 - 17
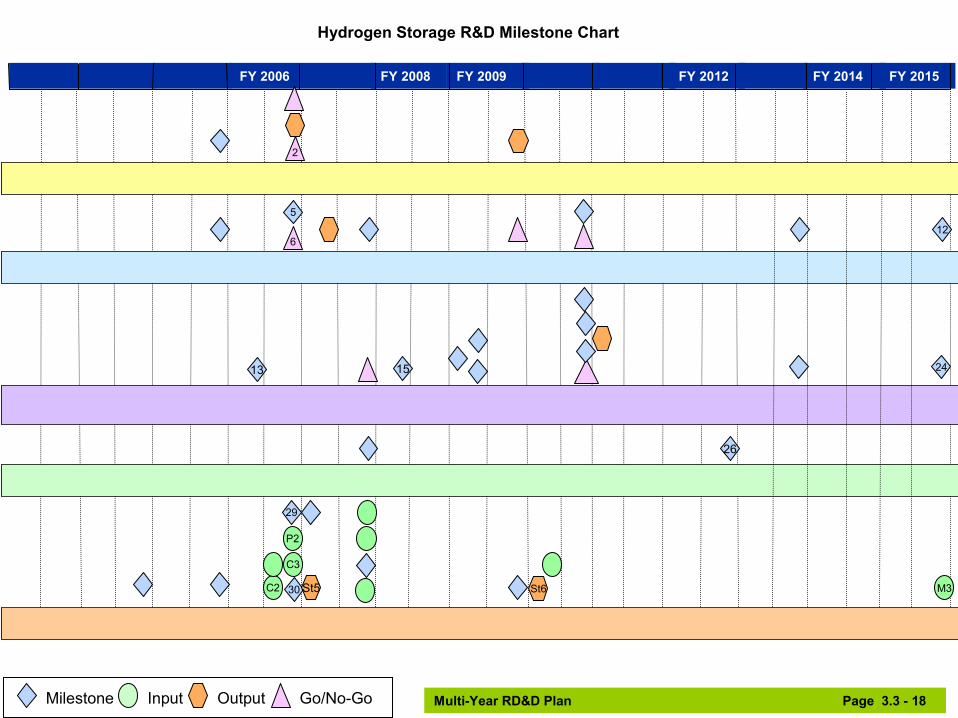
Hydrogen Storage R&D Milestone Chart
FY 2003 FY 2004 FY 2005 FY 2006 FY 2007 FY 2008 FY 2009 FY 2010 FY 2011 FY 2012 FY 2013 FY 2014 FY 2015
3
St1 1 St2
2
Task 1: Advanced Compressed and Cryogenic Tank Technologies
95
4 St3 7 11 128 106
Task 2: Advanced On-board Reversible Materials R&D
19
20
St417 2116 23 2415 13 18 14 22
Task 3: Off-board Regenerable Chemical Hydrogen Storage R&D
25 26
Task 4: Additional New Materials and Concepts
29 31 A0
P2 C5
C1 C3 32 C8
27 28 M3St5 V9 33 St6C2 30
Task 5: Testing and Analysis of On-board Storage Options
Milestone Input Output Go/No-Go Multi-Year RD&D Plan Page 3.3 - 18
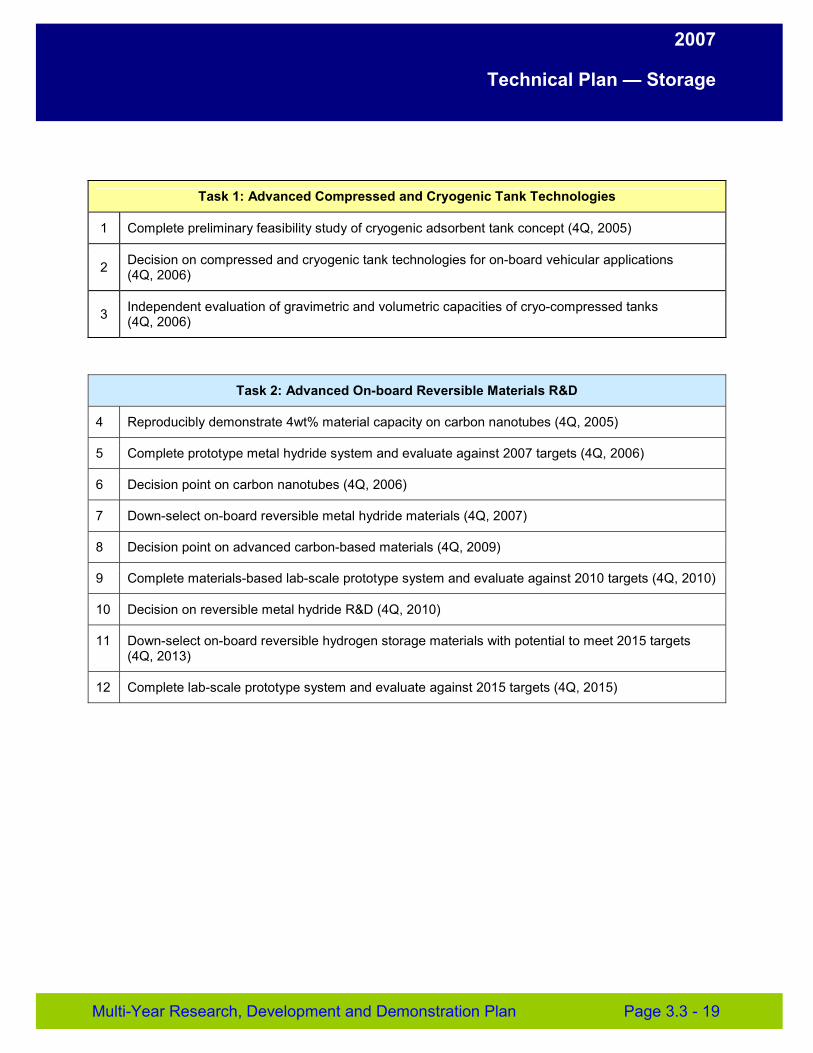
2007
Technical Plan — Storage
Task 1: Advanced Compressed and Cryogenic Tank Technologies
1 Complete preliminary feasibility study of cryogenic adsorbent tank concept (4Q, 2005)
2 Decision on compressed and cryogenic tank technologies for on-board vehicular applications (4Q, 2006)
3 Independent evaluation of gravimetric and volumetric capacities of cryo-compressed tanks (4Q, 2006)
Task 2: Advanced On-board Reversible Materials R&D
4 Reproducibly demonstrate 4wt% material capacity on carbon nanotubes (4Q, 2005)
5 Complete prototype metal hydride system and evaluate against 2007 targets (4Q, 2006)
6 Decision point on carbon nanotubes (4Q, 2006)
7 Down-select on-board reversible metal hydride materials (4Q, 2007)
8 Decision point on advanced carbon-based materials (4Q, 2009)
9 Complete materials-based lab-scale prototype system and evaluate against 2010 targets (4Q, 2010)
10 Decision on reversible metal hydride R&D (4Q, 2010)
11 Down-select on-board reversible hydrogen storage materials with potential to meet 2015 targets (4Q, 2013)
12 Complete lab-scale prototype system and evaluate against 2015 targets (4Q, 2015)
Multi-Year Research, Development and Demonstration Plan Page 3.3 - 19
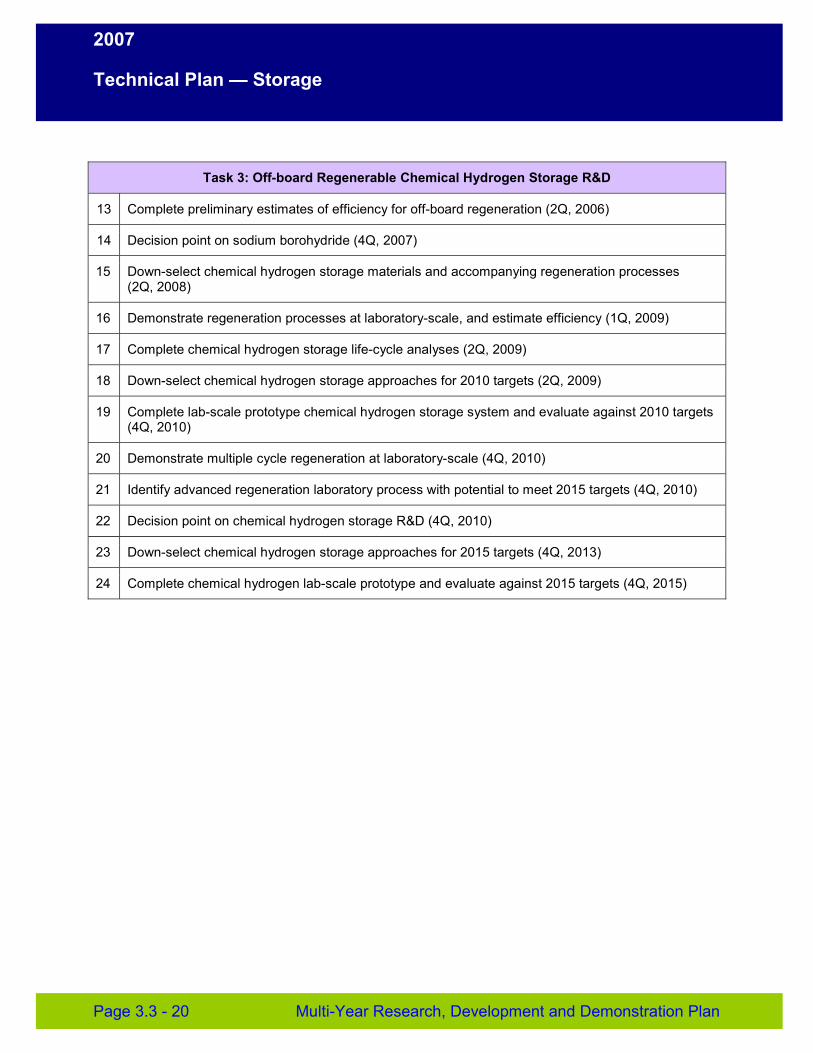
2007
Technical Plan — Storage
Task 3: Off-board Regenerable Chemical Hydrogen Storage R&D
13 Complete preliminary estimates of efficiency for off-board regeneration (2Q, 2006)
14 Decision point on sodium borohydride (4Q, 2007)
15 Down-select chemical hydrogen storage materials and accompanying regeneration processes (2Q, 2008)
16 Demonstrate regeneration processes at laboratory-scale, and estimate efficiency (1Q, 2009)
17 Complete chemical hydrogen storage life-cycle analyses (2Q, 2009)
18 Down-select chemical hydrogen storage approaches for 2010 targets (2Q, 2009)
19 Complete lab-scale prototype chemical hydrogen storage system and evaluate against 2010 targets (4Q, 2010)
20 Demonstrate multiple cycle regeneration at laboratory-scale (4Q, 2010)
21 Identify advanced regeneration laboratory process with potential to meet 2015 targets (4Q, 2010)
22 Decision point on chemical hydrogen storage R&D (4Q, 2010)
23 Down-select chemical hydrogen storage approaches for 2015 targets (4Q, 2013)
24 Complete chemical hydrogen lab-scale prototype and evaluate against 2015 targets (4Q, 2015)
Page 3.3 - 20 Multi-Year Research, Development and Demonstration Plan
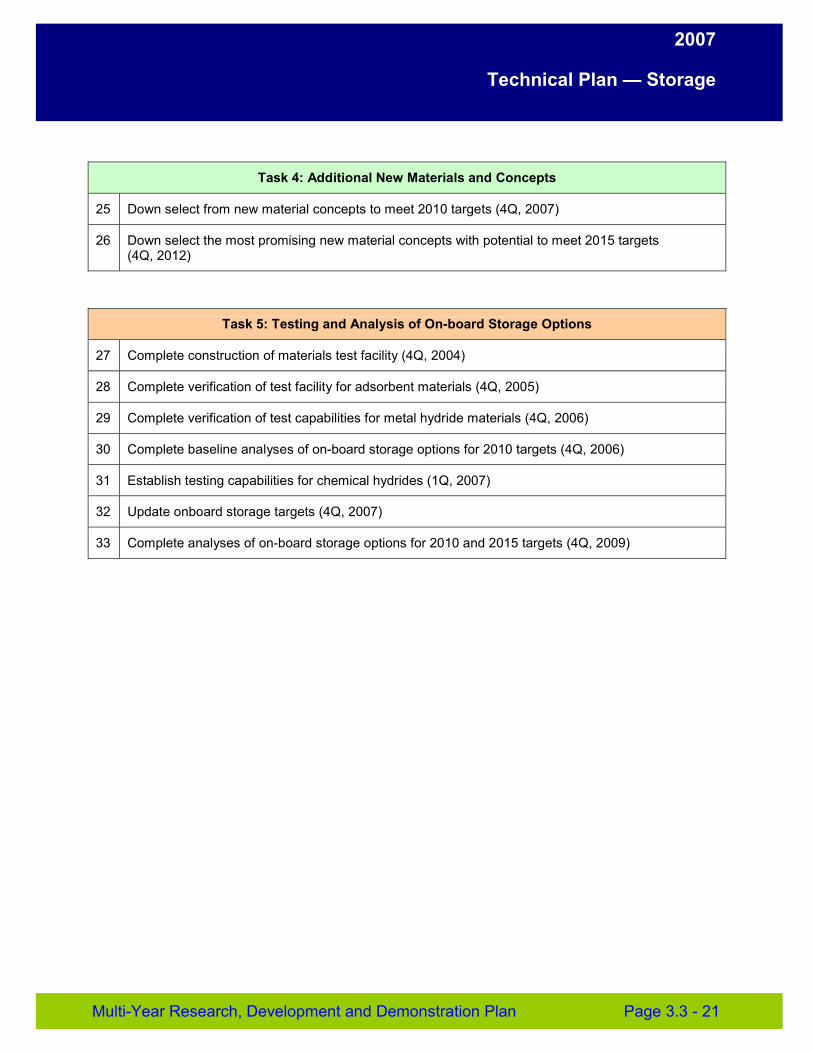
2007
Technical Plan — Storage
Task 4: Additional New Materials and Concepts
25 Down select from new material concepts to meet 2010 targets (4Q, 2007)
26 Down select the most promising new material concepts with potential to meet 2015 targets (4Q, 2012)
Task 5: Testing and Analysis of On-board Storage Options
27 Complete construction of materials test facility (4Q, 2004)
28 Complete verification of test facility for adsorbent materials (4Q, 2005)
29 Complete verification of test capabilities for metal hydride materials (4Q, 2006)
30 Complete baseline analyses of on-board storage options for 2010 targets (4Q, 2006)
31 Establish testing capabilities for chemical hydrides (1Q, 2007)
32 Update onboard storage targets (4Q, 2007)
33 Complete analyses of on-board storage options for 2010 and 2015 targets (4Q, 2009)
Multi-Year Research, Development and Demonstration Plan Page 3.3 - 21
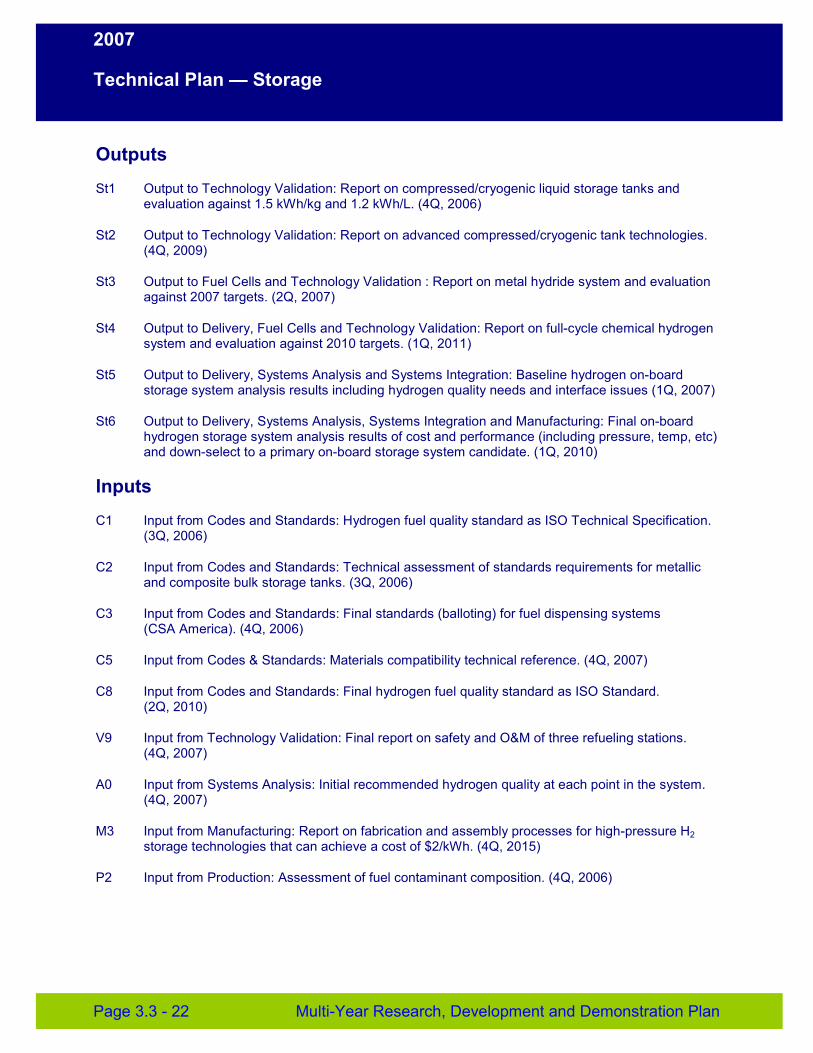
2007
Technical Plan — Storage
Outputs
St1 Output to Technology Validation: Report on compressed/cryogenic liquid storage tanks and evaluation against 1.5 kWh/kg and 1.2 kWh/L. (4Q, 2006)
St2 Output to Technology Validation: Report on advanced compressed/cryogenic tank technologies. (4Q, 2009)
St3 Output to Fuel Cells and Technology Validation : Report on metal hydride system and evaluation against 2007 targets. (2Q, 2007)
St4 Output to Delivery, Fuel Cells and Technology Validation: Report on full-cycle chemical hydrogen system and evaluation against 2010 targets. (1Q, 2011)
St5 Output to Delivery, Systems Analysis and Systems Integration: Baseline hydrogen on-board storage system analysis results including hydrogen quality needs and interface issues (1Q, 2007)
St6 Output to Delivery, Systems Analysis, Systems Integration and Manufacturing: Final on-board hydrogen storage system analysis results of cost and performance (including pressure, temp, etc) and down-select to a primary on-board storage system candidate. (1Q, 2010)
Inputs
C1 Input from Codes and Standards: Hydrogen fuel quality standard as ISO Technical Specification. (3Q, 2006)
C2 Input from Codes and Standards: Technical assessment of standards requirements for metallic and composite bulk storage tanks. (3Q, 2006)
C3 Input from Codes and Standards: Final standards (balloting) for fuel dispensing systems (CSA America). (4Q, 2006)
C5 Input from Codes & Standards: Materials compatibility technical reference. (4Q, 2007)
C8 Input from Codes and Standards: Final hydrogen fuel quality standard as ISO Standard. (2Q, 2010)
V9 Input from Technology Validation: Final report on safety and O&M of three refueling stations. (4Q, 2007)
A0 Input from Systems Analysis: Initial recommended hydrogen quality at each point in the system. (4Q, 2007)
M3 Input from Manufacturing: Report on fabrication and assembly processes for high-pressure H2 storage technologies that can achieve a cost of $2/kWh. (4Q, 2015)
P2 Input from Production: Assessment of fuel contaminant composition. (4Q, 2006)
Page 3.3 - 22 Multi-Year Research, Development and Demonstration Plan
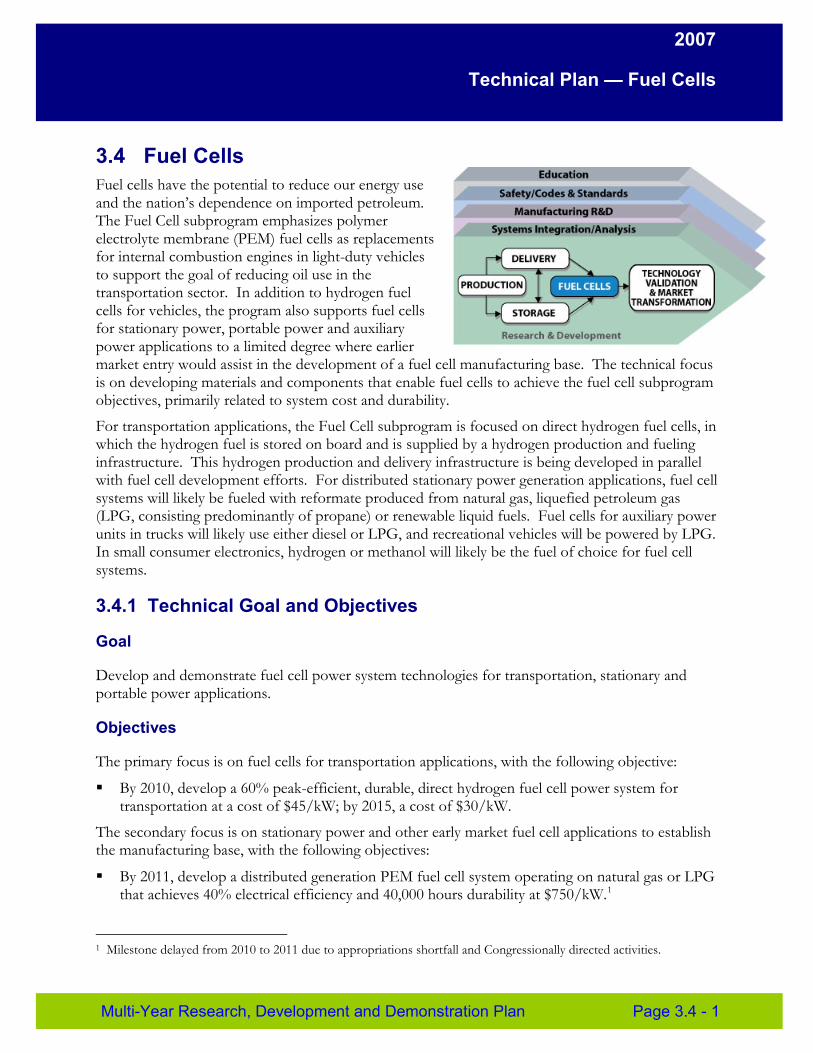
2007
Technical Plan — Fuel Cells
3.4 Fuel Cells Fuel cells have the potential to reduce our energy use and the nation’s dependence on imported petroleum. The Fuel Cell subprogram emphasizes polymer electrolyte membrane (PEM) fuel cells as replacements for internal combustion engines in light-duty vehicles to support the goal of reducing oil use in the transportation sector. In addition to hydrogen fuel cells for vehicles, the program also supports fuel cells for stationary power, portable power and auxiliary power applications to a limited degree where earlier market entry would assist in the development of a fuel cell manufacturing base. The technical focus is on developing materials and components that enable fuel cells to achieve the fuel cell subprogram objectives, primarily related to system cost and durability.
For transportation applications, the Fuel Cell subprogram is focused on direct hydrogen fuel cells, in which the hydrogen fuel is stored on board and is supplied by a hydrogen production and fueling infrastructure. This hydrogen production and delivery infrastructure is being developed in parallel with fuel cell development efforts. For distributed stationary power generation applications, fuel cell systems will likely be fueled with reformate produced from natural gas, liquefied petroleum gas (LPG, consisting predominantly of propane) or renewable liquid fuels. Fuel cells for auxiliary power units in trucks will likely use either diesel or LPG, and recreational vehicles will be powered by LPG. In small consumer electronics, hydrogen or methanol will likely be the fuel of choice for fuel cell systems.
3.4.1 Technical Goal and Objectives
Goal
Develop and demonstrate fuel cell power system technologies for transportation, stationary and portable power applications.
Objectives
The primary focus is on fuel cells for transportation applications, with the following objective:
� By 2010, develop a 60% peak-efficient, durable, direct hydrogen fuel cell power system for transportation at a cost of $45/kW; by 2015, a cost of $30/kW.
The secondary focus is on stationary power and other early market fuel cell applications to establish the manufacturing base, with the following objectives:
� By 2011, develop a distributed generation PEM fuel cell system operating on natural gas or LPG that achieves 40% electrical efficiency and 40,000 hours durability at $750/kW.1
1 Milestone delayed from 2010 to 2011 due to appropriations shortfall and Congressionally directed activities.
Multi-Year Research, Development and Demonstration Plan Page 3.4 - 1
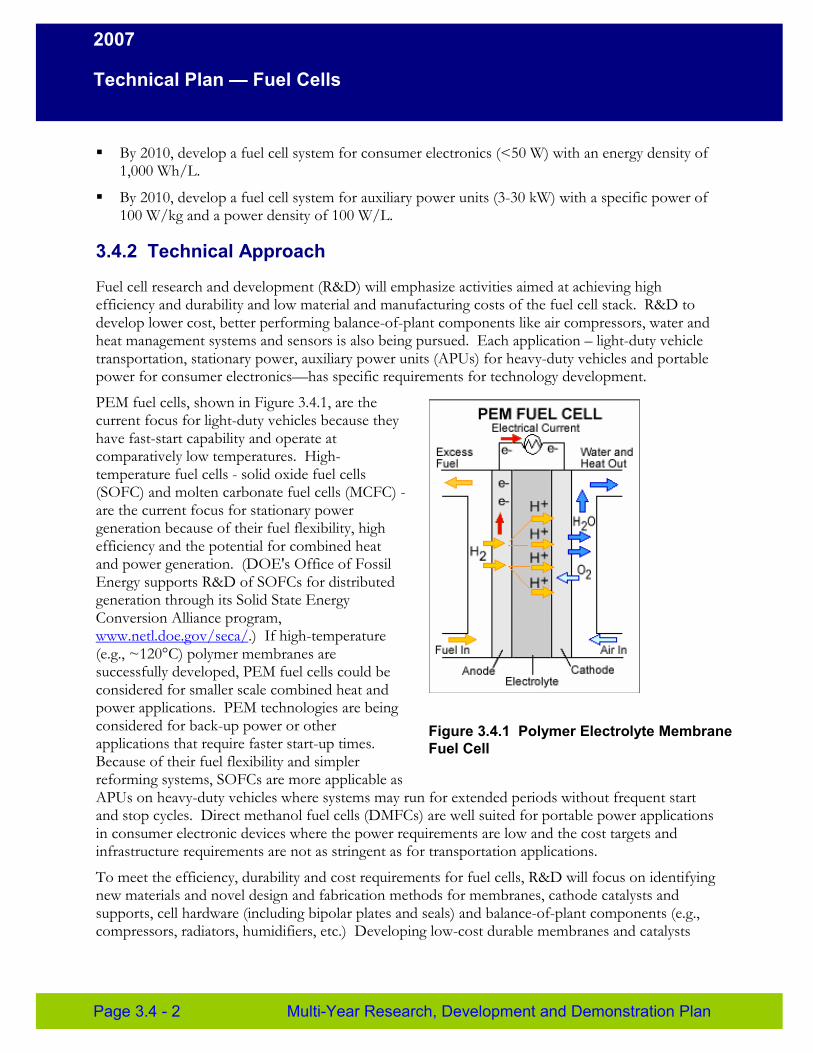
2007
Technical Plan — Fuel Cells
� By 2010, develop a fuel cell system for consumer electronics (<50 W) with an energy density of 1,000 Wh/L.
� By 2010, develop a fuel cell system for auxiliary power units (3-30 kW) with a specific power of 100 W/kg and a power density of 100 W/L.
3.4.2 Technical Approach
Fuel cell research and development (R&D) will emphasize activities aimed at achieving high efficiency and durability and low material and manufacturing costs of the fuel cell stack. R&D to develop lower cost, better performing balance-of-plant components like air compressors, water and heat management systems and sensors is also being pursued. Each application – light-duty vehicle transportation, stationary power, auxiliary power units (APUs) for heavy-duty vehicles and portable power for consumer electronics—has specific requirements for technology development.
PEM fuel cells, shown in Figure 3.4.1, are the current focus for light-duty vehicles because they have fast-start capability and operate at comparatively low temperatures. High-temperature fuel cells - solid oxide fuel cells (SOFC) and molten carbonate fuel cells (MCFC) are the current focus for stationary power generation because of their fuel flexibility, high efficiency and the potential for combined heat and power generation. (DOE's Office of Fossil Energy supports R&D of SOFCs for distributed generation through its Solid State Energy Conversion Alliance program, www.netl.doe.gov/seca/.) If high-temperature (e.g., ~120°C) polymer membranes are successfully developed, PEM fuel cells could be considered for smaller scale combined heat and power applications. PEM technologies are being considered for back-up power or other Figure 3.4.1 Polymer Electrolyte Membrane applications that require faster start-up times. Fuel Cell Because of their fuel flexibility and simpler reforming systems, SOFCs are more applicable as APUs on heavy-duty vehicles where systems may run for extended periods without frequent start and stop cycles. Direct methanol fuel cells (DMFCs) are well suited for portable power applications in consumer electronic devices where the power requirements are low and the cost targets and infrastructure requirements are not as stringent as for transportation applications.
To meet the efficiency, durability and cost requirements for fuel cells, R&D will focus on identifying new materials and novel design and fabrication methods for membranes, cathode catalysts and supports, cell hardware (including bipolar plates and seals) and balance-of-plant components (e.g., compressors, radiators, humidifiers, etc.) Developing low-cost durable membranes and catalysts
Page 3.4 - 2 Multi-Year Research, Development and Demonstration Plan
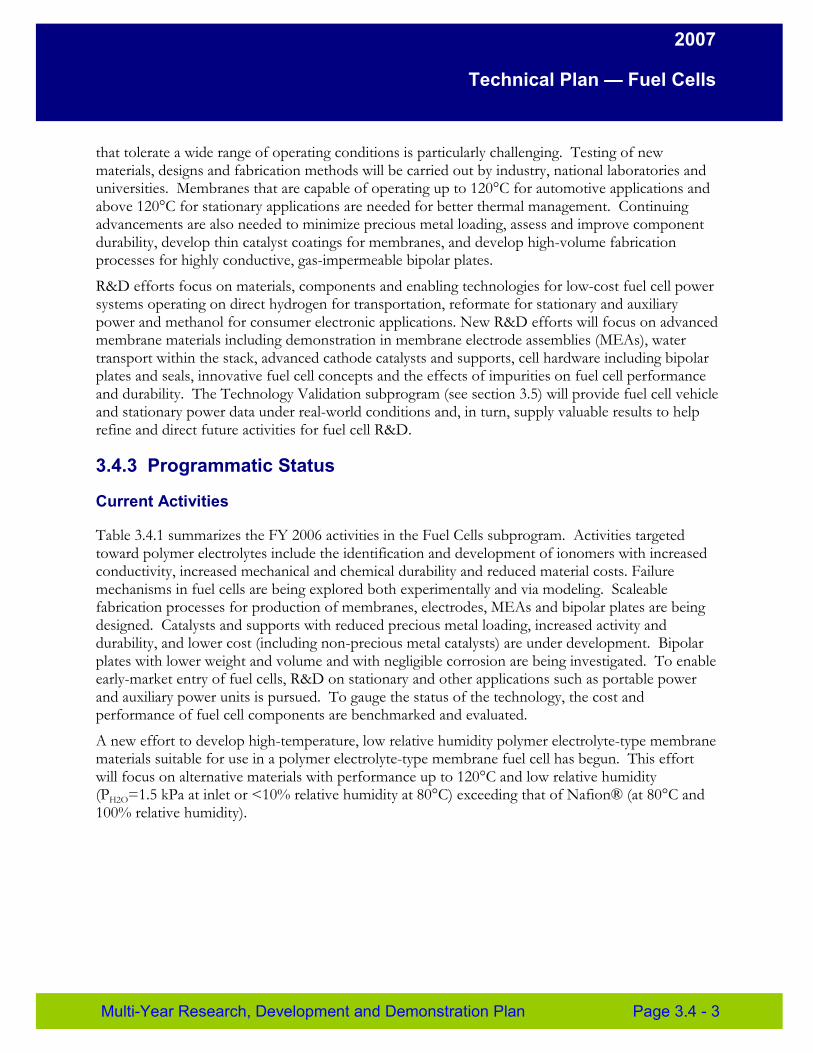
2007
Technical Plan — Fuel Cells
that tolerate a wide range of operating conditions is particularly challenging. Testing of new materials, designs and fabrication methods will be carried out by industry, national laboratories and universities. Membranes that are capable of operating up to 120°C for automotive applications and above 120°C for stationary applications are needed for better thermal management. Continuing advancements are also needed to minimize precious metal loading, assess and improve component durability, develop thin catalyst coatings for membranes, and develop high-volume fabrication processes for highly conductive, gas-impermeable bipolar plates.
R&D efforts focus on materials, components and enabling technologies for low-cost fuel cell power systems operating on direct hydrogen for transportation, reformate for stationary and auxiliary power and methanol for consumer electronic applications. New R&D efforts will focus on advanced membrane materials including demonstration in membrane electrode assemblies (MEAs), water transport within the stack, advanced cathode catalysts and supports, cell hardware including bipolar plates and seals, innovative fuel cell concepts and the effects of impurities on fuel cell performance and durability. The Technology Validation subprogram (see section 3.5) will provide fuel cell vehicle and stationary power data under real-world conditions and, in turn, supply valuable results to help refine and direct future activities for fuel cell R&D.
3.4.3 Programmatic Status
Current Activities
Table 3.4.1 summarizes the FY 2006 activities in the Fuel Cells subprogram. Activities targeted toward polymer electrolytes include the identification and development of ionomers with increased conductivity, increased mechanical and chemical durability and reduced material costs. Failure mechanisms in fuel cells are being explored both experimentally and via modeling. Scaleable fabrication processes for production of membranes, electrodes, MEAs and bipolar plates are being designed. Catalysts and supports with reduced precious metal loading, increased activity and durability, and lower cost (including non-precious metal catalysts) are under development. Bipolar plates with lower weight and volume and with negligible corrosion are being investigated. To enable early-market entry of fuel cells, R&D on stationary and other applications such as portable power and auxiliary power units is pursued. To gauge the status of the technology, the cost and performance of fuel cell components are benchmarked and evaluated.
A new effort to develop high-temperature, low relative humidity polymer electrolyte-type membrane materials suitable for use in a polymer electrolyte-type membrane fuel cell has begun. This effort will focus on alternative materials with performance up to 120°C and low relative humidity (PH2O=1.5 kPa at inlet or <10% relative humidity at 80°C) exceeding that of Nafion® (at 80°C and 100% relative humidity).
Multi-Year Research, Development and Demonstration Plan Page 3.4 - 3

2007
Technical Plan — Fuel Cells
Challenge
Table 3.4.1 Current Fuel Cell Activities
Approach Activities
Membranes
Develop � Identify / develop ionomers / membranes � Plug Power: Polybenzimidazole-based, membranes that with reduced raw material cost high-temperature membranes meet all targets �
�
�
Identify / develop ionomers / membranes with improved conductivity and mechanical / chemical / thermal stability over the entire temperature and humidity range Test and characterize membranes to improve durability Design scaleable membrane fabrication processes for producing membranes with mechanical / chemical / thermal stability over the entire temperature and humidity range
� Arkema Chemicals: Polyvinylidenefluoridebased membranes
� 3M: Perfluorosulfonic acid membranes with extended lifetime
� Case Western Reserve University: Nanocapillary network proton conducting membranes for high-temperature fuel cells
� Case Western Reserve University: Poly (p-phenylene sulfonic acid) with frozen-in free volume for high-temperature fuel cells
� Arizona State University: Protic salt polymer membranes
� Clemson University: Fluoroalkylphosphonic-acid-based proton conductors
� Colorado School of Mines: Hybrid heteropoly acid organic / inorganic composite materials
� FuelCell Energy, Inc.: High-temperature membrane with humidification-independent cluster structure
� GE Global Research: High-performance polymer fuel cell membranes
� Giner Electrochemical Systems: Dimensionally stable high-temperature membranes
� Pennsylvania State University: New proton-conducting composite materials
� Virginia Tech: New multiblock co-polymers with proton-conducting fillers
� The University of Tennessee: Poly(cyclohexadiene)-based polymer electrolyte membranes
� University of Central Florida: Polymeric electrolyte/phosphotungstic acid composite membranes
Page 3.4 - 4 Multi-Year Research, Development and Demonstration Plan
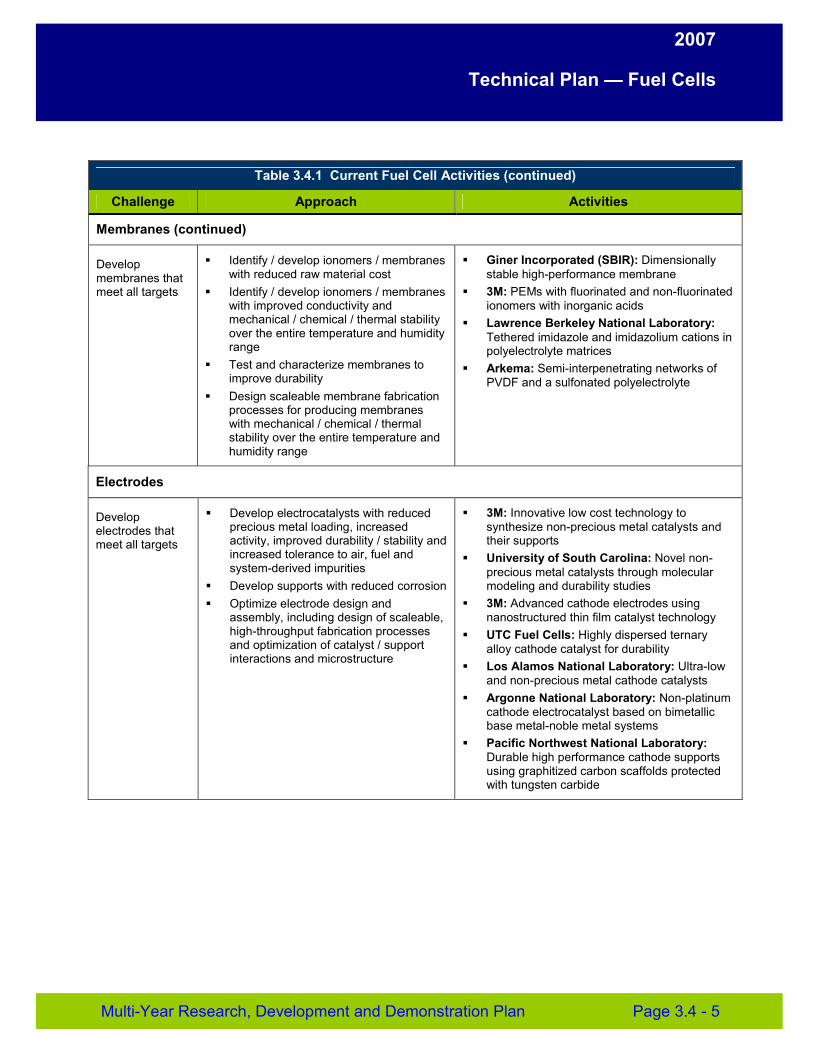
2007
Technical Plan — Fuel Cells
Table 3.4.1 Current Fuel Cell Activities (continued)
Challenge Approach Activities
Membranes (continued)
Develop � Identify / develop ionomers / membranes � Giner Incorporated (SBIR): Dimensionally membranes that with reduced raw material cost stable high-performance membrane meet all targets � Identify / develop ionomers / membranes
with improved conductivity and mechanical / chemical / thermal stability over the entire temperature and humidity range
� Test and characterize membranes to improve durability
� Design scaleable membrane fabrication processes for producing membranes with mechanical / chemical / thermal stability over the entire temperature and humidity range
� 3M: PEMs with fluorinated and non-fluorinated ionomers with inorganic acids
� Lawrence Berkeley National Laboratory: Tethered imidazole and imidazolium cations in polyelectrolyte matrices
� Arkema: Semi-interpenetrating networks of PVDF and a sulfonated polyelectrolyte
Electrodes
Develop � Develop electrocatalysts with reduced � 3M: Innovative low cost technology to electrodes that precious metal loading, increased synthesize non-precious metal catalysts and meet all targets activity, improved durability / stability and
increased tolerance to air, fuel and system-derived impurities
� Develop supports with reduced corrosion � Optimize electrode design and
assembly, including design of scaleable, high-throughput fabrication processes and optimization of catalyst / support interactions and microstructure
their supports � University of South Carolina: Novel non-
precious metal catalysts through molecular modeling and durability studies
� 3M: Advanced cathode electrodes using nanostructured thin film catalyst technology
� UTC Fuel Cells: Highly dispersed ternary alloy cathode catalyst for durability
� Los Alamos National Laboratory: Ultra-low and non-precious metal cathode catalysts
� Argonne National Laboratory: Non-platinum cathode electrocatalyst based on bimetallic base metal-noble metal systems
� Pacific Northwest National Laboratory: Durable high performance cathode supports using graphitized carbon scaffolds protected with tungsten carbide
Multi-Year Research, Development and Demonstration Plan Page 3.4 - 5
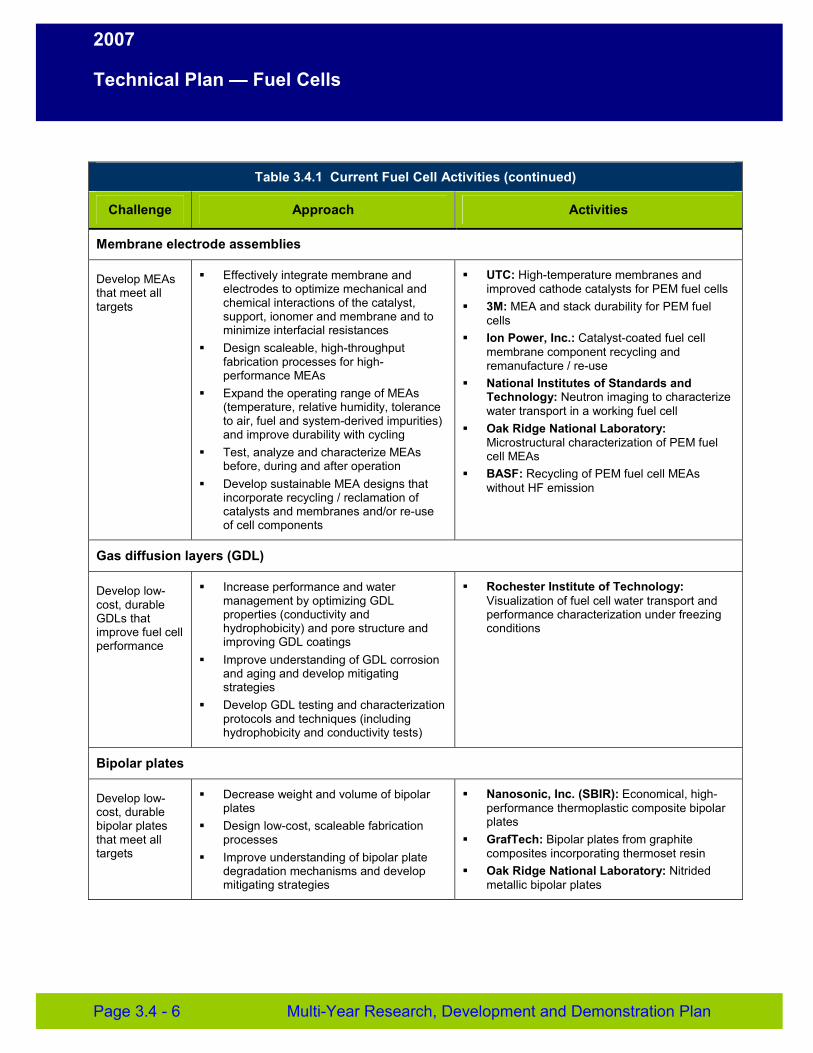
2007
Technical Plan — Fuel Cells
Table 3.4.1 Current Fuel Cell Activities (continued)
Challenge Approach Activities
Membrane electrode assemblies
Develop MEAs � Effectively integrate membrane and � UTC: High-temperature membranes and that meet all electrodes to optimize mechanical and improved cathode catalysts for PEM fuel cells targets chemical interactions of the catalyst,
support, ionomer and membrane and to minimize interfacial resistances
� Design scaleable, high-throughput fabrication processes for high-performance MEAs
� Expand the operating range of MEAs (temperature, relative humidity, tolerance to air, fuel and system-derived impurities) and improve durability with cycling
� Test, analyze and characterize MEAs
� 3M: MEA and stack durability for PEM fuel cells
� Ion Power, Inc.: Catalyst-coated fuel cell membrane component recycling and remanufacture / re-use
� National Institutes of Standards and Technology: Neutron imaging to characterize water transport in a working fuel cell
� Oak Ridge National Laboratory: Microstructural characterization of PEM fuel cell MEAs
before, during and after operation � Develop sustainable MEA designs that
incorporate recycling / reclamation of
� BASF: Recycling of PEM fuel cell MEAs without HF emission
catalysts and membranes and/or re-use of cell components
Gas diffusion layers (GDL)
Develop low � Increase performance and water � Rochester Institute of Technology: cost, durable management by optimizing GDL Visualization of fuel cell water transport and GDLs that properties (conductivity and performance characterization under freezing improve fuel cell hydrophobicity) and pore structure and conditions performance improving GDL coatings
� Improve understanding of GDL corrosion and aging and develop mitigating strategies
� Develop GDL testing and characterization protocols and techniques (including hydrophobicity and conductivity tests)
Bipolar plates
Develop low � Decrease weight and volume of bipolar � Nanosonic, Inc. (SBIR): Economical, high-cost, durable plates performance thermoplastic composite bipolar bipolar plates � Design low-cost, scaleable fabrication plates that meet all processes � GrafTech: Bipolar plates from graphite targets � Improve understanding of bipolar plate
degradation mechanisms and develop mitigating strategies
composites incorporating thermoset resin � Oak Ridge National Laboratory: Nitrided
metallic bipolar plates
Page 3.4 - 6 Multi-Year Research, Development and Demonstration Plan
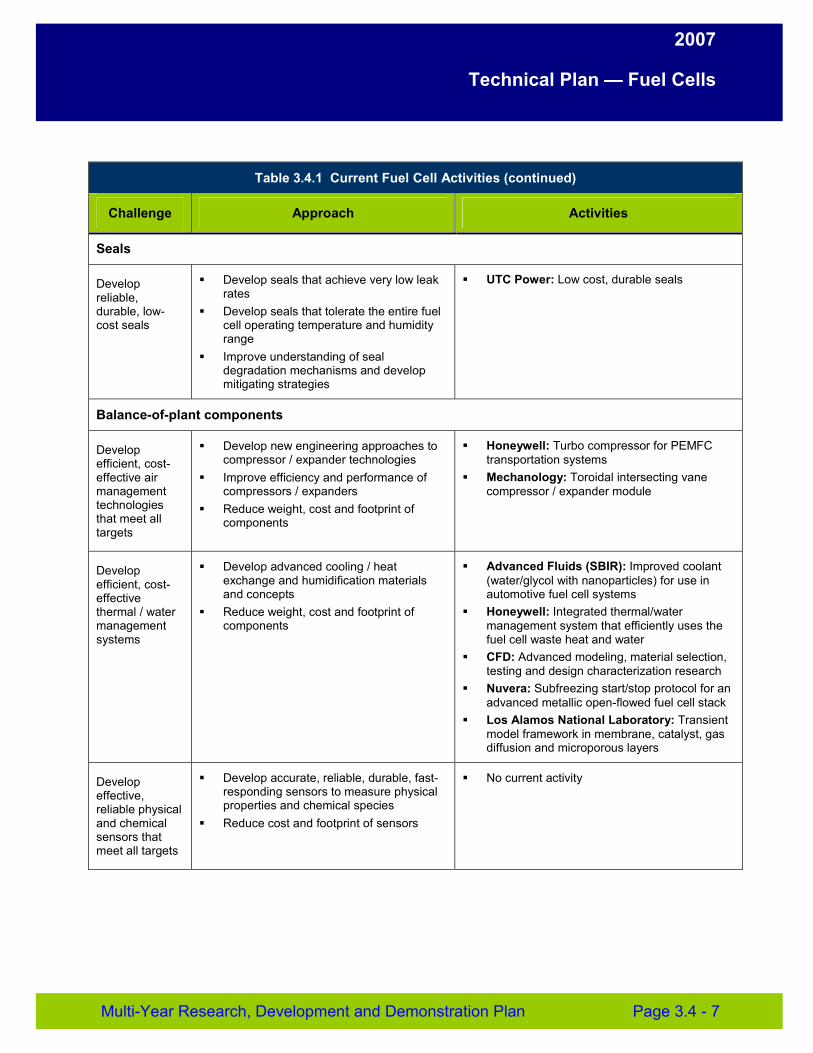
2007
Technical Plan — Fuel Cells
Table 3.4.1 Current Fuel Cell Activities (continued)
Challenge Approach Activities
Seals
Develop � Develop seals that achieve very low leak � UTC Power: Low cost, durable seals reliable, rates durable, low � Develop seals that tolerate the entire fuel cost seals cell operating temperature and humidity
range � Improve understanding of seal
degradation mechanisms and develop mitigating strategies
Balance-of-plant components
Develop � Develop new engineering approaches to � Honeywell: Turbo compressor for PEMFC efficient, cost- compressor / expander technologies transportation systems effective air � Improve efficiency and performance of � Mechanology: Toroidal intersecting vane management compressors / expanders compressor / expander module technologies � Reduce weight, cost and footprint of that meet all components targets
Develop � Develop advanced cooling / heat � Advanced Fluids (SBIR): Improved coolant efficient, cost- exchange and humidification materials (water/glycol with nanoparticles) for use in effective and concepts automotive fuel cell systems thermal / water � Reduce weight, cost and footprint of � Honeywell: Integrated thermal/water management components management system that efficiently uses the systems fuel cell waste heat and water
� CFD: Advanced modeling, material selection, testing and design characterization research
� Nuvera: Subfreezing start/stop protocol for an advanced metallic open-flowed fuel cell stack
� Los Alamos National Laboratory: Transient model framework in membrane, catalyst, gas diffusion and microporous layers
Develop effective, reliable physical and chemical sensors that meet all targets
� Develop accurate, reliable, durable, fast-responding sensors to measure physical properties and chemical species
� Reduce cost and footprint of sensors
� No current activity
Multi-Year Research, Development and Demonstration Plan Page 3.4 - 7
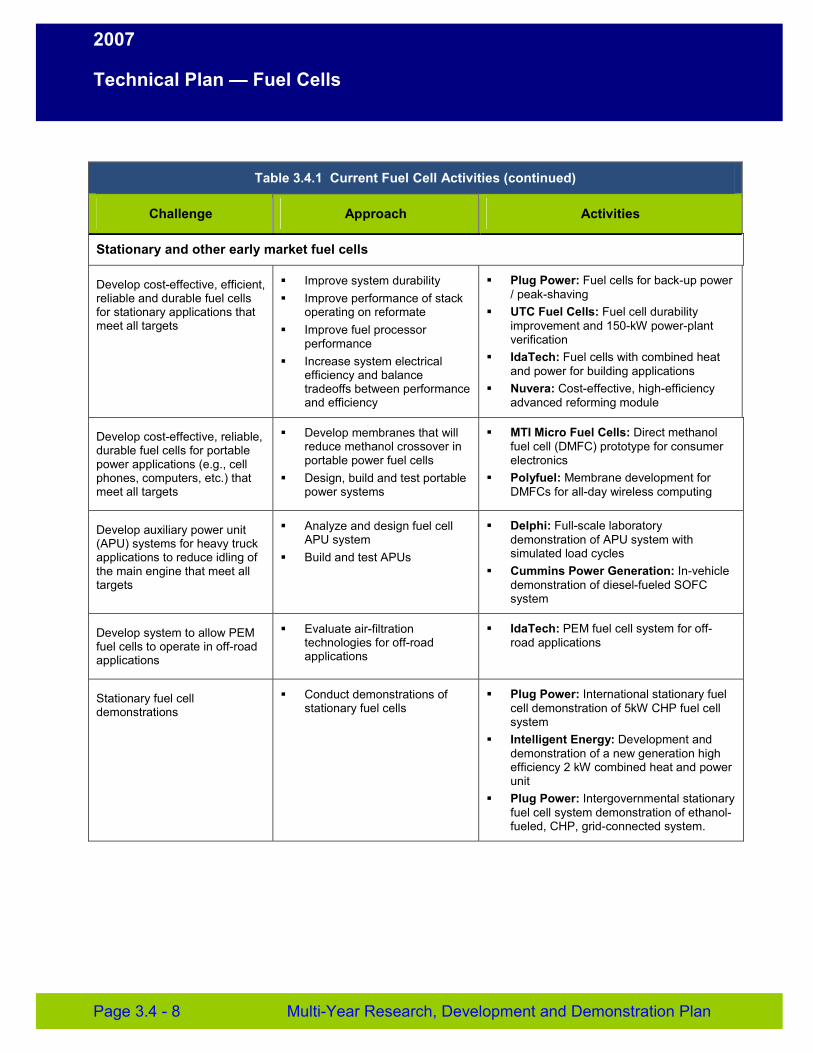
2007
Technical Plan — Fuel Cells
Table 3.4.1 Current Fuel Cell Activities (continued)
Challenge Approach Activities
Stationary and other early market fuel cells
Develop cost-effective, efficient, reliable and durable fuel cells for stationary applications that meet all targets
� Improve system durability � Improve performance of stack
operating on reformate � Improve fuel processor
performance � Increase system electrical
efficiency and balance tradeoffs between performance and efficiency
� Plug Power: Fuel cells for back-up power / peak-shaving
� UTC Fuel Cells: Fuel cell durability improvement and 150-kW power-plant verification
� IdaTech: Fuel cells with combined heat and power for building applications
� Nuvera: Cost-effective, high-efficiency advanced reforming module
Develop cost-effective, reliable, durable fuel cells for portable power applications (e.g., cell phones, computers, etc.) that meet all targets
� Develop membranes that will reduce methanol crossover in portable power fuel cells
� Design, build and test portable power systems
� MTI Micro Fuel Cells: Direct methanol fuel cell (DMFC) prototype for consumer electronics
� Polyfuel: Membrane development for DMFCs for all-day wireless computing
Develop auxiliary power unit (APU) systems for heavy truck applications to reduce idling of the main engine that meet all targets
� Analyze and design fuel cell APU system
� Build and test APUs
� Delphi: Full-scale laboratory demonstration of APU system with simulated load cycles
� Cummins Power Generation: In-vehicle demonstration of diesel-fueled SOFC system
Develop system to allow PEM fuel cells to operate in off-road applications
� Evaluate air-filtration technologies for off-road applications
� IdaTech: PEM fuel cell system for off-road applications
Stationary fuel cell � Conduct demonstrations of � Plug Power: International stationary fuel demonstrations stationary fuel cells cell demonstration of 5kW CHP fuel cell
system � Intelligent Energy: Development and
demonstration of a new generation high efficiency 2 kW combined heat and power unit
� Plug Power: Intergovernmental stationary fuel cell system demonstration of ethanol-fueled, CHP, grid-connected system.
Page 3.4 - 8 Multi-Year Research, Development and Demonstration Plan
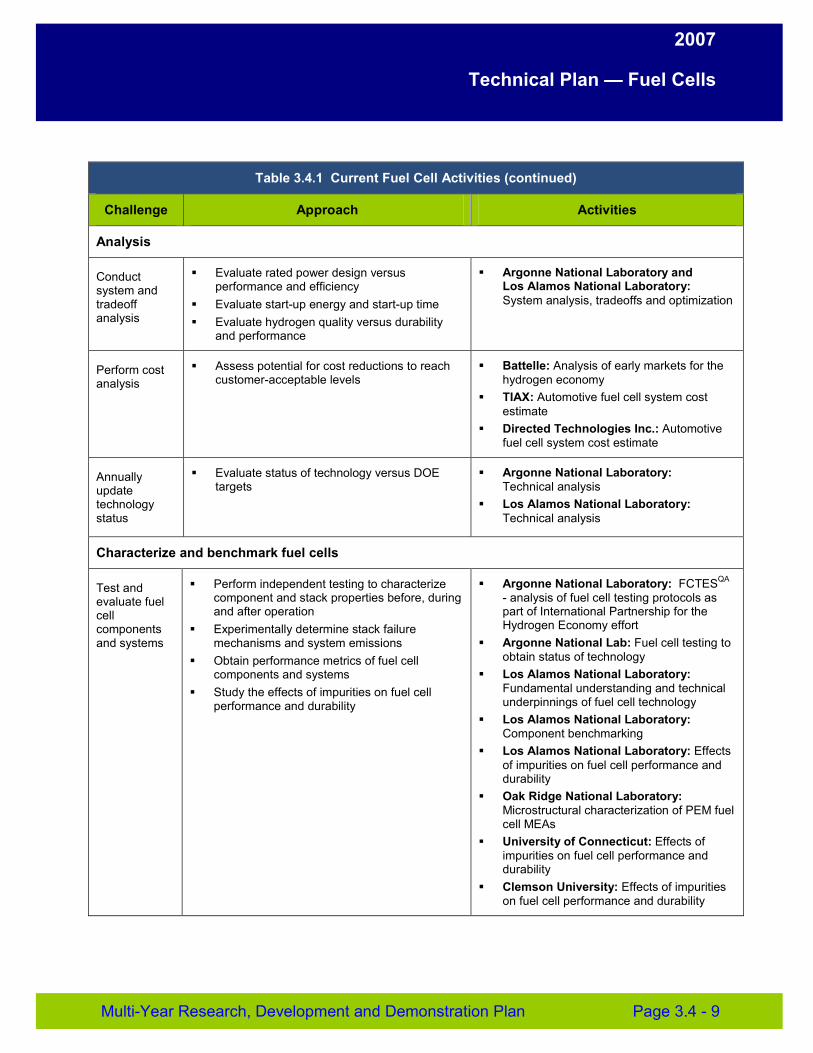
2007
Technical Plan — Fuel Cells
Table 3.4.1 Current Fuel Cell Activities (continued)
Challenge Approach Activities
Analysis
Conduct system and
� Evaluate rated power design versus performance and efficiency
� Argonne National Laboratory and Los Alamos National Laboratory:
tradeoff � Evaluate start-up energy and start-up time System analysis, tradeoffs and optimization analysis � Evaluate hydrogen quality versus durability
and performance
Perform cost � Assess potential for cost reductions to reach � Battelle: Analysis of early markets for the analysis customer-acceptable levels hydrogen economy
� TIAX: Automotive fuel cell system cost estimate
� Directed Technologies Inc.: Automotive fuel cell system cost estimate
Annually � Evaluate status of technology versus DOE � Argonne National Laboratory: update targets Technical analysis technology � Los Alamos National Laboratory: status Technical analysis
Characterize and benchmark fuel cells
Test and � Perform independent testing to characterize � Argonne National Laboratory: FCTESQA
evaluate fuel component and stack properties before, during - analysis of fuel cell testing protocols as cell and after operation part of International Partnership for the components � Experimentally determine stack failure Hydrogen Economy effort and systems mechanisms and system emissions
� Obtain performance metrics of fuel cell components and systems
� Study the effects of impurities on fuel cell performance and durability
� Argonne National Lab: Fuel cell testing to obtain status of technology
� Los Alamos National Laboratory: Fundamental understanding and technical underpinnings of fuel cell technology
� Los Alamos National Laboratory: Component benchmarking
� Los Alamos National Laboratory: Effects of impurities on fuel cell performance and durability
� Oak Ridge National Laboratory: Microstructural characterization of PEM fuel cell MEAs
� University of Connecticut: Effects of impurities on fuel cell performance and durability
� Clemson University: Effects of impurities on fuel cell performance and durability
Multi-Year Research, Development and Demonstration Plan Page 3.4 - 9
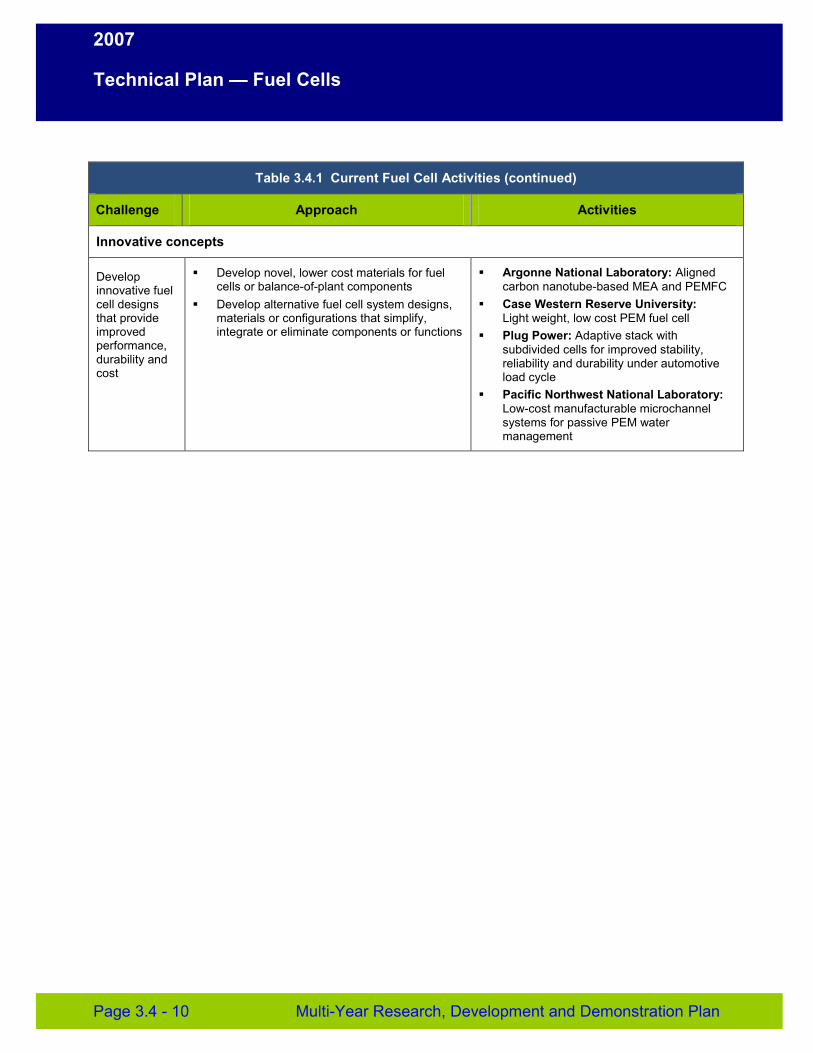
2007
Technical Plan — Fuel Cells
Table 3.4.1 Current Fuel Cell Activities (continued)
Challenge Approach Activities
Innovative concepts
Develop innovative fuel cell designs that provide improved performance, durability and cost
� Develop novel, lower cost materials for fuel cells or balance-of-plant components
� Develop alternative fuel cell system designs, materials or configurations that simplify, integrate or eliminate components or functions
� Argonne National Laboratory: Aligned carbon nanotube-based MEA and PEMFC
� Case Western Reserve University: Light weight, low cost PEM fuel cell
� Plug Power: Adaptive stack with subdivided cells for improved stability, reliability and durability under automotive load cycle
� Pacific Northwest National Laboratory: Low-cost manufacturable microchannel systems for passive PEM water management
Page 3.4 - 10 Multi-Year Research, Development and Demonstration Plan
2007
Technical Plan — Fuel Cells
3.4.4 Technical Challenges
Cost and durability are the major challenges to fuel cell commercialization. Size and weight are approaching targets but further reductions are needed to meet packaging requirements for commercial systems. The tolerance of fuel cell stacks to impurities has not been established. Tolerance to air, fuel and system-derived impurities (including the storage system) needs to be established. Operation at low relative humidity (PH2O=1.5 kPa at inlet or <10% relative humidity at 80°C) and start-up from sub-freezing temperatures has not been demonstrated. Cost, efficiency and packaging of fuel cell balance-of-plant components are also barriers to the commercialization of fuel cells. For transportation applications, fuel cell technologies face more stringent cost and durability requirements. In stationary power applications, raising the operating temperature of PEMs to increase fuel cell performance will also improve heat and power cogeneration and overall system efficiency. Fuel cell systems for consumer electronics need to have improved energy density to compete with batteries, and fuel cells for auxiliary power need to have a reduced size and weight to meet packaging requirements for heavy-duty trucks.
Transportation Systems
The cost of fuel cell power systems must be reduced before they can be competitive with gasoline internal combustion engines (ICEs). Automotive ICE power plants currently cost about $25-35 / kW; a fuel cell system needs to cost less than $50 / kW for the technology to be competitive. A significant fraction of the cost of a PEM fuel cell comes from precious-metal catalysts that are currently used on the anode and cathode for the electrochemical reactions. Other key cost factors include the membrane, cell hardware and balance-of-plant components.
The durability of fuel cell systems operating under automotive conditions has not been established. Fuel cell power systems will be required to be as durable and reliable as current automotive engines (i.e., 5,000 hour lifespan [150,000 miles equivalent]) and able to function over the full range of external environmental conditions (-40° to +40°C). Membranes are critical components of the fuel cell stack and must be able to perform over the full range of system operating temperatures with less than 5% loss of performance by the end of life and without external humidification. External humidification adds cost and complexity to the system. The durability of catalysts is also an issue and can be compromised by platinum sintering and dissolution, especially under conditions of load-cycling and high electrode potentials. Carbon support corrosion is another challenge at high electrode potentials and can worsen under load cycling and high-temperature operation.
Fuel cell and stack hardware (bipolar plates, gas diffusion layers and seals) also need further development. Bipolar plates represent a significant fraction of stack weight, which must be reduced. Seal materials must be durable over the lifetime of a fuel cell and yield acceptable leak rates.
Air management for fuel cell systems is a challenge because today’s compressor technologies are not suitable for automotive fuel cell applications. In addition, thermal and water management for fuel cells are issues. Fuel cell operation at lower temperatures creates a small differential between the operating and ambient temperatures necessitating large heat exchangers and humidifiers. These components increase the cost and complexity of the system and use some of the power that is produced, reducing overall system efficiency.
Multi-Year Research, Development and Demonstration Plan Page 3.4 - 11
2007
Technical Plan — Fuel Cells
The size and weight of current fuel cell systems must be further reduced to meet the packaging requirements for automobiles. Size and weight reduction applies not only to the fuel cell stack (catalysts, membranes, gas diffusion media and bipolar plates), but also to the ancillary components (e.g., compressor / expander, heat exchangers, humidifiers and sensors) that make up the balanceof-plant. Finally, lightweight, compact on-board hydrogen storage systems and economically viable hydrogen fuel also present challenges (see sections 3.3, 3.1 and 3.2).
Stationary / Distributed Generation and Other Fuel Cell Systems
Even though the specific performance requirements differ from transportation applications, some of the technical challenges for stationary and other fuel cell systems are the same. For example, the overall cost of these fuel cell power systems must also be competitive with conventional technologies or offer enhanced capabilities. However, stationary and other fuel cell systems have an acceptable price point considerably higher than transportation systems.
Performance of fuel cells for stationary applications for up to 20,000 hours has been demonstrated but market acceptance of stationary applications will likely necessitate more than 40,000 hours of reliable operation over the full range of external environmental conditions (-35° to 40°C).
The low operating temperature of PEM fuel cells limits the amount of waste heat that can be effectively used in combined heat and power (CHP) applications. Technologies need to be developed that will allow higher operating temperatures and/or more effective heat recovery systems. Improved system designs that will enable CHP efficiencies exceeding 80% are also needed. Technologies that allow the thermal energy rejected from stationary fuel cell systems to be utilized in heating and cooling systems also need to be evaluated. For example, the thermal energy can be utilized to regenerate desiccants in a desiccant cooling cycle. Start-up times need to be decreased in stationary fuel cell back-up power systems that operate on direct hydrogen.
Fuel cell systems for consumer electronics need to have improved energy density by more than a factor of three to compete with batteries. Fuel cells for auxiliary power applications need to have increased specific power and power density (by a factor of four) to meet packaging requirements for heavy-duty trucks.
Technical Targets Tables 3.4.2 and 3.4.3 list the DOE technical targets specifically for integrated PEM fuel cell power systems and fuel cell stacks operating on direct hydrogen for transportation applications. These targets have been developed with input from the FreedomCAR and Fuel Partnership, which includes automotive and energy companies, specifically the Fuel Cell Technical Team. Tables 3.4.4 through 3.4.6 list the DOE technical targets for stationary applications. The targets have been developed with input from developers of stationary fuel cell power systems. These R&D targets do not go beyond 2011 because stationary applications are closer to market than transportation applications. The 2011 targets are those that would be necessary for technology readiness.
Tables 3.4.7 and 3.4.8 list the DOE technical targets for consumer electronics, and APUs and truck refrigeration. Tables 3.4.9 and 3.4.10 list DOE technical targets for automotive and stationary fuel cell system sensors and automotive compressor / expander units. Tables 3.4.11 through 3.4.14 list DOE technical targets for fuel cell components: membranes, electrodes / catalysts, membrane
Page 3.4 - 12 Multi-Year Research, Development and Demonstration Plan

2007
Technical Plan — Fuel Cells
electrode assemblies and bipolar plates. Addition of these tables reflects a shift in program focus from development of fuel cell systems and stacks to component-level research. The tables will assist component developers in evaluating progress without testing full systems.
A draft specification of hydrogen quality required as input into the fuel cell system is provided in Appendix C.
All targets must be achieved simultaneously; however, the status values are not necessarily from a single system.
Multi-Year Research, Development and Demonstration Plan Page 3.4 - 13
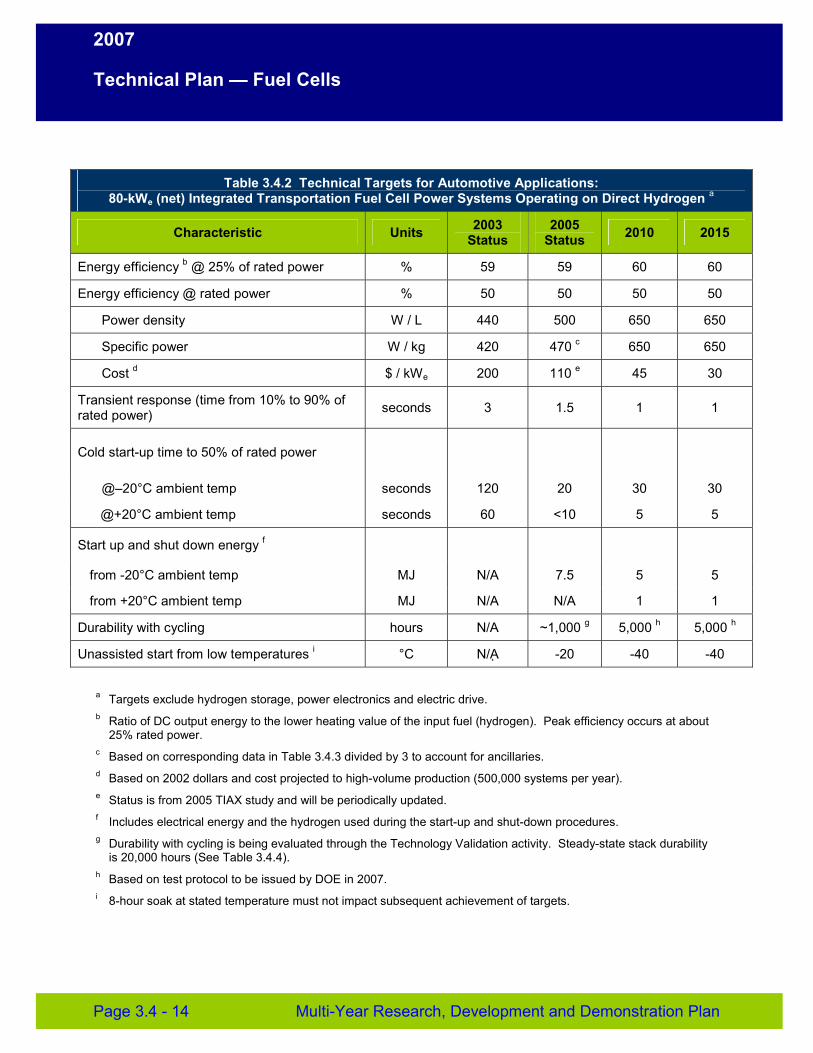
2007
Technical Plan — Fuel Cells
Table 3.4.2 Technical Targets for Automotive Applications: 80-kWe (net) Integrated Transportation Fuel Cell Power Systems Operating on Direct Hydrogen a
Characteristic Units 2003 Status
2005 Status 2010 2015
Energy efficiency b @ 25% of rated power % 59 59 60 60
Energy efficiency @ rated power % 50 50 50 50
Power density W / L 440 500 650 650
Specific power W / kg 420 470 c 650 650
Cost d $ / kWe 200 110 e 45 30
Transient response (time from 10% to 90% of rated power) seconds 3 1.5 1 1
Cold start-up time to 50% of rated power
@–20°C ambient temp
@+20°C ambient temp
seconds
seconds
120
60
20
<10
30
5
30
5
Start up and shut down energy f
from -20°C ambient temp
from +20°C ambient temp
MJ
MJ
N/A
N/A
7.5
N/A
5
1
5
1
Durability with cycling hours N/A ~1,000 g 5,000 h 5,000 h
Unassisted start from low temperatures i °C N/A -20 -40 -40
a Targets exclude hydrogen storage, power electronics and electric drive. b Ratio of DC output energy to the lower heating value of the input fuel (hydrogen). Peak efficiency occurs at about
25% rated power. c Based on corresponding data in Table 3.4.3 divided by 3 to account for ancillaries. d Based on 2002 dollars and cost projected to high-volume production (500,000 systems per year). e Status is from 2005 TIAX study and will be periodically updated. f Includes electrical energy and the hydrogen used during the start-up and shut-down procedures. g Durability with cycling is being evaluated through the Technology Validation activity. Steady-state stack durability
is 20,000 hours (See Table 3.4.4). h Based on test protocol to be issued by DOE in 2007. i 8-hour soak at stated temperature must not impact subsequent achievement of targets.
Page 3.4 - 14 Multi-Year Research, Development and Demonstration Plan
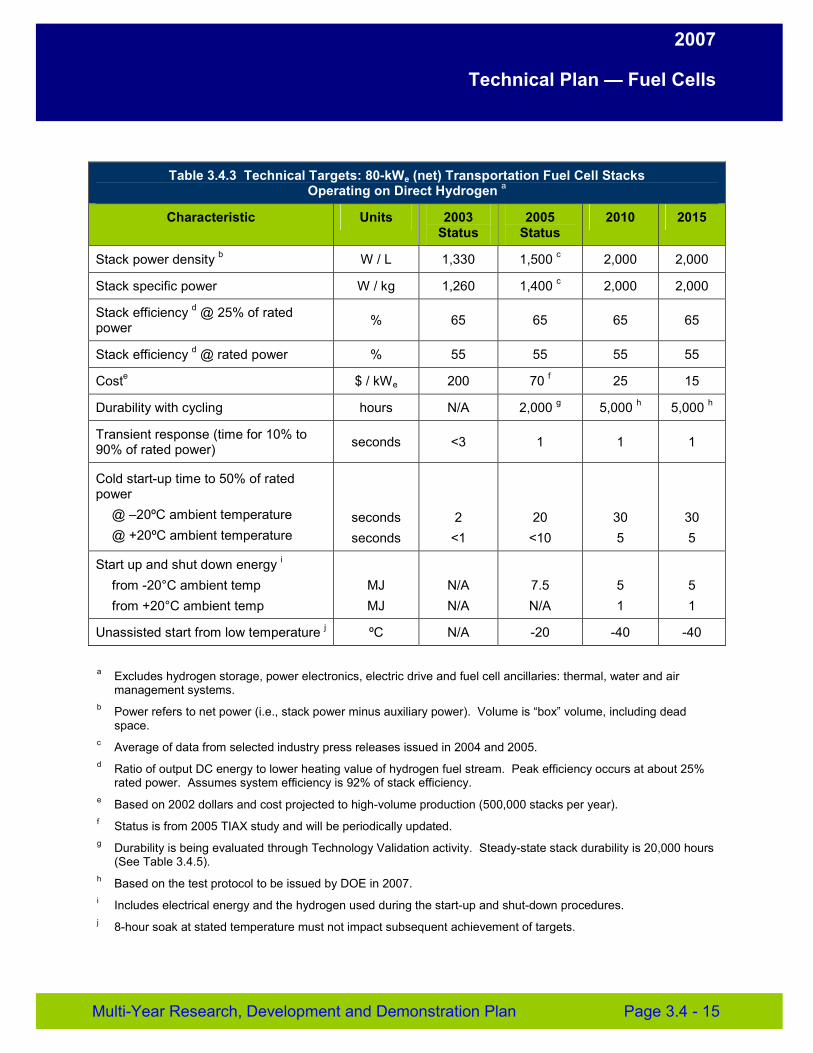
2007
Technical Plan — Fuel Cells
Table 3.4.3 Technical Targets: 80-kWe (net) Transportation Fuel Cell Stacks Operating on Direct Hydrogen a
Characteristic Units 2003 Status
2005 Status
2010 2015
Stack power density b W / L 1,330 1,500 c 2,000 2,000
Stack specific power W / kg 1,260 1,400 c 2,000 2,000
Stack efficiency d @ 25% of rated power % 65 65 65 65
Stack efficiency d @ rated power % 55 55 55 55
Coste $ / kWe 200 70 f 25 15
Durability with cycling hours N/A 2,000 g 5,000 h 5,000 h
Transient response (time for 10% to 90% of rated power) seconds <3 1 1 1
Cold start-up time to 50% of rated power
@ –20ºC ambient temperature @ +20ºC ambient temperature
seconds seconds
2 <1
20 <10
30 5
30 5
Start up and shut down energy i
from -20°C ambient temp from +20°C ambient temp
MJ MJ
N/A N/A
7.5 N/A
5 1
5 1
Unassisted start from low temperature j ºC N/A -20 -40 -40
a Excludes hydrogen storage, power electronics, electric drive and fuel cell ancillaries: thermal, water and air management systems.
b Power refers to net power (i.e., stack power minus auxiliary power). Volume is “box” volume, including dead space.
c Average of data from selected industry press releases issued in 2004 and 2005. d Ratio of output DC energy to lower heating value of hydrogen fuel stream. Peak efficiency occurs at about 25%
rated power. Assumes system efficiency is 92% of stack efficiency. e Based on 2002 dollars and cost projected to high-volume production (500,000 stacks per year). f Status is from 2005 TIAX study and will be periodically updated. g Durability is being evaluated through Technology Validation activity. Steady-state stack durability is 20,000 hours
(See Table 3.4.5). h Based on the test protocol to be issued by DOE in 2007. i Includes electrical energy and the hydrogen used during the start-up and shut-down procedures. j 8-hour soak at stated temperature must not impact subsequent achievement of targets.
Multi-Year Research, Development and Demonstration Plan Page 3.4 - 15
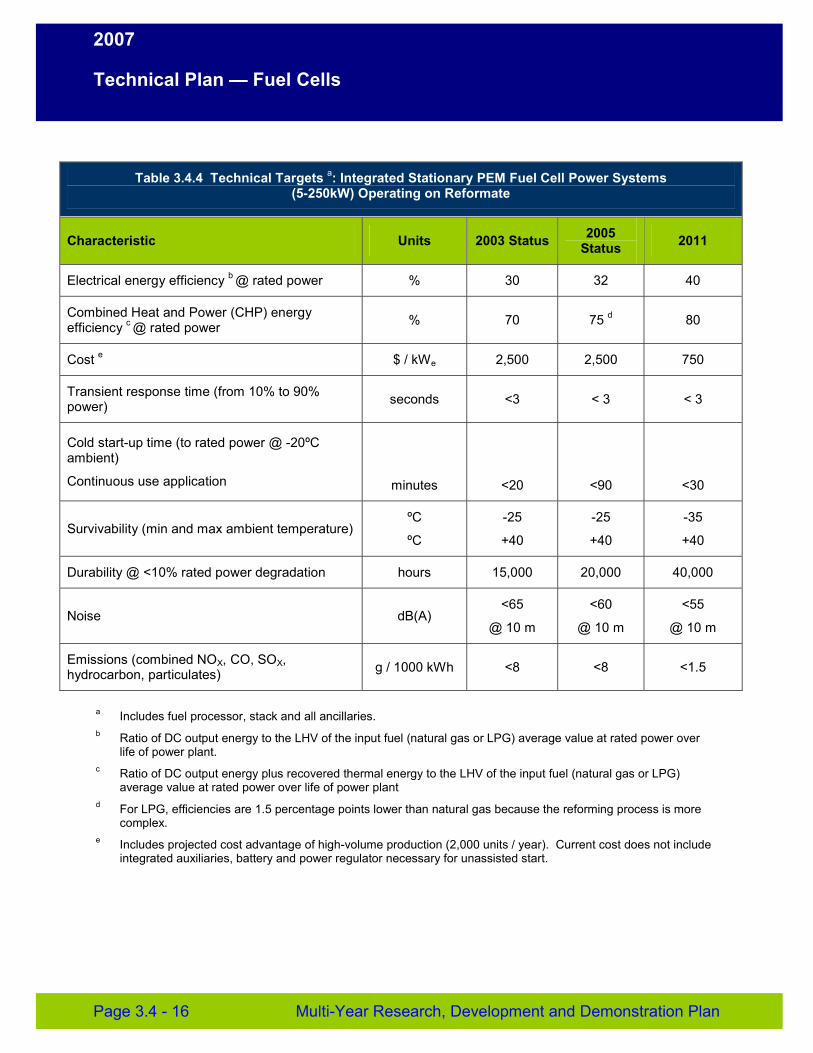
2007
Technical Plan — Fuel Cells
Table 3.4.4 Technical Targets a: Integrated Stationary PEM Fuel Cell Power Systems (5-250kW) Operating on Reformate
Characteristic Units 2003 Status 2005 Status 2011
Electrical energy efficiency b @ rated power % 30 32 40
Combined Heat and Power (CHP) energy efficiency c @ rated power % 70 75 d 80
Cost e $ / kWe 2,500 2,500 750
Transient response time (from 10% to 90% power) seconds <3 < 3 < 3
Cold start-up time (to rated power @ -20ºC ambient)
Continuous use application minutes <20 <90 <30
Survivability (min and max ambient temperature) ºC
ºC
-25
+40
-25
+40
-35
+40
Durability @ <10% rated power degradation hours 15,000 20,000 40,000
Noise dB(A) <65
@ 10 m
<60
@ 10 m
<55
@ 10 m
Emissions (combined NOX, CO, SOX, hydrocarbon, particulates) g / 1000 kWh <8 <8 <1.5
a Includes fuel processor, stack and all ancillaries. b Ratio of DC output energy to the LHV of the input fuel (natural gas or LPG) average value at rated power over
life of power plant. c Ratio of DC output energy plus recovered thermal energy to the LHV of the input fuel (natural gas or LPG)
average value at rated power over life of power plant d For LPG, efficiencies are 1.5 percentage points lower than natural gas because the reforming process is more
complex. e Includes projected cost advantage of high-volume production (2,000 units / year). Current cost does not include
integrated auxiliaries, battery and power regulator necessary for unassisted start.
Page 3.4 - 16 Multi-Year Research, Development and Demonstration Plan
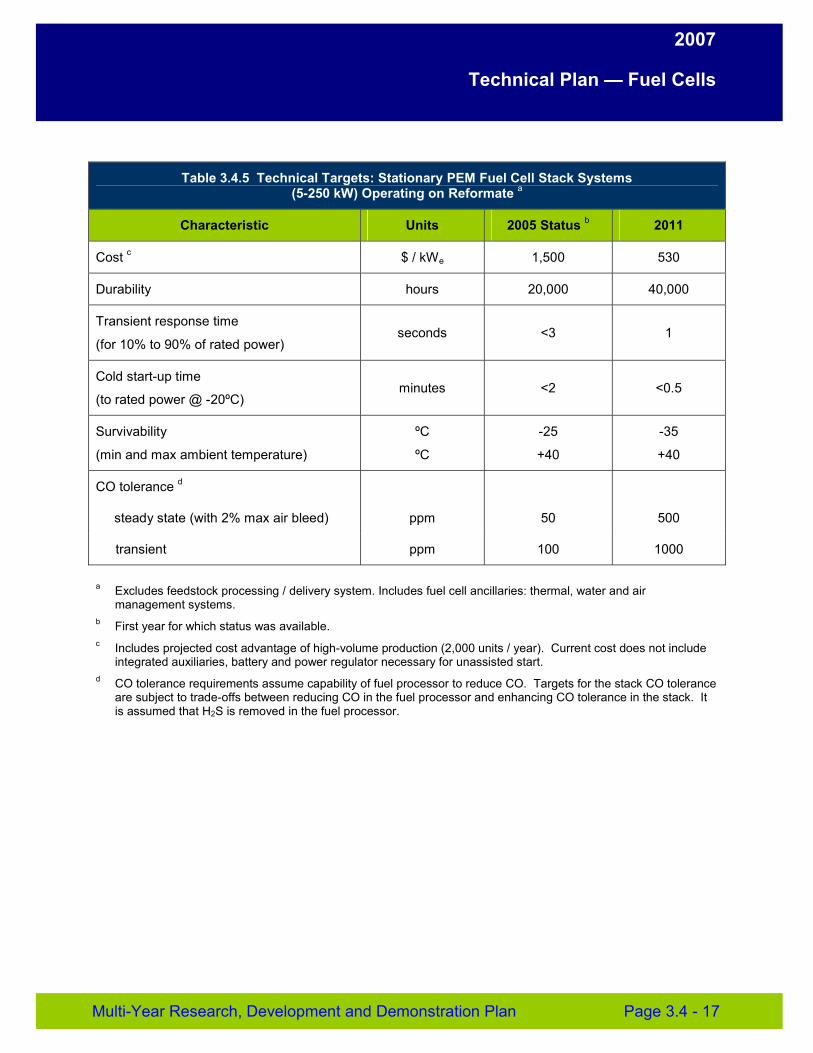
2007
Technical Plan — Fuel Cells
Table 3.4.5 Technical Targets: Stationary PEM Fuel Cell Stack Systems (5-250 kW) Operating on Reformate a
Characteristic Units 2005 Status b 2011
Cost c $ / kWe 1,500 530
Durability hours 20,000 40,000
Transient response time
(for 10% to 90% of rated power) seconds <3 1
Cold start-up time
(to rated power @ -20ºC) minutes <2 <0.5
Survivability
(min and max ambient temperature)
ºC
ºC
-25
+40
-35
+40
CO tolerance d
steady state (with 2% max air bleed)
transient
ppm
ppm
50
100
500
1000
a Excludes feedstock processing / delivery system. Includes fuel cell ancillaries: thermal, water and air management systems.
b First year for which status was available. c Includes projected cost advantage of high-volume production (2,000 units / year). Current cost does not include
integrated auxiliaries, battery and power regulator necessary for unassisted start. d CO tolerance requirements assume capability of fuel processor to reduce CO. Targets for the stack CO tolerance
are subject to trade-offs between reducing CO in the fuel processor and enhancing CO tolerance in the stack. It is assumed that H2S is removed in the fuel processor.
Multi-Year Research, Development and Demonstration Plan Page 3.4 - 17
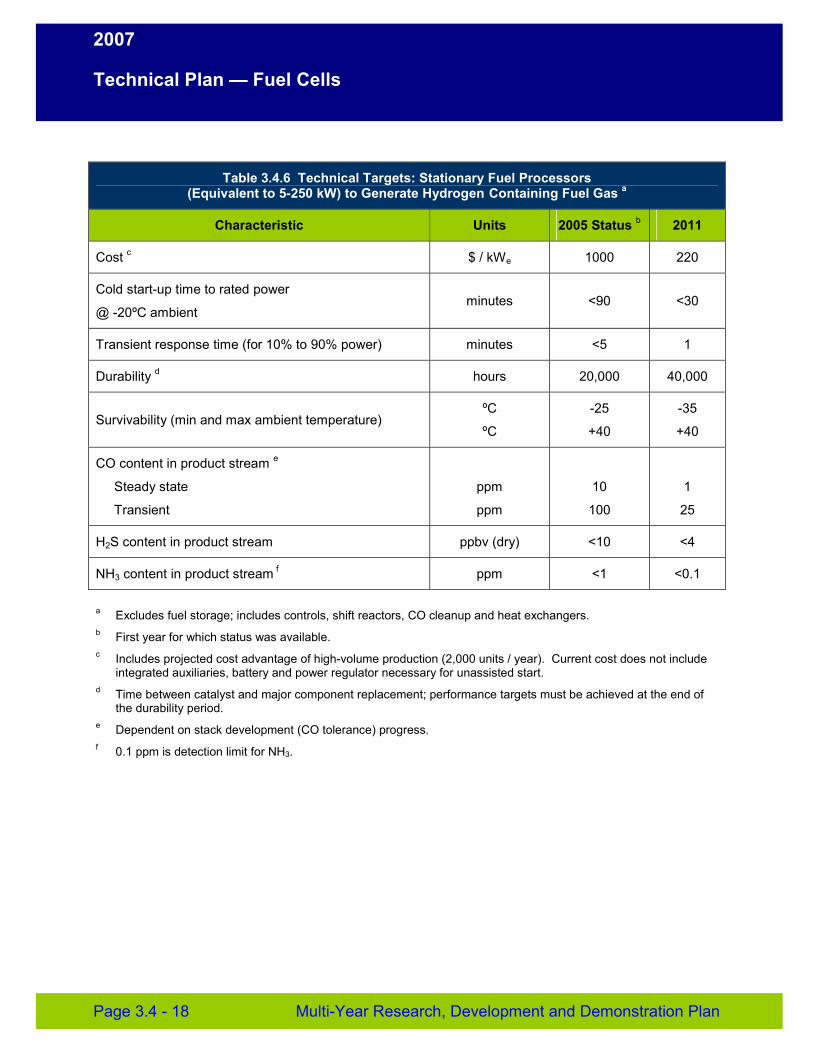
2007
Technical Plan — Fuel Cells
Table 3.4.6 Technical Targets: Stationary Fuel Processors (Equivalent to 5-250 kW) to Generate Hydrogen Containing Fuel Gas a
Characteristic Units 2005 Status b 2011
Cost c $ / kWe 1000 220
Cold start-up time to rated power
@ -20ºC ambient minutes <90 <30
Transient response time (for 10% to 90% power) minutes <5 1
Durability d hours 20,000 40,000
Survivability (min and max ambient temperature) ºC
ºC
-25
+40
-35
+40
CO content in product stream e
Steady state
Transient
ppm
ppm
10
100
1
25
H2S content in product stream ppbv (dry) <10 <4
NH3 content in product stream f ppm <1 <0.1
a Excludes fuel storage; includes controls, shift reactors, CO cleanup and heat exchangers. b First year for which status was available. c Includes projected cost advantage of high-volume production (2,000 units / year). Current cost does not include
integrated auxiliaries, battery and power regulator necessary for unassisted start. d Time between catalyst and major component replacement; performance targets must be achieved at the end of
the durability period. e Dependent on stack development (CO tolerance) progress. f 0.1 ppm is detection limit for NH3.
Page 3.4 - 18 Multi-Year Research, Development and Demonstration Plan
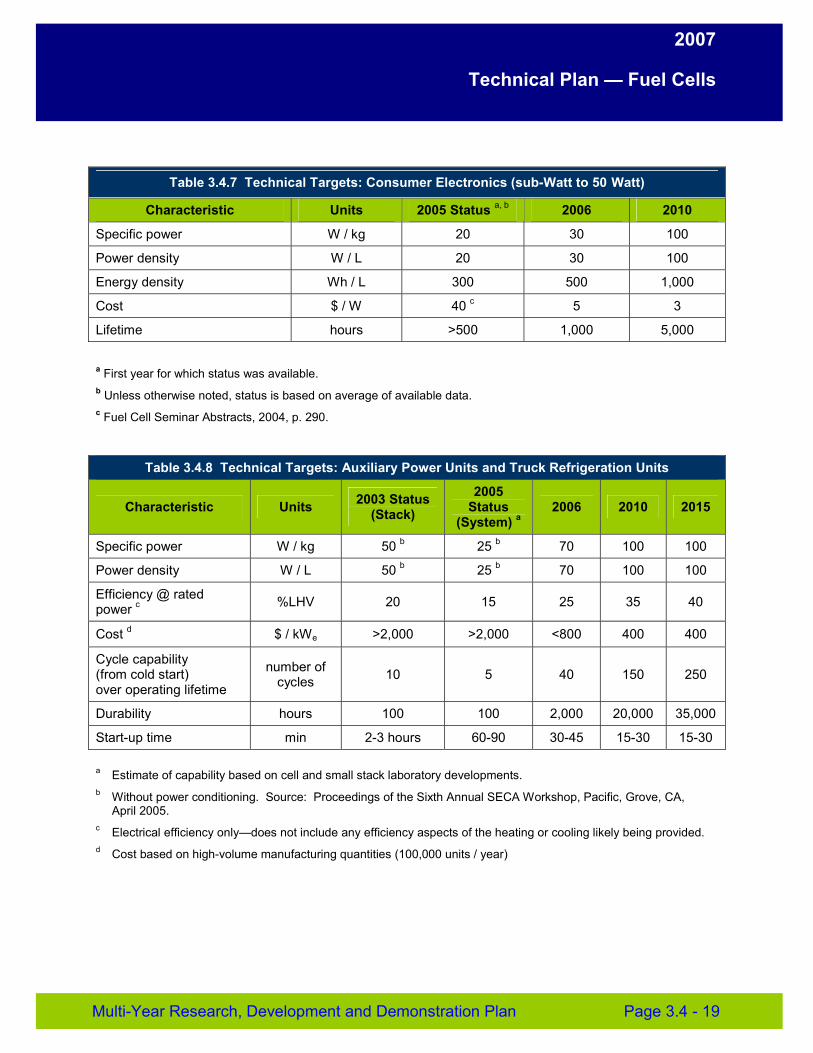
2007
Technical Plan — Fuel Cells
Table 3.4.7 Technical Targets: Consumer Electronics (sub-Watt to 50 Watt)
Characteristic Units 2005 Status a, b 2006 2010
Specific power W / kg 20 30 100
Power density W / L 20 30 100
Energy density Wh / L 300 500 1,000
Cost $ / W 40 c 5 3
Lifetime hours >500 1,000 5,000
a First year for which status was available. b Unless otherwise noted, status is based on average of available data. c Fuel Cell Seminar Abstracts, 2004, p. 290.
Table 3.4.8 Technical Targets: Auxiliary Power Units and Truck Refrigeration Units
Characteristic Units 2003 Status (Stack)
2005 Status
(System) a 2006 2010 2015
Specific power W / kg 50 b 25 b 70 100 100
Power density W / L 50 b 25 b 70 100 100
Efficiency @ rated power c %LHV 20 15 25 35 40
Cost d $ / kWe >2,000 >2,000 <800 400 400
Cycle capability (from cold start) over operating lifetime
number of cycles 10 5 40 150 250
Durability hours 100 100 2,000 20,000 35,000
Start-up time min 2-3 hours 60-90 30-45 15-30 15-30
a Estimate of capability based on cell and small stack laboratory developments. b Without power conditioning. Source: Proceedings of the Sixth Annual SECA Workshop, Pacific, Grove, CA,
April 2005. c Electrical efficiency only—does not include any efficiency aspects of the heating or cooling likely being provided. d Cost based on high-volume manufacturing quantities (100,000 units / year)
Multi-Year Research, Development and Demonstration Plan Page 3.4 - 19
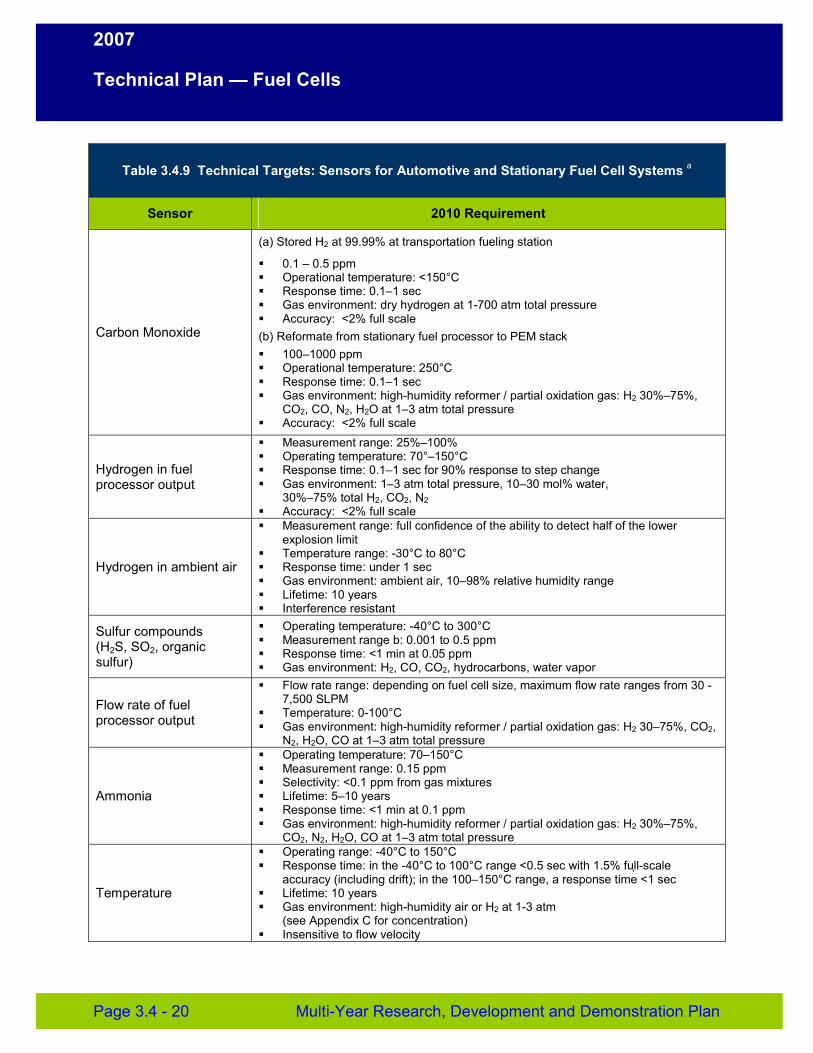
2007
Technical Plan — Fuel Cells
Table 3.4.9 Technical Targets: Sensors for Automotive and Stationary Fuel Cell Systems a
Sensor 2010 Requirement
Carbon Monoxide
(a) Stored H2 at 99.99% at transportation fueling station
� 0.1 – 0.5 ppm � Operational temperature: <150°C � Response time: 0.1–1 sec � Gas environment: dry hydrogen at 1-700 atm total pressure � Accuracy: <2% full scale (b) Reformate from stationary fuel processor to PEM stack � 100–1000 ppm � Operational temperature: 250°C � Response time: 0.1–1 sec � Gas environment: high-humidity reformer / partial oxidation gas: H2 30%–75%,
CO2, CO, N2, H2O at 1–3 atm total pressure � Accuracy: <2% full scale
Hydrogen in fuel processor output
� Measurement range: 25%–100% � Operating temperature: 70°–150°C � Response time: 0.1–1 sec for 90% response to step change � Gas environment: 1–3 atm total pressure, 10–30 mol% water,
30%–75% total H2, CO2, N2 � Accuracy: <2% full scale
Hydrogen in ambient air
� Measurement range: full confidence of the ability to detect half of the lower explosion limit
� Temperature range: -30°C to 80°C � Response time: under 1 sec � Gas environment: ambient air, 10–98% relative humidity range � Lifetime: 10 years � Interference resistant
Sulfur compounds (H2S, SO2, organic sulfur)
� Operating temperature: -40°C to 300°C � Measurement range b: 0.001 to 0.5 ppm � Response time: <1 min at 0.05 ppm � Gas environment: H2, CO, CO2, hydrocarbons, water vapor
Flow rate of fuel processor output
� Flow rate range: depending on fuel cell size, maximum flow rate ranges from 30 - 7,500 SLPM
� Temperature: 0-100°C � Gas environment: high-humidity reformer / partial oxidation gas: H2 30–75%, CO2,
N2, H2O, CO at 1–3 atm total pressure
Ammonia
� Operating temperature: 70–150°C � Measurement range: 0.15 ppm � Selectivity: <0.1 ppm from gas mixtures � Lifetime: 5–10 years � Response time: <1 min at 0.1 ppm � Gas environment: high-humidity reformer / partial oxidation gas: H2 30%–75%,
CO2, N2, H2O, CO at 1–3 atm total pressure
Temperature
� Operating range: -40°C to 150°C � Response time: in the -40°C to 100°C range <0.5 sec with 1.5% full-scale
accuracy (including drift); in the 100–150°C range, a response time <1 sec � Lifetime: 10 years � Gas environment: high-humidity air or H2 at 1-3 atm
(see Appendix C for concentration) � Insensitive to flow velocity
Page 3.4 - 20 Multi-Year Research, Development and Demonstration Plan
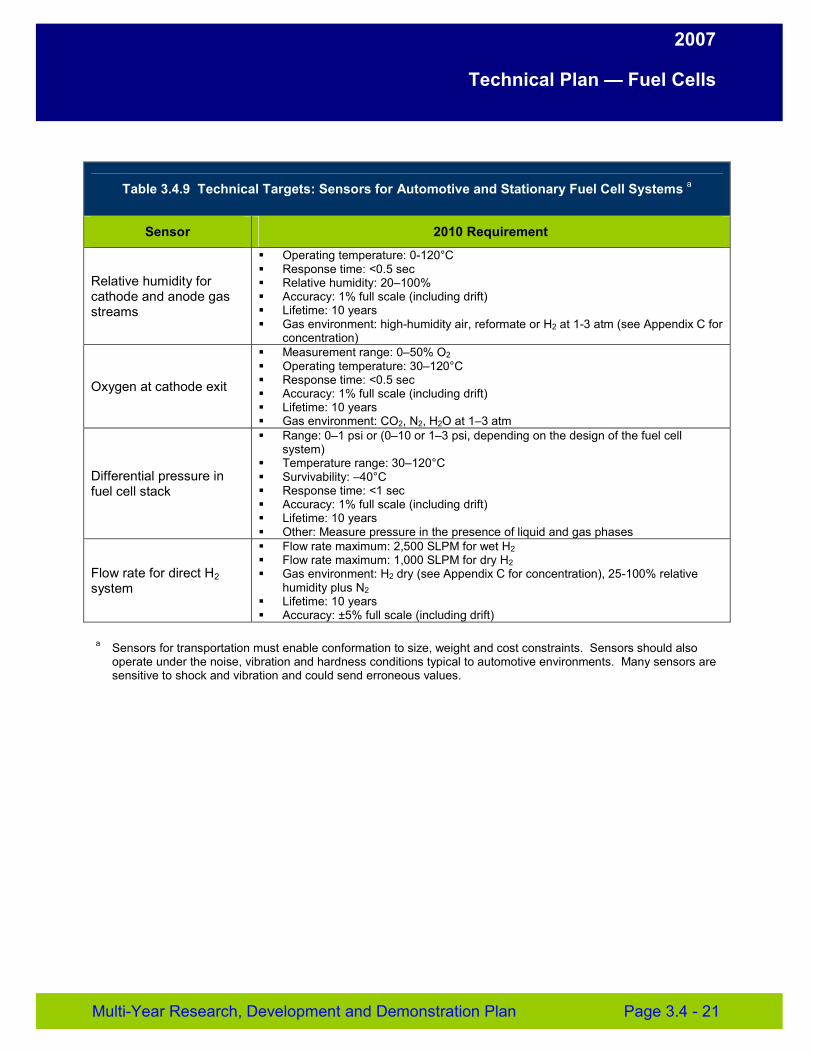
2007
Technical Plan — Fuel Cells
Table 3.4.9 Technical Targets: Sensors for Automotive and Stationary Fuel Cell Systems a
Sensor 2010 Requirement
Relative humidity for cathode and anode gas streams
� Operating temperature: 0-120°C � Response time: <0.5 sec � Relative humidity: 20–100% � Accuracy: 1% full scale (including drift) � Lifetime: 10 years � Gas environment: high-humidity air, reformate or H2 at 1-3 atm (see Appendix C for
concentration)
Oxygen at cathode exit
� Measurement range: 0–50% O2 � Operating temperature: 30–120°C � Response time: <0.5 sec � Accuracy: 1% full scale (including drift) � Lifetime: 10 years � Gas environment: CO2, N2, H2O at 1–3 atm
Differential pressure in fuel cell stack
� Range: 0–1 psi or (0–10 or 1–3 psi, depending on the design of the fuel cell system)
� Temperature range: 30–120°C � Survivability: –40°C � Response time: <1 sec � Accuracy: 1% full scale (including drift) � Lifetime: 10 years � Other: Measure pressure in the presence of liquid and gas phases
Flow rate for direct H2 system
� Flow rate maximum: 2,500 SLPM for wet H2 � Flow rate maximum: 1,000 SLPM for dry H2 � Gas environment: H2 dry (see Appendix C for concentration), 25-100% relative
humidity plus N2 � Lifetime: 10 years � Accuracy: ±5% full scale (including drift)
a Sensors for transportation must enable conformation to size, weight and cost constraints. Sensors should also operate under the noise, vibration and hardness conditions typical to automotive environments. Many sensors are sensitive to shock and vibration and could send erroneous values.
Multi-Year Research, Development and Demonstration Plan Page 3.4 - 21
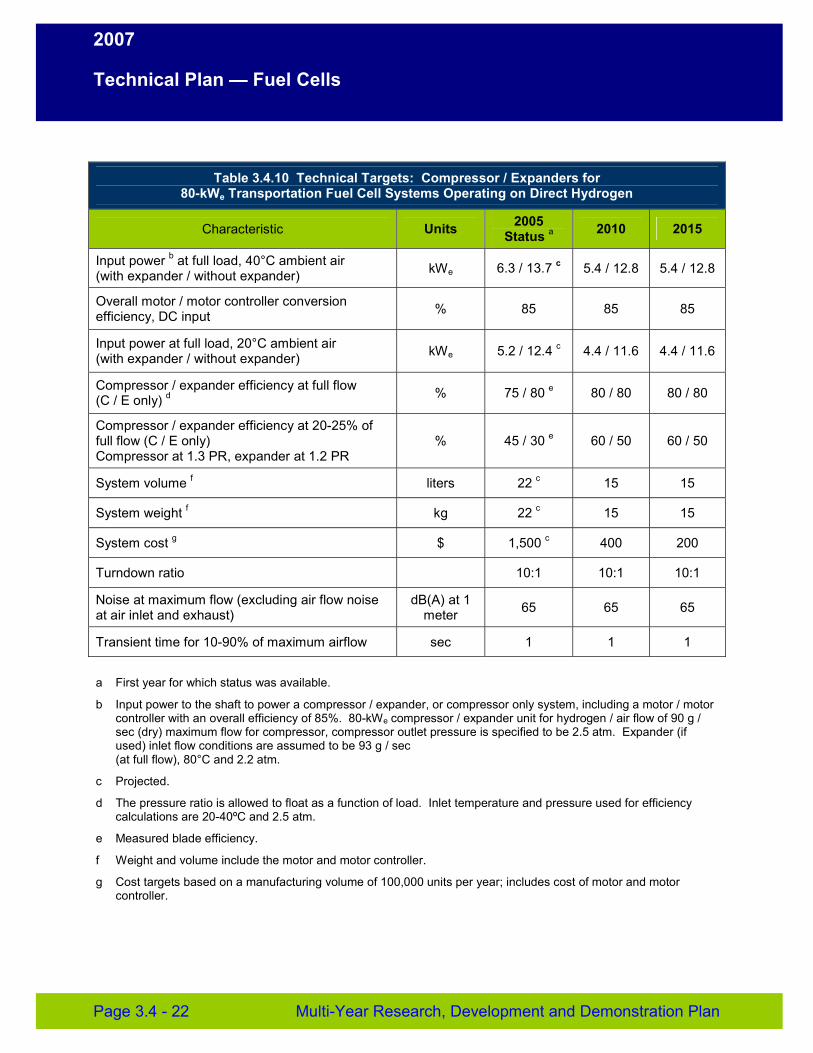
2007
Technical Plan — Fuel Cells
Table 3.4.10 Technical Targets: Compressor / Expanders for 80-kWe Transportation Fuel Cell Systems Operating on Direct Hydrogen
Characteristic Units 2005 Status a 2010 2015
Input power b at full load, 40°C ambient air (with expander / without expander) kWe 6.3 / 13.7 c 5.4 / 12.8 5.4 / 12.8
Overall motor / motor controller conversion efficiency, DC input % 85 85 85
Input power at full load, 20°C ambient air (with expander / without expander) kWe 5.2 / 12.4 c 4.4 / 11.6 4.4 / 11.6
Compressor / expander efficiency at full flow (C / E only) d % 75 / 80 e 80 / 80 80 / 80
Compressor / expander efficiency at 20-25% of full flow (C / E only) Compressor at 1.3 PR, expander at 1.2 PR
% 45 / 30 e 60 / 50 60 / 50
System volume f liters 22 c 15 15
System weight f kg 22 c 15 15
System cost g $ 1,500 c 400 200
Turndown ratio 10:1 10:1 10:1
Noise at maximum flow (excluding air flow noise at air inlet and exhaust)
dB(A) at 1 meter 65 65 65
Transient time for 10-90% of maximum airflow sec 1 1 1
a First year for which status was available.
b Input power to the shaft to power a compressor / expander, or compressor only system, including a motor / motor controller with an overall efficiency of 85%. 80-kWe compressor / expander unit for hydrogen / air flow of 90 g / sec (dry) maximum flow for compressor, compressor outlet pressure is specified to be 2.5 atm. Expander (if used) inlet flow conditions are assumed to be 93 g / sec (at full flow), 80°C and 2.2 atm.
c Projected.
d The pressure ratio is allowed to float as a function of load. Inlet temperature and pressure used for efficiency calculations are 20-40ºC and 2.5 atm.
e Measured blade efficiency.
f Weight and volume include the motor and motor controller.
g Cost targets based on a manufacturing volume of 100,000 units per year; includes cost of motor and motor controller.
Page 3.4 - 22 Multi-Year Research, Development and Demonstration Plan
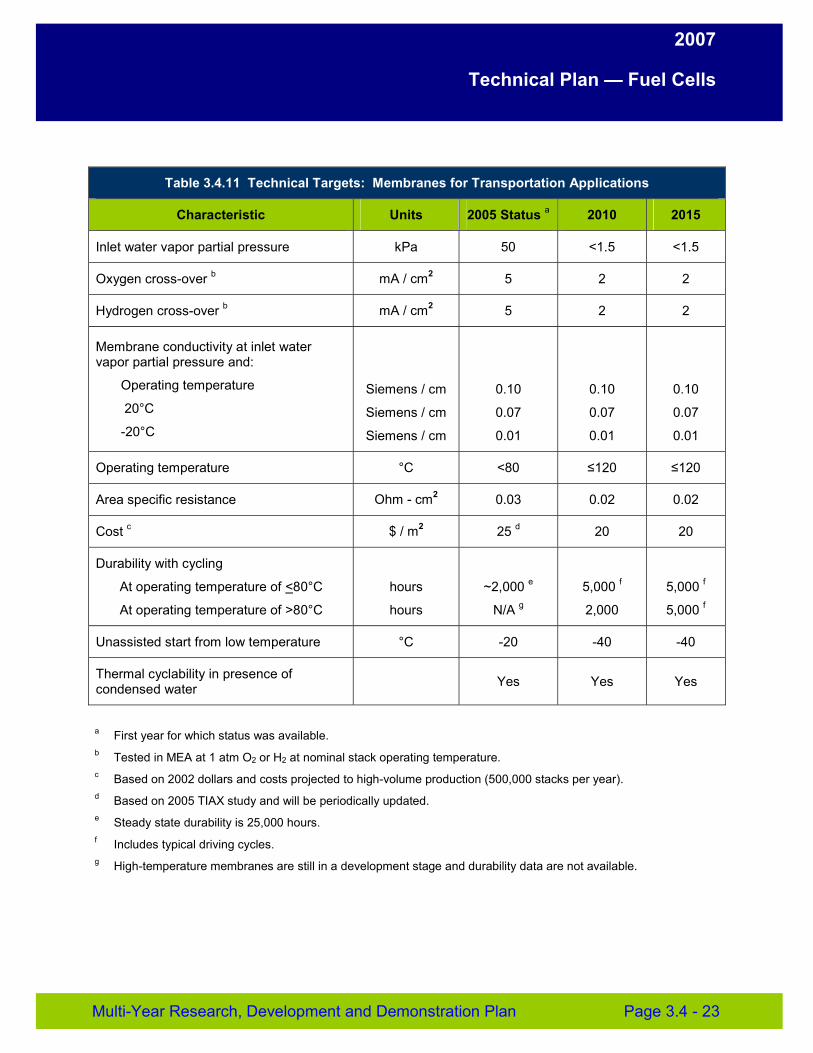
2007
Technical Plan — Fuel Cells
Table 3.4.11 Technical Targets: Membranes for Transportation Applications
Characteristic Units 2005 Status a 2010 2015
Inlet water vapor partial pressure kPa 50 <1.5 <1.5
Oxygen cross-over b mA / cm2 5 2 2
Hydrogen cross-over b mA / cm2 5 2 2
Membrane conductivity at inlet water vapor partial pressure and:
Operating temperature
20°C
-20°C
Siemens / cm
Siemens / cm
Siemens / cm
0.10
0.07
0.01
0.10
0.07
0.01
0.10
0.07
0.01
Operating temperature °C <80 ≤120 ≤120
Area specific resistance Ohm - cm2 0.03 0.02 0.02
Cost c $ / m2 25 d 20 20
Durability with cycling
At operating temperature of <80°C
At operating temperature of >80°C
hours
hours
~2,000 e
N/A g
5,000 f
2,000
5,000 f
5,000 f
Unassisted start from low temperature °C -20 -40 -40
Thermal cyclability in presence of condensed water Yes Yes Yes
a First year for which status was available. b Tested in MEA at 1 atm O2 or H2 at nominal stack operating temperature. c Based on 2002 dollars and costs projected to high-volume production (500,000 stacks per year). d Based on 2005 TIAX study and will be periodically updated. e Steady state durability is 25,000 hours. f Includes typical driving cycles. g High-temperature membranes are still in a development stage and durability data are not available.
Multi-Year Research, Development and Demonstration Plan Page 3.4 - 23
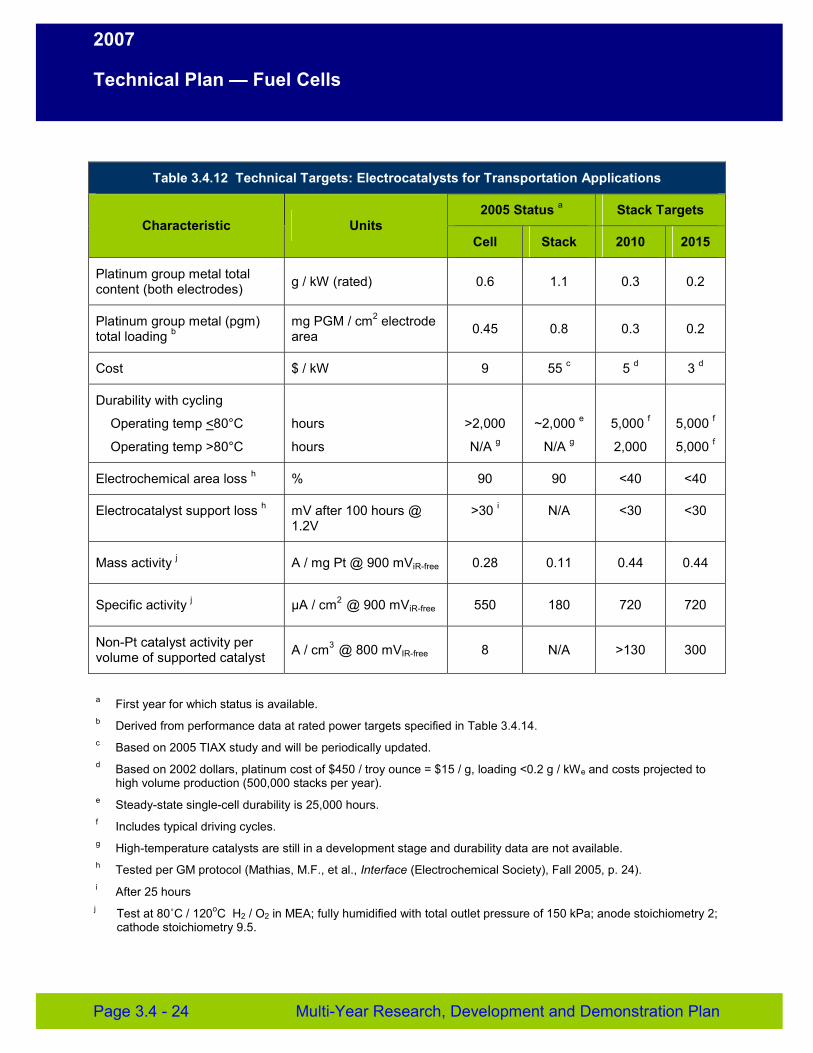
2007
Technical Plan — Fuel Cells
Table 3.4.12 Technical Targets: Electrocatalysts for Transportation Applications
Characteristic Units 2005 Status a Stack Targets
Cell Stack 2010 2015
Platinum group metal total content (both electrodes) g / kW (rated) 0.6 1.1 0.3 0.2
Platinum group metal (pgm) total loading b
mg PGM / cm2 electrode area 0.45 0.8 0.3 0.2
Cost $ / kW 9 55 c 5 d 3 d
Durability with cycling
Operating temp <80°C
Operating temp >80°C
hours
hours
>2,000
N/A g
~2,000 e
N/A g
5,000 f
2,000
5,000 f
5,000 f
Electrochemical area loss h % 90 90 <40 <40
Electrocatalyst support loss h mV after 100 hours @ 1.2V
>30 i N/A <30 <30
Mass activity j A / mg Pt @ 900 mViR-free 0.28 0.11 0.44 0.44
Specific activity j µA / cm2 @ 900 mViR-free 550 180 720 720
Non-Pt catalyst activity per volume of supported catalyst A / cm3 @ 800 mVIR-free 8 N/A >130 300
a First year for which status is available. b Derived from performance data at rated power targets specified in Table 3.4.14. c Based on 2005 TIAX study and will be periodically updated. d Based on 2002 dollars, platinum cost of $450 / troy ounce = $15 / g, loading <0.2 g / kWe and costs projected to
high volume production (500,000 stacks per year). e Steady-state single-cell durability is 25,000 hours. f Includes typical driving cycles. g High-temperature catalysts are still in a development stage and durability data are not available. h Tested per GM protocol (Mathias, M.F., et al., Interface (Electrochemical Society), Fall 2005, p. 24). i After 25 hours j Test at 80˚C / 120oC H2 / O2 in MEA; fully humidified with total outlet pressure of 150 kPa; anode stoichiometry 2;
cathode stoichiometry 9.5.
Page 3.4 - 24 Multi-Year Research, Development and Demonstration Plan
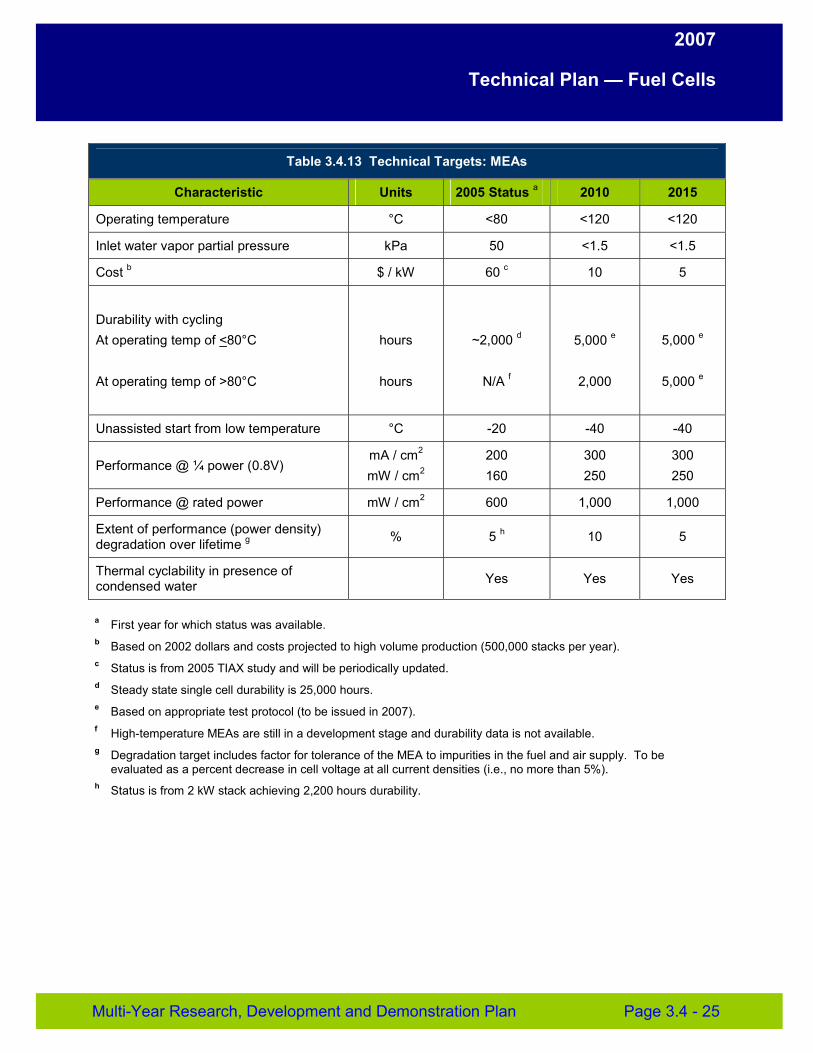
2007
Technical Plan — Fuel Cells
Table 3.4.13 Technical Targets: MEAs
Characteristic Units 2005 Status a 2010 2015
Operating temperature °C <80 <120 <120
Inlet water vapor partial pressure kPa 50 <1.5 <1.5
Cost b $ / kW 60 c 10 5
Durability with cycling At operating temp of <80°C
At operating temp of >80°C
hours
hours
~2,000 d
N/A f
5,000 e
2,000
5,000 e
5,000 e
Unassisted start from low temperature °C -20 -40 -40
Performance @ ¼ power (0.8V) mA / cm2
mW / cm2 200 160
300 250
300 250
Performance @ rated power mW / cm2 600 1,000 1,000
Extent of performance (power density) degradation over lifetime g % 5 h 10 5
Thermal cyclability in presence of condensed water Yes Yes Yes
a First year for which status was available. b Based on 2002 dollars and costs projected to high volume production (500,000 stacks per year). c Status is from 2005 TIAX study and will be periodically updated. d Steady state single cell durability is 25,000 hours. e Based on appropriate test protocol (to be issued in 2007). f High-temperature MEAs are still in a development stage and durability data is not available. g Degradation target includes factor for tolerance of the MEA to impurities in the fuel and air supply. To be
evaluated as a percent decrease in cell voltage at all current densities (i.e., no more than 5%). h Status is from 2 kW stack achieving 2,200 hours durability.
Multi-Year Research, Development and Demonstration Plan Page 3.4 - 25
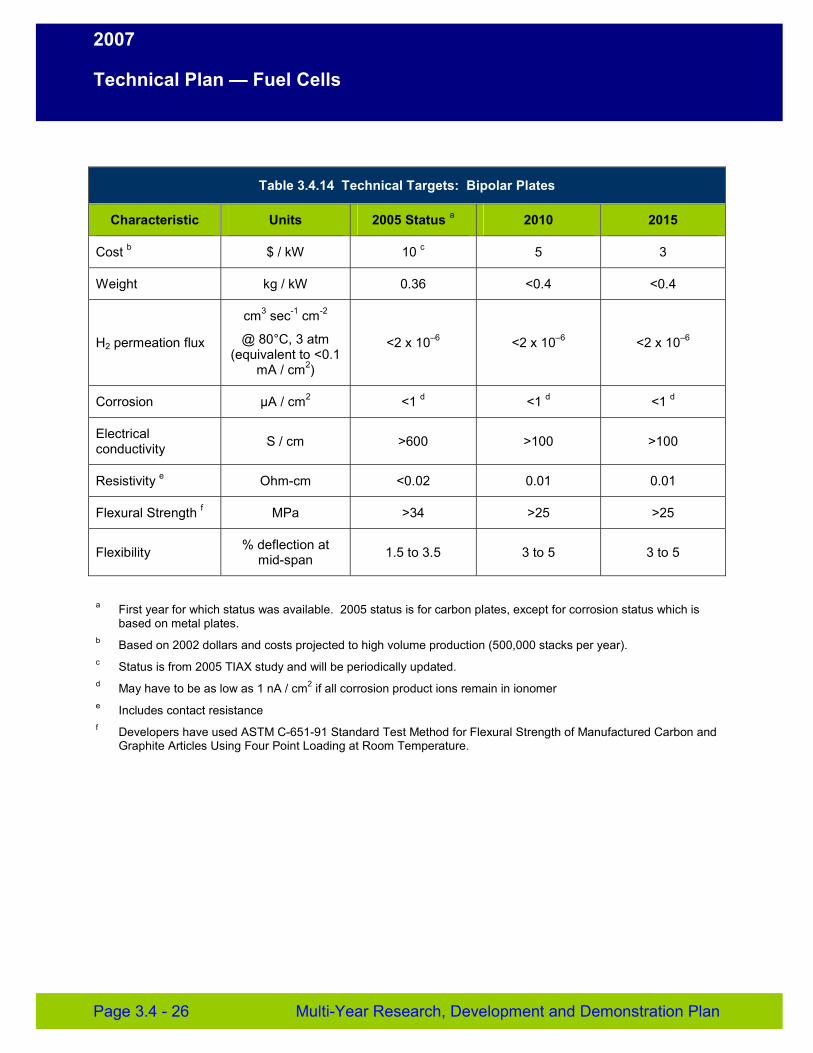
2007
Technical Plan — Fuel Cells
Table 3.4.14 Technical Targets: Bipolar Plates
Characteristic Units 2005 Status a 2010 2015
Cost b $ / kW 10 c 5 3
Weight kg / kW 0.36 <0.4 <0.4
H2 permeation flux
cm3 sec-1 cm-2
@ 80°C, 3 atm (equivalent to <0.1
mA / cm2)
<2 x 10⁻⁶ <2 x 10⁻⁶ <2 x 10⁻⁶
Corrosion µA / cm2 <1 d <1 d <1 d
Electrical conductivity S / cm >600 >100 >100
Resistivity e Ohm-cm <0.02 0.01 0.01
Flexural Strength f MPa >34 >25 >25
Flexibility % deflection at mid-span 1.5 to 3.5 3 to 5 3 to 5
a First year for which status was available. 2005 status is for carbon plates, except for corrosion status which is based on metal plates.
b Based on 2002 dollars and costs projected to high volume production (500,000 stacks per year). c Status is from 2005 TIAX study and will be periodically updated. d May have to be as low as 1 nA / cm2 if all corrosion product ions remain in ionomer e Includes contact resistance f Developers have used ASTM C-651-91 Standard Test Method for Flexural Strength of Manufactured Carbon and
Graphite Articles Using Four Point Loading at Room Temperature.
Page 3.4 - 26 Multi-Year Research, Development and Demonstration Plan
2007
Technical Plan — Fuel Cells
Barriers Of the many barriers discussed here, cost and durability present two of the most significant challenges to achieving clean, reliable, cost-effective fuel cell systems. While addressing cost and durability, fuel cell performance must meet or exceed that of competing technologies. Ultimately, operation of components and subsystems will be validated within the Technology Validation subprogram (see section 3.5).
A. Durability
Durability of fuel cell stacks, which must include tolerance to impurities and mechanical integrity, has not been established. Tolerance to air, fuel and system-derived impurities (including the storage system) needs to be established. Durability of fuel cell systems operating over automotive drive cycles has not been demonstrated. Operation at low relative humidity (PH2O=1.5 kPa at inlet or <10% relative humidity at 80°C) and start-up from sub-freezing temperatures has not been demonstrated. Component degradation and failure mechanisms are not well understood, which makes development of effective mitigating strategies necessary.
Stationary fuel cells must achieve greater than 40,000 hours durability to compete against other distributed power generation systems. Sulfur-tolerant catalysts and membrane materials are required to achieve this durability target in both the fuel processor and the stack, respectively. Research is also needed to understand failure mechanisms and develop mitigation strategies. State-of-the-art systems need to be benchmarked.
B. Cost
Materials and manufacturing costs are too high for catalysts, membranes, bipolar plates and gas diffusion layers. Low-cost, high-performance membranes, high-performance catalysts enabling ultra-low precious metal loading, and lower cost, lighter, corrosion-resistant bipolar plates are required to make fuel cell stacks competitive. The use of non-precious metal catalysts will also reduce the cost of MEAs. Balance-of-plant components specifically designed for use in fuel cell systems need development in order to achieve cost targets. Low-cost, high-volume manufacturing processes are also necessary.
C. Performance
Fuel cell performance and efficiency must meet or exceed that of competing technologies in order to be commercially viable. Voltage losses at the cathode are too high to meet efficiency targets simultaneously with the other targets. Anode and cathode performance depend on precious metal loading, which is currently too high (at the cathode) to meet cost targets. Loss of electrochemical surface area can occur as a result of catalyst migration and agglomeration during processing and operation. Current activities are focused on cathode performance because the kinetics at the cathode are about 100 times slower than at the anode.
Power densities at the higher voltages required for high-efficiency operation are currently too low to meet cost and packaging targets. Membrane performance under the extremes of automotive drive cycles and the steady-state lifetime requirement has not been established. Conductivity under subfreezing and low humidity conditions needs to increase.
Multi-Year Research, Development and Demonstration Plan Page 3.4 - 27
2007
Technical Plan — Fuel Cells
Cell / stack performance is affected by the chemical and electrical interface between the electrode and the membrane. Dissimilar electrolytes in the membrane and electrode may result in higher electronic resistance or chemical incompatibilities. Also, new electrolyte materials may require redesign of the electrode structure and interface to maintain performance.
D. Water Transport within the Stack
Effective management of the water produced in the fuel cell is needed to alleviate flooding and/or drying out of the membrane over the full operating temperature range. Ineffective water management leads to liquid-phase water blockage and mass-transport-limited performance or decreased proton conductivity as a result of dehumidification of the ionomer. Transportation and stationary fuel cells must be able to operate in environments where ambient temperatures fall below 0°C. R&D is needed to improve the designs of the gas diffusion layers, gas flow fields in bipolar plates, catalyst layers and membranes to enable effective water management and operation at subfreezing conditions.
E. System Thermal and Water Management
Thermal and water management processes include heat and water use, cooling and humidification. Improved heat utilization, cooling and humidification techniques are needed. The low operating temperature of PEM fuel cells results in a relatively small difference between the fuel cell stack operating temperature and ambient air temperature, which is not conducive to conventional heat rejection approaches and limits the use of heat generated by the fuel cell (approximately 50% of the energy supplied by the fuel). More efficient heat recovery systems, improved system designs, advanced heat exchangers and/or higher temperature operation of current systems are needed to utilize the low-grade heat and achieve the most efficient (electrical and thermal) systems, particularly for distributed power generation. Improved techniques to manage water during start-up and shutdown at subfreezing temperatures are also needed.
F. Air Management
Automotive-type compressors/expanders specifically designed for fuel cell applications that minimize parasitic power consumption and meet packaging and cost requirements are not available. Automotive-type compressors/expanders that meet the FreedomCAR and Fuel Partnership technical guidelines need to be engineered and integrated with the fuel cell stack so that the overall system meets packaging, cost and performance requirements.
G. Start-up and Shut-down Time and Energy/Transient Operation
Automotive fuel cell systems must start rapidly from any ambient condition with minimal fuel consumption. Strategies to address start-up and shut-down time and energy such as the use of hybrid systems and/or stored hydrogen are needed. Fuel cell power plants will also be required to follow load variations (e.g., drive cycles).
Page 3.4 - 28 Multi-Year Research, Development and Demonstration Plan
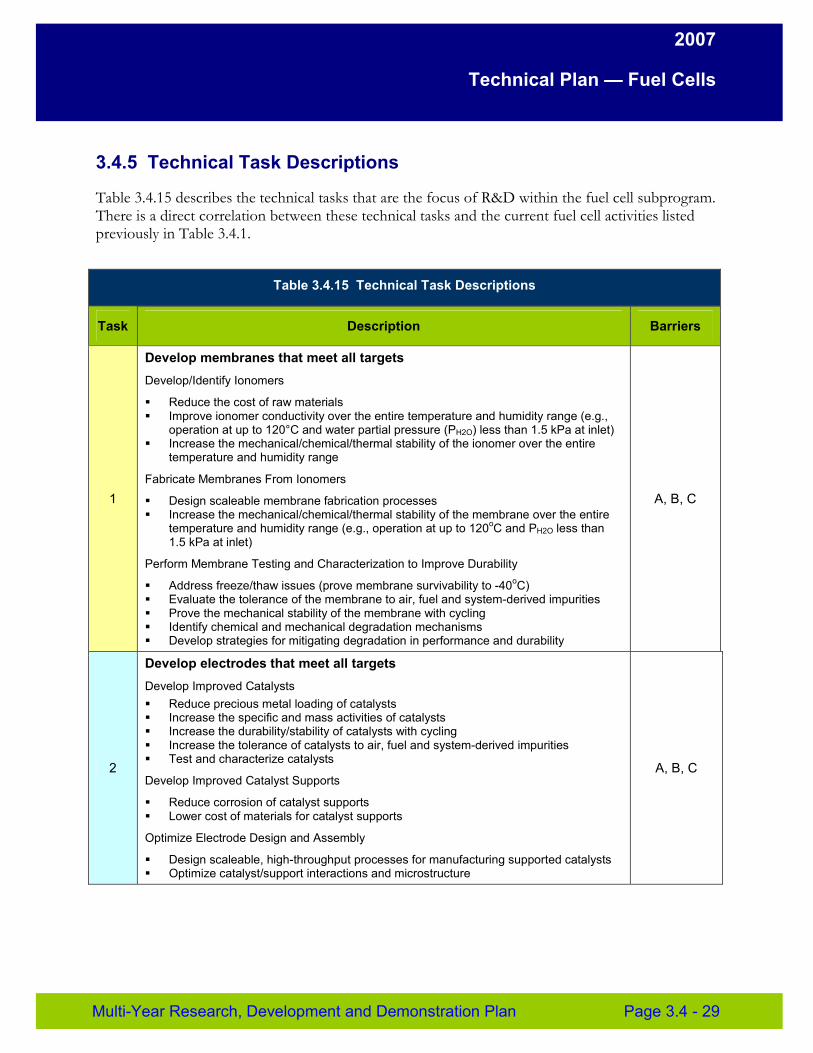
2007
Technical Plan — Fuel Cells
3.4.5 Technical Task Descriptions
Table 3.4.15 describes the technical tasks that are the focus of R&D within the fuel cell subprogram. There is a direct correlation between these technical tasks and the current fuel cell activities listed previously in Table 3.4.1.
Table 3.4.15 Technical Task Descriptions
Task Description Barriers
1
Develop membranes that meet all targets Develop/Identify Ionomers
� Reduce the cost of raw materials � Improve ionomer conductivity over the entire temperature and humidity range (e.g.,
operation at up to 120°C and water partial pressure (PH2O) less than 1.5 kPa at inlet) � Increase the mechanical/chemical/thermal stability of the ionomer over the entire
temperature and humidity range
Fabricate Membranes From Ionomers
� Design scaleable membrane fabrication processes � Increase the mechanical/chemical/thermal stability of the membrane over the entire
temperature and humidity range (e.g., operation at up to 120oC and PH2O less than 1.5 kPa at inlet)
Perform Membrane Testing and Characterization to Improve Durability
� Address freeze/thaw issues (prove membrane survivability to -40oC)� Evaluate the tolerance of the membrane to air, fuel and system-derived impurities � Prove the mechanical stability of the membrane with cycling � Identify chemical and mechanical degradation mechanisms � Develop strategies for mitigating degradation in performance and durability
A, B, C
2
Develop electrodes that meet all targets Develop Improved Catalysts � Reduce precious metal loading of catalysts � Increase the specific and mass activities of catalysts � Increase the durability/stability of catalysts with cycling � Increase the tolerance of catalysts to air, fuel and system-derived impurities � Test and characterize catalysts
Develop Improved Catalyst Supports
� Reduce corrosion of catalyst supports � Lower cost of materials for catalyst supports
Optimize Electrode Design and Assembly
� Design scaleable, high-throughput processes for manufacturing supported catalysts � Optimize catalyst/support interactions and microstructure
A, B, C
Multi-Year Research, Development and Demonstration Plan Page 3.4 - 29
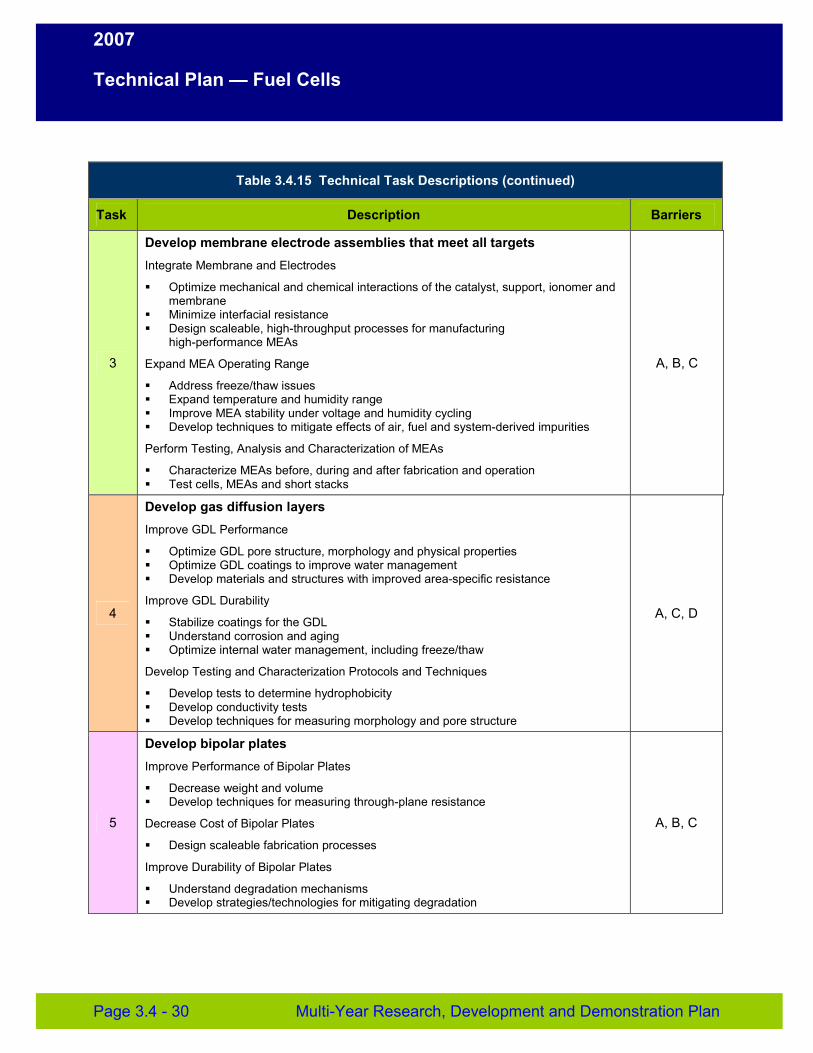
2007
Technical Plan — Fuel Cells
Table 3.4.15 Technical Task Descriptions (continued)
Task Description Barriers
3
Develop membrane electrode assemblies that meet all targets Integrate Membrane and Electrodes
� Optimize mechanical and chemical interactions of the catalyst, support, ionomer and membrane
� Minimize interfacial resistance � Design scaleable, high-throughput processes for manufacturing
high-performance MEAs
Expand MEA Operating Range
� Address freeze/thaw issues � Expand temperature and humidity range � Improve MEA stability under voltage and humidity cycling � Develop techniques to mitigate effects of air, fuel and system-derived impurities
Perform Testing, Analysis and Characterization of MEAs
� Characterize MEAs before, during and after fabrication and operation � Test cells, MEAs and short stacks
A, B, C
4
Develop gas diffusion layers Improve GDL Performance
� Optimize GDL pore structure, morphology and physical properties � Optimize GDL coatings to improve water management � Develop materials and structures with improved area-specific resistance
Improve GDL Durability
� Stabilize coatings for the GDL � Understand corrosion and aging � Optimize internal water management, including freeze/thaw
Develop Testing and Characterization Protocols and Techniques
� Develop tests to determine hydrophobicity � Develop conductivity tests � Develop techniques for measuring morphology and pore structure
A, C, D
5
Develop bipolar plates Improve Performance of Bipolar Plates
� Decrease weight and volume � Develop techniques for measuring through-plane resistance
Decrease Cost of Bipolar Plates
� Design scaleable fabrication processes
Improve Durability of Bipolar Plates
� Understand degradation mechanisms � Develop strategies/technologies for mitigating degradation
A, B, C
Page 3.4 - 30 Multi-Year Research, Development and Demonstration Plan
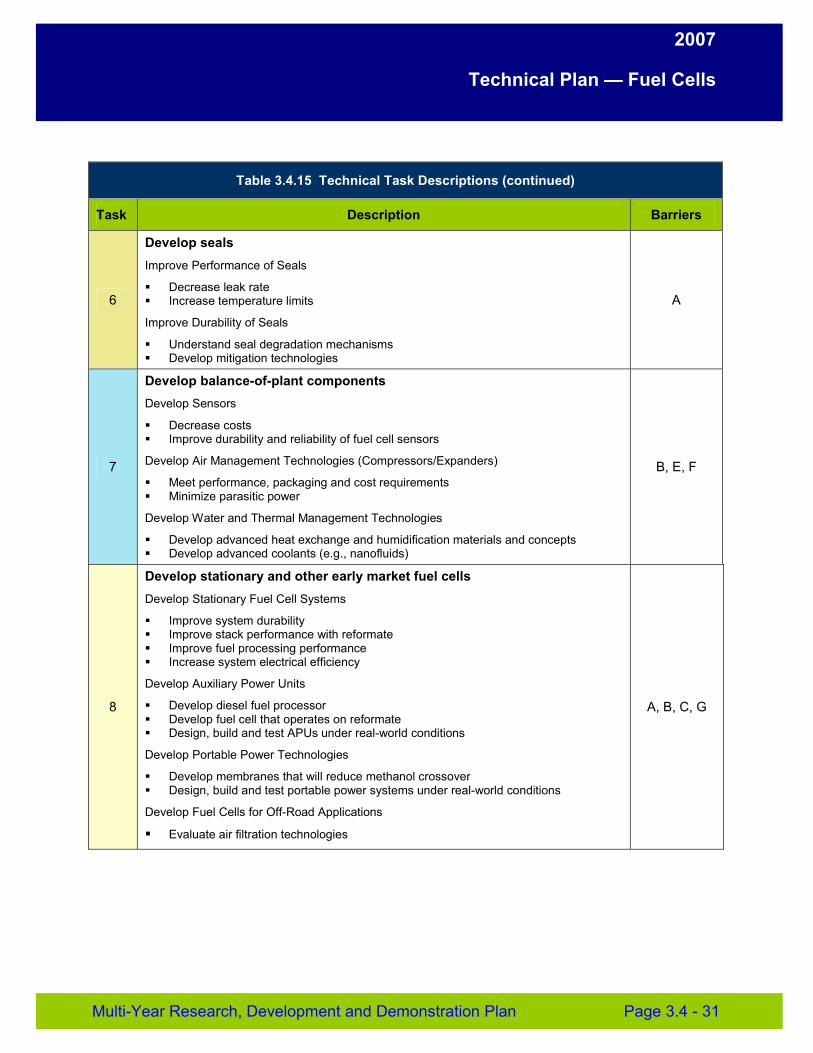
2007
Technical Plan — Fuel Cells
Table 3.4.15 Technical Task Descriptions (continued)
Task Description Barriers
6
Develop seals Improve Performance of Seals
� Decrease leak rate � Increase temperature limits
Improve Durability of Seals
� Understand seal degradation mechanisms � Develop mitigation technologies
A
7
Develop balance-of-plant components Develop Sensors
� Decrease costs � Improve durability and reliability of fuel cell sensors
Develop Air Management Technologies (Compressors/Expanders)
� Meet performance, packaging and cost requirements � Minimize parasitic power
Develop Water and Thermal Management Technologies
� Develop advanced heat exchange and humidification materials and concepts � Develop advanced coolants (e.g., nanofluids)
B, E, F
8
Develop stationary and other early market fuel cells Develop Stationary Fuel Cell Systems
� Improve system durability � Improve stack performance with reformate � Improve fuel processing performance � Increase system electrical efficiency
Develop Auxiliary Power Units
� Develop diesel fuel processor � Develop fuel cell that operates on reformate � Design, build and test APUs under real-world conditions
Develop Portable Power Technologies
� Develop membranes that will reduce methanol crossover � Design, build and test portable power systems under real-world conditions
Develop Fuel Cells for Off-Road Applications
� Evaluate air filtration technologies
A, B, C, G
Multi-Year Research, Development and Demonstration Plan Page 3.4 - 31
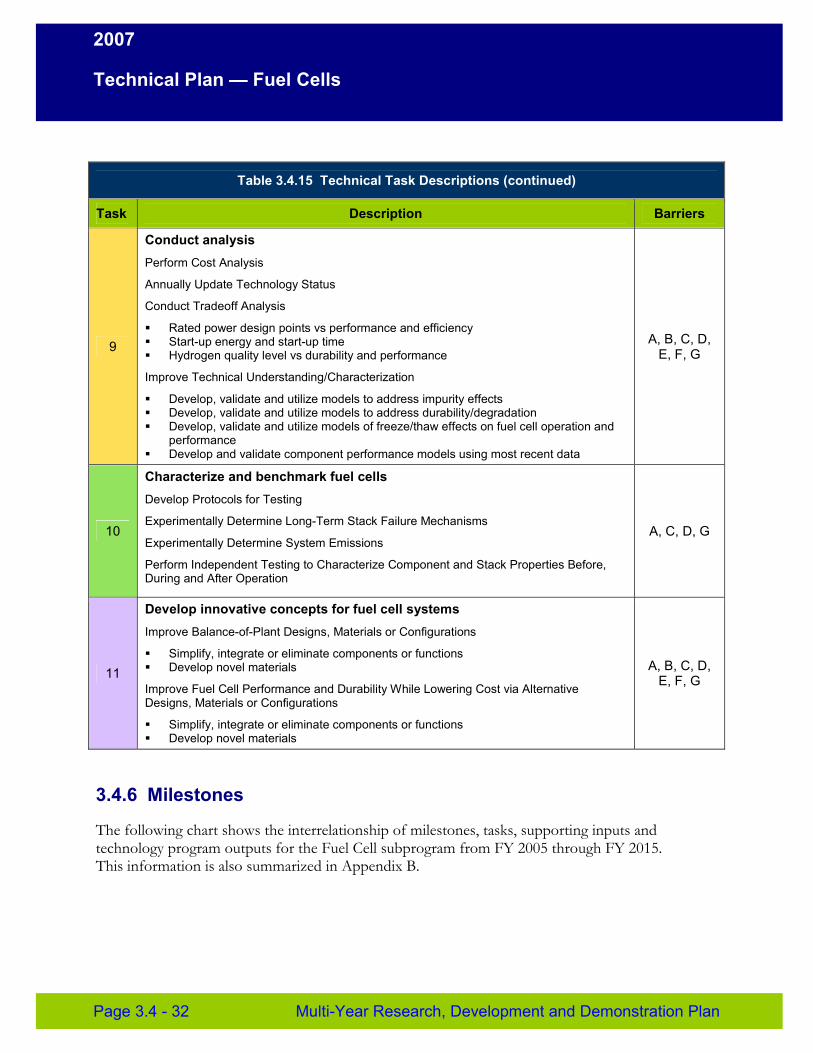
2007
Technical Plan — Fuel Cells
Table 3.4.15 Technical Task Descriptions (continued)
Task Description Barriers
9
Conduct analysis Perform Cost Analysis
Annually Update Technology Status
Conduct Tradeoff Analysis
� Rated power design points vs performance and efficiency � Start-up energy and start-up time � Hydrogen quality level vs durability and performance
Improve Technical Understanding/Characterization
� Develop, validate and utilize models to address impurity effects � Develop, validate and utilize models to address durability/degradation � Develop, validate and utilize models of freeze/thaw effects on fuel cell operation and
performance � Develop and validate component performance models using most recent data
A, B, C, D, E, F, G
10
Characterize and benchmark fuel cells Develop Protocols for Testing
Experimentally Determine Long-Term Stack Failure Mechanisms
Experimentally Determine System Emissions
Perform Independent Testing to Characterize Component and Stack Properties Before, During and After Operation
A, C, D, G
11
Develop innovative concepts for fuel cell systems Improve Balance-of-Plant Designs, Materials or Configurations
� Simplify, integrate or eliminate components or functions � Develop novel materials
Improve Fuel Cell Performance and Durability While Lowering Cost via Alternative Designs, Materials or Configurations
� Simplify, integrate or eliminate components or functions � Develop novel materials
A, B, C, D, E, F, G
3.4.6 Milestones
The following chart shows the interrelationship of milestones, tasks, supporting inputs and technology program outputs for the Fuel Cell subprogram from FY 2005 through FY 2015. This information is also summarized in Appendix B.
Page 3.4 - 32 Multi-Year Research, Development and Demonstration Plan
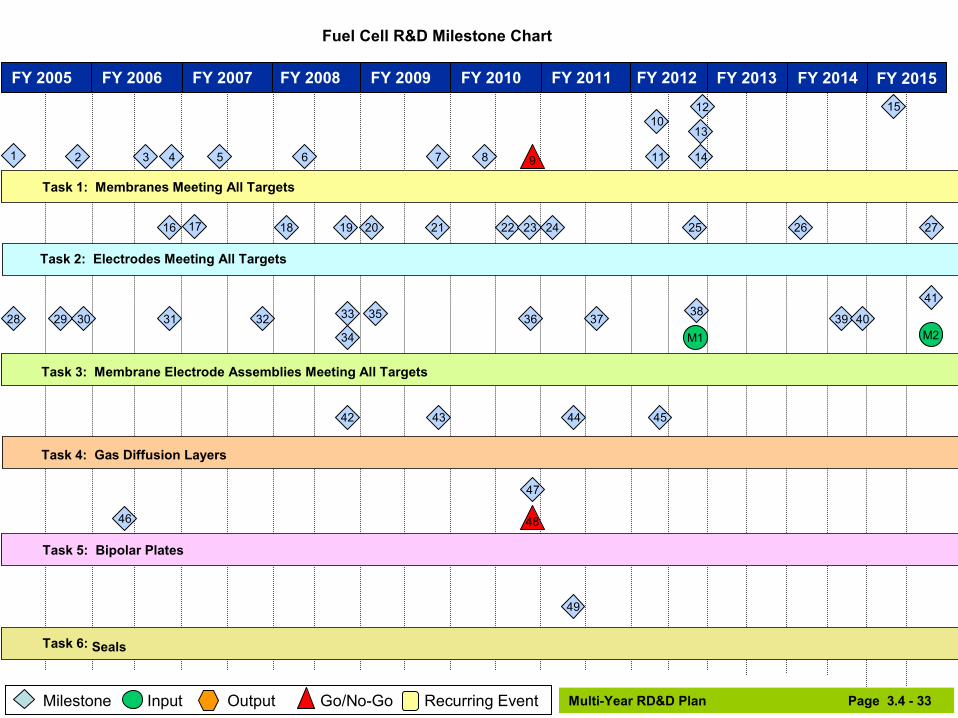
Fuel Cell R&D Milestone Chart
FY 2013 FY 2015 FY 2012 FY 2011 FY 2010 FY 2009 FY 2008 FY 2007 FY 2006 FY 2005 FY 2014
1 2 3 4 5 6 7 8 9
10
11
12
14
13
15
16 17 18 19 20 21 22 23 24 25 26 27
28 29 30 31 32 33
34
35 36 37 38
39 40
41
42 43 44 45
M1 M2
Milestone Input Output Go/No-Go Recurring Event
Task 1: Membranes Meeting All Targets
Task 2: Electrodes Meeting All Targets
Task 3: Membrane Electrode Assemblies Meeting All Targets
Multi-Year RD&D Plan Page 3.4 - 33
Task 4: Gas Diffusion Layers
46
47
48
Task 5: Bipolar Plates
49
Task 6: Seals
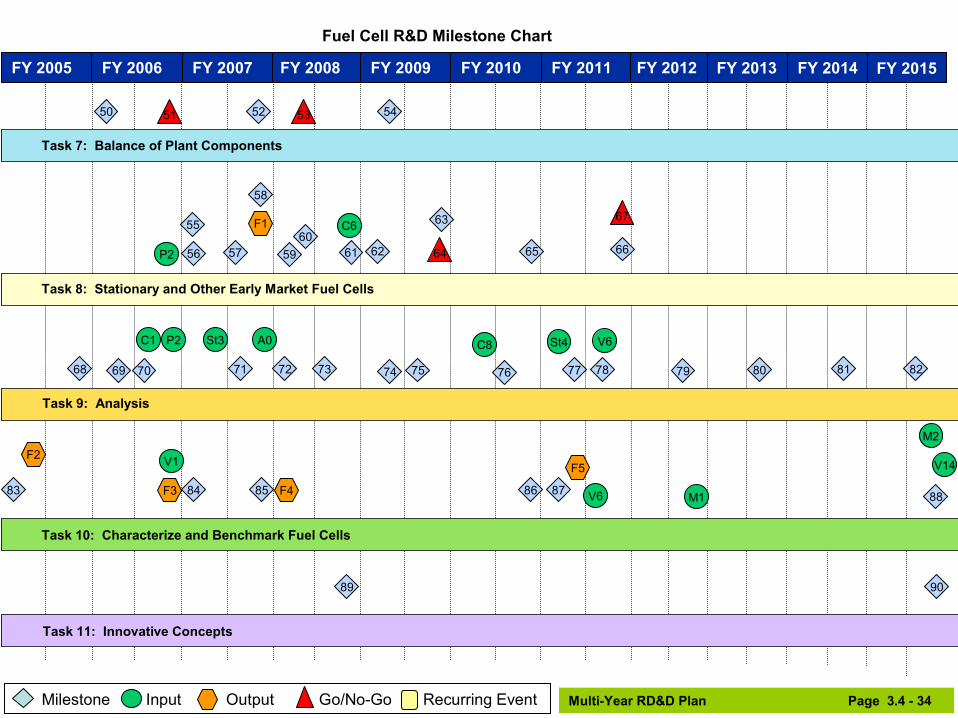
Fuel Cell R&D Milestone Chart
FY 2013 FY 2015 FY 2012 FY 2011 FY 2010 FY 2009 FY 2008 FY 2007 FY 2006 FY 2005 FY 2014
50 51 52 53 54
68
F1
P2
C655
56 57
58
59 60
61 62
63
64 65 66
67
St3 St4 V6C1 P2 C8
69 70 71 72 73 74 75 76 77 78 79 80 81 82
A0
Milestone Input Output Go/No-Go Recurring Event Multi-Year RD&D Plan Page 3.4 - 34
F2
83 F3 F4
F5 V14
84 85 86 87 88
V1
V6 M1
M2
9089
Task 7: Balance of Plant Components
Task 8: Stationary and Other Early Market Fuel Cells
Task 9: Analysis
Task 10: Characterize and Benchmark Fuel Cells
Task 11: Innovative Concepts
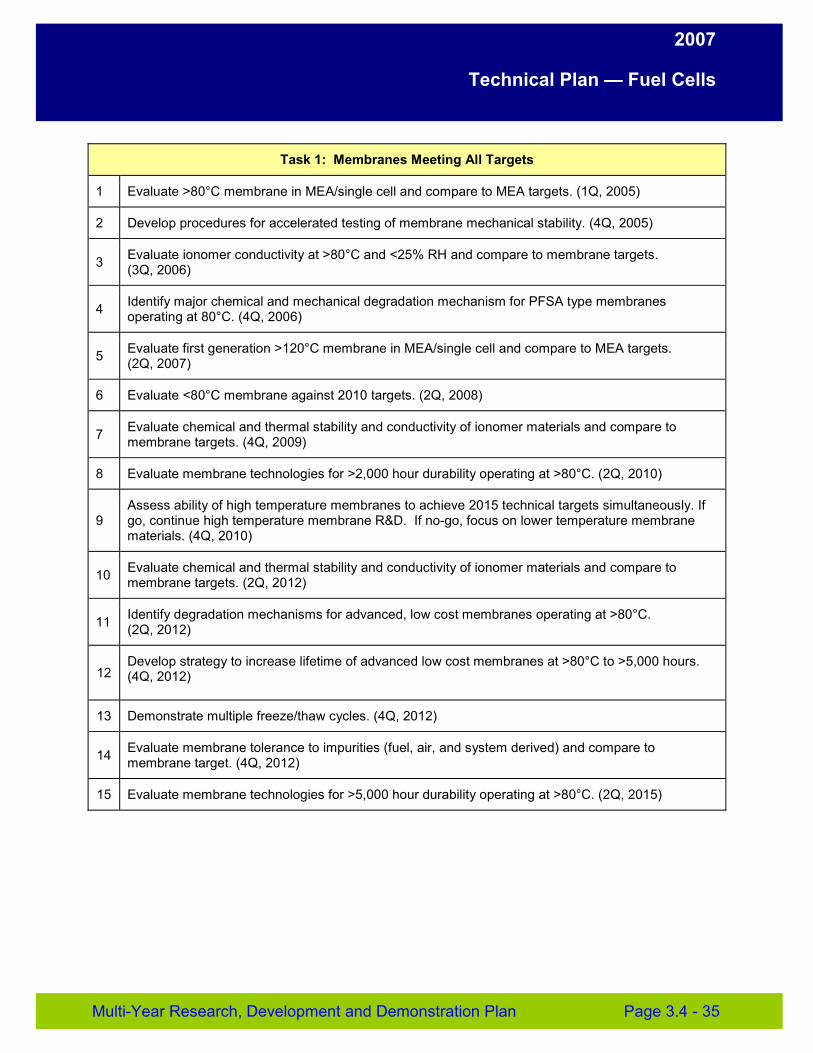
2007
Technical Plan — Fuel Cells
Task 1: Membranes Meeting All Targets
1 Evaluate >80°C membrane in MEA/single cell and compare to MEA targets. (1Q, 2005)
2 Develop procedures for accelerated testing of membrane mechanical stability. (4Q, 2005)
3 Evaluate ionomer conductivity at >80°C and <25% RH and compare to membrane targets. (3Q, 2006)
4 Identify major chemical and mechanical degradation mechanism for PFSA type membranes operating at 80°C. (4Q, 2006)
5 Evaluate first generation >120°C membrane in MEA/single cell and compare to MEA targets. (2Q, 2007)
6 Evaluate <80°C membrane against 2010 targets. (2Q, 2008)
7 Evaluate chemical and thermal stability and conductivity of ionomer materials and compare to membrane targets. (4Q, 2009)
8 Evaluate membrane technologies for >2,000 hour durability operating at >80°C. (2Q, 2010)
9 Assess ability of high temperature membranes to achieve 2015 technical targets simultaneously. If go, continue high temperature membrane R&D. If no-go, focus on lower temperature membrane materials. (4Q, 2010)
10 Evaluate chemical and thermal stability and conductivity of ionomer materials and compare to membrane targets. (2Q, 2012)
11 Identify degradation mechanisms for advanced, low cost membranes operating at >80°C. (2Q, 2012)
12 Develop strategy to increase lifetime of advanced low cost membranes at >80°C to >5,000 hours. (4Q, 2012)
13 Demonstrate multiple freeze/thaw cycles. (4Q, 2012)
14 Evaluate membrane tolerance to impurities (fuel, air, and system derived) and compare to membrane target. (4Q, 2012)
15 Evaluate membrane technologies for >5,000 hour durability operating at >80°C. (2Q, 2015)
Multi-Year Research, Development and Demonstration Plan Page 3.4 - 35
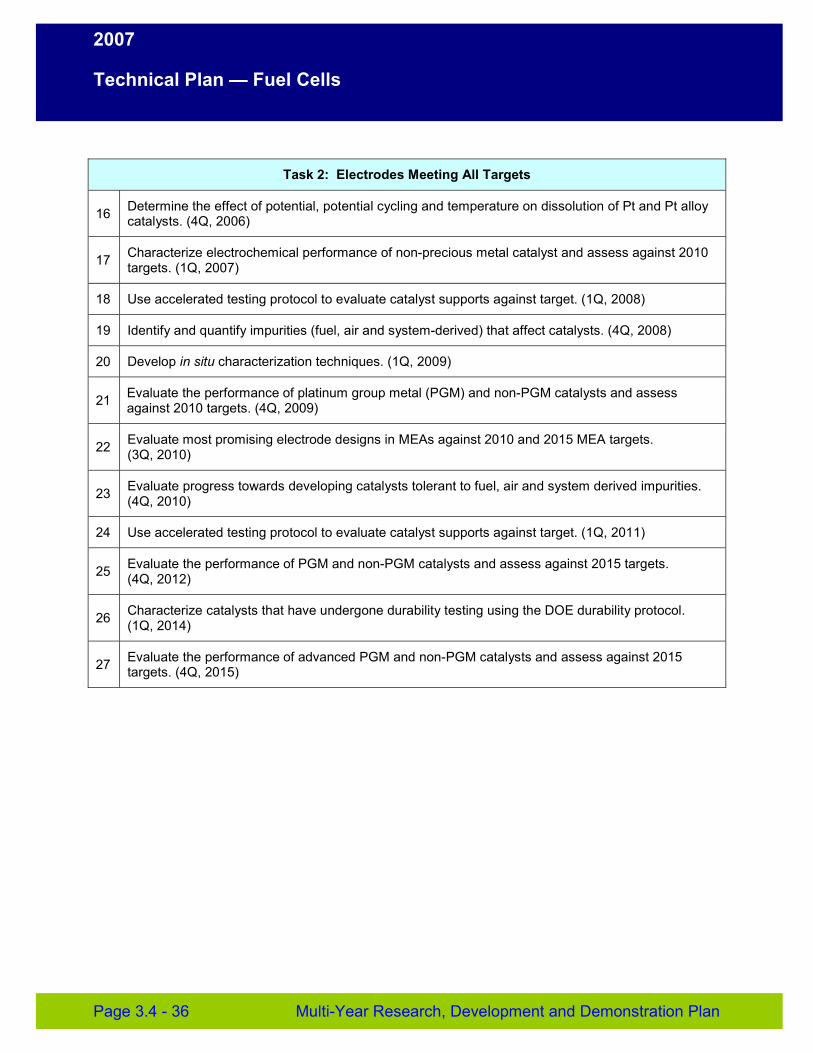
2007
Technical Plan — Fuel Cells
Task 2: Electrodes Meeting All Targets
16 Determine the effect of potential, potential cycling and temperature on dissolution of Pt and Pt alloy catalysts. (4Q, 2006)
17 Characterize electrochemical performance of non-precious metal catalyst and assess against 2010 targets. (1Q, 2007)
18 Use accelerated testing protocol to evaluate catalyst supports against target. (1Q, 2008)
19 Identify and quantify impurities (fuel, air and system-derived) that affect catalysts. (4Q, 2008)
20 Develop in situ characterization techniques. (1Q, 2009)
21 Evaluate the performance of platinum group metal (PGM) and non-PGM catalysts and assess against 2010 targets. (4Q, 2009)
22 Evaluate most promising electrode designs in MEAs against 2010 and 2015 MEA targets. (3Q, 2010)
23 Evaluate progress towards developing catalysts tolerant to fuel, air and system derived impurities. (4Q, 2010)
24 Use accelerated testing protocol to evaluate catalyst supports against target. (1Q, 2011)
25 Evaluate the performance of PGM and non-PGM catalysts and assess against 2015 targets. (4Q, 2012)
26 Characterize catalysts that have undergone durability testing using the DOE durability protocol. (1Q, 2014)
27 Evaluate the performance of advanced PGM and non-PGM catalysts and assess against 2015 targets. (4Q, 2015)
Page 3.4 - 36 Multi-Year Research, Development and Demonstration Plan
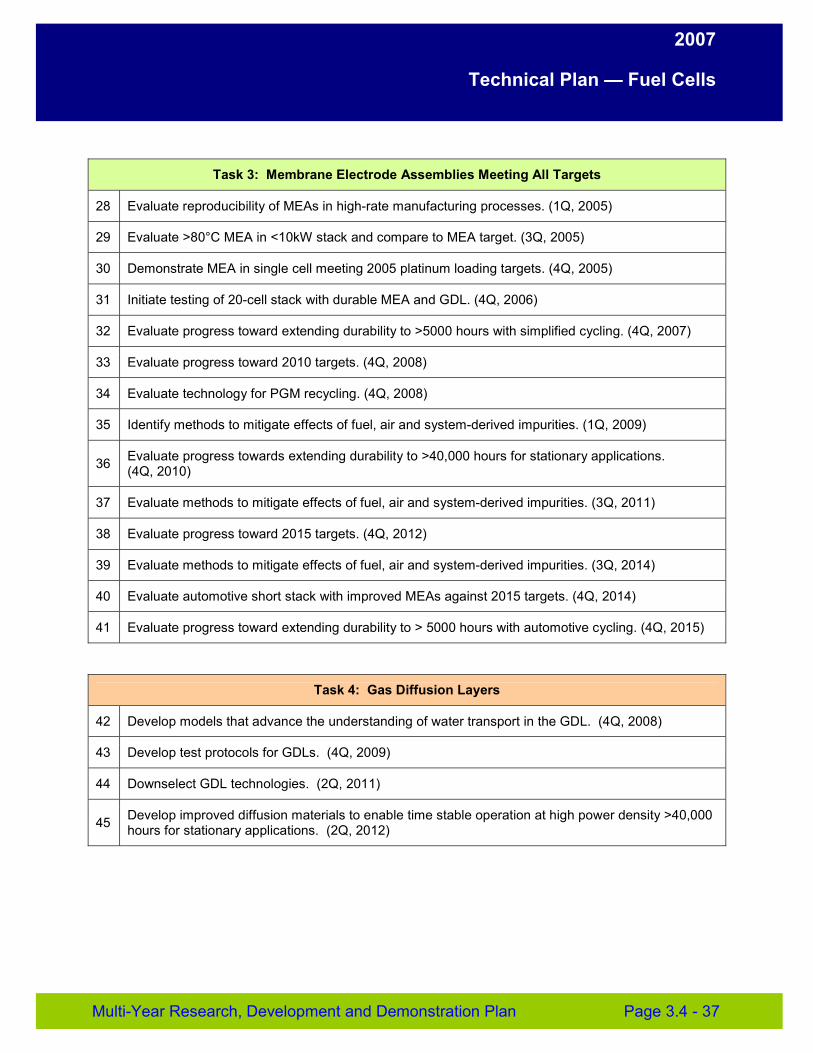
2007
Technical Plan — Fuel Cells
Task 3: Membrane Electrode Assemblies Meeting All Targets
28 Evaluate reproducibility of MEAs in high-rate manufacturing processes. (1Q, 2005)
29 Evaluate >80°C MEA in <10kW stack and compare to MEA target. (3Q, 2005)
30 Demonstrate MEA in single cell meeting 2005 platinum loading targets. (4Q, 2005)
31 Initiate testing of 20-cell stack with durable MEA and GDL. (4Q, 2006)
32 Evaluate progress toward extending durability to >5000 hours with simplified cycling. (4Q, 2007)
33 Evaluate progress toward 2010 targets. (4Q, 2008)
34 Evaluate technology for PGM recycling. (4Q, 2008)
35 Identify methods to mitigate effects of fuel, air and system-derived impurities. (1Q, 2009)
36 Evaluate progress towards extending durability to >40,000 hours for stationary applications. (4Q, 2010)
37 Evaluate methods to mitigate effects of fuel, air and system-derived impurities. (3Q, 2011)
38 Evaluate progress toward 2015 targets. (4Q, 2012)
39 Evaluate methods to mitigate effects of fuel, air and system-derived impurities. (3Q, 2014)
40 Evaluate automotive short stack with improved MEAs against 2015 targets. (4Q, 2014)
41 Evaluate progress toward extending durability to > 5000 hours with automotive cycling. (4Q, 2015)
Task 4: Gas Diffusion Layers
42 Develop models that advance the understanding of water transport in the GDL. (4Q, 2008)
43 Develop test protocols for GDLs. (4Q, 2009)
44 Downselect GDL technologies. (2Q, 2011)
45 Develop improved diffusion materials to enable time stable operation at high power density >40,000 hours for stationary applications. (2Q, 2012)
Multi-Year Research, Development and Demonstration Plan Page 3.4 - 37
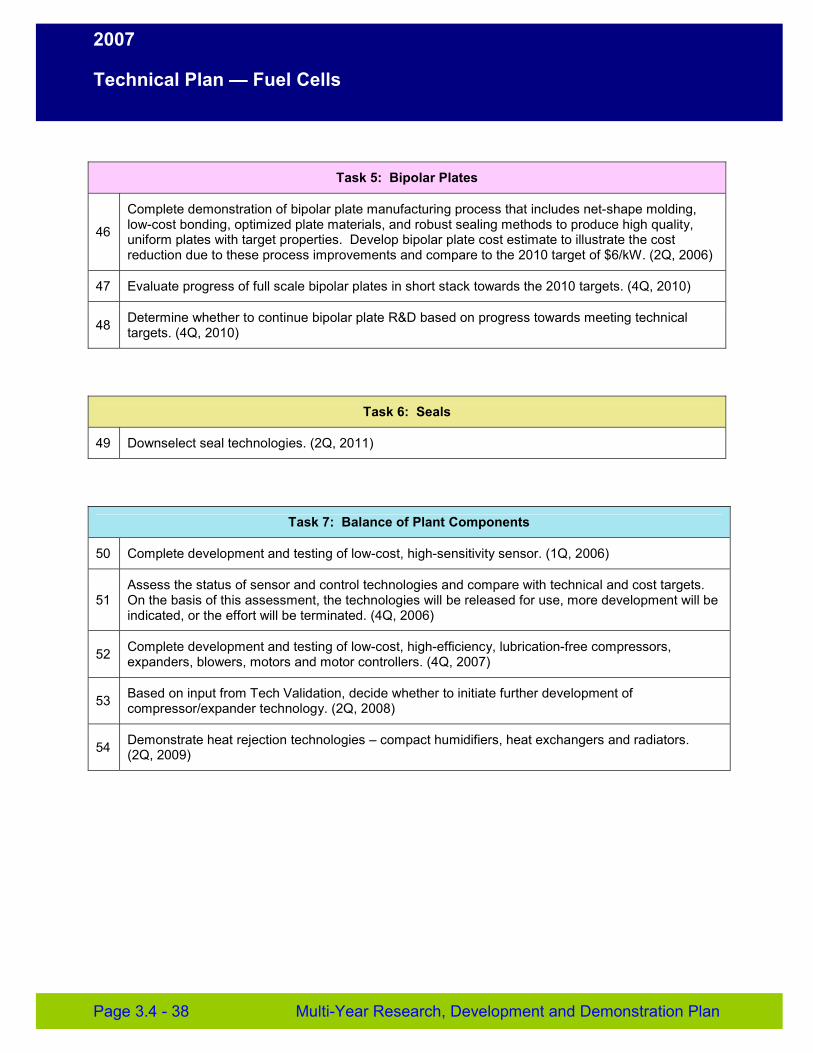
2007
Technical Plan — Fuel Cells
Task 5: Bipolar Plates
46
Complete demonstration of bipolar plate manufacturing process that includes net-shape molding, low-cost bonding, optimized plate materials, and robust sealing methods to produce high quality, uniform plates with target properties. Develop bipolar plate cost estimate to illustrate the cost reduction due to these process improvements and compare to the 2010 target of $6/kW. (2Q, 2006)
47 Evaluate progress of full scale bipolar plates in short stack towards the 2010 targets. (4Q, 2010)
48 Determine whether to continue bipolar plate R&D based on progress towards meeting technical targets. (4Q, 2010)
Task 6: Seals
49 Downselect seal technologies. (2Q, 2011)
Task 7: Balance of Plant Components
50 Complete development and testing of low-cost, high-sensitivity sensor. (1Q, 2006)
51 Assess the status of sensor and control technologies and compare with technical and cost targets. On the basis of this assessment, the technologies will be released for use, more development will be indicated, or the effort will be terminated. (4Q, 2006)
52 Complete development and testing of low-cost, high-efficiency, lubrication-free compressors, expanders, blowers, motors and motor controllers. (4Q, 2007)
53 Based on input from Tech Validation, decide whether to initiate further development of compressor/expander technology. (2Q, 2008)
54 Demonstrate heat rejection technologies – compact humidifiers, heat exchangers and radiators. (2Q, 2009)
Page 3.4 - 38 Multi-Year Research, Development and Demonstration Plan
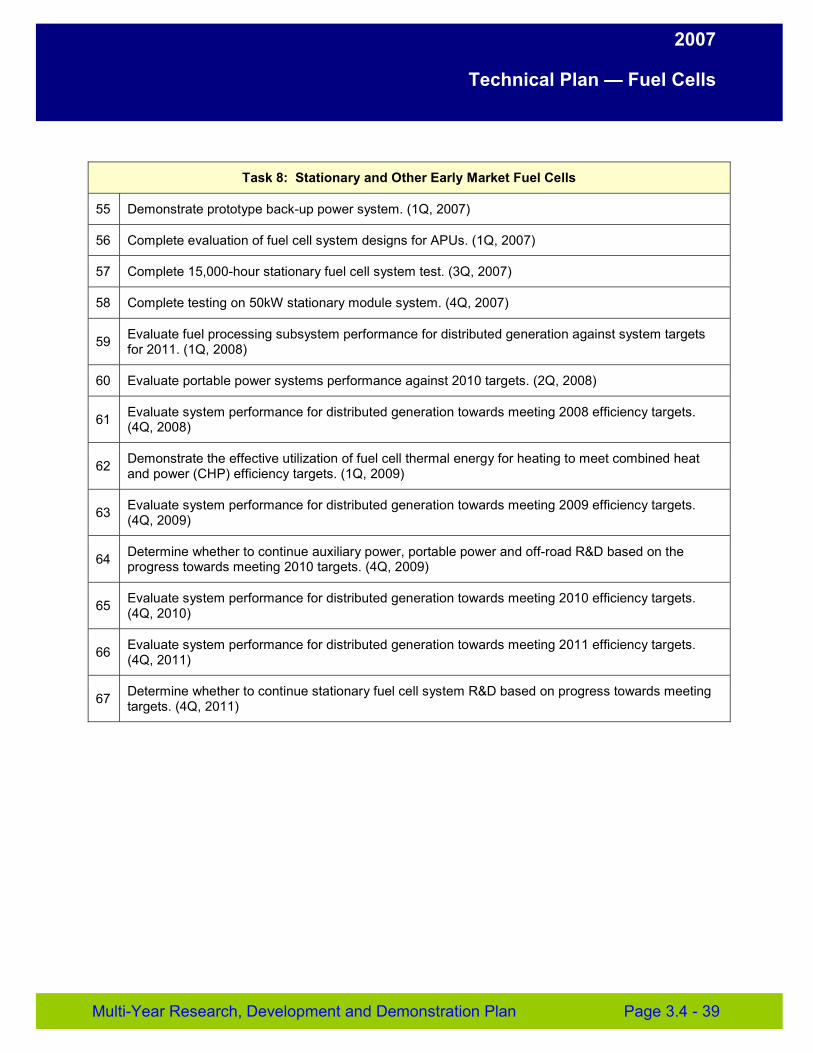
2007
Technical Plan — Fuel Cells
Task 8: Stationary and Other Early Market Fuel Cells
55 Demonstrate prototype back-up power system. (1Q, 2007)
56 Complete evaluation of fuel cell system designs for APUs. (1Q, 2007)
57 Complete 15,000-hour stationary fuel cell system test. (3Q, 2007)
58 Complete testing on 50kW stationary module system. (4Q, 2007)
59 Evaluate fuel processing subsystem performance for distributed generation against system targets for 2011. (1Q, 2008)
60 Evaluate portable power systems performance against 2010 targets. (2Q, 2008)
61 Evaluate system performance for distributed generation towards meeting 2008 efficiency targets. (4Q, 2008)
62 Demonstrate the effective utilization of fuel cell thermal energy for heating to meet combined heat and power (CHP) efficiency targets. (1Q, 2009)
63 Evaluate system performance for distributed generation towards meeting 2009 efficiency targets. (4Q, 2009)
64 Determine whether to continue auxiliary power, portable power and off-road R&D based on the progress towards meeting 2010 targets. (4Q, 2009)
65 Evaluate system performance for distributed generation towards meeting 2010 efficiency targets. (4Q, 2010)
66 Evaluate system performance for distributed generation towards meeting 2011 efficiency targets. (4Q, 2011)
67 Determine whether to continue stationary fuel cell system R&D based on progress towards meeting targets. (4Q, 2011)
Multi-Year Research, Development and Demonstration Plan Page 3.4 - 39
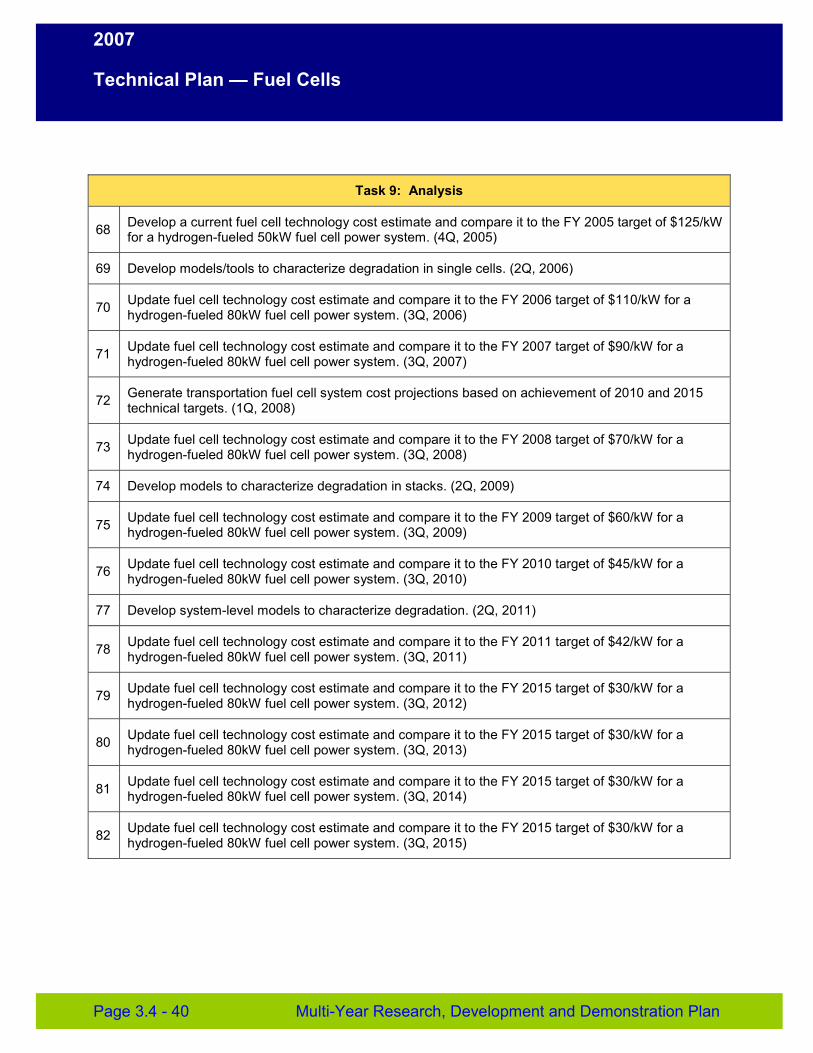
2007
Technical Plan — Fuel Cells
Task 9: Analysis
68 Develop a current fuel cell technology cost estimate and compare it to the FY 2005 target of $125/kW for a hydrogen-fueled 50kW fuel cell power system. (4Q, 2005)
69 Develop models/tools to characterize degradation in single cells. (2Q, 2006)
70 Update fuel cell technology cost estimate and compare it to the FY 2006 target of $110/kW for a hydrogen-fueled 80kW fuel cell power system. (3Q, 2006)
71 Update fuel cell technology cost estimate and compare it to the FY 2007 target of $90/kW for a hydrogen-fueled 80kW fuel cell power system. (3Q, 2007)
72 Generate transportation fuel cell system cost projections based on achievement of 2010 and 2015 technical targets. (1Q, 2008)
73 Update fuel cell technology cost estimate and compare it to the FY 2008 target of $70/kW for a hydrogen-fueled 80kW fuel cell power system. (3Q, 2008)
74 Develop models to characterize degradation in stacks. (2Q, 2009)
75 Update fuel cell technology cost estimate and compare it to the FY 2009 target of $60/kW for a hydrogen-fueled 80kW fuel cell power system. (3Q, 2009)
76 Update fuel cell technology cost estimate and compare it to the FY 2010 target of $45/kW for a hydrogen-fueled 80kW fuel cell power system. (3Q, 2010)
77 Develop system-level models to characterize degradation. (2Q, 2011)
78 Update fuel cell technology cost estimate and compare it to the FY 2011 target of $42/kW for a hydrogen-fueled 80kW fuel cell power system. (3Q, 2011)
79 Update fuel cell technology cost estimate and compare it to the FY 2015 target of $30/kW for a hydrogen-fueled 80kW fuel cell power system. (3Q, 2012)
80 Update fuel cell technology cost estimate and compare it to the FY 2015 target of $30/kW for a hydrogen-fueled 80kW fuel cell power system. (3Q, 2013)
81 Update fuel cell technology cost estimate and compare it to the FY 2015 target of $30/kW for a hydrogen-fueled 80kW fuel cell power system. (3Q, 2014)
82 Update fuel cell technology cost estimate and compare it to the FY 2015 target of $30/kW for a hydrogen-fueled 80kW fuel cell power system. (3Q, 2015)
Page 3.4 - 40 Multi-Year Research, Development and Demonstration Plan
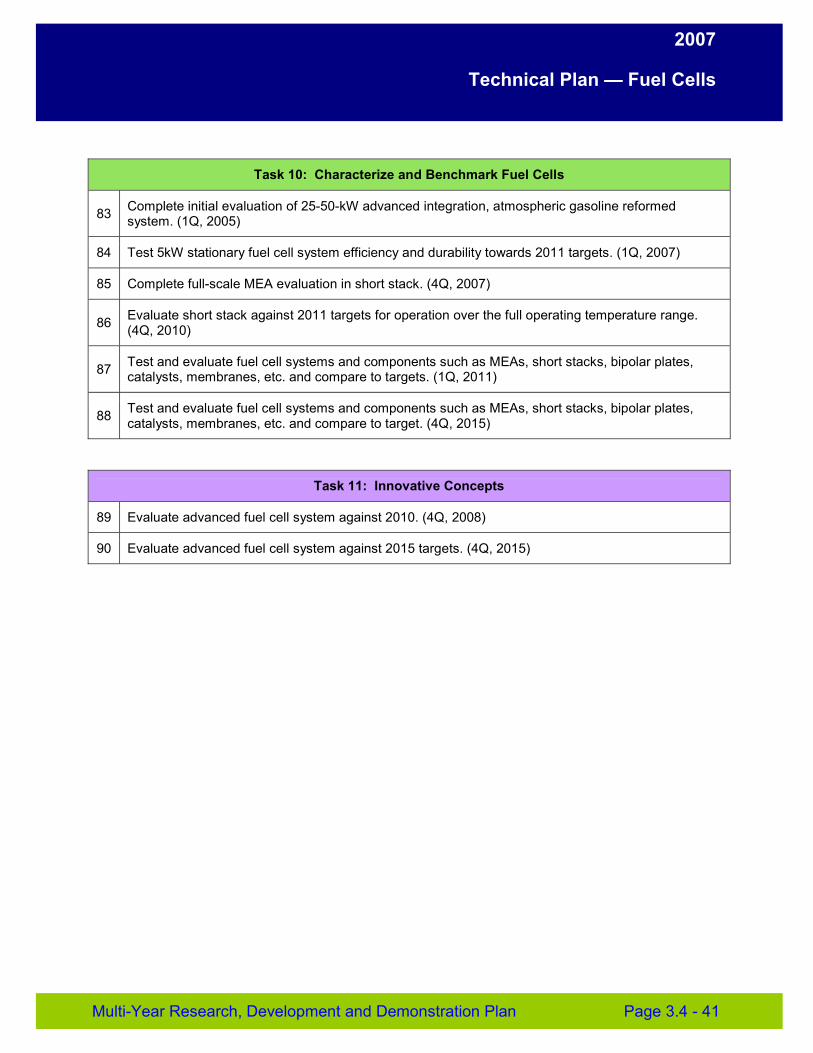
2007
Technical Plan — Fuel Cells
Task 10: Characterize and Benchmark Fuel Cells
83 Complete initial evaluation of 25-50-kW advanced integration, atmospheric gasoline reformed system. (1Q, 2005)
84 Test 5kW stationary fuel cell system efficiency and durability towards 2011 targets. (1Q, 2007)
85 Complete full-scale MEA evaluation in short stack. (4Q, 2007)
86 Evaluate short stack against 2011 targets for operation over the full operating temperature range. (4Q, 2010)
87 Test and evaluate fuel cell systems and components such as MEAs, short stacks, bipolar plates, catalysts, membranes, etc. and compare to targets. (1Q, 2011)
88 Test and evaluate fuel cell systems and components such as MEAs, short stacks, bipolar plates, catalysts, membranes, etc. and compare to target. (4Q, 2015)
Task 11: Innovative Concepts
89 Evaluate advanced fuel cell system against 2010. (4Q, 2008)
90 Evaluate advanced fuel cell system against 2015 targets. (4Q, 2015)
Multi-Year Research, Development and Demonstration Plan Page 3.4 - 41
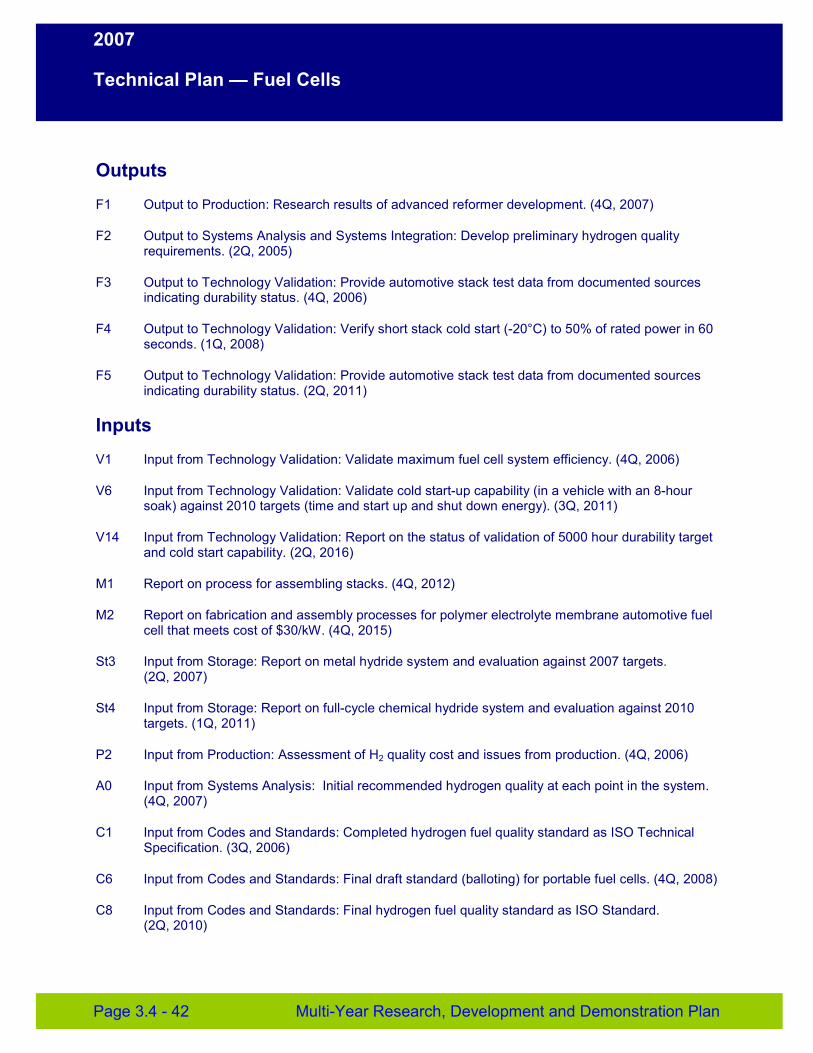
2007
Technical Plan — Fuel Cells
Outputs
F1 Output to Production: Research results of advanced reformer development. (4Q, 2007)
F2 Output to Systems Analysis and Systems Integration: Develop preliminary hydrogen quality requirements. (2Q, 2005)
F3 Output to Technology Validation: Provide automotive stack test data from documented sources indicating durability status. (4Q, 2006)
F4 Output to Technology Validation: Verify short stack cold start (-20°C) to 50% of rated power in 60 seconds. (1Q, 2008)
F5 Output to Technology Validation: Provide automotive stack test data from documented sources indicating durability status. (2Q, 2011)
Inputs
V1 Input from Technology Validation: Validate maximum fuel cell system efficiency. (4Q, 2006)
V6 Input from Technology Validation: Validate cold start-up capability (in a vehicle with an 8-hour soak) against 2010 targets (time and start up and shut down energy). (3Q, 2011)
V14 Input from Technology Validation: Report on the status of validation of 5000 hour durability target and cold start capability. (2Q, 2016)
M1 Report on process for assembling stacks. (4Q, 2012)
M2 Report on fabrication and assembly processes for polymer electrolyte membrane automotive fuel cell that meets cost of $30/kW. (4Q, 2015)
St3 Input from Storage: Report on metal hydride system and evaluation against 2007 targets. (2Q, 2007)
St4 Input from Storage: Report on full-cycle chemical hydride system and evaluation against 2010 targets. (1Q, 2011)
P2 Input from Production: Assessment of H2 quality cost and issues from production. (4Q, 2006)
A0 Input from Systems Analysis: Initial recommended hydrogen quality at each point in the system. (4Q, 2007)
C1 Input from Codes and Standards: Completed hydrogen fuel quality standard as ISO Technical Specification. (3Q, 2006)
C6 Input from Codes and Standards: Final draft standard (balloting) for portable fuel cells. (4Q, 2008)
C8 Input from Codes and Standards: Final hydrogen fuel quality standard as ISO Standard. (2Q, 2010)
Page 3.4 - 42 Multi-Year Research, Development and Demonstration Plan
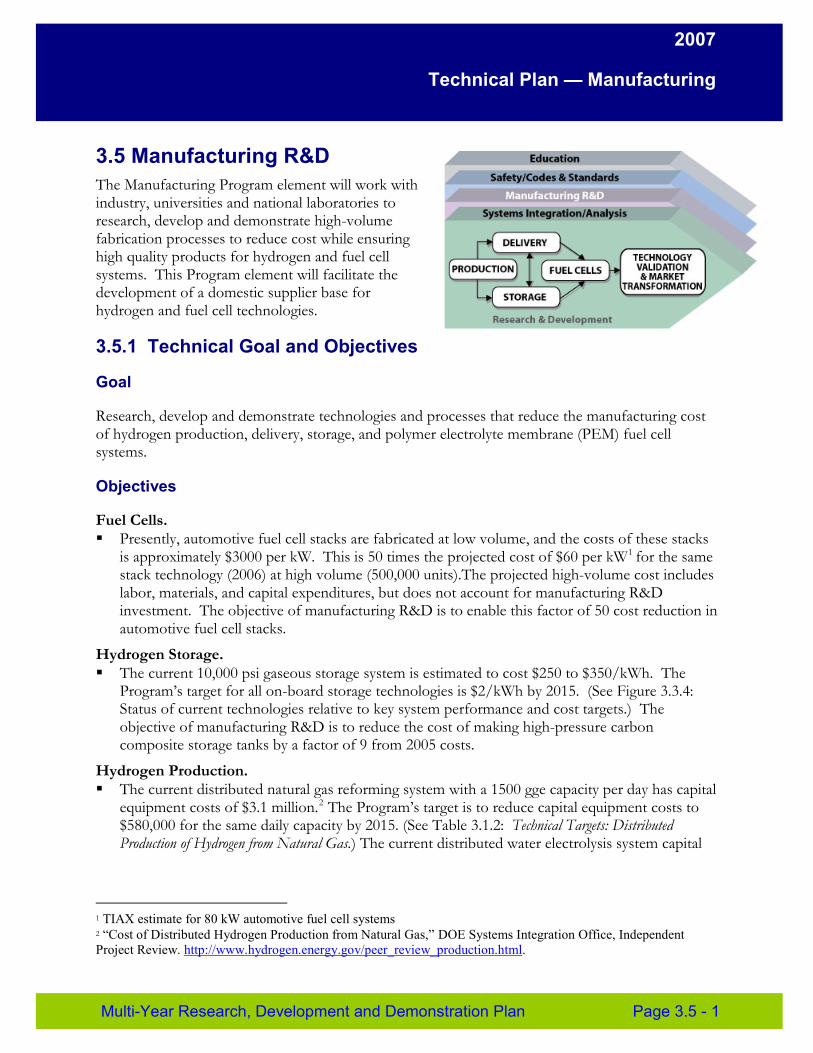
2007
Technical Plan — Manufacturing
3.5 Manufacturing R&D The Manufacturing Program element will work with industry, universities and national laboratories to research, develop and demonstrate high-volume fabrication processes to reduce cost while ensuring high quality products for hydrogen and fuel cell systems. This Program element will facilitate the development of a domestic supplier base for hydrogen and fuel cell technologies.
3.5.1 Technical Goal and Objectives
Goal
Research, develop and demonstrate technologies and processes that reduce the manufacturing cost of hydrogen production, delivery, storage, and polymer electrolyte membrane (PEM) fuel cell systems.
Objectives
Fuel Cells. � Presently, automotive fuel cell stacks are fabricated at low volume, and the costs of these stacks
is approximately $3000 per kW. This is 50 times the projected cost of $60 per kW1 for the same stack technology (2006) at high volume (500,000 units).The projected high-volume cost includes labor, materials, and capital expenditures, but does not account for manufacturing R&D investment. The objective of manufacturing R&D is to enable this factor of 50 cost reduction in automotive fuel cell stacks.
Hydrogen Storage. � The current 10,000 psi gaseous storage system is estimated to cost $250 to $350/kWh. The
Program’s target for all on-board storage technologies is $2/kWh by 2015. (See Figure 3.3.4: Status of current technologies relative to key system performance and cost targets.) The objective of manufacturing R&D is to reduce the cost of making high-pressure carbon composite storage tanks by a factor of 9 from 2005 costs.
Hydrogen Production. � The current distributed natural gas reforming system with a 1500 gge capacity per day has capital
equipment costs of $3.1 million.2 The Program’s target is to reduce capital equipment costs to $580,000 for the same daily capacity by 2015. (See Table 3.1.2: Technical Targets: Distributed Production of Hydrogen from Natural Gas.) The current distributed water electrolysis system capital
1 TIAX estimate for 80 kW automotive fuel cell systems 2 “Cost of Distributed Hydrogen Production from Natural Gas,” DOE Systems Integration Office, Independent Project Review. http://www.hydrogen.energy.gov/peer_review_production.html.
Multi-Year Research, Development and Demonstration Plan Page 3.5 - 1

2007
Technical Plan — Manufacturing
equipment cost is $900/kW.3 The Program’s target is $125/kW by 2017. The objective of manufacturing R&D is to reduce the cost of making components and subsystems for distributed natural gas reforming systems by a factor of 5 from 2006 costs.
3.5.2 Approach
This effort on Manufacturing R&D describes activities at the intersection of two Presidential Initiatives - the Manufacturing Initiative and the Hydrogen Fuel Initiative. To implement the President's Manufacturing Initiative, the National Science and Technology Council established the Interagency Working Group (IWG) on Manufacturing R&D. The IWG, led by the U.S. Department of Commerce, is coordinating and leveraging the current Federal efforts focused on manufacturability issues such as low-cost, high-volume manufacturing systems, advanced manufacturing technologies, manufacturing infrastructure, and measurements and standards. Manufacturing R&D for the Hydrogen Economy is one of three technical priorities of the IWG.
In July 2005, DOE, with support from the Department of Commerce’s National Institute for Standards and Technology (NIST), conducted a Workshop on Manufacturing R&D for the Hydrogen Economy to identify the path forward to address these challenges. The workshop brought together industry, university, national laboratory, and government representatives to discuss the key issues facing manufacturing of fuel cells, hydrogen production and delivery systems, and hydrogen storage systems. Workshop participants identified key technical challenges that face the manufacture of hydrogen technologies and recommended priorities for manufacturing R&D to facilitate their commercialization. The Roadmap on Manufacturing R&D for the Hydrogen Economy, which incorporated these recommendations, forms the basis for the Hydrogen Program's manufacturing element.
This Program element summary focuses on hydrogen components and systems that will need to be manufactured during the initial transition to a hydrogen infrastructure. In addition, cross-cutting technologies and capabilities will be developed, e.g., metrology and standards, modeling and simulation tools for manufacturing processes, knowledge bases for manufacturing, design for manufacturing, and sensors and process control. Longer-term technologies under development through the Hydrogen Fuel Initiative will be addressed in later manufacturing R&D efforts. This manufacturing R&D Program element emphasizes the expected demand for hydrogen production, hydrogen storage, and fuel cells for stationary, portable and transportation applications.
The Manufacturing R&D subprogram will:
� Develop innovative, low-cost manufacturing technologies for new materials and material applications.
� Adapt and scale-up laboratory fabrication methods to low-cost, high-volume production.
� Establish and refine process and quality control manufacturing techniques while hydrogen and fuel cell technologies are still evolving.
3 DOE Hydrogen Program, "Record 6002d: H2A MYYPP Current Forecourt Electrolysis Case (2006)," http://www.hydrogen.energy.gov/program_records.html.
Page 3.5 - 2 Multi-Year Research, Development and Demonstration Plan
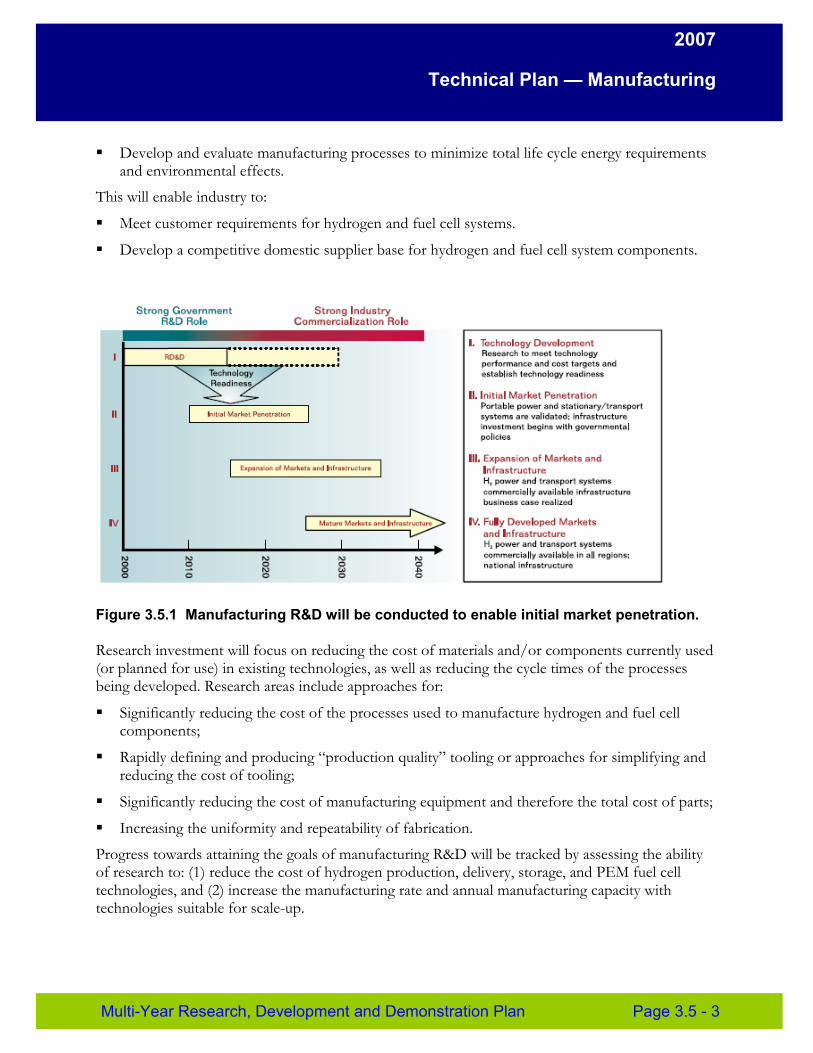
2007
Technical Plan — Manufacturing
� Develop and evaluate manufacturing processes to minimize total life cycle energy requirements and environmental effects.
This will enable industry to:
� Meet customer requirements for hydrogen and fuel cell systems.
� Develop a competitive domestic supplier base for hydrogen and fuel cell system components.
Figure 3.5.1 Manufacturing R&D will be conducted to enable initial market penetration.
Research investment will focus on reducing the cost of materials and/or components currently used (or planned for use) in existing technologies, as well as reducing the cycle times of the processes being developed. Research areas include approaches for:
� Significantly reducing the cost of the processes used to manufacture hydrogen and fuel cell components;
� Rapidly defining and producing “production quality” tooling or approaches for simplifying and reducing the cost of tooling;
� Significantly reducing the cost of manufacturing equipment and therefore the total cost of parts;
� Increasing the uniformity and repeatability of fabrication.
Progress towards attaining the goals of manufacturing R&D will be tracked by assessing the ability of research to: (1) reduce the cost of hydrogen production, delivery, storage, and PEM fuel cell technologies, and (2) increase the manufacturing rate and annual manufacturing capacity with technologies suitable for scale-up.
Multi-Year Research, Development and Demonstration Plan Page 3.5 - 3
2007
Technical Plan — Manufacturing
3.5.3 Programmatic Status
PEM Fuel Cells
Fuel cell stacks and their respective components are in the early stages of manufacturing technology development. Fuel cells stacks are now fabricated with laboratory methods that have typically been scaled up in size, but do not incorporate high-volume manufacturing methods. Application of high throughput roll-processing methods for three-layer MEAs (membrane electrode assemblies, e.g., catalyst coated membranes) is reported by several companies. On the other hand, full five-layer MEA roll-processing is not well developed. The entire fuel cell power system is usually constructed by integrating subsystems (e.g., hydrogen and oxygen delivery, water management, thermal management); however, each subsystem is assembled separately by a labor-intensive process.
Fuel cell system costs have been estimated for high production volumes, i.e., 500,000 units per year. Manufacturing assumptions for the estimated high volumes of parts include plant capacity scaled to market size, manufacturing process capabilities consistent with high-volume production, and low scrap rates.
Hydrogen Storage
At the present time, relatively few components for onboard hydrogen storage are commercially available and these components are only manufactured in very small quantities.
The exceptional strength-to-weight ratio of carbon fiber composite tanks makes them prime candidates for use with materials-based, cryogenic, or high-pressure gas for both vehicular and stationary storage applications. Hence, manufacturing improvements that reduce the system unit cost and production cycle time of these components would have wide applicability to hydrogen storage systems in general.
The major limitations on manufacturing composite tanks are the material cost of high-strength carbon fibers and processes used for fiber winding/placement. Tank testing and certification processes can also add significantly to tank cost. Even with multiple fiber winding machines, production capacity is limited to a few units per day. In stark contrast, high-volume production would require a rate of approximately 80 units per hour for 500,000 units per year. Clearly, significant challenges must be overcome to cost-effectively manufacture units at a rate sufficient to meet demand for use with fuel cell systems during near-term deployment. In the long-term, based on research progress in developing low pressure approaches, additional manufacturing R&D to ensure low-cost and reliable conformable storage systems will likely be required.
Page 3.5 - 4 Multi-Year Research, Development and Demonstration Plan
2007
Technical Plan — Manufacturing
Hydrogen Production
Because a large-scale delivery network will not be available in the near term, early hydrogen production technologies will likely be distributed reforming of natural gas or renewable liquid fuels (including ethanol or bio-oils), and distributed electrolysis. Today, hydrogen production is capital intensive; the capital contribution for small distributed hydrogen production facilities dominates. For distributed natural gas reforming systems, large capital contribution results from site-specific fabrication of fuel processing systems, which includes reformers, water-gas-shift catalyst beds, and pressure swing adsorption cleanup subsystems.
There is very limited manufacturing (none of which is automated) of electrolysis units in the size necessary for a distributed hydrogen fuel network for transportation. Manufacturing is focused on near ambient temperature alkaline and PEM electrolyzers. Synergistic manufacturing processes between PEM electrolyzers and fuel cells will be investigated. High-temperature solid oxide electrolyzers are currently not addressed in the Manufacturing R&D element because they are more suited to centralized, fossil energy based production systems. Since Manufacturing R&D is focused on near-term distributed production of hydrogen, hydrogen delivery technologies using central production pathways are not within the scope of the program in the near term.
Manufacturing R&D is required to reduce the high capital cost associated with establishing a distributed hydrogen generation network at existing refueling stations. Reducing the high capital cost by developing manufacturing facilities for pre-fabricating hydrogen generation systems and delivering the system modules to the generation sites will be required. Constructing modules that can be readily integrated into a hydrogen generation/delivery system and easily installed at a refueling station offers an approach to reducing costs by eliminating on-site construction and assembly of the individual components.
Current DOE manufacturing R&D projects are summarized in Table 3.5.1.
Multi-Year Research, Development and Demonstration Plan Page 3.5 - 5
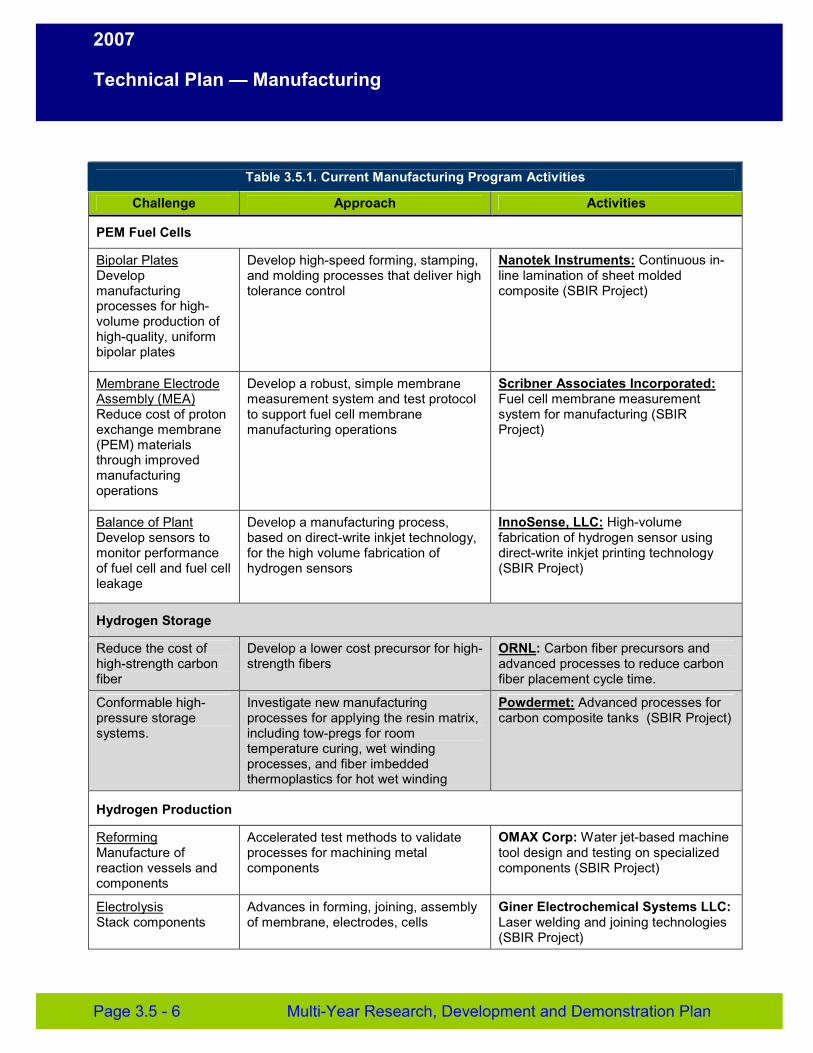
2007
Technical Plan — Manufacturing
Table 3.5.1. Current Manufacturing Program Activities
Challenge Approach Activities
PEM Fuel Cells
Bipolar Plates Develop manufacturing processes for high-volume production of high-quality, uniform bipolar plates
Develop high-speed forming, stamping, and molding processes that deliver high tolerance control
Nanotek Instruments: Continuous in-line lamination of sheet molded composite (SBIR Project)
Membrane Electrode Assembly (MEA) Reduce cost of proton exchange membrane (PEM) materials through improved manufacturing operations
Develop a robust, simple membrane measurement system and test protocol to support fuel cell membrane manufacturing operations
Scribner Associates Incorporated: Fuel cell membrane measurement system for manufacturing (SBIR Project)
Balance of Plant Develop sensors to monitor performance of fuel cell and fuel cell leakage
Develop a manufacturing process, based on direct-write inkjet technology, for the high volume fabrication of hydrogen sensors
InnoSense, LLC: High-volume fabrication of hydrogen sensor using direct-write inkjet printing technology (SBIR Project)
Hydrogen Storage
Reduce the cost of high-strength carbon fiber
Develop a lower cost precursor for high-strength fibers
ORNL: Carbon fiber precursors and advanced processes to reduce carbon fiber placement cycle time.
Conformable high-pressure storage systems.
Investigate new manufacturing processes for applying the resin matrix, including tow-pregs for room temperature curing, wet winding processes, and fiber imbedded thermoplastics for hot wet winding
Powdermet: Advanced processes for carbon composite tanks (SBIR Project)
Hydrogen Production
Reforming Manufacture of reaction vessels and components
Accelerated test methods to validate processes for machining metal components
OMAX Corp: Water jet-based machine tool design and testing on specialized components (SBIR Project)
Electrolysis Stack components
Advances in forming, joining, assembly of membrane, electrodes, cells
Giner Electrochemical Systems LLC: Laser welding and joining technologies (SBIR Project)
Page 3.5 - 6 Multi-Year Research, Development and Demonstration Plan
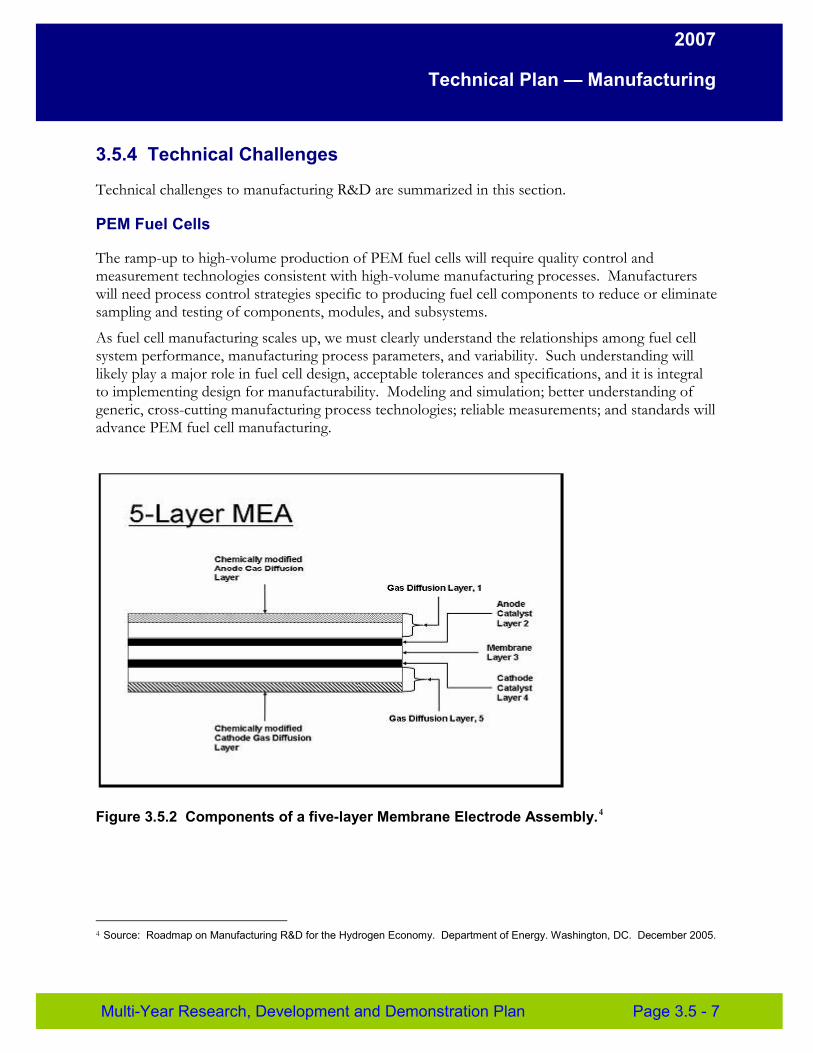
2007
Technical Plan — Manufacturing
3.5.4 Technical Challenges
Technical challenges to manufacturing R&D are summarized in this section.
PEM Fuel Cells
The ramp-up to high-volume production of PEM fuel cells will require quality control and measurement technologies consistent with high-volume manufacturing processes. Manufacturers will need process control strategies specific to producing fuel cell components to reduce or eliminate sampling and testing of components, modules, and subsystems.
As fuel cell manufacturing scales up, we must clearly understand the relationships among fuel cell system performance, manufacturing process parameters, and variability. Such understanding will likely play a major role in fuel cell design, acceptable tolerances and specifications, and it is integral to implementing design for manufacturability. Modeling and simulation; better understanding of generic, cross-cutting manufacturing process technologies; reliable measurements; and standards will advance PEM fuel cell manufacturing.
Figure 3.5.2 Components of a five-layer Membrane Electrode Assembly.4
4 Source: Roadmap on Manufacturing R&D for the Hydrogen Economy. Department of Energy. Washington, DC. December 2005.
Multi-Year Research, Development and Demonstration Plan Page 3.5 - 7
2007
Technical Plan — Manufacturing
Manufacturing R&D is needed in the following critical technologies:
� Membrane electrode assembly
� Fuel cell stack assembly
� Bipolar plate fabrication
� Balance-of-plant subsystem assembly
Each of these technologies requires manufacturing processes that can be scaled to increasing production volumes.
Hydrogen Storage
Cost is the primary issue with composite tank technology. Manufacturing carbon fiber storage tanks for both vehicular and stationary storage at forecourt stations will require dramatic reductions in unit costs and fabrication times while ensuring required quality control. A critical challenge lies in the cost of the fiber and the manufacture of composite tanks. Current projections of the manufactured cost per unit for high production volumes are about a factor of nine above storage system targets, and it is estimated that about 40 - 70% of the unit cost is due to the base cost of the carbon fiber (approximately 40% of the fiber cost is due to the precursor and the remainder due to thermal processing). The FreedomCar and Vehicle Technology Program of EERE is seeking to develop a low-cost commercial carbon fiber utilizing new precursors and new heat treatment processes to reduce the cycle time. The strength of the final product fiber will be limited to approximately 3.6-5.7 ksi because this range is adequate for vehicle body components. However, carbon fiber composite high-pressure storage vessels will require a tensile strength of 10 ksi or greater.
Costs for compressed gas storage systems stored at 350 and 700 bar (5,000 and 10,000 psi) can be reduced by lowering the cost of carbon fiber through materials and process improvements and moving to higher volume manufacturing processes through advanced manufacturing R&D. R&D is needed as composite storage technology is most likely to be employed in the near term for transportation applications and will be needed for most materials-based approaches for hydrogen storage.
High-volume production rates cannot be met simply by increased capitalization of current manufacturing equipment. Most importantly, the cycle time needs to be significantly reduced, which will require significant advances in filament winding processes or in the use of an alternative technology yet to be identified or developed. Reducing the amount of fiber used through fiber placement, and improvements in resin matrix technologies could greatly lower costs.
Hydrogen Production
Currently, hydrogen production is capital intensive, and the capital contribution to its cost is larger for smaller hydrogen production facilities that are designed for distributed applications. The higher per unit capital cost of the distributed systems is the result of site-specific fabrication of fuel processing systems, which include reformers, water-gas shift catalyst beds, and pressure swing adsorption purification subsystems. Also, there is only low-volume manufacturing of electrolysis units of the size necessary for a distributed hydrogen network.
Page 3.5 - 8 Multi-Year Research, Development and Demonstration Plan
2007
Technical Plan — Manufacturing
Manufacturing R&D for hydrogen production is needed for:
� Joining reformer components in reformers
� Reformer reactor vessels
� Stamping and extruding reformer components
� Deposition of catalyst coatings onto nonconformable surfaces in reformers and electrolyzers
Manufacturing costs for reformers with water-gas shift reactors are typically high because the inherent high-temperature reforming process requires specialty metals that are machined, joined, and welded. Reformer pressure vessels are another source of high cost for hydrogen production. Forming and joining of component sections is currently labor-intensive and costly. Establishing automated manufacturing processes for forming, heat treating, and assembling the catalyst supports and welding and joining the reformer components can help reduce capital costs.
A standardized, automated method for applying catalyst coatings to nonconformable surfaces (e.g., applying catalysts directly to heat exchange surfaces or microchannel reactors) will facilitate high-volume manufacturing. This approach will also benefit the deposition of catalysts onto electrode substrates for electrolysis. Also, on-line quality assurance methods need to be developed for these applications.
Cross Cutting Activities
Modeling and Simulation
Modeling and simulation can significantly advance the development and optimization of manufacturing processes. Mathematical models and modeling process integration are needed to evaluate the effects of various manufacturing techniques. Information on manufacturing process capabilities can be fed into component performance models to assess the impact of manufacturing variations. This will help to establish manufacturing process requirements (e.g., tolerances and quality assurance requirements), reduce manufacturing costs by relaxing noncritical tolerances, cut development times by generating more robust designs, and facilitate optimal solutions.
Knowledge Bases
Information and knowledge about new materials and sealants, including their processibility, formability, machinability, and compatibility with other materials and gases are needed to support modeling efforts. Also, toxicity and life-cycle environmental impact data needs to be collected and understood. Information is also needed on new process technologies and the fundamental correlations between manufacturing parameters and performance parameters. In many technology areas, the effect of variations caused by manufacturing is not understood sufficiently to establish appropriate tolerances and design practices.
Sensing and Process Control
Control technologies for manufacturing processes are needed to increase the reliability and quality of manufactured products while reducing cost. Low-cost systems are needed for monitoring and controlling manufacturing processes to produce the quantities of products that meet market requirements.
Multi-Year Research, Development and Demonstration Plan Page 3.5 - 9
2007
Technical Plan — Manufacturing
Metrology and Standards
Rapid and accurate measurement systems and devices are needed to apply quality assurance techniques such as statistical process control. Metrology will provide quantitative information about a manufacturing process and its output. The ability to reliably measure various process parameters such as leaks, microstructure defects, surface roughness, coating quality, dimensional accuracy, and other critical manufacturing process outputs will enable cost-effective manufacturing. In-process measurements will allow manufacturers to establish statistical process capabilities and make adjustments to control process and component quality during operation. Current inspection techniques often require off-line measurements, manual inspection techniques, and even destructive tests. These approaches slow the manufacturing process and add cost. Non-destructive testing techniques that eliminate manual and time-consuming test and measurement processes are needed.
Related issues include the need for standard measurement methods and protocols of the manufacturing process and component performance parameters. Such standards will ensure uniformity in the supply chain, lower costs, reduced scrap, and high quality products.
3.5.5 Barriers
This section summarizes the technical and economic barriers that must be overcome to meet the Manufacturing R&D objectives.
Fuel Cells
A. Lack of High-Volume Membrane Electrode Assembly (MEA) Processes New manufacturing methods are needed to fabricate advanced catalyst layers that meet the low precious metal targets. Most membrane electrode assembly (MEA) fabrication processes include a hot-pressing stage that slows the throughput processing rate. More flexible, agile, integrated approaches are needed for MEA manufacturing as the design of MEAs evolve. Processes that permit the continuous manufacturing of five-layer and/or seven-layer MEAs, while maintaining the critical performance properties of the gas diffusion layer are needed. B. Lack of High-Speed Bipolar Plate Manufacturing ProcessesNew high-speed forming, stamping, and molding processes are needed that will maintain the high tolerance requirement of PEM fuel cells for flow field dimensions, plate flatness, and plate parallelism. Processes for graphite resin, natural flake graphite, and metal plates need to be developed. Rapid prototyping and flexible tooling specifically for the manufacture of bipolar plates is needed. C. Lack of High-Speed Sealing TechniquesHigh-speed processes need to be developed to integrate MEA components incorporating edge and interfacial seals and gaskets. Merging the MEA sealing assembly process with the bipolar plate sealing in a continuous process could reduce the cost of stack assembly. D. Manual Stack AssemblyAutomated processes to rapidly assemble fuel cell stacks must precisely align MEAs, bipolar plates, and cooler plates to avoid mechanical stresses that can fracture and tear the membrane. Integration
Page 3.5 - 10 Multi-Year Research, Development and Demonstration Plan
2007
Technical Plan — Manufacturing
of computer aided design tools with technology and manufacturing development is needed to advance stack performance and reduce component costs. E. Lack of Manufacturing Processes for Balance of Plant Components for PEM Fuel Cell
Systems High-volume manufacturing for balance of plant components and rapid assembly into the fuel cell power plant system need to be developed to reduce costs. F. Low Levels of Quality Control and Inflexible Processes Systems to monitor manufacturing processes and control them to achieve required levels of productivity and quality are needed. In-line manufacturing process models and controls that are correlated with the performance and durability of the fuel cell components need to be developed. Modeling techniques for manufacturing processes need to be developed to expedite development of manufacturing systems for both components and complete fuel cell power plants. Leak detectors, other sensors for in-line quality control, and manufacturing process control are needed for assembly of fuel cell power plants.
Storage
G. High-Cost Carbon Fiber Currently, composite tanks require high-strength fiber made from carbon-fiber grade polyacrylonitrile precursor. This high grade carbon fiber is currently approximately $15 to $20/kg. Manufacturing R&D is needed to develop lower cost, high quality polyacrylonitrile or alternate precursors and reduced energy or faster carbonization process for carbon fiber, such as microwave or plasma processing. In addition to improved carbonization processes, other steps in the process, such as oxidation and graphitization need to be improved. Developing and implementing advanced fiber processing methods has the potential to reduce cost by 50% as well as provide the technology basis to expand U. S. competitiveness in high-strength fiber manufacturing. H. Lack of Carbon Fiber Fabrication Techniques for Conformable Tanks New manufacturing methods are needed that can reduce the cycle time, that is, the per unit fabrication time. Potential advances in manufacturing technologies include faster filament winding (e.g., multiple heads), new filament winding strategies and equipment, and continuous versus batch processing (e.g., pultrusion process). New manufacturing processes for applying the resin matrix, including tow-pregs for room temperature curing, wet winding processes, and fiber imbedded thermoplastics for hot wet winding should also be investigated. New manufacturing methods for carbon fiber winding and fiber placement manufacturing are needed as well as methods to improve conformability of tanks by allowing modified cylindrical tank shapes to be manufactured. A cost model is needed to guide development of high-volume production processes for high-pressure composite tanks employing fiber placement technologies. Fiber placement technologies, which could reduce the amount of carbon fiber needed by as much as 20%-30%, could also lower unit costs.
Multi-Year Research, Development and Demonstration Plan Page 3.5 - 11
2007
Technical Plan — Manufacturing
Hydrogen Production
I. Lack of Automated Joining Processes Component integration requires labor-intensive welding. Manufacturers need reliable, low-variability joining processes that can rapidly join dissimilar material combinations, and enable leak-free hydrogen systems. Catalysts are commonly applied to reformer and electrolyzer components before the components are joined. High-temperature joining processes can damage or deactivate the catalysts. Low-temperature joining processes (e.g., laser or friction welding) that do not damage the catalyst coatings on the joined parts must be evaluated for these applications. J. Lack of Low-Cost Coating and Cladding Processes The alkaline electrolysis cell stack uses high quantities of titanium and nickel, which adds to the cost. The development of manufacturing methods to clad or plate low cost substrates with these metals could reduce system cost. K. Lack of Low-Cost Stamping and Extrusion Stamping and extrusion methods are needed to enable high-volume manufacturing of critical components (e.g., heat exchangers), which are currently machined and welded. L. Lack of Continuous Manufacturing and Modularization Processes Currently all hydrogen production systems are custom-made; there are no modular systems. Common, interchangeable components are needed to permit assembly line production of hydrogen generators. Accelerated test methods and non-destructive evaluation techniques that can be used to rapidly screen materials and components during fabrication need to be developed. M. Lack of Automated Coating Processes Protective and catalytic coatings are an integral part of the reformer, electrolyzer, gas clean-up, and purification systems. In many cases, the surfaces are not flat and have fine details that must be adequately coated for the component to function properly. Automated methods for applying these coatings need to be developed.
Page 3.5 - 12 Multi-Year Research, Development and Demonstration Plan
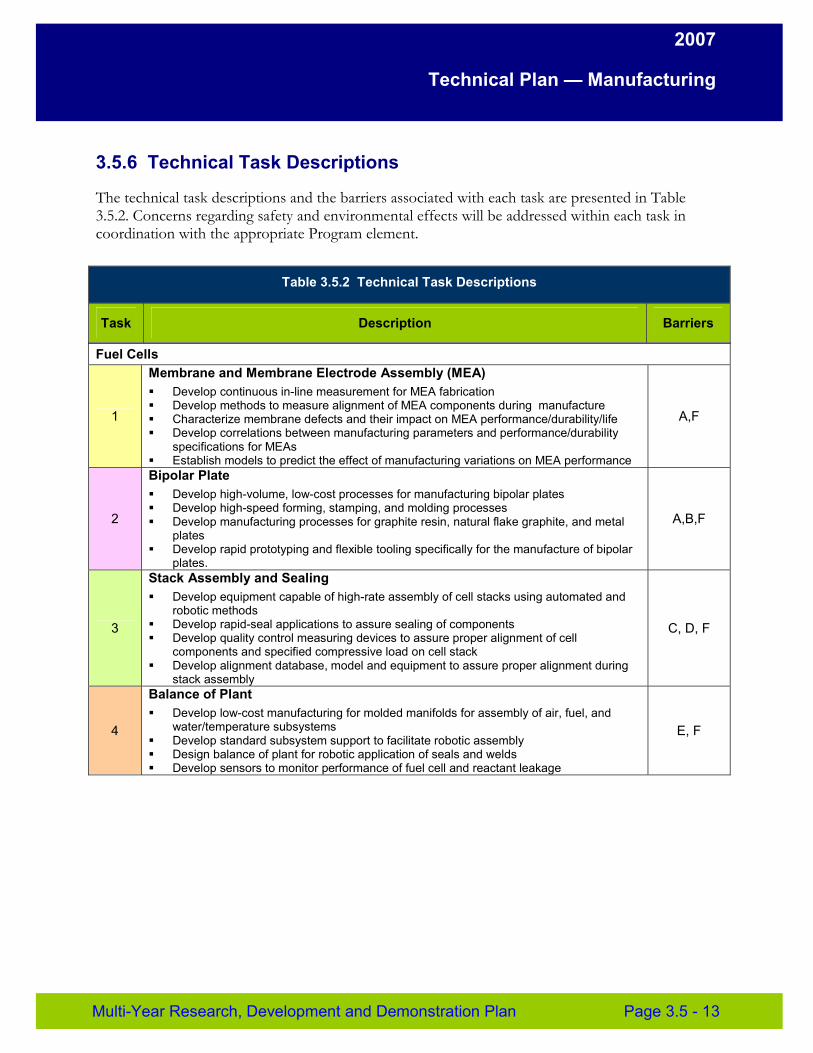
2007
Technical Plan — Manufacturing
3.5.6 Technical Task Descriptions
The technical task descriptions and the barriers associated with each task are presented in Table 3.5.2. Concerns regarding safety and environmental effects will be addressed within each task in coordination with the appropriate Program element.
Table 3.5.2 Technical Task Descriptions
Task Description Barriers
Fuel Cells
1
Membrane and Membrane Electrode Assembly (MEA) � Develop continuous in-line measurement for MEA fabrication � Develop methods to measure alignment of MEA components during manufacture � Characterize membrane defects and their impact on MEA performance/durability/life � Develop correlations between manufacturing parameters and performance/durability
specifications for MEAs � Establish models to predict the effect of manufacturing variations on MEA performance
A,F
2
Bipolar Plate � Develop high-volume, low-cost processes for manufacturing bipolar plates � Develop high-speed forming, stamping, and molding processes � Develop manufacturing processes for graphite resin, natural flake graphite, and metal
plates � Develop rapid prototyping and flexible tooling specifically for the manufacture of bipolar
plates.
A,B,F
3
Stack Assembly and Sealing � Develop equipment capable of high-rate assembly of cell stacks using automated and
robotic methods � Develop rapid-seal applications to assure sealing of components � Develop quality control measuring devices to assure proper alignment of cell
components and specified compressive load on cell stack � Develop alignment database, model and equipment to assure proper alignment during
stack assembly
C, D, F
4
Balance of Plant � Develop low-cost manufacturing for molded manifolds for assembly of air, fuel, and
water/temperature subsystems � Develop standard subsystem support to facilitate robotic assembly � Design balance of plant for robotic application of seals and welds � Develop sensors to monitor performance of fuel cell and reactant leakage
E, F
Multi-Year Research, Development and Demonstration Plan Page 3.5 - 13
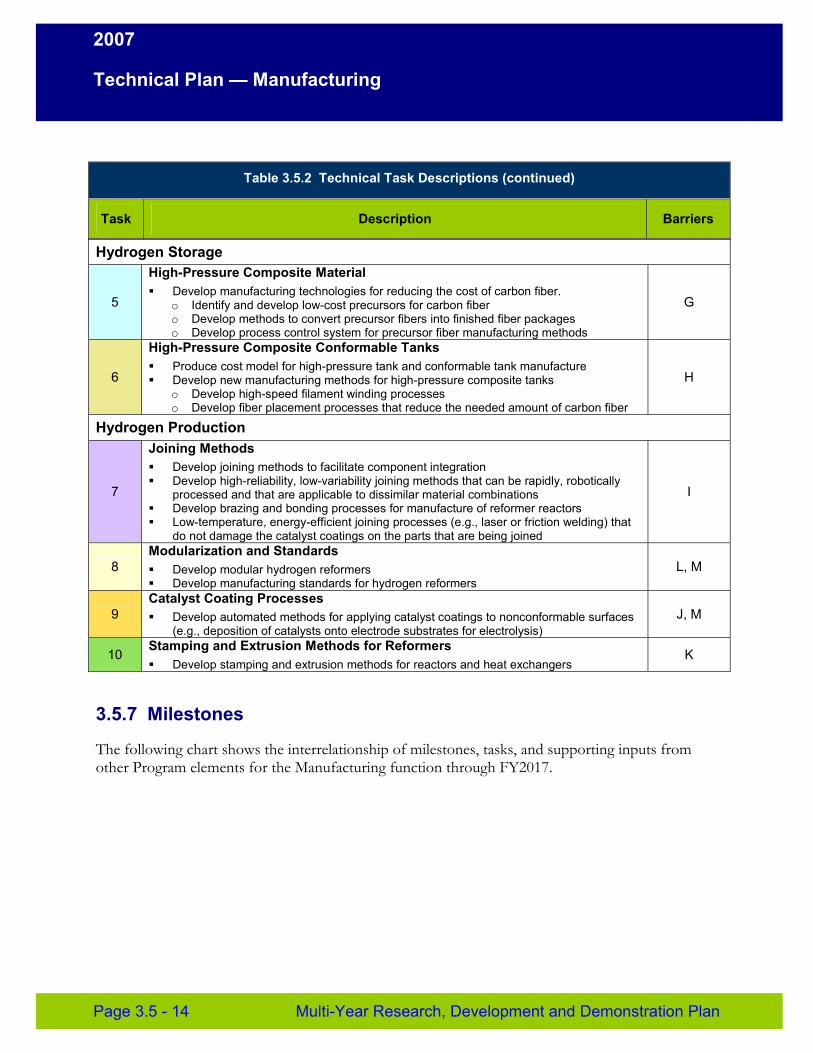
2007
Technical Plan — Manufacturing
Table 3.5.2 Technical Task Descriptions (continued)
Task Description Barriers
Hydrogen Storage
5
High-Pressure Composite Material � Develop manufacturing technologies for reducing the cost of carbon fiber.
o Identify and develop low-cost precursors for carbon fiber o Develop methods to convert precursor fibers into finished fiber packages o Develop process control system for precursor fiber manufacturing methods
G
6
High-Pressure Composite Conformable Tanks � Produce cost model for high-pressure tank and conformable tank manufacture � Develop new manufacturing methods for high-pressure composite tanks
o Develop high-speed filament winding processes o Develop fiber placement processes that reduce the needed amount of carbon fiber
H
Hydrogen Production
7
Joining Methods � Develop joining methods to facilitate component integration � Develop high-reliability, low-variability joining methods that can be rapidly, robotically
processed and that are applicable to dissimilar material combinations � Develop brazing and bonding processes for manufacture of reformer reactors � Low-temperature, energy-efficient joining processes (e.g., laser or friction welding) that
do not damage the catalyst coatings on the parts that are being joined
I
8 Modularization and Standards � Develop modular hydrogen reformers � Develop manufacturing standards for hydrogen reformers
L, M
9 Catalyst Coating Processes � Develop automated methods for applying catalyst coatings to nonconformable surfaces
(e.g., deposition of catalysts onto electrode substrates for electrolysis) J, M
10 Stamping and Extrusion Methods for Reformers � Develop stamping and extrusion methods for reactors and heat exchangers
K
3.5.7 Milestones
The following chart shows the interrelationship of milestones, tasks, and supporting inputs from other Program elements for the Manufacturing function through FY2017.
Page 3.5 - 14 Multi-Year Research, Development and Demonstration Plan
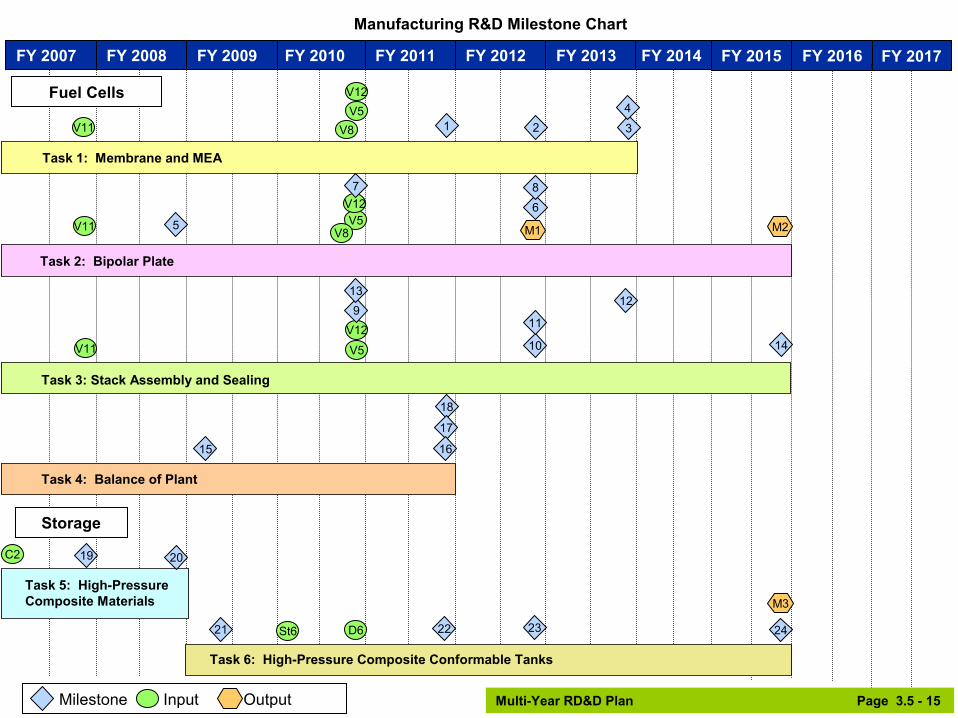
Manufacturing R&D Milestone Chart
FY 2015 FY 2017 FY 2014 FY 2013 FY 2012 FY 2011 FY 2010 FY 2009 FY 2008 FY 2007 FY 2016
Milestone Input Output Multi-Year RD&D Plan Page 3.5 - 15
Task 1: Membrane and MEA
Task 3: Stack Assembly and Sealing
Task 4: Balance of Plant
Task 5: High-Pressure Composite Materials
Task 6: High-Pressure Composite Conformable Tanks
1 2 3
4V5 V8V11
V12Fuel Cells
Task 2: Bipolar Plate
5 V5 V8V11
V12
M1 M2 6
7 8
10
11
12
V5V11 V12
14
9 13
Storage
18
17
15 16
19 20C2
21 22 23 24D6St6
M3
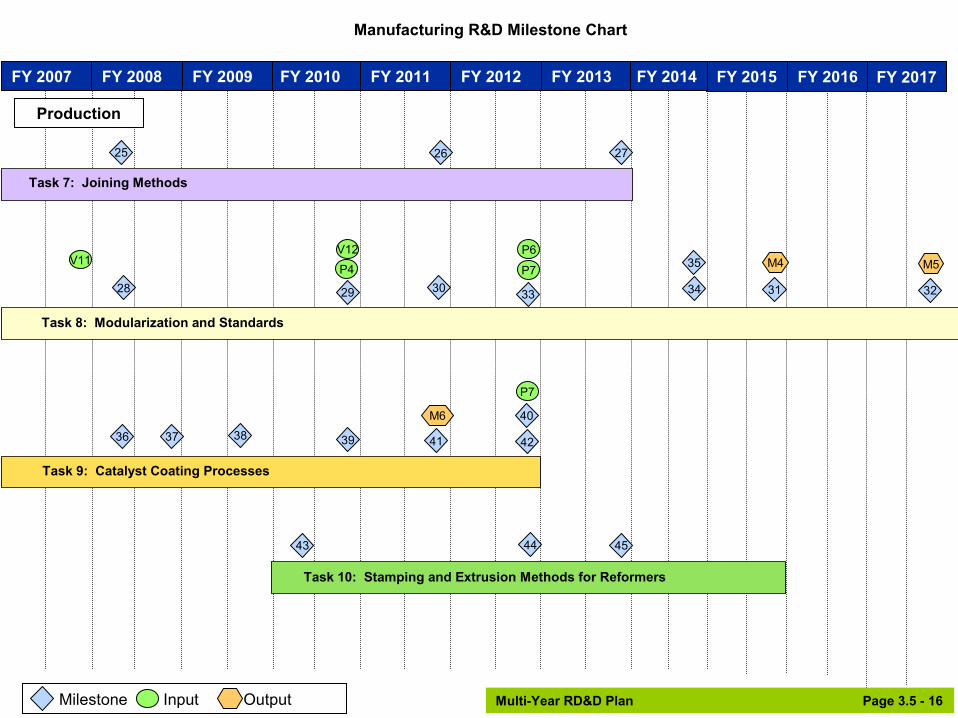
Manufacturing R&D Milestone Chart
FY 2015 FY 2017 FY 2014 FY 2013 FY 2012 FY 2011 FY 2010 FY 2009 FY 2008 FY 2007 FY 2016
Multi-Year RD&D Plan Page 3.5 - 16
Task 8: Modularization and Standards
Task 9: Catalyst Coating Processes
Task 10: Stamping and Extrusion Methods for Reformers
Milestone Input Output
Task 7: Joining Methods
Production
25 26 27
28 29 30 31 3233
P4 P6
P7 V11
V12
34
35 M4 M5
36 37 38 39 41 42
P7
M6 40
43 44 45
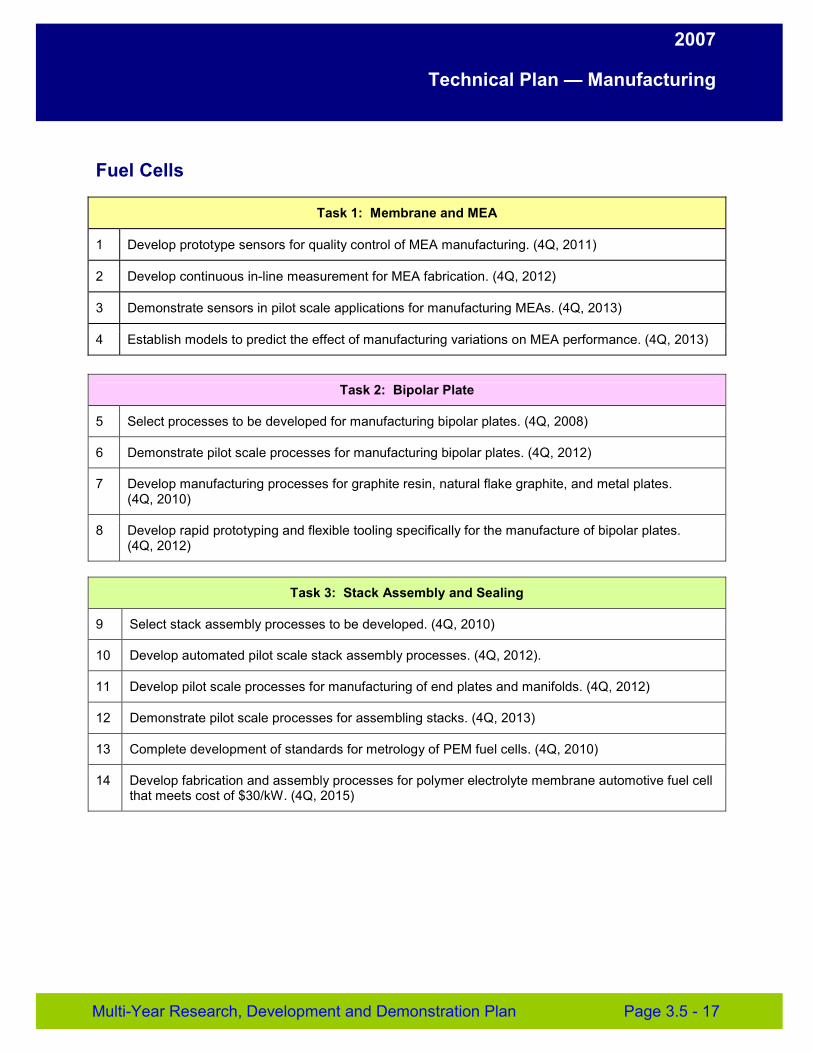
2007
Technical Plan — Manufacturing
Fuel Cells
Task 1: Membrane and MEA
1 Develop prototype sensors for quality control of MEA manufacturing. (4Q, 2011)
2 Develop continuous in-line measurement for MEA fabrication. (4Q, 2012)
3 Demonstrate sensors in pilot scale applications for manufacturing MEAs. (4Q, 2013)
4 Establish models to predict the effect of manufacturing variations on MEA performance. (4Q, 2013)
Task 2: Bipolar Plate
5 Select processes to be developed for manufacturing bipolar plates. (4Q, 2008)
6 Demonstrate pilot scale processes for manufacturing bipolar plates. (4Q, 2012)
7 Develop manufacturing processes for graphite resin, natural flake graphite, and metal plates. (4Q, 2010)
8 Develop rapid prototyping and flexible tooling specifically for the manufacture of bipolar plates. (4Q, 2012)
Task 3: Stack Assembly and Sealing
9 Select stack assembly processes to be developed. (4Q, 2010)
10 Develop automated pilot scale stack assembly processes. (4Q, 2012).
11 Develop pilot scale processes for manufacturing of end plates and manifolds. (4Q, 2012)
12 Demonstrate pilot scale processes for assembling stacks. (4Q, 2013)
13 Complete development of standards for metrology of PEM fuel cells. (4Q, 2010)
14 Develop fabrication and assembly processes for polymer electrolyte membrane automotive fuel cell that meets cost of $30/kW. (4Q, 2015)
Multi-Year Research, Development and Demonstration Plan Page 3.5 - 17
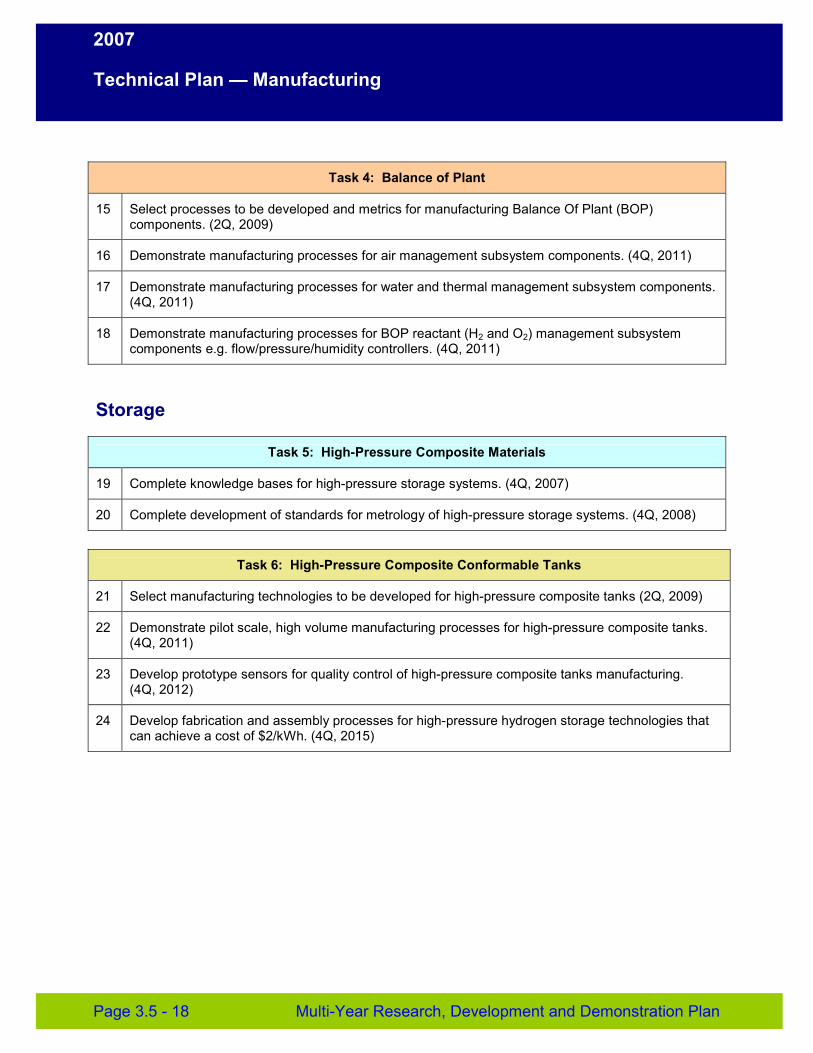
2007
Technical Plan — Manufacturing
Task 4: Balance of Plant
15 Select processes to be developed and metrics for manufacturing Balance Of Plant (BOP) components. (2Q, 2009)
16 Demonstrate manufacturing processes for air management subsystem components. (4Q, 2011)
17 Demonstrate manufacturing processes for water and thermal management subsystem components. (4Q, 2011)
18 Demonstrate manufacturing processes for BOP reactant (H2 and O2) management subsystem components e.g. flow/pressure/humidity controllers. (4Q, 2011)
Storage
Task 5: High-Pressure Composite Materials
19 Complete knowledge bases for high-pressure storage systems. (4Q, 2007)
20 Complete development of standards for metrology of high-pressure storage systems. (4Q, 2008)
Task 6: High-Pressure Composite Conformable Tanks
21 Select manufacturing technologies to be developed for high-pressure composite tanks (2Q, 2009)
22 Demonstrate pilot scale, high volume manufacturing processes for high-pressure composite tanks. (4Q, 2011)
23 Develop prototype sensors for quality control of high-pressure composite tanks manufacturing. (4Q, 2012)
24 Develop fabrication and assembly processes for high-pressure hydrogen storage technologies that can achieve a cost of $2/kWh. (4Q, 2015)
Page 3.5 - 18 Multi-Year Research, Development and Demonstration Plan
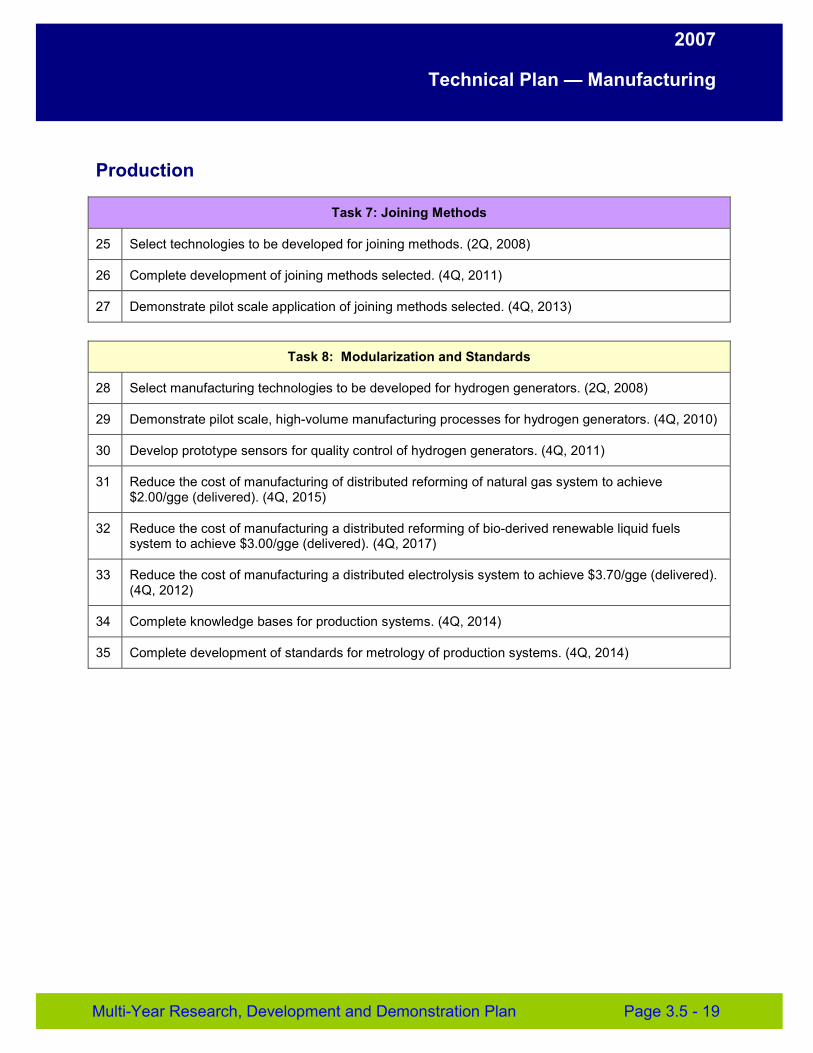
2007
Technical Plan — Manufacturing
Production
Task 7: Joining Methods
25 Select technologies to be developed for joining methods. (2Q, 2008)
26 Complete development of joining methods selected. (4Q, 2011)
27 Demonstrate pilot scale application of joining methods selected. (4Q, 2013)
Task 8: Modularization and Standards
28 Select manufacturing technologies to be developed for hydrogen generators. (2Q, 2008)
29 Demonstrate pilot scale, high-volume manufacturing processes for hydrogen generators. (4Q, 2010)
30 Develop prototype sensors for quality control of hydrogen generators. (4Q, 2011)
31 Reduce the cost of manufacturing of distributed reforming of natural gas system to achieve $2.00/gge (delivered). (4Q, 2015)
32 Reduce the cost of manufacturing a distributed reforming of bio-derived renewable liquid fuels system to achieve $3.00/gge (delivered). (4Q, 2017)
33 Reduce the cost of manufacturing a distributed electrolysis system to achieve $3.70/gge (delivered). (4Q, 2012)
34 Complete knowledge bases for production systems. (4Q, 2014)
35 Complete development of standards for metrology of production systems. (4Q, 2014)
Multi-Year Research, Development and Demonstration Plan Page 3.5 - 19
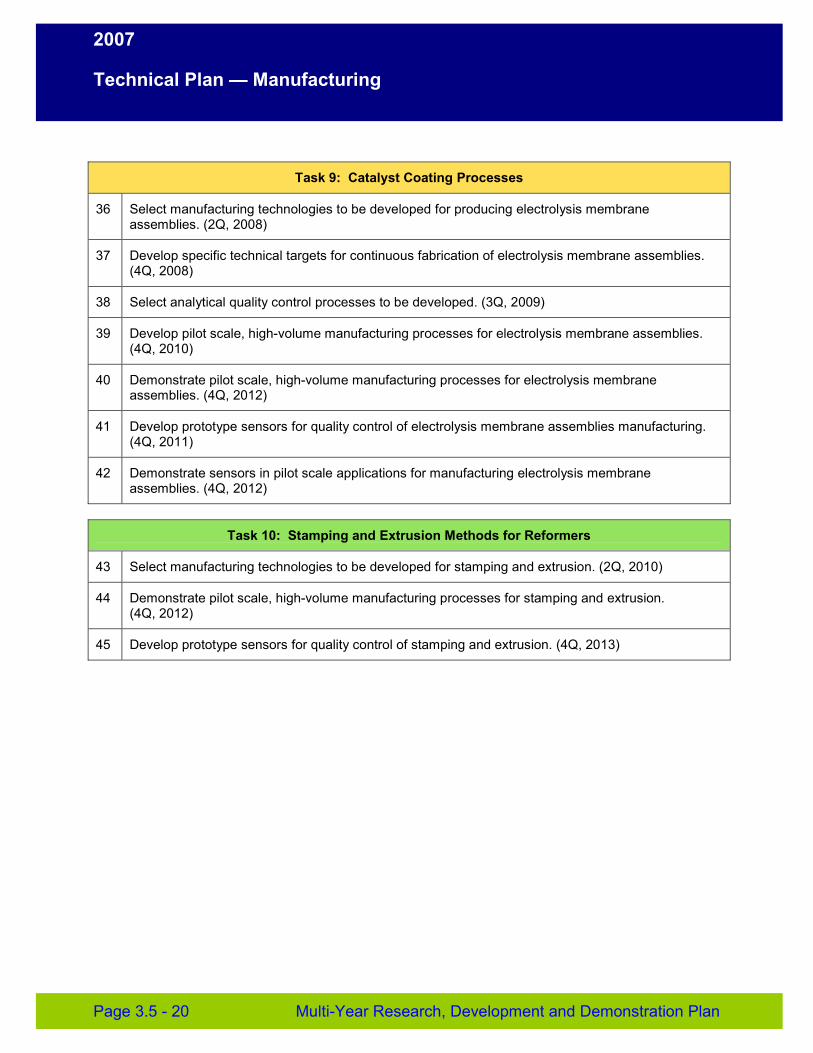
2007
Technical Plan — Manufacturing
Task 9: Catalyst Coating Processes
36 Select manufacturing technologies to be developed for producing electrolysis membrane assemblies. (2Q, 2008)
37 Develop specific technical targets for continuous fabrication of electrolysis membrane assemblies. (4Q, 2008)
38 Select analytical quality control processes to be developed. (3Q, 2009)
39 Develop pilot scale, high-volume manufacturing processes for electrolysis membrane assemblies. (4Q, 2010)
40 Demonstrate pilot scale, high-volume manufacturing processes for electrolysis membrane assemblies. (4Q, 2012)
41 Develop prototype sensors for quality control of electrolysis membrane assemblies manufacturing. (4Q, 2011)
42 Demonstrate sensors in pilot scale applications for manufacturing electrolysis membrane assemblies. (4Q, 2012)
Task 10: Stamping and Extrusion Methods for Reformers
43 Select manufacturing technologies to be developed for stamping and extrusion. (2Q, 2010)
44 Demonstrate pilot scale, high-volume manufacturing processes for stamping and extrusion. (4Q, 2012)
45 Develop prototype sensors for quality control of stamping and extrusion. (4Q, 2013)
Page 3.5 - 20 Multi-Year Research, Development and Demonstration Plan
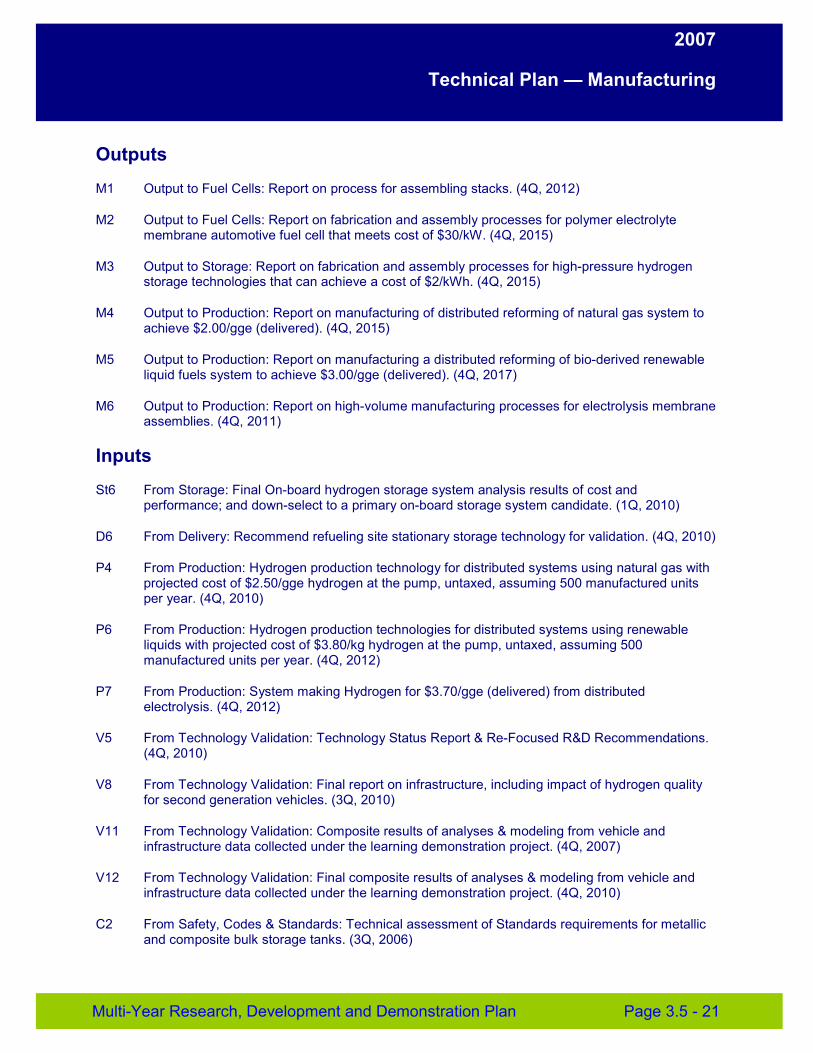
2007
Technical Plan — Manufacturing
Outputs
M1 Output to Fuel Cells: Report on process for assembling stacks. (4Q, 2012)
M2 Output to Fuel Cells: Report on fabrication and assembly processes for polymer electrolyte membrane automotive fuel cell that meets cost of $30/kW. (4Q, 2015)
M3 Output to Storage: Report on fabrication and assembly processes for high-pressure hydrogen storage technologies that can achieve a cost of $2/kWh. (4Q, 2015)
M4 Output to Production: Report on manufacturing of distributed reforming of natural gas system to achieve $2.00/gge (delivered). (4Q, 2015)
M5 Output to Production: Report on manufacturing a distributed reforming of bio-derived renewable liquid fuels system to achieve $3.00/gge (delivered). (4Q, 2017)
M6 Output to Production: Report on high-volume manufacturing processes for electrolysis membrane assemblies. (4Q, 2011)
Inputs
St6 From Storage: Final On-board hydrogen storage system analysis results of cost and performance; and down-select to a primary on-board storage system candidate. (1Q, 2010)
D6 From Delivery: Recommend refueling site stationary storage technology for validation. (4Q, 2010)
P4 From Production: Hydrogen production technology for distributed systems using natural gas with projected cost of $2.50/gge hydrogen at the pump, untaxed, assuming 500 manufactured units per year. (4Q, 2010)
P6 From Production: Hydrogen production technologies for distributed systems using renewable liquids with projected cost of $3.80/kg hydrogen at the pump, untaxed, assuming 500 manufactured units per year. (4Q, 2012)
P7 From Production: System making Hydrogen for $3.70/gge (delivered) from distributed electrolysis. (4Q, 2012)
V5 From Technology Validation: Technology Status Report & Re-Focused R&D Recommendations. (4Q, 2010)
V8 From Technology Validation: Final report on infrastructure, including impact of hydrogen quality for second generation vehicles. (3Q, 2010)
V11 From Technology Validation: Composite results of analyses & modeling from vehicle and infrastructure data collected under the learning demonstration project. (4Q, 2007)
V12 From Technology Validation: Final composite results of analyses & modeling from vehicle and infrastructure data collected under the learning demonstration project. (4Q, 2010)
C2 From Safety, Codes & Standards: Technical assessment of Standards requirements for metallic and composite bulk storage tanks. (3Q, 2006)
Multi-Year Research, Development and Demonstration Plan Page 3.5 - 21
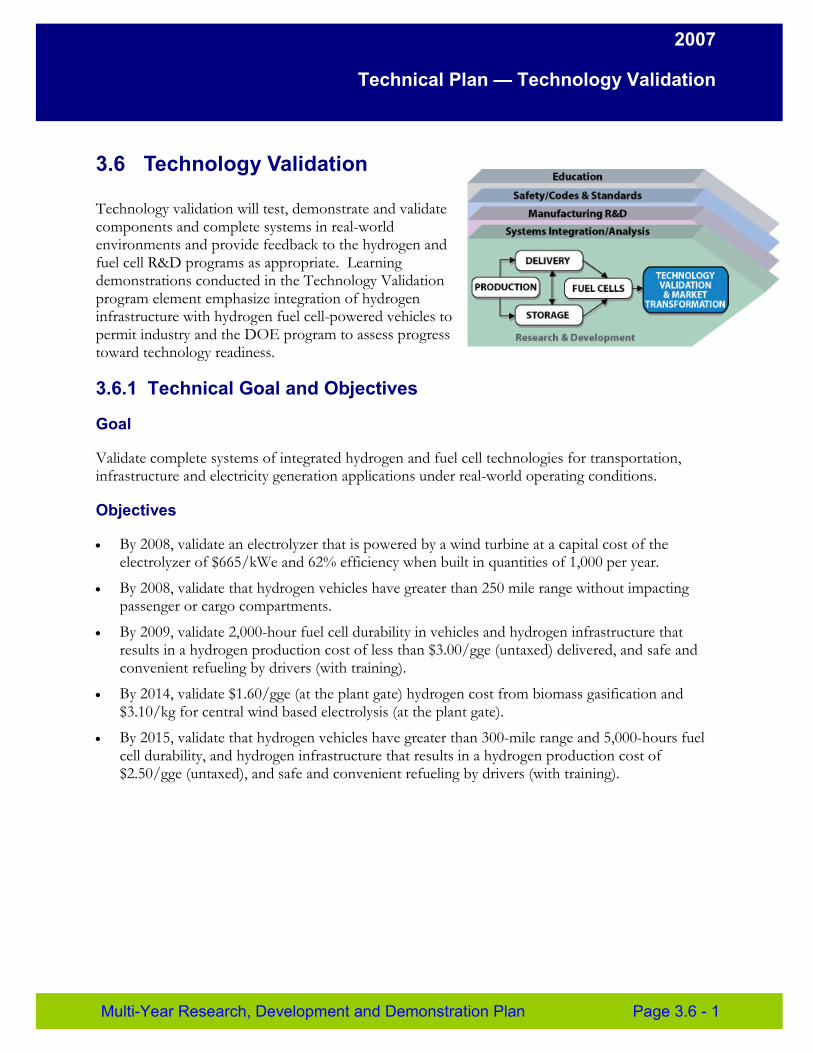
2007
Technical Plan — Technology Validation
3.6 Technology Validation
Technology validation will test, demonstrate and validate components and complete systems in real-world environments and provide feedback to the hydrogen and fuel cell R&D programs as appropriate. Learning demonstrations conducted in the Technology Validation program element emphasize integration of hydrogen infrastructure with hydrogen fuel cell-powered vehicles to permit industry and the DOE program to assess progress toward technology readiness.
3.6.1 Technical Goal and Objectives
Goal
Validate complete systems of integrated hydrogen and fuel cell technologies for transportation, infrastructure and electricity generation applications under real-world operating conditions.
Objectives
• By 2008, validate an electrolyzer that is powered by a wind turbine at a capital cost of the electrolyzer of $665/kWe and 62% efficiency when built in quantities of 1,000 per year.
• By 2008, validate that hydrogen vehicles have greater than 250 mile range without impacting passenger or cargo compartments.
• By 2009, validate 2,000-hour fuel cell durability in vehicles and hydrogen infrastructure that results in a hydrogen production cost of less than $3.00/gge (untaxed) delivered, and safe and convenient refueling by drivers (with training).
• By 2014, validate $1.60/gge (at the plant gate) hydrogen cost from biomass gasification and $3.10/kg for central wind based electrolysis (at the plant gate).
• By 2015, validate that hydrogen vehicles have greater than 300-mile range and 5,000-hours fuel cell durability, and hydrogen infrastructure that results in a hydrogen production cost of $2.50/gge (untaxed), and safe and convenient refueling by drivers (with training).
Multi-Year Research, Development and Demonstration Plan Page 3.6 - 1
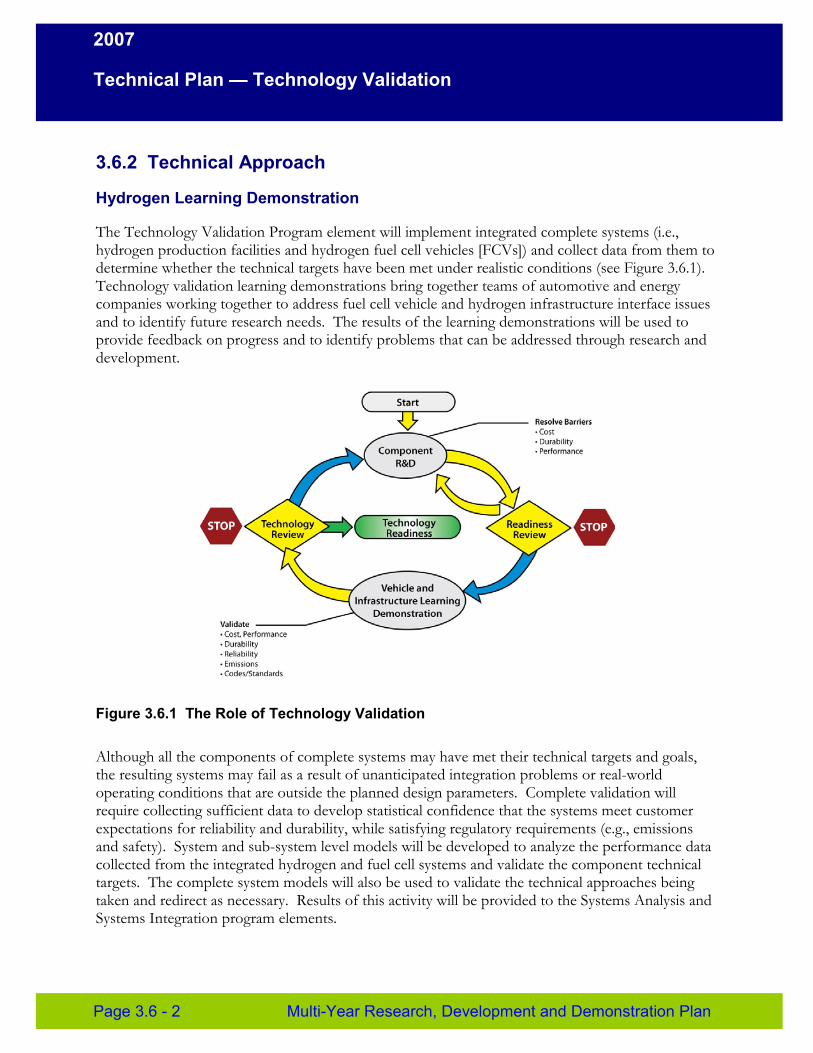
2007
Technical Plan — Technology Validation
3.6.2 Technical Approach
Hydrogen Learning Demonstration
The Technology Validation Program element will implement integrated complete systems (i.e., hydrogen production facilities and hydrogen fuel cell vehicles [FCVs]) and collect data from them to determine whether the technical targets have been met under realistic conditions (see Figure 3.6.1). Technology validation learning demonstrations bring together teams of automotive and energy companies working together to address fuel cell vehicle and hydrogen infrastructure interface issues and to identify future research needs. The results of the learning demonstrations will be used to provide feedback on progress and to identify problems that can be addressed through research and development.
Figure 3.6.1 The Role of Technology Validation
Although all the components of complete systems may have met their technical targets and goals, the resulting systems may fail as a result of unanticipated integration problems or real-world operating conditions that are outside the planned design parameters. Complete validation will require collecting sufficient data to develop statistical confidence that the systems meet customer expectations for reliability and durability, while satisfying regulatory requirements (e.g., emissions and safety). System and sub-system level models will be developed to analyze the performance data collected from the integrated hydrogen and fuel cell systems and validate the component technical targets. The complete system models will also be used to validate the technical approaches being taken and redirect as necessary. Results of this activity will be provided to the Systems Analysis and Systems Integration program elements.
Page 3.6 - 2 Multi-Year Research, Development and Demonstration Plan
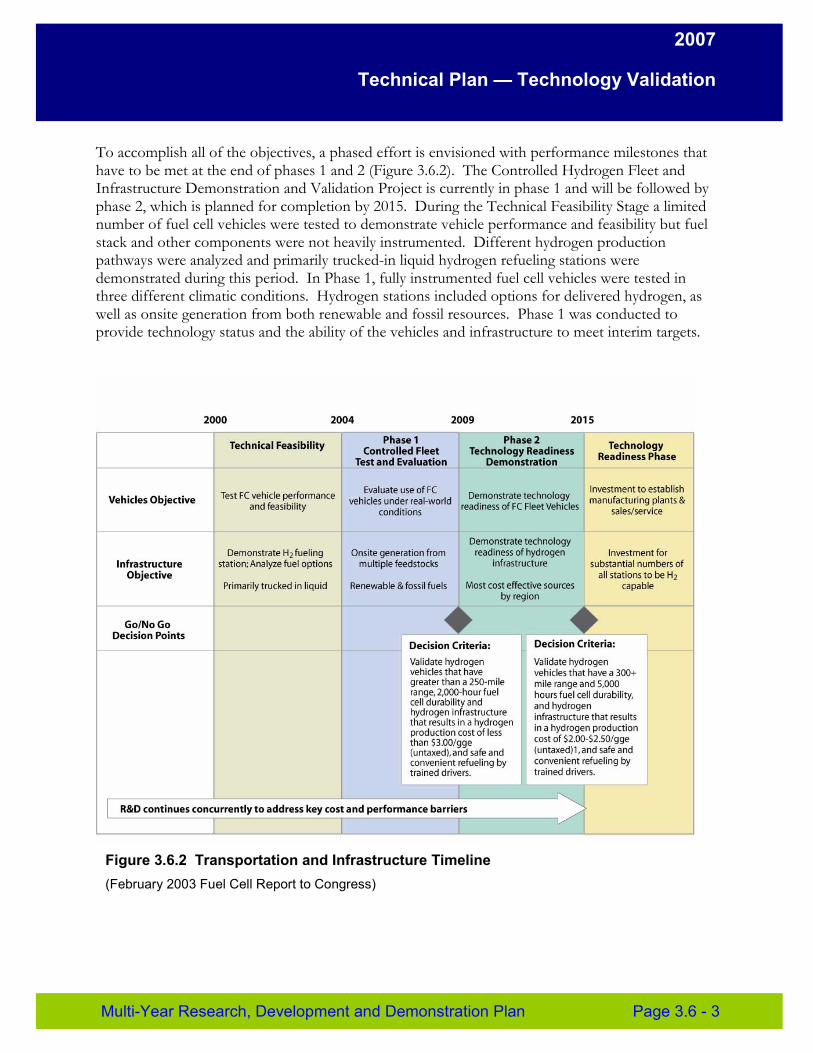
2007
Technical Plan — Technology Validation
To accomplish all of the objectives, a phased effort is envisioned with performance milestones that have to be met at the end of phases 1 and 2 (Figure 3.6.2). The Controlled Hydrogen Fleet and Infrastructure Demonstration and Validation Project is currently in phase 1 and will be followed by phase 2, which is planned for completion by 2015. During the Technical Feasibility Stage a limited number of fuel cell vehicles were tested to demonstrate vehicle performance and feasibility but fuel stack and other components were not heavily instrumented. Different hydrogen production pathways were analyzed and primarily trucked-in liquid hydrogen refueling stations were demonstrated during this period. In Phase 1, fully instrumented fuel cell vehicles were tested in three different climatic conditions. Hydrogen stations included options for delivered hydrogen, as well as onsite generation from both renewable and fossil resources. Phase 1 was conducted to provide technology status and the ability of the vehicles and infrastructure to meet interim targets.
Figure 3.6.2 Transportation and Infrastructure Timeline (February 2003 Fuel Cell Report to Congress)
Multi-Year Research, Development and Demonstration Plan Page 3.6 - 3
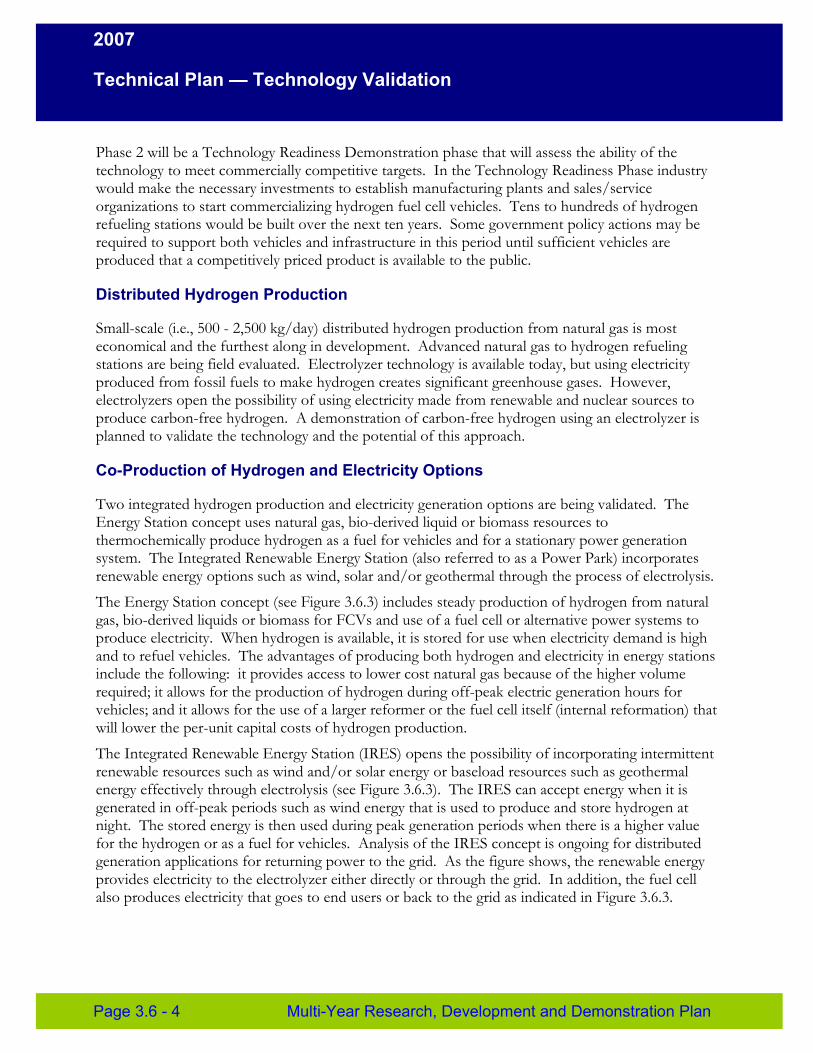
2007
Technical Plan — Technology Validation
Phase 2 will be a Technology Readiness Demonstration phase that will assess the ability of the technology to meet commercially competitive targets. In the Technology Readiness Phase industry would make the necessary investments to establish manufacturing plants and sales/service organizations to start commercializing hydrogen fuel cell vehicles. Tens to hundreds of hydrogen refueling stations would be built over the next ten years. Some government policy actions may be required to support both vehicles and infrastructure in this period until sufficient vehicles are produced that a competitively priced product is available to the public.
Distributed Hydrogen Production
Small-scale (i.e., 500 - 2,500 kg/day) distributed hydrogen production from natural gas is most economical and the furthest along in development. Advanced natural gas to hydrogen refueling stations are being field evaluated. Electrolyzer technology is available today, but using electricity produced from fossil fuels to make hydrogen creates significant greenhouse gases. However, electrolyzers open the possibility of using electricity made from renewable and nuclear sources to produce carbon-free hydrogen. A demonstration of carbon-free hydrogen using an electrolyzer is planned to validate the technology and the potential of this approach.
Co-Production of Hydrogen and Electricity Options
Two integrated hydrogen production and electricity generation options are being validated. The Energy Station concept uses natural gas, bio-derived liquid or biomass resources to thermochemically produce hydrogen as a fuel for vehicles and for a stationary power generation system. The Integrated Renewable Energy Station (also referred to as a Power Park) incorporates renewable energy options such as wind, solar and/or geothermal through the process of electrolysis.
The Energy Station concept (see Figure 3.6.3) includes steady production of hydrogen from natural gas, bio-derived liquids or biomass for FCVs and use of a fuel cell or alternative power systems to produce electricity. When hydrogen is available, it is stored for use when electricity demand is high and to refuel vehicles. The advantages of producing both hydrogen and electricity in energy stations include the following: it provides access to lower cost natural gas because of the higher volume required; it allows for the production of hydrogen during off-peak electric generation hours for vehicles; and it allows for the use of a larger reformer or the fuel cell itself (internal reformation) that will lower the per-unit capital costs of hydrogen production.
The Integrated Renewable Energy Station (IRES) opens the possibility of incorporating intermittent renewable resources such as wind and/or solar energy or baseload resources such as geothermal energy effectively through electrolysis (see Figure 3.6.3). The IRES can accept energy when it is generated in off-peak periods such as wind energy that is used to produce and store hydrogen at night. The stored energy is then used during peak generation periods when there is a higher value for the hydrogen or as a fuel for vehicles. Analysis of the IRES concept is ongoing for distributed generation applications for returning power to the grid. As the figure shows, the renewable energy provides electricity to the electrolyzer either directly or through the grid. In addition, the fuel cell also produces electricity that goes to end users or back to the grid as indicated in Figure 3.6.3.
Page 3.6 - 4 Multi-Year Research, Development and Demonstration Plan
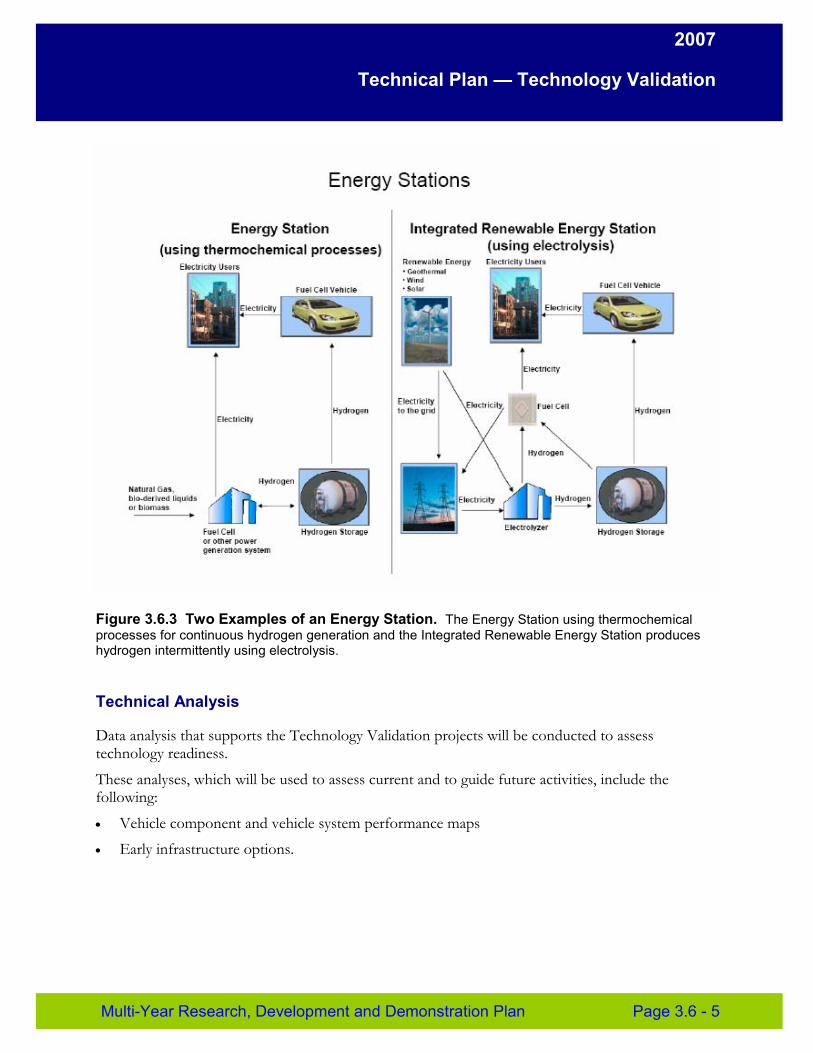
2007
Technical Plan — Technology Validation
Figure 3.6.3 Two Examples of an Energy Station. The Energy Station using thermochemical processes for continuous hydrogen generation and the Integrated Renewable Energy Station produces hydrogen intermittently using electrolysis.
Technical Analysis
Data analysis that supports the Technology Validation projects will be conducted to assess technology readiness.
These analyses, which will be used to assess current and to guide future activities, include the following:
• Vehicle component and vehicle system performance maps
• Early infrastructure options.
Multi-Year Research, Development and Demonstration Plan Page 3.6 - 5
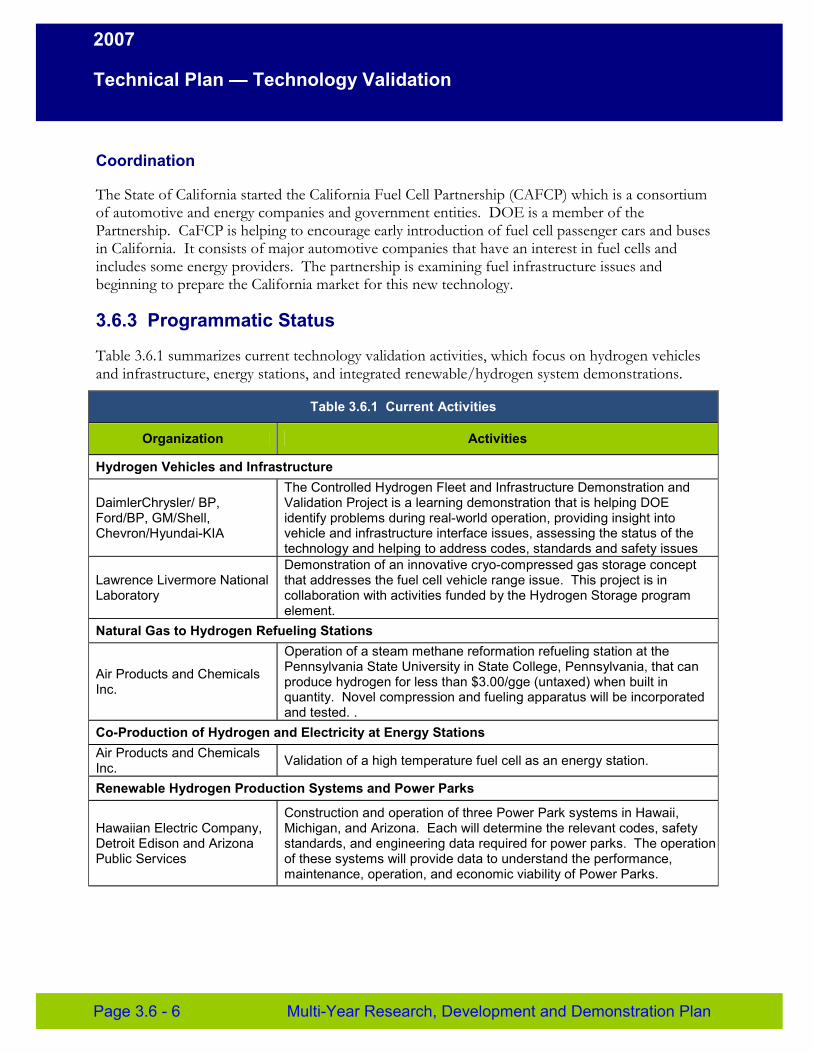
2007
Technical Plan — Technology Validation
Coordination
The State of California started the California Fuel Cell Partnership (CAFCP) which is a consortium of automotive and energy companies and government entities. DOE is a member of the Partnership. CaFCP is helping to encourage early introduction of fuel cell passenger cars and buses in California. It consists of major automotive companies that have an interest in fuel cells and includes some energy providers. The partnership is examining fuel infrastructure issues and beginning to prepare the California market for this new technology.
3.6.3 Programmatic Status
Table 3.6.1 summarizes current technology validation activities, which focus on hydrogen vehicles and infrastructure, energy stations, and integrated renewable/hydrogen system demonstrations.
Table 3.6.1 Current Activities
Organization Activities
Hydrogen Vehicles and Infrastructure
DaimlerChrysler/ BP, Ford/BP, GM/Shell, Chevron/Hyundai-KIA
The Controlled Hydrogen Fleet and Infrastructure Demonstration and Validation Project is a learning demonstration that is helping DOE identify problems during real-world operation, providing insight into vehicle and infrastructure interface issues, assessing the status of the technology and helping to address codes, standards and safety issues
Lawrence Livermore National Laboratory
Demonstration of an innovative cryo-compressed gas storage concept that addresses the fuel cell vehicle range issue. This project is in collaboration with activities funded by the Hydrogen Storage program element.
Natural Gas to Hydrogen Refueling Stations
Air Products and Chemicals Inc.
Operation of a steam methane reformation refueling station at the Pennsylvania State University in State College, Pennsylvania, that can produce hydrogen for less than $3.00/gge (untaxed) when built in quantity. Novel compression and fueling apparatus will be incorporated and tested. .
Co-Production of Hydrogen and Electricity at Energy Stations Air Products and Chemicals Inc. Validation of a high temperature fuel cell as an energy station.
Renewable Hydrogen Production Systems and Power Parks
Hawaiian Electric Company, Detroit Edison and Arizona Public Services
Construction and operation of three Power Park systems in Hawaii, Michigan, and Arizona. Each will determine the relevant codes, safety standards, and engineering data required for power parks. The operation of these systems will provide data to understand the performance, maintenance, operation, and economic viability of Power Parks.
Page 3.6 - 6 Multi-Year Research, Development and Demonstration Plan
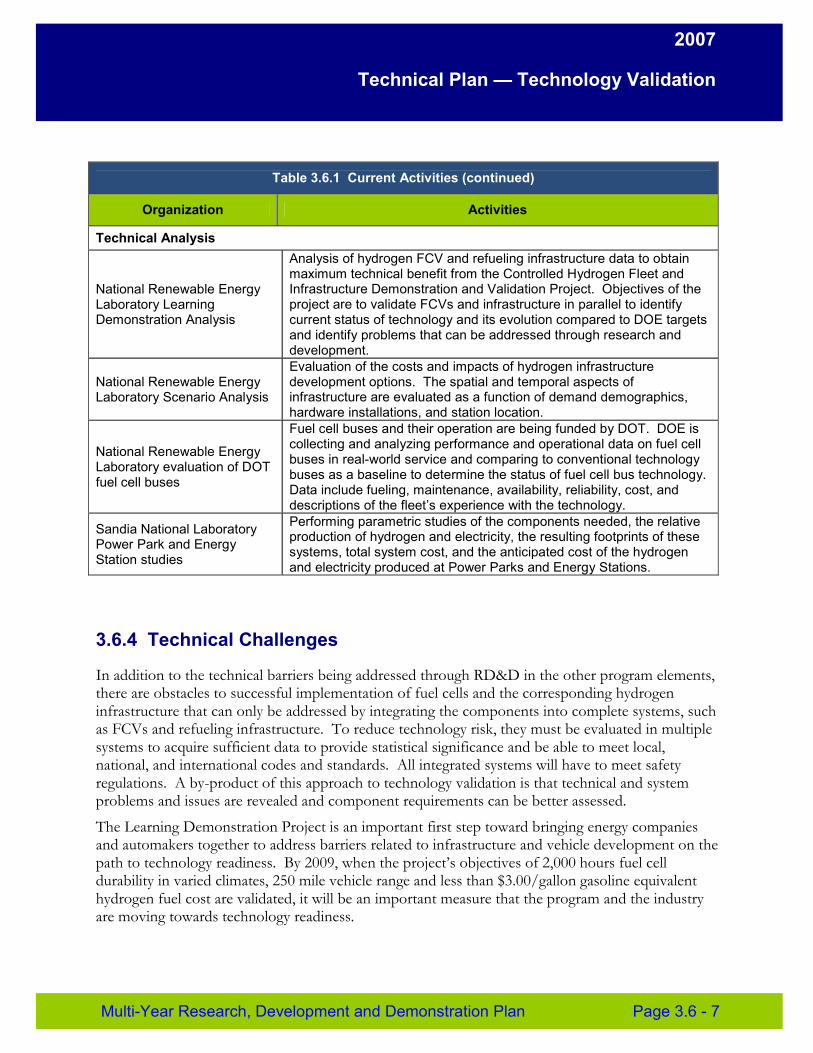
2007
Technical Plan — Technology Validation
Table 3.6.1 Current Activities (continued)
Organization Activities
Technical Analysis
National Renewable Energy Laboratory Learning Demonstration Analysis
Analysis of hydrogen FCV and refueling infrastructure data to obtain maximum technical benefit from the Controlled Hydrogen Fleet and Infrastructure Demonstration and Validation Project. Objectives of the project are to validate FCVs and infrastructure in parallel to identify current status of technology and its evolution compared to DOE targets and identify problems that can be addressed through research and development.
National Renewable Energy Laboratory Scenario Analysis
Evaluation of the costs and impacts of hydrogen infrastructure development options. The spatial and temporal aspects of infrastructure are evaluated as a function of demand demographics, hardware installations, and station location.
National Renewable Energy Laboratory evaluation of DOT fuel cell buses
Fuel cell buses and their operation are being funded by DOT. DOE is collecting and analyzing performance and operational data on fuel cell buses in real-world service and comparing to conventional technology buses as a baseline to determine the status of fuel cell bus technology. Data include fueling, maintenance, availability, reliability, cost, and descriptions of the fleet’s experience with the technology.
Sandia National Laboratory Power Park and Energy Station studies
Performing parametric studies of the components needed, the relative production of hydrogen and electricity, the resulting footprints of these systems, total system cost, and the anticipated cost of the hydrogen and electricity produced at Power Parks and Energy Stations.
3.6.4 Technical Challenges
In addition to the technical barriers being addressed through RD&D in the other program elements, there are obstacles to successful implementation of fuel cells and the corresponding hydrogen infrastructure that can only be addressed by integrating the components into complete systems, such as FCVs and refueling infrastructure. To reduce technology risk, they must be evaluated in multiple systems to acquire sufficient data to provide statistical significance and be able to meet local, national, and international codes and standards. All integrated systems will have to meet safety regulations. A by-product of this approach to technology validation is that technical and system problems and issues are revealed and component requirements can be better assessed.
The Learning Demonstration Project is an important first step toward bringing energy companies and automakers together to address barriers related to infrastructure and vehicle development on the path to technology readiness. By 2009, when the project’s objectives of 2,000 hours fuel cell durability in varied climates, 250 mile vehicle range and less than $3.00/gallon gasoline equivalent hydrogen fuel cost are validated, it will be an important measure that the program and the industry are moving towards technology readiness.
Multi-Year Research, Development and Demonstration Plan Page 3.6 - 7
2007
Technical Plan — Technology Validation
Technical Targets
The Technology Validation Program element does not develop new component technologies or sub-system configurations and, therefore, does not have technology targets. Instead, this program element will validate individual component technical targets developed within the other program elements when integrated into a complete system and review the future requirements for each component in such integrated systems. Specifically, once technical targets for each individual component have been verified under laboratory conditions, they will be validated under real-world conditions as part of learning demonstration and validation efforts.
Barriers
The following barriers will be addressed by the Technology Validation Program element to move toward technology readiness of fuel cell and hydrogen infrastructure technologies.
A. Lack of Fuel Cell Vehicle Performance and Durability Data In the public domain, statistical data for vehicles that are operated under both controlled and real-world conditions is very limited (i.e., data such as FCV system fuel efficiency and economy, thermal/water management integration, fuel cell stack durability, and system durability). Most or all the information is proprietary. Vehicle drivability, operation, and survivability in extreme climates (particularly low temperature start-up and operation in hot/arid climates), are also barriers to technology readiness. The interdependency of fuel cell subsystems is an important element that must be considered when developing individual subsystems. Development and testing of complete integrated fuel cell power systems is required to benchmark and validate targets for component development.
B. Hydrogen Storage Innovative packaging concepts, durability, fast-fill, discharge performance, and structural integrity data of hydrogen storage systems that are garnered from user sites need to be provided to the community. Current technology does not provide greater than 300-mile range without interfering with luggage or passenger compartment spaces; nor does it provide reasonable cost, efficiency and volume options for stationary applications. An understanding of composite tank operating cycle life and failure mechanisms and the introduction of potential impurities is lacking. Cycle life, storage density, fill-up times, regeneration cycle costs, energy efficiency, and availability of chemical and metal hydride storage systems need to be evaluated in real-world circumstances.
C. Lack of Hydrogen Refueling Infrastructure Performance and Availability Data The high cost of hydrogen production, low availability of the hydrogen production systems, and the challenge of providing safe systems including low-cost, durable sensors are early market penetration barriers. Shorter refueling times need to be validated for all the on-board storage concepts including those using up to 700 bar pressure. Integrated facilities with footprints small enough to be deployed into established refueling infrastructures need to be designed and implemented. Interface technology to fast-fill high pressure tanks requires reliable demonstrations. Small factory-manufactured, skid-mounted refueling systems need to be proven reliable options in low-volume production systems for sparsely populated areas with low anticipated vehicle traffic. Other concepts for energy stations and mid-sized plants (i.e., 5,000 - 50,000 kg/day), including pipelines or mobile refuelers, need to be verified with respect to system performance, efficiency, and availability.
Page 3.6 - 8 Multi-Year Research, Development and Demonstration Plan
2007
Technical Plan — Technology Validation
D. Maintenance and Training Facilities Lack of facilities for maintaining hydrogen vehicles, personnel not trained in handling and maintenance of hydrogen and fuel cell system components, limited certified procedures for fuel cells and safety, and lack of training manuals are all barriers that must be overcome. Lack of real-world data in the public domain on refueling requirements and operations and maintenance (O&M) requirements, including time and material costs, of FCVs are additional barriers.
E. Codes and Standards Lack of adopted or validated codes and standards that will permit the deployment of refueling stations in a cost-effective and timely manner must be addressed. A database also needs to be assembled from the Technology Validation projects that are relevant to the development of codes and standards to ensure that future energy systems based on these technologies can be efficiently installed and operated. Data on the impact of constituent hydrogen impurities on fuel cell and storage systems needs to be validated under real-world operating conditions.
F. Centralized Hydrogen Production from Fossil Resources There are few data on the cost, efficiencies, and availabilities of integrated coal-to-hydrogen/power plants with carbon sequestration options. In collaboration with Fossil Energy, hydrogen delivery systems from such centralized production systems need to be validated and operated. Hydrogen separations at high temperature and high pressure and their integrated impact on the hydrogen delivery system need to be demonstrated and validated.
G. Hydrogen from Nuclear Power Validated data on reaction rates, non-equilibrium reactions and material properties for the high-temperature production of hydrogen through thermochemical and electrochemical processes for pilot plants are limited. The cost and O&M of such an integrated system needs to be assessed before high-temperature nuclear reactors are designed and developed for hydrogen production. Hydrogen delivery options need to be determined and assessed as part of the system demonstration. Validation of integrated systems is required to optimize component development. This barrier will be addressed in collaboration with the Nuclear Energy Office.
H. Hydrogen from Renewable Resources There is little operational, cost, durability, and efficiency information for large integrated renewable electrolyzer systems that produce hydrogen. The integration of biomass, solar thermal chemical and other renewable electrolyzer systems needs to be evaluated. These activities will be conducted in collaboration with other EERE programs.
I. Hydrogen and Electricity Co-Production Cost and durability of hydrogen fuel cell or alternative-power production systems and reformer systems for co-producing hydrogen and electricity need to be statistically validated at user sites. Permitting, codes and standards, and safety procedures need to be established for hydrogen fuel cells located in or around buildings and refueling facilities. These systems have no commercial availability, or operational and maintenance experience.
Multi-Year Research, Development and Demonstration Plan Page 3.6 - 9
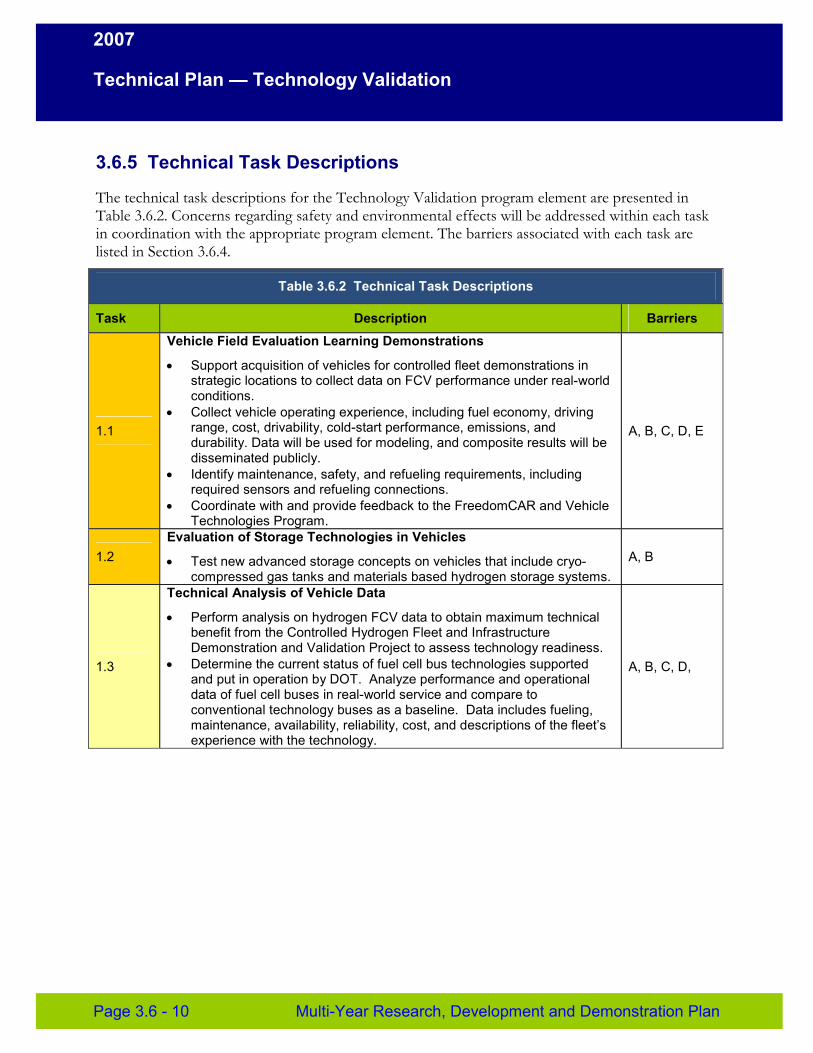
2007
Technical Plan — Technology Validation
3.6.5 Technical Task Descriptions
The technical task descriptions for the Technology Validation program element are presented in Table 3.6.2. Concerns regarding safety and environmental effects will be addressed within each task in coordination with the appropriate program element. The barriers associated with each task are listed in Section 3.6.4.
Table 3.6.2 Technical Task Descriptions
Task Description Barriers
1.1
Vehicle Field Evaluation Learning Demonstrations
• Support acquisition of vehicles for controlled fleet demonstrations in strategic locations to collect data on FCV performance under real-world conditions.
• Collect vehicle operating experience, including fuel economy, driving range, cost, drivability, cold-start performance, emissions, and durability. Data will be used for modeling, and composite results will be disseminated publicly.
• Identify maintenance, safety, and refueling requirements, including required sensors and refueling connections.
• Coordinate with and provide feedback to the FreedomCAR and Vehicle Technologies Program.
A, B, C, D, E
1.2 Evaluation of Storage Technologies in Vehicles
• Test new advanced storage concepts on vehicles that include cryo-compressed gas tanks and materials based hydrogen storage systems.
A, B
1.3
Technical Analysis of Vehicle Data
• Perform analysis on hydrogen FCV data to obtain maximum technical benefit from the Controlled Hydrogen Fleet and Infrastructure Demonstration and Validation Project to assess technology readiness.
• Determine the current status of fuel cell bus technologies supported and put in operation by DOT. Analyze performance and operational data of fuel cell buses in real-world service and compare to conventional technology buses as a baseline. Data includes fueling, maintenance, availability, reliability, cost, and descriptions of the fleet’s experience with the technology.
A, B, C, D,
Page 3.6 - 10 Multi-Year Research, Development and Demonstration Plan
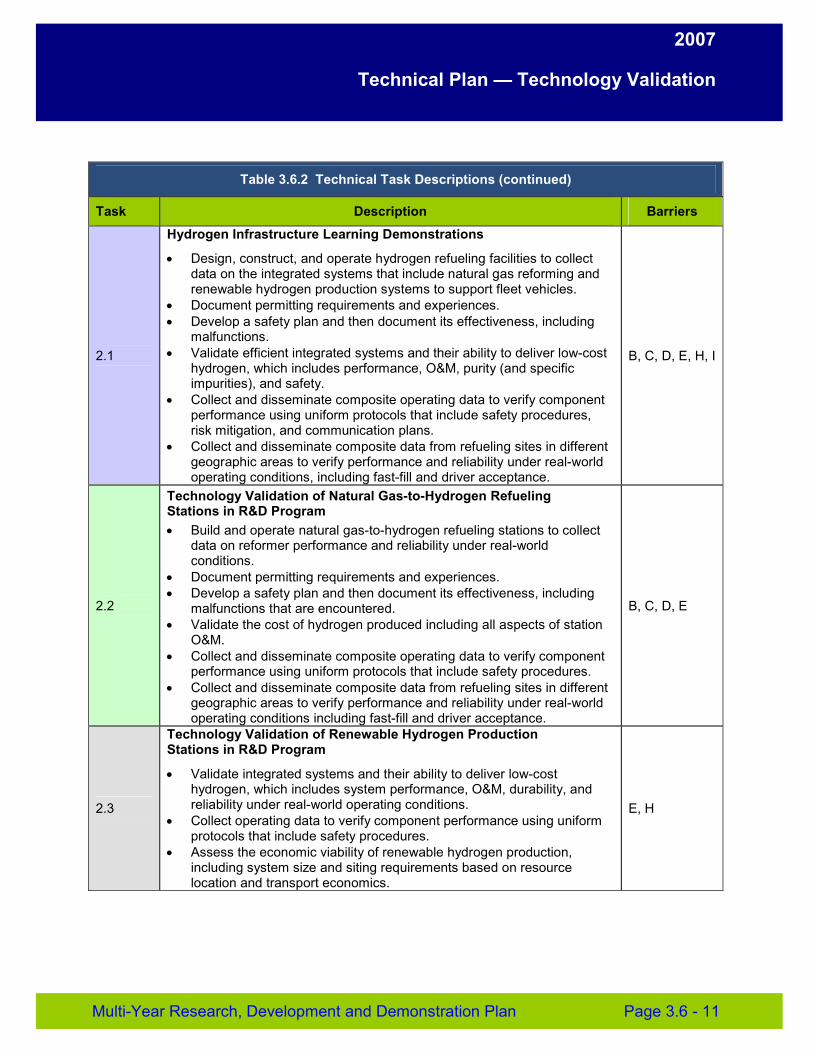
2007
Technical Plan — Technology Validation
Table 3.6.2 Technical Task Descriptions (continued)
Task Description Barriers
2.1
Hydrogen Infrastructure Learning Demonstrations
• Design, construct, and operate hydrogen refueling facilities to collect data on the integrated systems that include natural gas reforming and renewable hydrogen production systems to support fleet vehicles.
• Document permitting requirements and experiences. • Develop a safety plan and then document its effectiveness, including
malfunctions. • Validate efficient integrated systems and their ability to deliver low-cost
hydrogen, which includes performance, O&M, purity (and specific impurities), and safety.
• Collect and disseminate composite operating data to verify component performance using uniform protocols that include safety procedures, risk mitigation, and communication plans.
• Collect and disseminate composite data from refueling sites in different geographic areas to verify performance and reliability under real-world operating conditions, including fast-fill and driver acceptance.
B, C, D, E, H, I
2.2
Technology Validation of Natural Gas-to-Hydrogen Refueling Stations in R&D Program • Build and operate natural gas-to-hydrogen refueling stations to collect
data on reformer performance and reliability under real-world conditions.
• Document permitting requirements and experiences. • Develop a safety plan and then document its effectiveness, including
malfunctions that are encountered. • Validate the cost of hydrogen produced including all aspects of station
O&M. • Collect and disseminate composite operating data to verify component
performance using uniform protocols that include safety procedures. • Collect and disseminate composite data from refueling sites in different
geographic areas to verify performance and reliability under real-world operating conditions including fast-fill and driver acceptance.
B, C, D, E
2.3
Technology Validation of Renewable Hydrogen Production Stations in R&D Program
• Validate integrated systems and their ability to deliver low-cost hydrogen, which includes system performance, O&M, durability, and reliability under real-world operating conditions.
• Collect operating data to verify component performance using uniform protocols that include safety procedures.
• Assess the economic viability of renewable hydrogen production, including system size and siting requirements based on resource location and transport economics.
E, H
Multi-Year Research, Development and Demonstration Plan Page 3.6 - 11
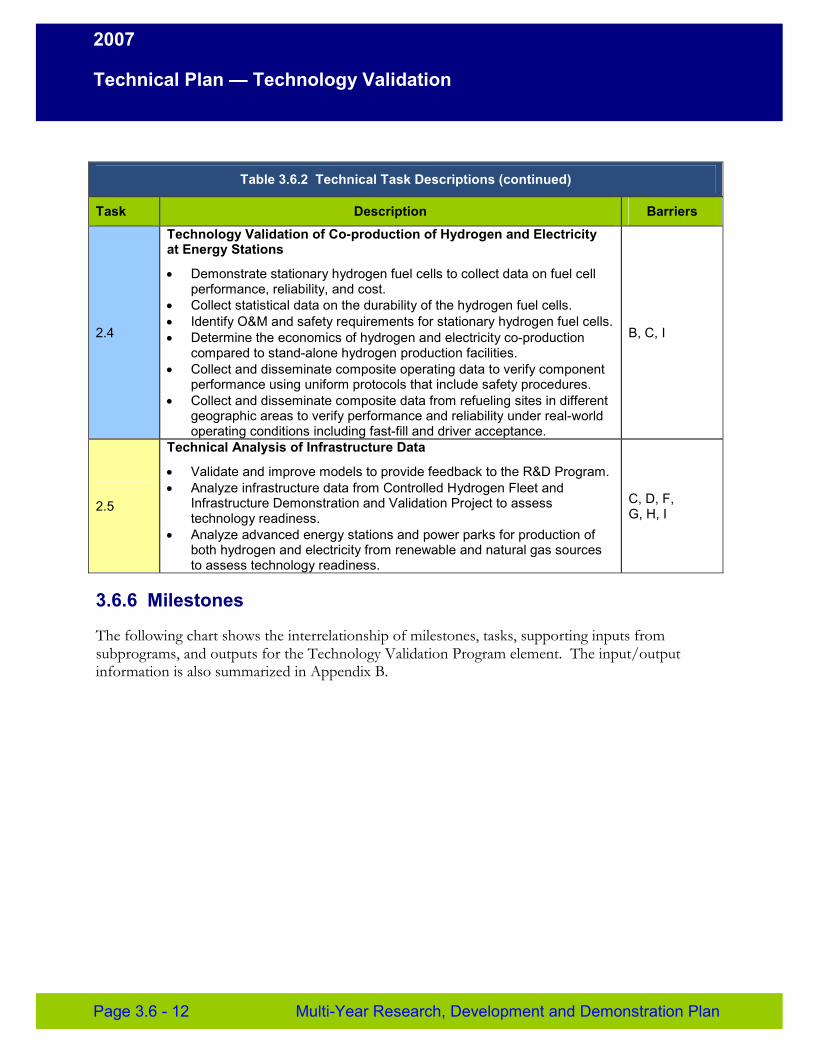
2007
Technical Plan — Technology Validation
Table 3.6.2 Technical Task Descriptions (continued)
Task Description Barriers
2.4
Technology Validation of Co-production of Hydrogen and Electricity at Energy Stations
• Demonstrate stationary hydrogen fuel cells to collect data on fuel cell performance, reliability, and cost.
• Collect statistical data on the durability of the hydrogen fuel cells. • Identify O&M and safety requirements for stationary hydrogen fuel cells. • Determine the economics of hydrogen and electricity co-production
compared to stand-alone hydrogen production facilities. • Collect and disseminate composite operating data to verify component
performance using uniform protocols that include safety procedures. • Collect and disseminate composite data from refueling sites in different
geographic areas to verify performance and reliability under real-world operating conditions including fast-fill and driver acceptance.
B, C, I
2.5
Technical Analysis of Infrastructure Data
• Validate and improve models to provide feedback to the R&D Program. • Analyze infrastructure data from Controlled Hydrogen Fleet and
Infrastructure Demonstration and Validation Project to assess technology readiness.
• Analyze advanced energy stations and power parks for production of both hydrogen and electricity from renewable and natural gas sources to assess technology readiness.
C, D, F, G, H, I
3.6.6 Milestones
The following chart shows the interrelationship of milestones, tasks, supporting inputs from subprograms, and outputs for the Technology Validation Program element. The input/output information is also summarized in Appendix B.
Page 3.6 - 12 Multi-Year Research, Development and Demonstration Plan
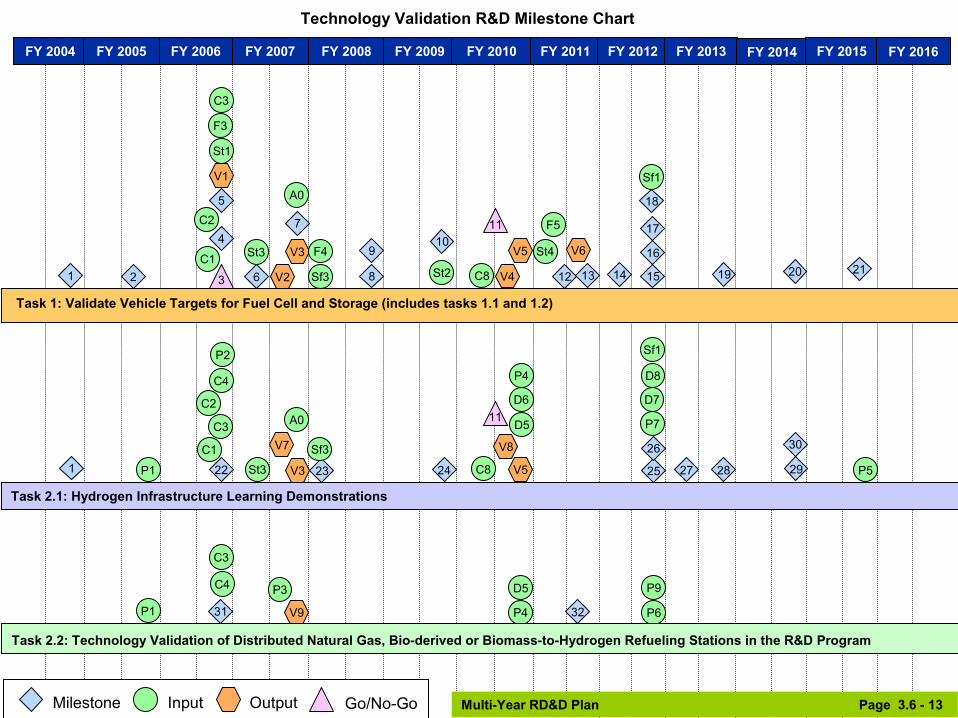
Technology Validation R&D Milestone Chart
1 2
9
2015
V3
V4
V5 V6
St1
St3C1
6
4
5
3
F3
C3
V2
F4
A0
St2
F5
C8
St4
1 2422 23V3 V5
V7 V8Sf3
St3
C1
C3
A0
C8P1
C4
31 32V9P1
D5
P4 P6
C2
C2
P9
P7
P4
12 14
16
19 2113
17
10
18
25
26
V1
8
Task 1: Validate Vehicle Targets for Fuel Cell and Storage (includes tasks 1.1 and 1.2)
Task 2.1: Hydrogen Infrastructure Learning Demonstrations
FY 2004 FY 2005 FY 2006 FY 2007 FY 2008 FY 2009 FY 2010 FY 2011 FY 2012 FY 2013 FY 2014 FY 2015 FY 2016
Sf1
Sf3
P3
D7
D8
D6
P527 28 29
30
D5
7
Sf1
11
11
P2
C4
C3
Milestone Input Output Go/No-Go Multi-Year RD&D Plan Page 3.6 - 13
Task 2.2: Technology Validation of Distributed Natural Gas, Bio-derived or Biomass-to-Hydrogen Refueling Stations in the R&D Program

Technology Validation R&D Milestone Chart
35 34
Task 2.3: Technology Validation of Renewable Hydrogen Production Stations in the R&D Program
36 37 38
33
V13 V14
V15
V10 V12V11
P8
V6
Tasks 1.3 and 2.5: Technical Analyses of Vehicle and Infrastructure Data
FY 2004 FY 2005 FY 2006 FY 2007 FY 2008 FY 2009 FY 2010 FY 2011 FY 2012 FY 2013 FY 2014 FY 2015 FY 2016
Task 2.4: Technology Validation of Co-Production of Hydrogen and Electricity at Energy Stations
P3
Multi-Year RD&D Plan Page 3.6 - 14 Milestone Input Output Go/No-Go
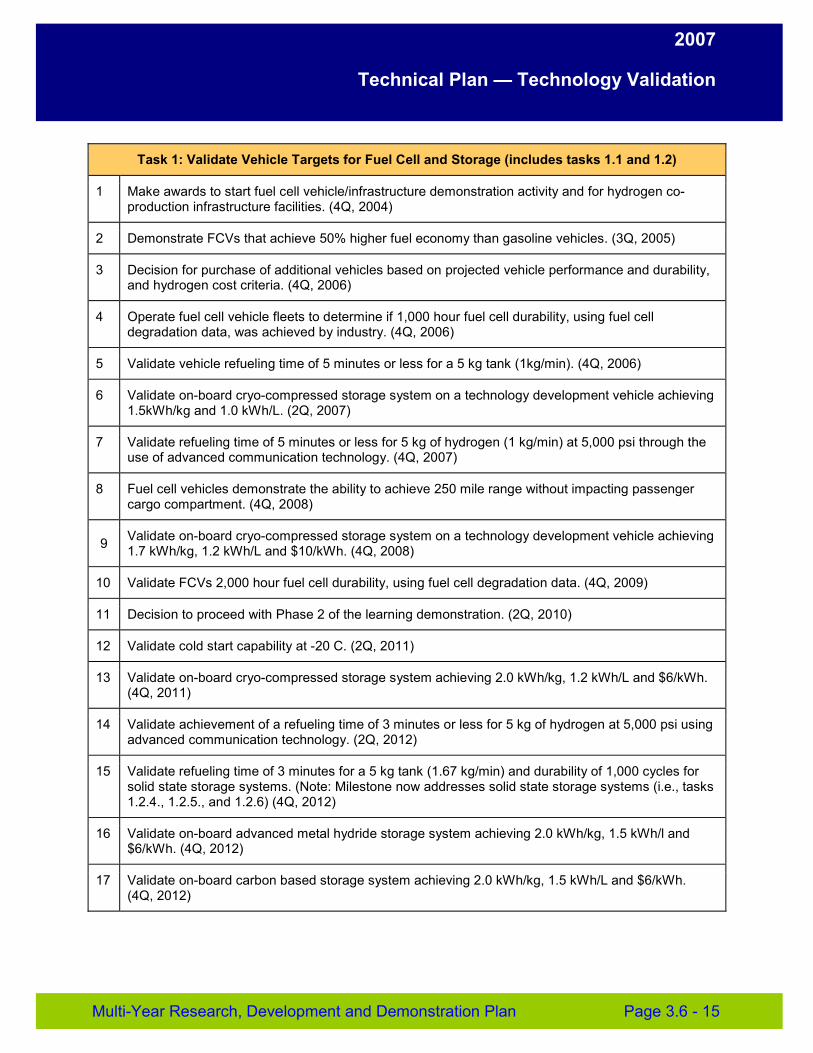
2007
Technical Plan — Technology Validation
Task 1: Validate Vehicle Targets for Fuel Cell and Storage (includes tasks 1.1 and 1.2)
1 Make awards to start fuel cell vehicle/infrastructure demonstration activity and for hydrogen co-production infrastructure facilities. (4Q, 2004)
2 Demonstrate FCVs that achieve 50% higher fuel economy than gasoline vehicles. (3Q, 2005)
3 Decision for purchase of additional vehicles based on projected vehicle performance and durability, and hydrogen cost criteria. (4Q, 2006)
4 Operate fuel cell vehicle fleets to determine if 1,000 hour fuel cell durability, using fuel cell degradation data, was achieved by industry. (4Q, 2006)
5 Validate vehicle refueling time of 5 minutes or less for a 5 kg tank (1kg/min). (4Q, 2006)
6 Validate on-board cryo-compressed storage system on a technology development vehicle achieving 1.5kWh/kg and 1.0 kWh/L. (2Q, 2007)
7 Validate refueling time of 5 minutes or less for 5 kg of hydrogen (1 kg/min) at 5,000 psi through the use of advanced communication technology. (4Q, 2007)
8 Fuel cell vehicles demonstrate the ability to achieve 250 mile range without impacting passenger cargo compartment. (4Q, 2008)
9 Validate on-board cryo-compressed storage system on a technology development vehicle achieving 1.7 kWh/kg, 1.2 kWh/L and $10/kWh. (4Q, 2008)
10 Validate FCVs 2,000 hour fuel cell durability, using fuel cell degradation data. (4Q, 2009)
11 Decision to proceed with Phase 2 of the learning demonstration. (2Q, 2010)
12 Validate cold start capability at -20 C. (2Q, 2011)
13 Validate on-board cryo-compressed storage system achieving 2.0 kWh/kg, 1.2 kWh/L and $6/kWh. (4Q, 2011)
14 Validate achievement of a refueling time of 3 minutes or less for 5 kg of hydrogen at 5,000 psi using advanced communication technology. (2Q, 2012)
15 Validate refueling time of 3 minutes for a 5 kg tank (1.67 kg/min) and durability of 1,000 cycles for solid state storage systems. (Note: Milestone now addresses solid state storage systems (i.e., tasks 1.2.4., 1.2.5., and 1.2.6) (4Q, 2012)
16 Validate on-board advanced metal hydride storage system achieving 2.0 kWh/kg, 1.5 kWh/l and $6/kWh. (4Q, 2012)
17 Validate on-board carbon based storage system achieving 2.0 kWh/kg, 1.5 kWh/L and $6/kWh. (4Q, 2012)
Multi-Year Research, Development and Demonstration Plan Page 3.6 - 15
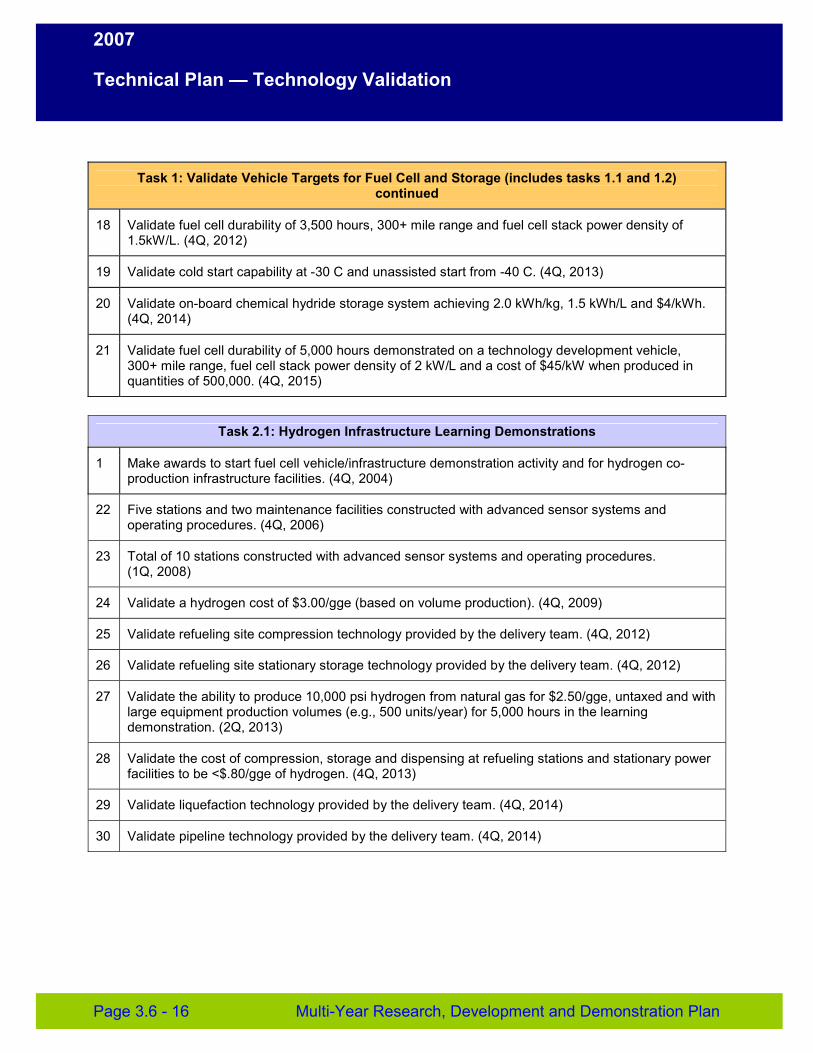
2007
Technical Plan — Technology Validation
Task 1: Validate Vehicle Targets for Fuel Cell and Storage (includes tasks 1.1 and 1.2) continued
18 Validate fuel cell durability of 3,500 hours, 300+ mile range and fuel cell stack power density of 1.5kW/L. (4Q, 2012)
19 Validate cold start capability at -30 C and unassisted start from -40 C. (4Q, 2013)
20 Validate on-board chemical hydride storage system achieving 2.0 kWh/kg, 1.5 kWh/L and $4/kWh. (4Q, 2014)
21 Validate fuel cell durability of 5,000 hours demonstrated on a technology development vehicle, 300+ mile range, fuel cell stack power density of 2 kW/L and a cost of $45/kW when produced in quantities of 500,000. (4Q, 2015)
Task 2.1: Hydrogen Infrastructure Learning Demonstrations
1 Make awards to start fuel cell vehicle/infrastructure demonstration activity and for hydrogen co-production infrastructure facilities. (4Q, 2004)
22 Five stations and two maintenance facilities constructed with advanced sensor systems and operating procedures. (4Q, 2006)
23 Total of 10 stations constructed with advanced sensor systems and operating procedures. (1Q, 2008)
24 Validate a hydrogen cost of $3.00/gge (based on volume production). (4Q, 2009)
25 Validate refueling site compression technology provided by the delivery team. (4Q, 2012)
26 Validate refueling site stationary storage technology provided by the delivery team. (4Q, 2012)
27 Validate the ability to produce 10,000 psi hydrogen from natural gas for $2.50/gge, untaxed and with large equipment production volumes (e.g., 500 units/year) for 5,000 hours in the learning demonstration. (2Q, 2013)
28 Validate the cost of compression, storage and dispensing at refueling stations and stationary power facilities to be <$.80/gge of hydrogen. (4Q, 2013)
29 Validate liquefaction technology provided by the delivery team. (4Q, 2014)
30 Validate pipeline technology provided by the delivery team. (4Q, 2014)
Page 3.6 - 16 Multi-Year Research, Development and Demonstration Plan
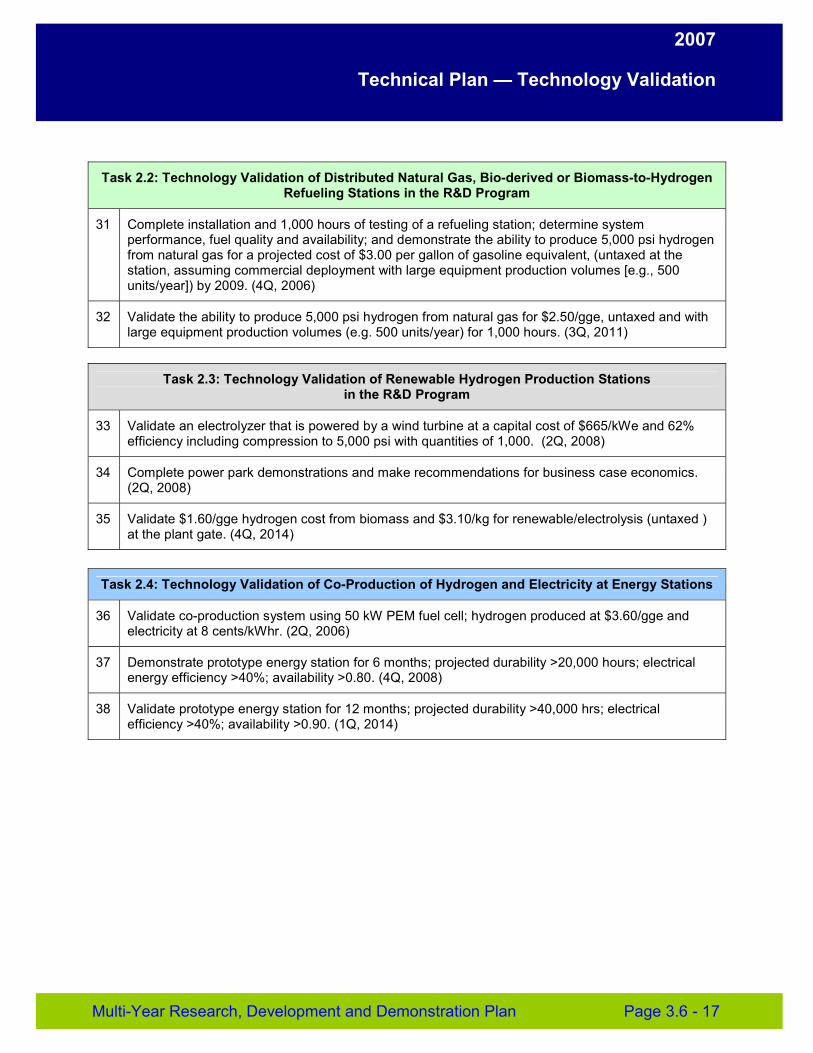
2007
Technical Plan — Technology Validation
Task 2.2: Technology Validation of Distributed Natural Gas, Bio-derived or Biomass-to-Hydrogen Refueling Stations in the R&D Program
31 Complete installation and 1,000 hours of testing of a refueling station; determine system performance, fuel quality and availability; and demonstrate the ability to produce 5,000 psi hydrogen from natural gas for a projected cost of $3.00 per gallon of gasoline equivalent, (untaxed at the station, assuming commercial deployment with large equipment production volumes [e.g., 500 units/year]) by 2009. (4Q, 2006)
32 Validate the ability to produce 5,000 psi hydrogen from natural gas for $2.50/gge, untaxed and with large equipment production volumes (e.g. 500 units/year) for 1,000 hours. (3Q, 2011)
Task 2.3: Technology Validation of Renewable Hydrogen Production Stations in the R&D Program
33 Validate an electrolyzer that is powered by a wind turbine at a capital cost of $665/kWe and 62% efficiency including compression to 5,000 psi with quantities of 1,000. (2Q, 2008)
34 Complete power park demonstrations and make recommendations for business case economics. (2Q, 2008)
35 Validate $1.60/gge hydrogen cost from biomass and $3.10/kg for renewable/electrolysis (untaxed ) at the plant gate. (4Q, 2014)
Task 2.4: Technology Validation of Co-Production of Hydrogen and Electricity at Energy Stations
36 Validate co-production system using 50 kW PEM fuel cell; hydrogen produced at $3.60/gge and electricity at 8 cents/kWhr. (2Q, 2006)
37 Demonstrate prototype energy station for 6 months; projected durability >20,000 hours; electrical energy efficiency >40%; availability >0.80. (4Q, 2008)
38 Validate prototype energy station for 12 months; projected durability >40,000 hrs; electrical efficiency >40%; availability >0.90. (1Q, 2014)
Multi-Year Research, Development and Demonstration Plan Page 3.6 - 17
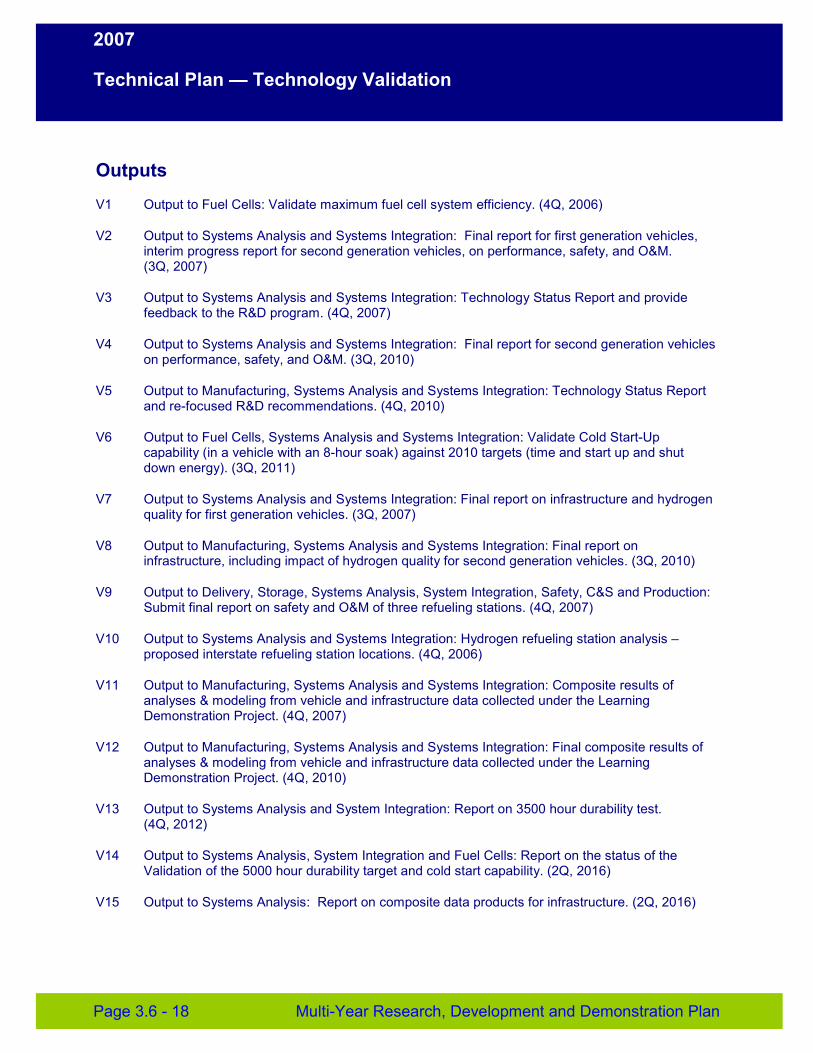
2007
Technical Plan — Technology Validation
Outputs
V1 Output to Fuel Cells: Validate maximum fuel cell system efficiency. (4Q, 2006)
V2 Output to Systems Analysis and Systems Integration: Final report for first generation vehicles, interim progress report for second generation vehicles, on performance, safety, and O&M. (3Q, 2007)
V3 Output to Systems Analysis and Systems Integration: Technology Status Report and provide feedback to the R&D program. (4Q, 2007)
V4 Output to Systems Analysis and Systems Integration: Final report for second generation vehicles on performance, safety, and O&M. (3Q, 2010)
V5 Output to Manufacturing, Systems Analysis and Systems Integration: Technology Status Report and re-focused R&D recommendations. (4Q, 2010)
V6 Output to Fuel Cells, Systems Analysis and Systems Integration: Validate Cold Start-Up capability (in a vehicle with an 8-hour soak) against 2010 targets (time and start up and shut down energy). (3Q, 2011)
V7 Output to Systems Analysis and Systems Integration: Final report on infrastructure and hydrogen quality for first generation vehicles. (3Q, 2007)
V8 Output to Manufacturing, Systems Analysis and Systems Integration: Final report on infrastructure, including impact of hydrogen quality for second generation vehicles. (3Q, 2010)
V9 Output to Delivery, Storage, Systems Analysis, System Integration, Safety, C&S and Production: Submit final report on safety and O&M of three refueling stations. (4Q, 2007)
V10 Output to Systems Analysis and Systems Integration: Hydrogen refueling station analysis – proposed interstate refueling station locations. (4Q, 2006)
V11 Output to Manufacturing, Systems Analysis and Systems Integration: Composite results of analyses & modeling from vehicle and infrastructure data collected under the Learning Demonstration Project. (4Q, 2007)
V12 Output to Manufacturing, Systems Analysis and Systems Integration: Final composite results of analyses & modeling from vehicle and infrastructure data collected under the Learning Demonstration Project. (4Q, 2010)
V13 Output to Systems Analysis and System Integration: Report on 3500 hour durability test. (4Q, 2012)
V14 Output to Systems Analysis, System Integration and Fuel Cells: Report on the status of the Validation of the 5000 hour durability target and cold start capability. (2Q, 2016)
V15 Output to Systems Analysis: Report on composite data products for infrastructure. (2Q, 2016)
Page 3.6 - 18 Multi-Year Research, Development and Demonstration Plan
2007
Technical Plan — Technology Validation
Inputs
St1 Input from Storage: Report on compressed/cryogenic liquid storage tanks and evaluation against 1.5 kWh/kg and 1.2 kWh/L. (4Q, 2006)
St2 Input from Storage: Report on advanced compressed/cryogenic tank technologies. (4Q, 2009)
St3 Input from Storage: Report on metal hydride system and evaluation against 2007 targets. (2Q, 2007)
St4 Input from Storage: Report on full-cycle chemical hydrogen system and evaluation against 2010 targets. (1Q, 2011)
C1 Input from Codes and Standards: Completed hydrogen fuel quality standard as ISO Technical Specification. (3Q, 2006)
C2 Input from Codes and Standards: Technical assessment of standards requirements for metallic and composite bulk storage tanks. (3Q, 2006)
C3 Input from Codes and Standards: Final standards (balloting) for fuel dispensing systems (CSA America). (4Q, 2006)
C4 Input from Codes and Standards: Draft standards (balloting) for refueling stations (NFPA). (4Q, 2006)
C8 Input from Codes and Standards: Final Hydrogen fuel quality standard as ISO Standard. (2Q, 2010)
Sf1 Input from Safety: Sensor meeting technical targets. (4Q, 2012)
Sf3 Input from Safety: Publish Best Practices Handbook. (1Q, 2008)
F3 Input from Fuel Cells: Provide automotive stack test data from documented sources indicating durability status. (4Q, 2006)
F4 Input from Fuel Cells: Verify short stack cold start (-20 C) to 50% of rated power in 60 seconds. (1Q, 2008)
F5 Input from Fuel Cells: Provide automotive stack test data from documented sources indicating durability status. (2Q, 2011)
A0 Input from Systems Analysis: Initial recommended hydrogen quality at each point in the system. (4Q, 2007)
D5 Input from Delivery: Refueling site compression technology recommended for validation. (4Q, 2010)
D6 Input from Delivery: Recommended refueling site stationary storage technology for validation. (4Q, 2010)
D7 Input from Delivery: Recommended liquefaction technology for potential validation. (4Q, 2012)
Multi-Year Research, Development and Demonstration Plan Page 3.6 - 19
2007
Technical Plan — Technology Validation
D8 Input from Delivery: Recommended pipeline technology for validation. (4Q, 2012)
P1 Input from Production: Verify hydrogen production technologies for distributed systems using natural gas with projected cost of $3.00/gge hydrogen at the pump, untaxed, assuming 500 manufactured units per year. (4Q, 2005)
P2 Input from Production: Assessment of H2 quality cost and issues from Production. (4Q, 2006)
P3 Input from Production: Impact of hydrogen quality on cost and performance. (3Q, 2007)
P4 Input from Production: Verify hydrogen production technologies for distributed systems using natural gas with projected cost of $2.50/gge hydrogen at the pump, untaxed assuming 500 manufactured per year. (4Q, 2010)
P5 Input from Production: Hydrogen production technology for distributed systems using natural gas with projected cost of $2.00/gge hydrogen at the pump, untaxed, assuming 500 manufactured units per year. (4Q, 2015)
P6 Input from Production: Hydrogen production technologies for distributed systems using renewable liquids with projected cost of $3.80/kg hydrogen at the pump, untaxed, assuming 500 manufactured units per year. (4Q, 2012)
P7 Input from Production: Distributed Electrolysis system making hydrogen for $3.70/gge delivered. (4Q, 2012)
P8 Input from Production: System making Hydrogen for $3.10/gge (plant gate) from central wind electrolysis. (4Q, 2012)
P9 Input from Production: Hydrogen production system making hydrogen for $1.60/gge from biomass at the plant gate. (4Q, 2012)
Page 3.6 - 20 Multi-Year Research, Development and Demonstration Plan
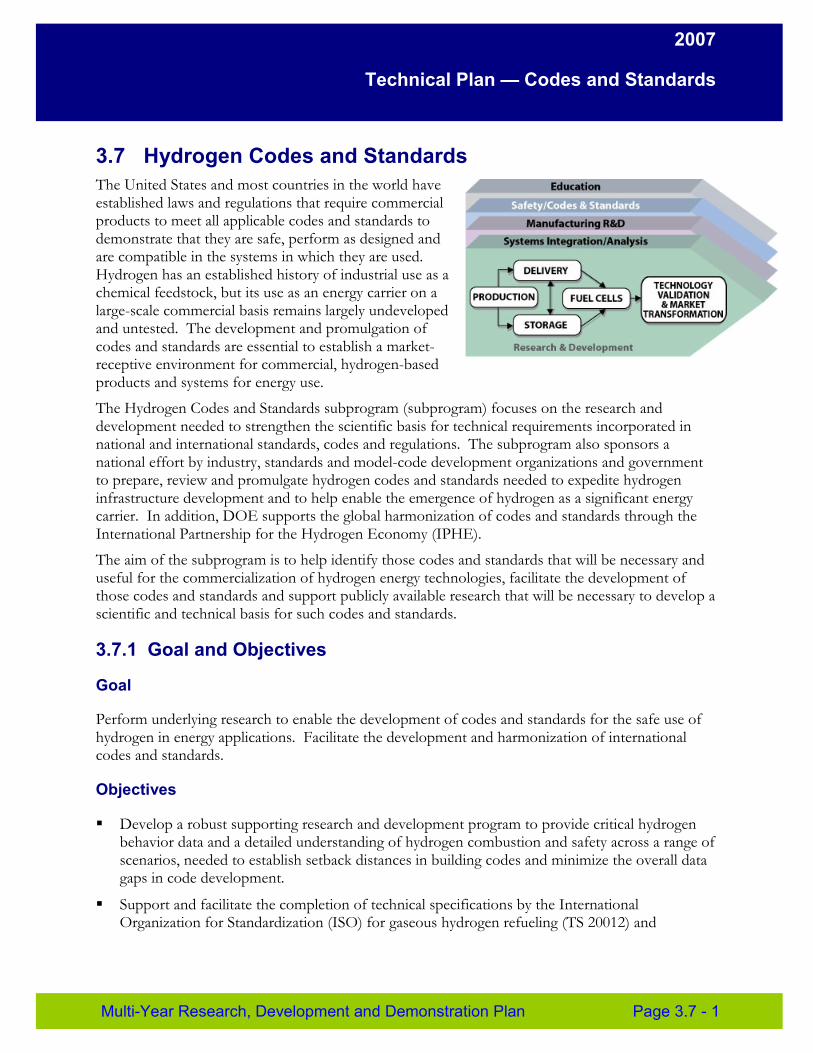
2007
Technical Plan — Codes and Standards
3.7 Hydrogen Codes and Standards The United States and most countries in the world have established laws and regulations that require commercial products to meet all applicable codes and standards to demonstrate that they are safe, perform as designed and are compatible in the systems in which they are used. Hydrogen has an established history of industrial use as a chemical feedstock, but its use as an energy carrier on a large-scale commercial basis remains largely undeveloped and untested. The development and promulgation of codes and standards are essential to establish a market-receptive environment for commercial, hydrogen-based products and systems for energy use.
The Hydrogen Codes and Standards subprogram (subprogram) focuses on the research and development needed to strengthen the scientific basis for technical requirements incorporated in national and international standards, codes and regulations. The subprogram also sponsors a national effort by industry, standards and model-code development organizations and government to prepare, review and promulgate hydrogen codes and standards needed to expedite hydrogen infrastructure development and to help enable the emergence of hydrogen as a significant energy carrier. In addition, DOE supports the global harmonization of codes and standards through the International Partnership for the Hydrogen Economy (IPHE).
The aim of the subprogram is to help identify those codes and standards that will be necessary and useful for the commercialization of hydrogen energy technologies, facilitate the development of those codes and standards and support publicly available research that will be necessary to develop a scientific and technical basis for such codes and standards.
3.7.1 Goal and Objectives
Goal
Perform underlying research to enable the development of codes and standards for the safe use of hydrogen in energy applications. Facilitate the development and harmonization of international codes and standards.
Objectives
� Develop a robust supporting research and development program to provide critical hydrogen behavior data and a detailed understanding of hydrogen combustion and safety across a range of scenarios, needed to establish setback distances in building codes and minimize the overall data gaps in code development.
� Support and facilitate the completion of technical specifications by the International Organization for Standardization (ISO) for gaseous hydrogen refueling (TS 20012) and
Multi-Year Research, Development and Demonstration Plan Page 3.7 - 1
2007
Technical Plan — Codes and Standards
standards for on-board liquid- (ISO 13985) and gaseous- or gaseous blend- (ISO 15869) hydrogen storage by 2007.
� Support and facilitate the effort, led by the National Fire Protection Association (NFPA), to complete the draft Hydrogen Technologies Code (NFPA 2) by 2008.
� With experimental data and input from Technology Validation Program element activities, support and facilitate the completion of standards for bulk hydrogen storage (e.g., NFPA 55) by 2008.
� Facilitate the adoption of the most recently available model codes (e.g., from the International Code Council [ICC]) in key regions by 2007.
� Complete preliminary research and development on hydrogen release scenarios to support the establishment of setback distances in building codes and provide a sound basis for model code development and adoption.
� Support and facilitate the development of Global Technical Regulations (GTR) by 2010 for hydrogen vehicle systems under the United Nations Economic Commission for Europe, World Forum for Harmonization of Vehicle Regulations and Working Party on Pollution and Energy Program (ECE-WP29/GRPE).
� Support and facilitate the completion by 2012 of necessary codes and standards needed for the early commercialization and market entry of hydrogen energy technologies.
3.7.2 Technical Approach
The Hydrogen Program recognizes that domestic and international codes and standards must be established along with affordable hydrogen and fuel cell technologies to enable the timely commercialization and safe use of hydrogen as an energy carrier. The lack of codes and standards applicable to hydrogen as an energy carrier is a major institutional barrier to deploying hydrogen technologies. It is in the national interest to eliminate this potential barrier. As such, the subprogram works with domestic and international standards development organizations (SDOs) to facilitate the development of performance-based standards. These standards are then referenced by building and other codes to expedite regulatory approval of hydrogen technologies. This approach ensures that U.S. consumers can purchase products that are safe and reliable, regardless of their country of origin, and that U.S. companies can compete internationally.
The key U.S. and international SDOs developing and publishing the majority of hydrogen codes and standards are shown in Table 3.7.1. These organizations typically work with the public and private sectors to develop codes and standards.
Page 3.7 - 2 Multi-Year Research, Development and Demonstration Plan
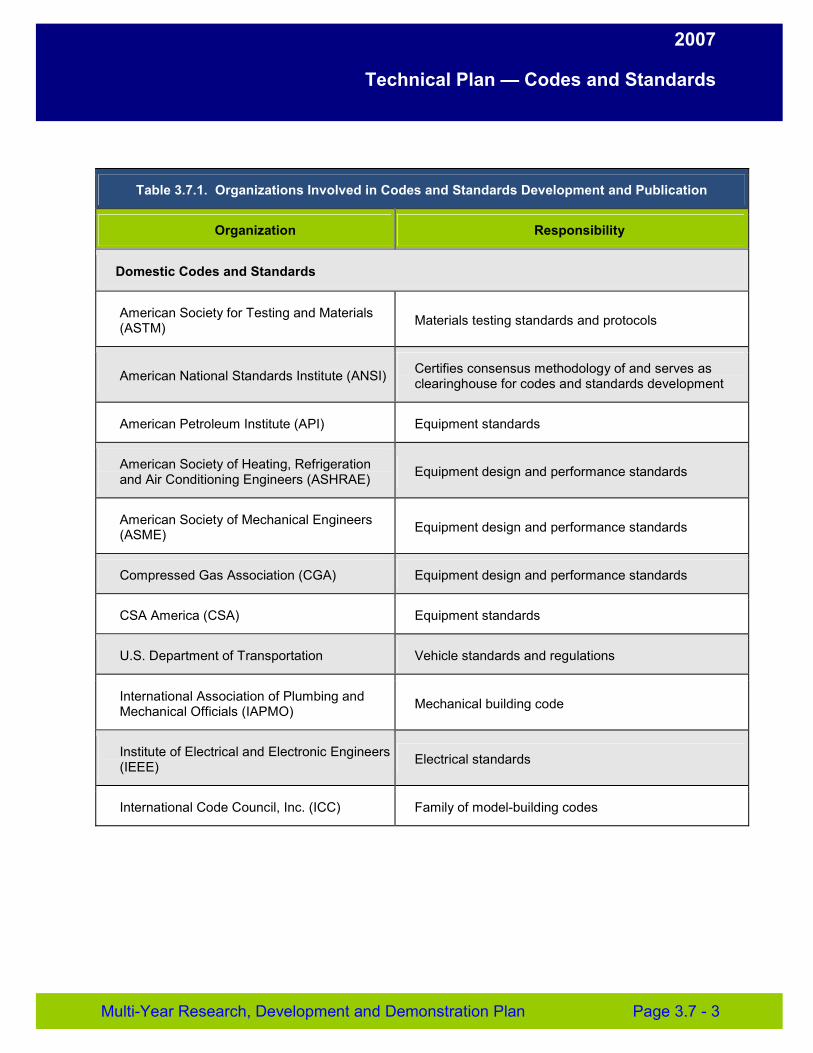
2007
Technical Plan — Codes and Standards
Table 3.7.1. Organizations Involved in Codes and Standards Development and Publication
Organization Responsibility
Domestic Codes and Standards
American Society for Testing and Materials (ASTM) Materials testing standards and protocols
American National Standards Institute (ANSI) Certifies consensus methodology of and serves as clearinghouse for codes and standards development
American Petroleum Institute (API) Equipment standards
American Society of Heating, Refrigeration and Air Conditioning Engineers (ASHRAE) Equipment design and performance standards
American Society of Mechanical Engineers (ASME) Equipment design and performance standards
Compressed Gas Association (CGA) Equipment design and performance standards
CSA America (CSA) Equipment standards
U.S. Department of Transportation Vehicle standards and regulations
International Association of Plumbing and Mechanical Officials (IAPMO) Mechanical building code
Institute of Electrical and Electronic Engineers (IEEE) Electrical standards
International Code Council, Inc. (ICC) Family of model-building codes
Multi-Year Research, Development and Demonstration Plan Page 3.7 - 3
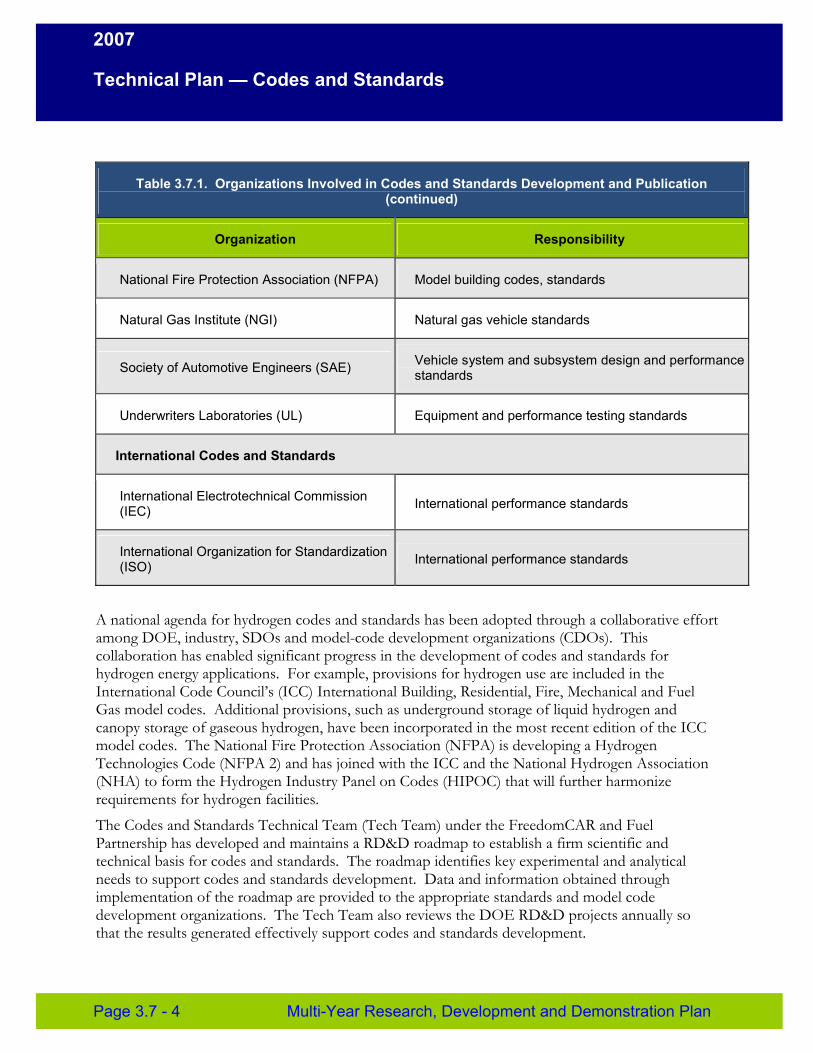
2007
Technical Plan — Codes and Standards
Table 3.7.1. Organizations Involved in Codes and Standards Development and Publication (continued)
Organization Responsibility
National Fire Protection Association (NFPA) Model building codes, standards
Natural Gas Institute (NGI) Natural gas vehicle standards
Society of Automotive Engineers (SAE) Vehicle system and subsystem design and performance standards
Underwriters Laboratories (UL) Equipment and performance testing standards
International Codes and Standards
International Electrotechnical Commission (IEC) International performance standards
International Organization for Standardization (ISO) International performance standards
A national agenda for hydrogen codes and standards has been adopted through a collaborative effort among DOE, industry, SDOs and model-code development organizations (CDOs). This collaboration has enabled significant progress in the development of codes and standards for hydrogen energy applications. For example, provisions for hydrogen use are included in the International Code Council’s (ICC) International Building, Residential, Fire, Mechanical and Fuel Gas model codes. Additional provisions, such as underground storage of liquid hydrogen and canopy storage of gaseous hydrogen, have been incorporated in the most recent edition of the ICC model codes. The National Fire Protection Association (NFPA) is developing a Hydrogen Technologies Code (NFPA 2) and has joined with the ICC and the National Hydrogen Association (NHA) to form the Hydrogen Industry Panel on Codes (HIPOC) that will further harmonize requirements for hydrogen facilities.
The Codes and Standards Technical Team (Tech Team) under the FreedomCAR and Fuel Partnership has developed and maintains a RD&D roadmap to establish a firm scientific and technical basis for codes and standards. The roadmap identifies key experimental and analytical needs to support codes and standards development. Data and information obtained through implementation of the roadmap are provided to the appropriate standards and model code development organizations. The Tech Team also reviews the DOE RD&D projects annually so that the results generated effectively support codes and standards development.
Page 3.7 - 4 Multi-Year Research, Development and Demonstration Plan
2007
Technical Plan — Codes and Standards
Research to Facilitate Domestic Codes and Standards Development
A primary role of the subprogram is to support R&D to provide a technical basis for the development of hydrogen codes and standards. This R&D focuses on basic hydrogen properties and behavior, as well as the testing of materials and components that support standards development.
The Codes and Standards subprogram also facilitates and supports the codes and standards development process. One result of DOE’s effort is the creation of “National Templates,” which identify players and establish relationships to facilitate codes and standards development. Through these relationships, DOE and the major SDOs and CDOs coordinate the preparation of critical standards and codes for hydrogen technologies in vehicular and stationary applications. The structure provided by the templates is implemented through the National Hydrogen and Fuel Cell Codes and Standards Coordinating Committee (Coordinating Committee ) formed by the DOE, NHA, and the U.S. Fuel Cell Council. The Coordinating Committee provides a single national forum for the codes and standards community to keep participants aware of progress in implementing the templates and to discuss issues and concerns that may arise.
The subprogram has also assumed a communication role so that timely, accurate and relevant information is prepared and disseminated to stakeholders. An important part of implementing the National Templates is to maintain an awareness of the status of and changes in hydrogen codes and standards. The DOE has worked with ANSI to create a hydrogen portal on ANSI’s national standards network. The portal (www.hcsp.ansi.org), is linked to a matrix (posted at www.fuelcellstandards.com) that lists codes and standards by application area and for each code and standard listed, provides a brief description, technical contacts and current status. The portal also facilitates electronic access to key hydrogen standards and model codes.
Information about current codes and standards issues is also provided through the Hydrogen Safety Newsletter published monthly by the National Hydrogen Association (NHA) and available at www.hydrogensafety.info. The Newsletter also tracks activities in codes and standards and provides a convenient site for information on codes and standards, such as the minutes of the monthly teleconference meetings of the Coordinating Committee.
The ICC and the NFPA are the two major organizations that develop model codes in the U.S. Typical model codes available for adoption by state and local governments are listed in Table 3.7.2. Many of these model codes have been or are being amended to incorporate requirements for hydrogen applications.
Multi-Year Research, Development and Demonstration Plan Page 3.7 - 5
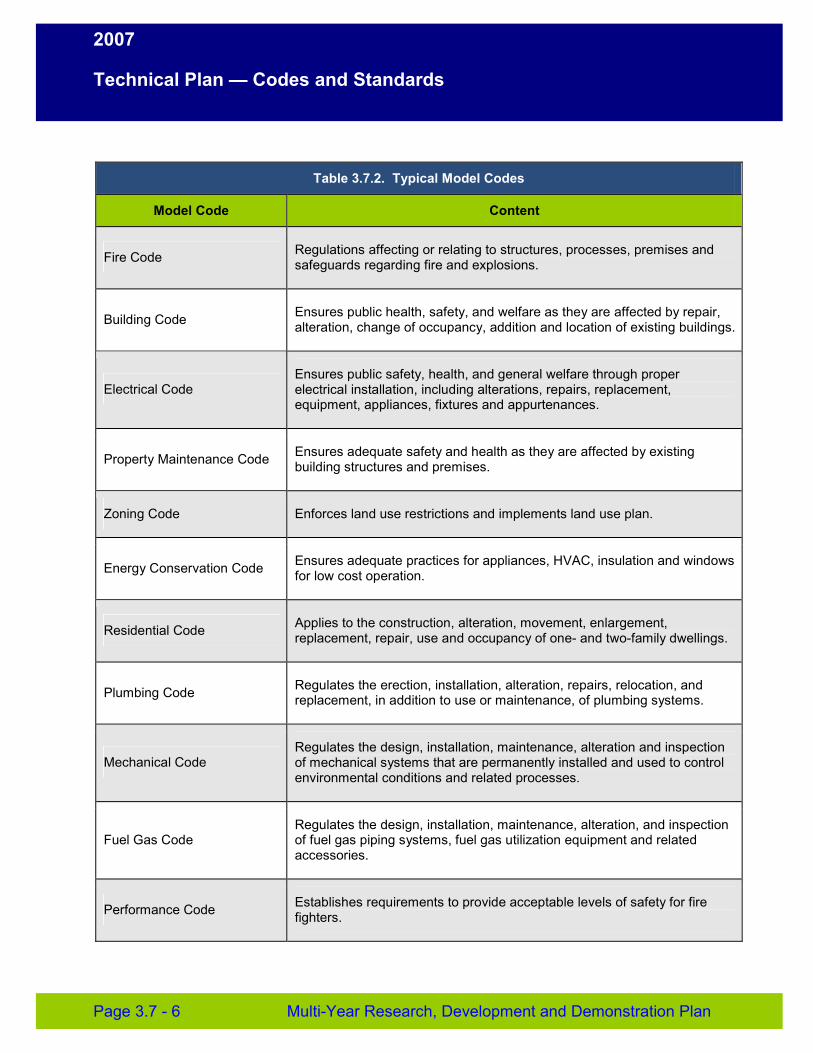
2007
Technical Plan — Codes and Standards
Table 3.7.2. Typical Model Codes
Model Code Content
Fire Code Regulations affecting or relating to structures, processes, premises and safeguards regarding fire and explosions.
Building Code Ensures public health, safety, and welfare as they are affected by repair, alteration, change of occupancy, addition and location of existing buildings.
Electrical Code Ensures public safety, health, and general welfare through proper electrical installation, including alterations, repairs, replacement, equipment, appliances, fixtures and appurtenances.
Property Maintenance Code Ensures adequate safety and health as they are affected by existing building structures and premises.
Zoning Code Enforces land use restrictions and implements land use plan.
Energy Conservation Code Ensures adequate practices for appliances, HVAC, insulation and windows for low cost operation.
Residential Code Applies to the construction, alteration, movement, enlargement, replacement, repair, use and occupancy of one- and two-family dwellings.
Plumbing Code Regulates the erection, installation, alteration, repairs, relocation, and replacement, in addition to use or maintenance, of plumbing systems.
Mechanical Code Regulates the design, installation, maintenance, alteration and inspection of mechanical systems that are permanently installed and used to control environmental conditions and related processes.
Fuel Gas Code Regulates the design, installation, maintenance, alteration, and inspection of fuel gas piping systems, fuel gas utilization equipment and related accessories.
Performance Code Establishes requirements to provide acceptable levels of safety for fire fighters.
Page 3.7 - 6 Multi-Year Research, Development and Demonstration Plan
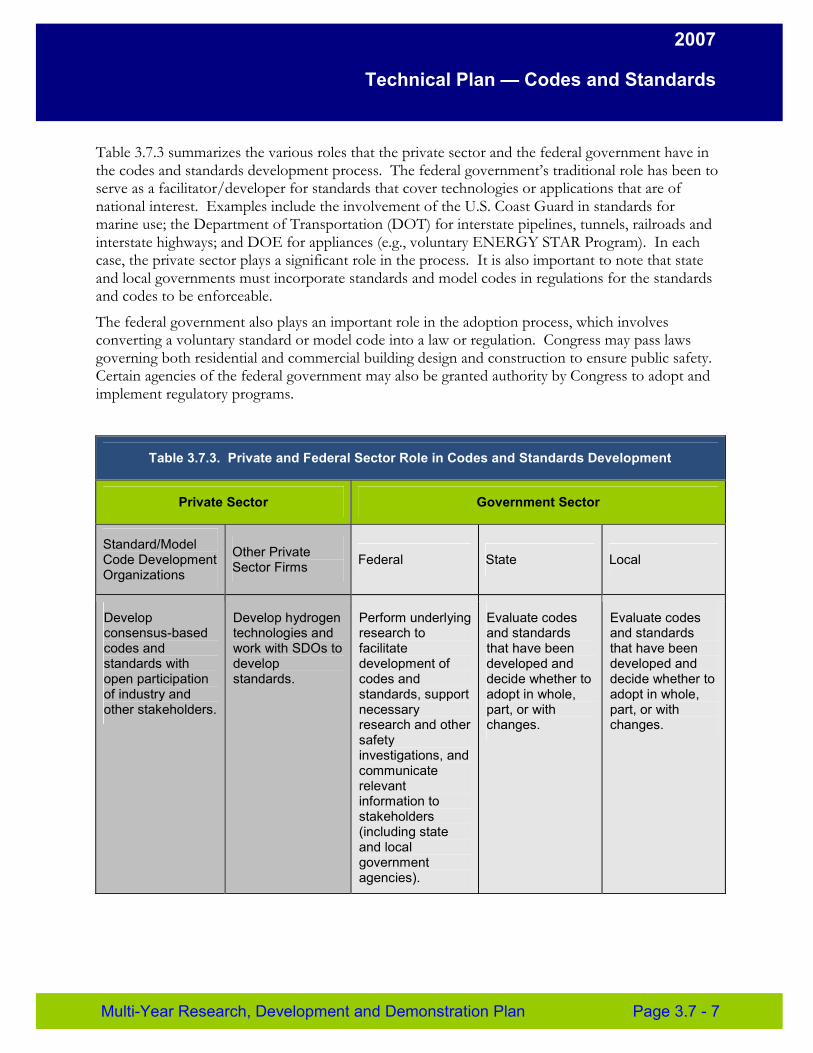
2007
Technical Plan — Codes and Standards
Table 3.7.3 summarizes the various roles that the private sector and the federal government have in the codes and standards development process. The federal government’s traditional role has been to serve as a facilitator/developer for standards that cover technologies or applications that are of national interest. Examples include the involvement of the U.S. Coast Guard in standards for marine use; the Department of Transportation (DOT) for interstate pipelines, tunnels, railroads and interstate highways; and DOE for appliances (e.g., voluntary ENERGY STAR Program). In each case, the private sector plays a significant role in the process. It is also important to note that state and local governments must incorporate standards and model codes in regulations for the standards and codes to be enforceable.
The federal government also plays an important role in the adoption process, which involves converting a voluntary standard or model code into a law or regulation. Congress may pass laws governing both residential and commercial building design and construction to ensure public safety. Certain agencies of the federal government may also be granted authority by Congress to adopt and implement regulatory programs.
Table 3.7.3. Private and Federal Sector Role in Codes and Standards Development
Private Sector Government Sector
Standard/Model Code Development Organizations
Other Private Sector Firms Federal State Local
Develop consensus-based codes and standards with open participation of industry and other stakeholders.
Develop hydrogen technologies and work with SDOs to develop standards.
Perform underlying research to facilitate development of codes and standards, support necessary research and other safety investigations, and communicate relevant information to stakeholders (including state and local government agencies).
Evaluate codes and standards that have been developed and decide whether to adopt in whole, part, or with changes.
Evaluate codes and standards that have been developed and decide whether to adopt in whole, part, or with changes.
Multi-Year Research, Development and Demonstration Plan Page 3.7 - 7
2007
Technical Plan — Codes and Standards
International Codes and Standards Development
The Hydrogen, Fuel Cells and Infrastructure Technologies Program supports the development of international codes and standards that facilitate trade between the U.S. and other countries. The Codes and Standards subprogram coordinates and supports the participation of U.S. experts at key international codes and standards development organization meetings sponsored by ISO, IEC and ECE-WP29/GRPE. The subprogram also supports the International Partnership for a Hydrogen Economy in collaborative R&D with other member governments to provide the technical basis for the development of codes and standards.
Through its coordination of the domestic codes and standards agenda, the subprogram facilitates national consensus positions on international standards. The subprogram also supports and coordinates the U.S. Technical Advisory Groups (TAGs) for ISO TC197 (Hydrogen Technologies), IEC TC105 (Fuel Cell Technology) and other key ISO and IEC technical committees. The TAGs provide a national forum for industry and government experts to develop consensus positions on proposed ISO and IEC documents and actions. The subprogram also works with the EPA and DOT/NHTSA to provide technical expertise on issues before the WP29/GRPE.
3.7.3 Programmatic Status
Current Activities
The current Codes and Standards subprogram activities are summarized in Table 3.7.4.
Page 3.7 - 8 Multi-Year Research, Development and Demonstration Plan
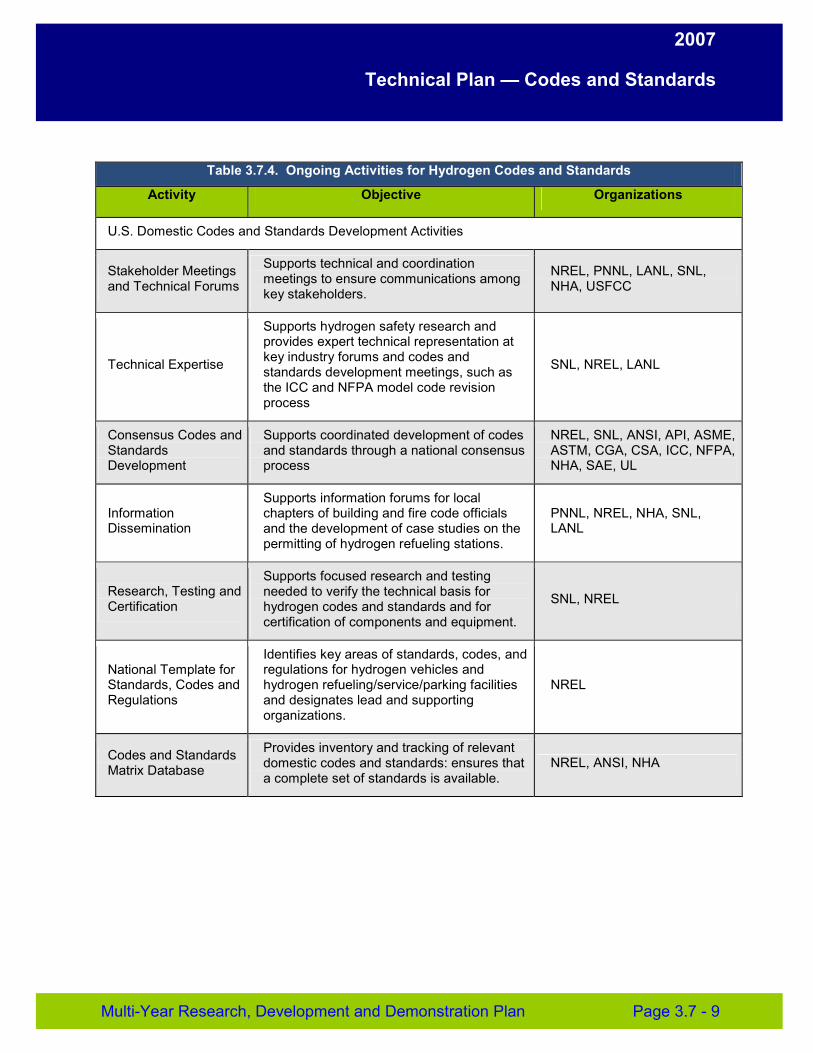
2007
Technical Plan — Codes and Standards
Table 3.7.4. Ongoing Activities for Hydrogen Codes and Standards
Activity Objective Organizations
U.S. Domestic Codes and Standards Development Activities
Stakeholder Meetings and Technical Forums
Supports technical and coordination meetings to ensure communications among key stakeholders.
NREL, PNNL, LANL, SNL, NHA, USFCC
Technical Expertise
Supports hydrogen safety research and provides expert technical representation at key industry forums and codes and standards development meetings, such as the ICC and NFPA model code revision process
SNL, NREL, LANL
Consensus Codes and Standards Development
Supports coordinated development of codes and standards through a national consensus process
NREL, SNL, ANSI, API, ASME, ASTM, CGA, CSA, ICC, NFPA, NHA, SAE, UL
Information Dissemination
Supports information forums for local chapters of building and fire code officials and the development of case studies on the permitting of hydrogen refueling stations.
PNNL, NREL, NHA, SNL, LANL
Research, Testing and Certification
Supports focused research and testing needed to verify the technical basis for hydrogen codes and standards and for certification of components and equipment.
SNL, NREL
National Template for Standards, Codes and Regulations
Identifies key areas of standards, codes, and regulations for hydrogen vehicles and hydrogen refueling/service/parking facilities and designates lead and supporting organizations.
NREL
Codes and Standards Matrix Database
Provides inventory and tracking of relevant domestic codes and standards: ensures that a complete set of standards is available.
NREL, ANSI, NHA
Multi-Year Research, Development and Demonstration Plan Page 3.7 - 9
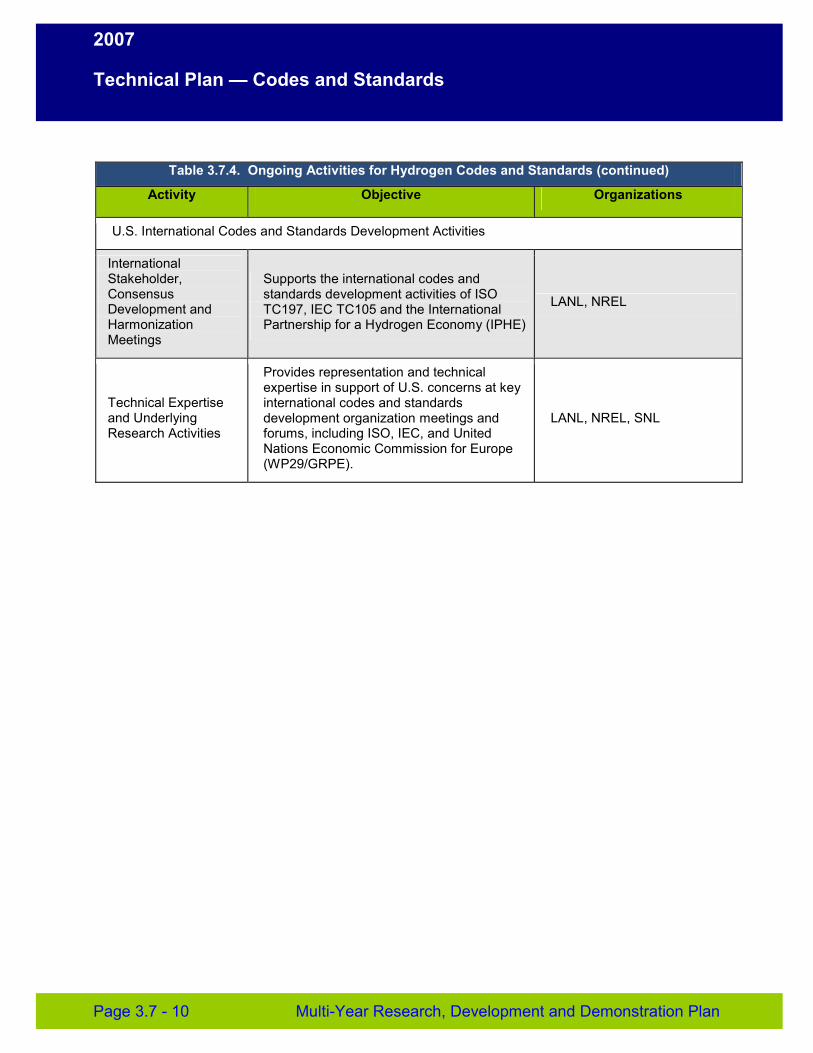
2007
Technical Plan — Codes and Standards
Table 3.7.4. Ongoing Activities for Hydrogen Codes and Standards (continued)
Activity Objective Organizations
U.S. International Codes and Standards Development Activities
International Stakeholder, Consensus Development and Harmonization Meetings
Supports the international codes and standards development activities of ISO TC197, IEC TC105 and the International Partnership for a Hydrogen Economy (IPHE)
LANL, NREL
Technical Expertise and Underlying Research Activities
Provides representation and technical expertise in support of U.S. concerns at key international codes and standards development organization meetings and forums, including ISO, IEC, and United Nations Economic Commission for Europe (WP29/GRPE).
LANL, NREL, SNL
Page 3.7 - 10 Multi-Year Research, Development and Demonstration Plan
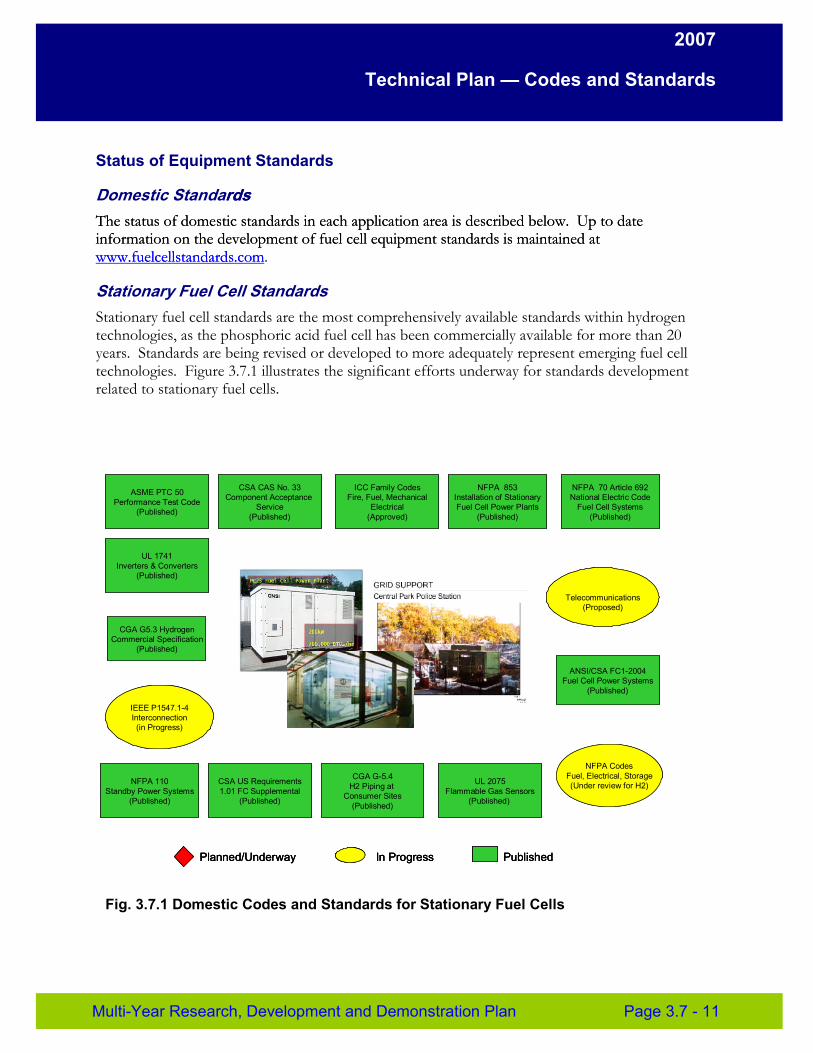
2007
Technical Plan — Codes and Standards
Status of Equipment Standards
Domestic Standardsrds The status of domestic standards in each application area is described below. Up to dateThe status of domestic standards in each application area is described below. Up to date information on the development of fuel cell equipment standards is maintained atinformation on the development of fuel cell equipment standards is maintained at www.fuelcellstandards.comwww.fuelcellstandards.com.
Stationary Fuel Cell Standards Stationary fuel cell standards are the most comprehensively available standards within hydrogen technologies, as the phosphoric acid fuel cell has been commercially available for more than 20 years. Standards are being revised or developed to more adequately represent emerging fuel cell technologies. Figure 3.7.1 illustrates the significant efforts underway for standards development related to stationary fuel cells.
IEEE P1547.1-4 Interconnection (in Progress)
UL 2266 Telecommunications
(Proposed)
-
IEEE P1547.1-4Interconnection(in Progress)
UL 2266Telecommunications
(Proposed)
ICC Family Codes Fire, Fuel, Mechanical
Electrical (Approved)
ANSI/CSA FC1-2004 Fuel Cell Power Systems
(Published)
CSA US Requirements 1.01 FC Supplemental
(Published)
CGA G 5.4 H2 Piping at
Consumer Sites (Published)
CSA CAS No. 33 Component Acceptance
Service (Published)
UL 2075 Flammable Gas Sensors
(Published)
CGA G5.3 Hydrogen Commercial Specification
(Published)
NFPA 853 Installation of Stationary Fuel Cell Power Plants
(Published)
NFPA 70 Article 692 National Electric Code
Fuel Cell Systems (Published)
NFPA 110 Standby Power Systems
(Published)
NFPA Codes Fuel, Electrical, Storage (Under review for H2)
UL 1741 Inverters & Converters
(Published)
ASME PTC 50 Performance Test Code
(Published)
-
Planned/UnderwayPlPlanned/Underwayanned/Underway In ProgressIIn Progressn Progress PublishedPPublishedublished
Fig. 3.7.1 Domestic Codes and Standards for Stationary Fuel Cells
Multi-Year Research, Development and Demonstration Plan Page 3.7 - 11
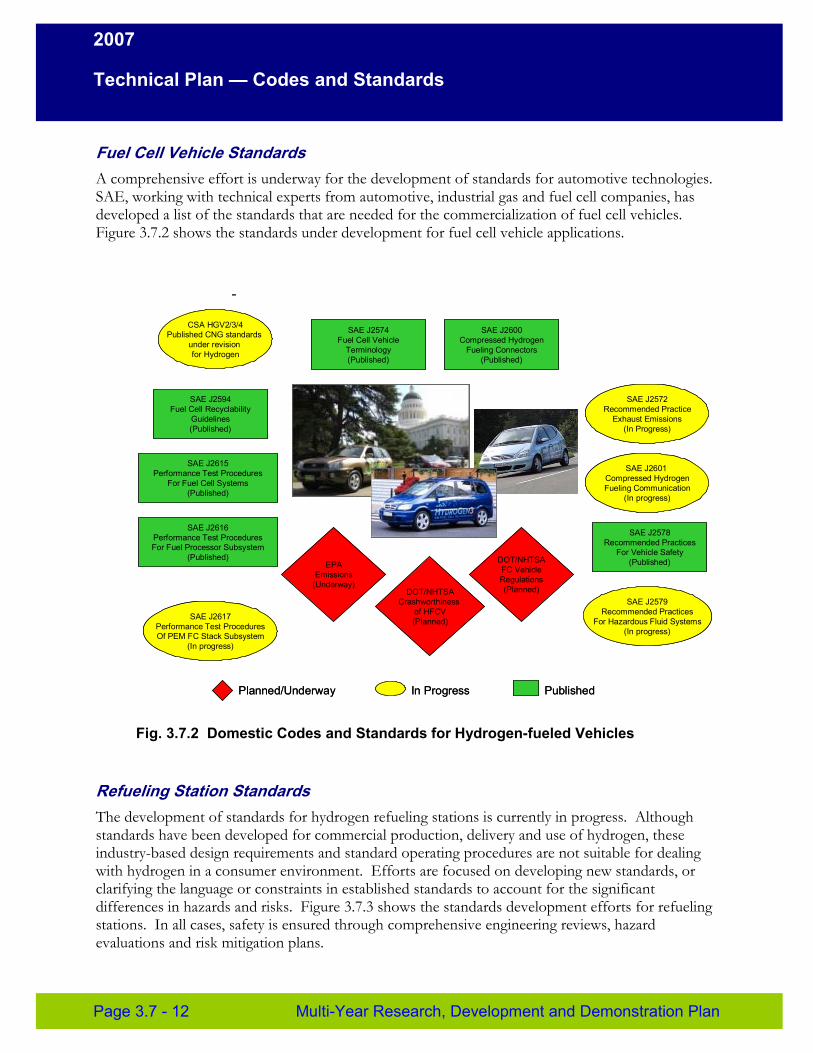
2007
Technical Plan — Codes and Standards
Fuel Cell Vehicle Standards A comprehensive effort is underway for the development of standards for automotive technologies. SAE, working with technical experts from automotive, industrial gas and fuel cell companies, has developed a list of the standards that are needed for the commercialization of fuel cell vehicles. Figure 3.7.2 shows the standards under development for fuel cell vehicle applications.
-
SAE J2579 Recommended Practices
For Hazardous Fluid Systems (In progress)
SAE J2572 Recommended Practice
Exhaust Emissions (In Progress)
SAE J2601 Compressed Hydrogen Fueling Communication
(In progress)
SAE J2617 Performance Test Procedures Of PEM FC Stack Subsystem
(In progress)
CSA HGV2/3/4 Published CNG standards
under revision for Hydrogen
Planned/Underway In Progress Published
SAE J2579Recommended Practices
For Hazardous Fluid Systems(In progress)
SAE J2572Recommended Practice
Exhaust Emissions(In Progress)
SAE J2601Compressed HydrogenFueling Communication
(In progress)
SAE J2617Performance Test ProceduresOf PEM FC Stack Subsystem
(In progress)
CSA HGV2/3/4Published CNG standards
under revisionfor Hydrogen
EPA Emissions
(Underway)
SAE J2594 Fuel Cell Recyclability
Guidelines (Published)
SAE J2600 Compressed Hydrogen
Fueling Connectors (Published)
SAE J2574 Fuel Cell Vehicle
Terminology (Published)
SAE J2578 Recommended Practices
For Vehicle Safety (Published)DOT/NHTSA
FC Vehicle Regulations (Planned)DOT/NHTSA
Crashworthiness of HFCV (Planned)
SAE J2615 Performance Test Procedures
For Fuel Cell Systems (Published)
SAE J2616 Performance Test Procedures For Fuel Processor Subsystem
(Published)
Planned/Underway In Progress Published
Fig. 3.7.2 Domestic Codes and Standards for Hydrogen-fueled Vehicles
Refueling Station Standards The development of standards for hydrogen refueling stations is currently in progress. Although standards have been developed for commercial production, delivery and use of hydrogen, these industry-based design requirements and standard operating procedures are not suitable for dealing with hydrogen in a consumer environment. Efforts are focused on developing new standards, or clarifying the language or constraints in established standards to account for the significant differences in hazards and risks. Figure 3.7.3 shows the standards development efforts for refueling stations. In all cases, safety is ensured through comprehensive engineering reviews, hazard evaluations and risk mitigation plans.
Page 3.7 - 12 Multi-Year Research, Development and Demonstration Plan
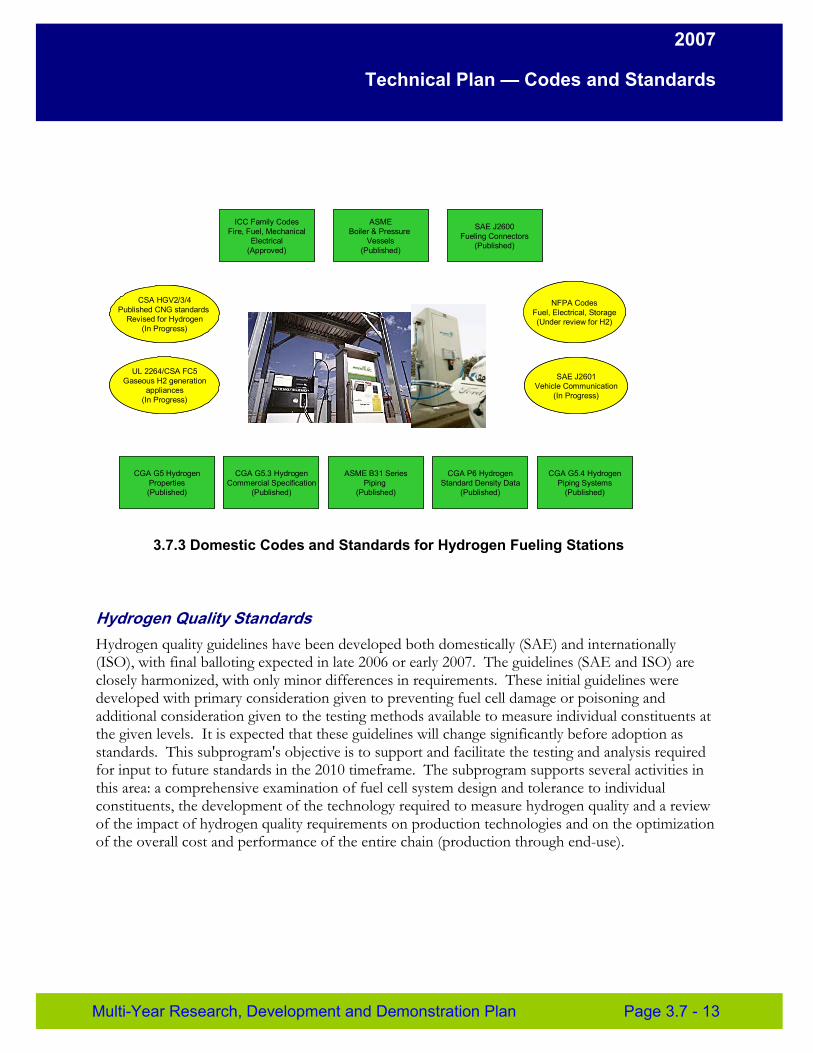
2007
Technical Plan — Codes and Standards
CSA HGV2/3/4 Published CNG standards
Revised for Hydrogen (In Progress)
NFPA Codes Fuel, Electrical, Storage (Under review for H2)
SAE J2601 Vehicle Communication
(In Progress)
ICC Family Codes Fire, Fuel, Mechanical
Electrical (Approved)
ASME Boiler & Pressure
Vessels (Published)
CGA G5.3 Hydrogen Commercial Specification
(Published)
CGA G5 Hydrogen Properties (Published)
CGA P6 Hydrogen Standard Density Data
(Published)
CGA G5.4 Hydrogen Piping Systems
(Published)
SAE J2600 Fueling Connectors
(Published)
ASME B31 Series Piping
(Published)
CSA HGV2/3/4Published CNG standards
Revised for Hydrogen(In Progress)
UL 2264/CSA FC5 Gaseous H2 generation
appliances (In Progress)
3.7.3 Domestic Codes and Standards for Hydrogen Fueling Stations
Hydrogen Quality Standards Hydrogen quality guidelines have been developed both domestically (SAE) and internationally (ISO), with final balloting expected in late 2006 or early 2007. The guidelines (SAE and ISO) are closely harmonized, with only minor differences in requirements. These initial guidelines were developed with primary consideration given to preventing fuel cell damage or poisoning and additional consideration given to the testing methods available to measure individual constituents at the given levels. It is expected that these guidelines will change significantly before adoption as standards. This subprogram's objective is to support and facilitate the testing and analysis required for input to future standards in the 2010 timeframe. The subprogram supports several activities in this area: a comprehensive examination of fuel cell system design and tolerance to individual constituents, the development of the technology required to measure hydrogen quality and a review of the impact of hydrogen quality requirements on production technologies and on the optimization of the overall cost and performance of the entire chain (production through end-use).
Multi-Year Research, Development and Demonstration Plan Page 3.7 - 13
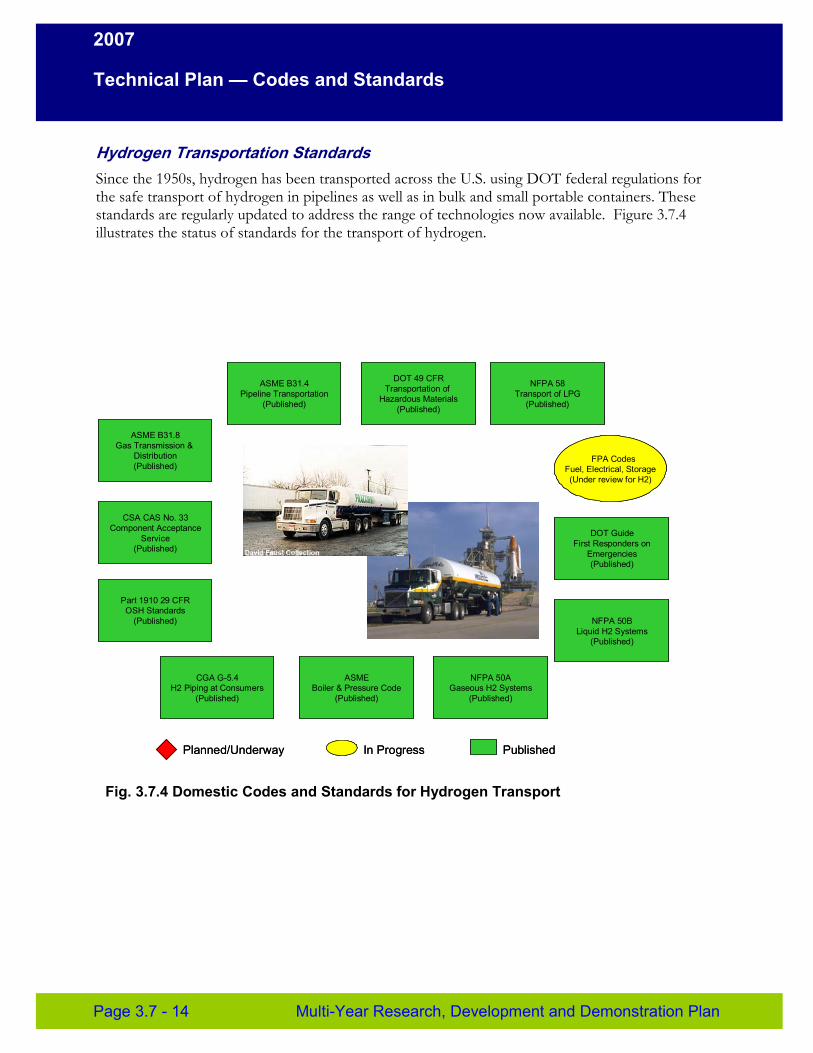
2007
Technical Plan — Codes and Standards
Hydrogen Transportation Standards Since the 1950s, hydrogen has been transported across the U.S. using DOT federal regulations for the safe transport of hydrogen in pipelines as well as in bulk and small portable containers. These standards are regularly updated to address the range of technologies now available. Figure 3.7.4 illustrates the status of standards for the transport of hydrogen.
DOT 49 CFR Transportation of
Hazardous Materials (Published)
ASME B31.4 Pipeline Transportation
(Published)
NFPA 58 Transport of LPG
(Published)
ASME B31.8 Gas Transmission &
Distribution (Published)
NFPA Codes Fuel, Electrical, Storage (Under review for H2)
N
-
Part 1910 29 CFR OSH Standards
(Published)
DOT Guide First Responders on
Emergencies (Published)
CSA CAS No. 33 Component Acceptance
Service (Published)
NFPA 50B Liquid H2 Systems
(Published)
CGA G-
FPA CodesFuel, Electrical, Storage(Under review for H2)
5.4 H2 Piping at Consumers
(Published)
ASME Boiler & Pressure Code
(Published)
NFPA 50A Gaseous H2 Systems
(Published)
Planned/UnderwayPlanned/Underway In ProgressIn Progress PublishedPublished
Fig. 3.7.4 Domestic Codes and Standards for Hydrogen Transport
Page 3.7 - 14 Multi-Year Research, Development and Demonstration Plan
2007
Technical Plan — Codes and Standards
International Standards
Three separate but related international efforts are underway to develop new technology standards through the International Organization for Standardization (ISO), the International Electrotechnical Commission (IEC) and the World Forum for Harmonization of Vehicle Regulations.
International Organization for Standardization ISO is a worldwide federation of national standards bodies from more than 140 countries. Established in 1947, its mission is to promote standardization to facilitate the exchange of goods and services, and to facilitate cooperation in intellectual, scientific, technological and economic activities. ISO standards are developed through a consensus process.
The following ISO Technical Committees are working on standards related to hydrogen and fuel cells:
TC 197 - Hydrogen Technologies
Systems and devices for the production, storage, transport, measurement, and use of hydrogen. Working groups address standards and guidelines for gaseous and gaseous blends and liquid fuel tanks for vehicles, hydrogen safety, hydrogen fuel quality, water electrolysis, fuel processing and transportable gas storage devices.
TC 22 - Road Vehicles
Compatibility, interchangeability, and safety, with particular attention to terminology and test procedures for mopeds, motorcycles, motor vehicles, trailers, semi-trailers, light trailers, combination vehicles and articulated vehicles. The Electric Road Vehicle Subcommittee (SC21) is addressing operation of vehicles, safety, and energy storage. TC 58 - Gas Cylinders
Fittings and characteristics related to the use and manufacture of high-pressure gas storage. The working group on gas compatibility and materials coordinates with TC 197.
International Electrotechnical Commission IEC is a leading global organization for preparing and publishing international standards for electrical, electronic and related technologies. The IEC is developing standards for the electrical interface to fuel cells. IEC Technical Committee 105 is primarily addressing stationary fuel cell power plants, but has also addressed portable and propulsion fuel cells. The working groups in TC 105 include the following: Terminology, Fuel Cell Modules, Stationary Safety, Performance, Installation, Propulsion and Safety and Performance of Portable Fuel Cells.
World Forum for Harmonization of Vehicle Regulations Within the U.N. framework on GRPE, the European Union recognized a need to harmonize vehicle regulations. The original agreement was signed in 1958, with contracting parties including most European countries, Australia, Japan and South Africa, but not the United States. Contracting parties have two years to adopt standards developed under the 1958 agreement. Requirements (“regulations” or “directives”) under this agreement are based on the “type” approval process, wherein an authority works with a technical service to assess compliance of components and
Multi-Year Research, Development and Demonstration Plan Page 3.7 - 15
2007
Technical Plan — Codes and Standards
systems (such as a vehicle). European countries use the “type” approval process, while the U.S. uses a self-certification process.
Since the initial agreement, the ECE WP29 developed a new “accelerated” agreement to allow the development of global legal requirements. The 1998 agreement has most European countries, Canada, China, Japan, Korea, South Africa and the U.S. as contracting parties. This new concept is termed Global Technical Regulations (GTR). These regulations are essentially technical requirements; therefore, they allow the use of different approval processes and global harmonization of legal requirements for all vehicles. The GRPE established an Ad Hoc Group to draft regulations for gaseous and liquid hydrogen systems. The ISO process and that instituted by the GRPE will harmonize the differences between both standards. In June 2002, the GRPE voted to move all actions for the introduction of fuel cell vehicles under the 1998 agreement to accelerate the development and adoption of a GTR. The subprogram will monitor and participate in this process in support of the EPA and DOT/NHTSA lead responsibilities.
3.7.4 Challenges
A major challenge to the commercialization of hydrogen technologies is the lack of available data necessary to develop and validate standards. The Program sponsors a comprehensive, long-term RD&D effort to develop the scientific and technical basis for requirements incorporated in standards and model codes.
Another challenge to the commercialization of hydrogen technologies is the need for appropriate codes and standards to ensure consistency and facilitate deployment. Certification to applicable standards facilitates approval by local code officials and safety inspectors. Uniform standards are needed because manufacturers cannot cost-effectively manufacture multiple products that would be required to meet different and inconsistent standards.
Domestically, competition between the individual SDOs could impact the adoption of new codes for hydrogen and fuel cell technologies. Because of the typical 3- to 5-year development cycle, some demonstration projects could be delayed or incur additional development costs. The DOE has worked with SDOs, CDOs and industry to minimize duplication in domestic codes and standards development. International standards developed by ISO and IEC will have an increasing impact on U.S. hydrogen and fuel cell interests. The U.S., Japan and Europe, among others, have accelerated efforts in this area, and the Program supports cooperative and coordinated development of international standards.
Targets
Since the development of the model codes or domestic and international standards is a voluntary, industry-led process, the federal government can facilitate but cannot direct this process. R&D activities supported by the subprogram will provide the data needed to accelerate the development of codes and standards to facilitate the commercial acceptance of hydrogen and fuel cell technologies.
Page 3.7 - 16 Multi-Year Research, Development and Demonstration Plan
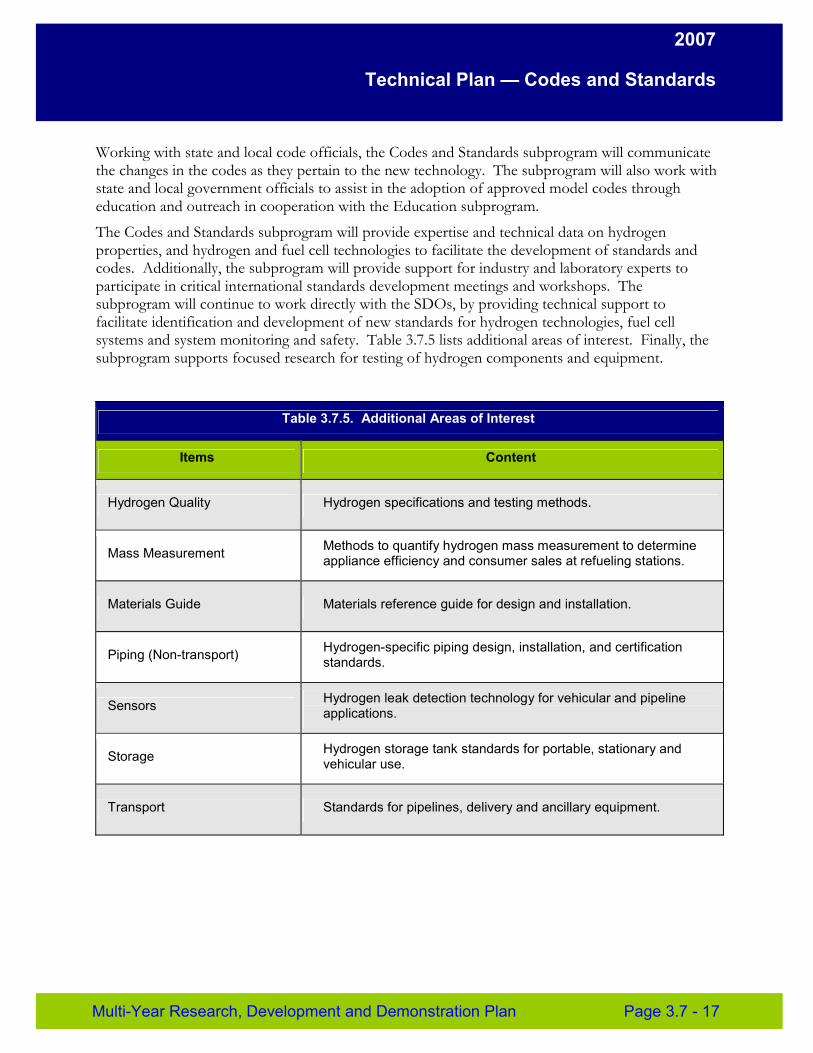
2007
Technical Plan — Codes and Standards
Working with state and local code officials, the Codes and Standards subprogram will communicate the changes in the codes as they pertain to the new technology. The subprogram will also work with state and local government officials to assist in the adoption of approved model codes through education and outreach in cooperation with the Education subprogram.
The Codes and Standards subprogram will provide expertise and technical data on hydrogen properties, and hydrogen and fuel cell technologies to facilitate the development of standards and codes. Additionally, the subprogram will provide support for industry and laboratory experts to participate in critical international standards development meetings and workshops. The subprogram will continue to work directly with the SDOs, by providing technical support to facilitate identification and development of new standards for hydrogen technologies, fuel cell systems and system monitoring and safety. Table 3.7.5 lists additional areas of interest. Finally, the subprogram supports focused research for testing of hydrogen components and equipment.
Table 3.7.5. Additional Areas of Interest
Items Content
Hydrogen Quality Hydrogen specifications and testing methods.
Mass Measurement Methods to quantify hydrogen mass measurement to determine appliance efficiency and consumer sales at refueling stations.
Materials Guide Materials reference guide for design and installation.
Piping (Non-transport) Hydrogen-specific piping design, installation, and certification standards.
Sensors Hydrogen leak detection technology for vehicular and pipeline applications.
Storage Hydrogen storage tank standards for portable, stationary and vehicular use.
Transport Standards for pipelines, delivery and ancillary equipment.
Multi-Year Research, Development and Demonstration Plan Page 3.7 - 17
2007
Technical Plan — Codes and Standards
Barriers
A. Limited Government Influence on Model Codes
The code development process is voluntary, so the government can affect its progression, but ultimately it is up to the CDOs.
B. Competition among SDOs and CDOs
The competition between various organizations hinders the creation of consistent hydrogen codes and standards.
C. Limited State Funds for New Codes
Budget shortfalls in many states and local jurisdictions impact the adoption of codes and standards because they do not always have the funds for purchasing new codes or for training building and fire officials.
D. Large Number of Local Government Jurisdictions (approximately 44,000).
The large number of jurisdictions hinders the universal adoption of codes and standards.
E. Lack of Consistency in Training of Officials
The training of code officials is not mandated and varies significantly. The large number of jurisdictions leads to variation in training facilities and requirements.
F. Limited DOE Role in the Development of International Standards
Governments can participate and influence the development of codes and standards, but they cannot direct the development of international standards.
G. Inadequate Representation at International Forums
Participation in international forums and meetings is voluntary and, to date, has been limited by budgetary constraints.
H. International Competitiveness
Economic competition complicates the development of international standards.
I. Conflicts between Domestic and International Standards
National positions can complicate the harmonization of domestic and international standards.
J. Lack of National Consensus on Codes and Standards
Competitive issues hinder consensus.
K. Lack of Sustained Domestic Industry Support at International Technical Committees
Cost, time and availability of domestic hydrogen experts have limited consistent support of the activities conducted within the international technical committees.
Page 3.7 - 18 Multi-Year Research, Development and Demonstration Plan
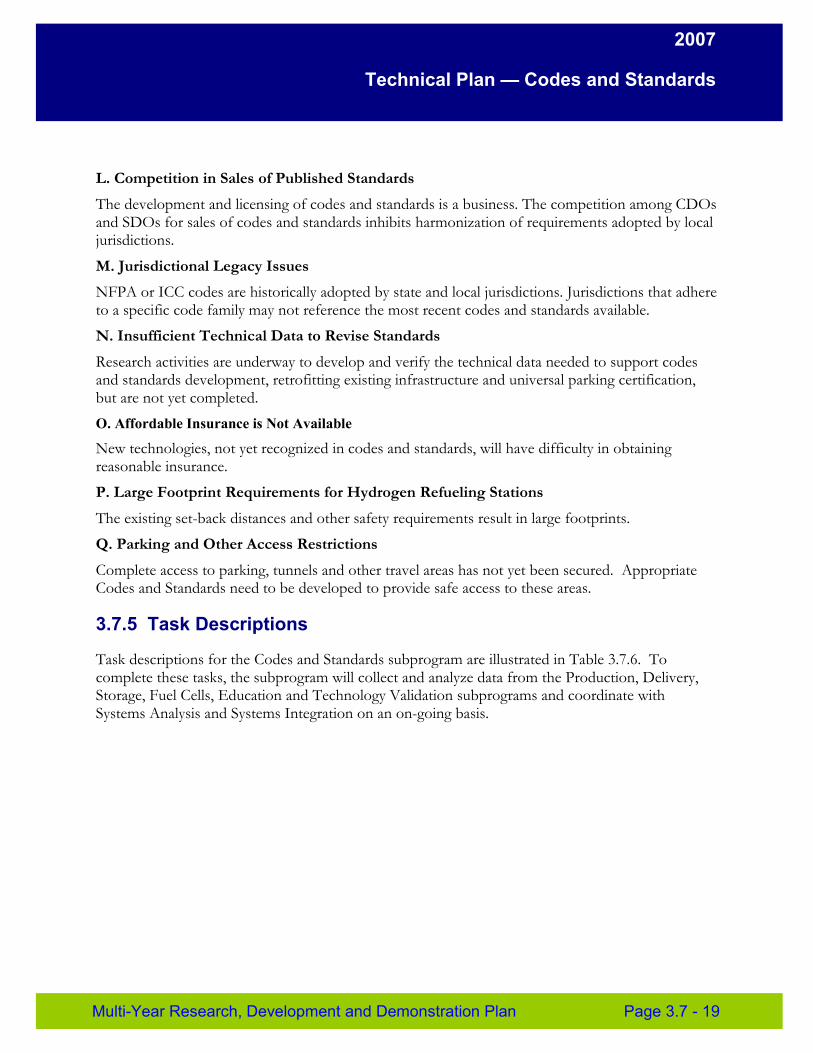
2007
Technical Plan — Codes and Standards
L. Competition in Sales of Published Standards
The development and licensing of codes and standards is a business. The competition among CDOs and SDOs for sales of codes and standards inhibits harmonization of requirements adopted by local jurisdictions.
M. Jurisdictional Legacy Issues
NFPA or ICC codes are historically adopted by state and local jurisdictions. Jurisdictions that adhere to a specific code family may not reference the most recent codes and standards available.
N. Insufficient Technical Data to Revise Standards
Research activities are underway to develop and verify the technical data needed to support codes and standards development, retrofitting existing infrastructure and universal parking certification, but are not yet completed. O. Affordable Insurance is Not Available
New technologies, not yet recognized in codes and standards, will have difficulty in obtaining reasonable insurance.
P. Large Footprint Requirements for Hydrogen Refueling Stations
The existing set-back distances and other safety requirements result in large footprints.
Q. Parking and Other Access Restrictions
Complete access to parking, tunnels and other travel areas has not yet been secured. Appropriate Codes and Standards need to be developed to provide safe access to these areas.
3.7.5 Task Descriptions
Task descriptions for the Codes and Standards subprogram are illustrated in Table 3.7.6. To complete these tasks, the subprogram will collect and analyze data from the Production, Delivery, Storage, Fuel Cells, Education and Technology Validation subprograms and coordinate with Systems Analysis and Systems Integration on an on-going basis.
Multi-Year Research, Development and Demonstration Plan Page 3.7 - 19
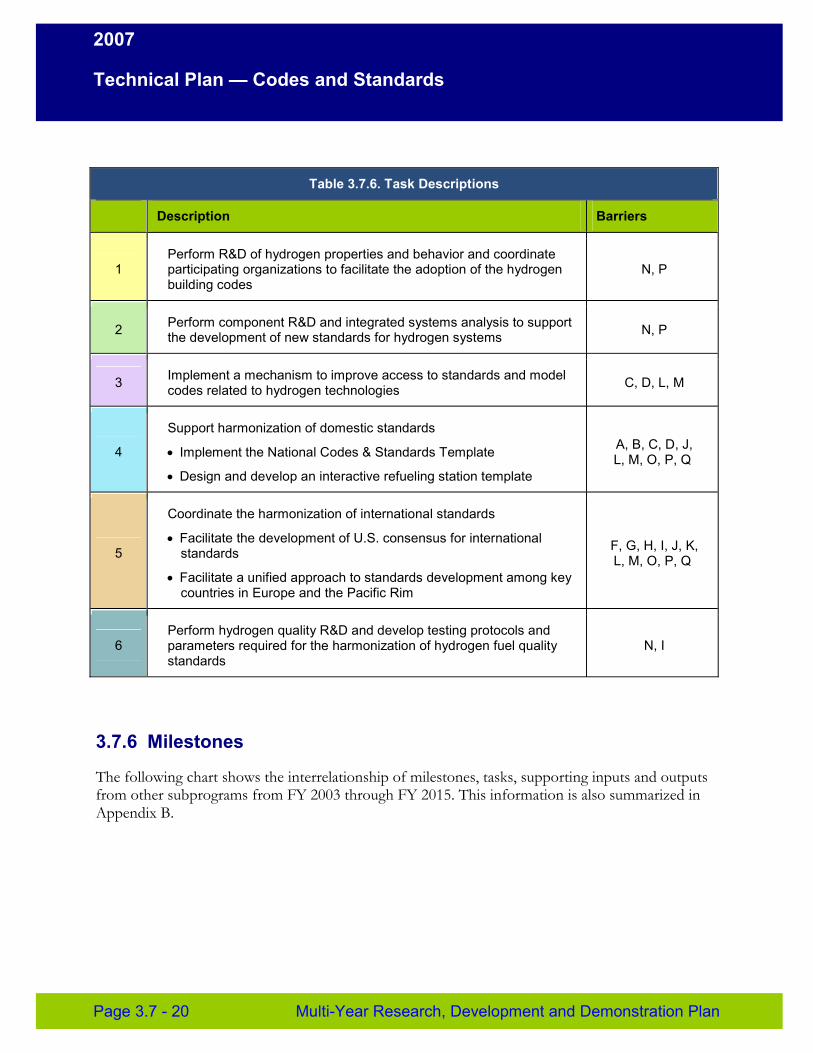
2007
Technical Plan — Codes and Standards
Table 3.7.6. Task Descriptions
Description Barriers
1 Perform R&D of hydrogen properties and behavior and coordinate participating organizations to facilitate the adoption of the hydrogen building codes
N, P
2 Perform component R&D and integrated systems analysis to support the development of new standards for hydrogen systems N, P
3 Implement a mechanism to improve access to standards and model codes related to hydrogen technologies C, D, L, M
4
Support harmonization of domestic standards
• Implement the National Codes & Standards Template
• Design and develop an interactive refueling station template
A, B, C, D, J, L, M, O, P, Q
5
Coordinate the harmonization of international standards
• Facilitate the development of U.S. consensus for international standards
• Facilitate a unified approach to standards development among key countries in Europe and the Pacific Rim
F, G, H, I, J, K, L, M, O, P, Q
6 Perform hydrogen quality R&D and develop testing protocols and parameters required for the harmonization of hydrogen fuel quality standards
N, I
3.7.6 Milestones
The following chart shows the interrelationship of milestones, tasks, supporting inputs and outputs from other subprograms from FY 2003 through FY 2015. This information is also summarized in Appendix B.
Page 3.7 - 20 Multi-Year Research, Development and Demonstration Plan
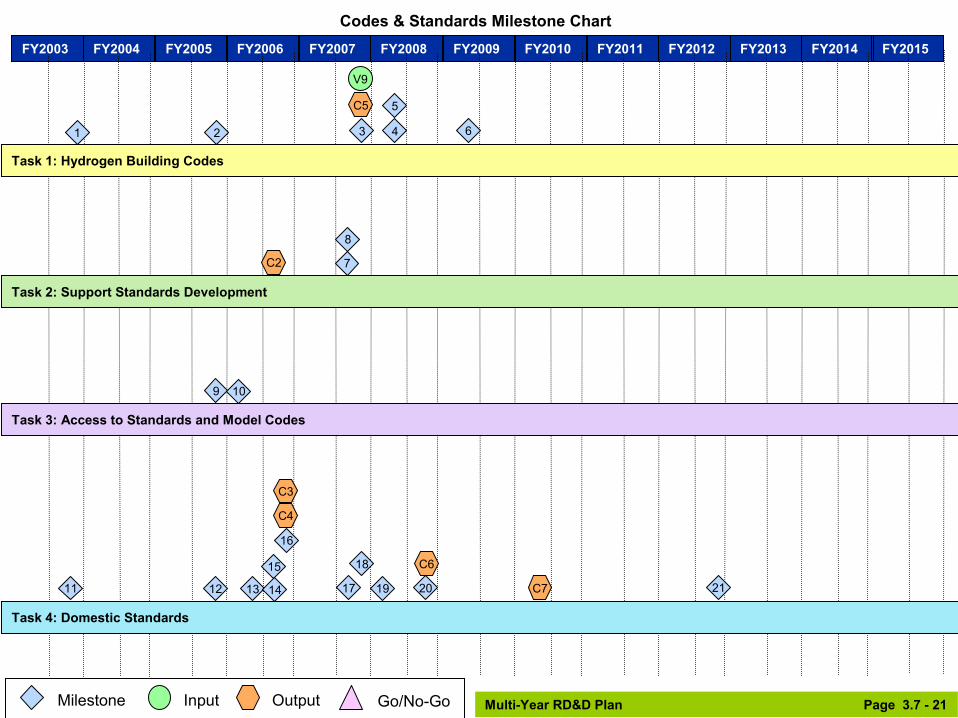
Codes & Standards Milestone Chart FY2003 FY2004 FY2005 FY2006 FY2007 FY2008 FY2009 FY2010 FY2011 FY2012 FY2013 FY2014 FY2015
Milestone Input Output Go/No-Go
Task 1: Hydrogen Building Codes
1 2 3
Task 2: Support Standards Development
4
5
6
7
8
9
19 2120
Task 3: Access to Standards and Model Codes
10
Task 4: Domestic Standards
11 1312
15
14
18 17
16
C2
C5
C4
C3
C6
C7
V9
Multi-Year RD&D Plan Page 3.7 - 21
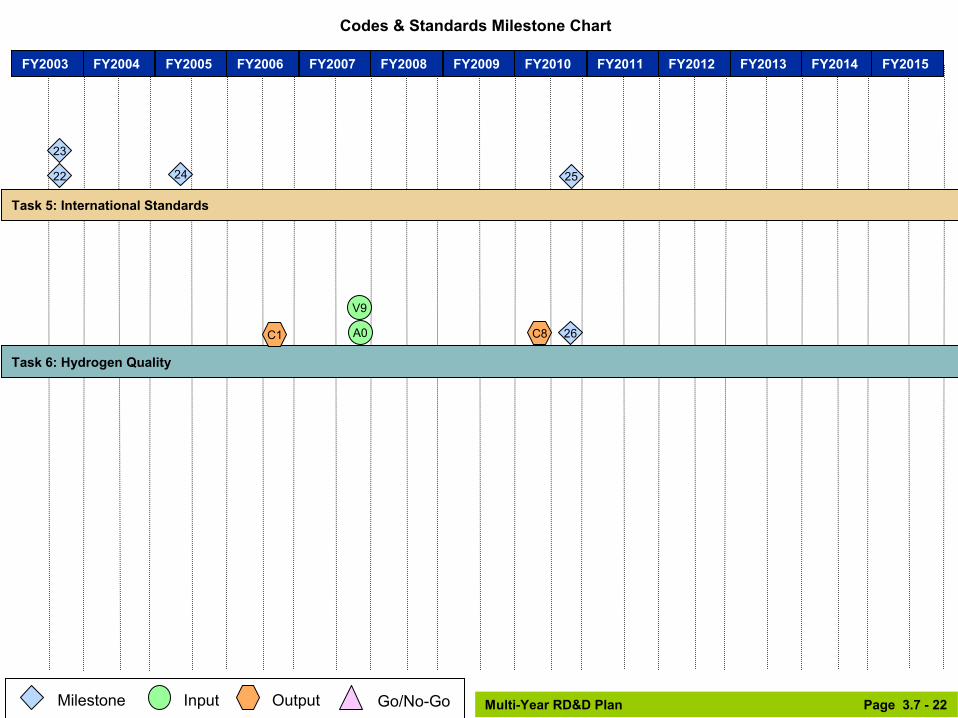
Codes & Standards Milestone Chart
FY2003 FY2004 FY2005 FY2006 FY2007 FY2008 FY2009 FY2010 FY2011 FY2012 FY2013 FY2014 FY2015
Task 6: Hydrogen Quality
C8
Task 5: International Standards
22
23
24 25
C1 26A0
V9
Milestone Input Output Go/No-Go Multi-Year RD&D Plan Page 3.7 - 22
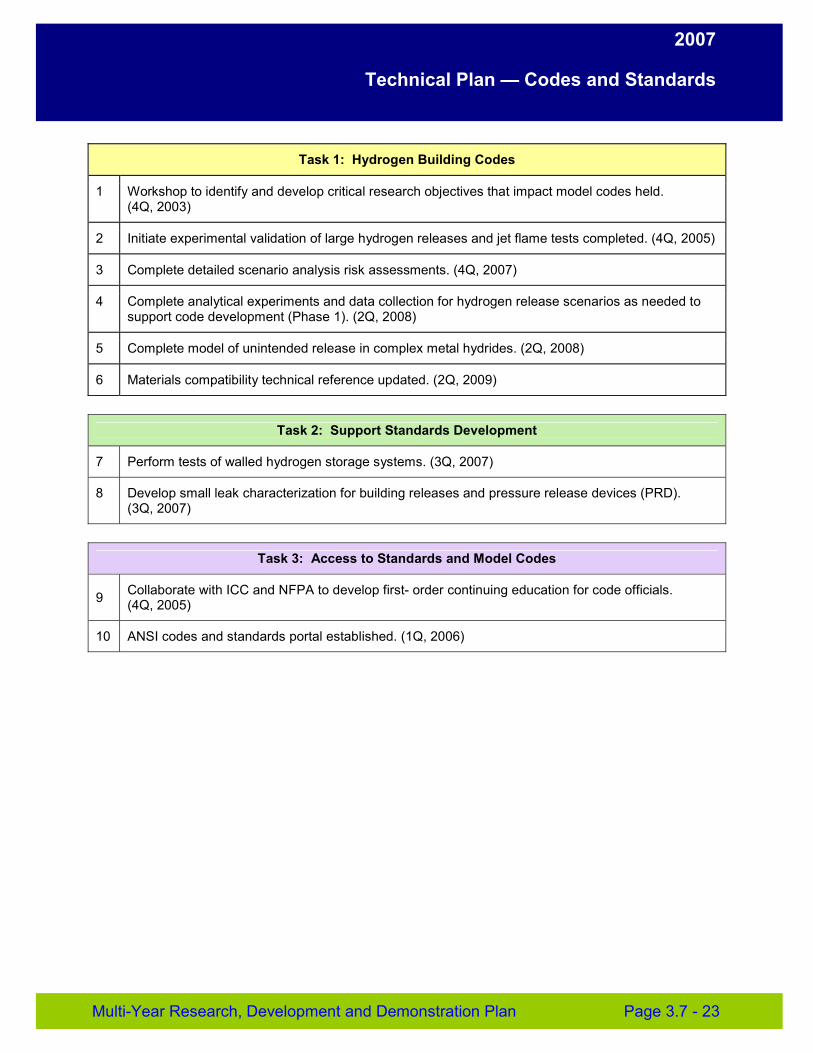
2007
Technical Plan — Codes and Standards
Task 1: Hydrogen Building Codes
1 Workshop to identify and develop critical research objectives that impact model codes held. (4Q, 2003)
2 Initiate experimental validation of large hydrogen releases and jet flame tests completed. (4Q, 2005)
3 Complete detailed scenario analysis risk assessments. (4Q, 2007)
4 Complete analytical experiments and data collection for hydrogen release scenarios as needed to support code development (Phase 1). (2Q, 2008)
5 Complete model of unintended release in complex metal hydrides. (2Q, 2008)
6 Materials compatibility technical reference updated. (2Q, 2009)
Task 2: Support Standards Development
7 Perform tests of walled hydrogen storage systems. (3Q, 2007)
8 Develop small leak characterization for building releases and pressure release devices (PRD). (3Q, 2007)
Task 3: Access to Standards and Model Codes
9 Collaborate with ICC and NFPA to develop first- order continuing education for code officials. (4Q, 2005)
10 ANSI codes and standards portal established. (1Q, 2006)
Multi-Year Research, Development and Demonstration Plan Page 3.7 - 23
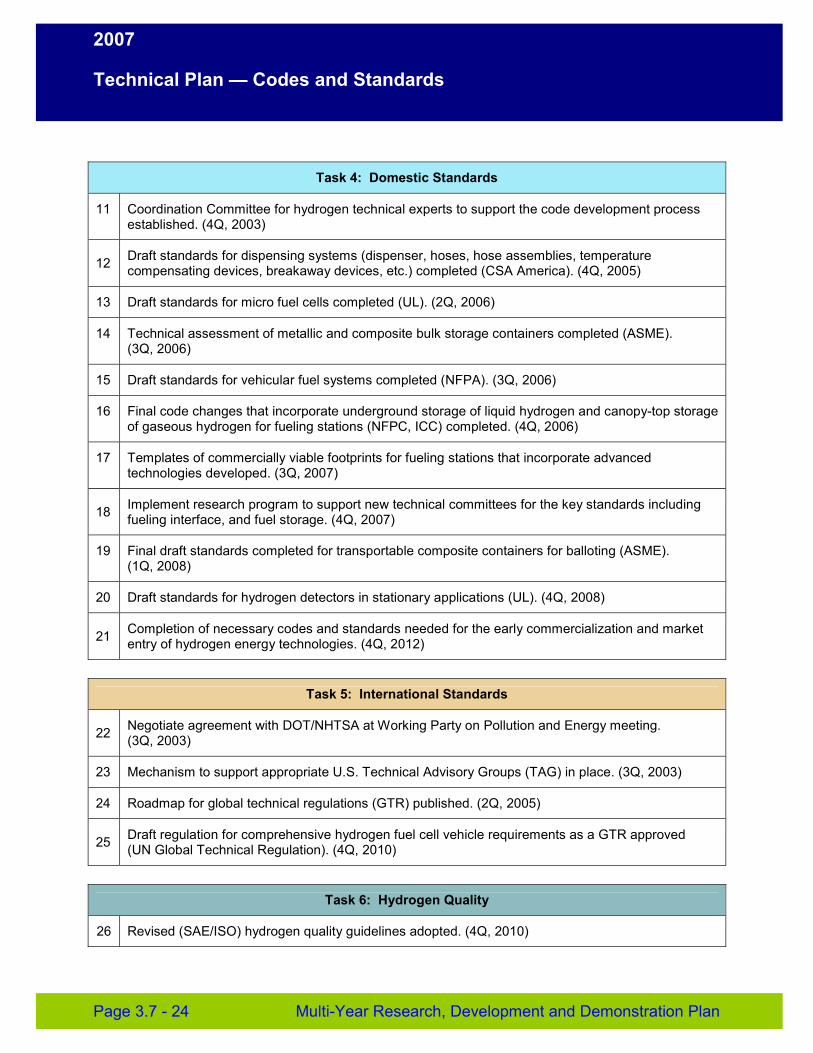
2007
Technical Plan — Codes and Standards
Task 4: Domestic Standards
11 Coordination Committee for hydrogen technical experts to support the code development process established. (4Q, 2003)
12 Draft standards for dispensing systems (dispenser, hoses, hose assemblies, temperature compensating devices, breakaway devices, etc.) completed (CSA America). (4Q, 2005)
13 Draft standards for micro fuel cells completed (UL). (2Q, 2006)
14 Technical assessment of metallic and composite bulk storage containers completed (ASME). (3Q, 2006)
15 Draft standards for vehicular fuel systems completed (NFPA). (3Q, 2006)
16 Final code changes that incorporate underground storage of liquid hydrogen and canopy-top storage of gaseous hydrogen for fueling stations (NFPC, ICC) completed. (4Q, 2006)
17 Templates of commercially viable footprints for fueling stations that incorporate advanced technologies developed. (3Q, 2007)
18 Implement research program to support new technical committees for the key standards including fueling interface, and fuel storage. (4Q, 2007)
19 Final draft standards completed for transportable composite containers for balloting (ASME). (1Q, 2008)
20 Draft standards for hydrogen detectors in stationary applications (UL). (4Q, 2008)
21 Completion of necessary codes and standards needed for the early commercialization and market entry of hydrogen energy technologies. (4Q, 2012)
Task 5: International Standards
22 Negotiate agreement with DOT/NHTSA at Working Party on Pollution and Energy meeting. (3Q, 2003)
23 Mechanism to support appropriate U.S. Technical Advisory Groups (TAG) in place. (3Q, 2003)
24 Roadmap for global technical regulations (GTR) published. (2Q, 2005)
25 Draft regulation for comprehensive hydrogen fuel cell vehicle requirements as a GTR approved (UN Global Technical Regulation). (4Q, 2010)
Task 6: Hydrogen Quality
26 Revised (SAE/ISO) hydrogen quality guidelines adopted. (4Q, 2010)
Page 3.7 - 24 Multi-Year Research, Development and Demonstration Plan
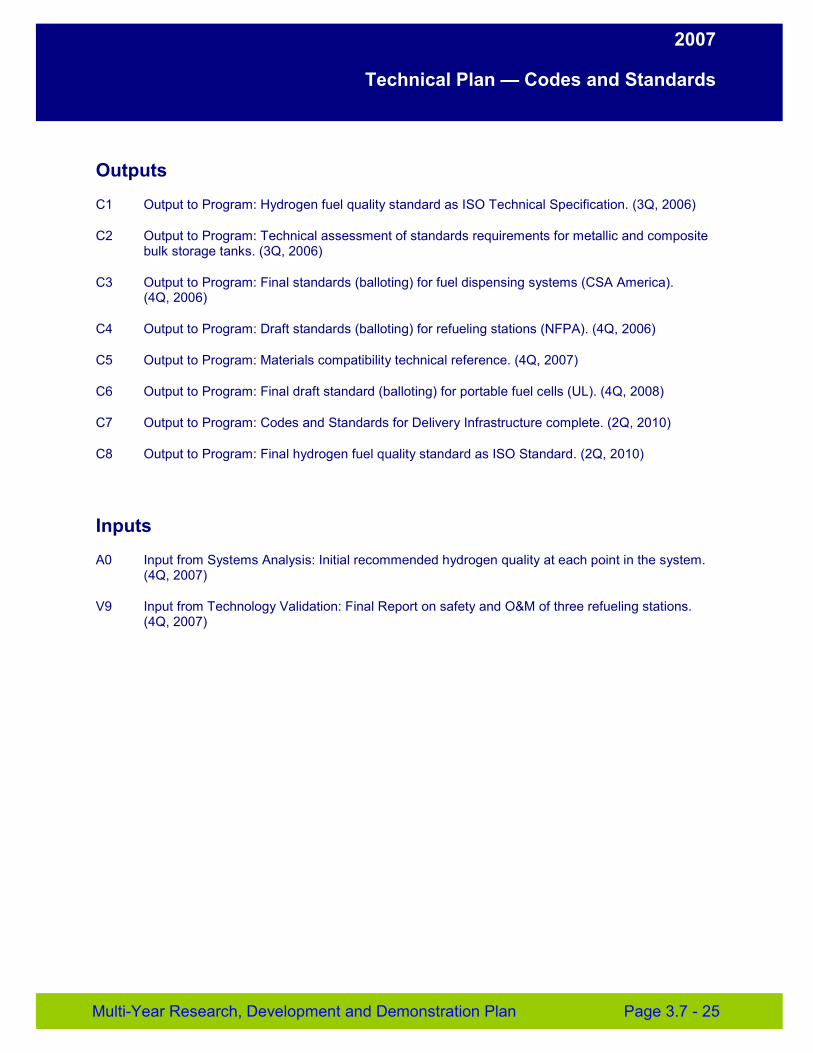
2007
Technical Plan — Codes and Standards
Outputs
C1 Output to Program: Hydrogen fuel quality standard as ISO Technical Specification. (3Q, 2006)
C2 Output to Program: Technical assessment of standards requirements for metallic and composite bulk storage tanks. (3Q, 2006)
C3 Output to Program: Final standards (balloting) for fuel dispensing systems (CSA America). (4Q, 2006)
C4 Output to Program: Draft standards (balloting) for refueling stations (NFPA). (4Q, 2006)
C5 Output to Program: Materials compatibility technical reference. (4Q, 2007)
C6 Output to Program: Final draft standard (balloting) for portable fuel cells (UL). (4Q, 2008)
C7 Output to Program: Codes and Standards for Delivery Infrastructure complete. (2Q, 2010)
C8 Output to Program: Final hydrogen fuel quality standard as ISO Standard. (2Q, 2010)
Inputs
A0 Input from Systems Analysis: Initial recommended hydrogen quality at each point in the system. (4Q, 2007)
V9 Input from Technology Validation: Final Report on safety and O&M of three refueling stations. (4Q, 2007)
Multi-Year Research, Development and Demonstration Plan Page 3.7 - 25
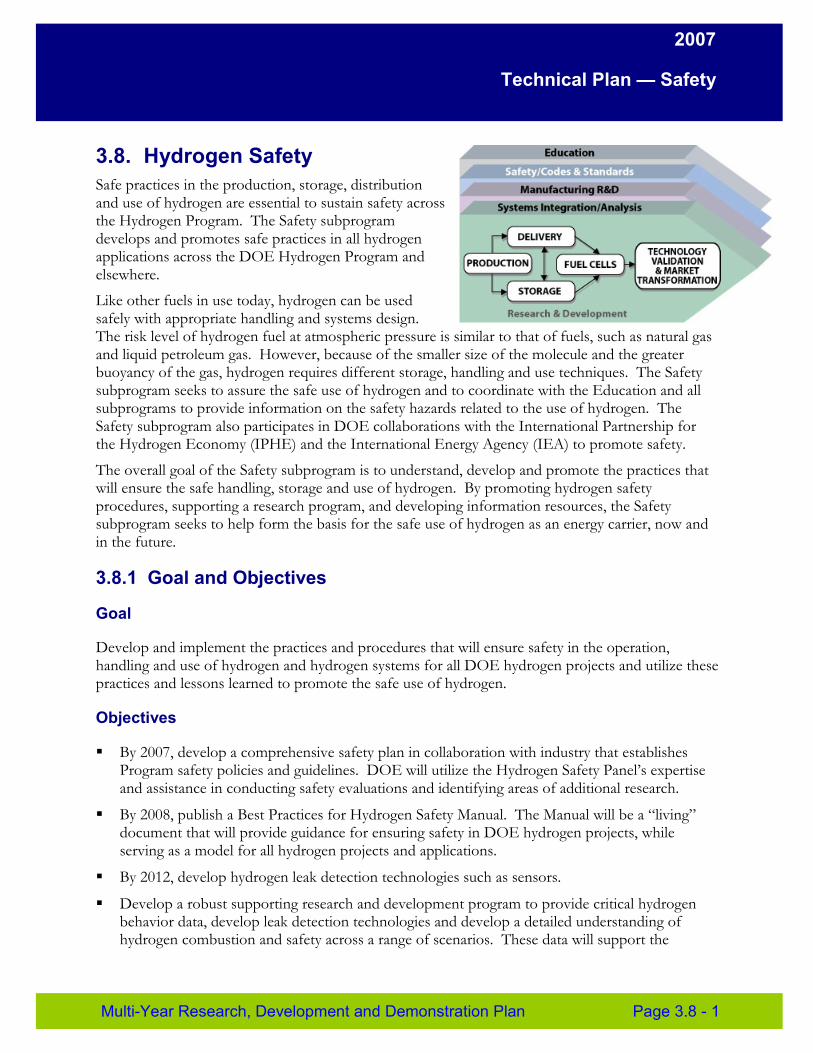
2007
Technical Plan — Safety
3.8. Hydrogen Safety Safe practices in the production, storage, distribution and use of hydrogen are essential to sustain safety across the Hydrogen Program. The Safety subprogram develops and promotes safe practices in all hydrogen applications across the DOE Hydrogen Program and elsewhere.
Like other fuels in use today, hydrogen can be used safely with appropriate handling and systems design. The risk level of hydrogen fuel at atmospheric pressure is similar to that of fuels, such as natural gas and liquid petroleum gas. However, because of the smaller size of the molecule and the greater buoyancy of the gas, hydrogen requires different storage, handling and use techniques. The Safety subprogram seeks to assure the safe use of hydrogen and to coordinate with the Education and all subprograms to provide information on the safety hazards related to the use of hydrogen. The Safety subprogram also participates in DOE collaborations with the International Partnership for the Hydrogen Economy (IPHE) and the International Energy Agency (IEA) to promote safety.
The overall goal of the Safety subprogram is to understand, develop and promote the practices that will ensure the safe handling, storage and use of hydrogen. By promoting hydrogen safety procedures, supporting a research program, and developing information resources, the Safety subprogram seeks to help form the basis for the safe use of hydrogen as an energy carrier, now and in the future.
3.8.1 Goal and Objectives
Goal
Develop and implement the practices and procedures that will ensure safety in the operation, handling and use of hydrogen and hydrogen systems for all DOE hydrogen projects and utilize these practices and lessons learned to promote the safe use of hydrogen.
Objectives
� By 2007, develop a comprehensive safety plan in collaboration with industry that establishes Program safety policies and guidelines. DOE will utilize the Hydrogen Safety Panel’s expertise and assistance in conducting safety evaluations and identifying areas of additional research.
� By 2008, publish a Best Practices for Hydrogen Safety Manual. The Manual will be a “living” document that will provide guidance for ensuring safety in DOE hydrogen projects, while serving as a model for all hydrogen projects and applications.
� By 2012, develop hydrogen leak detection technologies such as sensors.
� Develop a robust supporting research and development program to provide critical hydrogen behavior data, develop leak detection technologies and develop a detailed understanding of hydrogen combustion and safety across a range of scenarios. These data will support the
Multi-Year Research, Development and Demonstration Plan Page 3.8 - 1
2007
Technical Plan — Safety
establishment of setback distances in building codes and minimize the overall data gaps in codes and standards development.
� Promote widespread sharing of safety-related information, procedures and lessons learned with first responders, authorities having jurisdiction and other stakeholders.
3.8.2 Approach
Safety Management
The continued safe operation, handling and use of hydrogen and related systems require comprehensive safety management. In response to recommendations by the National Research Council, the Safety subprogram will develop a comprehensive safety plan to outline protocols to promote safety in all DOE-funded hydrogen projects through communication among DOE Hydrogen Program management, subprograms and projects.
In addition to the efforts of the subprograms and individual project managers, DOE pursues project safety through the efforts of the Pacific Northwest National Laboratory (PNNL) and its Hydrogen Safety Panel. Supported by the Hydrogen Safety Panel, PNNL provides recommendations on safety and hazard mitigation to the DOE Hydrogen Program on its activities and projects. With experts from the insurance, fire safety, fuel provider, automaker, aerospace, engineering and other industries, the Panel possesses well over 100 years of collective safety experience. Its objectives are to help identify safety concerns; determine current status of regulations, policies, codes, standards and guidelines and provide a platform to discuss critical hydrogen safety issues. Through independent assessments of safety plans, telephone interviews and site visits, the Panel identifies alternative safety practices and needs for additional analysis or review.
Safety Research and Development
Data and its classification present a number of challenges for hydrogen use. For example, the way hydrogen is classified throughout the world is inconsistent. Some countries, including the U.S., currently classify hydrogen as a hazardous material without the necessary regulations in place that allow the common use of it as a fuel. The subprogram will work to develop the scientific basis to promote the adoption of hydrogen regulations that facilitate its use as a fuel, as is done with other common fuels such as gasoline. (Fuels such as gasoline are also considered hazardous materials, but regulations are in place that allow the common use of it as a fuel.)
Additional data needs exist for the commercial use of hydrogen beyond its historical use as a feedstock chemical. In addition, safety-related information, often corresponding to company-specific chemical processes and handling procedures, has been treated as proprietary. The widespread availability and communication of safety-related information will be crucial to ensure safe operation of future hydrogen fuel systems.
Although safety-by-design and passive mitigation systems are preferred, it will still be necessary to develop technologies to detect hydrogen releases and system failures. This subprogram will develop hydrogen sensors with the appropriate response time (See Table 3.8.2), sensitivity and accuracy for use in safety applications to reduce risk and help establish public confidence.
Page 3.8 - 2 Multi-Year Research, Development and Demonstration Plan
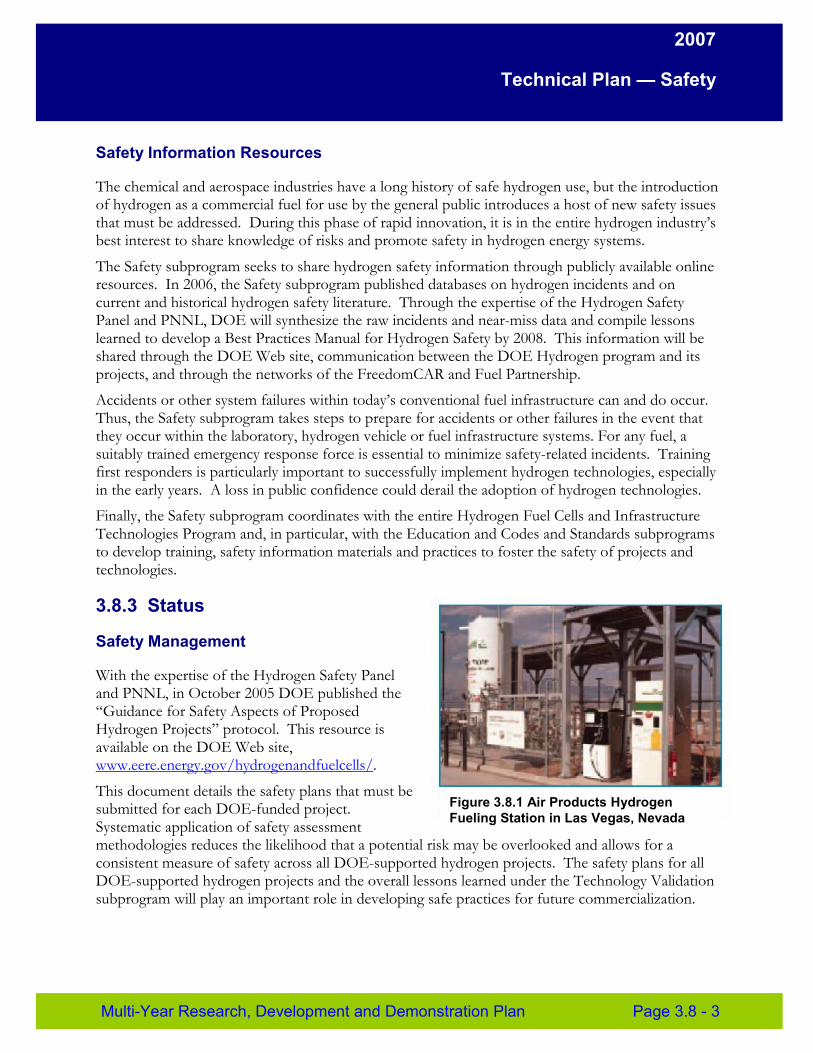
2007
Technical Plan — Safety
Safety Information Resources
The chemical and aerospace industries have a long history of safe hydrogen use, but the introduction of hydrogen as a commercial fuel for use by the general public introduces a host of new safety issues that must be addressed. During this phase of rapid innovation, it is in the entire hydrogen industry’s best interest to share knowledge of risks and promote safety in hydrogen energy systems.
The Safety subprogram seeks to share hydrogen safety information through publicly available online resources. In 2006, the Safety subprogram published databases on hydrogen incidents and on current and historical hydrogen safety literature. Through the expertise of the Hydrogen Safety Panel and PNNL, DOE will synthesize the raw incidents and near-miss data and compile lessons learned to develop a Best Practices Manual for Hydrogen Safety by 2008. This information will be shared through the DOE Web site, communication between the DOE Hydrogen program and its projects, and through the networks of the FreedomCAR and Fuel Partnership.
Accidents or other system failures within today’s conventional fuel infrastructure can and do occur. Thus, the Safety subprogram takes steps to prepare for accidents or other failures in the event that they occur within the laboratory, hydrogen vehicle or fuel infrastructure systems. For any fuel, a suitably trained emergency response force is essential to minimize safety-related incidents. Training first responders is particularly important to successfully implement hydrogen technologies, especially in the early years. A loss in public confidence could derail the adoption of hydrogen technologies.
Finally, the Safety subprogram coordinates with the entire Hydrogen Fuel Cells and Infrastructure Technologies Program and, in particular, with the Education and Codes and Standards subprograms to develop training, safety information materials and practices to foster the safety of projects and technologies.
3.8.3 Status
Safety Management
With the expertise of the Hydrogen Safety Panel and PNNL, in October 2005 DOE published the “Guidance for Safety Aspects of Proposed Hydrogen Projects” protocol. This resource is available on the DOE Web site, www.eere.energy.gov/hydrogenandfuelcells/.
This document details the safety plans that must be submitted for each DOE-funded project. Systematic application of safety assessment
Figure 3.8.1 Air Products Hydrogen Fueling Station in Las Vegas, Nevada
methodologies reduces the likelihood that a potential risk may be overlooked and allows for a consistent measure of safety across all DOE-supported hydrogen projects. The safety plans for all DOE-supported hydrogen projects and the overall lessons learned under the Technology Validation subprogram will play an important role in developing safe practices for future commercialization.
Multi-Year Research, Development and Demonstration Plan Page 3.8 - 3
2007
Technical Plan — Safety
In March 2004, the Hydrogen Safety Panel conducted its first site visit at the Las Vegas Hydrogen Energy Station in Nevada, shown in Figure 3.8.1. Review teams, consisting of Panel members, work with principal investigators and their teams through scheduled site visits and provide their evaluations to PNNL, which then reports to and provides safety recommendations to DOE. Project teams draw on the Panel’s expertise to help resolve safety issues associated with the use of hydrogen and hydrogen-related systems. By the end of March 2006, the Panel had completed thirteen site visits. The Hydrogen, Fuel Cells & Infrastructure Technologies Program, PNNL and the Panel will continue to select a portfolio of projects for safety review.
Safety Research and Development
To provide technical data for hydrogen codes and standards, the Safety subprogram supports research such as the materials compatibility, hydrogen behavior and risk assessment studies conducted by Sandia National Laboratory. The online Technical Reference for Hydrogen Compatibility of Materials contains data collected from the literature and generated from materials testing. Information for 15 material classes will be published in 2007 and made available at www.ca.sandia.gov/matlsTechRef/. Sections on pressure vessel steels, pipeline steels and aluminum alloys will be added in the future. Sandia also conducts research on the behavior of hydrogen releases and develops quantitative risk assessments to evaluate credible hydrogen safety scenarios.
Information Resources
The Safety subprogram also focuses on information, materials and training facilities that are critical for the commercialization of hydrogen energy technologies. To help fill the void of publicly available hydrogen safety data, in 2006 DOE published two online hydrogen safety information resources: the Hydrogen Incidents Database and the Safety Bibliographic Database. The Hydrogen Incidents Database, developed by PNNL, catalogs all hydrogen incidents and near-misses at DOE-funded projects and elsewhere. All the reports include details of the incidents and are non-attributed to ensure anonymity. This resource is available at www.h2incidents.org.The Safety Bibliographic Database, developed by the National Renewable Energy Laboratory, was established in response to a recommendation from the National Research Council. The Safety Bibliographic Database contains over 400 publicly available hydrogen safety-related reports, papers, and presentations, allowing researchers, code officials, and stakeholders to learn from the experiences of others, and is available at www.hydrogen.energy.gov/biblio_database.html.
Page 3.8 - 4 Multi-Year Research, Development and Demonstration Plan
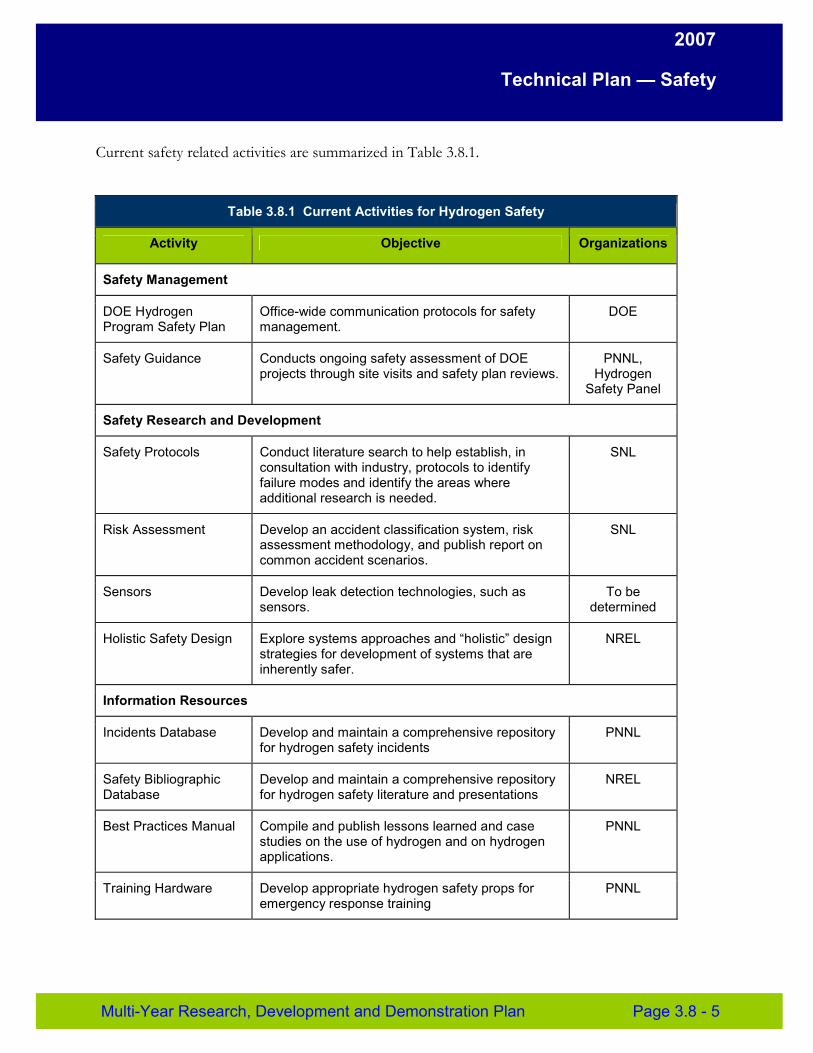
2007
Technical Plan — Safety
Current safety related activities are summarized in Table 3.8.1.
Table 3.8.1 Current Activities for Hydrogen Safety
Activity Objective Organizations
Safety Management
DOE Hydrogen Program Safety Plan
Office-wide communication protocols for safety management.
DOE
Safety Guidance Conducts ongoing safety assessment of DOE projects through site visits and safety plan reviews.
PNNL, Hydrogen
Safety Panel
Safety Research and Development
Safety Protocols Conduct literature search to help establish, in consultation with industry, protocols to identify failure modes and identify the areas where additional research is needed.
SNL
Risk Assessment Develop an accident classification system, risk assessment methodology, and publish report on common accident scenarios.
SNL
Sensors Develop leak detection technologies, such as sensors.
To be determined
Holistic Safety Design Explore systems approaches and “holistic” design strategies for development of systems that are inherently safer.
NREL
Information Resources
Incidents Database Develop and maintain a comprehensive repository for hydrogen safety incidents
PNNL
Safety Bibliographic Database
Develop and maintain a comprehensive repository for hydrogen safety literature and presentations
NREL
Best Practices Manual Compile and publish lessons learned and case studies on the use of hydrogen and on hydrogen applications.
PNNL
Training Hardware Develop appropriate hydrogen safety props for emergency response training
PNNL
Multi-Year Research, Development and Demonstration Plan Page 3.8 - 5
2007
Technical Plan — Safety
3.8.4 Challenges
Developing a comprehensive safety plan is a challenge, in part, because the safety information on hydrogen components and systems is often limited to industrial practice. Companies develop practices to comply with federal regulations and meet the criteria of their insurance providers. Therefore, the scientific and technical basis for established industrial training practices is not always publicly available, perhaps because of proprietary or liability concerns. In addition, any new safety information and practices may not be published.
Hydrogen’s tendency to leak presents a challenge to its storage and delivery. As a flammable gas, leakage creates a safety hazard. The Safety subprogram works with other subprograms to eliminate leakage, develop robust, reliable hydrogen leak detection technology with rapid response times and operability over a range of environmental conditions and develop design principles that mitigate the effects of hydrogen leakage.
There is a general lack of understanding of hydrogen and hydrogen safety needs among local government officials, fire marshals and the general public. In some cases, public opposition to siting hydrogen refueling stations has occurred, at times preventing operation of a facility. In other cases, the local regulatory authority may view one or more hydrogen properties (e.g. hydrogen gas is flammable at low concentrations) in isolation without considering other characteristics that could mitigate danger (e.g., hydrogen’s tendency to rapidly disperse once released). Failure to comprehensively consider hydrogen’s properties may lead to over-restrictive policies that preclude implementation.
The general public may be receiving limited or inaccurate information. To date, there is no comprehensive handbook containing best practices for hydrogen safety. Once mandatory reporting is established for safety and reliability, training will be required to educate government officials. Additionally, the data assessing the safety of hydrogen systems must meet the needs of insurance providers and other stakeholders. This subprogram is working to fill these gaps through R&D, training and tracking of safety-related incidents and lessons learned to help foster best practices.
The technical challenges discussed elsewhere in this RD&D program plan must be overcome with solutions that are reliable, safe and cost-effective. System safety must be convincingly communicated to crucial enablers of the technology, such as regulatory authorities and the public at large.
Targets
Most hydrogen safety R&D projects are exploratory in nature and do not have technical targets. In the U.S., this safety data is then voluntarily adopted into codes and standards through a consensus-based, industry-led process (see Section 3.7). An exception to the lack of targets is the R&D of hydrogen safety sensors, for which performance targets can be set (see Table 3.8.2).
Page 3.8 - 6 Multi-Year Research, Development and Demonstration Plan
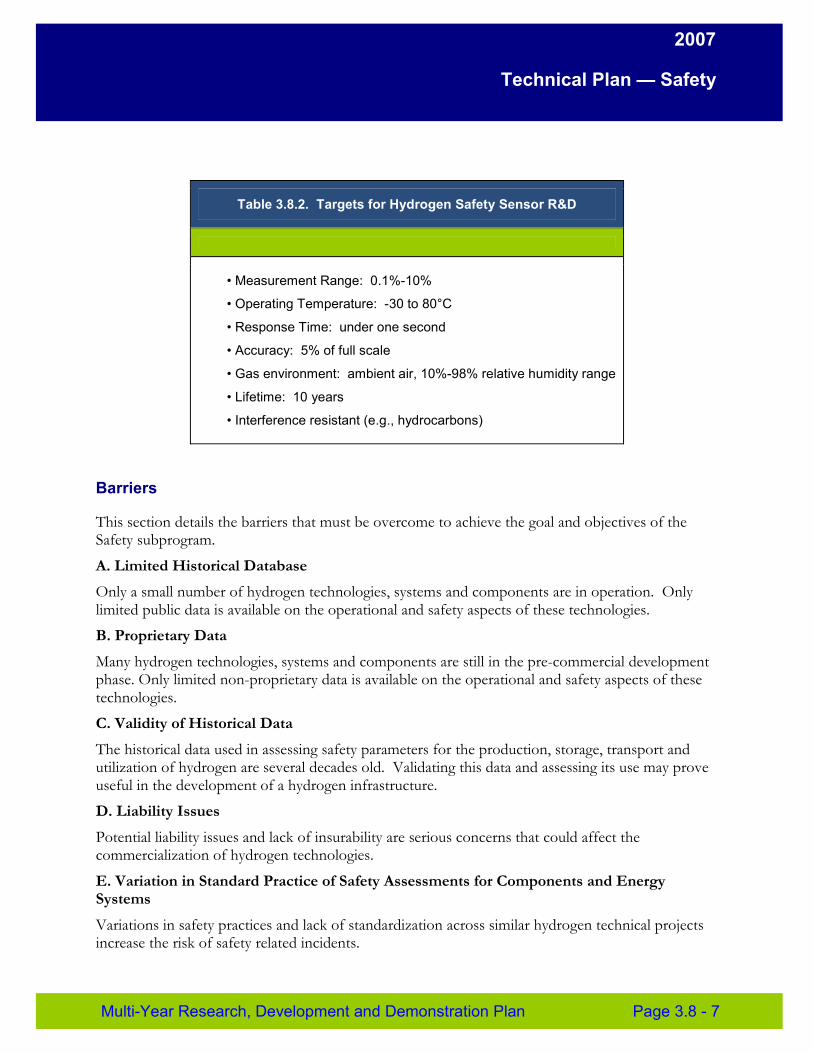
2007
Technical Plan — Safety
Table 3.8.2. Targets for Hydrogen Safety Sensor R&D
• Measurement Range: 0.1%-10%
• Operating Temperature: -30 to 80°C
• Response Time: under one second
• Accuracy: 5% of full scale
• Gas environment: ambient air, 10%-98% relative humidity range
• Lifetime: 10 years
• Interference resistant (e.g., hydrocarbons)
Barriers
This section details the barriers that must be overcome to achieve the goal and objectives of the Safety subprogram.
A. Limited Historical Database
Only a small number of hydrogen technologies, systems and components are in operation. Only limited public data is available on the operational and safety aspects of these technologies.
B. Proprietary Data
Many hydrogen technologies, systems and components are still in the pre-commercial development phase. Only limited non-proprietary data is available on the operational and safety aspects of these technologies.
C. Validity of Historical Data
The historical data used in assessing safety parameters for the production, storage, transport and utilization of hydrogen are several decades old. Validating this data and assessing its use may prove useful in the development of a hydrogen infrastructure.
D. Liability Issues
Potential liability issues and lack of insurability are serious concerns that could affect the commercialization of hydrogen technologies.
E. Variation in Standard Practice of Safety Assessments for Components and Energy Systems
Variations in safety practices and lack of standardization across similar hydrogen technical projects increase the risk of safety related incidents.
Multi-Year Research, Development and Demonstration Plan Page 3.8 - 7
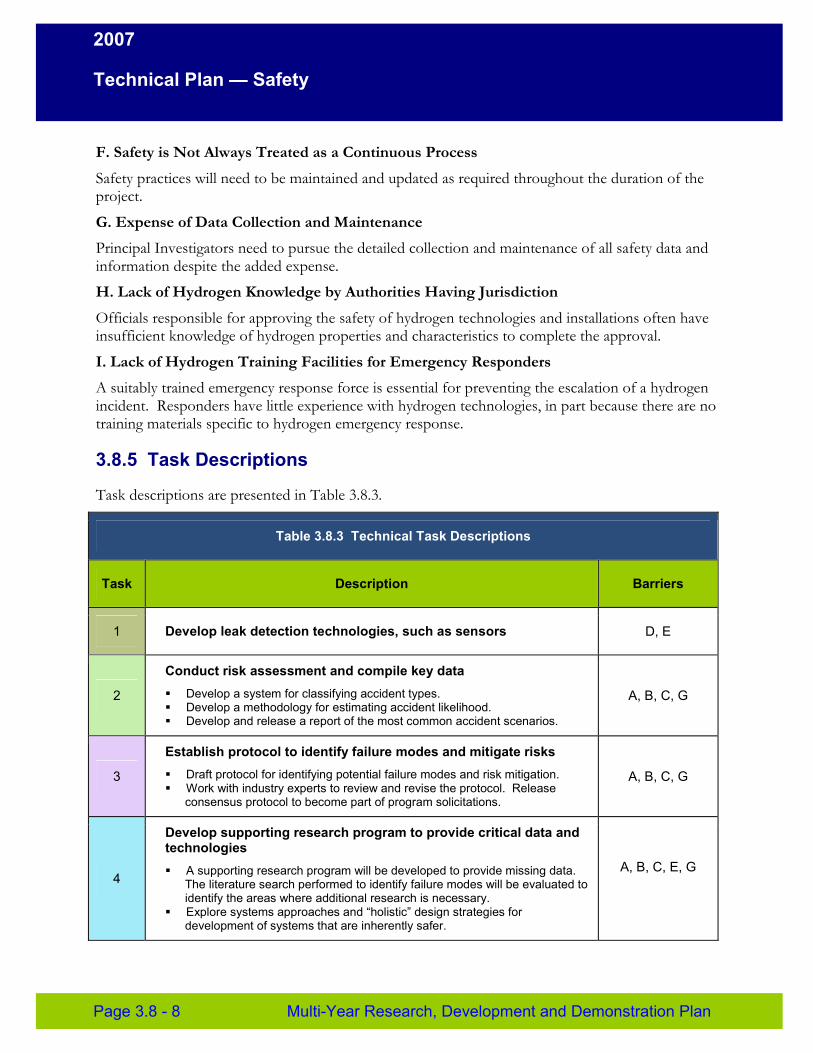
2007
Technical Plan — Safety
F. Safety is Not Always Treated as a Continuous Process
Safety practices will need to be maintained and updated as required throughout the duration of the project.
G. Expense of Data Collection and Maintenance
Principal Investigators need to pursue the detailed collection and maintenance of all safety data and information despite the added expense.
H. Lack of Hydrogen Knowledge by Authorities Having Jurisdiction
Officials responsible for approving the safety of hydrogen technologies and installations often have insufficient knowledge of hydrogen properties and characteristics to complete the approval.
I. Lack of Hydrogen Training Facilities for Emergency Responders
A suitably trained emergency response force is essential for preventing the escalation of a hydrogen incident. Responders have little experience with hydrogen technologies, in part because there are no training materials specific to hydrogen emergency response.
3.8.5 Task Descriptions
Task descriptions are presented in Table 3.8.3.
Table 3.8.3 Technical Task Descriptions
Task Description Barriers
1 Develop leak detection technologies, such as sensors D, E
2
Conduct risk assessment and compile key data � Develop a system for classifying accident types. � Develop a methodology for estimating accident likelihood. � Develop and release a report of the most common accident scenarios.
A, B, C, G
3
Establish protocol to identify failure modes and mitigate risks � Draft protocol for identifying potential failure modes and risk mitigation. � Work with industry experts to review and revise the protocol. Release
consensus protocol to become part of program solicitations.
A, B, C, G
4
Develop supporting research program to provide critical data and technologies � A supporting research program will be developed to provide missing data.
The literature search performed to identify failure modes will be evaluated to identify the areas where additional research is necessary.
� Explore systems approaches and “holistic” design strategies for development of systems that are inherently safer.
A, B, C, E, G
Page 3.8 - 8 Multi-Year Research, Development and Demonstration Plan
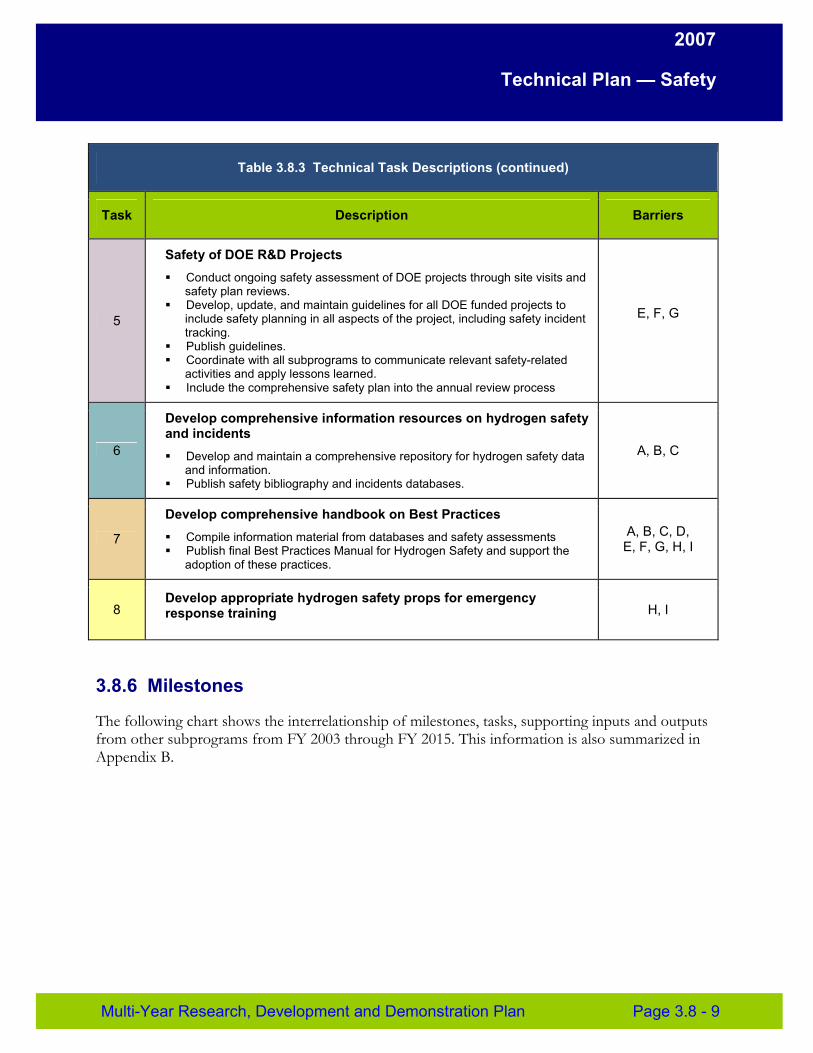
2007
Technical Plan — Safety
Task
Table 3.8.3 Technical Task Descriptions (continued)
Description Barriers
5
Safety of DOE R&D Projects � Conduct ongoing safety assessment of DOE projects through site visits and
safety plan reviews. � Develop, update, and maintain guidelines for all DOE funded projects to
include safety planning in all aspects of the project, including safety incident tracking.
� Publish guidelines. � Coordinate with all subprograms to communicate relevant safety-related
activities and apply lessons learned. � Include the comprehensive safety plan into the annual review process
E, F, G
6
Develop comprehensive information resources on hydrogen safety and incidents � Develop and maintain a comprehensive repository for hydrogen safety data
and information. � Publish safety bibliography and incidents databases.
A, B, C
7
Develop comprehensive handbook on Best Practices � Compile information material from databases and safety assessments � Publish final Best Practices Manual for Hydrogen Safety and support the
adoption of these practices.
A, B, C, D, E, F, G, H, I
8 Develop appropriate hydrogen safety props for emergency response training H, I
3.8.6 Milestones
The following chart shows the interrelationship of milestones, tasks, supporting inputs and outputs from other subprograms from FY 2003 through FY 2015. This information is also summarized in Appendix B.
Multi-Year Research, Development and Demonstration Plan Page 3.8 - 9
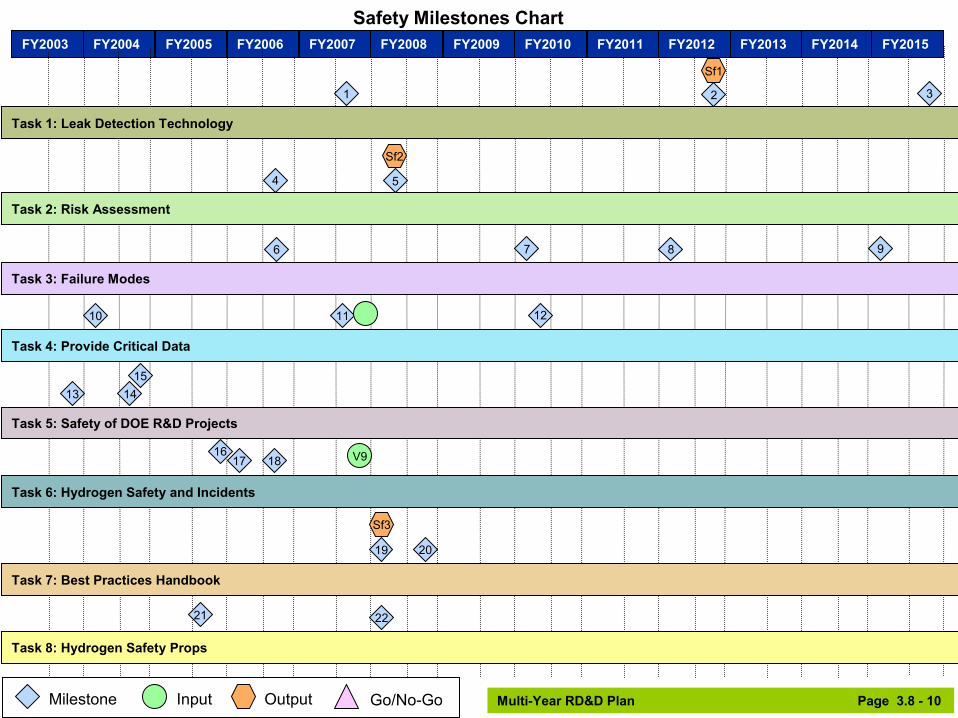
3
FY2003 FY2004 FY2005 FY2006
Safety Milestones Chart
Milestone Input Output Go/No-Go
FY2007 FY2008 FY2009 FY2010 FY2011 FY2012 FY2013 FY2014 FY2015
Task 1: Leak Detection Technology
1 2
Task 2: Risk Assessment
4 5
6 7 8 9
Multi-Year RD&D Plan Page 3.8 - 10
Task 3: Failure Modes
10 11 V9
Task 4: Provide Critical Data
12
Sf2
Sf1
Task 5: Safety of DOE R&D Projects
13
15
14
Task 6: Hydrogen Safety and Incidents
1817 V9
19 20
Task 7: Best Practices Handbook
Sf3
21 22
Task 8: Hydrogen Safety Props
16
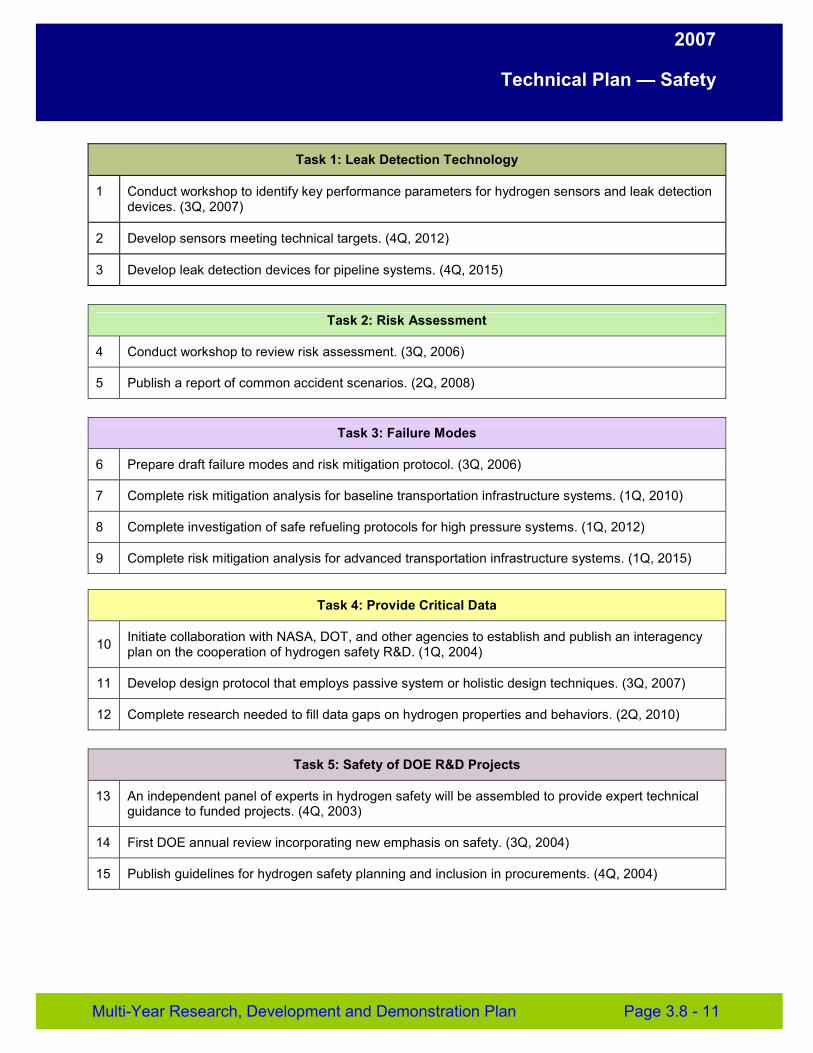
2007
Technical Plan — Safety
Task 1: Leak Detection Technology
1 Conduct workshop to identify key performance parameters for hydrogen sensors and leak detection devices. (3Q, 2007)
2 Develop sensors meeting technical targets. (4Q, 2012)
3 Develop leak detection devices for pipeline systems. (4Q, 2015)
Task 2: Risk Assessment
4 Conduct workshop to review risk assessment. (3Q, 2006)
5 Publish a report of common accident scenarios. (2Q, 2008)
Task 3: Failure Modes
6 Prepare draft failure modes and risk mitigation protocol. (3Q, 2006)
7 Complete risk mitigation analysis for baseline transportation infrastructure systems. (1Q, 2010)
8 Complete investigation of safe refueling protocols for high pressure systems. (1Q, 2012)
9 Complete risk mitigation analysis for advanced transportation infrastructure systems. (1Q, 2015)
Task 4: Provide Critical Data
10 Initiate collaboration with NASA, DOT, and other agencies to establish and publish an interagency plan on the cooperation of hydrogen safety R&D. (1Q, 2004)
11 Develop design protocol that employs passive system or holistic design techniques. (3Q, 2007)
12 Complete research needed to fill data gaps on hydrogen properties and behaviors. (2Q, 2010)
Task 5: Safety of DOE R&D Projects
13 An independent panel of experts in hydrogen safety will be assembled to provide expert technical guidance to funded projects. (4Q, 2003)
14 First DOE annual review incorporating new emphasis on safety. (3Q, 2004)
15 Publish guidelines for hydrogen safety planning and inclusion in procurements. (4Q, 2004)
Multi-Year Research, Development and Demonstration Plan Page 3.8 - 11
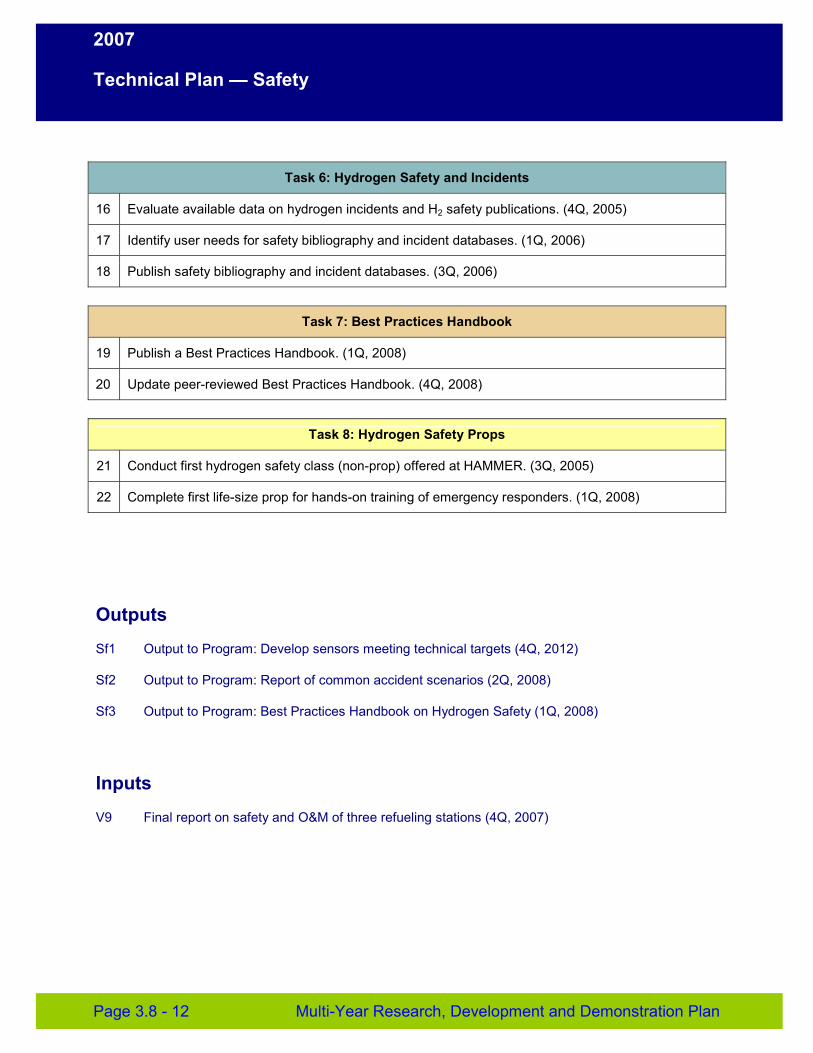
2007
Technical Plan — Safety
Task 6: Hydrogen Safety and Incidents
16 Evaluate available data on hydrogen incidents and H2 safety publications. (4Q, 2005)
17 Identify user needs for safety bibliography and incident databases. (1Q, 2006)
18 Publish safety bibliography and incident databases. (3Q, 2006)
Task 7: Best Practices Handbook
19 Publish a Best Practices Handbook. (1Q, 2008)
20 Update peer-reviewed Best Practices Handbook. (4Q, 2008)
Task 8: Hydrogen Safety Props
21 Conduct first hydrogen safety class (non-prop) offered at HAMMER. (3Q, 2005)
22 Complete first life-size prop for hands-on training of emergency responders. (1Q, 2008)
Outputs
Sf1 Output to Program: Develop sensors meeting technical targets (4Q, 2012)
Sf2 Output to Program: Report of common accident scenarios (2Q, 2008)
Sf3 Output to Program: Best Practices Handbook on Hydrogen Safety (1Q, 2008)
Inputs
V9 Final report on safety and O&M of three refueling stations (4Q, 2007)
Page 3.8 - 12 Multi-Year Research, Development and Demonstration Plan

2007
Technical Plan — Education
3.9 Education Expanding the use of hydrogen as an energy carrier requires a sustained education effort to lay the foundation for future commercial market introduction. Although hydrogen and fuel cells are considered l onger-term technologies, hydrogen fueling stations and fuel cell vehicles are entering the public space today through demonstration projects in certain regions of the country, and stationary fuel cells have already reach ed the commercial market in some niche applicatio ns. Current knowledge and awareness levels of hydrogen and fuel cells are low, however, and prevalent misunderstandings of hydrogen properties hav e effected negative opinions about the safe use of hydrogen as an energy carrier. Given the current and anticipated public visibility of hydrogen demonstration projects—and the correlation between knowledge and opinion—a carefully planned education program is needed.
The Hydrogen Education subprogram seeks to facilitate hydrogen and fuel cell demonstrations and support future commercialization by providing technically accurate and objective information to key target audiences both directly and indirectly involved in the use of hydrogen and fuel cells today. These audiences, identified in the National Hydrogen Energy Roadmap1, include safety and code officials, state and local government representatives, local communities and the public, and potential end users. Undergraduate and graduate students, professors, and middle and high school teachers and students comprise another important audience, as they are our Nation’s future researchers, scientists, engineers, technicians, and technology users.
3.9.1 Goal and Objectives
Goal
Educate key audiences about hydrogen and fuel cell technologies to facilitate near-term demonstration, commercialization, and long-term market acceptance.
Objectives
Hydrogen education objectives are based on a 2004 “baseline” Hydrogen Knowledge Survey. The baseline for each target population is defined as that population’s average score on the survey’s technical knowledge questions.
1 U.S. Department of Energy. National Hydrogen Energy Roadmap. November 2002. p. 36. Available on the web at www.hydrogen.energy.gov/roadmaps_vision.html.
Multi-Year Research, Development and Demonstration Plan Page 3.9 - 1
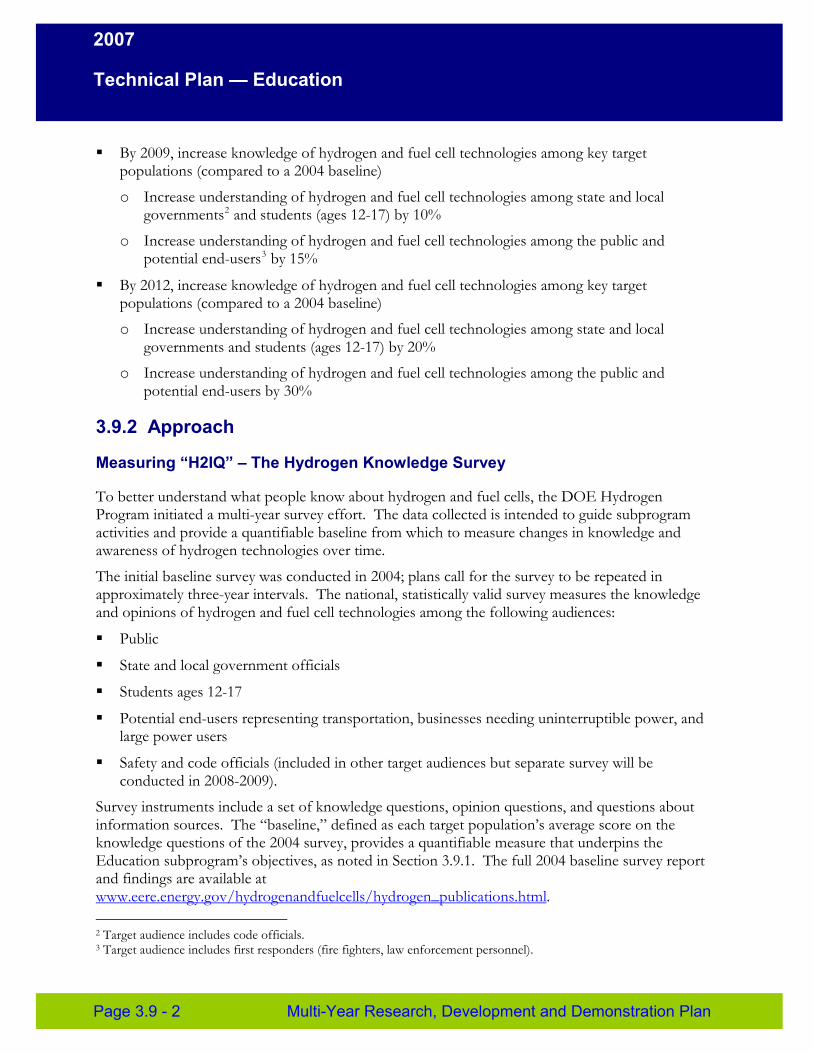
2007
Technical Plan — Education
� By 2009, increase knowledge of hydrogen and fuel cell technologies among key target populations (compared to a 2004 baseline)
o Increase understanding of hydrogen and fuel cell technologies among state and local governments2 and students (ages 12-17) by 10%
o Increase understanding of hydrogen and fuel cell technologies among the public and potential end-users3 by 15%
� By 2012, increase knowledge of hydrogen and fuel cell technologies among key target populations (compared to a 2004 baseline)
o Increase understanding of hydrogen and fuel cell technologies among state and local governments and students (ages 12-17) by 20%
o Increase understanding of hydrogen and fuel cell technologies among the public and potential end-users by 30%
3.9.2 Approach
Measuring “H2IQ” – The Hydrogen Knowledge Survey
To better understand what people know about hydrogen and fuel cells, the DOE Hydrogen Program initiated a multi-year survey effort. The data collected is intended to guide subprogram activities and provide a quantifiable baseline from which to measure changes in knowledge and awareness of hydrogen technologies over time.
The initial baseline survey was conducted in 2004; plans call for the survey to be repeated in approximately three-year intervals. The national, statistically valid survey measures the knowledge and opinions of hydrogen and fuel cell technologies among the following audiences:
� Public
� State and local government officials
� Students ages 12-17
� Potential end-users representing transportation, businesses needing uninterruptible power, and large power users
� Safety and code officials (included in other target audiences but separate survey will be conducted in 2008-2009).
Survey instruments include a set of knowledge questions, opinion questions, and questions about information sources. The “baseline,” defined as each target population’s average score on the knowledge questions of the 2004 survey, provides a quantifiable measure that underpins the Education subprogram’s objectives, as noted in Section 3.9.1. The full 2004 baseline survey report and findings are available at www.eere.energy.gov/hydrogenandfuelcells/hydrogen_publications.html.
2 Target audience includes code officials. 3 Target audience includes first responders (fire fighters, law enforcement personnel).
Page 3.9 - 2 Multi-Year Research, Development and Demonstration Plan

2007
Technical Plan — Education
Strategy
Developing hydrogen as a major energy carrier will require a combination of technological breakthroughs, market acceptance, and large investments in infrastructure. Success will not happen overnight, or even over years, but rather over decades; it will require an evolutionary process that phases hydrogen in as the technologies and their markets are ready. The coinciding education effort must also assume a phased and focused approach that considers technology readiness and the Hydrogen Program’s overall market transformation strategy.
In the near term, a national education effort or campaign risks overselling hydrogen and fuel cells before they are widely available. Instead, the Education subprogram will “follow the technology” and concentrate on areas where hydrogen and fuel cells are (or soon will be) publicly visible through demonstration projects or early niche market commercialization efforts. As the Hydrogen Program’s market transformation strategy develops, the Education subprogram must develop and evolve as well, to align with plans for hydrogen and fuel cell technology introduction.
In addition, as of March 2006, nearly thirty states are represented by a state or regional hydrogen or fuel cell initiative. The Education subprogram activities will support those efforts by providing a consistent message, readily available information resources, and other activities, as appropriate.
The Education subprogram includes the development and dissemination of information resources as well as training and relies on partnerships to leverage limited resources and extend the reach of its efforts.
• Educational Materials and Information Resources This includes traditional print materials, such as fact sheets, as well as information available on the web, on CD, and via other forms of media including audio and video. Careful attention must be given to cost, as well as the traditional forms of media/information delivery to which target audiences are accustomed. The primary distribution mechanism for hydrogen education materials will be the Program website, via web pages, databases, electronic files of hard copy documents, and other interactive tools or resources. The Education subprogram will also rely on the DOE Energy Efficiency and Renewable Energy Information Center for hard copy distribution and response to simple information inquiries. The Information Center is a free public service provided by EERE; anyone interested can call 877-EERE-INF(O)/877-337-3463 to request hard copies of Program materials (in stock; documents less than 4 pages in length can be printed on demand). Users can also request copies through an on-line catalog available at www.eere.energy.gov/hydrogenandfuelcells/resources.html.
• Training In-person training via workshops or seminars can be an effective mode of targeted information delivery, as it essentially guarantees a captive audience with little distraction and allows for additional “unplanned” learning through interaction between and among the instructor and students. In-person training is expensive, however, and will be considered as budget allows and only for the areas with the greatest need (both geographic and topical, to align with Hydrogen Program market
Multi-Year Research, Development and Demonstration Plan Page 3.9 - 3
2007
Technical Plan — Education
transformation plans). Online training through web casts and “webinars” will be considered as an alternative to increase the number of training opportunities provided and extend the reach of DOE-funded efforts to a larger audience.
• Partnerships and Collaboration Coordination with other entities helps to ensure effective use of taxpayer dollars by avoiding duplication and leveraging resources to achieve common goals. Partnership with other organizations can also provide a distribution mechanism for DOE-developed educational materials and information resources. The Education subprogram will rely on strategic partnerships with trade associations, states, state and regional initiatives, related programs within DOE, federal agencies, international partners (through the International Partnership for the Hydrogen Economy and International Energy Agency), and others to extend the reach of its efforts, as well as for informal feedback on ongoing efforts and future direction.
Messaging
The Education subprogram considers a balanced message to help target audiences become familiar with hydrogen and how it fits in the portfolio of near-term and long-term energy choices, develop an accurate understanding of hydrogen safety, recognize opportunities, and understand their part in facilitating use of hydrogen and fuel cell technologies. Maintaining the DOE Hydrogen Program reputation as a credible source of technically-accurate and objective information about hydrogen and fuel cell technologies is essential. All materials developed and funded by the Education subprogram will undergo critical review for accuracy of content, audience usability, and consistency with higher-level DOE programmatic material and messaging.
Educational information and communications messaging tie to the Hydrogen Knowledge Survey, on which the subprogram objectives and targets are based. The survey questions are meant to evaluate basic understanding of hydrogen properties and align with simple messages relative to well-established energy security and environmental benefits of hydrogen and fuel cell technologies. Data collected in the 2004 baseline survey also indicates a direct correlation between knowledge of hydrogen and opinions about safety. Respondents with higher scores on the knowledge questions were also more likely to express a positive opinion about safety – for example, public survey respondents who achieved “passing grades” (more than 72% correct) on the knowledge questions were more likely to say they would feel pleased if their local gas station also sold hydrogen.
Target Audiences
Table 3.9.1 identifies the target audiences for hydrogen education and briefly describes their information needs. As illustrated in the table, target audiences for education have been prioritized according to their involvement or role in the use of hydrogen and fuel cell technologies in the near term. While activities to educate all key target audiences are important, the subprogram must focus its limited resources on those with the greatest near-term need.
Page 3.9 - 4 Multi-Year Research, Development and Demonstration Plan

2007
Technical Plan — Education
Table 3.9.1 Key Target Audiences for the Hydrogen Education Subprogram
Target Audience Rationale
First Responders Must know how to handle potential incidents; their understanding can also facilitate local project approval
Code Officials Must be familiar with hydrogen to facilitate permitting process and local project approval
Local Communities/ General Public
Will be more likely to welcome local demonstration projects when they are familiar with hydrogen
State and Local Government Representatives
A broad understanding of hydrogen supports decision-making on current opportunities and laying the foundation for long-term change
Potential End Users Potential early adopters in niche applications need information about near-term opportunities
University Faculty and Students Current interest is high; graduates needed for research in government, industry, and academia
Middle School and High School Teachers and Students
Current interest is high; teachers looking for technically accurate information and usable classroom activities
3.9.3 Programmatic Status
Budget limitations have greatly effected the status of the Education subprogram. New projects were competitively awarded in FY2004. Hydrogen education received a zero Congressional appropriation in FY2005; projects either ceased activity or continued on a limited basis using partner cost-share (non-DOE) funds. Target audiences have been prioritized according to their near-term relevance and effect on the use of hydrogen and fuel cell technologies today.
The Education subprogram first focused its efforts on cross-cutting information resources, including the program website, as well as technology introduction fact sheets and overview material appropriate to multiple target audiences with little background in hydrogen or fuel cells. Existing hard copy materials were brought under the umbrella of the EERE Information Center, where operators maintain a detailed product inventory that allows for better resource management. The EERE Hydrogen, Fuel Cells, and Infrastructure Technologies (HFCIT) Program website, www.eere.energy.gov/hydrogenandfuelcells, was launched in conjunction with the President’s Hydrogen Fuel Initiative in 2003. A DOE Hydrogen Program website (“DOE H2 site”), www.hydrogen.energy.gov, was also developed to serve as a portal to the individual offices that comprise the program (EERE/HFCIT; Fossil Energy; Nuclear Energy, Science, and Technology; and Science). Although there is some natural overlap, the DOE H2 site, managed by the DOE Hydrogen Systems Integrator, primarily provides programmatic information and news relevant to all four offices. The EERE/HFCIT site, managed primarily by the Education subprogram, provides links to higher-level programmatic information on the DOE H2 site but also serves as a primary
Multi-Year Research, Development and Demonstration Plan Page 3.9 - 5
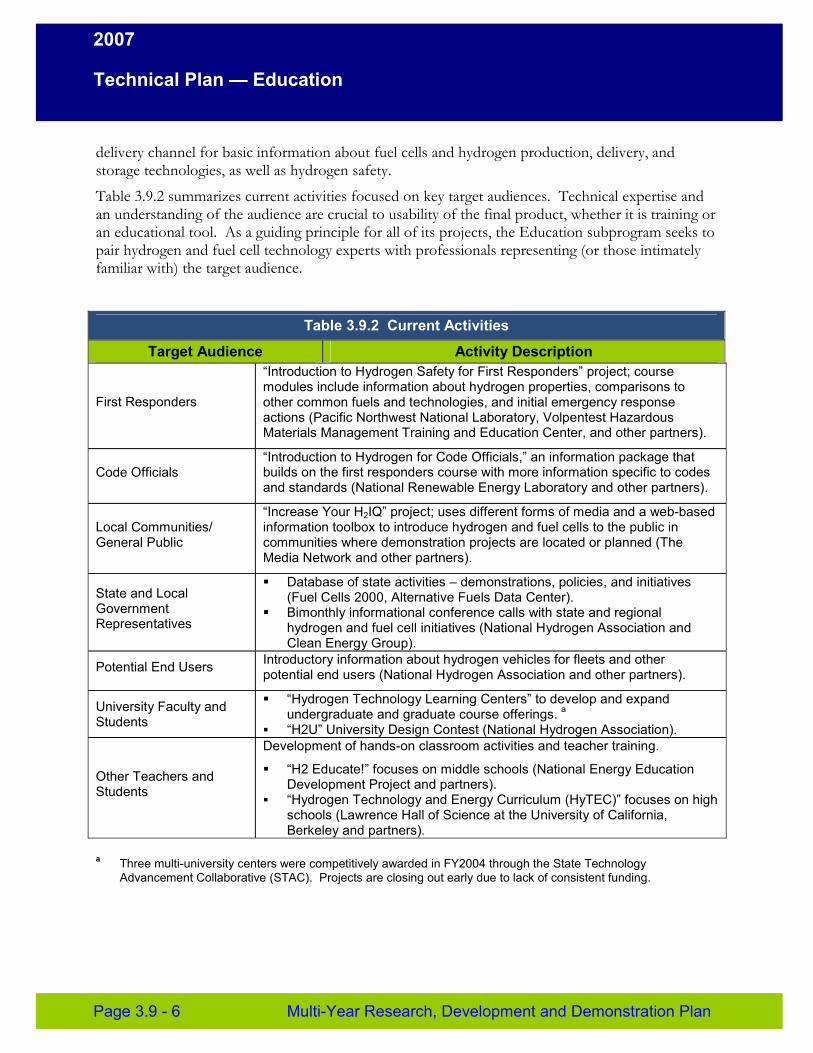
2007
Technical Plan — Education
delivery channel for basic information about fuel cells and hydrogen production, delivery, and storage technologies, as well as hydrogen safety.
Table 3.9.2 summarizes current activities focused on key target audiences. Technical expertise and an understanding of the audience are crucial to usability of the final product, whether it is training or an educational tool. As a guiding principle for all of its projects, the Education subprogram seeks to pair hydrogen and fuel cell technology experts with professionals representing (or those intimately familiar with) the target audience.
Table 3.9.2 Current Activities
Target Audience Activity Description
First Responders
“Introduction to Hydrogen Safety for First Responders” project; course modules include information about hydrogen properties, comparisons to other common fuels and technologies, and initial emergency response actions (Pacific Northwest National Laboratory, Volpentest Hazardous Materials Management Training and Education Center, and other partners).
Code Officials “Introduction to Hydrogen for Code Officials,” an information package that builds on the first responders course with more information specific to codes and standards (National Renewable Energy Laboratory and other partners).
Local Communities/ General Public
“Increase Your H2IQ” project; uses different forms of media and a web-based information toolbox to introduce hydrogen and fuel cells to the public in communities where demonstration projects are located or planned (The Media Network and other partners).
State and Local Government Representatives
� Database of state activities – demonstrations, policies, and initiatives (Fuel Cells 2000, Alternative Fuels Data Center).
� Bimonthly informational conference calls with state and regional hydrogen and fuel cell initiatives (National Hydrogen Association and Clean Energy Group).
Potential End Users Introductory information about hydrogen vehicles for fleets and other potential end users (National Hydrogen Association and other partners).
University Faculty and Students
� “Hydrogen Technology Learning Centers” to develop and expand undergraduate and graduate course offerings. a
� “H2U” University Design Contest (National Hydrogen Association).
Other Teachers and Students
Development of hands-on classroom activities and teacher training.
� “H2 Educate!” focuses on middle schools (National Energy Education Development Project and partners).
� “Hydrogen Technology and Energy Curriculum (HyTEC)” focuses on high schools (Lawrence Hall of Science at the University of California, Berkeley and partners).
a Three multi-university centers were competitively awarded in FY2004 through the State Technology Advancement Collaborative (STAC). Projects are closing out early due to lack of consistent funding.
Page 3.9 - 6 Multi-Year Research, Development and Demonstration Plan

2007
Technical Plan — Education
With regard to partnerships and collaboration, the Education subprogram maintains close contact with trade associations and others sharing an interest in education and training, including (but not limited to) the National Hydrogen Association, U.S. Fuel Cell Council, Fuel Cells 2000, California Fuel Cell Partnership, and NextEnergy, as well as other entities listed in the “Strategy/Partnerships and Collaboration” section of this plan. Such coordination is regular, but informal. Formal feedback on the subprogram’s efforts and direction is obtained through the DOE Hydrogen Program Annual Merit Review process.
3.9.4 Challenge
Considering our Nation’s long relationship with the gasoline internal combustion engine, the move to hydrogen and fuel cell technologies is a fundamental change in the way we use energy. Resistance or hesitance to change is the overarching challenge to education, and it is fed by several different factors.
The first factor is low awareness. The 2004 Hydrogen Knowledge Survey data shows current levels of knowledge and awareness of hydrogen technology – among all populations – are quite low. The data also indicates a direct correlation between knowledge of hydrogen and fuel cells and opinions about safety; simply put, people who know more about hydrogen tend to feel comfortable with the notion of using it to meet their everyday energy needs. Rumors, misinterpretation, and misunderstanding of historical events and the facts about hydrogen safety may prompt people to express a “not in my backyard” mentality. Technically accurate information from a trusted and objective source can raise awareness, correct misinformation or false perceptions, and help to build comfort levels with using new energy technologies.
The second factor is that there are few examples of real-world use. Hydrogen technology demonstrations, though increasingly visible in the public space, are not common throughout the country. The number of demonstrations is growing, but there are still few real-world examples to which we can point when introducing the idea of using hydrogen as an energy carrier. Some people may embrace the opportunity to be among the first to experience cutting-edge technology, while others may not want to feel that they are “part of the experiment.” Real-world examples and, better still, hands-on or first-hand experience, can greatly enhance understanding and comfort with using a new fuel and energy carrier.
The third factor that can feed resistance to change, and therefore influence the overall challenge to education, is the “what’s in it for me” factor. Although hydrogen and fuel cell technologies are emerging in the commercial market in some specialized niche applications such as stationary emergency back-up power, they are considered primarily as technologies for long term – not readily available today and won’t be for some time. When near-term and personal relevance or benefits are not obvious, engaging any of the key target audiences can be difficult.
The overall challenge to education is also compounded by the scope and magnitude of the effort required. Even considering a phased approach focused on specific target audiences in areas of the country where initial demonstration projects are planned, the task is large.
Multi-Year Research, Development and Demonstration Plan Page 3.9 - 7
2007
Technical Plan — Education
3.9.5 Barriers
The following section outlines barriers to achieving the education goal and objectives.
A. Lack of Readily Available, Objective, and Technically Accurate Information Although a significant body of technical information exists, there is little readily available information about hydrogen and fuel cells for individuals outside of the R&D community, and many educational resources and training opportunities require participants to pay a fee. Moreover, explaining hydrogen and fuel cells to a non-technical audience – clearly and succinctly, while still retaining technical accuracy – is challenging.
B. Mixed Messages The growing public and mainstream media interest in energy has sparked increased outreach activity among many different organizations. The flurry of activity helps raise public awareness of energy issues, but it also creates potential for conflicting public messages, as well as confusion about technology readiness and how hydrogen and fuel cells fit in the portfolio of our Nation’s energy choices.
C. Disconnect Between Hydrogen Information and Dissemination Networks Educational materials and resources must reach their intended audiences to be effective, and institutional barriers can complicate or inhibit target audience access to information. Many target audiences have established training mechanisms and legacy networks through which they are accustomed to receiving information. Tapping into these traditional training and education mechanisms is often the most efficient way in which to ensure access to the target audience, but it is often difficult to do.
D. Lack of Educated Trainers and Training Opportunities In-person training through workshops or seminars is one of the most effective information delivery mechanisms – there is less distraction for students and an opportunity for interaction between and among all participants. Availability of suitable trainers is low, however, and can be resource-intensive at a level that is beyond the capability of most education programs to fund.
E. Regional Differences Educational needs vary by audience, but they may also vary regionally. What works for a particular target audience group in one state, county, city, or district may not be the best approach for that same audience group in another area of the country (for example, education standards vary from state to state). Serving the education needs of a single target audience may therefore require multiple approaches tailored to serve the needs of various regions. This strains resources and can complicate activities developed at the national level.
F. Difficulty of Measuring Success Quantifying the success of education activities is difficult. The number of fact sheets distributed or number of training workshops held does not provide a meaningful measure of whether target audiences are actually gaining knowledge or understanding. The subprogram developed the knowledge survey to more accurately and quantifiably measure success, but external influences, such as mass media attention, can also affect public knowledge and opinion, making it difficult to determine whether or not measured changes in knowledge are actually the result of subprogram activities.
Page 3.9 - 8 Multi-Year Research, Development and Demonstration Plan
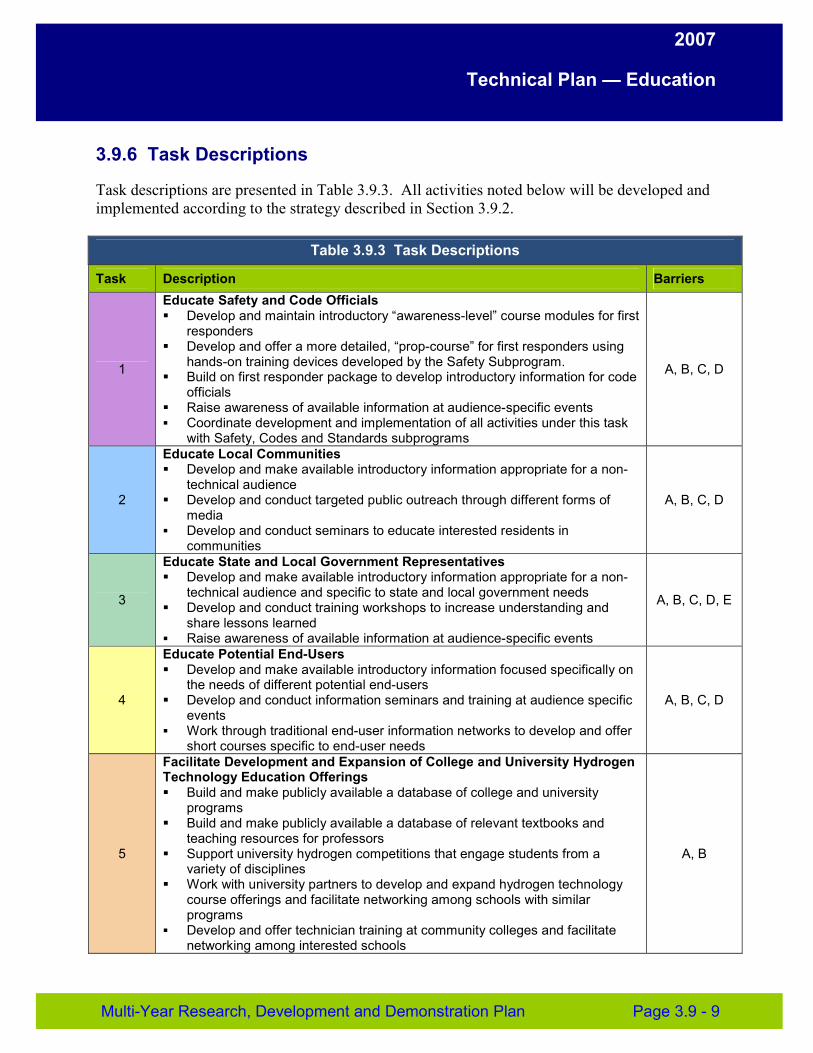
2007
Technical Plan — Education
3.9.6 Task Descriptions
Task descriptions are presented in Table 3.9.3. All activities noted below will be developed and implemented according to the strategy described in Section 3.9.2.
Table 3.9.3 Task Descriptions
Task Description Barriers
1
Educate Safety and Code Officials � Develop and maintain introductory “awareness-level” course modules for first
responders � Develop and offer a more detailed, “prop-course” for first responders using
hands-on training devices developed by the Safety Subprogram. � Build on first responder package to develop introductory information for code
officials � Raise awareness of available information at audience-specific events � Coordinate development and implementation of all activities under this task
with Safety, Codes and Standards subprograms
A, B, C, D
2
Educate Local Communities � Develop and make available introductory information appropriate for a non-
technical audience � Develop and conduct targeted public outreach through different forms of
media � Develop and conduct seminars to educate interested residents in
communities
A, B, C, D
3
Educate State and Local Government Representatives � Develop and make available introductory information appropriate for a non-
technical audience and specific to state and local government needs � Develop and conduct training workshops to increase understanding and
share lessons learned � Raise awareness of available information at audience-specific events
A, B, C, D, E
4
Educate Potential End-Users � Develop and make available introductory information focused specifically on
the needs of different potential end-users � Develop and conduct information seminars and training at audience specific
events � Work through traditional end-user information networks to develop and offer
short courses specific to end-user needs
A, B, C, D
5
Facilitate Development and Expansion of College and University Hydrogen Technology Education Offerings� Build and make publicly available a database of college and university
programs � Build and make publicly available a database of relevant textbooks and
teaching resources for professors � Support university hydrogen competitions that engage students from a
variety of disciplines � Work with university partners to develop and expand hydrogen technology
course offerings and facilitate networking among schools with similar programs
� Develop and offer technician training at community colleges and facilitate networking among interested schools
A, B
Multi-Year Research, Development and Demonstration Plan Page 3.9 - 9
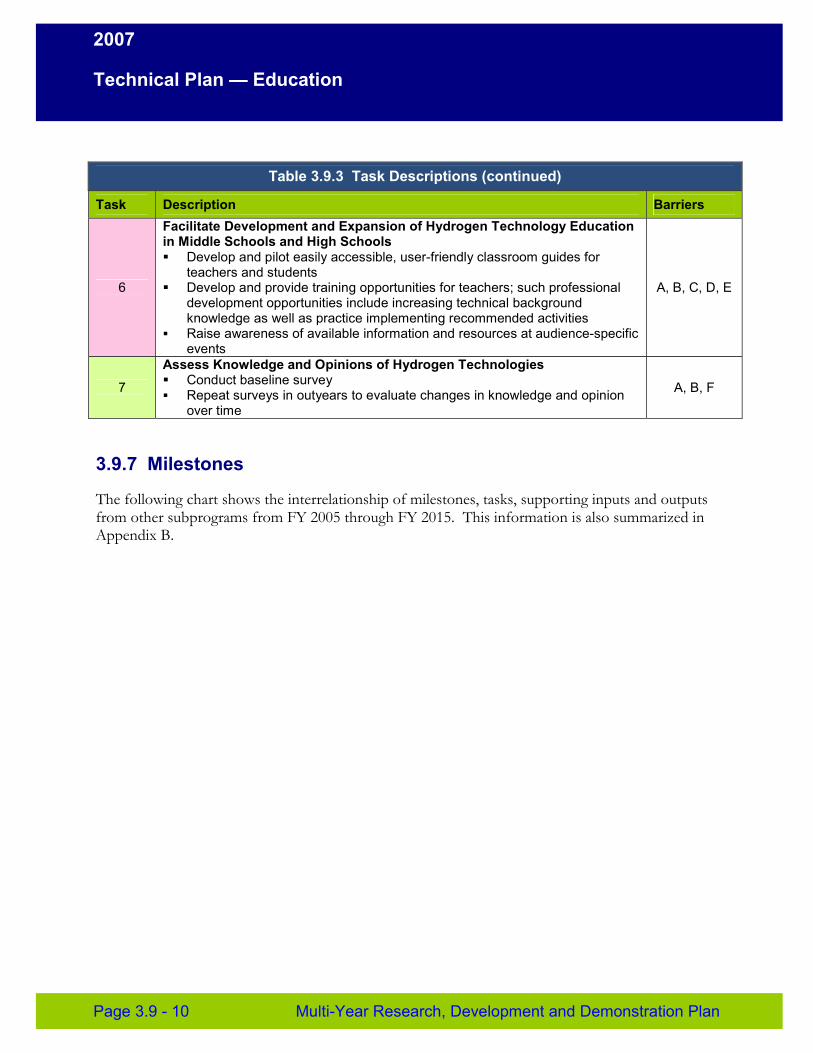
2007
Technical Plan — Education
Table 3.9.3 Task Descriptions (continued)
Task Description Barriers
6
Facilitate Development and Expansion of Hydrogen Technology Education in Middle Schools and High Schools� Develop and pilot easily accessible, user-friendly classroom guides for
teachers and students � Develop and provide training opportunities for teachers; such professional
development opportunities include increasing technical background knowledge as well as practice implementing recommended activities
� Raise awareness of available information and resources at audience-specific events
A, B, C, D, E
7
Assess Knowledge and Opinions of Hydrogen Technologies� Conduct baseline survey � Repeat surveys in outyears to evaluate changes in knowledge and opinion
over time
A, B, F
3.9.7 Milestones
The following chart shows the interrelationship of milestones, tasks, supporting inputs and outputs from other subprograms from FY 2005 through FY 2015. This information is also summarized in Appendix B.
Page 3.9 - 10 Multi-Year Research, Development and Demonstration Plan
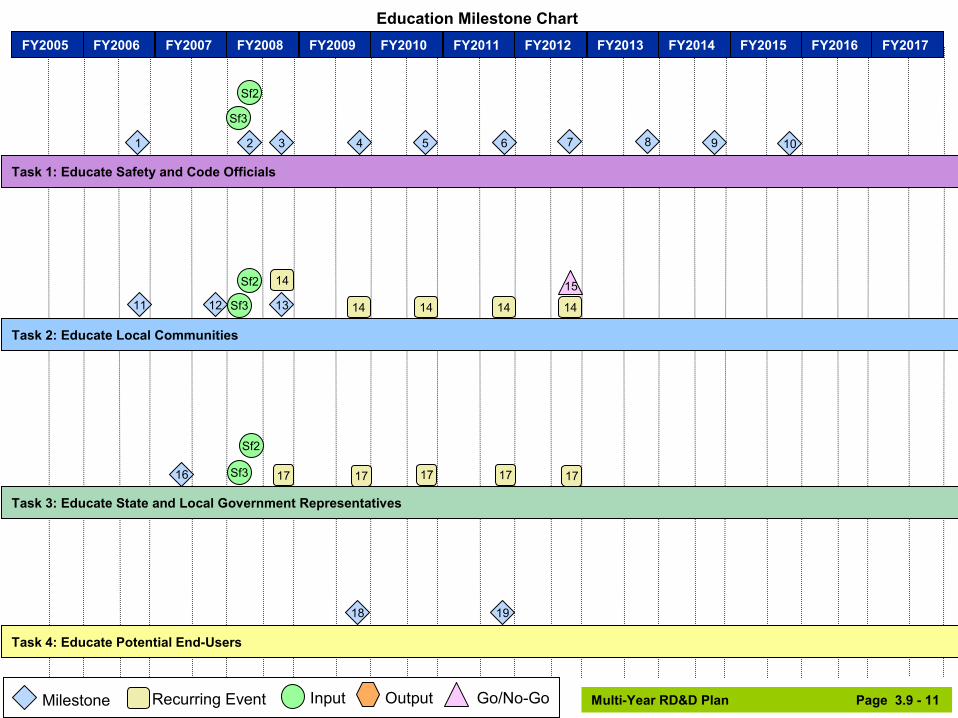
Education Milestone Chart FY2005 FY2006 FY2007 FY2008 FY2009 FY2010 FY2011 FY2012 FY2013 FY2014 FY2015 FY2016 FY2017
Milestone Input Output Go/No-Go
Task 1: Educate Safety and Code Officials
1 2 3 4 5 6 7 8 9 10
Task 2: Educate Local Communities
11 12 13
Recurring Event
14
14 14 14 14
15
Task 3: Educate State and Local Government Representatives
16 17 17 17 1717
Task 4: Educate Potential End-Users
18 19
Sf3
Sf2
Sf2
Sf3
Sf2
Sf3
Multi-Year RD&D Plan Page 3.9 - 11
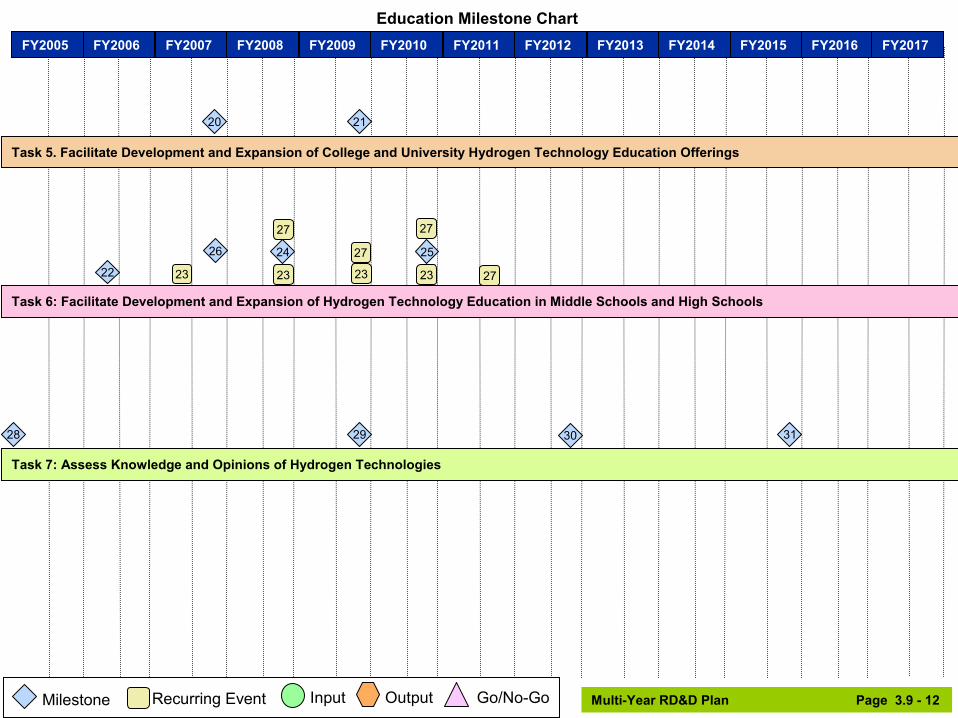
Education Milestone Chart FY2005 FY2006 FY2007 FY2008 FY2009 FY2010 FY2011 FY2012 FY2013 FY2014 FY2015 FY2016 FY2017
Task 5. Facilitate Development and Expansion of College and University Hydrogen Technology Education Offerings
20 21
Task 6: Facilitate Development and Expansion of Hydrogen Technology Education in Middle Schools and High Schools
Task 7: Assess Knowledge and Opinions of Hydrogen Technologies
22 23 23 23 23
24 2526
27
27
27
27
28 29 30 31
Milestone Input Output Go/No-Go Recurring Event Multi-Year RD&D Plan Page 3.9 - 12
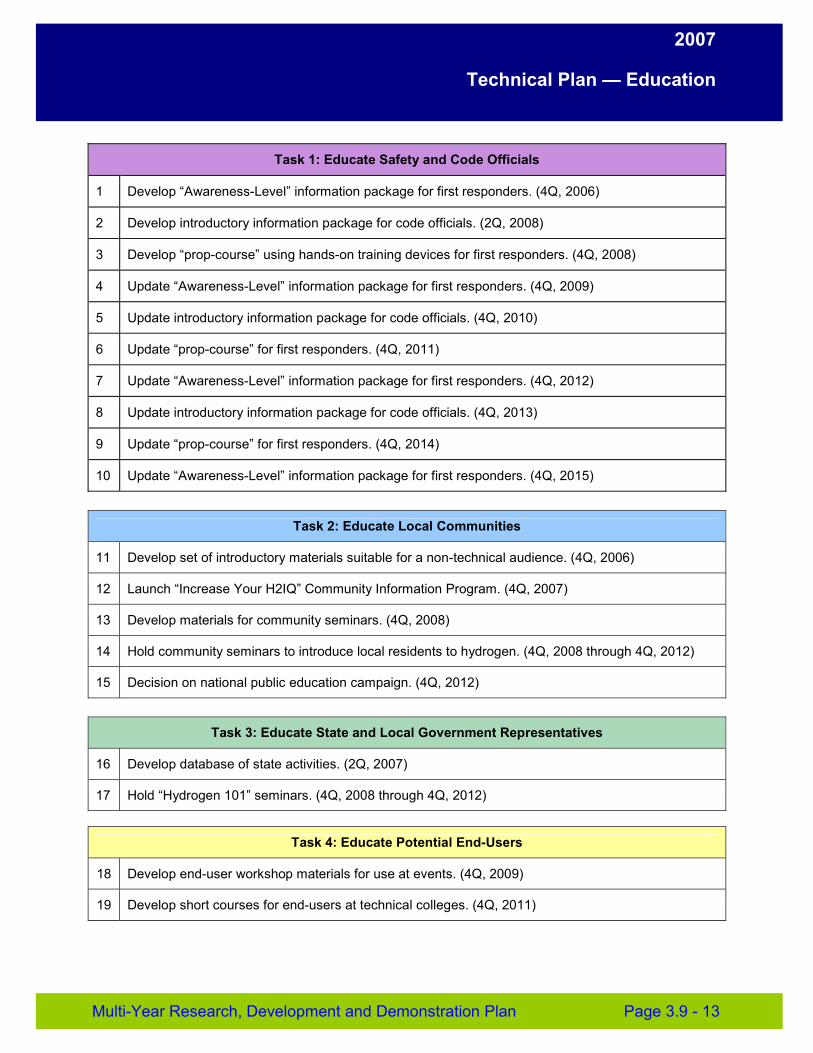
2007
Technical Plan — Education
Task 1: Educate Safety and Code Officials
1 Develop “Awareness-Level” information package for first responders. (4Q, 2006)
2 Develop introductory information package for code officials. (2Q, 2008)
3 Develop “prop-course” using hands-on training devices for first responders. (4Q, 2008)
4 Update “Awareness-Level” information package for first responders. (4Q, 2009)
5 Update introductory information package for code officials. (4Q, 2010)
6 Update “prop-course” for first responders. (4Q, 2011)
7 Update “Awareness-Level” information package for first responders. (4Q, 2012)
8 Update introductory information package for code officials. (4Q, 2013)
9 Update “prop-course” for first responders. (4Q, 2014)
10 Update “Awareness-Level” information package for first responders. (4Q, 2015)
Task 2: Educate Local Communities
11 Develop set of introductory materials suitable for a non-technical audience. (4Q, 2006)
12 Launch “Increase Your H2IQ” Community Information Program. (4Q, 2007)
13 Develop materials for community seminars. (4Q, 2008)
14 Hold community seminars to introduce local residents to hydrogen. (4Q, 2008 through 4Q, 2012)
15 Decision on national public education campaign. (4Q, 2012)
Task 3: Educate State and Local Government Representatives
16 Develop database of state activities. (2Q, 2007)
17 Hold “Hydrogen 101” seminars. (4Q, 2008 through 4Q, 2012)
Task 4: Educate Potential End-Users
18 Develop end-user workshop materials for use at events. (4Q, 2009)
19 Develop short courses for end-users at technical colleges. (4Q, 2011)
Multi-Year Research, Development and Demonstration Plan Page 3.9 - 13
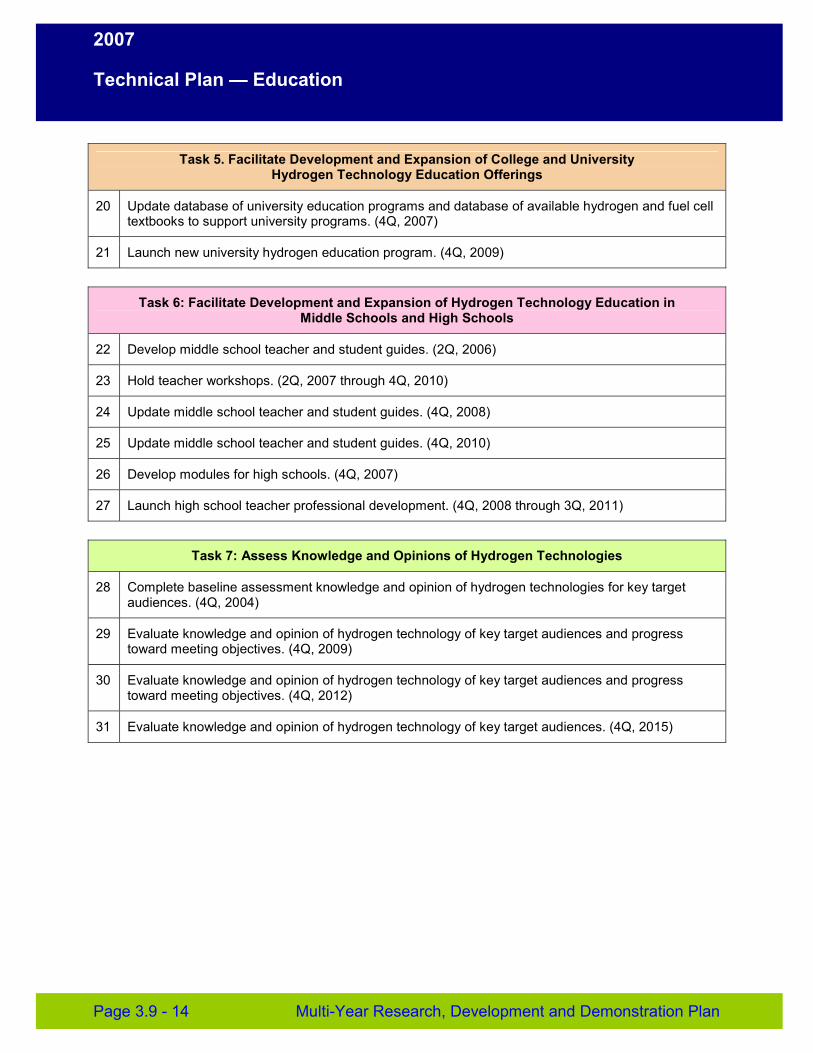
2007
Technical Plan — Education
Task 5. Facilitate Development and Expansion of College and University Hydrogen Technology Education Offerings
20 Update database of university education programs and database of available hydrogen and fuel cell textbooks to support university programs. (4Q, 2007)
21 Launch new university hydrogen education program. (4Q, 2009)
Task 6: Facilitate Development and Expansion of Hydrogen Technology Education in Middle Schools and High Schools
22 Develop middle school teacher and student guides. (2Q, 2006)
23 Hold teacher workshops. (2Q, 2007 through 4Q, 2010)
24 Update middle school teacher and student guides. (4Q, 2008)
25 Update middle school teacher and student guides. (4Q, 2010)
26 Develop modules for high schools. (4Q, 2007)
27 Launch high school teacher professional development. (4Q, 2008 through 3Q, 2011)
Task 7: Assess Knowledge and Opinions of Hydrogen Technologies
28 Complete baseline assessment knowledge and opinion of hydrogen technologies for key target audiences. (4Q, 2004)
29 Evaluate knowledge and opinion of hydrogen technology of key target audiences and progress toward meeting objectives. (4Q, 2009)
30 Evaluate knowledge and opinion of hydrogen technology of key target audiences and progress toward meeting objectives. (4Q, 2012)
31 Evaluate knowledge and opinion of hydrogen technology of key target audiences. (4Q, 2015)
Page 3.9 - 14 Multi-Year Research, Development and Demonstration Plan

2007
Technical Plan — Education
Outputs
None
Inputs
Sf2 Input from Safety: Report of Common Accident Scenarios. (2Q, 2008)
Sf3 Publish a Best Practices Handbook for hydrogen safety, (1Q, 2008)
Multi-Year Research, Development and Demonstration Plan Page 3.9 - 15
2007
Systems Analysis
4.0 Systems Analysis Systems Analysis supports decision-making by providing greater understanding of the contribution of individual components to the hydrogen energy system as a whole, and the interaction of the components and their effects on the system. Analysis will be used to continually evaluate the alternatives for satisfying the functions and requirements of the future hydrogen system/economy and the Program’s progress against the targets outlined in this RD&D Plan. Analysis is conducted to assess cross-cutting and overall hydrogen system issues and to support the development of the production, delivery, storage, fuel cell and safety technologies. The Systems Analysis activities are led by the DOE Technology Analyst and are supported by the Systems Integration function, which provides analytical resources, models and tools, and independent analysis capabilities as required. The DOE Hydrogen Program Systems Analysis Plan (SAP) will provide the overall context of Systems Analysis activities, roles and responsibilities of organizations, and descriptions of supporting tools and processes. This section of the RD&D plan describes the implementation of that effort, leading to the tasks and project areas which will be funded in order to accomplish Systems Analysis and program objectives.
4.1 Technical Goal and Objectives
Goal
Provide system-level analysis products to support hydrogen infrastructure development and technology readiness by evaluating technologies and pathways, guiding the selection of RD&D projects, and estimating the potential value of RD&D efforts.
Objectives
� By 2008, develop and utilize a macro-system model of the hydrogen fuel infrastructure to support transportation systems. By 2011, enhance the model to include the stationary electrical generation and infrastructure for long-term applications analysis.
� By 2009, identify and evaluate early market transformation scenarios consistent with infrastructure and hydrogen resources.
� By 2014, complete environmental studies that are necessary for technology readiness. � By 2015, analyze the ultimate potential for hydrogen and fuel cell vehicles. The analysis will
address necessary resources, hydrogen production, transportation infrastructure, vehicle performance, and interactions between a hydrogen economic sector and other sectors.
� Provide milestone-based analysis, including risk analysis, independent reviews, financial evaluations and environmental analysis, to support the Program's needs prior to technology readiness.
� On an annual basis, update the Well-to-Wheels analysis for technologies and pathways for the Hydrogen Program to include technological advances or changes.
Multi-Year Research, Development and Demonstration Plan Page 4 - 1
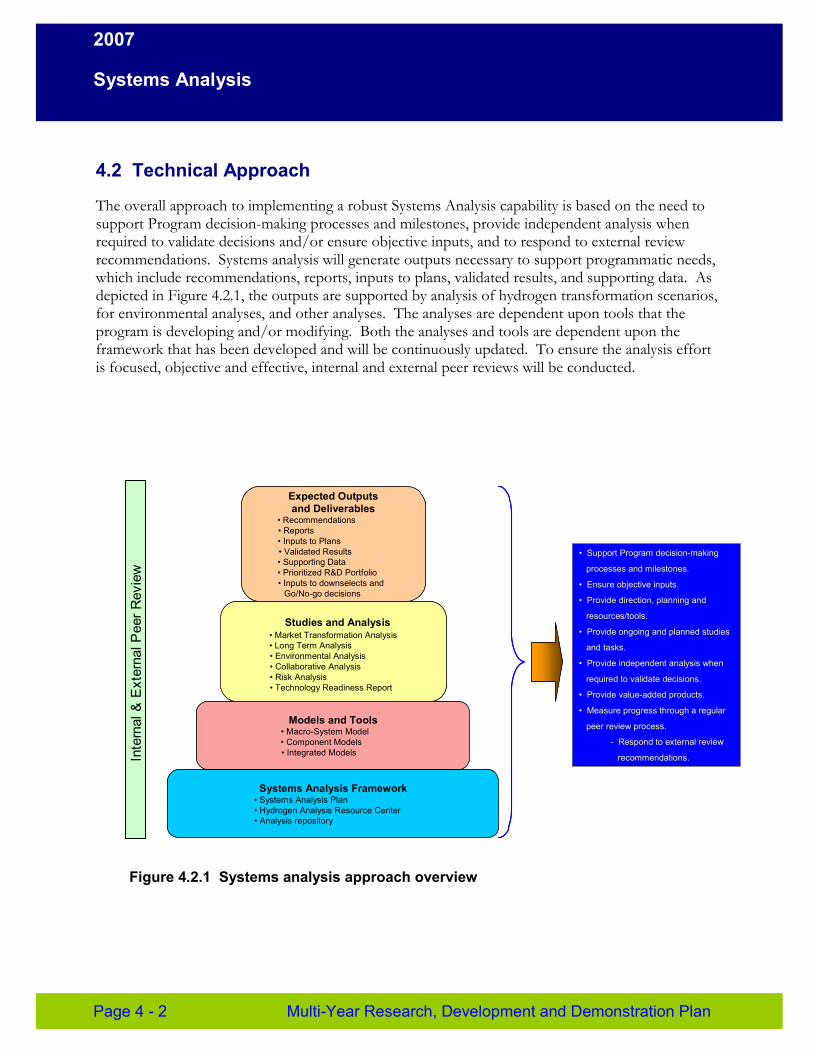
2007
Systems Analysis
4.2 Technical Approach
The overall approach to implementing a robust Systems Analysis capability is based on the need to support Program decision-making processes and milestones, provide independent analysis when required to validate decisions and/or ensure objective inputs, and to respond to external review recommendations. Systems analysis will generate outputs necessary to support programmatic needs, which include recommendations, reports, inputs to plans, validated results, and supporting data. As depicted in Figure 4.2.1, the outputs are supported by analysis of hydrogen transformation scenarios, for environmental analyses, and other analyses. The analyses are dependent upon tools that the program is developing and/or modifying. Both the analyses and tools are dependent upon the framework that has been developed and will be continuously updated. To ensure the analysis effort is focused, objective and effective, internal and external peer reviews will be conducted.
Inte
rnal
& E
xter
nal P
eer R
evie
w
-
Studies and Analysis • Market Transformation Analysis • Long Term Analysis • Environmental Analysis • Collaborative Analysis • Risk Analysis • Technology Readiness Report
Models and Tools • Macro-System Model • Component Models • Integrated Models
Systems Analysis Framework • Systems Analysis Plan • Hydrogen Analysis Resource Center • Analysis repository
Expected Outputs and Deliverables
• Recommendations • Reports • Inputs to Plans • Validated Results • Supporting Data • Prioritized R&D Portfolio • Inputs to downselects and
Go/No-go decisions
• Support Program decision-making
processes and milestones.
• Ensure objective inputs.
• Provide direction, planning and
resources/tools.
• Provide ongoing and planned studies
and tasks.
• Provide independent analysis when
required to validate decisions.
• Provide value-added products.
• Measure progress through a regular
peer review process.
- Respond to external review
recommendations.
Figure 4.2.1 Systems analysis approach overview
Page 4 - 2 Multi-Year Research, Development and Demonstration Plan
2007
Systems Analysis
Studies and Analysis
Planned studies and analysis are separated into the following categories: understanding the initial phases of the hydrogen infrastructure; understanding the potential of a long-term hydrogen requirements; environmental analysis; and cross-cutting analytical studies that require quick response.
Market Transformation Analysis
The potential technology pathways essential to understand the development of the hydrogen infrastructure will be modeled and analyzed from the standpoints of application requirements (targets), cost, risk, environmental consequence and societal impact. From these analyses, key cost and technology barriers/gaps will be identified, which will help further define and update the key RD&D needs and plans within each Program element. In addition, analyses will be undertaken to update energy, environmental impact and financial impact/risk projections. This wide range of analyses are required to provide the necessary information about the infrastructure, vehicle options, resource requirements and availability, fuel quality, cost and profitability, and well-to-wheels emissions. The analyses are described in Table 4.2.1.
Long-term Analysis
Long-term analysis will involve the same analysis areas as the market transformation analysis; however, this analysis will involve the investigation of a larger hydrogen economic sector instead of the early infrastructure issues. In addition to the categories listed above, the quantity of resources necessary to produce hydrogen and the transportation needs and limitations for those resources will need to be understood. Likewise, analyses of delivery of centrally produced hydrogen will be important.
Environmental Analysis
This work will focus on completing all environmental analyses necessary before technology readiness. Initial studies will involve understanding the potential effects of hydrogen and its infrastructure on the environment. The studied effects will involve both primary (releases of hydrogen to the atmosphere, construction of pipelines and their associated ecological impacts, materials used for fuel cells, hydrogen storage and other components of the hydrogen systems) as well as secondary effects (changes in urban pollutants and GHG emissions). Environmental data produced from subprogram element projects will be compiled and analyzed to support Go/No-Go decisions and independent reviews.
Cross-Cut Analysis
Cross-cut analysis will provide support for the program’s analysis requirements, which include both large, in-depth analyses to assist with program decisions and short-term analyses necessary for the program to answer specific questions raised by constituents. A cross-cut analysis team will be formed to perform standardized cross-cutting analysis for the DOE Hydrogen Program to understand cost and options for the long-term applications of hydrogen. The analysis will include the assessment of various hydrogen production sources, the options for delivery, storage, fuel cell technology and hydrogen vehicles.
Multi-Year Research, Development and Demonstration Plan Page 4 - 3
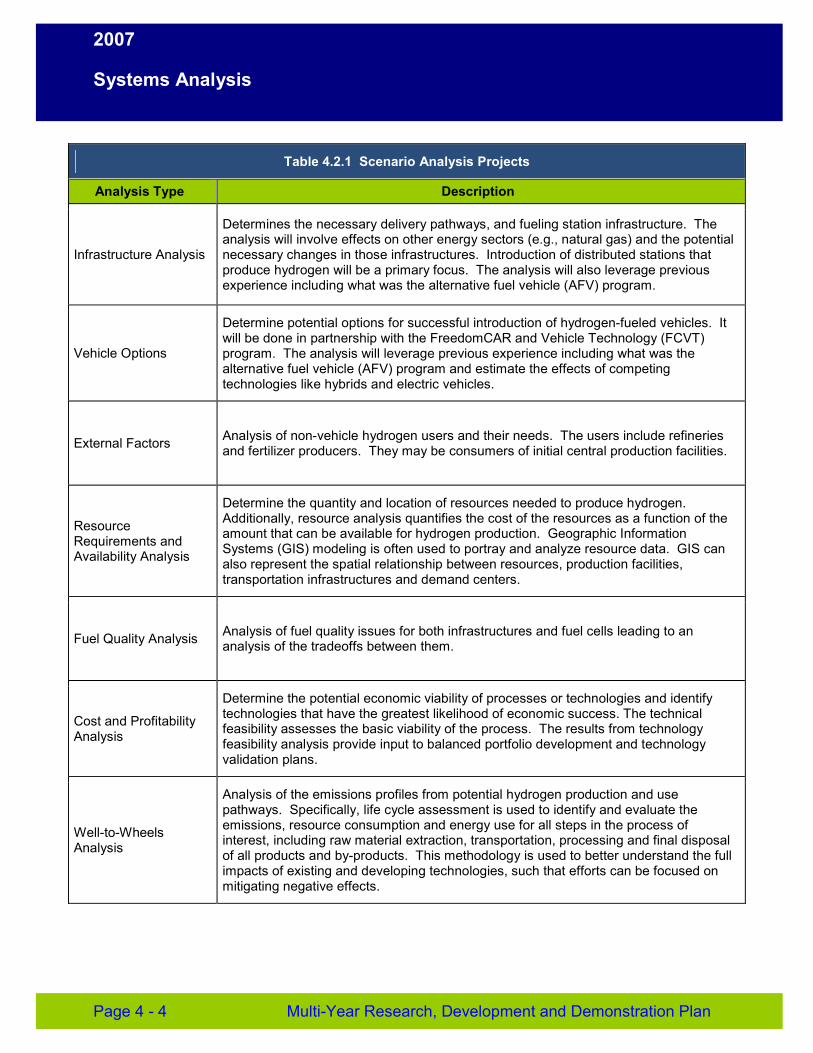
2007
Systems Analysis
Table 4.2.1 Scenario Analysis Projects
Analysis Type Description
Infrastructure Analysis
Determines the necessary delivery pathways, and fueling station infrastructure. The analysis will involve effects on other energy sectors (e.g., natural gas) and the potential necessary changes in those infrastructures. Introduction of distributed stations that produce hydrogen will be a primary focus. The analysis will also leverage previous experience including what was the alternative fuel vehicle (AFV) program.
Vehicle Options
Determine potential options for successful introduction of hydrogen-fueled vehicles. It will be done in partnership with the FreedomCAR and Vehicle Technology (FCVT) program. The analysis will leverage previous experience including what was the alternative fuel vehicle (AFV) program and estimate the effects of competing technologies like hybrids and electric vehicles.
External Factors Analysis of non-vehicle hydrogen users and their needs. The users include refineries and fertilizer producers. They may be consumers of initial central production facilities.
Resource Requirements and Availability Analysis
Determine the quantity and location of resources needed to produce hydrogen. Additionally, resource analysis quantifies the cost of the resources as a function of the amount that can be available for hydrogen production. Geographic Information Systems (GIS) modeling is often used to portray and analyze resource data. GIS can also represent the spatial relationship between resources, production facilities, transportation infrastructures and demand centers.
Fuel Quality Analysis Analysis of fuel quality issues for both infrastructures and fuel cells leading to an analysis of the tradeoffs between them.
Cost and Profitability Analysis
Determine the potential economic viability of processes or technologies and identify technologies that have the greatest likelihood of economic success. The technical feasibility assesses the basic viability of the process. The results from technology feasibility analysis provide input to balanced portfolio development and technology validation plans.
Well-to-Wheels Analysis
Analysis of the emissions profiles from potential hydrogen production and use pathways. Specifically, life cycle assessment is used to identify and evaluate the emissions, resource consumption and energy use for all steps in the process of interest, including raw material extraction, transportation, processing and final disposal of all products and by-products. This methodology is used to better understand the full impacts of existing and developing technologies, such that efforts can be focused on mitigating negative effects.
Page 4 - 4 Multi-Year Research, Development and Demonstration Plan
2007
Systems Analysis
Models and Tools
Systems analysis models include component models that simulate individual portions of hydrogen scenarios, integrated models that involve economic and environmental factors applicable to hydrogen fuel and vehicles, and the macro-system model (MSM) to link other models and facilitate consistency and communication between them. Modeling tools provide the basis for analyzing alternatives at the system-, technology-, or component-level in terms of their cost, performance, benefit and risk impacts on the macro system. Analysis will be done across key activity boundaries such as chemical hydrogen storage in which off-board regeneration has implications across storage, delivery and production subprogram elements.
To ensure model integrity and analysis consistency, the models will be updated and validated annually with data and information from subprogram projects, independent reviews and technology validation.
Macro-System Model
The macro-system model (MSM) will be a structure that links other existing and emerging models to perform cross-cutting analysis of engineering issues. A number of models exist to analyze components and subsystems of the long-term applications of hydrogen; however, the MSM will integrate many of those component and subsystem models using a common architecture and calculate overall results (i.e., it is the tool that will address the overarching hydrogen fuel infrastructure as a system). The primary objective of the MSM will be to support programmatic decisions regarding investment levels and to focus funding. The MSM will also facilitate consistency between models because it will require common terms and techniques to allow for information transfer. To achieve that objective, it will be a tool that estimates how and when proposed technologies might fit into a national system.
Component Models
These models are engineering models used individually to generate technology-specific information. Two examples of these models are the Hydrogen Analysis (H2A) Production models and the Hydrogen Analysis (H2A) Delivery models. The H2A Production models are standardized tools for economic calculations of various hydrogen production technologies. These models are publicly available and provide analysis for a number of different production technologies and pathways. The H2A Delivery models have been developed for both delivery component cost estimations and system needs and cost estimations for specific delivery scenarios, which are also publicly available.
Integrated Models
Multiple integrated models are engineering models that have been developed either within the program or outside the program and have been modified to answer overarching hydrogen-related questions. Most of these models simulate hydrogen-related areas and variables but each has its own strengths and weaknesses; therefore, utilization and upkeep of all is necessary. The models include the following: the HyDS Model; HyTrans; an Agent-Based Modeling System being developed by RCF and its partners; MARKAL with hydrogen representation; and the Production Infrastructures Options model being developed by DTI. Additionally, the GREET model (used for well-to-wheels
Multi-Year Research, Development and Demonstration Plan Page 4 - 5

2007
Systems Analysis
analysis) and WinDS (an electricity sector model) are necessary for some programmatic analysis which will require periodic maintenance.
Systems Analysis Framework
The systems analysis framework is designed to support all modeling and analysis efforts. It involves establishing a source of consistent data for analytical efforts, determining and prioritizing the analysis tasks, organizing them so that they use consistent techniques and data, and organizing the results so that they can be easily found and used when making decisions.
Systems Analysis Plan
A detailed Systems Analysis Plan (SAP) has been developed to lay out the overall approach, tasks and processes for the systems analysis efforts of the Program. It defines how specific analysis activities relate to the objectives of the overall program. The SAP contains a catalog of resources, the systems analysis processes, and the analysis results.
Hydrogen Analysis Resource Center (HyARC)
A technical data management system has been developed to provide a consistent database, a list of assumptions, information standards and tools for analytical activities supporting the Hydrogen Program. This analysis resource center will provide data for standardized input to systems analysis, the establishment of the base case hydrogen system and to conduct the subsequent trade-off analyses. This technical data management system will ensure consistency in analyses conducted by the Program. The database will be updated annually and made available to the community through the Web.
Analysis Repository
A repository of technical analysis and evaluation activities will be established. The repository will be prioritized based on need to better understand system requirements, support Go/No-Go decisions, and evaluate progress towards the milestones and technology development goals of the program. The analysis repository will be updated periodically to ensure that the analytical activities provide direction, focus and support to the Program’s research and development activities.
4.3 Systems Analysis Collaboration
This plan only describes the specific activities performed and funded by the Systems Analysis program element of the Hydrogen, Fuel Cells and Infrastructure Technologies (HFCIT) program. However, the analytical activities needed to support the entire DOE Hydrogen Program are more extensive, and to a large degree, coordinated by and performed in collaboration with the efforts described in this section. These include the following:
� Analysis activities performed within and uniquely to the individual Program Elements of HFCIT: The Delivery Program Element, for example, funds analysis projects which specifically address Delivery issues and the results of which are needed to help determine future Delivery R&D focus. Descriptions of these analysis activities are found in the respective Program Element sections of this plan.
Page 4 - 6 Multi-Year Research, Development and Demonstration Plan
2007
Systems Analysis
� Analysis efforts of the other Offices participating in the DOE Hydrogen Program: The Office of Fossil Energy and the Office of Nuclear Energy, Science and Technology each perform analysis to support their respective R&D efforts in the production of hydrogen. These are coordinated with Systems Analysis and are reflected in the overall Analysis Portfolio maintained by the Systems Analysis organization for the entire DOE Hydrogen Program. A Cross-Cut Analytical Team, composed of members from FE, NE, national laboratories and other departments, will be formed to carry out this standardized cross-cutting analysis for the DOE Hydrogen Program to understand the cost and options for hydrogen fuel and vehicles.
� Planning, Analysis and Evaluation (PAE) analysis: The PAE organization within EERE Planning, Budget, and Analysis (PBA) performs policy and benefits analysis across the EERE portfolio, but also specifically in support of individual programs – such as HFCIT. The Technology Analyst and Systems Integrator are members of the PAE Analytic Council, and coordinate with PAE to ensure the synergy and timeliness of the policy and benefits analysis to support program needs.
� External reviews and analysis: These include such external activities as reviews by the National Academy of Sciences, efforts under the Hydrogen Technical Advisory Committee, and future international work which might be undertaken by the International Partnership for the Hydrogen Economy. Although by their nature these are independent of the HFCIT program, the Technology Analyst is typically involved in briefing these organizations on program status and needs, participating in working groups which frame the analytical elements, and interpreting the results for use by the program.
Multi-Year Research, Development and Demonstration Plan Page 4 - 7
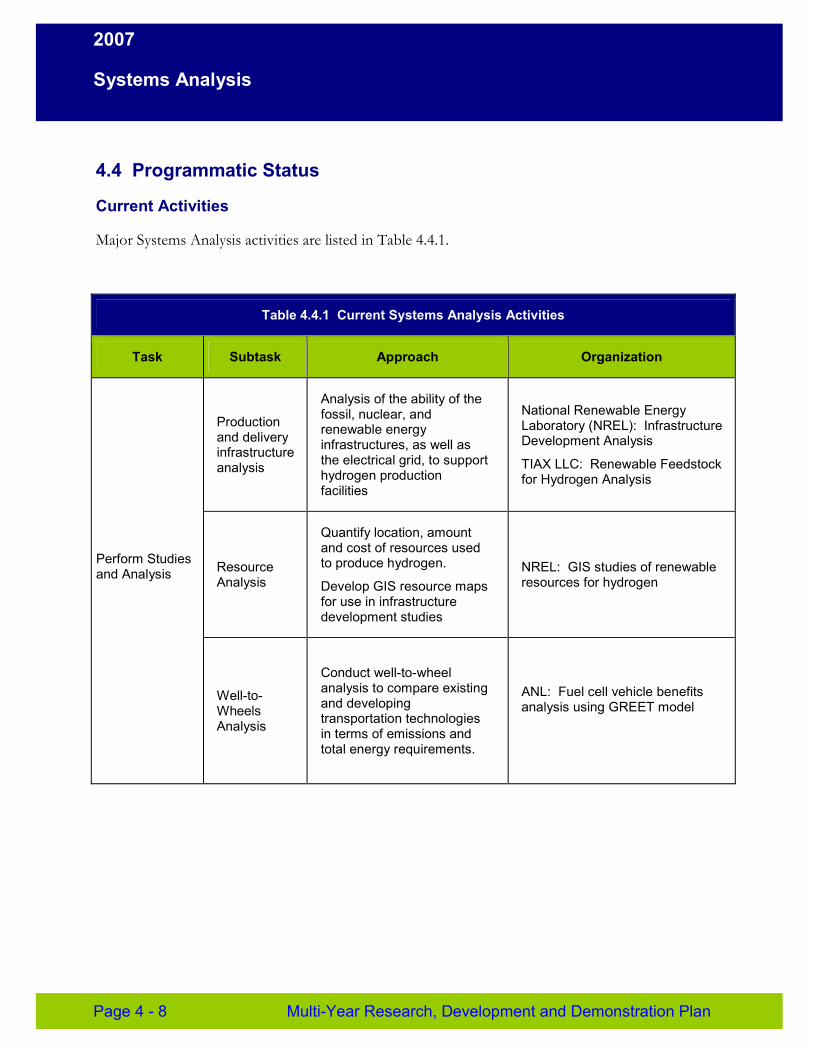
2007
Systems Analysis
4.4 Programmatic Status
Current Activities
Major Systems Analysis activities are listed in Table 4.4.1.
Table 4.4.1 Current Systems Analysis Activities
Task Subtask Approach Organization
Perform Studies and Analysis
Production and delivery infrastructure analysis
Analysis of the ability of the fossil, nuclear, and renewable energy infrastructures, as well as the electrical grid, to support hydrogen production facilities
National Renewable Energy Laboratory (NREL): Infrastructure Development Analysis
TIAX LLC: Renewable Feedstock for Hydrogen Analysis
Resource Analysis
Quantify location, amount and cost of resources used to produce hydrogen.
Develop GIS resource maps for use in infrastructure development studies
NREL: GIS studies of renewable resources for hydrogen
Well-to-Wheels Analysis
Conduct well-to-wheel analysis to compare existing and developing transportation technologies in terms of emissions and total energy requirements.
ANL: Fuel cell vehicle benefits analysis using GREET model
Page 4 - 8 Multi-Year Research, Development and Demonstration Plan
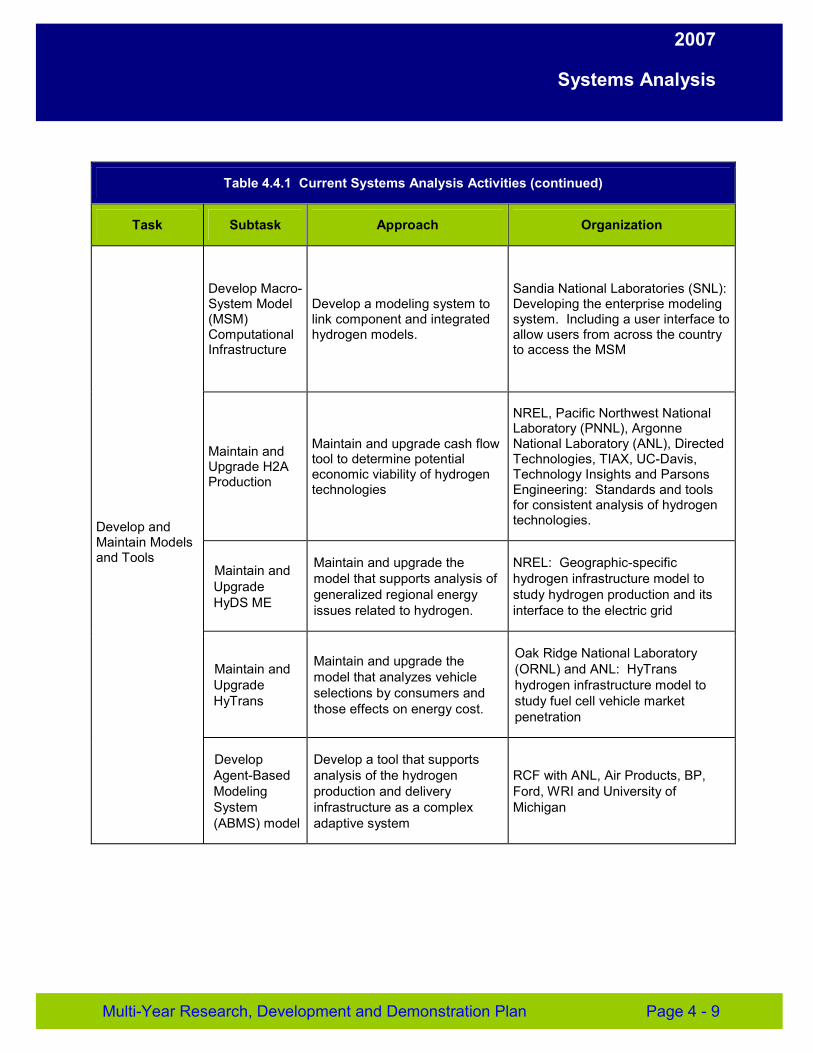
2007
Systems Analysis
Table 4.4.1 Current Systems Analysis Activities (continued)
Task Subtask Approach Organization
Develop and Maintain Models and Tools
Develop Macro-System Model (MSM) Computational Infrastructure
Develop a modeling system to link component and integrated hydrogen models.
Sandia National Laboratories (SNL): Developing the enterprise modeling system. Including a user interface to allow users from across the country to access the MSM
Maintain and Upgrade H2A Production
Maintain and upgrade cash flow tool to determine potential economic viability of hydrogen technologies
NREL, Pacific Northwest National Laboratory (PNNL), Argonne National Laboratory (ANL), Directed Technologies, TIAX, UC-Davis, Technology Insights and Parsons Engineering: Standards and tools for consistent analysis of hydrogen technologies.
Maintain and Upgrade HyDS ME
Maintain and upgrade the model that supports analysis of generalized regional energy issues related to hydrogen.
NREL: Geographic-specific hydrogen infrastructure model to study hydrogen production and its interface to the electric grid
Maintain and Upgrade HyTrans
Maintain and upgrade the model that analyzes vehicle selections by consumers and those effects on energy cost.
Oak Ridge National Laboratory (ORNL) and ANL: HyTrans hydrogen infrastructure model to study fuel cell vehicle market penetration
Develop Develop a tool that supports Agent-Based analysis of the hydrogen RCF with ANL, Air Products, BP, Modeling production and delivery Ford, WRI and University of System infrastructure as a complex Michigan (ABMS) model adaptive system
Multi-Year Research, Development and Demonstration Plan Page 4 - 9
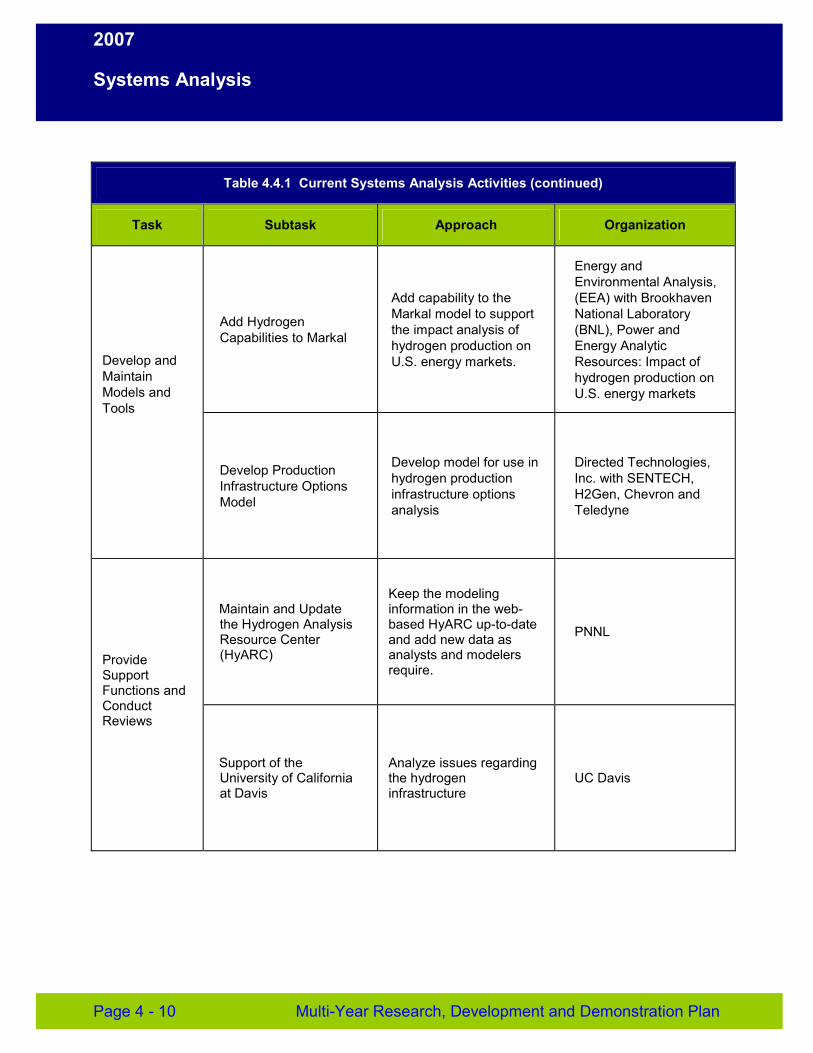
2007
Systems Analysis
Table 4.4.1 Current Systems Analysis Activities (continued)
Task Subtask Approach Organization
Develop and Maintain Models and Tools
Add Hydrogen Capabilities to Markal
Add capability to the Markal model to support the impact analysis of hydrogen production on U.S. energy markets.
Energy and Environmental Analysis, (EEA) with Brookhaven National Laboratory (BNL), Power and Energy Analytic Resources: Impact of hydrogen production on U.S. energy markets
Develop Production Infrastructure Options Model
Develop model for use in hydrogen production infrastructure options analysis
Directed Technologies, Inc. with SENTECH, H2Gen, Chevron and Teledyne
Provide Support Functions and Conduct Reviews
Maintain and Update the Hydrogen Analysis Resource Center (HyARC)
Keep the modeling information in the web-based HyARC up-to-date and add new data as analysts and modelers require.
PNNL
Support of the University of California at Davis
Analyze issues regarding the hydrogen infrastructure
UC Davis
Page 4 - 10 Multi-Year Research, Development and Demonstration Plan
2007
Systems Analysis
4.5 Technical Challenges
The following discussion details the various technical and programmatic barriers that must be overcome to attain the Systems Analysis goal and objectives.
Barriers
A. Future Market Behavior
Understanding the behavior and drivers of the fuel and vehicle markets is necessary to determine the long-term applications. Another major issue is the hydrogen supply, vehicle supply, and the demand for vehicles and hydrogen are all dependent and linked. To analyze various hydrogen fuel and vehicle scenarios, models need to be developed to understand these issues and their interactions.
B. Stove-piped/Siloed Analytical Capability
Analytical capabilities and resources have been largely segmented functionally by Program element (production, storage, fuel cells, etc.) and organizationally by DOE office (EERE, FE, NE, and SC) as well as by performers/analysts (laboratories, specialized teams, industry/academia, etc.). Successful systems analysis requires the coordination and integration of analysis resources across all facets of the analytical domain.
C. Inconsistent Data, Assumptions and Guidelines
Analysis results are strongly influenced by the data sets employed, as well as the assumptions and guidelines established to frame the analytical tasks. These elements have been largely uncontrolled in the past, with individual analysts and organizations making their own value decisions. Although this does not necessarily make the results wrong, it does make it more difficult to put the results and ensuing recommendations in context with other analyses and the overall objectives of the Program. Establishing a Program-endorsed consistent set of data, assumptions and guidelines is challenging because of the large number of stakeholders involved and the breadth of technologies and system requirements.
D. Suite of Models and Tools
The program currently has a group of models to use for analysis; however, the models are not sufficient to answer all analytical needs. A macro-system model is necessary to address the overarching hydrogen infrastructure as a system. Improvement of component models is necessary to make them more useable and consistent.
E. Unplanned Studies and Analysis
Every year, many analysis questions are raised that require analysis outside and, in some cases, instead of the plans made for that year. Many analysis questions need responses in brief periods of time particularly when they are driven by external requests or needs (DOE senior management, Congress, OMB, HTAC, etc.). A flexible capability to provide those results is necessary.
Multi-Year Research, Development and Demonstration Plan Page 4 - 11
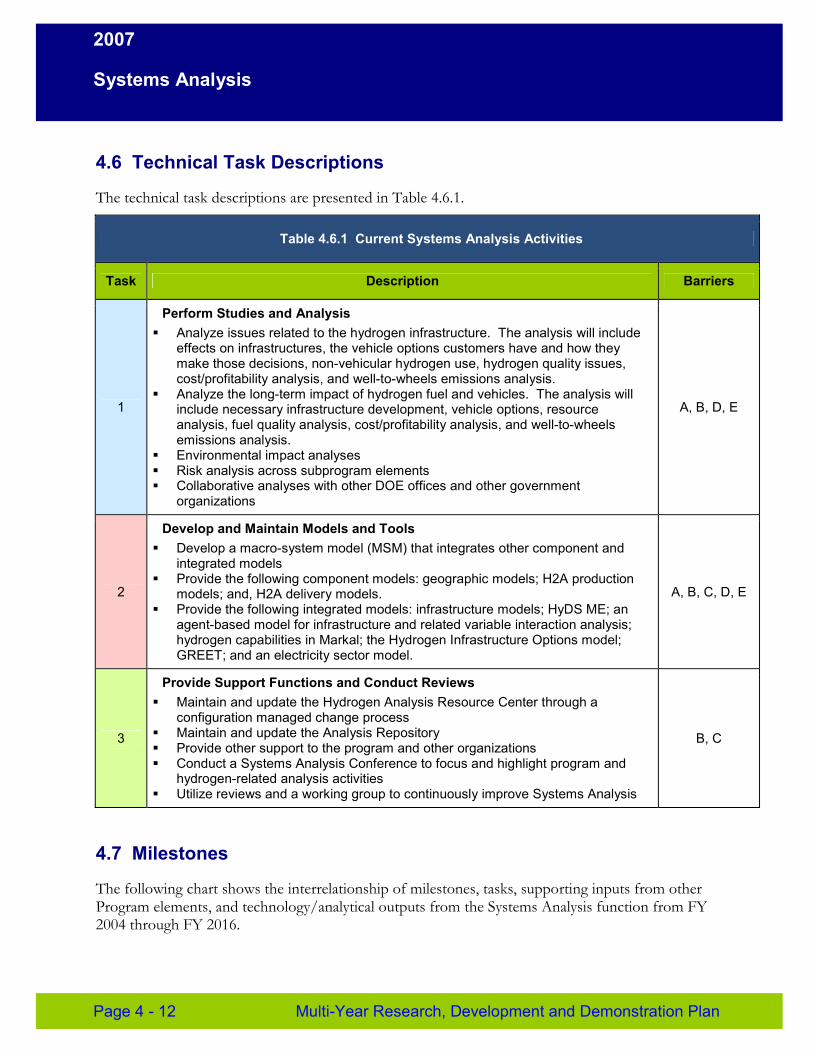
2007
Systems Analysis
4.6 Technical Task Descriptions
The technical task descriptions are presented in Table 4.6.1.
Table 4.6.1 Current Systems Analysis Activities
Task Description Barriers
1
Perform Studies and Analysis � Analyze issues related to the hydrogen infrastructure. The analysis will include
effects on infrastructures, the vehicle options customers have and how they make those decisions, non-vehicular hydrogen use, hydrogen quality issues, cost/profitability analysis, and well-to-wheels emissions analysis.
� Analyze the long-term impact of hydrogen fuel and vehicles. The analysis will include necessary infrastructure development, vehicle options, resource analysis, fuel quality analysis, cost/profitability analysis, and well-to-wheels emissions analysis.
� Environmental impact analyses � Risk analysis across subprogram elements � Collaborative analyses with other DOE offices and other government
organizations
A, B, D, E
2
Develop and Maintain Models and Tools � Develop a macro-system model (MSM) that integrates other component and
integrated models � Provide the following component models: geographic models; H2A production
models; and, H2A delivery models. � Provide the following integrated models: infrastructure models; HyDS ME; an
agent-based model for infrastructure and related variable interaction analysis; hydrogen capabilities in Markal; the Hydrogen Infrastructure Options model; GREET; and an electricity sector model.
A, B, C, D, E
3
Provide Support Functions and Conduct Reviews � Maintain and update the Hydrogen Analysis Resource Center through a
configuration managed change process � Maintain and update the Analysis Repository � Provide other support to the program and other organizations � Conduct a Systems Analysis Conference to focus and highlight program and
hydrogen-related analysis activities � Utilize reviews and a working group to continuously improve Systems Analysis
B, C
4.7 Milestones
The following chart shows the interrelationship of milestones, tasks, supporting inputs from other Program elements, and technology/analytical outputs from the Systems Analysis function from FY 2004 through FY 2016.
Page 4 - 12 Multi-Year Research, Development and Demonstration Plan
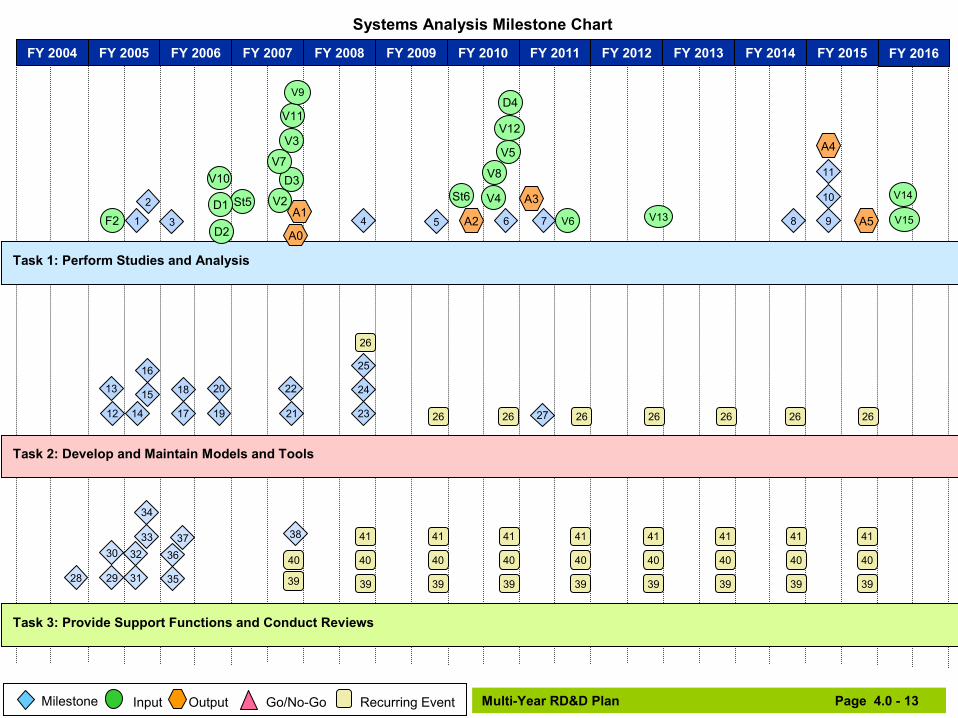
Systems Analysis Milestone Chart
FY 2004 FY 2005 FY 2006 FY 2007 FY 2008 FY 2009 FY 2010 FY 2011 FY 2012 FY 2013 FY 2014 FY 2015 FY 2016
F2 1
2
3 D2
D1
V10
St5 A1
D3
V3
V11
V7
V2
V9
A0 4 5
St6
A2 6
V5
V8
V4
V12
D4
7
A3
V6 V13 8
11
9
10
A4
A5
V14
V15
Task 1: Perform Studies and Analysis
26
16 25
13 15 18 20 22 24
: Dev
12 14 17 19 21 23 26 26 27 26 26 26 26 26
Task 2 elop and Maintain Models and Tools
34
30 33
32 37
36
38
40 40
41
40
41
40
41
40
41
40
41
40
41
40
41
40
41
28 29 31 35 39 39 39 39 39 39 39 39 39
Task 3: Provide Support Functions and Conduct Reviews
Milestone Input Output Go/No-Go Recurring Event Multi-Year RD&D Plan Page 4.0 - 13
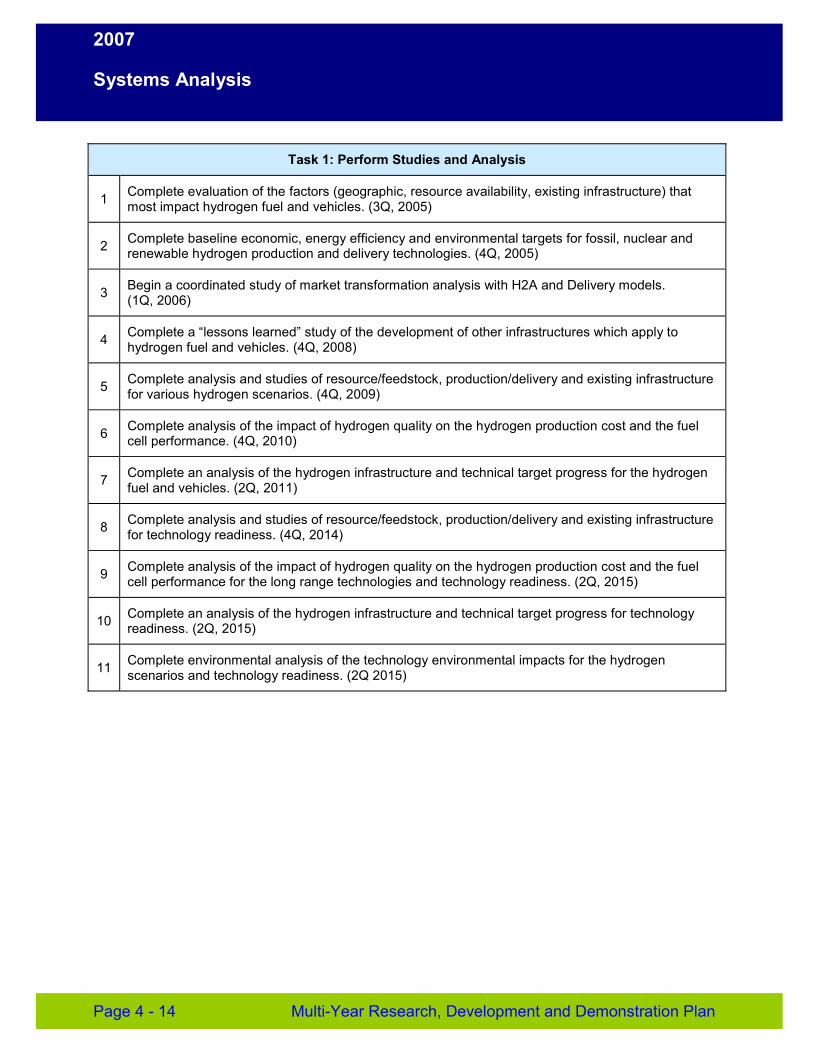
2007
Systems Analysis
Task 1: Perform Studies and Analysis
1 Complete evaluation of the factors (geographic, resource availability, existing infrastructure) that most impact hydrogen fuel and vehicles. (3Q, 2005)
2 Complete baseline economic, energy efficiency and environmental targets for fossil, nuclear and renewable hydrogen production and delivery technologies. (4Q, 2005)
3 Begin a coordinated study of market transformation analysis with H2A and Delivery models. (1Q, 2006)
4 Complete a “lessons learned” study of the development of other infrastructures which apply to hydrogen fuel and vehicles. (4Q, 2008)
5 Complete analysis and studies of resource/feedstock, production/delivery and existing infrastructure for various hydrogen scenarios. (4Q, 2009)
6 Complete analysis of the impact of hydrogen quality on the hydrogen production cost and the fuel cell performance. (4Q, 2010)
7 Complete an analysis of the hydrogen infrastructure and technical target progress for the hydrogen fuel and vehicles. (2Q, 2011)
8 Complete analysis and studies of resource/feedstock, production/delivery and existing infrastructure for technology readiness. (4Q, 2014)
9 Complete analysis of the impact of hydrogen quality on the hydrogen production cost and the fuel cell performance for the long range technologies and technology readiness. (2Q, 2015)
10 Complete an analysis of the hydrogen infrastructure and technical target progress for technology readiness. (2Q, 2015)
11 Complete environmental analysis of the technology environmental impacts for the hydrogen scenarios and technology readiness. (2Q 2015)
Page 4 - 14 Multi-Year Research, Development and Demonstration Plan
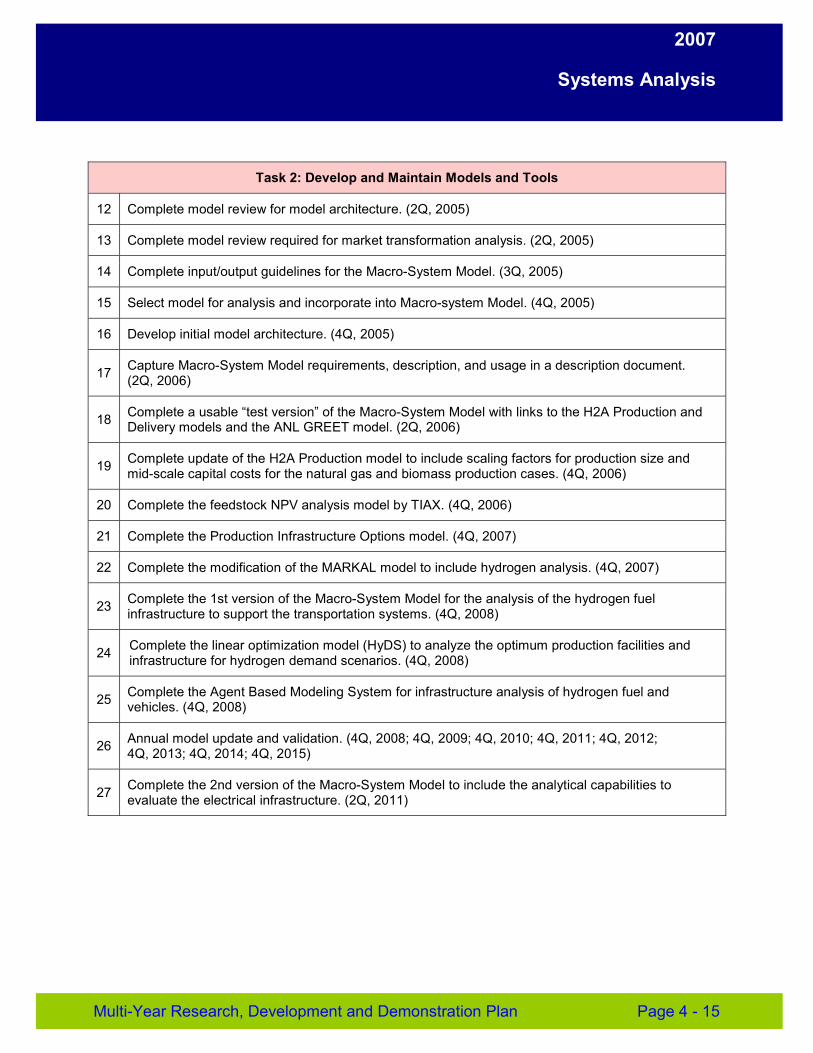
2007
Systems Analysis
Task 2: Develop and Maintain Models and Tools
12 Complete model review for model architecture. (2Q, 2005)
13 Complete model review required for market transformation analysis. (2Q, 2005)
14 Complete input/output guidelines for the Macro-System Model. (3Q, 2005)
15 Select model for analysis and incorporate into Macro-system Model. (4Q, 2005)
16 Develop initial model architecture. (4Q, 2005)
17 Capture Macro-System Model requirements, description, and usage in a description document. (2Q, 2006)
18 Complete a usable “test version” of the Macro-System Model with links to the H2A Production and Delivery models and the ANL GREET model. (2Q, 2006)
19 Complete update of the H2A Production model to include scaling factors for production size and mid-scale capital costs for the natural gas and biomass production cases. (4Q, 2006)
20 Complete the feedstock NPV analysis model by TIAX. (4Q, 2006)
21 Complete the Production Infrastructure Options model. (4Q, 2007)
22 Complete the modification of the MARKAL model to include hydrogen analysis. (4Q, 2007)
23 Complete the 1st version of the Macro-System Model for the analysis of the hydrogen fuel infrastructure to support the transportation systems. (4Q, 2008)
24 Complete the linear optimization model (HyDS) to analyze the optimum production facilities and infrastructure for hydrogen demand scenarios. (4Q, 2008)
25 Complete the Agent Based Modeling System for infrastructure analysis of hydrogen fuel and vehicles. (4Q, 2008)
26 Annual model update and validation. (4Q, 2008; 4Q, 2009; 4Q, 2010; 4Q, 2011; 4Q, 2012; 4Q, 2013; 4Q, 2014; 4Q, 2015)
27 Complete the 2nd version of the Macro-System Model to include the analytical capabilities to evaluate the electrical infrastructure. (2Q, 2011)
Multi-Year Research, Development and Demonstration Plan Page 4 - 15
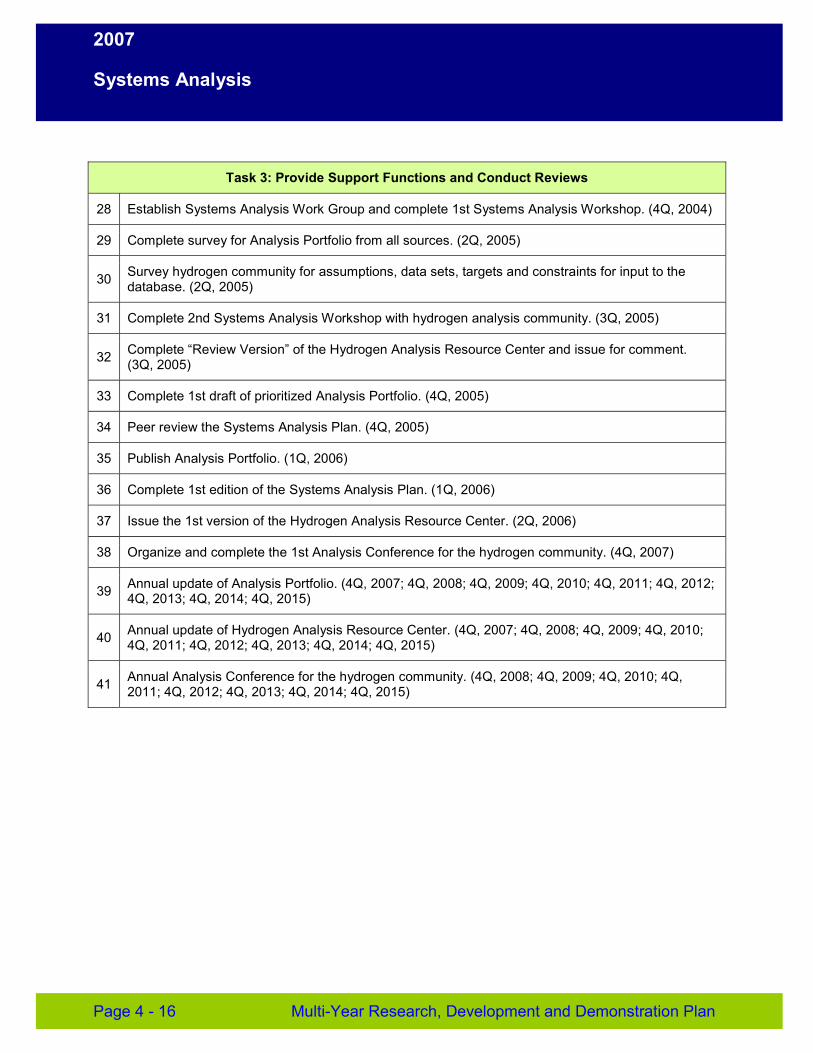
2007
Systems Analysis
Task 3: Provide Support Functions and Conduct Reviews
28 Establish Systems Analysis Work Group and complete 1st Systems Analysis Workshop. (4Q, 2004)
29 Complete survey for Analysis Portfolio from all sources. (2Q, 2005)
30 Survey hydrogen community for assumptions, data sets, targets and constraints for input to the database. (2Q, 2005)
31 Complete 2nd Systems Analysis Workshop with hydrogen analysis community. (3Q, 2005)
32 Complete “Review Version” of the Hydrogen Analysis Resource Center and issue for comment. (3Q, 2005)
33 Complete 1st draft of prioritized Analysis Portfolio. (4Q, 2005)
34 Peer review the Systems Analysis Plan. (4Q, 2005)
35 Publish Analysis Portfolio. (1Q, 2006)
36 Complete 1st edition of the Systems Analysis Plan. (1Q, 2006)
37 Issue the 1st version of the Hydrogen Analysis Resource Center. (2Q, 2006)
38 Organize and complete the 1st Analysis Conference for the hydrogen community. (4Q, 2007)
39 Annual update of Analysis Portfolio. (4Q, 2007; 4Q, 2008; 4Q, 2009; 4Q, 2010; 4Q, 2011; 4Q, 2012; 4Q, 2013; 4Q, 2014; 4Q, 2015)
40 Annual update of Hydrogen Analysis Resource Center. (4Q, 2007; 4Q, 2008; 4Q, 2009; 4Q, 2010; 4Q, 2011; 4Q, 2012; 4Q, 2013; 4Q, 2014; 4Q, 2015)
41 Annual Analysis Conference for the hydrogen community. (4Q, 2008; 4Q, 2009; 4Q, 2010; 4Q, 2011; 4Q, 2012; 4Q, 2013; 4Q, 2014; 4Q, 2015)
Page 4 - 16 Multi-Year Research, Development and Demonstration Plan
2007
Systems Analysis
Outputs
A0 Output to Production, Delivery, Storage, Fuel Cells, C&S, and Technology Validation: Initial recommended hydrogen quality at each point in the system. (4Q, 2007)
A1 Output to Production, Delivery and Systems Integration: Complete techno-economic analysis on production technologies currently being researched to meet overall Program hydrogen fuel objective. (4Q, 2007)
A2 Output to Systems Integration: Issue a report on the infrastructure analysis for the hydrogen scenarios. (2Q, 2010)
A3 Output to Systems Integration: Issue a report on the status of the technologies and infrastructure to meet the demands for the hydrogen fuel and vehicles. (1Q, 2011)
A4 Output to Systems Integration: Issue a report on the results of the infrastructure analysis for the long term technologies and requirements for technology readiness. (2Q, 2015)
A5 Output to Systems Integration: Issue report of the environmental analysis of the Hydrogen Program. (4Q, 2015)
Inputs
D1 Input from Delivery: Initial H2A delivery models characterizing the cost of hydrogen delivery by pipeline, gaseous tube trailers, and cryogenic liquid H2 trucks. (4Q, 2006)
D2 Input from Delivery: Hydrogen contaminant composition and issues. (4Q, 2006)
D3 Input from Delivery: Hydrogen delivery infrastructure analysis results. (4Q, 2007)
D4 Input from Delivery: Assessment of impact of hydrogen quality requirements on cost and performance of hydrogen delivery. (4Q, 2010)
St5 Input from Storage: Baseline hydrogen on-board storage system analysis results including hydrogen quality needs and interface issues. (1Q, 2007)
St6 Input from Storage: Final on-board hydrogen storage system analysis results of cost and performance; and down-select to a primary on-board storage system candidate. (1Q, 2010)
F2 Develop preliminary hydrogen quality requirements. (2Q, 2005)
V2 Input from Technology Validation: Final report for first generation vehicles and interim progress report for second generation vehicles, on performance, safety and O&M. (3Q, 2007)
V3 Input from Technology Validation: Technology status report and provide feedback to the R&D program. (4Q, 2007)
Multi-Year Research, Development and Demonstration Plan Page 4 - 17
2007
Systems Analysis
V4 Input from Technology Validation: Final report for second generation vehicles on performance, safety and O&M. (3Q, 2010)
V5 Input from Technology Validation: Technology status report and re-focused R&D recommendations. (4Q, 2010)
V6 Input from Technology Validation: Validate cold start-up capability (in a vehicle with an 8-hour soak) against 2010 targets (time and start-up and shut-down energy). (3Q, 2011)
V7 Input from Technology Validation: Final report on infrastructure and hydrogen quality for first generation vehicles. (3Q, 2007)
V8 Input from Technology Validation: Final report on infrastructure, including impact of hydrogen quality for second generation vehicles. (3Q, 2010)
V9 Input from Technology Validation: Final report on safety and O&M for three refueling stations. (4Q, 2007 )
V10 Input from Technology Validation: Hydrogen refueling station analysis – proposed interstate refueling station locations. (4Q, 2006)
V11 Input from Technology Validation: Composite results of analyses and modeling from vehicle and infrastructure data collected under the learning demonstration project. (4Q, 2007)
V12 Input from Technology Validation: Final composite results of analyses and modeling from vehicle and infrastructure data collected under the Learning Demonstration Project. (4Q, 2010)
V13 Input from Technology Validation: Final report for 3500 hour durability test. (4Q, 2012)
V14 Input from Technology Validation: Report on the status of validation of 5000 hour durability target and cold-start capability. (2Q, 2016)
V15 Input from Technology Validation: Composite data products for infrastructure report. (2Q, 2016)
Page 4 - 18 Multi-Year Research, Development and Demonstration Plan
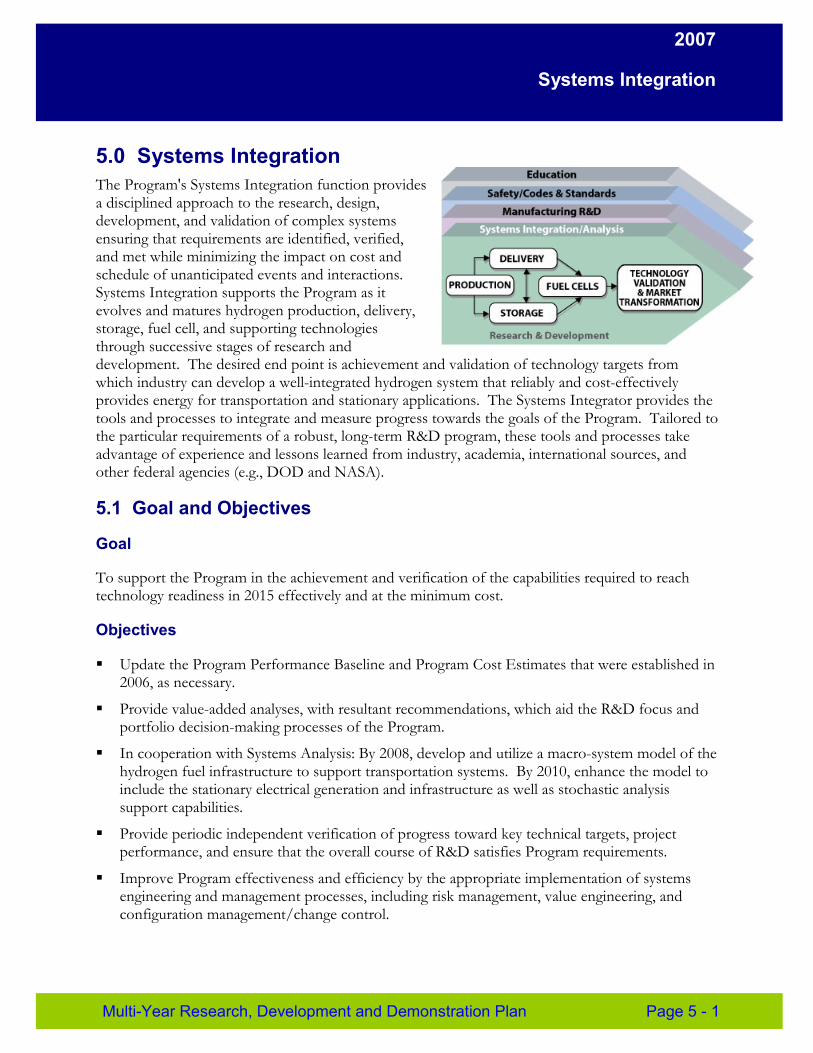
2007
Systems Integration
5.0 Systems Integration The Program's Systems Integration function provides a disciplined approach to the research, design, development, and validation of complex systems ensuring that requirements are identified, verified, and met while minimizing the impact on cost and schedule of unanticipated events and interactions. Systems Integration supports the Program as it evolves and matures hydrogen production, delivery, storage, fuel cell, and supporting technologies through successive stages of research and development. The desired end point is achievement and validation of technology targets from which industry can develop a well-integrated hydrogen system that reliably and cost-effectively provides energy for transportation and stationary applications. The Systems Integrator provides the tools and processes to integrate and measure progress towards the goals of the Program. Tailored to the particular requirements of a robust, long-term R&D program, these tools and processes take advantage of experience and lessons learned from industry, academia, international sources, and other federal agencies (e.g., DOD and NASA).
5.1 Goal and Objectives
Goal
To support the Program in the achievement and verification of the capabilities required to reach technology readiness in 2015 effectively and at the minimum cost.
Objectives
� Update the Program Performance Baseline and Program Cost Estimates that were established in 2006, as necessary.
� Provide value-added analyses, with resultant recommendations, which aid the R&D focus and portfolio decision-making processes of the Program.
� In cooperation with Systems Analysis: By 2008, develop and utilize a macro-system model of the hydrogen fuel infrastructure to support transportation systems. By 2010, enhance the model to include the stationary electrical generation and infrastructure as well as stochastic analysis support capabilities.
� Provide periodic independent verification of progress toward key technical targets, project performance, and ensure that the overall course of R&D satisfies Program requirements.
� Improve Program effectiveness and efficiency by the appropriate implementation of systems engineering and management processes, including risk management, value engineering, and configuration management/change control.
Multi-Year Research, Development and Demonstration Plan Page 5 - 1
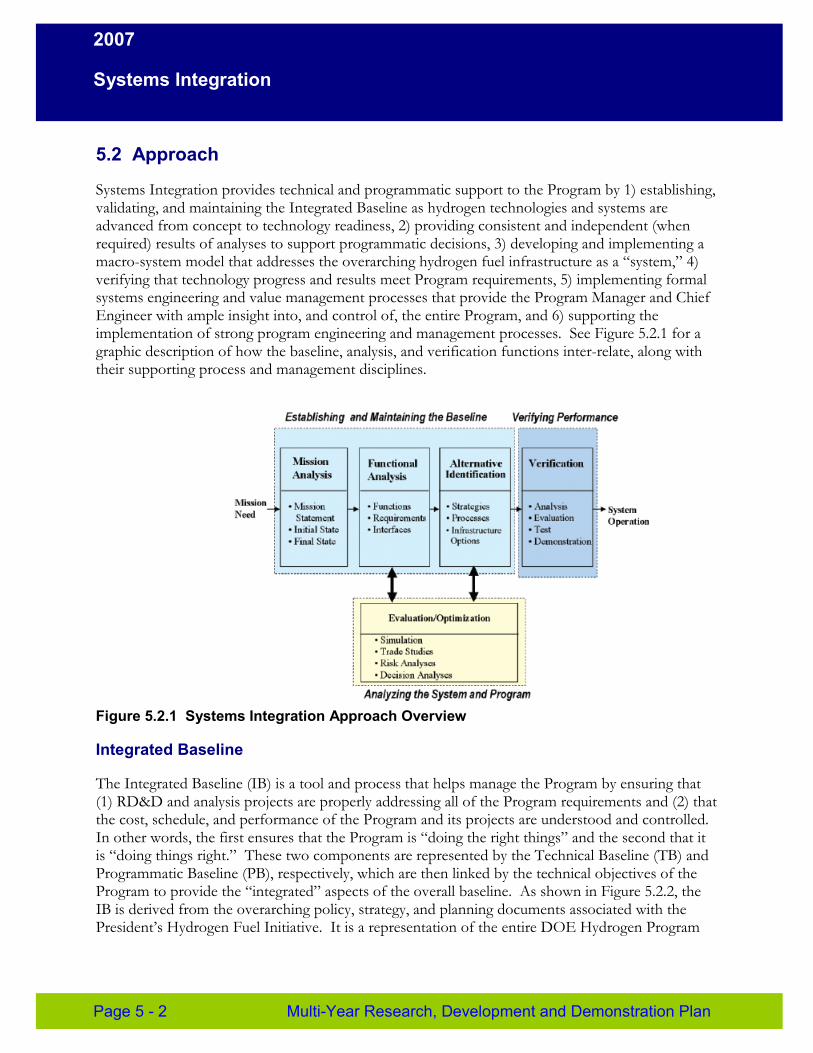
2007
Systems Integration
5.2 Approach
Systems Integration provides technical and programmatic support to the Program by 1) establishing, validating, and maintaining the Integrated Baseline as hydrogen technologies and systems are advanced from concept to technology readiness, 2) providing consistent and independent (when required) results of analyses to support programmatic decisions, 3) developing and implementing a macro-system model that addresses the overarching hydrogen fuel infrastructure as a “system,” 4) verifying that technology progress and results meet Program requirements, 5) implementing formal systems engineering and value management processes that provide the Program Manager and Chief Engineer with ample insight into, and control of, the entire Program, and 6) supporting the implementation of strong program engineering and management processes. See Figure 5.2.1 for a graphic description of how the baseline, analysis, and verification functions inter-relate, along with their supporting process and management disciplines.
Figure 5.2.1 Systems Integration Approach Overview
Integrated Baseline
The Integrated Baseline (IB) is a tool and process that helps manage the Program by ensuring that (1) RD&D and analysis projects are properly addressing all of the Program requirements and (2) that the cost, schedule, and performance of the Program and its projects are understood and controlled. In other words, the first ensures that the Program is “doing the right things” and the second that it is “doing things right.” These two components are represented by the Technical Baseline (TB) and Programmatic Baseline (PB), respectively, which are then linked by the technical objectives of the Program to provide the “integrated” aspects of the overall baseline. As shown in Figure 5.2.2, the IB is derived from the overarching policy, strategy, and planning documents associated with the President’s Hydrogen Fuel Initiative. It is a representation of the entire DOE Hydrogen Program
Page 5 - 2 Multi-Year Research, Development and Demonstration Plan
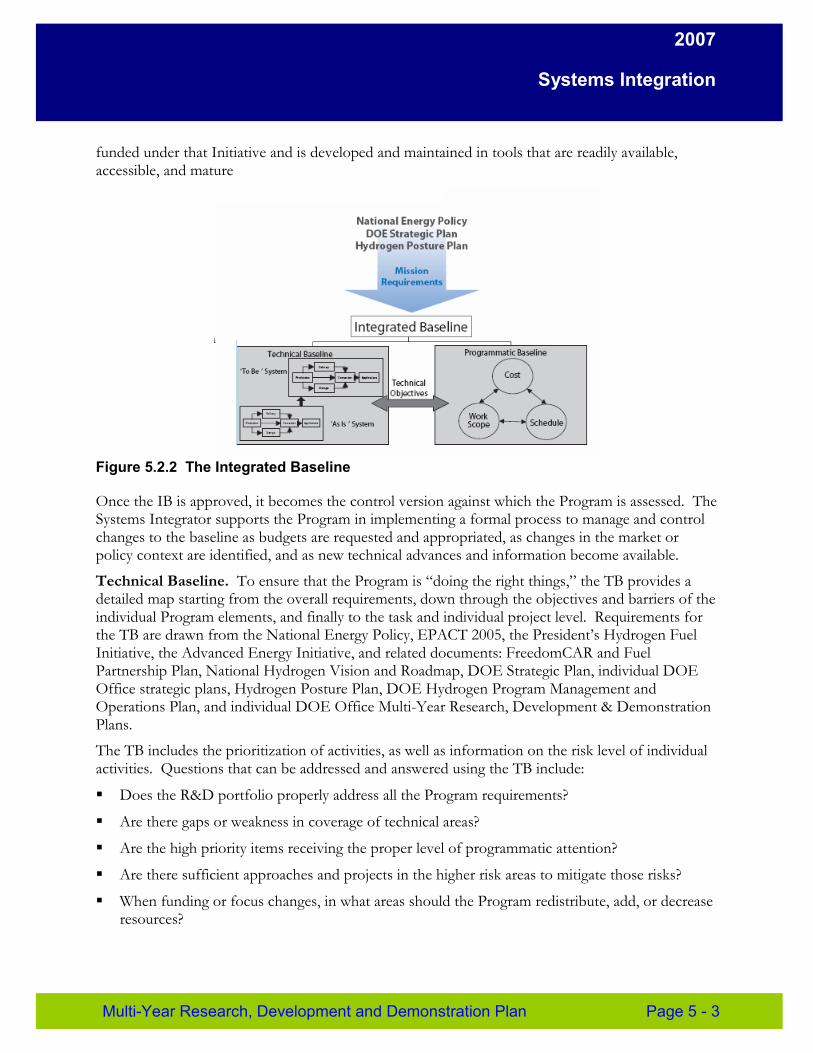
2007
Systems Integration
funded under that Initiative and is developed and maintained in tools that are readily available, accessible, and mature
Figure 5.2.2 The Integrated Baseline
Once the IB is approved, it becomes the control version against which the Program is assessed. The Systems Integrator supports the Program in implementing a formal process to manage and control changes to the baseline as budgets are requested and appropriated, as changes in the market or policy context are identified, and as new technical advances and information become available.
Technical Baseline. To ensure that the Program is “doing the right things,” the TB provides a detailed map starting from the overall requirements, down through the objectives and barriers of the individual Program elements, and finally to the task and individual project level. Requirements for the TB are drawn from the National Energy Policy, EPACT 2005, the President’s Hydrogen Fuel Initiative, the Advanced Energy Initiative, and related documents: FreedomCAR and Fuel Partnership Plan, National Hydrogen Vision and Roadmap, DOE Strategic Plan, individual DOE Office strategic plans, Hydrogen Posture Plan, DOE Hydrogen Program Management and Operations Plan, and individual DOE Office Multi-Year Research, Development & Demonstration Plans.
The TB includes the prioritization of activities, as well as information on the risk level of individual activities. Questions that can be addressed and answered using the TB include:
� Does the R&D portfolio properly address all the Program requirements?
� Are there gaps or weakness in coverage of technical areas?
� Are the high priority items receiving the proper level of programmatic attention?
� Are there sufficient approaches and projects in the higher risk areas to mitigate those risks?
� When funding or focus changes, in what areas should the Program redistribute, add, or decrease resources?
Multi-Year Research, Development and Demonstration Plan Page 5 - 3
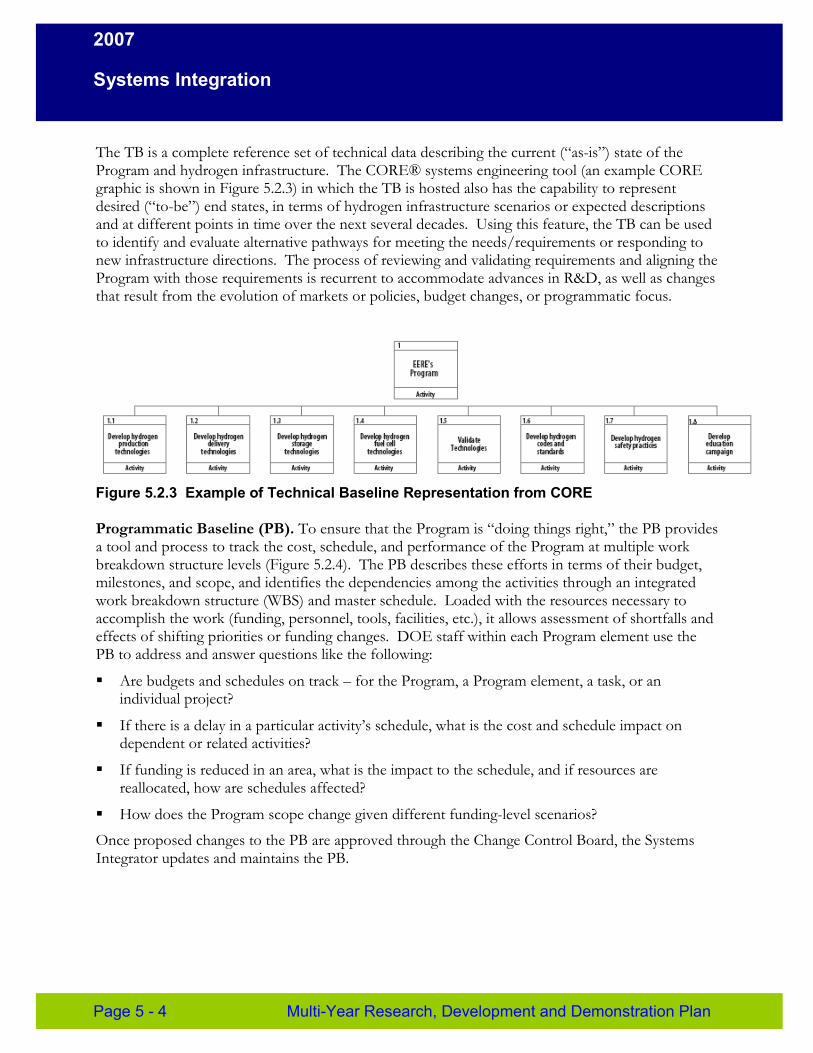
2007
Systems Integration
The TB is a complete reference set of technical data describing the current (“as-is”) state of the Program and hydrogen infrastructure. The CORE® systems engineering tool (an example CORE graphic is shown in Figure 5.2.3) in which the TB is hosted also has the capability to represent desired (“to-be”) end states, in terms of hydrogen infrastructure scenarios or expected descriptions and at different points in time over the next several decades. Using this feature, the TB can be used to identify and evaluate alternative pathways for meeting the needs/requirements or responding to new infrastructure directions. The process of reviewing and validating requirements and aligning the Program with those requirements is recurrent to accommodate advances in R&D, as well as changes that result from the evolution of markets or policies, budget changes, or programmatic focus.
Figure 5.2.3 Example of Technical Baseline Representation from CORE
Programmatic Baseline (PB). To ensure that the Program is “doing things right,” the PB provides a tool and process to track the cost, schedule, and performance of the Program at multiple work breakdown structure levels (Figure 5.2.4). The PB describes these efforts in terms of their budget, milestones, and scope, and identifies the dependencies among the activities through an integrated work breakdown structure (WBS) and master schedule. Loaded with the resources necessary to accomplish the work (funding, personnel, tools, facilities, etc.), it allows assessment of shortfalls and effects of shifting priorities or funding changes. DOE staff within each Program element use the PB to address and answer questions like the following:
� Are budgets and schedules on track – for the Program, a Program element, a task, or an individual project?
� If there is a delay in a particular activity’s schedule, what is the cost and schedule impact on dependent or related activities?
� If funding is reduced in an area, what is the impact to the schedule, and if resources are reallocated, how are schedules affected?
� How does the Program scope change given different funding-level scenarios?
Once proposed changes to the PB are approved through the Change Control Board, the Systems Integrator updates and maintains the PB.
Page 5 - 4 Multi-Year Research, Development and Demonstration Plan
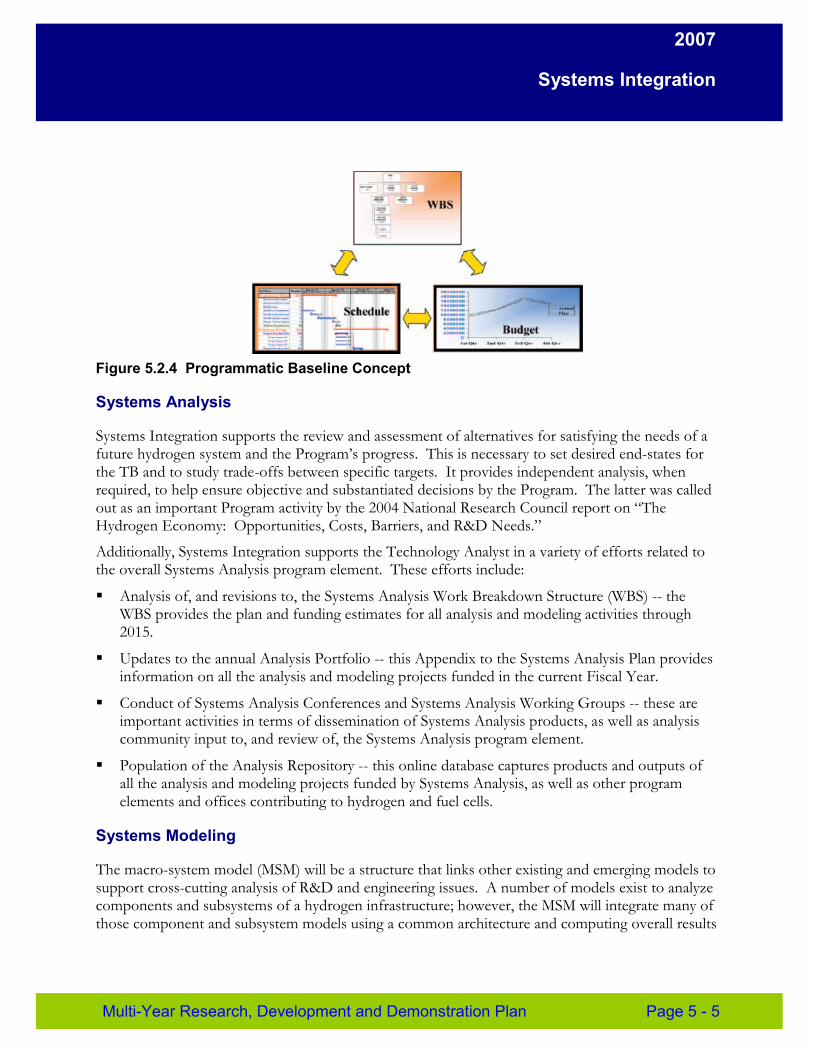
2007
Systems Integration
Figure 5.2.4 Programmatic Baseline Concept
Systems Analysis
Systems Integration supports the review and assessment of alternatives for satisfying the needs of a future hydrogen system and the Program’s progress. This is necessary to set desired end-states for the TB and to study trade-offs between specific targets. It provides independent analysis, when required, to help ensure objective and substantiated decisions by the Program. The latter was called out as an important Program activity by the 2004 National Research Council report on “The Hydrogen Economy: Opportunities, Costs, Barriers, and R&D Needs.”
Additionally, Systems Integration supports the Technology Analyst in a variety of efforts related to the overall Systems Analysis program element. These efforts include:
� Analysis of, and revisions to, the Systems Analysis Work Breakdown Structure (WBS) -- the WBS provides the plan and funding estimates for all analysis and modeling activities through 2015.
� Updates to the annual Analysis Portfolio -- this Appendix to the Systems Analysis Plan provides information on all the analysis and modeling projects funded in the current Fiscal Year.
� Conduct of Systems Analysis Conferences and Systems Analysis Working Groups -- these are important activities in terms of dissemination of Systems Analysis products, as well as analysis community input to, and review of, the Systems Analysis program element.
� Population of the Analysis Repository -- this online database captures products and outputs of all the analysis and modeling projects funded by Systems Analysis, as well as other program elements and offices contributing to hydrogen and fuel cells.
Systems Modeling
The macro-system model (MSM) will be a structure that links other existing and emerging models to support cross-cutting analysis of R&D and engineering issues. A number of models exist to analyze components and subsystems of a hydrogen infrastructure; however, the MSM will integrate many of those component and subsystem models using a common architecture and computing overall results
Multi-Year Research, Development and Demonstration Plan Page 5 - 5
2007
Systems Integration
(i.e., it is the tool that will address the overarching hydrogen fuel infrastructure as a system, including all aspects of hydrogen production/use).
The primary objective of the MSM will be to support programmatic decisions regarding investment levels and to focus R&D. The MSM will be utilized to address overarching analysis questions. Examples of these questions include system option-analysis regarding hydrogen quality, feedback effects of infrastructure development on production cost, and changes in emissions due to a growing hydrogen infrastructure. The MSM will be a tool that estimates how and when proposed technologies might fit into a national energy infrastructure.
The MSM is being developed on the Enterprise Modeling Framework (EMF) that is an outgrowth of High Level Architecture (HLA). HLA is a general-purpose architecture for simulation reuse and interoperability that was developed by the Defense Modeling and Simulation Office (DMSO) to run large, distributed war games. HLA links component models to analyze cross-cutting issues; in this case, well-to-wheels pathway analysis, hydrogen quality, and other issues. We selected HLA because, like the DMSO problem, the MSM requires interaction of many component models and has both spatial and temporal issues.
Technical Performance Verification
As the Program develops new technologies and produces research results, Systems Integration facilitates technical reviews at key stages to evaluate strategic fit with Program objectives, technical potential, economic/market potential, and environmental, health, and safety considerations along with the plan for further development. Verification will be accomplished through analysis, testing, and/or demonstration. Criteria and approaches will vary depending on the maturity of the technology. For example, at early stages of development, information available to evaluate concepts is likely to be more general and have higher uncertainty than that available at later stages. Information stemming from these reviews will be used to re-evaluate the baseline.
In some cases, Systems Integration convenes technical review panels of peer experts to provide an independent assessment and recommendation to DOE for consideration during the decision process. This is particularly true for major Go/No-Go decisions of the Program, as well as when an assessment of progress toward one of the key technical targets of the Program is warranted. In FY2006, for example, independent analyses are being conducted to support Go/No-Go decisions pertaining to cryo-compressed hydrogen storage and single-walled carbon nanotubes for hydrogen storage. Moreover, independent analyses were conducted on progress towards achieving key technical targets for fuel cell system costs and production cost of hydrogen from distributed steam methane reforming.
The Systems Integrator works closely with the DOE Technology Development Managers to bring knowledge of system-level requirements and review criteria to planning and execution. In particular, the Systems Integrator supports reviews of the following Program activities:
� Peer review for all projects and activities
� Independent review panels for key Program milestones and Go/No-Go decisions
� Stage Gate reviews at key progress points for significant projects.
Page 5 - 6 Multi-Year Research, Development and Demonstration Plan
2007
Systems Integration
Systems Engineering and Value Management
Systems Integration supports the Program by aiding implementation of several key processes, three of which are described below:
Risk Management. Systems Integration supports implementation of a risk management process to identify potential Program risks and determine actions that will mitigate the impact of those risks. The Risk Management Plan (RMP) describes methods for identifying, assessing, prioritizing, and analyzing risk drivers; developing risk-handling plans; and planning for adequate resources to handle risk. The RMP assigns specific responsibilities for the management of risk and prescribes the documenting, monitoring, and reporting processes to be followed. A six-step risk process—risk awareness, identification, quantification, handling, impact determination, and reporting and tracking—will be used. Throughout the life of the Program, the Systems Integrator helps identify “potential” risks, focusing on the critical areas that could affect the outcome of the Program such as:
� System Requirements
� Environment, Safety, and Health
� Modeling and Simulation Accuracy
� Technology Capability
� Budget and Funding Management
� Schedule
� Stakeholder, Legal, and Regulatory Issues.
Configuration Management. Systems Integration manages the evolving configuration of the Technical Baseline and continuously monitors and controls it. Changes to the Technical Baseline and the Programmatic Baseline (the approved work scope, schedule, and cost) must both be controlled to ensure that all work being performed is consistent with the approved technical requirements and the current configuration, and that potential impacts throughout the Integrated Baseline are considered before actions are taken. A formal change control process has been established to ensure that the potential impacts of proposed changes to either the Technical Baseline or the Programmatic Baseline are evaluated, coordinated, controlled, reviewed, approved, and documented in a manner that best serves the Program and its projects. The decision-making body within the Program for approving proposed changes is the Change Control Board, headed by the Chief Engineer. The procedures and processes will be documented in a Configuration Management Plan.
Earned Value Management System. The Program is comprised of numerous complex projects, many of which are on the leading edge of technology. To be successful, the Program Manager must have ample insight to, and control of, the entire Program. An element of that insight and control is provided by implementing an Earned Value Management System (EVMS) in accordance with direction from the Secretary of Energy and DOE Order 413.3, Program and Project Management for the Acquisition of Capital Assets. The EVMS for the Program follows the guidance provided in the Department’s (Draft) Earned Value Management Application Guide (Version 1.6, January 1, 2005).
Multi-Year Research, Development and Demonstration Plan Page 5 - 7
2007
Systems Integration
This guidance includes tailoring the EVMS for a research and development program, such as the DOE Hydrogen Program.
By implementing a tailored, top-level EVMS process, the Program management team is able to:
� Establish a standard approach for organizing the various elements of the Program
� Facilitate the formation of a comprehensive time-phased budget based on thorough schedule planning and cost estimating
� Capture actual costs incurred by the Program
� Determine real, specific work progress on the Program in terms of cost and schedule
� Measure performance against an approved Program baseline.
Program Support
Systems Integration provides analyses and recommends DOE-sponsored activities to make sure R&D results are shared throughout the hydrogen community, thus ensuring the development of the necessary technological capabilities at the lowest possible cost. Specific support is provided to the overall Program in the following areas:
� Annual Merit Review -- Systems Integration coordinates the conduct of the annual review of the Program, during which typically 250 funded projects present their results in oral or poster formats. In addition, a team of ~150 peer reviewers evaluate approximately one-half of the presented projects for feedback to the Program.
� Annual Progress Report -- This annual report, in professional journal format, summarizes the objectives, approach, technical accomplishments, and future plans for each of the projects funded by the Program.
� Hydrogen Technical Advisory Committee (HTAC) -- Systems Integration provides coordination and technical support to this FACA-level committee which reviews the Program and provides information and recommendations to the Secretary of Energy.
� DOE Hydrogen Program Website -- This website provides a one-stop-shop for all the hydrogen and fuel cell activities of DOE, across the offices of EERE, FE, NE, and SC.
Page 5 - 8 Multi-Year Research, Development and Demonstration Plan
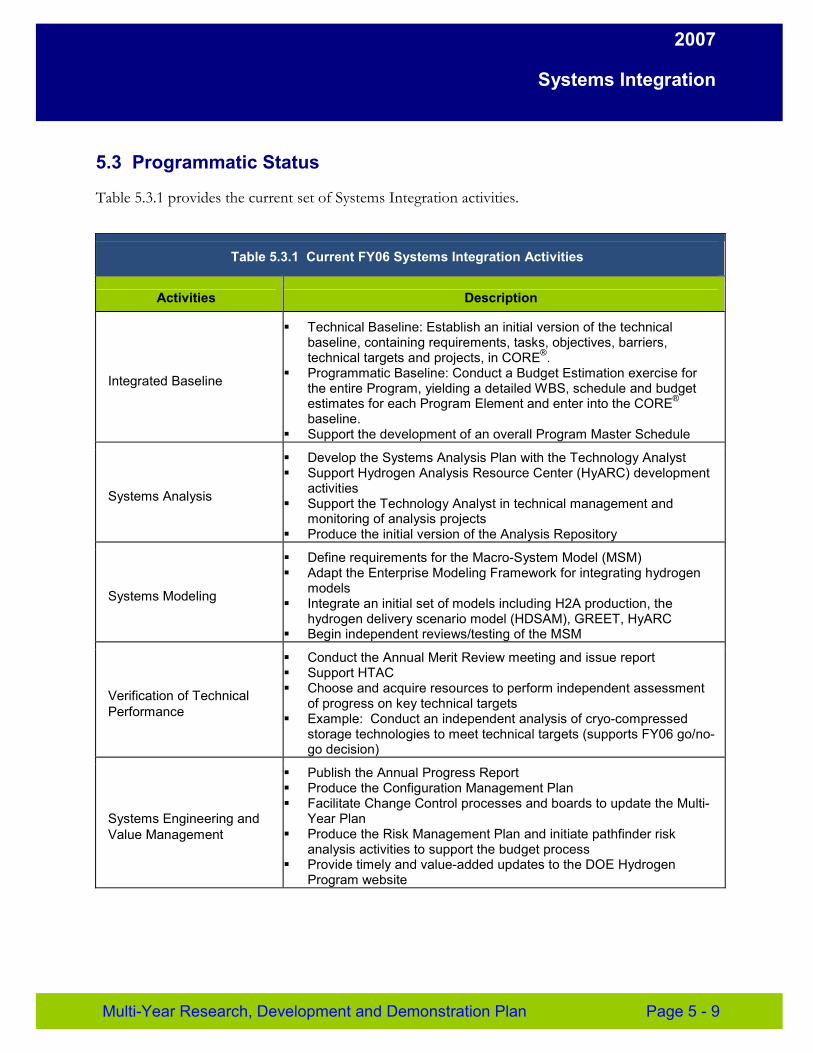
2007
Systems Integration
5.3 Programmatic Status
Table 5.3.1 provides the current set of Systems Integration activities.
Table 5.3.1 Current FY06 Systems Integration Activities
Activities Description
Integrated Baseline
� Technical Baseline: Establish an initial version of the technical baseline, containing requirements, tasks, objectives, barriers, technical targets and projects, in CORE® .
� Programmatic Baseline: Conduct a Budget Estimation exercise for the entire Program, yielding a detailed WBS, schedule and budget estimates for each Program Element and enter into the CORE®
baseline. � Support the development of an overall Program Master Schedule
Systems Analysis
� Develop the Systems Analysis Plan with the Technology Analyst � Support Hydrogen Analysis Resource Center (HyARC) development
activities � Support the Technology Analyst in technical management and
monitoring of analysis projects � Produce the initial version of the Analysis Repository
Systems Modeling
� Define requirements for the Macro-System Model (MSM) � Adapt the Enterprise Modeling Framework for integrating hydrogen
models � Integrate an initial set of models including H2A production, the
hydrogen delivery scenario model (HDSAM), GREET, HyARC � Begin independent reviews/testing of the MSM
Verification of Technical Performance
� Conduct the Annual Merit Review meeting and issue report � Support HTAC � Choose and acquire resources to perform independent assessment
of progress on key technical targets � Example: Conduct an independent analysis of cryo-compressed
storage technologies to meet technical targets (supports FY06 go/nogo decision)
Systems Engineering and Value Management
� Publish the Annual Progress Report � Produce the Configuration Management Plan � Facilitate Change Control processes and boards to update the Multi-
Year Plan � Produce the Risk Management Plan and initiate pathfinder risk
analysis activities to support the budget process � Provide timely and value-added updates to the DOE Hydrogen
Program website
Multi-Year Research, Development and Demonstration Plan Page 5 - 9
2007
Systems Integration
5.4 Challenges
The following discussion details the various technical and programmatic barriers that must be overcome to attain the DOE Hydrogen Program Systems Integration goal and objectives.
A. Program Complexity. The DOE Hydrogen Program is comprised of nearly 300 projects spread across different organizations, addressing a variety of technological disciplines, many of which are on the leading edge of technology. Further complicating the ability to properly integrate the Program is the geographical dispersal of these organizations, the long-term duration of the Program, and the multitude of external stakeholders. The breadth and depth of the Program make it a challenge to encompass all aspects into the Integrated Baseline. Both vertical and horizontal integration will be necessary to integrate the Program under a unified system and to ensure integrated management and optimization of work flow across organizational boundaries. Completeness is important, because a true assessment of the sufficiency of program efforts against the requirements can only be made if the entire Program is represented. The four DOE offices (EERE, FE, NE, and SC) and other programs and agencies (e.g. Department of Transportation) that are involved in work under the President’s Hydrogen Fuel Initiative each have their own baselining and scheduling requirements, which must be consistent and interrelated.
B. Adapting System Integration Functions to an R&D Program. Systems integration has most often been applied to the design, development, production, and maintenance of large, complex acquisition or construction projects. Implementing systems integration within an ongoing R&D program without delaying or disrupting current efforts represents a significant challenge, especially when the process has not been institutionalized within the organization.
C. Inherent Uncertainty in R&D. Most systems integration and engineering efforts have been applied to large hardware and software acquisition projects, not R&D programs. Given the inherent uncertainties with regard to achieving desired outcomes from the research and development of new technologies, tailoring the systems integration procedures and tools to the R&D paradigm will be a challenge, as will be gaining Program and stakeholder acceptance of these processes as value-added and important to both Program Element and overall Program success.
D. Accessibility/Availability of Technical Information. The cost-effective availability and accessibility of the most up-to-date technical results are necessary to support programmatic decision making. Within the Program, technical information relevant to a particular issue must be collected from a wide array of sources—from people in different organizations, who developed it originally without necessarily considering its role in management decision-making. To ensure that results from many sources are technically and practically realistic, these diverse technical results require a vetting process.
5.5 Task Descriptions
The task descriptions are presented in Table 5.5.1.
Page 5 - 10 Multi-Year Research, Development and Demonstration Plan
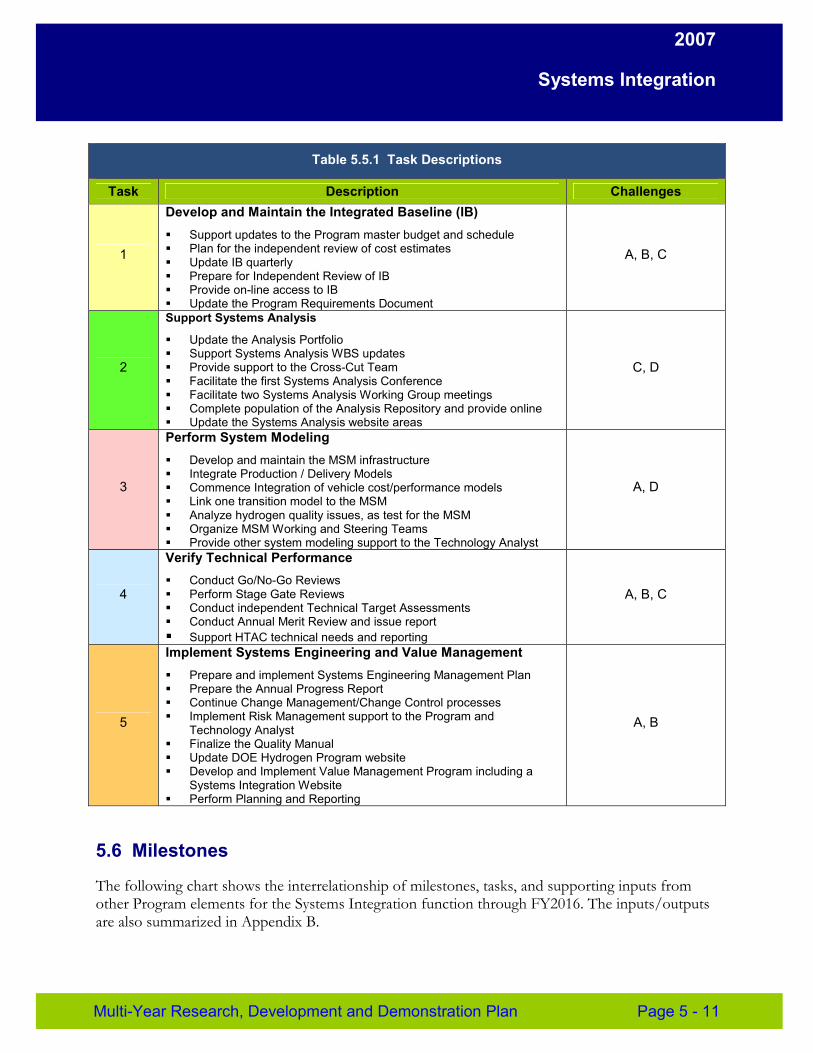
2007
Systems Integration
Table 5.5.1 Task Descriptions
Task Description Challenges
1
Develop and Maintain the Integrated Baseline (IB) � Support updates to the Program master budget and schedule � Plan for the independent review of cost estimates � Update IB quarterly � Prepare for Independent Review of IB � Provide on-line access to IB � Update the Program Requirements Document
A, B, C
2
Support Systems Analysis
� Update the Analysis Portfolio � Support Systems Analysis WBS updates � Provide support to the Cross-Cut Team � Facilitate the first Systems Analysis Conference � Facilitate two Systems Analysis Working Group meetings � Complete population of the Analysis Repository and provide online � Update the Systems Analysis website areas
C, D
3
Perform System Modeling � Develop and maintain the MSM infrastructure � Integrate Production / Delivery Models � Commence Integration of vehicle cost/performance models � Link one transition model to the MSM � Analyze hydrogen quality issues, as test for the MSM � Organize MSM Working and Steering Teams � Provide other system modeling support to the Technology Analyst
A, D
4
Verify Technical Performance � Conduct Go/No-Go Reviews � Perform Stage Gate Reviews � Conduct independent Technical Target Assessments � Conduct Annual Merit Review and issue report � Support HTAC technical needs and reporting
A, B, C
5
Implement Systems Engineering and Value Management � Prepare and implement Systems Engineering Management Plan � Prepare the Annual Progress Report � Continue Change Management/Change Control processes � Implement Risk Management support to the Program and
Technology Analyst � Finalize the Quality Manual � Update DOE Hydrogen Program website � Develop and Implement Value Management Program including a
Systems Integration Website � Perform Planning and Reporting
A, B
5.6 Milestones
The following chart shows the interrelationship of milestones, tasks, and supporting inputs from other Program elements for the Systems Integration function through FY2016. The inputs/outputs are also summarized in Appendix B.
Multi-Year Research, Development and Demonstration Plan Page 5 - 11
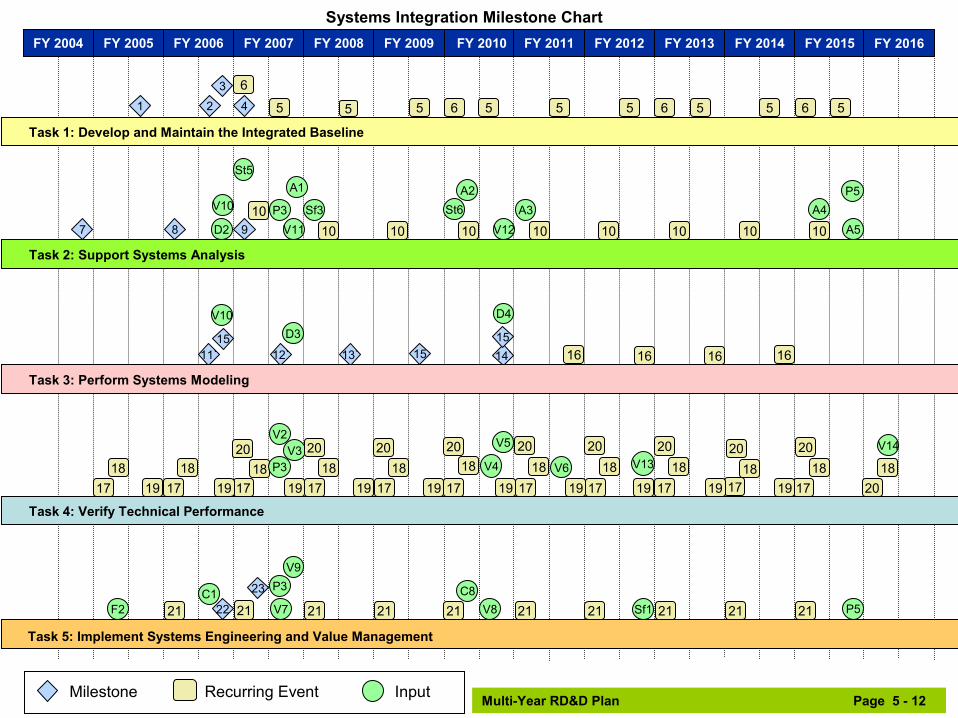
Systems Integration Milestone Chart FY 2004 FY 2005 FY 2006 FY 2007 FY 2008 FY 2009
1
7
2
3
4
8 9
11` 12` 13` 15
15
23
22
V11
V2 V3
V7
V10
P3
D2
D3
St5
V9
C1
Sf3
A1
F2
5 5 5
6
10 10 10
17 17 17 17 1719 19 19 19 19
21 21 21 21
18 18 18 18 18 20 20 20
P3
P3
Task 1: Develop and Maintain the Integrated Baseline
Task 2: Support Systems Analysis
Task 3: Perform Systems Modeling
Task 4: Verify Technical Performance
Task 5: Implement Systems Engineering and Value Management
V10
FY 2010
14` 15
V12
V4
V5
V8
D4
St6
C8
A2
56
10
17 19
21
18 20
FY 2011
A3
V6
5
10
16
17 19
21
18 20
FY 2012
V13
Sf1
5
10
16
17 19
21
18 20
FY 2013
56
10
16
17 19
21
18 20
FY 2014
5
10
16
17 19
21
18 20
FY 2015
A4 A5
56
10
17
21
18 20
P5
P5
FY 2016
18 20
V14
Milestone Recurring Event Input Multi-Year RD&D Plan Page 5 - 12
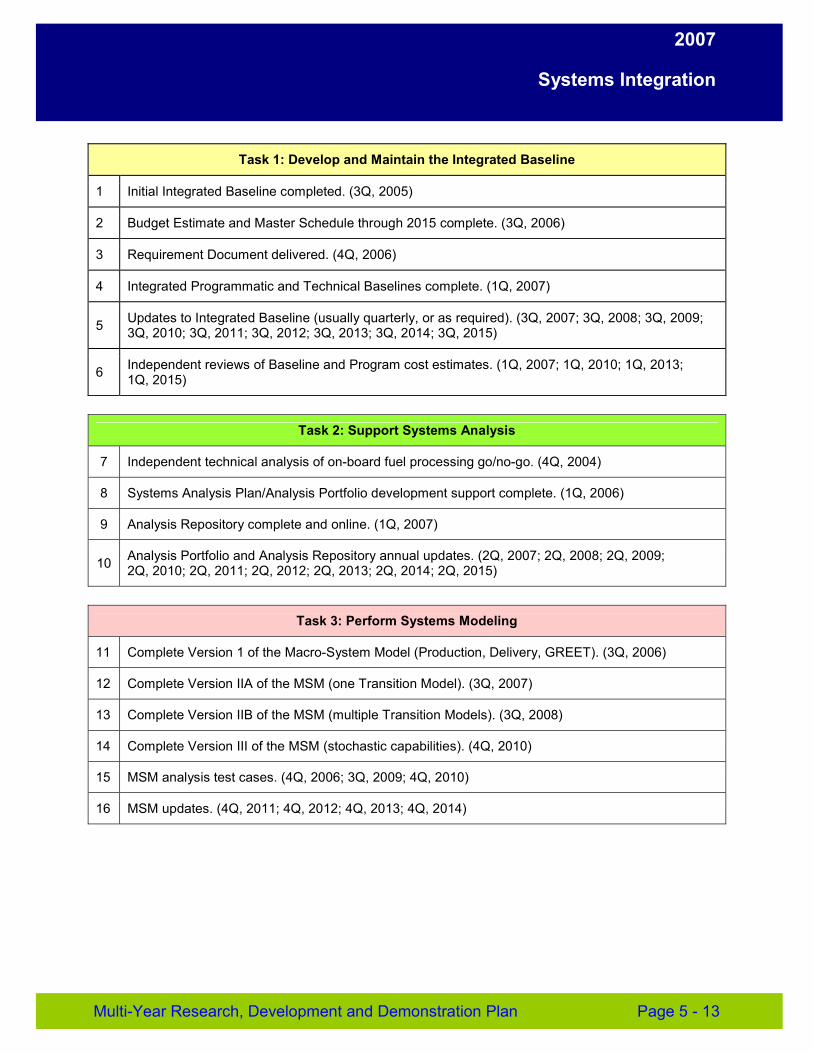
2007
Systems Integration
Task 1: Develop and Maintain the Integrated Baseline
1 Initial Integrated Baseline completed. (3Q, 2005)
2 Budget Estimate and Master Schedule through 2015 complete. (3Q, 2006)
3 Requirement Document delivered. (4Q, 2006)
4 Integrated Programmatic and Technical Baselines complete. (1Q, 2007)
5 Updates to Integrated Baseline (usually quarterly, or as required). (3Q, 2007; 3Q, 2008; 3Q, 2009; 3Q, 2010; 3Q, 2011; 3Q, 2012; 3Q, 2013; 3Q, 2014; 3Q, 2015)
6 Independent reviews of Baseline and Program cost estimates. (1Q, 2007; 1Q, 2010; 1Q, 2013; 1Q, 2015)
Task 2: Support Systems Analysis
7 Independent technical analysis of on-board fuel processing go/no-go. (4Q, 2004)
8 Systems Analysis Plan/Analysis Portfolio development support complete. (1Q, 2006)
9 Analysis Repository complete and online. (1Q, 2007)
10 Analysis Portfolio and Analysis Repository annual updates. (2Q, 2007; 2Q, 2008; 2Q, 2009; 2Q, 2010; 2Q, 2011; 2Q, 2012; 2Q, 2013; 2Q, 2014; 2Q, 2015)
Task 3: Perform Systems Modeling
11 Complete Version 1 of the Macro-System Model (Production, Delivery, GREET). (3Q, 2006)
12 Complete Version IIA of the MSM (one Transition Model). (3Q, 2007)
13 Complete Version IIB of the MSM (multiple Transition Models). (3Q, 2008)
14 Complete Version III of the MSM (stochastic capabilities). (4Q, 2010)
15 MSM analysis test cases. (4Q, 2006; 3Q, 2009; 4Q, 2010)
16 MSM updates. (4Q, 2011; 4Q, 2012; 4Q, 2013; 4Q, 2014)
Multi-Year Research, Development and Demonstration Plan Page 5 - 13
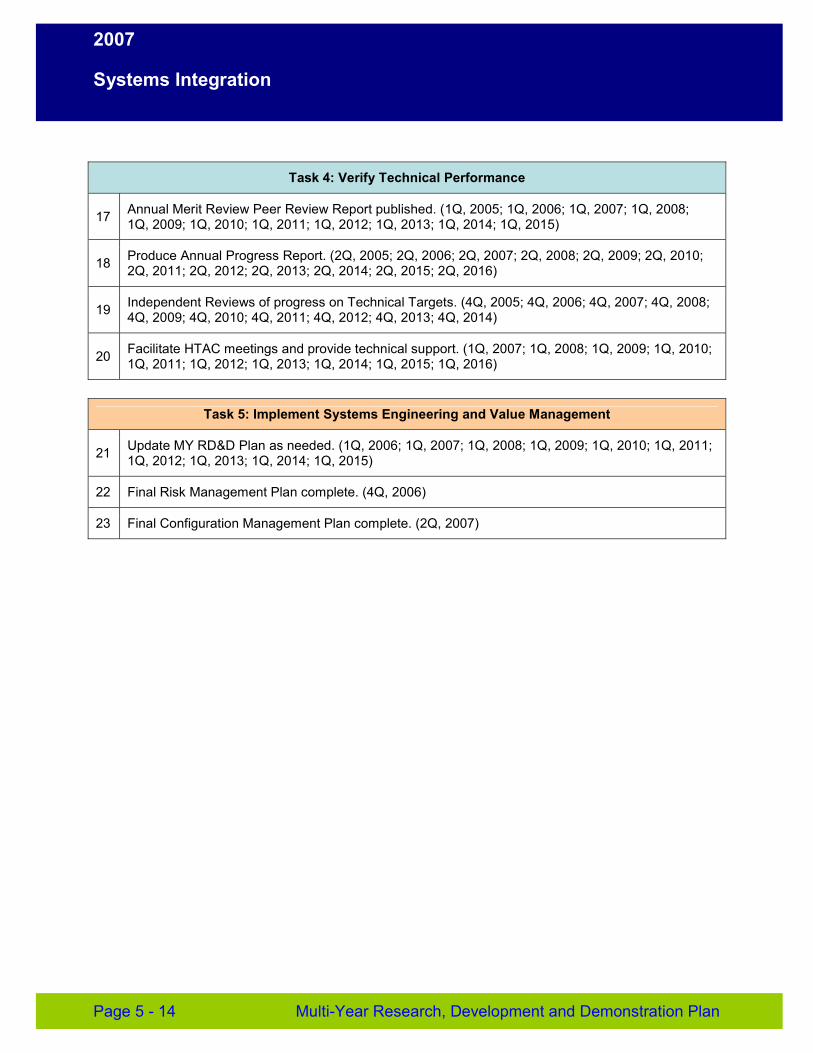
2007
Systems Integration
Task 4: Verify Technical Performance
17 Annual Merit Review Peer Review Report published. (1Q, 2005; 1Q, 2006; 1Q, 2007; 1Q, 2008; 1Q, 2009; 1Q, 2010; 1Q, 2011; 1Q, 2012; 1Q, 2013; 1Q, 2014; 1Q, 2015)
18 Produce Annual Progress Report. (2Q, 2005; 2Q, 2006; 2Q, 2007; 2Q, 2008; 2Q, 2009; 2Q, 2010; 2Q, 2011; 2Q, 2012; 2Q, 2013; 2Q, 2014; 2Q, 2015; 2Q, 2016)
19 Independent Reviews of progress on Technical Targets. (4Q, 2005; 4Q, 2006; 4Q, 2007; 4Q, 2008; 4Q, 2009; 4Q, 2010; 4Q, 2011; 4Q, 2012; 4Q, 2013; 4Q, 2014)
20 Facilitate HTAC meetings and provide technical support. (1Q, 2007; 1Q, 2008; 1Q, 2009; 1Q, 2010; 1Q, 2011; 1Q, 2012; 1Q, 2013; 1Q, 2014; 1Q, 2015; 1Q, 2016)
Task 5: Implement Systems Engineering and Value Management
21 Update MY RD&D Plan as needed. (1Q, 2006; 1Q, 2007; 1Q, 2008; 1Q, 2009; 1Q, 2010; 1Q, 2011; 1Q, 2012; 1Q, 2013; 1Q, 2014; 1Q, 2015)
22 Final Risk Management Plan complete. (4Q, 2006)
23 Final Configuration Management Plan complete. (2Q, 2007)
Page 5 - 14 Multi-Year Research, Development and Demonstration Plan
2007
Systems Integration
Inputs
P3 Impact of hydrogen quality on cost and performance. (3Q, 2007)
P5 Hydrogen production technology for distributed systems. (4Q, 2015)
D2 Hydrogen containment composition and issues. (4Q, 2006)
D3 Hydrogen delivery infrastructure analysis results. (4Q, 2007)
D4 Assessment of impact of hydrogen quality requirements on cost and performance of hydrogen delivery. (4Q, 2010)
St5 Baseline hydrogen on-board storage system analysis results including hydrogen quality needs and interface issues. (1Q, 2007)
St6 Final On-board Hydrogen storage system analysis results of cost and performance; and down-select to a primary on-board storage system candidate. (1Q, 2010)
F2 Develop preliminary Hydrogen quality requirements. (2Q, 2005)
V2 Final report for first generation vehicles, interim progress report for second generation vehicles, on performance, safety, and O&M. (3Q, 2007)
V3 Technology Status Report and re-focused R&D recommendations. (4Q, 2007)
V4 Final report for second generation vehicles on performance, safety, and O&M. (3Q, 2010)
V5 Technology Status Report and re-focused R&D recommendations. (4Q, 2010)
V6 Validate Cold Start-Up capability (in a vehicle with an 8-hour soak) meeting 2005 requirements (specify cold-start energy). (3Q, 2011)
V7 Final report on infrastructure and hydrogen quality for first generation vehicles. (3Q, 2007)
V8 Final report on infrastructure, including impact of hydrogen quality for second generation vehicles. (3Q, 2010)
V9 Final report on safety and O&M of three refueling stations. (4Q, 2007)
V10 Hydrogen refueling station analysis – proposed interstate refueling station locations. (4Q, 2006)
V11 Composite results of analyses and modeling from vehicle and infrastructure data collected under the Learning Demonstration Project. (4Q, 2007)
V12 Final composite results of analyses and modeling from vehicle and infrastructure data collected under the Learning Demonstration Project. (4Q, 2010)
V13 Report on 3500 hour durability test. (4Q, 2012)
Multi-Year Research, Development and Demonstration Plan Page 5 - 15
2007
Systems Integration
V14 Report on the status of the Validation of the 5000 hour durability and cold start capability. (2Q, 2016)
C1 Completed hydrogen fuel quality standard as ISO Technical Specification. (3Q, 2006)
C8 Final Hydrogen Fuel quality standard as ISO standard. (2Q, 2010)
Sf1 Sensors meeting technical targets. (4Q, 2012)
Sf3 Final peer reviewed Best Practices Handbook. (1Q, 2008)
A1 Complete techno-economic analysis on production technologies currently being researched to meet overall Program hydrogen fuel objective. (4Q, 2007)
A2 Issue a report on the infrastructure analysis for the hydrogen scenarios. (2Q, 2010)
A3 Issue a report on the status of the technologies and infrastructure to meet the demands for the hydrogen fuel and vehicles. (1Q, 2011)
A4 Issue a report on the results of the infrastructure analysis for the long term technologies and requirements for technology readiness. (2Q, 2015)
A5 Issue report of the environmental analysis of the Hydrogen Program. (4Q, 2015)
Outputs
Note: None for Systems Integration. Per agreement in FY05, System Integration outputs/products are for the entire Program, not individual Program Elements, so did not make sense to make every Program Element show them as Inputs.
Page 5 - 16 Multi-Year Research, Development and Demonstration Plan
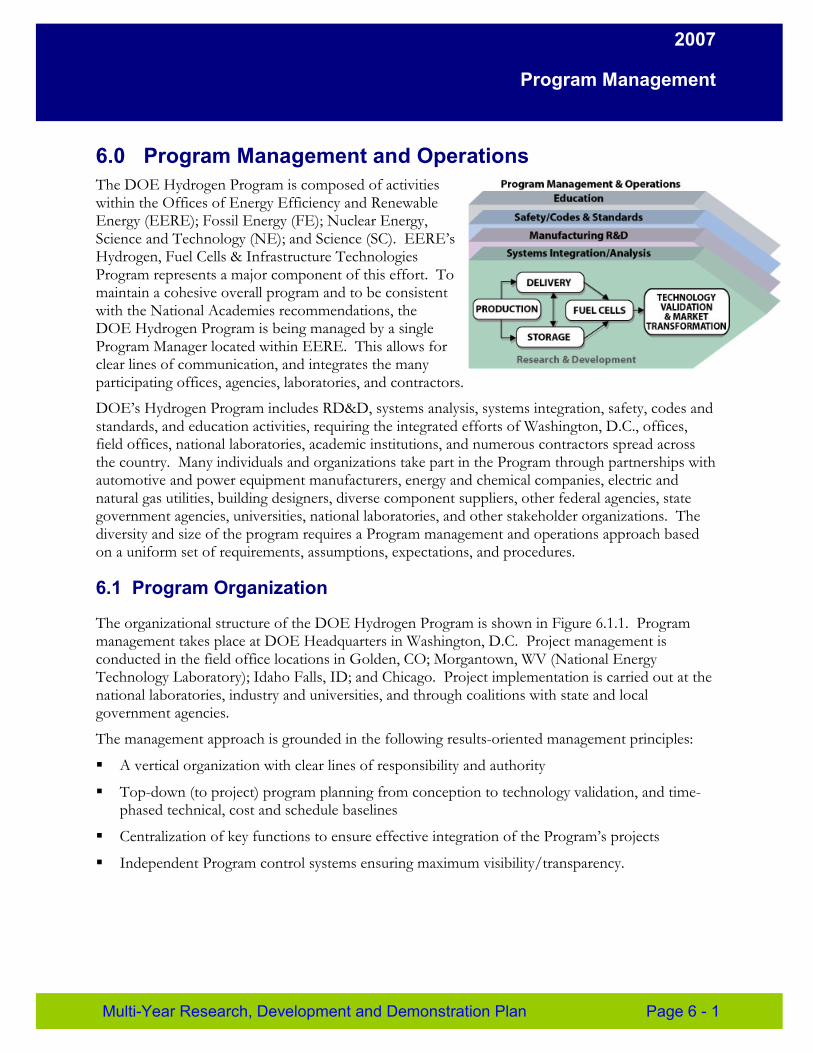
2007
Program Management
6.0 Program Management and Operations The DOE Hydrogen Program is composed of activities within the Offices of Energy Efficiency and Renewable Energy (EERE); Fossil Energy (FE); Nuclear Energy, Science and Technology (NE); and Science (SC). EERE’s Hydrogen, Fuel Cells & Infrastructure Technolo gies Program represents a major component of this effort. To maintain a cohesive overall program and to be consistent with the National Academies recommendation s, the DOE Hydrogen Program is being managed by a single Program Manager located within EERE. This allows f or clear lines of communication, and integrates the many participating offices, agencies, laboratories, and contractors.
DOE’s Hydrogen Program includes RD&D, systems analysis, systems integration, safety, codes and standards, and education activities, requiring the integrated efforts of Washington, D.C., offices, field offices, national laboratories, academic institutions, and numerous contractors spread across the country. Many individuals and organizations take part in the Program through partnerships with automotive and power equipment manufacturers, energy and chemical companies, electric and natural gas utilities, building designers, diverse component suppliers, other federal agencies, state government agencies, universities, national laboratories, and other stakeholder organizations. The diversity and size of the program requires a Program management and operations approach based on a uniform set of requirements, assumptions, expectations, and procedures.
6.1 Program Organization
The organizational structure of the DOE Hydrogen Program is shown in Figure 6.1.1. Program management takes place at DOE Headquarters in Washington, D.C. Project management is conducted in the field office locations in Golden, CO; Morgantown, WV (National Energy Technology Laboratory); Idaho Falls, ID; and Chicago. Project implementation is carried out at the national laboratories, industry and universities, and through coalitions with state and local government agencies.
The management approach is grounded in the following results-oriented management principles:
� A vertical organization with clear lines of responsibility and authority
� Top-down (to project) program planning from conception to technology validation, and time-phased technical, cost and schedule baselines
� Centralization of key functions to ensure effective integration of the Program’s projects
� Independent Program control systems ensuring maximum visibility/transparency.
Multi-Year Research, Development and Demonstration Plan Page 6 - 1
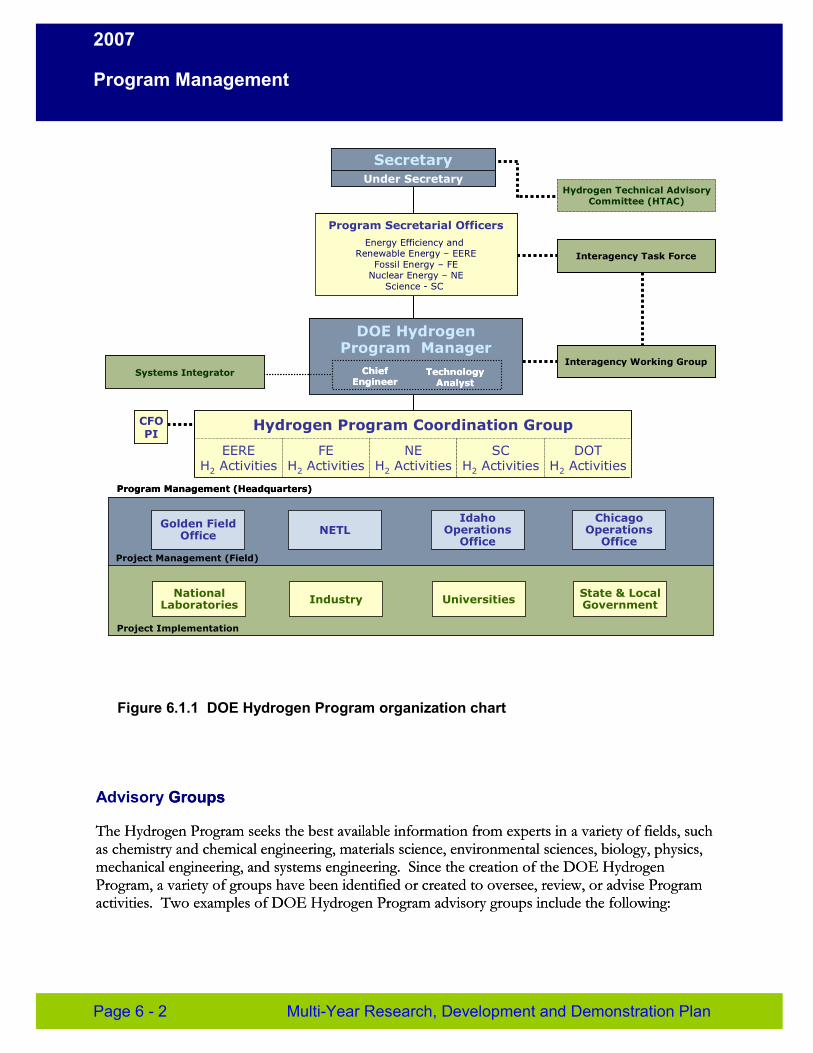
2007
Program Management
– –
– -
Program Secretarial Officers
Energy Efficiency and Renewable Energy – EERE
Fossil Energy – FE Nuclear Energy – NE
Science - SC
Secretary Under Secretary
CFO PI
Hydrogen Program Coordination Group
EERE H2 Activities
FE H2 Activities
NE H2 Activities
SC H2 Activities
DOT H2 Activities
DOE Hydrogen Program Manager
Chief Engineer
Technology Analyst
Chief Engineer
TechnologyAnalyst
Systems Integrator
Interagency Task Force
Hydrogen Technical Advisory Committee (HTAC)
Interagency Working Group
Program Management (Headquarters)Program Management (Headquarters)
Project Management (Field)
Golden Field Office NETL
Idaho Operations
Office
Chicago Operations
Office
National Laboratories
Project Implementation
Industry Universities State & Local Government
Figure 6.1.1 DOE Hydrogen Program organization chart
Advisory GroupsGroups
The Hydrogen Program seeks the best available information from experts in a variety of fields, suchThe Hydrogen Program seeks the best available information from experts in a variety of fields, such as chemistry and chemical engineering, materials science, environmental sciences, biology, physics,as chemistry and chemical engineering, materials science, environmental sciences, biology, physics, mechanical engineering, and systems engineering. Since the creation of the DOE Hydrogenmechanical engineering, and systems engineering. Since the creation of the DOE Hydrogen Program, a variety of groups have been identified or created to oversee, review, or advise ProgramProgram, a variety of groups have been identified or created to oversee, review, or advise Program activities. Two examples of DOE Hydrogen Program advisory groups include the following:activities. Two examples of DOE Hydrogen Program advisory groups include the following:
Page 6 - 2 Multi-Year Research, Development and Demonstration Plan
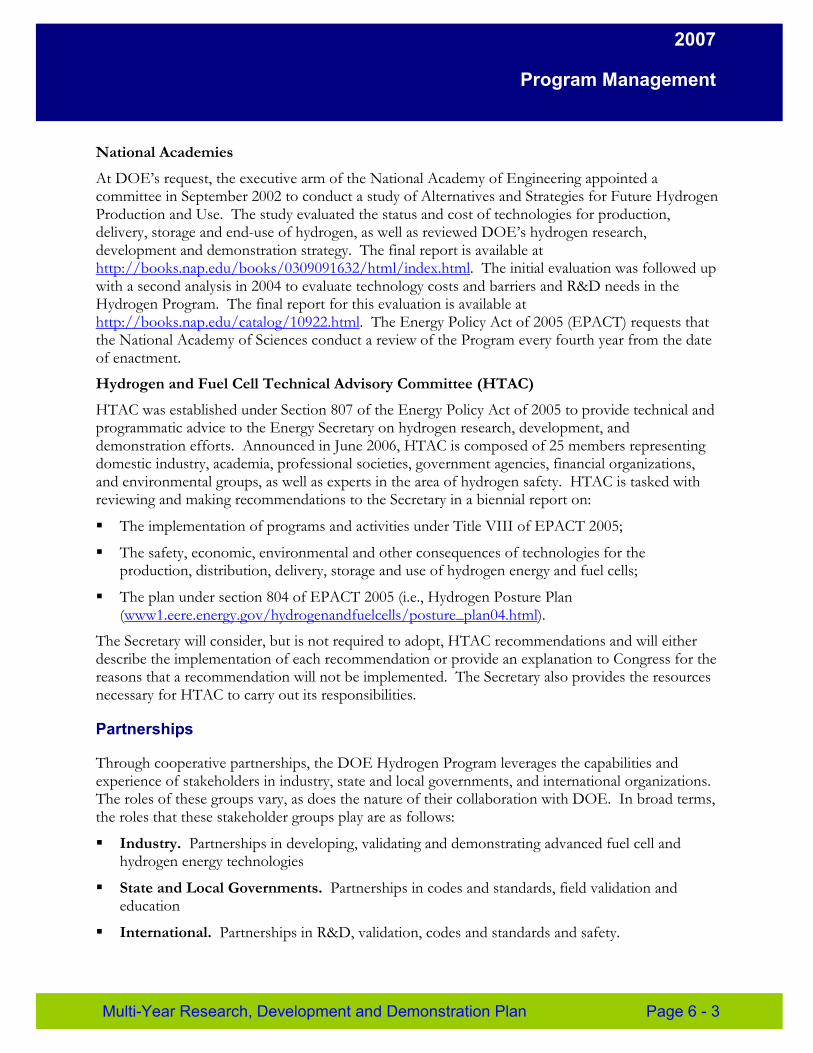
2007
Program Management
National Academies
At DOE’s request, the executive arm of the National Academy of Engineering appointed a committee in September 2002 to conduct a study of Alternatives and Strategies for Future Hydrogen Production and Use. The study evaluated the status and cost of technologies for production, delivery, storage and end-use of hydrogen, as well as reviewed DOE’s hydrogen research, development and demonstration strategy. The final report is available at http://books.nap.edu/books/0309091632/html/index.html. The initial evaluation was followed up with a second analysis in 2004 to evaluate technology costs and barriers and R&D needs in the Hydrogen Program. The final report for this evaluation is available at http://books.nap.edu/catalog/10922.html. The Energy Policy Act of 2005 (EPACT) requests that the National Academy of Sciences conduct a review of the Program every fourth year from the date of enactment.
Hydrogen and Fuel Cell Technical Advisory Committee (HTAC)
HTAC was established under Section 807 of the Energy Policy Act of 2005 to provide technical and programmatic advice to the Energy Secretary on hydrogen research, development, and demonstration efforts. Announced in June 2006, HTAC is composed of 25 members representing domestic industry, academia, professional societies, government agencies, financial organizations, and environmental groups, as well as experts in the area of hydrogen safety. HTAC is tasked with reviewing and making recommendations to the Secretary in a biennial report on:
� The implementation of programs and activities under Title VIII of EPACT 2005;
� The safety, economic, environmental and other consequences of technologies for the production, distribution, delivery, storage and use of hydrogen energy and fuel cells;
� The plan under section 804 of EPACT 2005 (i.e., Hydrogen Posture Plan (www1.eere.energy.gov/hydrogenandfuelcells/posture_plan04.html).
The Secretary will consider, but is not required to adopt, HTAC recommendations and will either describe the implementation of each recommendation or provide an explanation to Congress for the reasons that a recommendation will not be implemented. The Secretary also provides the resources necessary for HTAC to carry out its responsibilities.
Partnerships
Through cooperative partnerships, the DOE Hydrogen Program leverages the capabilities and experience of stakeholders in industry, state and local governments, and international organizations. The roles of these groups vary, as does the nature of their collaboration with DOE. In broad terms, the roles that these stakeholder groups play are as follows:
� Industry. Partnerships in developing, validating and demonstrating advanced fuel cell and hydrogen energy technologies
� State and Local Governments. Partnerships in codes and standards, field validation and education
� International. Partnerships in R&D, validation, codes and standards and safety.
Multi-Year Research, Development and Demonstration Plan Page 6 - 3
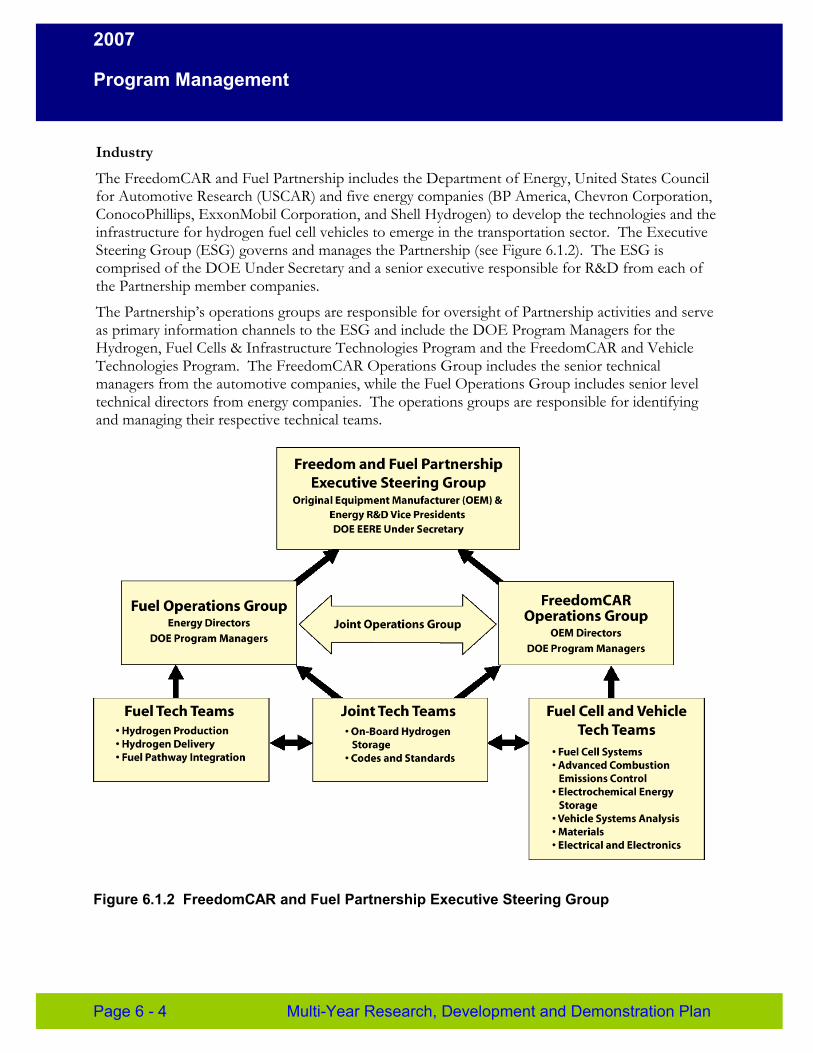
2007
Program Management
Industry
The FreedomCAR and Fuel Partnership includes the Department of Energy, United States Council for Automotive Research (USCAR) and five energy companies (BP America, Chevron Corporation, ConocoPhillips, ExxonMobil Corporation, and Shell Hydrogen) to develop the technologies and the infrastructure for hydrogen fuel cell vehicles to emerge in the transportation sector. The Executive Steering Group (ESG) governs and manages the Partnership (see Figure 6.1.2). The ESG is comprised of the DOE Under Secretary and a senior executive responsible for R&D from each of the Partnership member companies.
The Partnership’s operations groups are responsible for oversight of Partnership activities and serve as primary information channels to the ESG and include the DOE Program Managers for the Hydrogen, Fuel Cells & Infrastructure Technologies Program and the FreedomCAR and Vehicle Technologies Program. The FreedomCAR Operations Group includes the senior technical managers from the automotive companies, while the Fuel Operations Group includes senior level technical directors from energy companies. The operations groups are responsible for identifying and managing their respective technical teams.
Figure 6.1.2 FreedomCAR and Fuel Partnership Executive Steering Group
Page 6 - 4 Multi-Year Research, Development and Demonstration Plan

2007
Program Management
The Partnership’s technical teams consist of scientists and engineers with technology-specific expertise from the automotive and energy partner companies, DOE, national laboratories, and other organizations on an as-needed basis, such as the supplier community and other government agencies. The primary purpose of the technical teams is to identify and recommend comprehensive technical goals and evaluate progress and the achievement of technical milestones of the program. Each of the partners considers information developed by the technical teams in implementing its respective R&D programs. In addition, the technical teams assist DOE in reviewing the Hydrogen Program.
State, Local, and Regional Entities
The DOE Hydrogen Program collaborates with State and local government organizations and various regional entities to promote development and demonstration of hydrogen technologies. For example, the California Fuel Cell Partnership is a unique collaboration of auto manufacturers, energy companies, fuel cell technology companies and government agencies that is placing fuel cell vehicles on the roads in California. This partnership is showcasing new vehicle technology that could move the world toward practical and affordable environmental solutions. In addition to DOE, the other government partners include the California Air Resources Board, the California Energy Commission, the South Coast Air Quality Management District, the Upper Midwest Hydrogen Initiative, DOT and EPA.
The U. S. Fuel Cell Council has developed a comprehensive database that catalogues initiatives, policies and partnerships involving stationary fuel cell installations, hydrogen fueling stations and vehicle demonstrations in the United States (www.fuelcells.org/info/charts/h2fuelingstations.pdf; www.fuelcells.org/info/statedatabase.html). State and local partnerships are the primary vehicle through which DOE meets the needs of individual citizens, cities, counties and states across the nation. The Program will do the following:
� Work with states and communities to promote the Program
� Identify and engage community and state partners
� Coordinate with public and private sector activities.
International
On April 23, 2003, the Secretary of Energy called for an International Partnership for the Hydrogen Economy. As a result of the Secretary’s vision, efforts were initiated with 16 countries and the European Commission in the areas of codes and standards, fuel cells, hydrogen production, hydrogen storage, economic modeling, and education. These efforts led to formation of the International Partnership for a Hydrogen Economy (www.iphe.net).
The Secretary’s call for an international partnership built on the efforts of the previous several years, during which DOE coordinated international activities to advance hydrogen and fuel cell technologies. DOE continues to take a leadership role in the International Energy Agency Hydrogen Implementing Agreement (www.iea.org) and Advanced Fuel Cell Implementing Agreement (see Table 6.1.1).
Multi-Year Research, Development and Demonstration Plan Page 6 - 5

2007
Program Management
In addition, the Program is working with international groups, such as the International Organization of Standards, to develop a comprehensive set of codes and standards, which will facilitate the global demonstration and commercialization of hydrogen and fuel cell technologies.
Table 6.1.1 International Energy Agency Hydrogen and Advanced Fuel Cell Implementing Agreement Tasks
Hydrogen Fuel Cells
Hydrogen from Carbon-Containing Materials
Solid and Liquid State Storage
Integrated Systems Evaluation
Hydrogen Safety
Water Photolysis
Biohydrogen
Polymer Electrolyte Fuel Cells
MCFC Towards Demonstration
Solid Oxide Fuel Cells
Fuel Cells for Stationary Applications
Fuel Cell Systems for Transportation
Fuel Cells for Portable Applications
Coordination
Interagency Task Force and Interagency Working Group
The Hydrogen and Fuel Cell Interagency Working Group, which has been meeting regularly since the President announced the Hydrogen Fuel Initiative in early 2003, provides a key mechanism for collaboration among federal agencies involved in hydrogen and fuel cell research, development, and demonstration. Co-Chaired by DOE and the White House Office of Science and Technology Policy (OSTP), the working group has now focused its activities more specifically on fulfilling the responsibilities assigned to it in the Energy Policy Act of 2005 (Section 806). Principal activities involve education and information-sharing across federal agencies to promote the development of safe, economical, and environmentally friendly hydrogen energy systems. The working group is also responsible for assisting the Secretary of Energy with decisions related to federal agency procurements of fuel cells and hydrogen energy systems and with support for the development of hydrogen and fuel cell safety codes and standards. The working group has also created two ad hoc committees to help carry out its duties: (1) an ad hoc committee to develop a regulatory framework (led by the Department of Transportation), and (2) an ad hoc committee on biomass-to-hydrogen production and fuel cells for rural applications (led by DOE and the Department of Agriculture). The working group web site, www.hydrogen.gov, provides additional information and a portal to details about federal activities to advance the development of hydrogen and fuel cell technologies.
In August 2007, a high level Interagency Task Force was established to assist the Secretary with decisions related to improving efficiency in the federal government by promoting federal agency deployment of fuel cells and hydrogen energy systems.
Page 6 - 6 Multi-Year Research, Development and Demonstration Plan
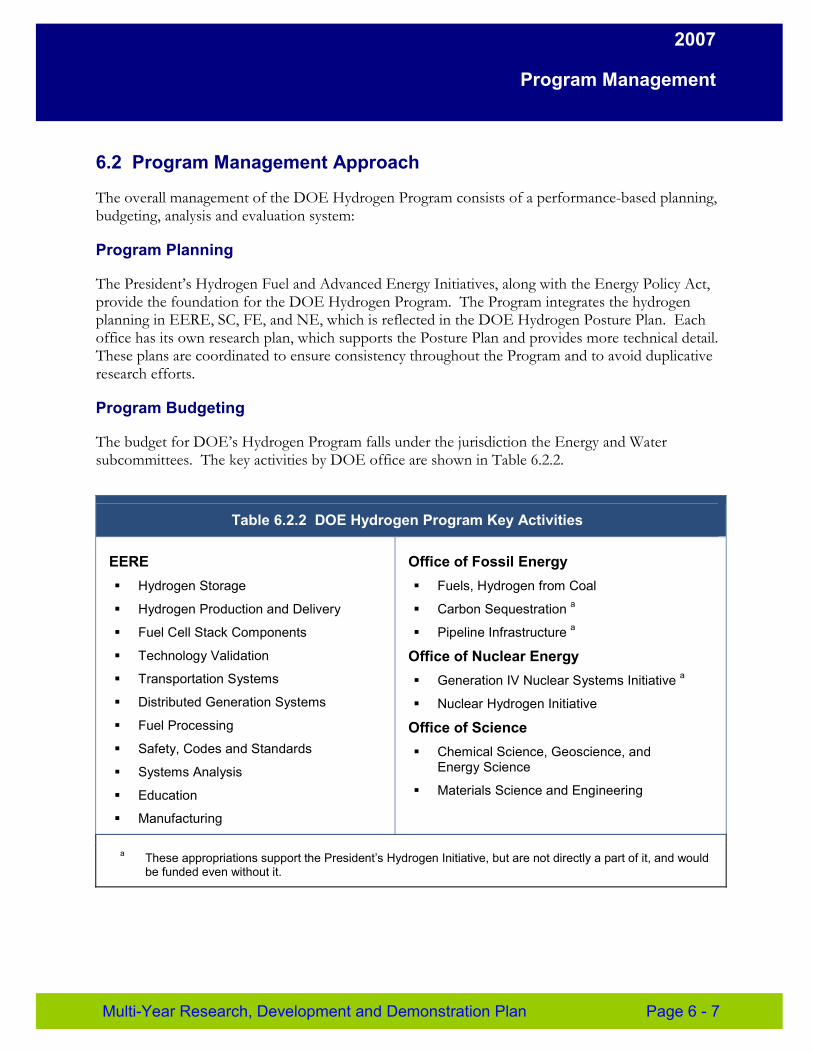
2007
Program Management
6.2 Program Management Approach
The overall management of the DOE Hydrogen Program consists of a performance-based planning, budgeting, analysis and evaluation system:
Program Planning
The President’s Hydrogen Fuel and Advanced Energy Initiatives, along with the Energy Policy Act, provide the foundation for the DOE Hydrogen Program. The Program integrates the hydrogen planning in EERE, SC, FE, and NE, which is reflected in the DOE Hydrogen Posture Plan. Each office has its own research plan, which supports the Posture Plan and provides more technical detail. These plans are coordinated to ensure consistency throughout the Program and to avoid duplicative research efforts.
Program Budgeting
The budget for DOE’s Hydrogen Program falls under the jurisdiction the Energy and Water subcommittees. The key activities by DOE office are shown in Table 6.2.2.
Table 6.2.2 DOE Hydrogen Program Key Activities
EERE � Hydrogen Storage
� Hydrogen Production and Delivery
� Fuel Cell Stack Components
� Technology Validation
� Transportation Systems
� Distributed Generation Systems
� Fuel Processing
� Safety, Codes and Standards
� Systems Analysis
� Education
� Manufacturing
Office of Fossil Energy � Fuels, Hydrogen from Coal
� Carbon Sequestration a
� Pipeline Infrastructure a
Office of Nuclear Energy � Generation IV Nuclear Systems Initiative a
� Nuclear Hydrogen Initiative
Office of Science � Chemical Science, Geoscience, and
Energy Science
� Materials Science and Engineering
a These appropriations support the President’s Hydrogen Initiative, but are not directly a part of it, and would be funded even without it.
Multi-Year Research, Development and Demonstration Plan Page 6 - 7
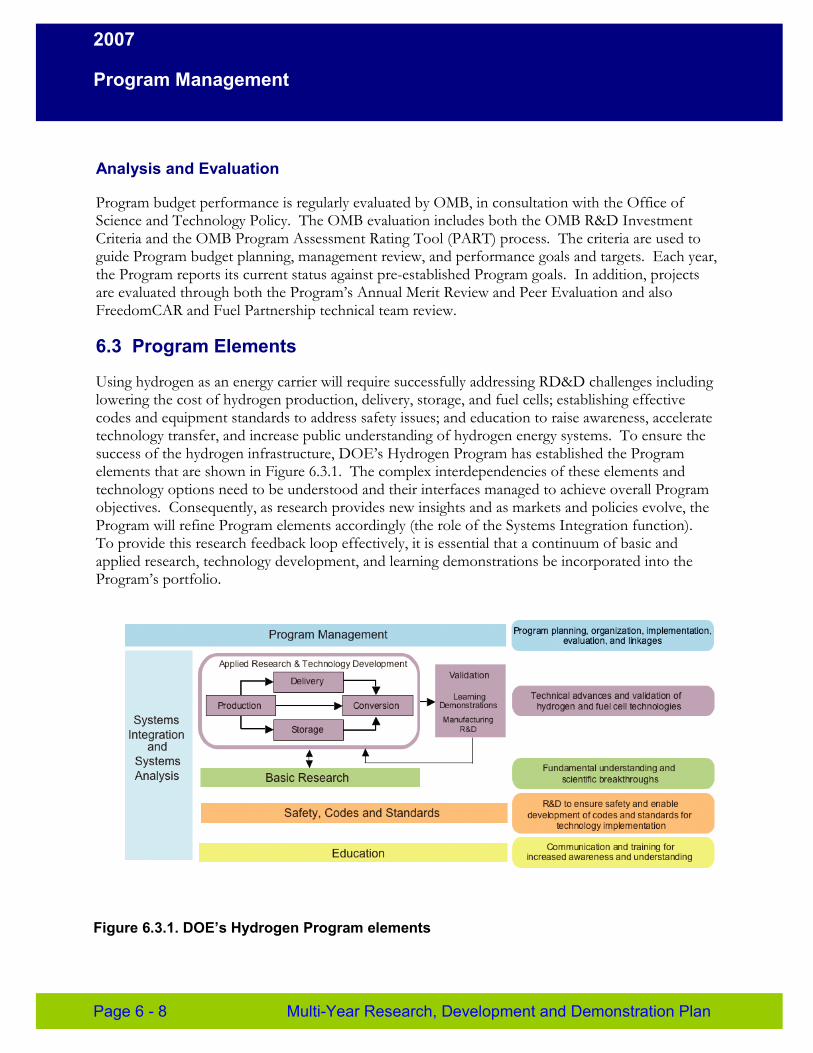
2007
Program Management
Analysis and Evaluation
Program budget performance is regularly evaluated by OMB, in consultation with the Office of Science and Technology Policy. The OMB evaluation includes both the OMB R&D Investment Criteria and the OMB Program Assessment Rating Tool (PART) process. The criteria are used to guide Program budget planning, management review, and performance goals and targets. Each year, the Program reports its current status against pre-established Program goals. In addition, projects are evaluated through both the Program’s Annual Merit Review and Peer Evaluation and also FreedomCAR and Fuel Partnership technical team review.
6.3 Program Elements
Using hydrogen as an energy carrier will require successfully addressing RD&D challenges including lowering the cost of hydrogen production, delivery, storage, and fuel cells; establishing effective codes and equipment standards to address safety issues; and education to raise awareness, accelerate technology transfer, and increase public understanding of hydrogen energy systems. To ensure the success of the hydrogen infrastructure, DOE’s Hydrogen Program has established the Program elements that are shown in Figure 6.3.1. The complex interdependencies of these elements and technology options need to be understood and their interfaces managed to achieve overall Program objectives. Consequently, as research provides new insights and as markets and policies evolve, the Program will refine Program elements accordingly (the role of the Systems Integration function). To provide this research feedback loop effectively, it is essential that a continuum of basic and applied research, technology development, and learning demonstrations be incorporated into the Program’s portfolio.
Figure 6.3.1. DOE’s Hydrogen Program elements
Page 6 - 8 Multi-Year Research, Development and Demonstration Plan

2007
Program Management
6.4 Program Implementation
The implementation strategy for the DOE Hydrogen Program is based on three guiding principles:
Linking the RD&D and Education Efforts to Policies, Requirements, and the Process for Selecting Options
The Hydrogen Program mission is to research, develop, and validate technologies for producing, storing, delivering and using hydrogen in an efficient, clean, safe, reliable, and affordable manner.1
An implementation strategy has been developed to ensure that all Program activities and procedures are consistent with the overall mission and the requirements contained in the Hydrogen Posture Plan.
Organizing the Work
To ensure an appropriate master schedule and defensible budget requests for the Program through 2015, a detailed Work Breakdown Structure (WBS) was developed. The WBS is constantly updated to serve two main purposes: (1) to ensure that the right work is being done and (2) to ensure that the right work is done correctly. Program goals were imposed “top-down,” consistent with the policies and requirements contained in the Hydrogen Posture Plan, whereas detailed tasks, schedules, and budgets were established “bottoms-up.” The WBS divides the Program into manageable segments of work to facilitate program management, cost estimating and budgeting, schedule management, cost and schedule control, and reporting of cost and schedule performance. It ensures all required work is incorporated in the Program and that no unnecessary work is included.
Managing and Monitoring the Program
The DOE Hydrogen Program is managed in accordance with its approved integrated baseline: the technical baseline (i.e., a compilation of the Program’s technical requirements) and the programmatic baseline (i.e., the work scope, schedule, and cost deemed necessary to satisfy the technical requirements). The programmatic portion of the integrated baseline ensures the amount of work to be accomplished, the time allotted to accomplish the Program activities, and the resources required to complete the work scope are evenly balanced. It provides the Program Manager with the necessary insight to monitor and manage the entire Program. In addition, the Program is currently working towards providing an increased level of insight and control by implementing an Earned Value Management System in accordance with DOE Order 413.3, Program and Project Management for the Acquisition of Capital Assets.
1 Hydrogen Posture Plan, August 2006 Draft
Multi-Year Research, Development and Demonstration Plan Page 6 - 9

2007
Program Management
Program Control
To ensure that the DOE Hydrogen Program remains on schedule and within cost, a Program control system has been instituted with the following objectives:
� Provide assurance that all work has been planned and considered in developing the Program cost and schedule baselines
� Identify the necessary procedures and organizational measures required for effective, timely management of the effort
� Ensure that these measures are implemented and that the resulting information accurately reflects the status of the Program
� Establish a review and decision-making process that addresses Program dynamics.
Under the Program control system, integrated cost, schedule, and technology baselines are developed. The performance of the DOE Hydrogen Program offices and supporting organizations (contractors, national laboratories, etc.) in completing tasks is measured against these baselines and reported to their organizations, to track program performance or take corrective actions if necessary. The Program uses a change control process, a procedure by which changes to an accepted work product are carefully proposed, assessed, conditionally accepted, and applied. The change control process provides a measure of stability to the Program and ensures consistency across Program elements.
Responsibilities for Program Control
The Chief Engineer is responsible for Program oversight. The Systems Integrator – in support of the Chief Engineer – gathers, integrates, and analyzes information on the scope, schedule, and budget of elements of the Program. Element plans and schedules are integrated into a Program plan, work breakdown structure, and master schedule. Together these plans comprise the programmatic baseline that is associated with a specific version of the technical baseline. The Systems Integrator analyzes this information to ensure that all technical requirements are addressed and consistent, and to identify critical paths, milestones, and decision points. The Systems Integrator provides tools and information to support DOE in monitoring performance against schedule and budget and in identifying risk.
Implementation of Program Control
Figure 6.4.1 provides an overview of the DOE Hydrogen Program’s control process. The primary inputs to Program control include the integrated baseline (see Chapter 5), budget guidance, and results of prior Program reviews.
Page 6 - 10 Multi-Year Research, Development and Demonstration Plan
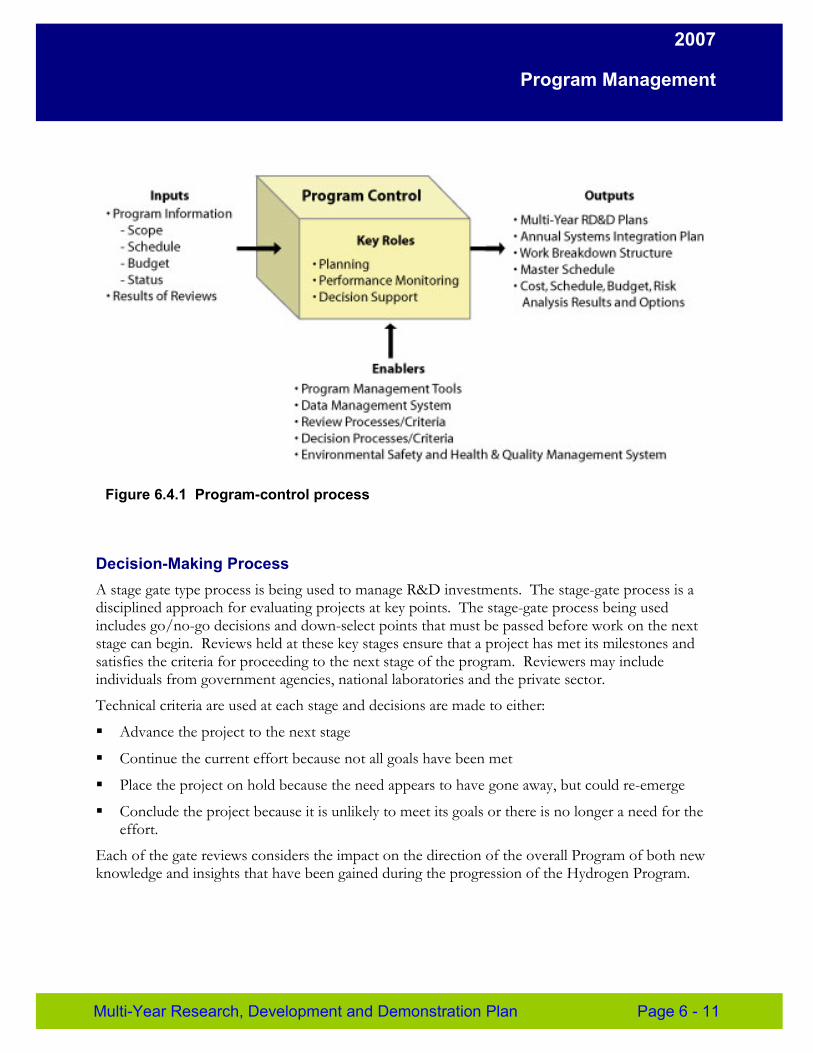
2007
Program Management
Figure 6.4.1 Program-control process
Decision-Making Process A stage gate type process is being used to manage R&D investments. The stage-gate process is a disciplined approach for evaluating projects at key points. The stage-gate process being used includes go/no-go decisions and down-select points that must be passed before work on the next stage can begin. Reviews held at these key stages ensure that a project has met its milestones and satisfies the criteria for proceeding to the next stage of the program. Reviewers may include individuals from government agencies, national laboratories and the private sector.
Technical criteria are used at each stage and decisions are made to either:
� Advance the project to the next stage
� Continue the current effort because no t all goals have been met
� Place the project on hold because the need appears to have gone away, but could re-emerge
� Conclude the project because it is unlikely to meet its goals or there is no longer a need for th e effort.
Each of the gate reviews considers the impact on the direction of the overall Program of both new knowledge and insights that have been gained during the progression of the Hydrogen Program.
Multi-Year Research, Development and Demonstration Plan Page 6 - 11
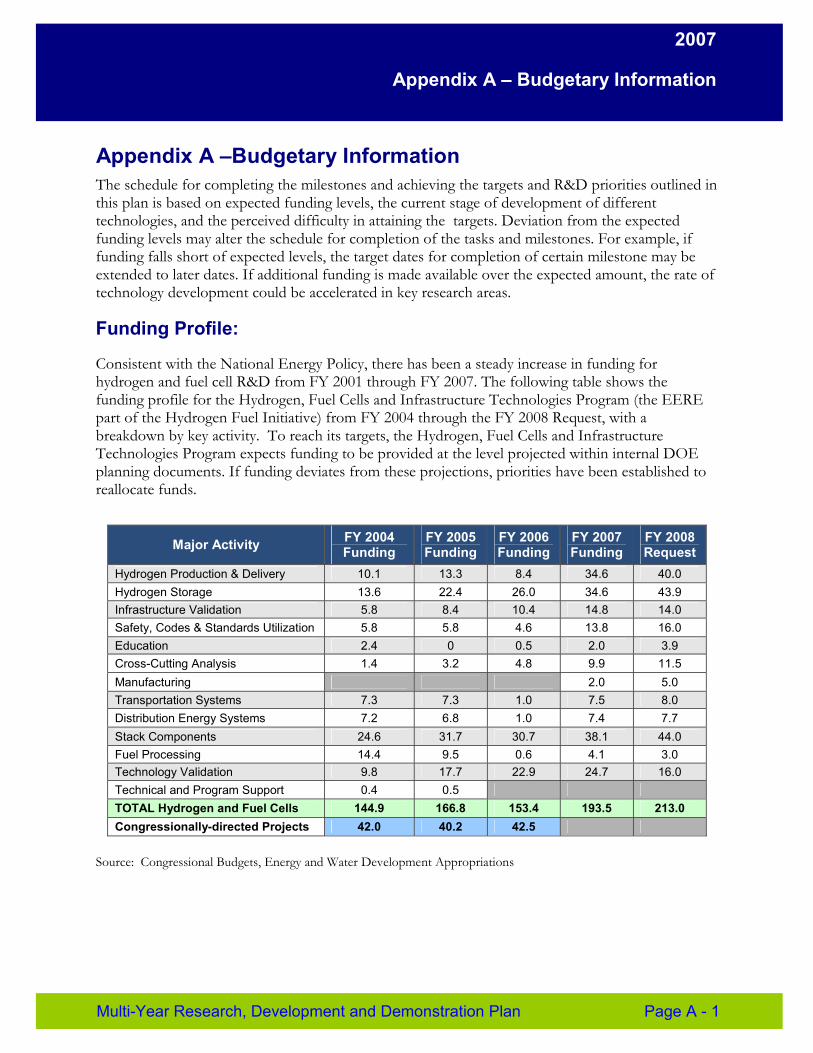
2007
Appendix A – Budgetary Information
Appendix A –Budgetary Information The schedule for completing the milestones and achieving the targets and R&D priorities outlined in this plan is based on expected funding levels, the current stage of development of different technologies, and the perceived difficulty in attaining the targets. Deviation from the expected funding levels may alter the schedule for completion of the tasks and milestones. For example, if funding falls short of expected levels, the target dates for completion of certain milestone may be extended to later dates. If additional funding is made available over the expected amount, the rate of technology development could be accelerated in key research areas.
Funding Profile:
Consistent with the National Energy Policy, there has been a steady increase in funding for hydrogen and fuel cell R&D from FY 2001 through FY 2007. The following table shows the funding profile for the Hydrogen, Fuel Cells and Infrastructure Technologies Program (the EERE part of the Hydrogen Fuel Initiative) from FY 2004 through the FY 2008 Request, with a breakdown by key activity. To reach its targets, the Hydrogen, Fuel Cells and Infrastructure Technologies Program expects funding to be provided at the level projected within internal DOE planning documents. If funding deviates from these projections, priorities have been established to reallocate funds.
Major Activity FY 2004 Funding
FY 2005 Funding
FY 2006 Funding
FY 2007 Funding
FY 2008 Request
Hydrogen Production & Delivery 10.1 13.3 8.4 34.6 40.0 Hydrogen Storage 13.6 22.4 26.0 34.6 43.9 Infrastructure Validation 5.8 8.4 10.4 14.8 14.0 Safety, Codes & Standards Utilization 5.8 5.8 4.6 13.8 16.0 Education 2.4 0 0.5 2.0 3.9 Cross-Cutting Analysis 1.4 3.2 4.8 9.9 11.5 Manufacturing 2.0 5.0 Transportation Systems 7.3 7.3 1.0 7.5 8.0 Distribution Energy Systems 7.2 6.8 1.0 7.4 7.7 Stack Components 24.6 31.7 30.7 38.1 44.0 Fuel Processing 14.4 9.5 0.6 4.1 3.0 Technology Validation 9.8 17.7 22.9 24.7 16.0 Technical and Program Support 0.4 0.5 TOTAL Hydrogen and Fuel Cells 144.9 166.8 153.4 193.5 213.0 Congressionally-directed Projects 42.0 40.2 42.5
Source: Congressional Budgets, Energy and Water Development Appropriations
Multi-Year Research, Development and Demonstration Plan Page A - 1
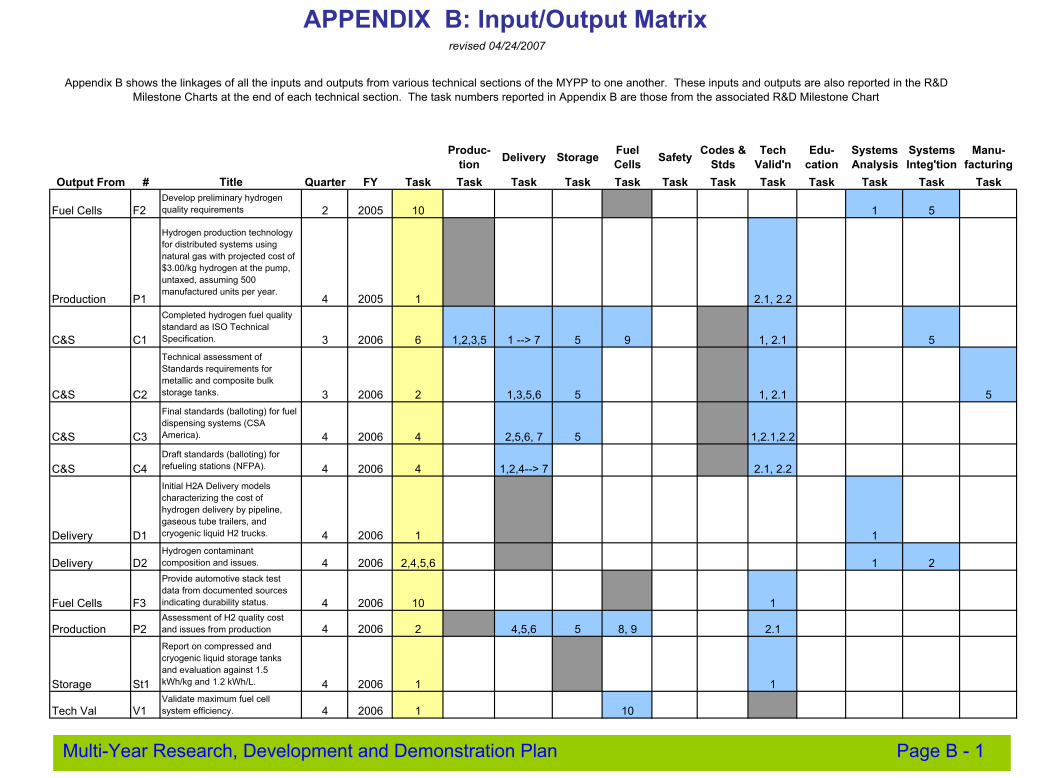
APPENDIX B: Input/Output Matrix revised 04/24/2007
Appendix B shows the linkages of all the inputs and outputs from various technical sections of the MYPP to one another. These inputs and outputs are also reported in the R&D Milestone Charts at the end of each technical section. The task numbers reported in Appendix B are those from the associated R&D Milestone Chart
Produc- Fuel Codes & Tech Edu- Systems Systems Manu-Delivery Storage Safetytion Cells Stds Valid'n cation Analysis Integ'tion facturing Output From # Title Quarter FY Task Task Task Task Task Task Task Task Task Task Task Task
Fuel Cells F2 Develop preliminary hydrogen quality requirements 2 2005 10 1 5
Production P1
Hydrogen production technology for distributed systems using natural gas with projected cost of $3.00/kg hydrogen at the pump, untaxed, assuming 500 manufactured units per year.
4 2005 1 2.1, 2.2
C&S C1
Completed hydrogen fuel quality standard as ISO Technical Specification. 3 2006 6 1,2,3,5 1 --> 7 5 9 1, 2.1 5
C&S C2
Technical assessment of Standards requirements for metallic and composite bulk storage tanks. 3 2006 2 1,3,5,6 5 1, 2.1 5
C&S C3
Final standards (balloting) for fuel dispensing systems (CSA America). 4 2006 4 2,5,6, 7 5 1,2.1,2.2
C&S C4 Draft standards (balloting) for refueling stations (NFPA). 4 2006 4 1,2,4--> 7 2.1, 2.2
Delivery D1
Initial H2A Delivery models characterizing the cost of hydrogen delivery by pipeline, gaseous tube trailers, and cryogenic liquid H2 trucks. 4 2006 1 1
Delivery D2 Hydrogen contaminant composition and issues. 4 2006 2,4,5,6 1 2
Fuel Cells F3
Provide automotive stack test data from documented sources indicating durability status. 4 2006 10 1
Production P2 Assessment of H2 quality cost and issues from production 4 2006 2 4,5,6 5 8, 9 2.1
Storage St1
Report on compressed and cryogenic liquid storage tanks and evaluation against 1.5 kWh/kg and 1.2 kWh/L. 4 2006 1 1
Tech Val V1 Validate maximum fuel cell system efficiency. 4 2006 1 10
Multi-Year Research, Development and Demonstration Plan Page B - 1
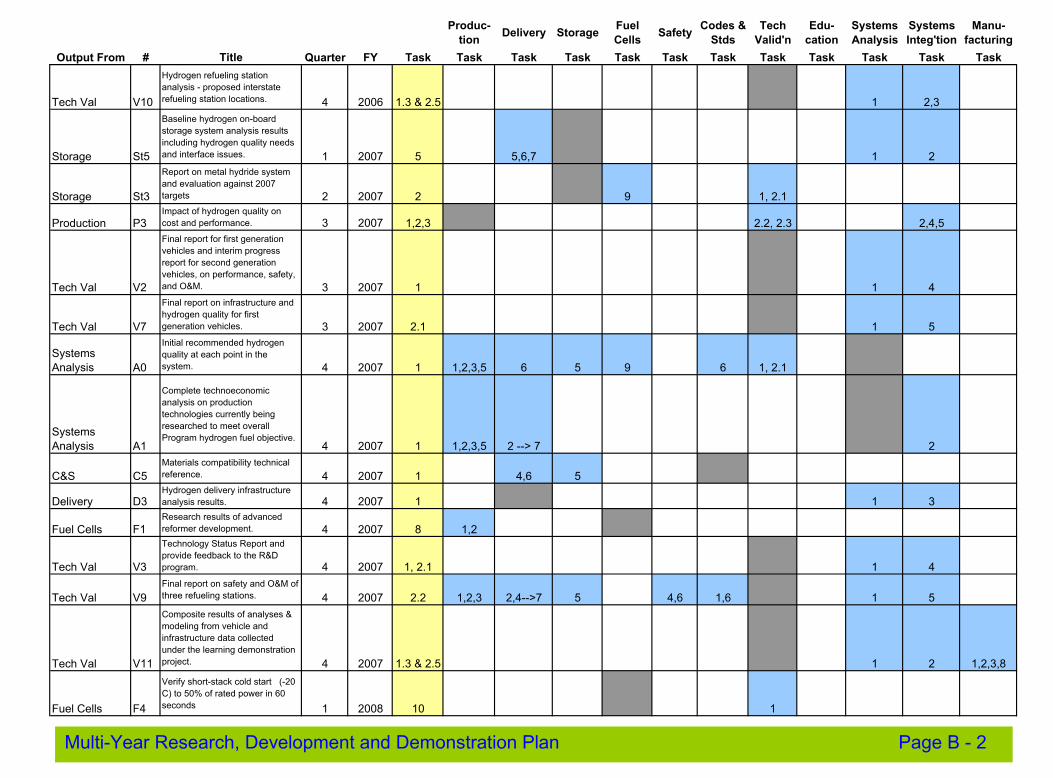
Produc- Fuel Codes & Tech Edu- Systems Systems Manu-Delivery Storage Safetytion Cells Stds Valid'n cation Analysis Integ'tion facturing Output From # Title Quarter FY Task Task Task Task Task Task Task Task Task Task Task Task
Tech Val V10
Hydrogen refueling station analysis - proposed interstate refueling station locations. 4 2006 1.3 & 2.5 1 2,3
Storage St5
Baseline hydrogen on-board storage system analysis results including hydrogen quality needs and interface issues. 1 2007 5 5,6,7 1 2
Storage St3
Report on metal hydride system and evaluation against 2007 targets 2 2007 2 9 1, 2.1
Production P3 Impact of hydrogen quality on cost and performance. 3 2007 1,2,3 2.2, 2.3 2,4,5
Tech Val V2
Final report for first generation vehicles and interim progress report for second generation vehicles, on performance, safety, and O&M. 3 2007 1 1 4
Tech Val V7
Final report on infrastructure and hydrogen quality for first generation vehicles. 3 2007 2.1 1 5
Systems Analysis A0
Initial recommended hydrogen quality at each point in the system. 4 2007 1 1,2,3,5 6 5 9 6 1, 2.1
Systems Analysis A1
Complete technoeconomic analysis on production technologies currently being researched to meet overall Program hydrogen fuel objective.
4 2007 1 1,2,3,5 2 --> 7 2
C&S C5 Materials compatibility technical reference. 4 2007 1 4,6 5
Delivery D3 Hydrogen delivery infrastructure analysis results. 4 2007 1 1 3
Fuel Cells F1 Research results of advanced reformer development. 4 2007 8 1,2
Tech Val V3
Technology Status Report and provide feedback to the R&D program. 4 2007 1, 2.1 1 4
Tech Val V9 Final report on safety and O&M of three refueling stations. 4 2007 2.2 1,2,3 2,4-->7 5 4,6 1,6 1 5
Tech Val V11
Composite results of analyses & modeling from vehicle and infrastructure data collected under the learning demonstration project. 4 2007 1.3 & 2.5 1 2 1,2,3,8
Fuel Cells F4
Verify short-stack cold start (-20 C) to 50% of rated power in 60 seconds 1 2008 10 1
Multi-Year Research, Development and Demonstration Plan Page B - 2
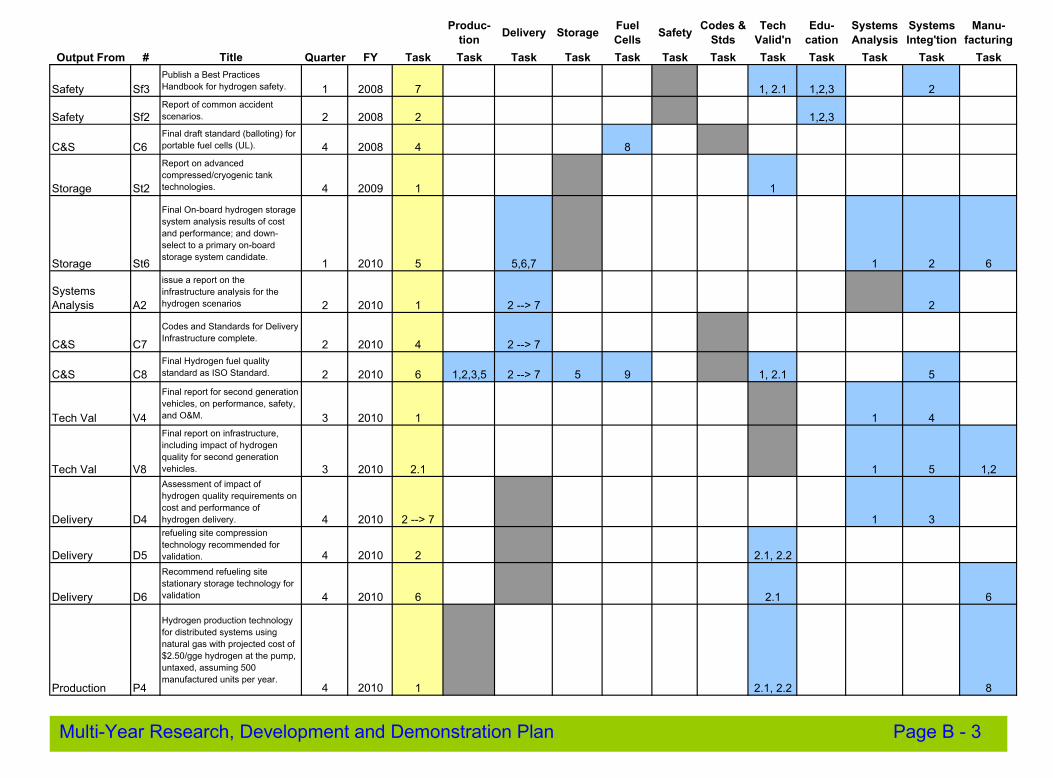
Produc- Fuel Codes & Tech Edu- Systems Systems Manu-Delivery Storage Safetytion Cells Stds Valid'n cation Analysis Integ'tion facturing Output From # Title Quarter FY Task Task Task Task Task Task Task Task Task Task Task Task
Safety Sf3 Publish a Best Practices Handbook for hydrogen safety. 1 2008 7 1, 2.1 1,2,3 2
Safety Sf2 Report of common accident scenarios. 2 2008 2 1,2,3
C&S C6 Final draft standard (balloting) for portable fuel cells (UL). 4 2008 4 8
Storage St2
Report on advanced compressed/cryogenic tank technologies. 4 2009 1 1
Storage St6
Final On-board hydrogen storage system analysis results of cost and performance; and down-select to a primary on-board storage system candidate. 1 2010 5 5,6,7 1 2 6
Systems Analysis A2
issue a report on the infrastructure analysis for the hydrogen scenarios 2 2010 1 2 --> 7 2
C&S C7
Codes and Standards for Delivery Infrastructure complete. 2 2010 4 2 --> 7
C&S C8 Final Hydrogen fuel quality standard as ISO Standard. 2 2010 6 1,2,3,5 2 --> 7 5 9 1, 2.1 5
Tech Val V4
Final report for second generation vehicles, on performance, safety, and O&M. 3 2010 1 1 4
Tech Val V8
Final report on infrastructure, including impact of hydrogen quality for second generation vehicles. 3 2010 2.1 1 5 1,2
Delivery D4
Assessment of impact of hydrogen quality requirements on cost and performance of hydrogen delivery. 4 2010 2 --> 7 1 3
Delivery D5
refueling site compression technology recommended for validation. 4 2010 2 2.1, 2.2
Delivery D6
Recommend refueling site stationary storage technology for validation 4 2010 6 2.1 6
Production P4
Hydrogen production technology for distributed systems using natural gas with projected cost of $2.50/gge hydrogen at the pump, untaxed, assuming 500 manufactured units per year.
4 2010 1 2.1, 2.2 8
Multi-Year Research, Development and Demonstration Plan Page B - 3
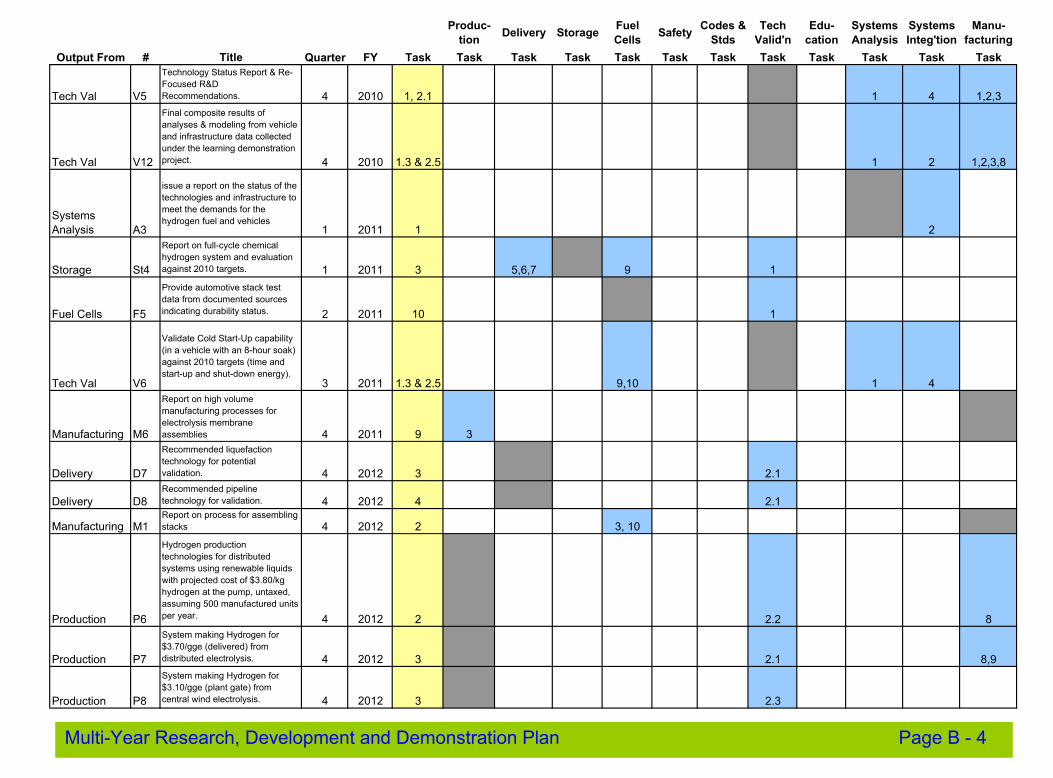
Produc- Fuel Codes & Tech Edu- Systems Systems Manu-Delivery Storage Safetytion Cells Stds Valid'n cation Analysis Integ'tion facturing Output From # Title Quarter FY Task Task Task Task Task Task Task Task Task Task Task Task
Tech Val V5
Technology Status Report & Re-Focused R&D Recommendations. 4 2010 1, 2.1 1 4 1,2,3
Tech Val V12
Final composite results of analyses & modeling from vehicle and infrastructure data collected under the learning demonstration project. 4 2010 1.3 & 2.5 1 2 1,2,3,8
Systems Analysis A3
issue a report on the status of the technologies and infrastructure to meet the demands for the hydrogen fuel and vehicles
1 2011 1 2
Storage St4
Report on full-cycle chemical hydrogen system and evaluation against 2010 targets. 1 2011 3 5,6,7 9 1
Fuel Cells F5
Provide automotive stack test data from documented sources indicating durability status. 2 2011 10 1
Tech Val V6
Validate Cold Start-Up capability (in a vehicle with an 8-hour soak) against 2010 targets (time and start-up and shut-down energy).
3 2011 1.3 & 2.5 9,10 1 4
Manufacturing M6
Report on high volume manufacturing processes for electrolysis membrane assemblies 4 2011 9 3
Delivery D7
Recommended liquefaction technology for potential validation. 4 2012 3 2.1
Delivery D8 Recommended pipeline technology for validation. 4 2012 4 2.1
Manufacturing M1 Report on process for assembling stacks 4 2012 2 3, 10
Production P6
Hydrogen production technologies for distributed systems using renewable liquids with projected cost of $3.80/kg hydrogen at the pump, untaxed, assuming 500 manufactured units per year. 4 2012 2 2.2 8
Production P7
System making Hydrogen for $3.70/gge (delivered) from distributed electrolysis. 4 2012 3 2.1 8,9
Production P8
System making Hydrogen for $3.10/gge (plant gate) from central wind electrolysis. 4 2012 3 2.3
Multi-Year Research, Development and Demonstration Plan Page B - 4
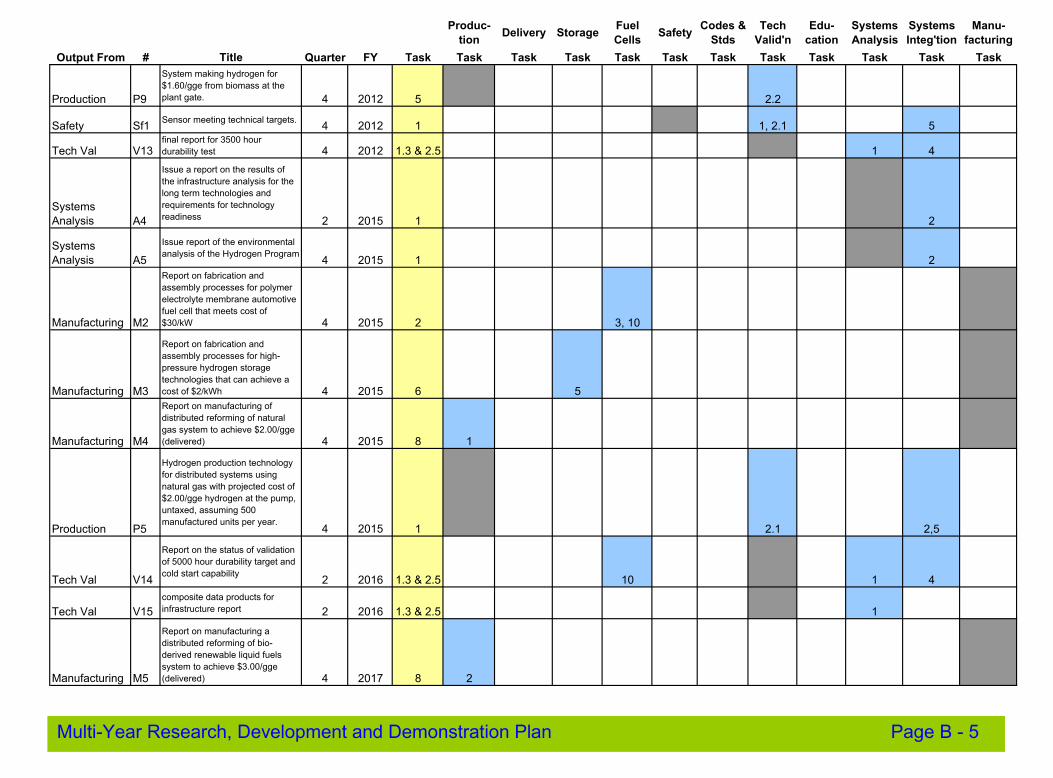
Produc- Fuel Codes & Tech Edu- Systems Systems Manu-Delivery Storage Safetytion Cells Stds Valid'n cation Analysis Integ'tion facturing Output From # Title Quarter FY Task Task Task Task Task Task Task Task Task Task Task Task
Production P9
System making hydrogen for $1.60/gge from biomass at the plant gate. 4 2012 5 2.2
Safety Sf1 Sensor meeting technical targets. 4 2012 1 1, 2.1 5
Tech Val V13 final report for 3500 hour durability test 4 2012 1.3 & 2.5 1 4
Systems Analysis A4
Issue a report on the results of the infrastructure analysis for the long term technologies and requirements for technology readiness 2 2015 1 2
Systems Analysis A5
Issue report of the environmental analysis of the Hydrogen Program 4 2015 1 2
Manufacturing M2
Report on fabrication and assembly processes for polymer electrolyte membrane automotive fuel cell that meets cost of $30/kW 4 2015 2 3, 10
Manufacturing M3
Report on fabrication and assembly processes for high-pressure hydrogen storage technologies that can achieve a cost of $2/kWh 4 2015 6 5
Manufacturing M4
Report on manufacturing of distributed reforming of natural gas system to achieve $2.00/gge (delivered) 4 2015 8 1
Production P5
Hydrogen production technology for distributed systems using natural gas with projected cost of $2.00/gge hydrogen at the pump, untaxed, assuming 500 manufactured units per year.
4 2015 1 2.1 2,5
Tech Val V14
Report on the status of validation of 5000 hour durability target and cold start capability 2 2016 1.3 & 2.5 10 1 4
Tech Val V15 composite data products for infrastructure report 2 2016 1.3 & 2.5 1
Manufacturing M5
Report on manufacturing a distributed reforming of bio-derived renewable liquid fuels system to achieve $3.00/gge (delivered) 4 2017 8 2
Multi-Year Research, Development and Demonstration Plan Page B - 5
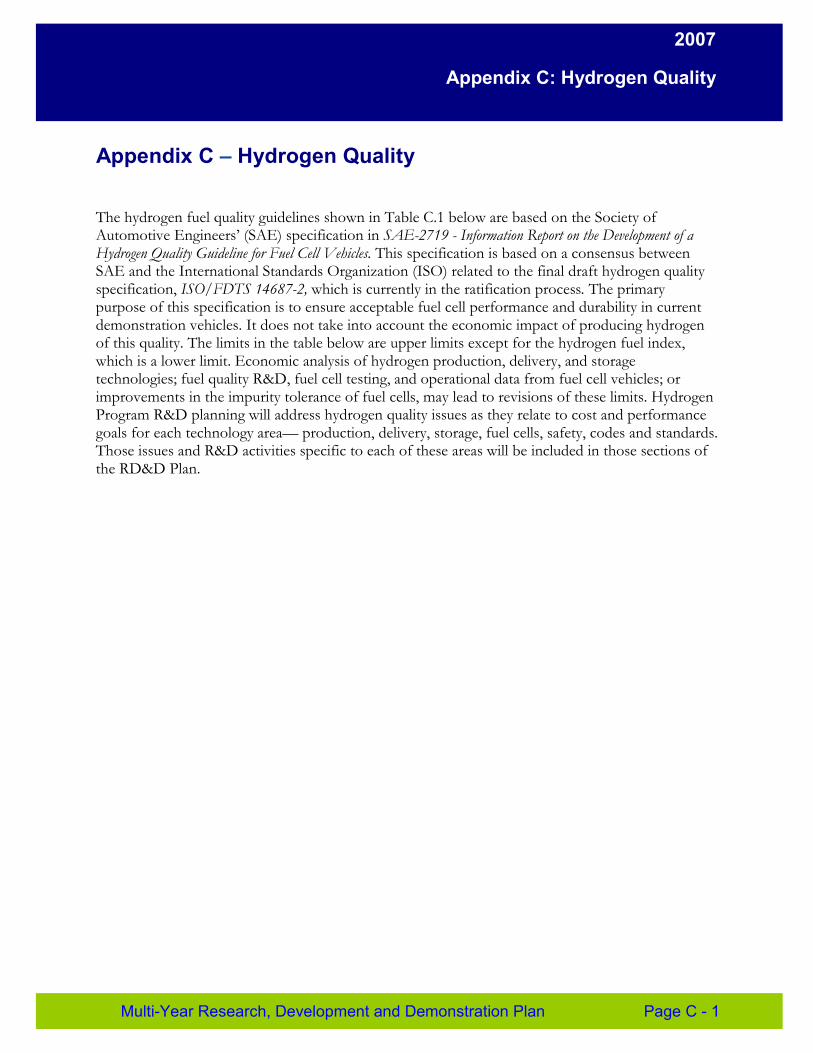
2007
Appendix C: Hydrogen Quality
Appendix C – Hydrogen Quality
The hydrogen fuel quality guidelines shown in Table C.1 below are based on the Society of Automotive Engineers’ (SAE) specification in SAE-2719 - Information Report on the Development of a Hydrogen Quality Guideline for Fuel Cell Vehicles. This specification is based on a consensus between SAE and the International Standards Organization (ISO) related to the final draft hydrogen quality specification, ISO/FDTS 14687-2, which is currently in the ratification process. The primary purpose of this specification is to ensure acceptable fuel cell performance and durability in current demonstration vehicles. It does not take into account the economic impact of producing hydrogen of this quality. The limits in the table below are upper limits except for the hydrogen fuel index, which is a lower limit. Economic analysis of hydrogen production, delivery, and storage technologies; fuel quality R&D, fuel cell testing, and operational data from fuel cell vehicles; or improvements in the impurity tolerance of fuel cells, may lead to revisions of these limits. Hydrogen Program R&D planning will address hydrogen quality issues as they relate to cost and performance goals for each technology area— production, delivery, storage, fuel cells, safety, codes and standards. Those issues and R&D activities specific to each of these areas will be included in those sections of the RD&D Plan.
Multi-Year Research, Development and Demonstration Plan Page C - 1
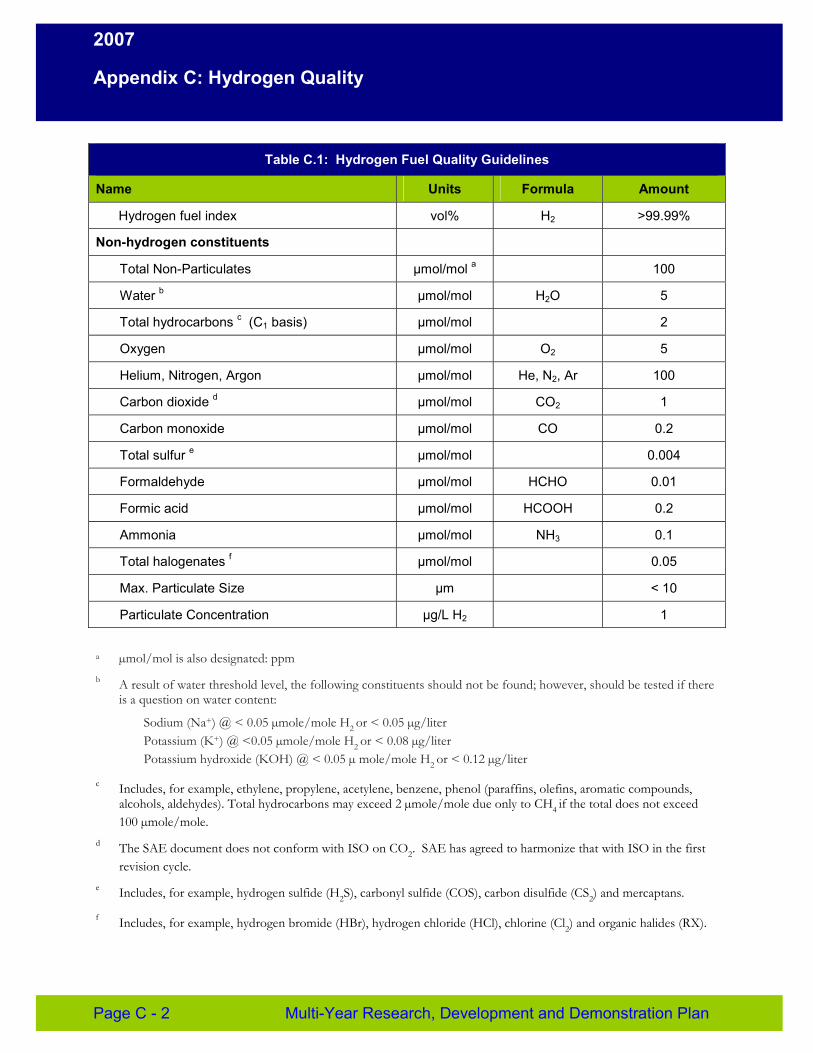
2007
Appendix C: Hydrogen Quality
Table C.1: Hydrogen Fuel Quality Guidelines
Name Units Formula Amount
Hydrogen fuel index vol% H2 >99.99%
Non-hydrogen constituents
Total Non-Particulates µmol/mol a 100
Water b µmol/mol H2O 5
Total hydrocarbons c (C1 basis) µmol/mol 2
Oxygen µmol/mol O2 5
Helium, Nitrogen, Argon µmol/mol He, N2, Ar 100
Carbon dioxide d µmol/mol CO2 1
Carbon monoxide µmol/mol CO 0.2
Total sulfur e µmol/mol 0.004
Formaldehyde µmol/mol HCHO 0.01
Formic acid µmol/mol HCOOH 0.2
Ammonia µmol/mol NH3 0.1
Total halogenates f µmol/mol 0.05
Max. Particulate Size µm < 10
Particulate Concentration µg/L H2 1
a µmol/mol is also designated: ppm b A result of water threshold level, the following constituents should not be found; however, should be tested if there
is a question on water content:
Sodium (Na+) @ < 0.05 µmole/mole H2 or < 0.05 µg/liter Potassium (K+) @ <0.05 µmole/mole H2 or < 0.08 µg/liter Potassium hydroxide (KOH) @ < 0.05 µ mole/mole H2 or < 0.12 µg/liter
c Includes, for example, ethylene, propylene, acetylene, benzene, phenol (paraffins, olefins, aromatic compounds, alcohols, aldehydes). Total hydrocarbons may exceed 2 µmole/mole due only to CH4 if the total does not exceed 100 µmole/mole.
d The SAE document does not conform with ISO on CO2. SAE has agreed to harmonize that with ISO in the first revision cycle.
e Includes, for example, hydrogen sulfide (H2S), carbonyl sulfide (COS), carbon disulfide (CS2) and mercaptans.
f Includes, for example, hydrogen bromide (HBr), hydrogen chloride (HCl), chlorine (Cl2) and organic halides (RX).
Page C - 2 Multi-Year Research, Development and Demonstration Plan
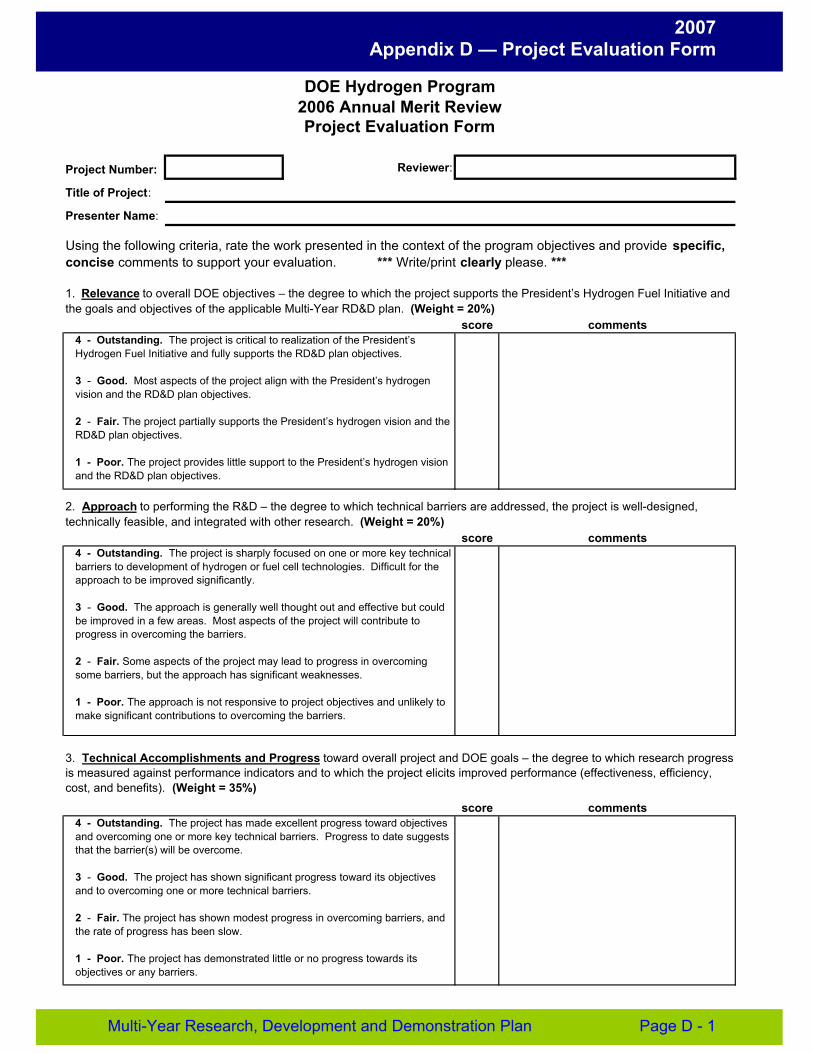
2007 Appendix D — Project Evaluation Form
DOE Hydrogen Program 2006 Annual Merit Review Project Evaluation Form
Project Number: Reviewer:
Title of Project:
Presenter Name:
Using the following criteria, rate the work presented in the context of the program objectives and provide specific, concise comments to support your evaluation. *** Write/print clearly please. ***
1. Relevance to overall DOE objectives – the degree to which the project supports the President’s Hydrogen Fuel Initiative and the goals and objectives of the applicable Multi-Year RD&D plan. (Weight = 20%)
score comments 4 - Outstanding. The project is critical to realization of the President’s Hydrogen Fuel Initiative and fully supports the RD&D plan objectives.
3 - Good. Most aspects of the project align with the President’s hydrogen vision and the RD&D plan objectives.
2 - Fair. The project partially supports the President’s hydrogen vision and the RD&D plan objectives.
1 - Poor. The project provides little support to the President’s hydrogen vision and the RD&D plan objectives.
2. Approach to performing the R&D – the degree to which technical barriers are addressed, the project is well-designed, technically feasible, and integrated with other research. (Weight = 20%)
score comments 4 - Outstanding. The project is sharply focused on one or more key technical barriers to development of hydrogen or fuel cell technologies. Difficult for the approach to be improved significantly.
3 - Good. The approach is generally well thought out and effective but could be improved in a few areas. Most aspects of the project will contribute to progress in overcoming the barriers.
2 - Fair. Some aspects of the project may lead to progress in overcoming some barriers, but the approach has significant weaknesses.
1 - Poor. The approach is not responsive to project objectives and unlikely to make significant contributions to overcoming the barriers.
3. Technical Accomplishments and Progress toward overall project and DOE goals – the degree to which research progress is measured against performance indicators and to which the project elicits improved performance (effectiveness, efficiency, cost, and benefits). (Weight = 35%)
score comments 4 - Outstanding. The project has made excellent progress toward objectives and overcoming one or more key technical barriers. Progress to date suggests that the barrier(s) will be overcome.
3 - Good. The project has shown significant progress toward its objectives and to overcoming one or more technical barriers.
2 - Fair. The project has shown modest progress in overcoming barriers, and the rate of progress has been slow.
1 - Poor. The project has demonstrated little or no progress towards its objectives or any barriers.
Multi-Year Research, Development and Demonstration Plan Page D - 1
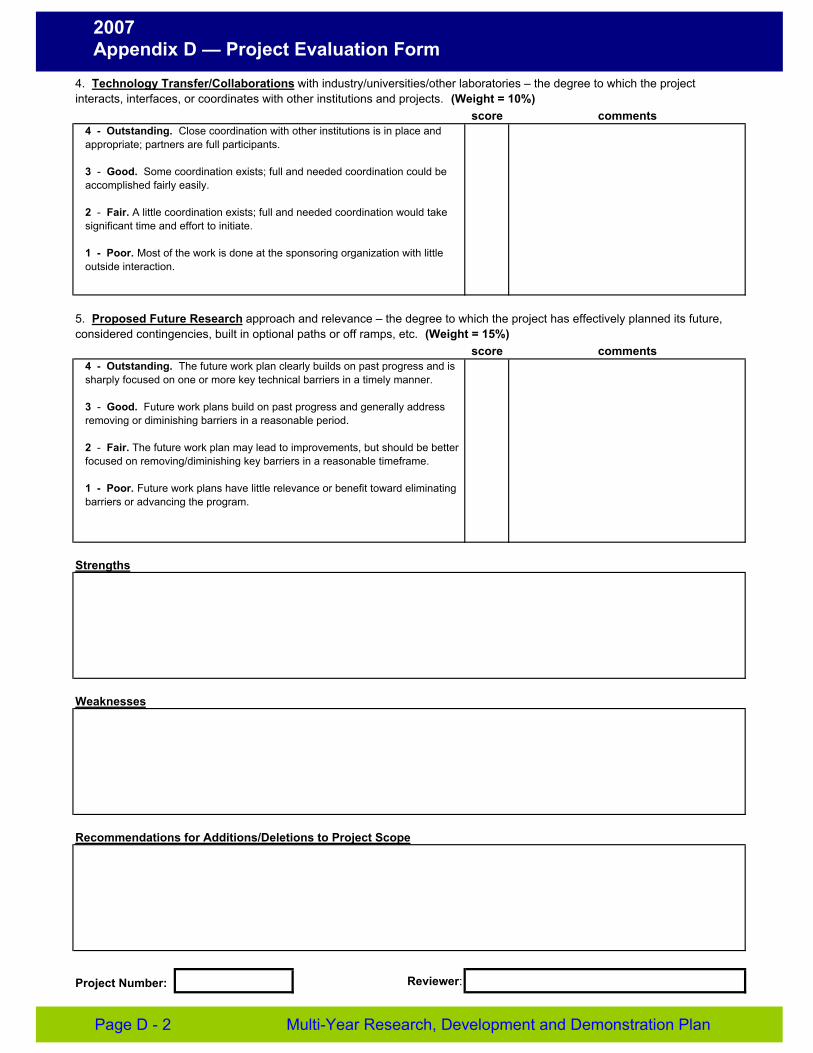
2007 Appendix D — Project Evaluation Form
4. Technology Transfer/Collaborations with industry/universities/other laboratories – the degree to which the project interacts, interfaces, or coordinates with other institutions and projects. (Weight = 10%)
score comments 4 - Outstanding. Close coordination with other institutions is in place and appropriate; partners are full participants.
3 - Good. Some coordination exists; full and needed coordination could be accomplished fairly easily.
2 - Fair. A little coordination exists; full and needed coordination would take significant time and effort to initiate.
1 - Poor. Most of the work is done at the sponsoring organization with little outside interaction.
5. Proposed Future Research approach and relevance – the degree to which the project has effectively planned its future, considered contingencies, built in optional paths or off ramps, etc. (Weight = 15%)
score comments 4 - Outstanding. The future work plan clearly builds on past progress and is sharply focused on one or more key technical barriers in a timely manner.
3 - Good. Future work plans build on past progress and generally address removing or diminishing barriers in a reasonable period.
2 - Fair. The future work plan may lead to improvements, but should be better focused on removing/diminishing key barriers in a reasonable timeframe.
1 - Poor. Future work plans have little relevance or benefit toward eliminating barriers or advancing the program.
Strengths
Weaknesses
Recommendations for Additions/Deletions to Project Scope
Reviewer:Project Number:
Page D - 2 Multi-Year Research, Development and Demonstration Plan
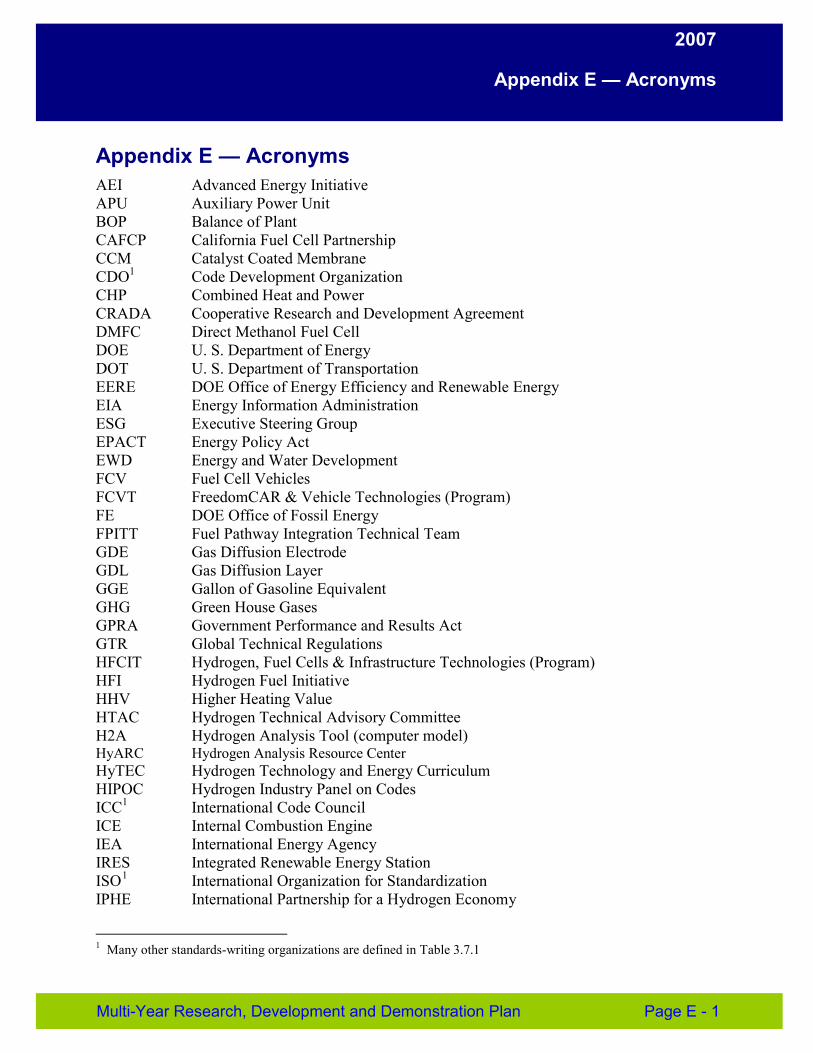
2007
Appendix E — Acronyms
Appendix E — Acronyms AEI Advanced Energy Initiative APU Auxiliary Power Unit BOP Balance of Plant CAFCP California Fuel Cell Partnership CCM Catalyst Coated Membrane CDO1 Code Development Organization CHP Combined Heat and Power CRADA Cooperative Research and Development Agreement DMFC Direct Methanol Fuel Cell DOE U. S. Department of Energy DOT U. S. Department of Transportation EERE DOE Office of Energy Efficiency and Renewable Energy EIA Energy Information Administration ESG Executive Steering Group EPACT Energy Policy Act EWD Energy and Water Development FCV Fuel Cell Vehicles FCVT FreedomCAR & Vehicle Technologies (Program) FE DOE Office of Fossil Energy FPITT Fuel Pathway Integration Technical Team GDE Gas Diffusion Electrode GDL Gas Diffusion Layer GGE Gallon of Gasoline Equivalent GHG Green House Gases GPRA Government Performance and Results Act GTR Global Technical Regulations HFCIT Hydrogen, Fuel Cells & Infrastructure Technologies (Program) HFI Hydrogen Fuel Initiative HHV Higher Heating Value HTAC Hydrogen Technical Advisory Committee H2A Hydrogen Analysis Tool (computer model) HyARC Hydrogen Analysis Resource Center HyTEC Hydrogen Technology and Energy Curriculum HIPOC Hydrogen Industry Panel on Codes ICC1 International Code Council ICE Internal Combustion Engine IEA International Energy Agency IRES Integrated Renewable Energy Station ISO1 International Organization for Standardization IPHE International Partnership for a Hydrogen Economy
1 Many other standards-writing organizations are defined in Table 3.7.1
Multi-Year Research, Development and Demonstration Plan Page E - 1
2007
Appendix E — Acronyms
ITER International Thermonuclear Experimental Reactor LHV Lower Heating Value LPG Liquefied Propane Gas MCFC Molten Carbonate Fuel Cell MEA Membrane Electrode Assembly MSM Macro-System Model MYPP Multi-Year Program Plan
= Multi-Year Research, Development and Demonstration Plan NAE National Academy of Engineering NAS National Academy of Sciences NE DOE Office of Nuclear Energy NEMS National Energy Modeling System NETL National Energy Technology Laboratory NFPA National Fire Protection Association NHA National Hydrogen Association NRC National Research Council NREL National Renewable Energy Laboratory OBD On Board Diagnostics OMB Office of Management and Budget OSTP White House Office of Science and Technology Policy PAE Planning, Analysis and Evaluation PART OMB Program Assessment Rating Tool PBA (Office of) Planning, Budget & Analysis PEM Polymer Electrolyte Membrane PEMFC Polymer Electrolyte Membrane Fuel Cell PM Program Manager PMC Project Management Center PMOP Program Management and Operations Plan RD&D Research, Development and Demonstration RFP Request for Proposal SAP Systems Analysis Plan SDO1 Standards Development Organizations SBIR Small Business Innovative Research SIP Systems Integration Plan SC DOE Office of Science SOFC Solid Oxide Fuel Cell SOW Statement of Work TAG U.S. Technical Advisory Groups TBD To Be Determined TDM Technology Development Manager USCAR U.S. Council for Automotive Research (a formal R&D partnership among Ford,
Daimler-Chrysler and General Motors) VSATT Vehicle Systems Analysis Technical Team WBS Work Breakdown Structure
Page E - 2 Multi-Year Research, Development and Demonstration Plan

A Strong Energy Portfolio for a Strong America Energy efficiency and clean, renewable energy will mean a stronger economy, a cleaner environment, and greater energy independence for America. Working with a wide array of state, community, industry, and university partners, the U.S. Department of Energy’s Office of Energy Efficiency and Renewable Energy invests in a diverse portfolio of energy technologies.
“Tonight I am proposing $1.2 billion in research funding so that
America can lead the world in developing clean, hydrogen-powered
automobiles.
“A simple chemical reaction between hydrogen and oxygen
generates energy, which can be used to power a car producing
only water, not exhaust fumes.
“With a new national commitment our scientists and engineers
will overcome obstacles to taking these cars from laboratory to
showroom . . .
“Join me in this important innovation to make our air signifi cantly
cleaner, and our country much less dependent on foreign sources
of energy.”
– 2003 State of the Union Address January 28, 2003
President Bush
Launches the
Hydrogen Fuel
Initiative
Hydrogen, Fuel Cells & Infrastructure Technologies Program
DOE/GO-102007-2430 October 2007
For more information contact: EERE Information Center 1-877-EERE-INF (1-877-337-3463 www.eere.energy.gov