Hydrogen Fuel Cell Vehicle - Civil & Environmental Engineering
340
School of Civil and Environmental Engineering Exploring the Hydrogen Transition: Investigation of an Alternative Fuel Fall 2004 – Spring 2005
Transcript of Hydrogen Fuel Cell Vehicle - Civil & Environmental Engineering
School of Civil and Environmental Engineering
Exploring the Hydrogen Transition:
Investigation of an Alternative Fuel
Fall 2004 – Spring 2005
Executive Summary
The need for a transition to an alternative fuel is clear and continually increasing. 63% of crudeoil consumed in America is imported, a quarter of which comes from the Middle East (forbes.com,2005, eia.doe.gov, 2005). As Americans buy more vehicles and drive them further, energy con-sumption and oil use increase. As a result, greenhouse gas and particulate emissions will continueto be problematic. Ideally, vehicles would be powered by a clean, efficient, non-polluting fuel.Hydrogen fits all of these characteristics, and as hydrogen fuel becomes more technologically andeconomically feasible, the transition to hydrogen as a transportation fuel is conceivable.
One of the current innovations in vehicles is the advent of hybrid technology. The results arebetter fuel economy and dramatically lower emissions. Our group examined whether a transitionthat uses hybrid technology as a stepping-stone to fuel cell vehicles would be more effective thana direct transition from standard gasoline-powered to hydrogen-powered vehicles. Conclusions onpath effectiveness were drawn by analyzing the energy consumption, oil use, and CO2 productionfor each path.
Our group also determined the necessity for government involvement in order to facilitate atransition to hydrogen-powered and/or hybrid-electric vehicles (HEVs). Short-term and long-termlegislative policies were considered, as well as the level of need for each. In addition, our groupinvestigated current initiatives for hybrid and hydrogen transitions, assessing their effectivenessand feasibility.
Based on our research, our group concludes that HEVs will fully penetrate the light vehiclemarket between 2030 and 2080. This transition will significantly increase average light vehicleefficiency, leading to decreased energy and oil consumption, and reduced carbon dioxide emissions.Successful hybrid penetration will also delay fuel cell vehicle introduction by at least ten years, asthe expected decrease in oil consumption will ease the need to find alternative fuels.
ii
iii
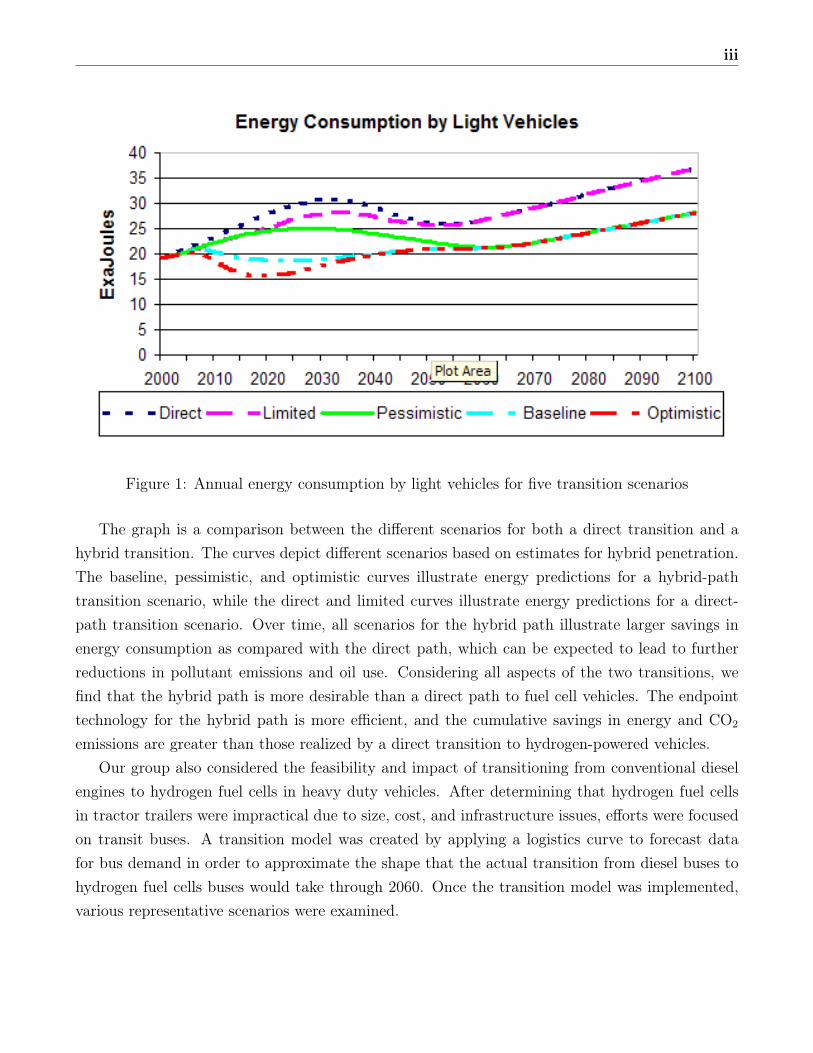
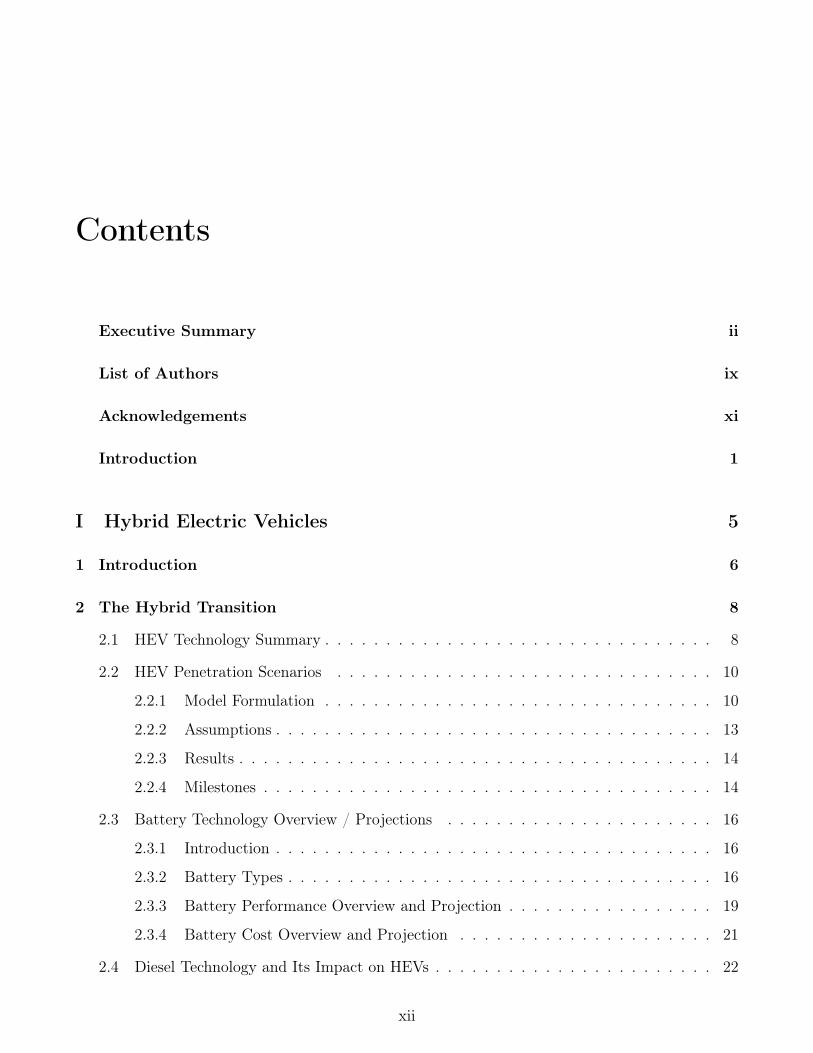
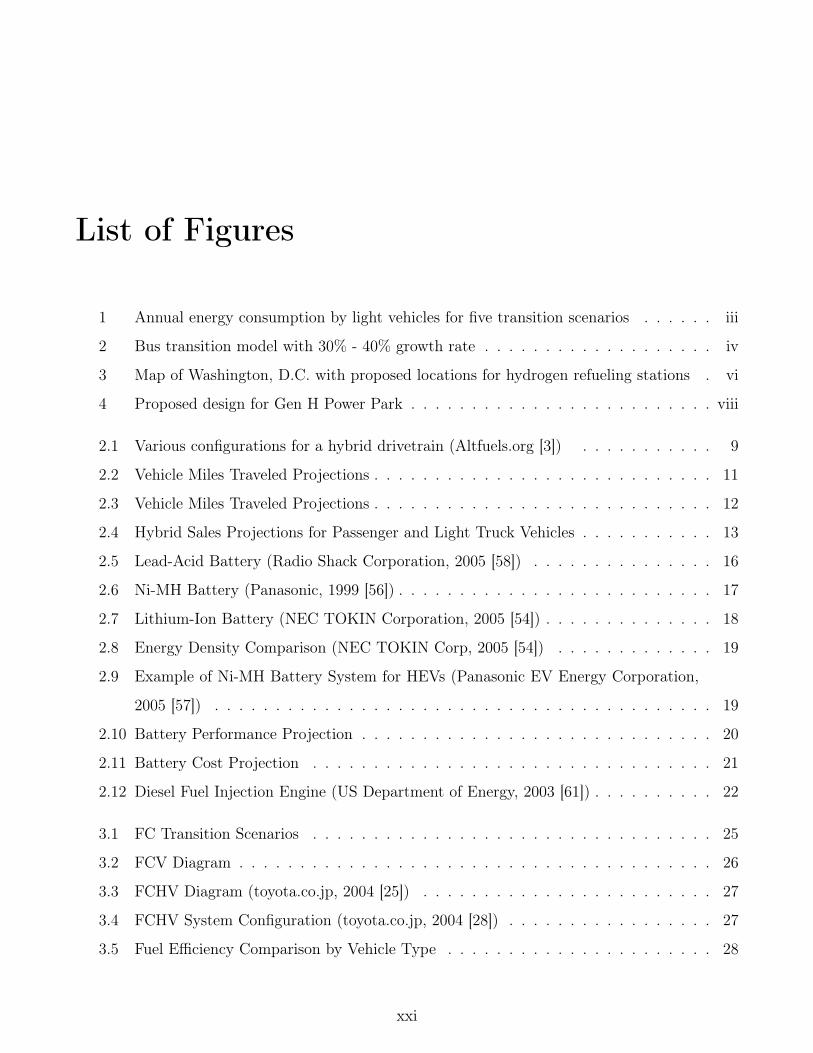
Figure 1: Annual energy consumption by light vehicles for five transition scenarios
The graph is a comparison between the different scenarios for both a direct transition and ahybrid transition. The curves depict different scenarios based on estimates for hybrid penetration.The baseline, pessimistic, and optimistic curves illustrate energy predictions for a hybrid-pathtransition scenario, while the direct and limited curves illustrate energy predictions for a direct-path transition scenario. Over time, all scenarios for the hybrid path illustrate larger savings inenergy consumption as compared with the direct path, which can be expected to lead to furtherreductions in pollutant emissions and oil use. Considering all aspects of the two transitions, wefind that the hybrid path is more desirable than a direct path to fuel cell vehicles. The endpointtechnology for the hybrid path is more efficient, and the cumulative savings in energy and CO2
emissions are greater than those realized by a direct transition to hydrogen-powered vehicles.Our group also considered the feasibility and impact of transitioning from conventional diesel
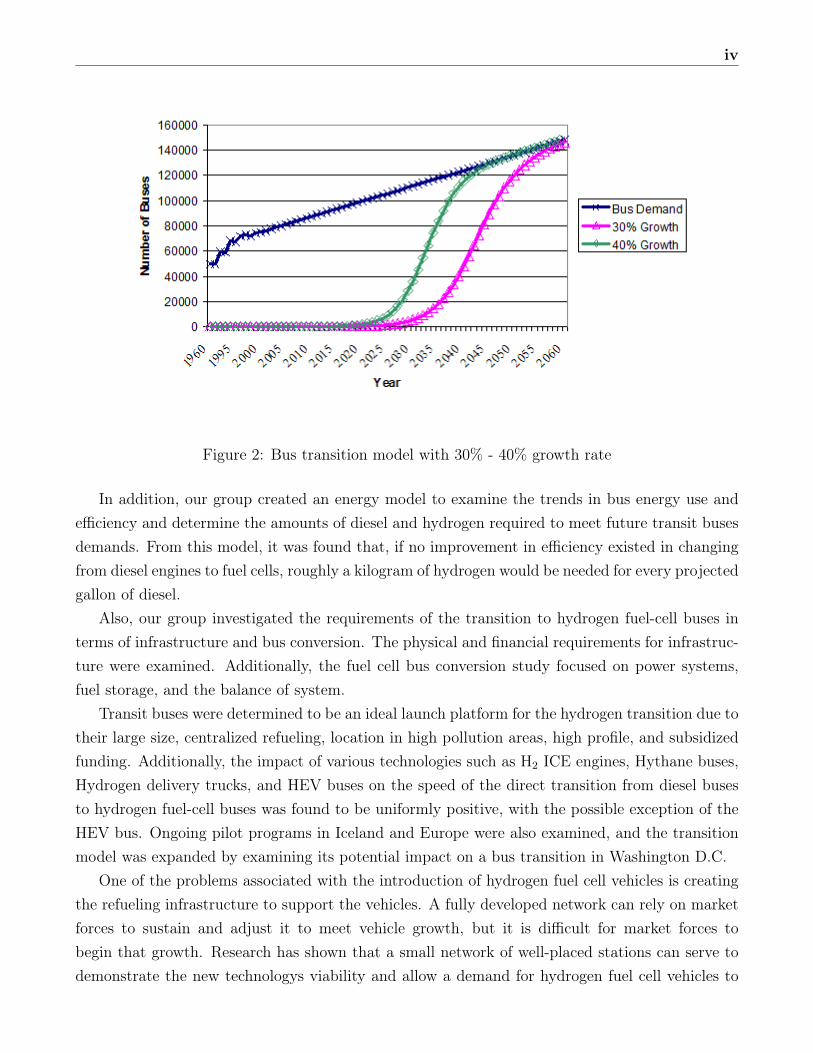
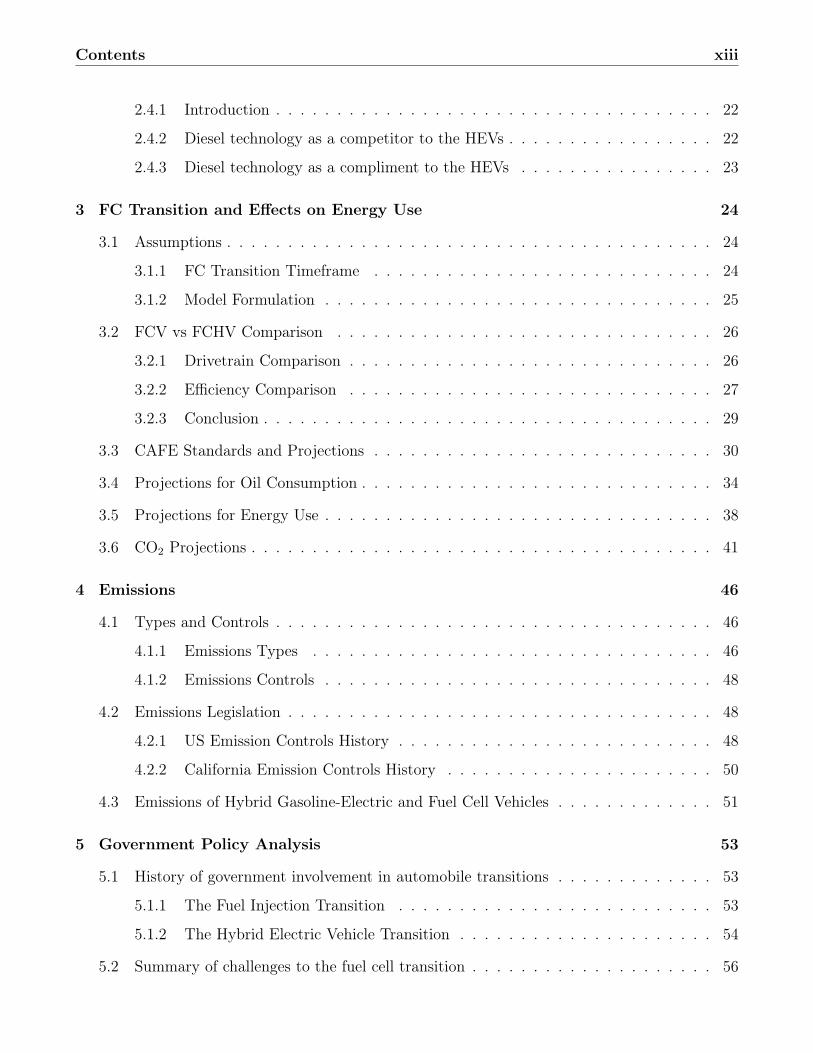
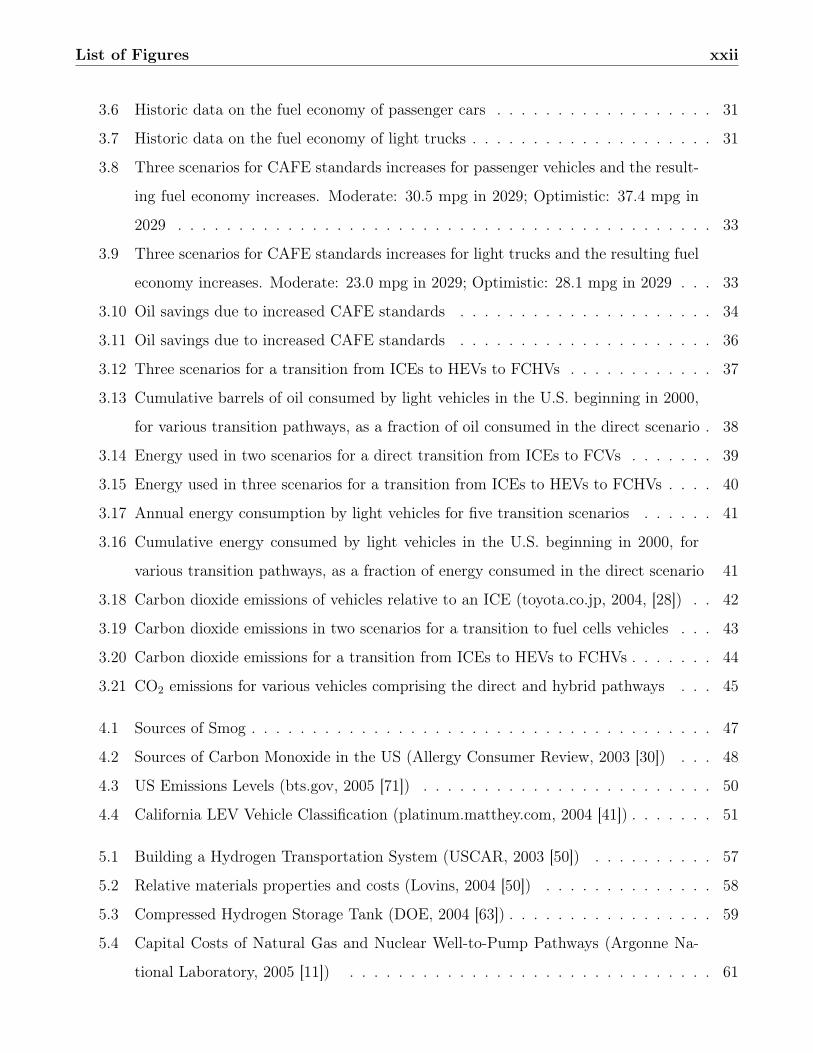
engines to hydrogen fuel cells in heavy duty vehicles. After determining that hydrogen fuel cellsin tractor trailers were impractical due to size, cost, and infrastructure issues, efforts were focusedon transit buses. A transition model was created by applying a logistics curve to forecast datafor bus demand in order to approximate the shape that the actual transition from diesel buses tohydrogen fuel cells buses would take through 2060. Once the transition model was implemented,various representative scenarios were examined.
iv
Figure 2: Bus transition model with 30% - 40% growth rate
In addition, our group created an energy model to examine the trends in bus energy use andefficiency and determine the amounts of diesel and hydrogen required to meet future transit busesdemands. From this model, it was found that, if no improvement in efficiency existed in changingfrom diesel engines to fuel cells, roughly a kilogram of hydrogen would be needed for every projectedgallon of diesel.
Also, our group investigated the requirements of the transition to hydrogen fuel-cell buses interms of infrastructure and bus conversion. The physical and financial requirements for infrastruc-ture were examined. Additionally, the fuel cell bus conversion study focused on power systems,fuel storage, and the balance of system.
Transit buses were determined to be an ideal launch platform for the hydrogen transition due totheir large size, centralized refueling, location in high pollution areas, high profile, and subsidizedfunding. Additionally, the impact of various technologies such as H2 ICE engines, Hythane buses,Hydrogen delivery trucks, and HEV buses on the speed of the direct transition from diesel busesto hydrogen fuel-cell buses was found to be uniformly positive, with the possible exception of theHEV bus. Ongoing pilot programs in Iceland and Europe were also examined, and the transitionmodel was expanded by examining its potential impact on a bus transition in Washington D.C.
One of the problems associated with the introduction of hydrogen fuel cell vehicles is creatingthe refueling infrastructure to support the vehicles. A fully developed network can rely on marketforces to sustain and adjust it to meet vehicle growth, but it is difficult for market forces tobegin that growth. Research has shown that a small network of well-placed stations can serve todemonstrate the new technologys viability and allow a demand for hydrogen fuel cell vehicles to
v
grow. Our group designed a plan to build a network for the District of Columbia (DC) and analyzeits behavior. It was believed that this city represented a typical American city and also provideda unique opportunity to showcase hydrogen technology in view of lawmakers and, to some extent,the American people.
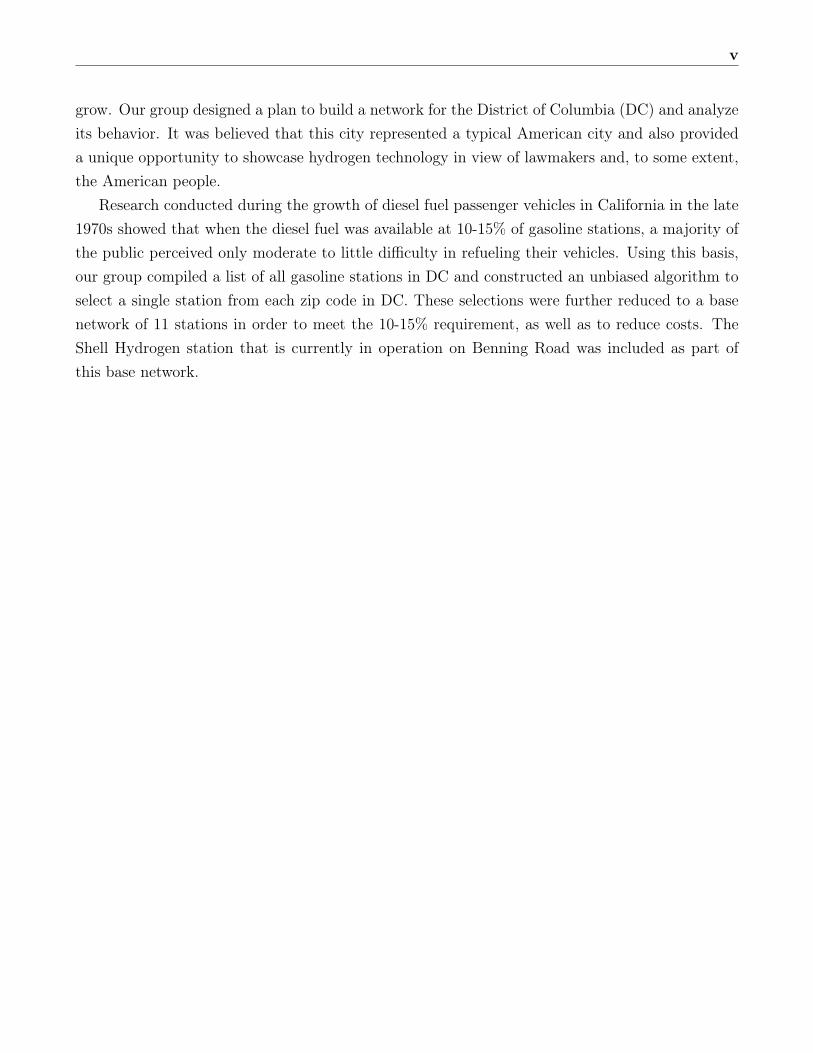
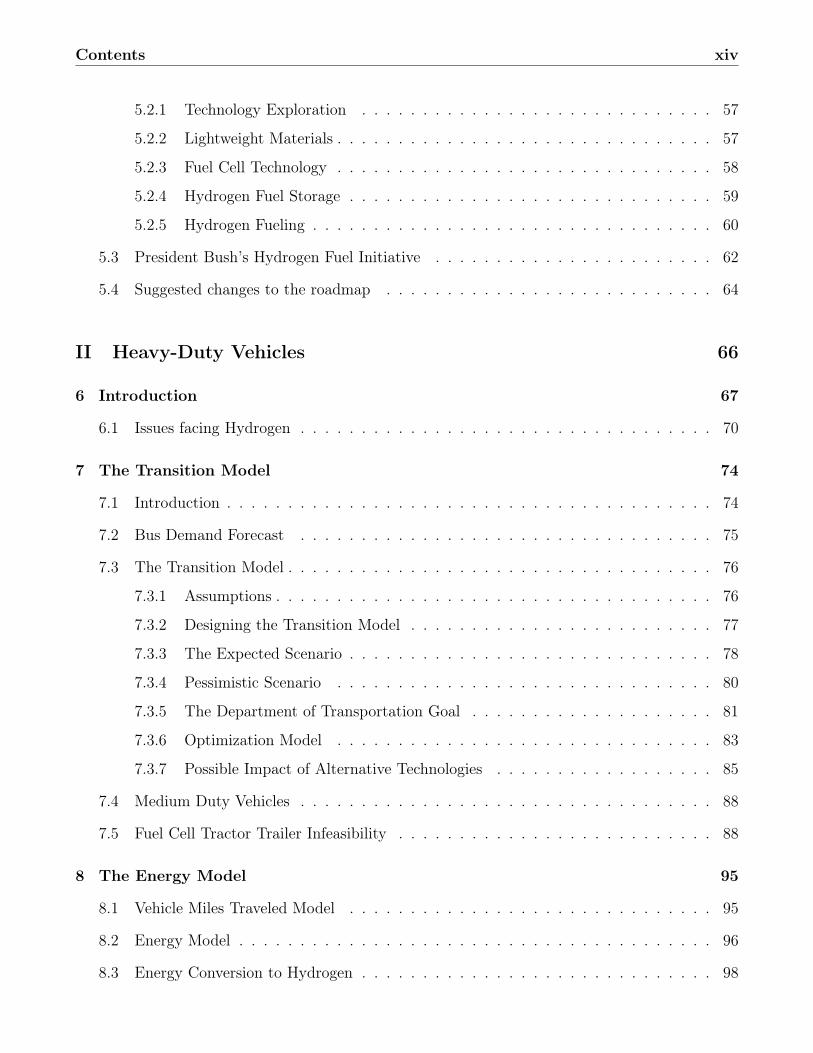
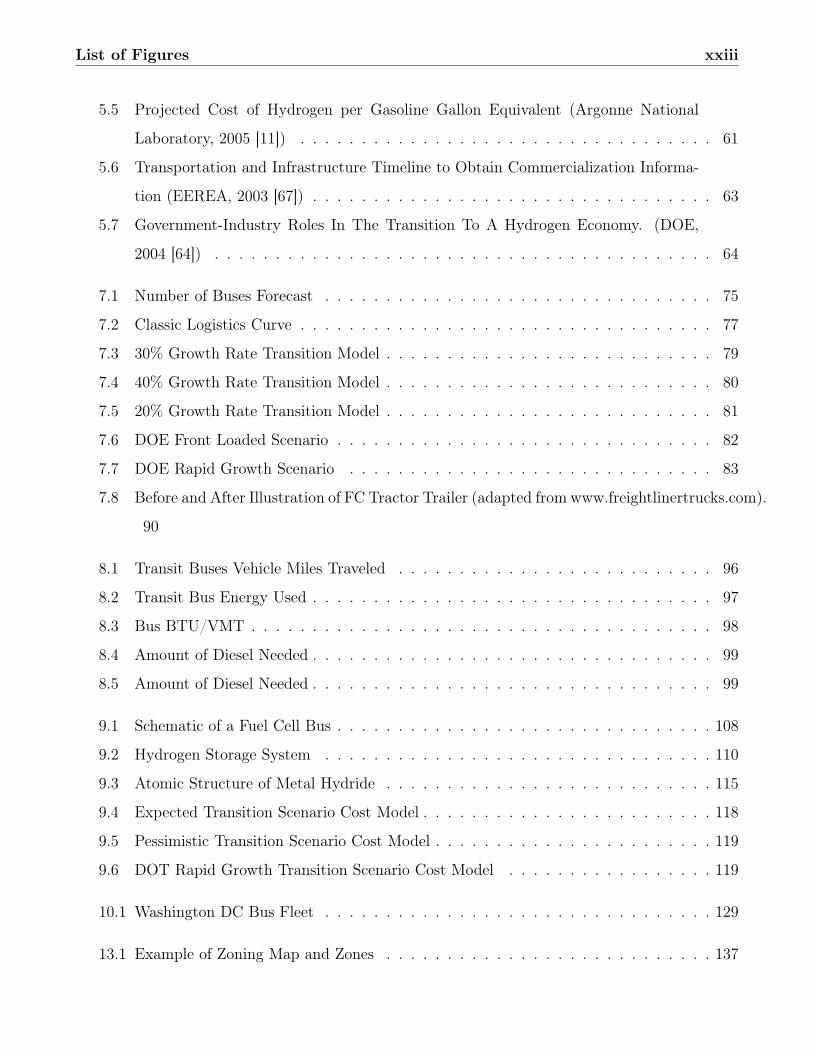
Research conducted during the growth of diesel fuel passenger vehicles in California in the late1970s showed that when the diesel fuel was available at 10-15% of gasoline stations, a majority ofthe public perceived only moderate to little difficulty in refueling their vehicles. Using this basis,our group compiled a list of all gasoline stations in DC and constructed an unbiased algorithm toselect a single station from each zip code in DC. These selections were further reduced to a basenetwork of 11 stations in order to meet the 10-15% requirement, as well as to reduce costs. TheShell Hydrogen station that is currently in operation on Benning Road was included as part ofthis base network.
vi
Figure 3: Map of Washington, D.C. with proposed locations for hydrogen refueling stations
Next, a simulation model was created to conduct a thorough analysis on both DC and thesurrounding counties to determine how the demand for FCVs might grow over time accordingto population growth, socioeconomic statistics, and urban sprawl. The model found that theproposed network could adequately serve the growth in both the suburban and urban areas of DCfor approximately ten years before more construction would be needed. Furthermore, the modeldemonstrated that an urban network could encourage suburban FCV ownership, and eventuallycreate a market for suburban stations.
Finally, an economic analysis was performed to demonstrate the feasibility of constructing the
vii
DC hydrogen network. An estimated initial investment of $20 million would be needed to constructthese 11 stations, which could be recovered over 15 years by selling hydrogen at $3.44/kg in thefirst year, and steadily declining the price to $1.68/kg at the end of the analysis period. Theresearch also concludes that the overall feasibility of the project will require the cooperation ofmany entities including multiple hydrogen providers and energy corporations.
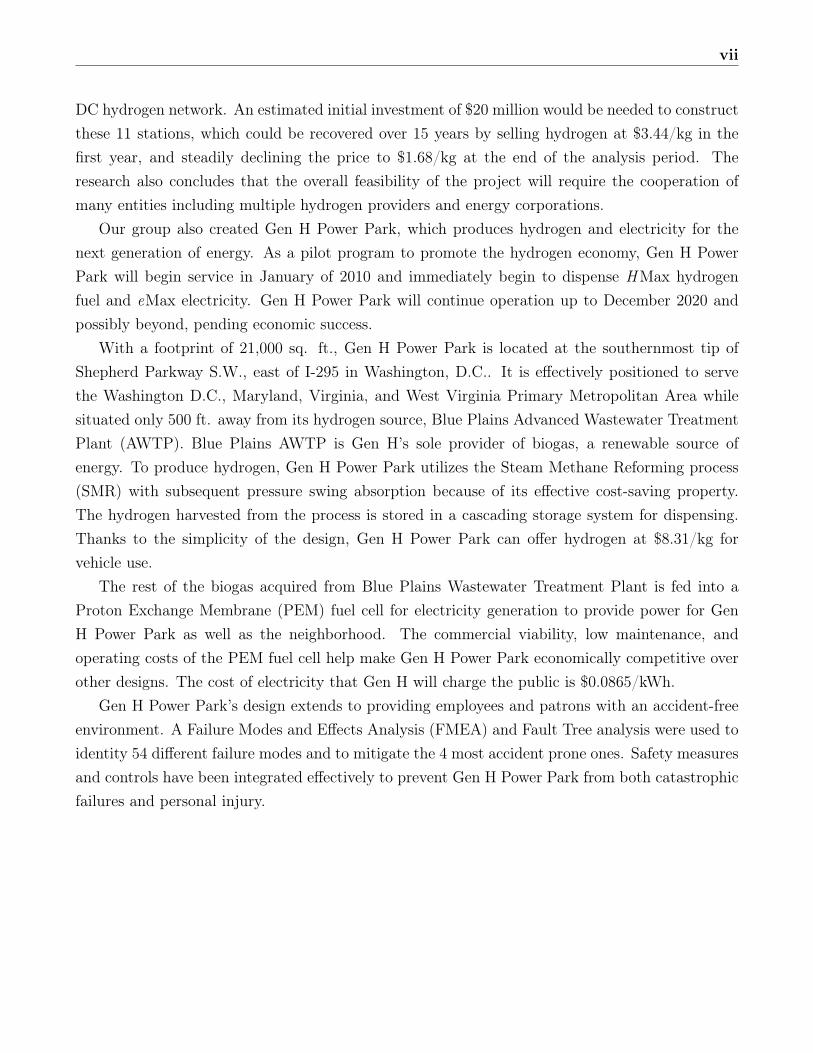
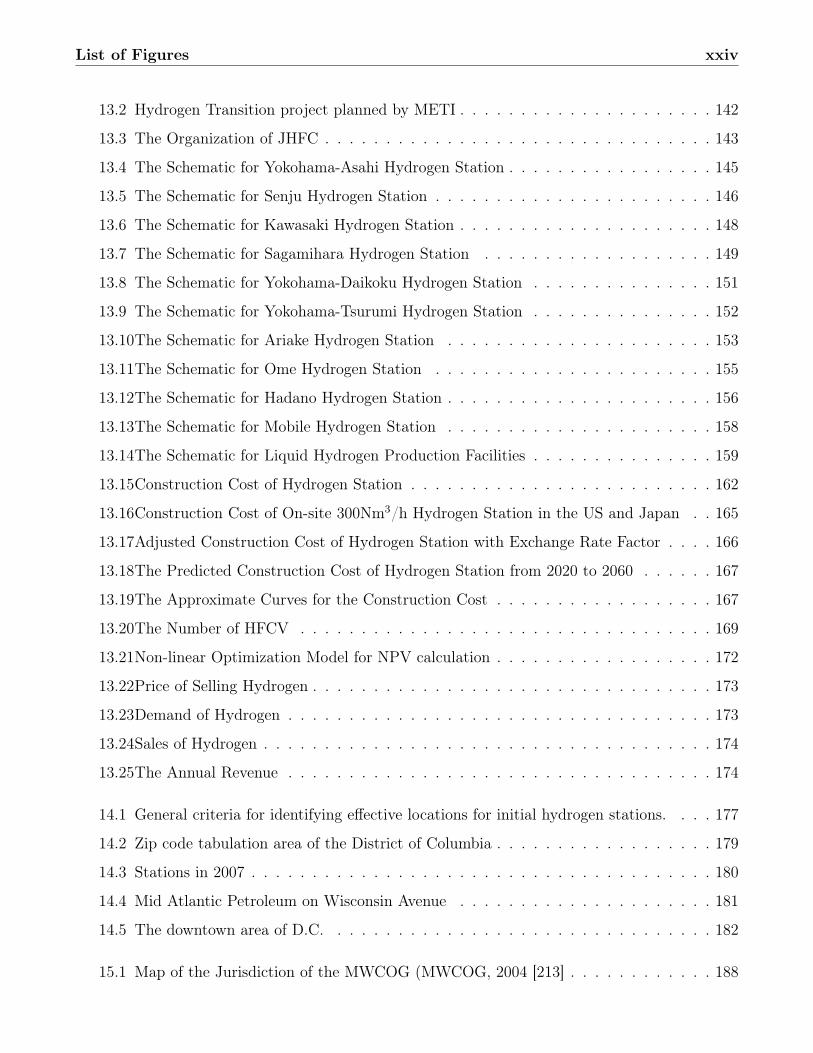
Our group also created Gen H Power Park, which produces hydrogen and electricity for thenext generation of energy. As a pilot program to promote the hydrogen economy, Gen H PowerPark will begin service in January of 2010 and immediately begin to dispense HMax hydrogenfuel and eMax electricity. Gen H Power Park will continue operation up to December 2020 andpossibly beyond, pending economic success.
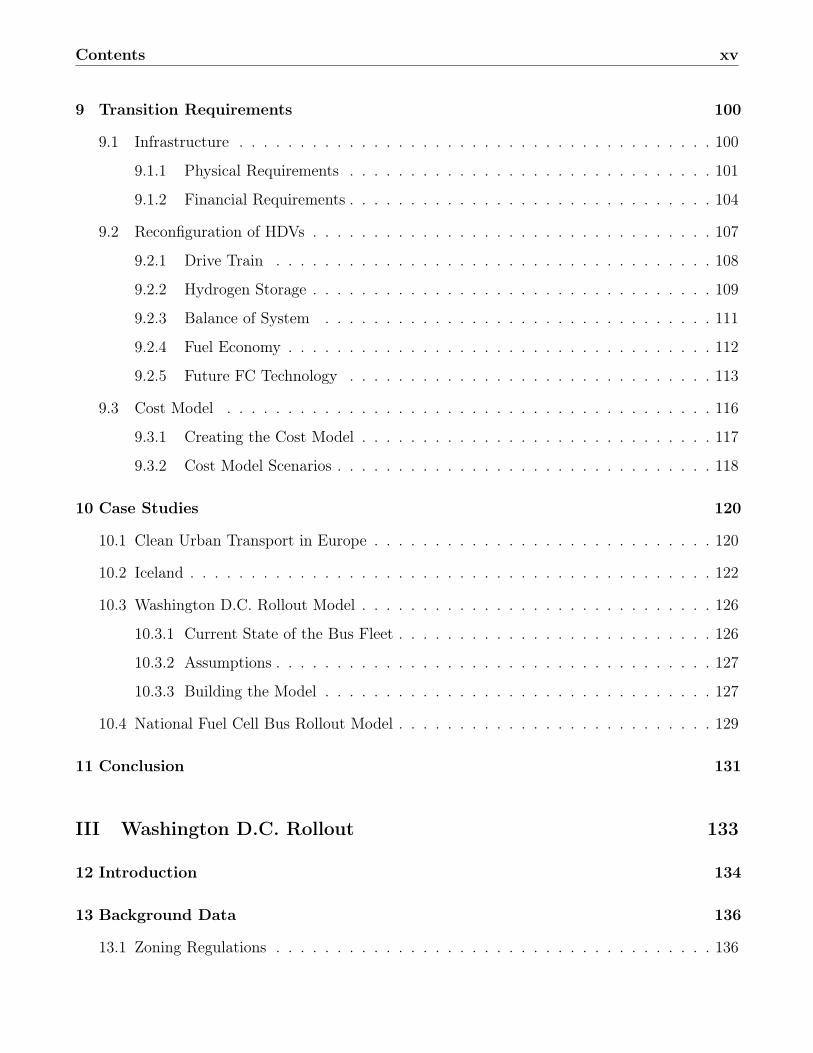
With a footprint of 21,000 sq. ft., Gen H Power Park is located at the southernmost tip ofShepherd Parkway S.W., east of I-295 in Washington, D.C.. It is effectively positioned to servethe Washington D.C., Maryland, Virginia, and West Virginia Primary Metropolitan Area whilesituated only 500 ft. away from its hydrogen source, Blue Plains Advanced Wastewater TreatmentPlant (AWTP). Blue Plains AWTP is Gen H’s sole provider of biogas, a renewable source ofenergy. To produce hydrogen, Gen H Power Park utilizes the Steam Methane Reforming process(SMR) with subsequent pressure swing absorption because of its effective cost-saving property.The hydrogen harvested from the process is stored in a cascading storage system for dispensing.Thanks to the simplicity of the design, Gen H Power Park can offer hydrogen at $8.31/kg forvehicle use.
The rest of the biogas acquired from Blue Plains Wastewater Treatment Plant is fed into aProton Exchange Membrane (PEM) fuel cell for electricity generation to provide power for GenH Power Park as well as the neighborhood. The commercial viability, low maintenance, andoperating costs of the PEM fuel cell help make Gen H Power Park economically competitive overother designs. The cost of electricity that Gen H will charge the public is $0.0865/kWh.
Gen H Power Park’s design extends to providing employees and patrons with an accident-freeenvironment. A Failure Modes and Effects Analysis (FMEA) and Fault Tree analysis were used toidentity 54 different failure modes and to mitigate the 4 most accident prone ones. Safety measuresand controls have been integrated effectively to prevent Gen H Power Park from both catastrophicfailures and personal injury.
viii
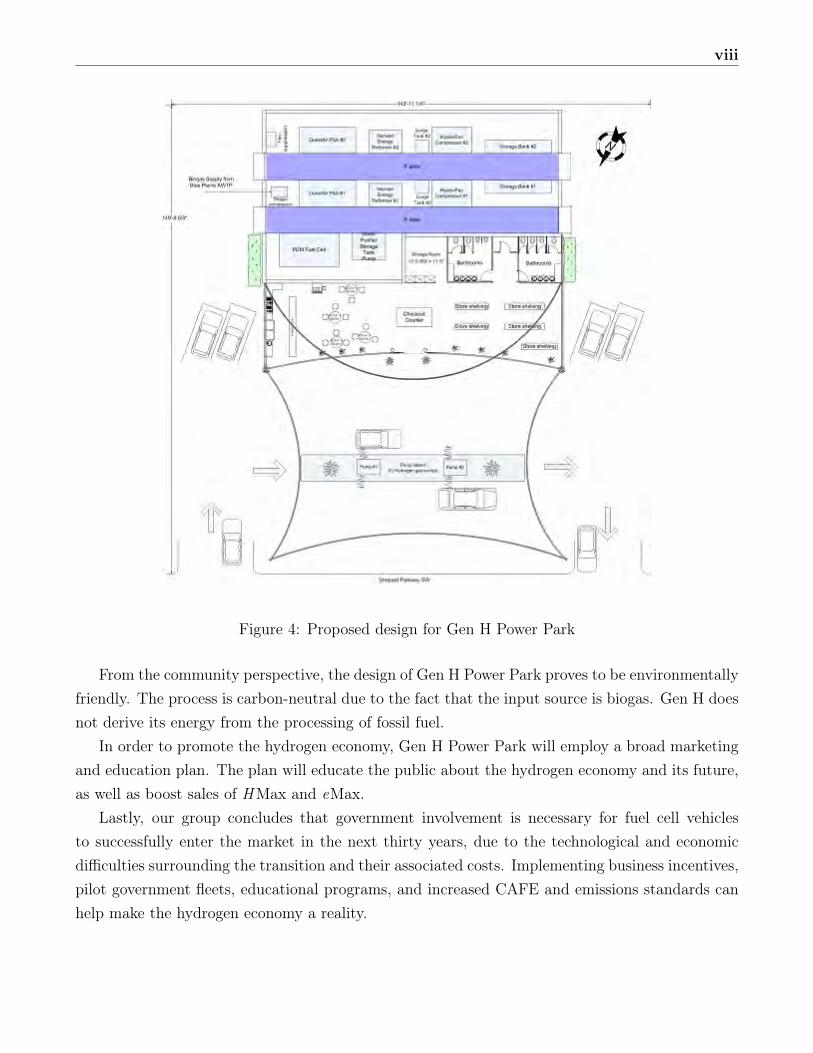
Figure 4: Proposed design for Gen H Power Park
From the community perspective, the design of Gen H Power Park proves to be environmentallyfriendly. The process is carbon-neutral due to the fact that the input source is biogas. Gen H doesnot derive its energy from the processing of fossil fuel.
In order to promote the hydrogen economy, Gen H Power Park will employ a broad marketingand education plan. The plan will educate the public about the hydrogen economy and its future,as well as boost sales of HMax and eMax.
Lastly, our group concludes that government involvement is necessary for fuel cell vehiclesto successfully enter the market in the next thirty years, due to the technological and economicdifficulties surrounding the transition and their associated costs. Implementing business incentives,pilot government fleets, educational programs, and increased CAFE and emissions standards canhelp make the hydrogen economy a reality.
List of Authors
Advisor: Professor Francis Vanek
Hybrid Electric Vehicle Team
• Peng Wei - Project Manager - Beijing, P.R. China
• Ghan Patel - Team Manager - King of Prussia, PA
• Nicole Kalb - Gettysburg, PA
Heavy-Duty Vehicle Team
• Daniel Chituc - Team Manager - Waverly, NY
• Jon Leisner - Asst. Project Manager - Philadelphia, PA
• Frederic Bruneau - Londonderry, NH
Washington, D.C. Rollout Team
• Dan Herstine - Team Manager - Lindenwold, NJ
• Koji Akeno - Tokushima, Japan
• Kang-Wei Hsiao - Taipei, Taiwan
ix

x
Gen H Power Park Design Team
• Jason Leung - Team Manager - Hong Kong SAR, China
• Walter Chen - Chief Editor - College Station, TX
• Perla Lastra - Palmdale, CA
• Joseph W. Schwarz IV - Rocky River, OH
Acknowledgements
We would like to extend our most sincere thanks to the following for making our project success-
ful by providing us with information, physical and moral support, and a conducive atmosphere
throughout the year. Every minute of your time spent in contributing to our success will always
be highly appreciated.All of the School of Civil and Environmental Engineering faculty and office staff, in particular
Patricia Apgar for being our tireless link to the administration, Bonnie Jo Coughlin for alwaysensuring that our printing paper was in stock, and Cameron Willkens for keeping our computersystems in top form at all times, even with the shortest of notice.
The other members of the Gen H Power Park design team: Devendar Agarwal, Marilyn Basanta,Arvind Chandrasekar, David Miller, and Nadia Siles for your dedication and hard work.
All of our professors at Cornell University, especially Dr. Mark Turnquist, Prof. A.M. Center,Dr. Huseyin Topaloglu, and Dr. Robert J. Thomas for your help and guidance on this project.
Bill Blackburn of the California Fuel Cell Partnership, Patrick Serfass of the National HydrogenAssociation, Marc Hubert of HERA Hydrogen Storage Systems Inc., Jaimie Levin, Director ofMarketing and Communications for AC Transit, and all the vendors of the components in Gen HPower Park for your time and information.
Last but not least, our advisor, Professor Francis Vanek, for your great leadership, continuousguidance, encouragement, and constructive reviews. The late hours and tireless efforts you put into ensure our success will always be cherished.
For those whose assistance went to seeing us through, and are not mentioned herein, we ac-knowledge you too and recognize your value to us.
xi
Contents
Executive Summary ii
List of Authors ix
Acknowledgements xi
Introduction 1
I Hybrid Electric Vehicles 5
1 Introduction 6
2 The Hybrid Transition 8
2.1 HEV Technology Summary . . . . . . . . . . . . . . . . . . . . . . . . . . . . . . . . 8
2.2 HEV Penetration Scenarios . . . . . . . . . . . . . . . . . . . . . . . . . . . . . . . 10
2.2.1 Model Formulation . . . . . . . . . . . . . . . . . . . . . . . . . . . . . . . . 10
2.2.2 Assumptions . . . . . . . . . . . . . . . . . . . . . . . . . . . . . . . . . . . . 13
2.2.3 Results . . . . . . . . . . . . . . . . . . . . . . . . . . . . . . . . . . . . . . . 14
2.2.4 Milestones . . . . . . . . . . . . . . . . . . . . . . . . . . . . . . . . . . . . . 14
2.3 Battery Technology Overview / Projections . . . . . . . . . . . . . . . . . . . . . . 16
2.3.1 Introduction . . . . . . . . . . . . . . . . . . . . . . . . . . . . . . . . . . . . 16
2.3.2 Battery Types . . . . . . . . . . . . . . . . . . . . . . . . . . . . . . . . . . . 16
2.3.3 Battery Performance Overview and Projection . . . . . . . . . . . . . . . . . 19
2.3.4 Battery Cost Overview and Projection . . . . . . . . . . . . . . . . . . . . . 21
2.4 Diesel Technology and Its Impact on HEVs . . . . . . . . . . . . . . . . . . . . . . . 22
xii
Contents xiii
2.4.1 Introduction . . . . . . . . . . . . . . . . . . . . . . . . . . . . . . . . . . . . 22
2.4.2 Diesel technology as a competitor to the HEVs . . . . . . . . . . . . . . . . . 22
2.4.3 Diesel technology as a compliment to the HEVs . . . . . . . . . . . . . . . . 23
3 FC Transition and Effects on Energy Use 24
3.1 Assumptions . . . . . . . . . . . . . . . . . . . . . . . . . . . . . . . . . . . . . . . . 24
3.1.1 FC Transition Timeframe . . . . . . . . . . . . . . . . . . . . . . . . . . . . 24
3.1.2 Model Formulation . . . . . . . . . . . . . . . . . . . . . . . . . . . . . . . . 25
3.2 FCV vs FCHV Comparison . . . . . . . . . . . . . . . . . . . . . . . . . . . . . . . 26
3.2.1 Drivetrain Comparison . . . . . . . . . . . . . . . . . . . . . . . . . . . . . . 26
3.2.2 Efficiency Comparison . . . . . . . . . . . . . . . . . . . . . . . . . . . . . . 27
3.2.3 Conclusion . . . . . . . . . . . . . . . . . . . . . . . . . . . . . . . . . . . . . 29
3.3 CAFE Standards and Projections . . . . . . . . . . . . . . . . . . . . . . . . . . . . 30
3.4 Projections for Oil Consumption . . . . . . . . . . . . . . . . . . . . . . . . . . . . . 34
3.5 Projections for Energy Use . . . . . . . . . . . . . . . . . . . . . . . . . . . . . . . . 38
3.6 CO2 Projections . . . . . . . . . . . . . . . . . . . . . . . . . . . . . . . . . . . . . . 41
4 Emissions 46
4.1 Types and Controls . . . . . . . . . . . . . . . . . . . . . . . . . . . . . . . . . . . . 46
4.1.1 Emissions Types . . . . . . . . . . . . . . . . . . . . . . . . . . . . . . . . . 46
4.1.2 Emissions Controls . . . . . . . . . . . . . . . . . . . . . . . . . . . . . . . . 48
4.2 Emissions Legislation . . . . . . . . . . . . . . . . . . . . . . . . . . . . . . . . . . . 48
4.2.1 US Emission Controls History . . . . . . . . . . . . . . . . . . . . . . . . . . 48
4.2.2 California Emission Controls History . . . . . . . . . . . . . . . . . . . . . . 50
4.3 Emissions of Hybrid Gasoline-Electric and Fuel Cell Vehicles . . . . . . . . . . . . . 51
5 Government Policy Analysis 53
5.1 History of government involvement in automobile transitions . . . . . . . . . . . . . 53
5.1.1 The Fuel Injection Transition . . . . . . . . . . . . . . . . . . . . . . . . . . 53
5.1.2 The Hybrid Electric Vehicle Transition . . . . . . . . . . . . . . . . . . . . . 54
5.2 Summary of challenges to the fuel cell transition . . . . . . . . . . . . . . . . . . . . 56
Contents xiv
5.2.1 Technology Exploration . . . . . . . . . . . . . . . . . . . . . . . . . . . . . 57
5.2.2 Lightweight Materials . . . . . . . . . . . . . . . . . . . . . . . . . . . . . . . 57
5.2.3 Fuel Cell Technology . . . . . . . . . . . . . . . . . . . . . . . . . . . . . . . 58
5.2.4 Hydrogen Fuel Storage . . . . . . . . . . . . . . . . . . . . . . . . . . . . . . 59
5.2.5 Hydrogen Fueling . . . . . . . . . . . . . . . . . . . . . . . . . . . . . . . . . 60
5.3 President Bush’s Hydrogen Fuel Initiative . . . . . . . . . . . . . . . . . . . . . . . 62
5.4 Suggested changes to the roadmap . . . . . . . . . . . . . . . . . . . . . . . . . . . 64
II Heavy-Duty Vehicles 66
6 Introduction 67
6.1 Issues facing Hydrogen . . . . . . . . . . . . . . . . . . . . . . . . . . . . . . . . . . 70
7 The Transition Model 74
7.1 Introduction . . . . . . . . . . . . . . . . . . . . . . . . . . . . . . . . . . . . . . . . 74
7.2 Bus Demand Forecast . . . . . . . . . . . . . . . . . . . . . . . . . . . . . . . . . . 75
7.3 The Transition Model . . . . . . . . . . . . . . . . . . . . . . . . . . . . . . . . . . . 76
7.3.1 Assumptions . . . . . . . . . . . . . . . . . . . . . . . . . . . . . . . . . . . . 76
7.3.2 Designing the Transition Model . . . . . . . . . . . . . . . . . . . . . . . . . 77
7.3.3 The Expected Scenario . . . . . . . . . . . . . . . . . . . . . . . . . . . . . . 78
7.3.4 Pessimistic Scenario . . . . . . . . . . . . . . . . . . . . . . . . . . . . . . . 80
7.3.5 The Department of Transportation Goal . . . . . . . . . . . . . . . . . . . . 81
7.3.6 Optimization Model . . . . . . . . . . . . . . . . . . . . . . . . . . . . . . . 83
7.3.7 Possible Impact of Alternative Technologies . . . . . . . . . . . . . . . . . . 85
7.4 Medium Duty Vehicles . . . . . . . . . . . . . . . . . . . . . . . . . . . . . . . . . . 88
7.5 Fuel Cell Tractor Trailer Infeasibility . . . . . . . . . . . . . . . . . . . . . . . . . . 88
8 The Energy Model 95
8.1 Vehicle Miles Traveled Model . . . . . . . . . . . . . . . . . . . . . . . . . . . . . . 95
8.2 Energy Model . . . . . . . . . . . . . . . . . . . . . . . . . . . . . . . . . . . . . . . 96
8.3 Energy Conversion to Hydrogen . . . . . . . . . . . . . . . . . . . . . . . . . . . . . 98
Contents xv
9 Transition Requirements 100
9.1 Infrastructure . . . . . . . . . . . . . . . . . . . . . . . . . . . . . . . . . . . . . . . 100
9.1.1 Physical Requirements . . . . . . . . . . . . . . . . . . . . . . . . . . . . . . 101
9.1.2 Financial Requirements . . . . . . . . . . . . . . . . . . . . . . . . . . . . . . 104
9.2 Reconfiguration of HDVs . . . . . . . . . . . . . . . . . . . . . . . . . . . . . . . . . 107
9.2.1 Drive Train . . . . . . . . . . . . . . . . . . . . . . . . . . . . . . . . . . . . 108
9.2.2 Hydrogen Storage . . . . . . . . . . . . . . . . . . . . . . . . . . . . . . . . . 109
9.2.3 Balance of System . . . . . . . . . . . . . . . . . . . . . . . . . . . . . . . . 111
9.2.4 Fuel Economy . . . . . . . . . . . . . . . . . . . . . . . . . . . . . . . . . . . 112
9.2.5 Future FC Technology . . . . . . . . . . . . . . . . . . . . . . . . . . . . . . 113
9.3 Cost Model . . . . . . . . . . . . . . . . . . . . . . . . . . . . . . . . . . . . . . . . 116
9.3.1 Creating the Cost Model . . . . . . . . . . . . . . . . . . . . . . . . . . . . . 117
9.3.2 Cost Model Scenarios . . . . . . . . . . . . . . . . . . . . . . . . . . . . . . . 118
10 Case Studies 120
10.1 Clean Urban Transport in Europe . . . . . . . . . . . . . . . . . . . . . . . . . . . . 120
10.2 Iceland . . . . . . . . . . . . . . . . . . . . . . . . . . . . . . . . . . . . . . . . . . . 122
10.3 Washington D.C. Rollout Model . . . . . . . . . . . . . . . . . . . . . . . . . . . . . 126
10.3.1 Current State of the Bus Fleet . . . . . . . . . . . . . . . . . . . . . . . . . . 126
10.3.2 Assumptions . . . . . . . . . . . . . . . . . . . . . . . . . . . . . . . . . . . . 127
10.3.3 Building the Model . . . . . . . . . . . . . . . . . . . . . . . . . . . . . . . . 127
10.4 National Fuel Cell Bus Rollout Model . . . . . . . . . . . . . . . . . . . . . . . . . . 129
11 Conclusion 131
III Washington D.C. Rollout 133
12 Introduction 134
13 Background Data 136
13.1 Zoning Regulations . . . . . . . . . . . . . . . . . . . . . . . . . . . . . . . . . . . . 136

Contents xvi
13.1.1 Zones that allow gasoline stations . . . . . . . . . . . . . . . . . . . . . . . . 136
13.1.2 Public Sentiment . . . . . . . . . . . . . . . . . . . . . . . . . . . . . . . . . 138
13.2 Driver Behavior . . . . . . . . . . . . . . . . . . . . . . . . . . . . . . . . . . . . . . 139
13.2.1 Decision to Purchase FCVs . . . . . . . . . . . . . . . . . . . . . . . . . . . . 139
13.2.2 Relationship to Design of Network –Where/When to refuel . . . . . . . . . . 140
13.3 Information Derived from Japan . . . . . . . . . . . . . . . . . . . . . . . . . . . . . 141
13.3.1 Hydrogen Project in Japan . . . . . . . . . . . . . . . . . . . . . . . . . . . . 142
13.3.2 About JHFC . . . . . . . . . . . . . . . . . . . . . . . . . . . . . . . . . . . 142
13.3.3 Features of the Project of JHFC . . . . . . . . . . . . . . . . . . . . . . . . 143
13.3.4 Specifications of 11 types of hydrogen production facilities . . . . . . . . . . 144
13.4 Construction Cost of Hydrogen Stations . . . . . . . . . . . . . . . . . . . . . . . . 160
13.4.1 Construction Cost of Hydrogen Station in Japan . . . . . . . . . . . . . . . . 160
13.4.2 The difference in construction costs of hydrogen stations in the US and Japan162
13.4.3 Estimated Construction Cost in the US from Japan’s Cost . . . . . . . . . . 164
13.4.4 Economic Analysis for the Investment of Hydrogen Infrastructure . . . . . . 168
14 Design of Network 175
14.1 Design of Network . . . . . . . . . . . . . . . . . . . . . . . . . . . . . . . . . . . . 175
14.1.1 Sufficient Number for Initial Stage . . . . . . . . . . . . . . . . . . . . . . . 175
14.1.2 The Procedure of Initial Hydrogen Network . . . . . . . . . . . . . . . . . . 177
14.1.3 Final Design of Hydrogen Network . . . . . . . . . . . . . . . . . . . . . . . 183
14.1.4 Background on Implementation Decisions . . . . . . . . . . . . . . . . . . . . 184
15 Network Analysis 186
15.1 Estimate Load on Network . . . . . . . . . . . . . . . . . . . . . . . . . . . . . . . . 187
15.1.1 Population Projections (Trip Generation) . . . . . . . . . . . . . . . . . . . . 187
15.1.2 Users . . . . . . . . . . . . . . . . . . . . . . . . . . . . . . . . . . . . . . . . 190
15.1.3 Loading the Network (Trip Assignment) . . . . . . . . . . . . . . . . . . . . 196
15.2 Simulation . . . . . . . . . . . . . . . . . . . . . . . . . . . . . . . . . . . . . . . . . 197
15.3 Chickens and Eggs: How will the system grow? . . . . . . . . . . . . . . . . . . . . 199
15.3.1 Arlington, Alexandria City and Pentagon . . . . . . . . . . . . . . . . . . . 201
Contents xvii
15.4 Conclusion . . . . . . . . . . . . . . . . . . . . . . . . . . . . . . . . . . . . . . . . . 203
IV Gen H Power Park Design 205
16 Technical Design 206
16.1 Park Location . . . . . . . . . . . . . . . . . . . . . . . . . . . . . . . . . . . . . . . 206
16.2 Hydrogen Source . . . . . . . . . . . . . . . . . . . . . . . . . . . . . . . . . . . . . 208
16.3 Hydrogen Production . . . . . . . . . . . . . . . . . . . . . . . . . . . . . . . . . . . 212
16.3.1 Hydrogen Production Process . . . . . . . . . . . . . . . . . . . . . . . . . . 213
16.4 Hydrogen Distribution Process . . . . . . . . . . . . . . . . . . . . . . . . . . . . . . 214
16.4.1 Hydrogen Compression . . . . . . . . . . . . . . . . . . . . . . . . . . . . . . 215
16.4.2 Hydrogen Storage . . . . . . . . . . . . . . . . . . . . . . . . . . . . . . . . . 215
16.4.3 Hydrogen Dispensing . . . . . . . . . . . . . . . . . . . . . . . . . . . . . . . 217
16.5 Hydrogen Refueling Capability . . . . . . . . . . . . . . . . . . . . . . . . . . . . . . 217
16.6 Fuel Cell . . . . . . . . . . . . . . . . . . . . . . . . . . . . . . . . . . . . . . . . . . 218
16.6.1 The PEM Fuel Cell . . . . . . . . . . . . . . . . . . . . . . . . . . . . . . . . 219
16.6.2 PEM Fuel Cell Operational Characteristics . . . . . . . . . . . . . . . . . . . 219
17 Safety Analysis 221
17.1 Failure Modes and Effects Analysis . . . . . . . . . . . . . . . . . . . . . . . . . . . 221
17.2 Risk Mitigation . . . . . . . . . . . . . . . . . . . . . . . . . . . . . . . . . . . . . . 223
17.2.1 Power Conditioner . . . . . . . . . . . . . . . . . . . . . . . . . . . . . . . . 223
17.2.2 Storage System . . . . . . . . . . . . . . . . . . . . . . . . . . . . . . . . . . 223
17.2.3 Hydrogen Pipes and Dispensing Hoses . . . . . . . . . . . . . . . . . . . . . 224
17.3 Fault Tree Analysis . . . . . . . . . . . . . . . . . . . . . . . . . . . . . . . . . . . 225
18 Economic Analysis 227
18.1 Cost Structure . . . . . . . . . . . . . . . . . . . . . . . . . . . . . . . . . . . . . . . 227
18.1.1 Capital Cost . . . . . . . . . . . . . . . . . . . . . . . . . . . . . . . . . . . . 227
18.1.2 Running Expenses . . . . . . . . . . . . . . . . . . . . . . . . . . . . . . . . 229
18.1.3 Biogas Cost . . . . . . . . . . . . . . . . . . . . . . . . . . . . . . . . . . . . 229
Contents xviii
18.2 Revenue . . . . . . . . . . . . . . . . . . . . . . . . . . . . . . . . . . . . . . . . . . 230
18.3 Cash Flow . . . . . . . . . . . . . . . . . . . . . . . . . . . . . . . . . . . . . . . . . 231
18.3.1 Depreciation Calculations . . . . . . . . . . . . . . . . . . . . . . . . . . . . 231
18.4 Conclusions . . . . . . . . . . . . . . . . . . . . . . . . . . . . . . . . . . . . . . . . 232
19 Environmental Analysis 233
19.1 Hydrogen Production Emissions . . . . . . . . . . . . . . . . . . . . . . . . . . . . . 233
19.2 Electricity Production Emissions . . . . . . . . . . . . . . . . . . . . . . . . . . . . 234
19.3 Total Carbon Dioxide Emissions . . . . . . . . . . . . . . . . . . . . . . . . . . . . . 235
19.4 Net Carbon Dioxide Emissions . . . . . . . . . . . . . . . . . . . . . . . . . . . . . . 236
20 Marketing and Education 237
20.1 Education and Public Awareness . . . . . . . . . . . . . . . . . . . . . . . . . . . . 237
20.1.1 General Public . . . . . . . . . . . . . . . . . . . . . . . . . . . . . . . . . . 237
20.1.2 Academic Outreach . . . . . . . . . . . . . . . . . . . . . . . . . . . . . . . . 238
20.2 Marketing . . . . . . . . . . . . . . . . . . . . . . . . . . . . . . . . . . . . . . . . . 239
V Conclusions 242
21 Recommendations for Shell Gas & Power 243
21.1 Various Ways to Generate Hydrogen . . . . . . . . . . . . . . . . . . . . . . . . . . 243
21.2 Possible NGOs’ Involvement in the Transition . . . . . . . . . . . . . . . . . . . . . 246
21.3 Resolving the General Public’s Concern about Hydrogen . . . . . . . . . . . . . . . 247
21.4 The Necessity of Government Incentives . . . . . . . . . . . . . . . . . . . . . . . . 248
22 Project Conclusions 250
22.1 Findings and Results . . . . . . . . . . . . . . . . . . . . . . . . . . . . . . . . . . . 250
22.1.1 HEV . . . . . . . . . . . . . . . . . . . . . . . . . . . . . . . . . . . . . . . . 250
22.1.2 HDV . . . . . . . . . . . . . . . . . . . . . . . . . . . . . . . . . . . . . . . . 250
22.1.3 Gen H Power Park Design: . . . . . . . . . . . . . . . . . . . . . . . . . . . . 251
22.1.4 Washington D.C. Rollout . . . . . . . . . . . . . . . . . . . . . . . . . . . . . 252
Contents xix
22.2 Recommendations . . . . . . . . . . . . . . . . . . . . . . . . . . . . . . . . . . . . . 253
23 Reflections 255
23.1 HEV . . . . . . . . . . . . . . . . . . . . . . . . . . . . . . . . . . . . . . . . . . . . 255
23.2 HDV . . . . . . . . . . . . . . . . . . . . . . . . . . . . . . . . . . . . . . . . . . . . 256
23.3 Washington D.C. Rollout . . . . . . . . . . . . . . . . . . . . . . . . . . . . . . . . . 258
23.4 Gen H Power Park . . . . . . . . . . . . . . . . . . . . . . . . . . . . . . . . . . . . 260
Bibliography 263
Appendix 280
A Hybrid vs Direct Path Comparison Parameters 280
B HDV Appendix 281
B.1 Historical Bus Data . . . . . . . . . . . . . . . . . . . . . . . . . . . . . . . . . . . . 281
B.2 Bus Forecast By Year . . . . . . . . . . . . . . . . . . . . . . . . . . . . . . . . . . . 282
B.3 30% Growth Rate Scenario . . . . . . . . . . . . . . . . . . . . . . . . . . . . . . . . 283
B.4 40% Growth Rate Scenario . . . . . . . . . . . . . . . . . . . . . . . . . . . . . . . . 284
B.5 Pessimistic Scenario (20% Growth Rate) . . . . . . . . . . . . . . . . . . . . . . . . 285
B.6 DOT Front Loaded Scenario . . . . . . . . . . . . . . . . . . . . . . . . . . . . . . . 286
B.7 DOT Rapid Growth Scenario . . . . . . . . . . . . . . . . . . . . . . . . . . . . . . 287
B.8 Historical Vehicle Miles Traveled for Transit Buses . . . . . . . . . . . . . . . . . . . 288
B.9 Historical Energy Consumption for Transit Buses . . . . . . . . . . . . . . . . . . . 288
B.10 Major Bus and Trolleybus Agency Vehicle Data, Fiscal Year 2002 . . . . . . . . . . 289
C Station Placement in Phases 294
C.1 Station for Phase I . . . . . . . . . . . . . . . . . . . . . . . . . . . . . . . . . . . . 294
C.2 Station for Phase II . . . . . . . . . . . . . . . . . . . . . . . . . . . . . . . . . . . . 298
D Contest Appendix 302
D.1 CASCADE v3.0 Software . . . . . . . . . . . . . . . . . . . . . . . . . . . . . . . . . 302
Contents xx
D.2 Safety . . . . . . . . . . . . . . . . . . . . . . . . . . . . . . . . . . . . . . . . . . . 304
D.2.1 Safety Codes . . . . . . . . . . . . . . . . . . . . . . . . . . . . . . . . . . . 304
D.2.2 Failure Modes and Effects Analysis . . . . . . . . . . . . . . . . . . . . . . . 305
D.2.3 Fault Tree . . . . . . . . . . . . . . . . . . . . . . . . . . . . . . . . . . . . . 309
D.3 Carbon Dioxide Emission Calculations . . . . . . . . . . . . . . . . . . . . . . . . . 309
D.3.1 Carbon Dioxide Resulting from Swing Adsorption . . . . . . . . . . . . . . . 309
D.3.2 Carbon Dioxide Resulting from Steam Reformation . . . . . . . . . . . . . . 309
D.4 Cash Flow Analysis Spreadsheet . . . . . . . . . . . . . . . . . . . . . . . . . . . . . 310
D.5 Marketing Budget . . . . . . . . . . . . . . . . . . . . . . . . . . . . . . . . . . . . . 311
List of Figures
1 Annual energy consumption by light vehicles for five transition scenarios . . . . . . iii
2 Bus transition model with 30% - 40% growth rate . . . . . . . . . . . . . . . . . . . iv
3 Map of Washington, D.C. with proposed locations for hydrogen refueling stations . vi
4 Proposed design for Gen H Power Park . . . . . . . . . . . . . . . . . . . . . . . . . viii
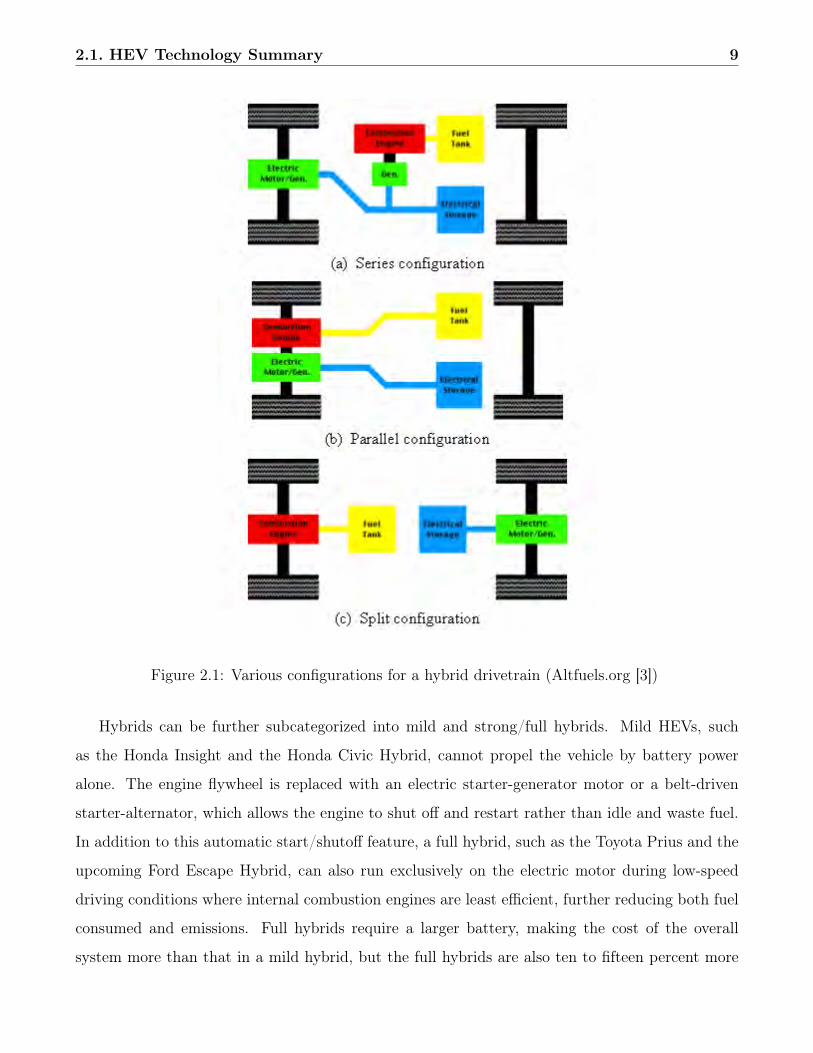
2.1 Various configurations for a hybrid drivetrain (Altfuels.org [3]) . . . . . . . . . . . 9
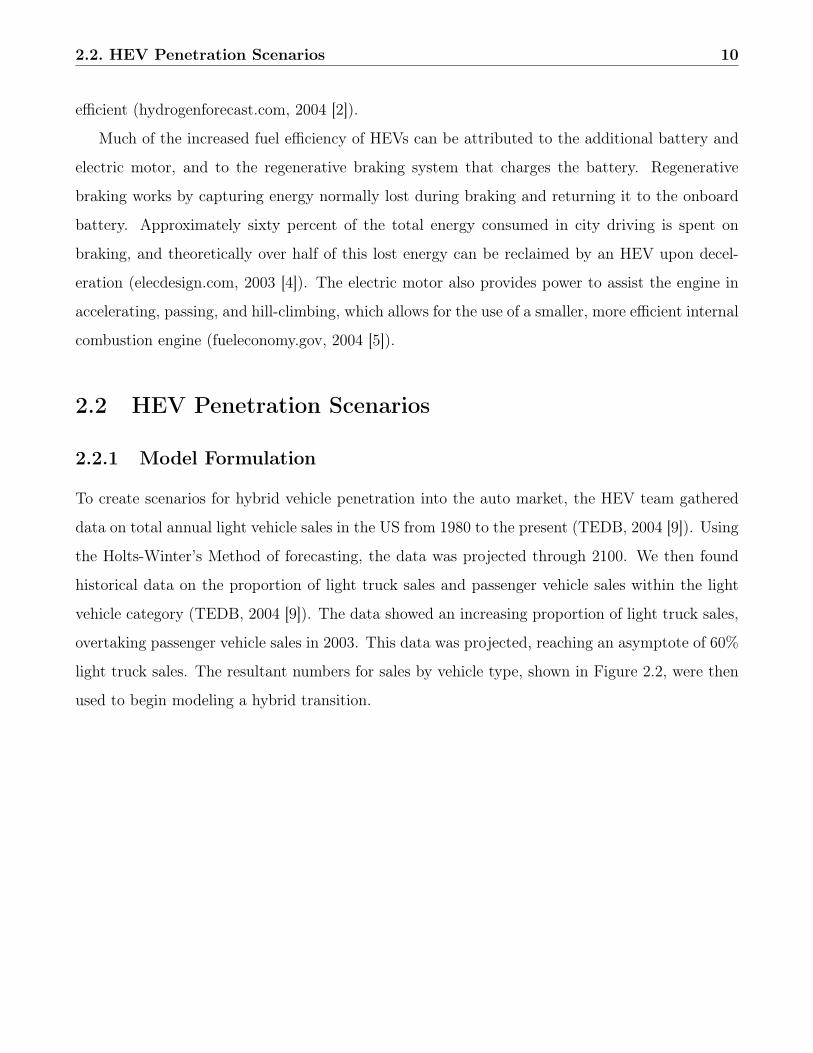
2.2 Vehicle Miles Traveled Projections . . . . . . . . . . . . . . . . . . . . . . . . . . . . 11
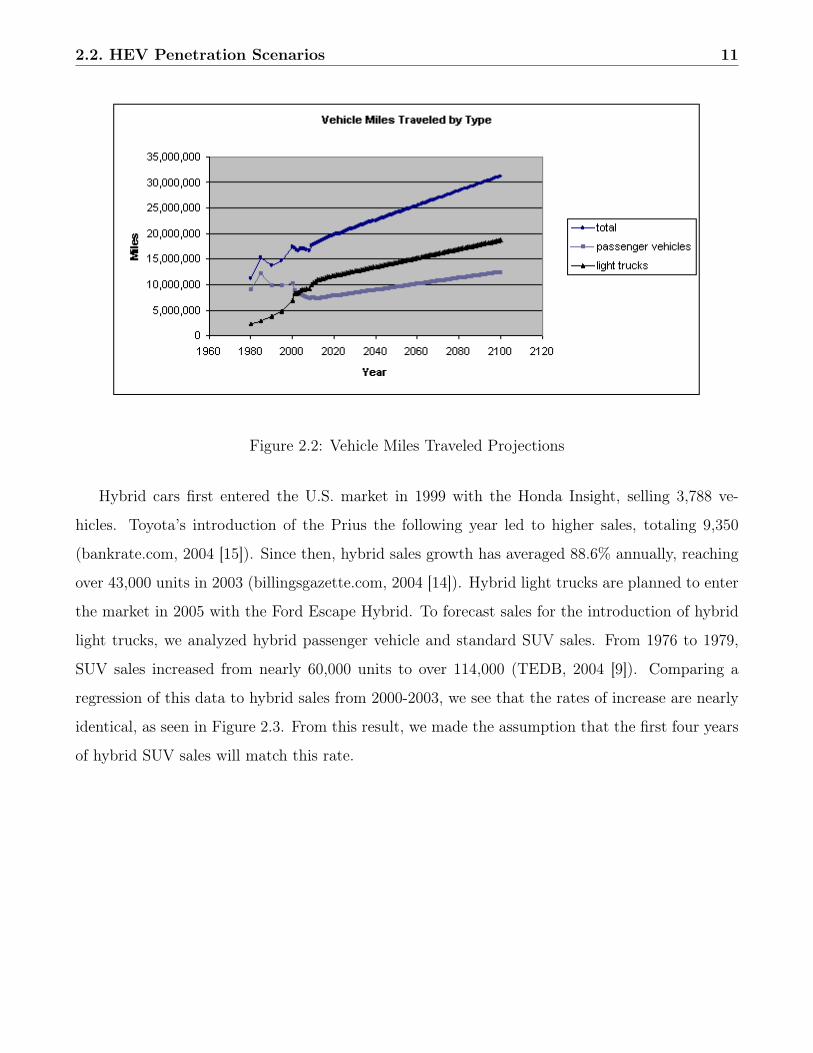
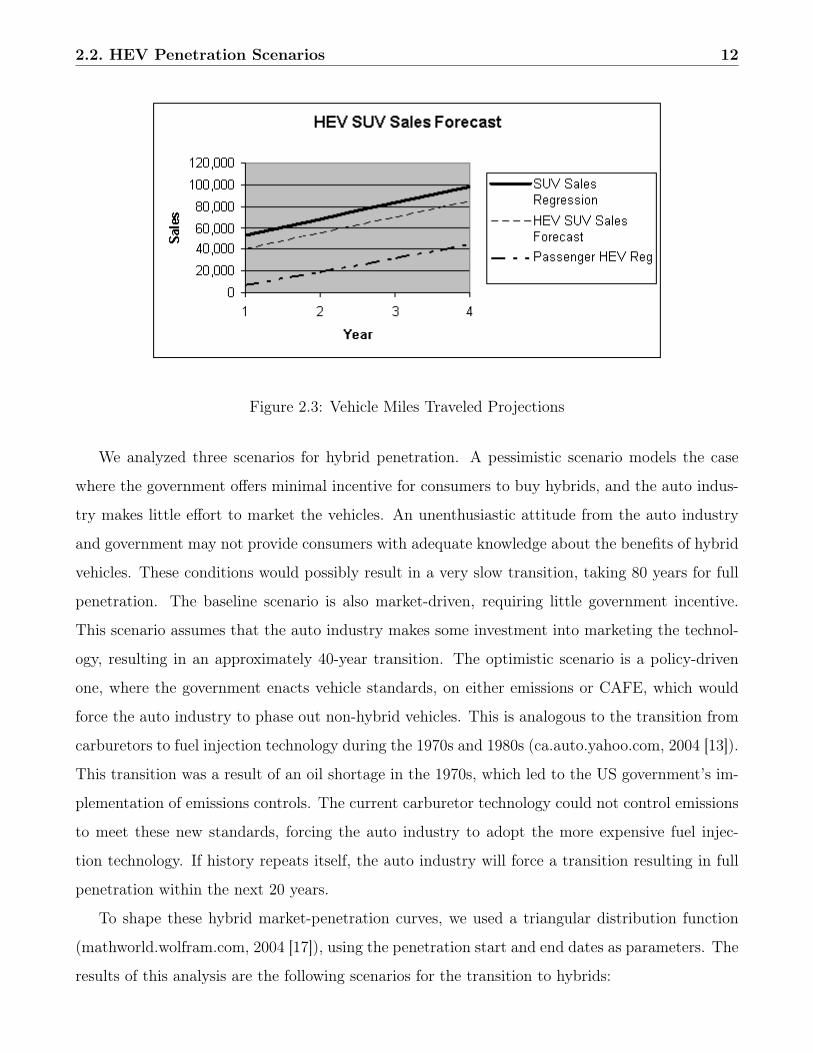
2.3 Vehicle Miles Traveled Projections . . . . . . . . . . . . . . . . . . . . . . . . . . . . 12
2.4 Hybrid Sales Projections for Passenger and Light Truck Vehicles . . . . . . . . . . . 13
2.5 Lead-Acid Battery (Radio Shack Corporation, 2005 [58]) . . . . . . . . . . . . . . . 16
2.6 Ni-MH Battery (Panasonic, 1999 [56]) . . . . . . . . . . . . . . . . . . . . . . . . . . 17
2.7 Lithium-Ion Battery (NEC TOKIN Corporation, 2005 [54]) . . . . . . . . . . . . . . 18
2.8 Energy Density Comparison (NEC TOKIN Corp, 2005 [54]) . . . . . . . . . . . . . 19
2.9 Example of Ni-MH Battery System for HEVs (Panasonic EV Energy Corporation,
2005 [57]) . . . . . . . . . . . . . . . . . . . . . . . . . . . . . . . . . . . . . . . . . 19
2.10 Battery Performance Projection . . . . . . . . . . . . . . . . . . . . . . . . . . . . . 20
2.11 Battery Cost Projection . . . . . . . . . . . . . . . . . . . . . . . . . . . . . . . . . 21
2.12 Diesel Fuel Injection Engine (US Department of Energy, 2003 [61]) . . . . . . . . . . 22
3.1 FC Transition Scenarios . . . . . . . . . . . . . . . . . . . . . . . . . . . . . . . . . 25
3.2 FCV Diagram . . . . . . . . . . . . . . . . . . . . . . . . . . . . . . . . . . . . . . . 26
3.3 FCHV Diagram (toyota.co.jp, 2004 [25]) . . . . . . . . . . . . . . . . . . . . . . . . 27
3.4 FCHV System Configuration (toyota.co.jp, 2004 [28]) . . . . . . . . . . . . . . . . . 27
3.5 Fuel Efficiency Comparison by Vehicle Type . . . . . . . . . . . . . . . . . . . . . . 28
xxi
List of Figures xxii
3.6 Historic data on the fuel economy of passenger cars . . . . . . . . . . . . . . . . . . 31
3.7 Historic data on the fuel economy of light trucks . . . . . . . . . . . . . . . . . . . . 31
3.8 Three scenarios for CAFE standards increases for passenger vehicles and the result-
ing fuel economy increases. Moderate: 30.5 mpg in 2029; Optimistic: 37.4 mpg in
2029 . . . . . . . . . . . . . . . . . . . . . . . . . . . . . . . . . . . . . . . . . . . . 33
3.9 Three scenarios for CAFE standards increases for light trucks and the resulting fuel
economy increases. Moderate: 23.0 mpg in 2029; Optimistic: 28.1 mpg in 2029 . . . 33
3.10 Oil savings due to increased CAFE standards . . . . . . . . . . . . . . . . . . . . . 34
3.11 Oil savings due to increased CAFE standards . . . . . . . . . . . . . . . . . . . . . 36
3.12 Three scenarios for a transition from ICEs to HEVs to FCHVs . . . . . . . . . . . . 37
3.13 Cumulative barrels of oil consumed by light vehicles in the U.S. beginning in 2000,
for various transition pathways, as a fraction of oil consumed in the direct scenario . 38
3.14 Energy used in two scenarios for a direct transition from ICEs to FCVs . . . . . . . 39
3.15 Energy used in three scenarios for a transition from ICEs to HEVs to FCHVs . . . . 40
3.17 Annual energy consumption by light vehicles for five transition scenarios . . . . . . 41
3.16 Cumulative energy consumed by light vehicles in the U.S. beginning in 2000, for
various transition pathways, as a fraction of energy consumed in the direct scenario 41
3.18 Carbon dioxide emissions of vehicles relative to an ICE (toyota.co.jp, 2004, [28]) . . 42
3.19 Carbon dioxide emissions in two scenarios for a transition to fuel cells vehicles . . . 43
3.20 Carbon dioxide emissions for a transition from ICEs to HEVs to FCHVs . . . . . . . 44
3.21 CO2 emissions for various vehicles comprising the direct and hybrid pathways . . . 45
4.1 Sources of Smog . . . . . . . . . . . . . . . . . . . . . . . . . . . . . . . . . . . . . . 47
4.2 Sources of Carbon Monoxide in the US (Allergy Consumer Review, 2003 [30]) . . . 48
4.3 US Emissions Levels (bts.gov, 2005 [71]) . . . . . . . . . . . . . . . . . . . . . . . . 50
4.4 California LEV Vehicle Classification (platinum.matthey.com, 2004 [41]) . . . . . . . 51
5.1 Building a Hydrogen Transportation System (USCAR, 2003 [50]) . . . . . . . . . . 57
5.2 Relative materials properties and costs (Lovins, 2004 [50]) . . . . . . . . . . . . . . 58
5.3 Compressed Hydrogen Storage Tank (DOE, 2004 [63]) . . . . . . . . . . . . . . . . . 59
5.4 Capital Costs of Natural Gas and Nuclear Well-to-Pump Pathways (Argonne Na-
tional Laboratory, 2005 [11]) . . . . . . . . . . . . . . . . . . . . . . . . . . . . . . 61
List of Figures xxiii
5.5 Projected Cost of Hydrogen per Gasoline Gallon Equivalent (Argonne National
Laboratory, 2005 [11]) . . . . . . . . . . . . . . . . . . . . . . . . . . . . . . . . . . 61
5.6 Transportation and Infrastructure Timeline to Obtain Commercialization Informa-
tion (EEREA, 2003 [67]) . . . . . . . . . . . . . . . . . . . . . . . . . . . . . . . . . 63
5.7 Government-Industry Roles In The Transition To A Hydrogen Economy. (DOE,
2004 [64]) . . . . . . . . . . . . . . . . . . . . . . . . . . . . . . . . . . . . . . . . . 64
7.1 Number of Buses Forecast . . . . . . . . . . . . . . . . . . . . . . . . . . . . . . . . 75
7.2 Classic Logistics Curve . . . . . . . . . . . . . . . . . . . . . . . . . . . . . . . . . . 77
7.3 30% Growth Rate Transition Model . . . . . . . . . . . . . . . . . . . . . . . . . . . 79
7.4 40% Growth Rate Transition Model . . . . . . . . . . . . . . . . . . . . . . . . . . . 80
7.5 20% Growth Rate Transition Model . . . . . . . . . . . . . . . . . . . . . . . . . . . 81
7.6 DOE Front Loaded Scenario . . . . . . . . . . . . . . . . . . . . . . . . . . . . . . . 82
7.7 DOE Rapid Growth Scenario . . . . . . . . . . . . . . . . . . . . . . . . . . . . . . 83
7.8 Before and After Illustration of FC Tractor Trailer (adapted from www.freightlinertrucks.com).
90
8.1 Transit Buses Vehicle Miles Traveled . . . . . . . . . . . . . . . . . . . . . . . . . . 96
8.2 Transit Bus Energy Used . . . . . . . . . . . . . . . . . . . . . . . . . . . . . . . . . 97
8.3 Bus BTU/VMT . . . . . . . . . . . . . . . . . . . . . . . . . . . . . . . . . . . . . . 98
8.4 Amount of Diesel Needed . . . . . . . . . . . . . . . . . . . . . . . . . . . . . . . . . 99
8.5 Amount of Diesel Needed . . . . . . . . . . . . . . . . . . . . . . . . . . . . . . . . . 99
9.1 Schematic of a Fuel Cell Bus . . . . . . . . . . . . . . . . . . . . . . . . . . . . . . . 108
9.2 Hydrogen Storage System . . . . . . . . . . . . . . . . . . . . . . . . . . . . . . . . 110
9.3 Atomic Structure of Metal Hydride . . . . . . . . . . . . . . . . . . . . . . . . . . . 115
9.4 Expected Transition Scenario Cost Model . . . . . . . . . . . . . . . . . . . . . . . . 118
9.5 Pessimistic Transition Scenario Cost Model . . . . . . . . . . . . . . . . . . . . . . . 119
9.6 DOT Rapid Growth Transition Scenario Cost Model . . . . . . . . . . . . . . . . . 119
10.1 Washington DC Bus Fleet . . . . . . . . . . . . . . . . . . . . . . . . . . . . . . . . 129
13.1 Example of Zoning Map and Zones . . . . . . . . . . . . . . . . . . . . . . . . . . . 137
List of Figures xxiv
13.2 Hydrogen Transition project planned by METI . . . . . . . . . . . . . . . . . . . . . 142
13.3 The Organization of JHFC . . . . . . . . . . . . . . . . . . . . . . . . . . . . . . . . 143
13.4 The Schematic for Yokohama-Asahi Hydrogen Station . . . . . . . . . . . . . . . . . 145
13.5 The Schematic for Senju Hydrogen Station . . . . . . . . . . . . . . . . . . . . . . . 146
13.6 The Schematic for Kawasaki Hydrogen Station . . . . . . . . . . . . . . . . . . . . . 148
13.7 The Schematic for Sagamihara Hydrogen Station . . . . . . . . . . . . . . . . . . . 149
13.8 The Schematic for Yokohama-Daikoku Hydrogen Station . . . . . . . . . . . . . . . 151
13.9 The Schematic for Yokohama-Tsurumi Hydrogen Station . . . . . . . . . . . . . . . 152
13.10The Schematic for Ariake Hydrogen Station . . . . . . . . . . . . . . . . . . . . . . 153
13.11The Schematic for Ome Hydrogen Station . . . . . . . . . . . . . . . . . . . . . . . 155
13.12The Schematic for Hadano Hydrogen Station . . . . . . . . . . . . . . . . . . . . . . 156
13.13The Schematic for Mobile Hydrogen Station . . . . . . . . . . . . . . . . . . . . . . 158
13.14The Schematic for Liquid Hydrogen Production Facilities . . . . . . . . . . . . . . . 159
13.15Construction Cost of Hydrogen Station . . . . . . . . . . . . . . . . . . . . . . . . . 162
13.16Construction Cost of On-site 300Nm3/h Hydrogen Station in the US and Japan . . 165
13.17Adjusted Construction Cost of Hydrogen Station with Exchange Rate Factor . . . . 166
13.18The Predicted Construction Cost of Hydrogen Station from 2020 to 2060 . . . . . . 167
13.19The Approximate Curves for the Construction Cost . . . . . . . . . . . . . . . . . . 167
13.20The Number of HFCV . . . . . . . . . . . . . . . . . . . . . . . . . . . . . . . . . . 169
13.21Non-linear Optimization Model for NPV calculation . . . . . . . . . . . . . . . . . . 172
13.22Price of Selling Hydrogen . . . . . . . . . . . . . . . . . . . . . . . . . . . . . . . . . 173
13.23Demand of Hydrogen . . . . . . . . . . . . . . . . . . . . . . . . . . . . . . . . . . . 173
13.24Sales of Hydrogen . . . . . . . . . . . . . . . . . . . . . . . . . . . . . . . . . . . . . 174
13.25The Annual Revenue . . . . . . . . . . . . . . . . . . . . . . . . . . . . . . . . . . . 174
14.1 General criteria for identifying effective locations for initial hydrogen stations. . . . 177
14.2 Zip code tabulation area of the District of Columbia . . . . . . . . . . . . . . . . . . 179
14.3 Stations in 2007 . . . . . . . . . . . . . . . . . . . . . . . . . . . . . . . . . . . . . . 180
14.4 Mid Atlantic Petroleum on Wisconsin Avenue . . . . . . . . . . . . . . . . . . . . . 181
14.5 The downtown area of D.C. . . . . . . . . . . . . . . . . . . . . . . . . . . . . . . . 182
15.1 Map of the Jurisdiction of the MWCOG (MWCOG, 2004 [213] . . . . . . . . . . . . 188
List of Figures xxv
15.2 Population of Greater DC regions over time . . . . . . . . . . . . . . . . . . . . . . 189
15.3 Trend over time of Greater DC urban sprawl . . . . . . . . . . . . . . . . . . . . . . 189
15.4 Population distribution in Washington D.C . . . . . . . . . . . . . . . . . . . . . . . 192
15.5 Population estimation in Washington D.C . . . . . . . . . . . . . . . . . . . . . . . 193
15.6 Per capita income of census tracts in DC area (Bowen, 2004) . . . . . . . . . . . . . 193
15.7 Penetration curves of FCVs over time . . . . . . . . . . . . . . . . . . . . . . . . . . 194
15.8 Growth of FCV users over time . . . . . . . . . . . . . . . . . . . . . . . . . . . . . 196
15.9 Average refills per year at a station in the network . . . . . . . . . . . . . . . . . . . 197
15.10Approx. hourly usage of a gasoline station (derived from Papacostas, 2001 [210]) . . 198
15.11Phase II . . . . . . . . . . . . . . . . . . . . . . . . . . . . . . . . . . . . . . . . . . 201
15.12Arlington, Alexandria City and Pentagon . . . . . . . . . . . . . . . . . . . . . . . . 202
15.13Station Locations in Arlington, Alexandria City . . . . . . . . . . . . . . . . . . . . 203
16.1 Numerical and Graphical Output of Location Analysis . . . . . . . . . . . . . . . . 207
16.2 Gen H Location . . . . . . . . . . . . . . . . . . . . . . . . . . . . . . . . . . . . . . 208
16.3 Schematic . . . . . . . . . . . . . . . . . . . . . . . . . . . . . . . . . . . . . . . . . 209
16.4 Plan View . . . . . . . . . . . . . . . . . . . . . . . . . . . . . . . . . . . . . . . . . 210
16.5 Process Flow . . . . . . . . . . . . . . . . . . . . . . . . . . . . . . . . . . . . . . . 211
16.6 Daily Demand and Bio-Gas Purchased . . . . . . . . . . . . . . . . . . . . . . . . . 212
16.7 Cascade Banks Pressure vs Time . . . . . . . . . . . . . . . . . . . . . . . . . . . . 216
16.8 Hydrogen Dispensing Simulation . . . . . . . . . . . . . . . . . . . . . . . . . . . . . 218
17.1 Sample Fault Tree of the 4 major risks . . . . . . . . . . . . . . . . . . . . . . . . . 226
19.1 Production Pathway: Above– Hydrogen, Below– Electricity . . . . . . . . . . . . . . 234
19.2 Total Carbon Dioxide Emissions . . . . . . . . . . . . . . . . . . . . . . . . . . . . . 236
20.1 H:can:2, HydroRanger . . . . . . . . . . . . . . . . . . . . . . . . . . . . . . . . . . 240
D.1 CASCADE Main Screen . . . . . . . . . . . . . . . . . . . . . . . . . . . . . . . . . 303
D.2 CASCADE Calculation Results . . . . . . . . . . . . . . . . . . . . . . . . . . . . . 303
D.3 Detailed Simulation Output Report . . . . . . . . . . . . . . . . . . . . . . . . . . . 304
D.4 Cash Flow Analysis Spreadsheet . . . . . . . . . . . . . . . . . . . . . . . . . . . . . 310

List of Figures xxvi
D.5 Marketing Budget . . . . . . . . . . . . . . . . . . . . . . . . . . . . . . . . . . . . . 311
List of Tables
2.1 Baseline Hybrid Sales Projections . . . . . . . . . . . . . . . . . . . . . . . . . . . . 14
2.2 Principal Specifications (Panasonic EV Energy Corporation, 2005 [57]) . . . . . . . 20
2.3 Prius vs. Jetta TDI (Edmund, 2005 [46]) . . . . . . . . . . . . . . . . . . . . . . . . 23
4.1 Baseline Hybrid Sales Projections . . . . . . . . . . . . . . . . . . . . . . . . . . . . 52
5.1 State HEV incentives (Hybridcar.com, 2004 [48]) . . . . . . . . . . . . . . . . . . . 56
5.2 Cell unit cost / car (Lovins, 2004 [50]), assuming a FC system cost of $5,000/kW . . 58
5.3 U.S. DOE Hydrogen Storage Targets (US DOE, 2003, [63]) . . . . . . . . . . . . . . 60
9.1 Cost Breakdown of 150 kW ACR hydrogen generator . . . . . . . . . . . . . . . . . 106
13.1 Specifications of the Yokohama-Asahi Hydrogen Station . . . . . . . . . . . . . . . . 144
13.2 Specifications of the Senju Hydrogen Station . . . . . . . . . . . . . . . . . . . . . . 146
13.3 Specifications of the Kawasaki Hydrogen Station . . . . . . . . . . . . . . . . . . . . 147
13.4 Specifications of the Sagamihara Hydrogen Station . . . . . . . . . . . . . . . . . . 149
13.5 Specifications of the Yokohama-Daikoku Hydrogen Station . . . . . . . . . . . . . . 150
13.6 Specifications of the Yokohama-Tsurumi Hydrogen Station . . . . . . . . . . . . . . 151
13.7 Specifications of the Ariake Hydrogen Station . . . . . . . . . . . . . . . . . . . . . 153
13.8 Specifications of the Ome Hydrogen Station . . . . . . . . . . . . . . . . . . . . . . 154
13.9 Specifications of the Hadano Hydrogen Station . . . . . . . . . . . . . . . . . . . . . 156
13.10Specifications of the Mobile Hydrogen Station . . . . . . . . . . . . . . . . . . . . . 157
13.11Specifications of the Liquid Hydrogen Production Facilities . . . . . . . . . . . . . . 159
13.12Definition of Periods . . . . . . . . . . . . . . . . . . . . . . . . . . . . . . . . . . . 160
13.13Construction Cost of Hydrogen Station (JPY) . . . . . . . . . . . . . . . . . . . . . 161
13.14Construction Cost of Hydrogen Station (US$) . . . . . . . . . . . . . . . . . . . . . 161
xxvii
List of Tables xxviii
13.15Comparison of Construction Cost in the US and Japan . . . . . . . . . . . . . . . . 163
13.16Construction Cost of On-site 300Nm3/h Hydrogen Station in Japan . . . . . . . . . 164
13.17Construction Cost of On-site 300Nm3/h Hydrogen Station in the US . . . . . . . . 164
13.18Construction Cost of 6 Types of Hydrogen Station in Japan . . . . . . . . . . . . . 165
13.19Adjusted Construction Cost of Hydrogen Station with Exchange Rate Factor . . . . 166
13.20The Predicted Construction Cost of Hydrogen Station from 2020 to 2060 . . . . . . 167
13.21The Number of HFCV . . . . . . . . . . . . . . . . . . . . . . . . . . . . . . . . . . 168
13.22Required number of 500Nm3 Hydrogen Supply Facilities . . . . . . . . . . . . . . . 170
14.1 Major oil companies’ infrastructure in D.C. . . . . . . . . . . . . . . . . . . . . . . . 178
15.1 Calculation of Vehicles/capita . . . . . . . . . . . . . . . . . . . . . . . . . . . . . . 190
15.2 Population density ranges represented on map below . . . . . . . . . . . . . . . . . 191
15.3 Population in different zip codes . . . . . . . . . . . . . . . . . . . . . . . . . . . . . 192
15.4 Phase II . . . . . . . . . . . . . . . . . . . . . . . . . . . . . . . . . . . . . . . . . . 200
17.1 FMEA of Top Four Failure Modes by RPN . . . . . . . . . . . . . . . . . . . . . . . 222
17.2 FMEA of Top Four Failure Modes by RPN . . . . . . . . . . . . . . . . . . . . . . . 225
18.1 Capital Equipment Costs (x $1000) . . . . . . . . . . . . . . . . . . . . . . . . . . . 228
18.2 Land and Construction Costs (x $1000) . . . . . . . . . . . . . . . . . . . . . . . . . 228
18.3 Construction Cost Spread (x $1000) . . . . . . . . . . . . . . . . . . . . . . . . . . . 228
18.4 Maintenance Costs (x $1000) . . . . . . . . . . . . . . . . . . . . . . . . . . . . . . 229
18.5 Administration Costs (x $1000) . . . . . . . . . . . . . . . . . . . . . . . . . . . . . 229
18.6 Biogas Costs . . . . . . . . . . . . . . . . . . . . . . . . . . . . . . . . . . . . . . . 230
18.7 Revenue . . . . . . . . . . . . . . . . . . . . . . . . . . . . . . . . . . . . . . . . . . 231
19.1 Carbon dioxide emissions during hydrogen production. . . . . . . . . . . . . . . . . 234
19.2 Carbon dioxide emissions during electricity production . . . . . . . . . . . . . . . . 235
D.1 Safety Codes . . . . . . . . . . . . . . . . . . . . . . . . . . . . . . . . . . . . . . . 305
D.2 Severity Rating and Consequences . . . . . . . . . . . . . . . . . . . . . . . . . . . . 305
D.3 Probability and Occurence Rating . . . . . . . . . . . . . . . . . . . . . . . . . . . . 305
D.4 Detection Rating and Ease of Detection . . . . . . . . . . . . . . . . . . . . . . . . . 305

List of Tables xxix
D.5 Severity Rating and Consequences . . . . . . . . . . . . . . . . . . . . . . . . . . . . 309
D.6 Conversion Scale between Fault Tree and FMEA OCC . . . . . . . . . . . . . . . . 309

Introduction
Due to the rising cost and diminishing supply of oil-based fuels, as well as the growing concerns
about pollution and global climate change, there has been a great deal of research on alternative
fuel technologies. One of the most promising of these new technologies is hydrogen fuel cells.
Fuel cells need only hydrogen, the most abundant element in the universe, and oxygen as fuels.
Since fuel cells use a chemical process, not a combustion process, their emissions are much lower
than conventional technologies. This makes them a promising solution to the transportation needs
of the future. Despite its future potential, hydrogen as a transportation fuel is currently faced
with a number of challenges, such as unsolved technical hurdles, the need to develop a large scale
infrastructure to supply hydrogen, and the need for substantial cost reduction.
In this report, we examine the requirements needed to manage the transition to using hydrogen
as the next generation of transportation fuel. Research in this area was conducted in four specific
areas. First, we investigated the transition to using fuel cells in passenger vehicles and the impact
that hybrid electric vehicles, a technology familiar to most people, will have on this transition.
We then discuss a potential launch pad for the hydrogen transition, heavy duty vehicles (HDVs),
paying particular attention to fuel cell transit buses. Next, we describe a specific example of
a hydrogen production facility, the Gen H Power Park. Finally, we concentrate on a plan for
creating a hydrogen infrastructure in Washington D.C. Each area of research will be discussed in
detail below.
HEV
Hybrid technology is the current innovation in motor vehicles. Since their introduction six years
ago, hybrid sales have seen remarkable growth with no sign of dissipation. To investigate a future
transition to hydrogen power, we will consider different hybrid vehicle penetration scenarios and
1
List of Tables 2
their effects on total US energy and oil consumption. We will also analyze the effect of developing
battery and diesel technologies on the hybrid and hydrogen transitions. We will consider whether a
direct path to hydrogen vehicles is more desirable than one using hybrid technology as a stepping-
stone. Vehicle emissions and their history in US legislation will be discussed, and an analysis of the
effect of the transitions on emissions will be conducted. Finally, we will explore the necessity for
government involvement to aid these transitions, and provide recommendations to most effectively
ease the hybrid and hydrogen transitions.
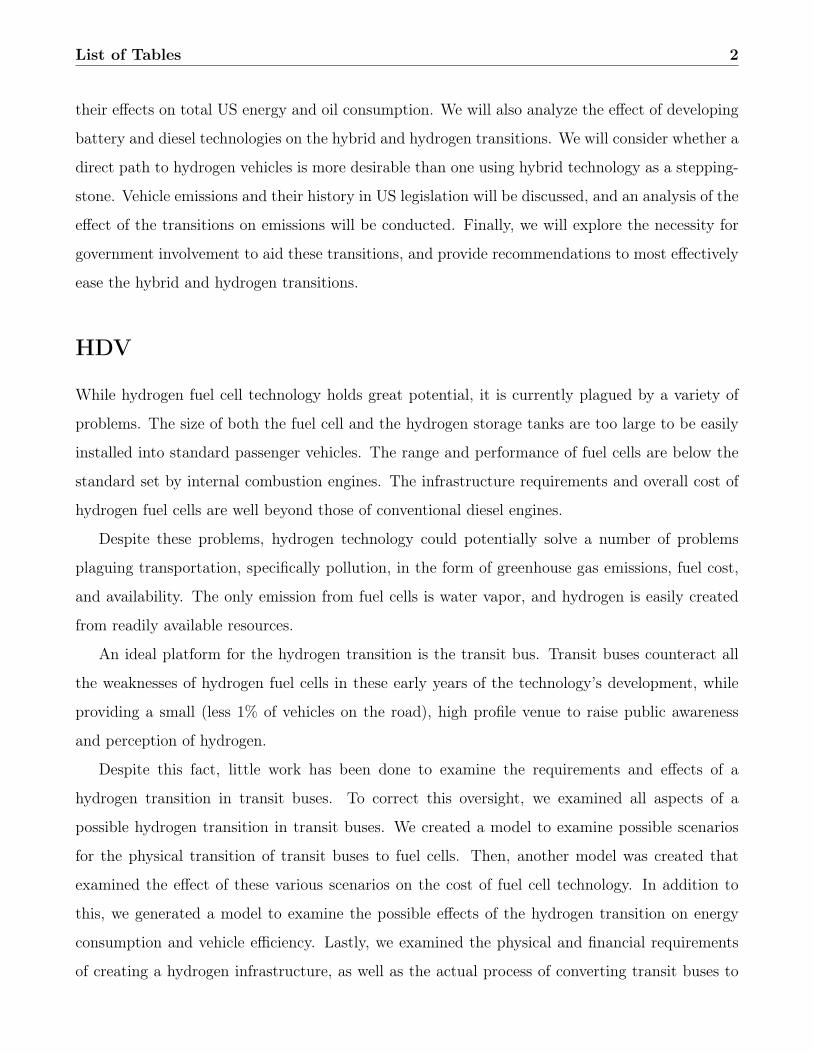
HDV
While hydrogen fuel cell technology holds great potential, it is currently plagued by a variety of
problems. The size of both the fuel cell and the hydrogen storage tanks are too large to be easily
installed into standard passenger vehicles. The range and performance of fuel cells are below the
standard set by internal combustion engines. The infrastructure requirements and overall cost of
hydrogen fuel cells are well beyond those of conventional diesel engines.
Despite these problems, hydrogen technology could potentially solve a number of problems
plaguing transportation, specifically pollution, in the form of greenhouse gas emissions, fuel cost,
and availability. The only emission from fuel cells is water vapor, and hydrogen is easily created
from readily available resources.
An ideal platform for the hydrogen transition is the transit bus. Transit buses counteract all
the weaknesses of hydrogen fuel cells in these early years of the technology’s development, while
providing a small (less 1% of vehicles on the road), high profile venue to raise public awareness
and perception of hydrogen.
Despite this fact, little work has been done to examine the requirements and effects of a
hydrogen transition in transit buses. To correct this oversight, we examined all aspects of a
possible hydrogen transition in transit buses. We created a model to examine possible scenarios
for the physical transition of transit buses to fuel cells. Then, another model was created that
examined the effect of these various scenarios on the cost of fuel cell technology. In addition to
this, we generated a model to examine the possible effects of the hydrogen transition on energy
consumption and vehicle efficiency. Lastly, we examined the physical and financial requirements
of creating a hydrogen infrastructure, as well as the actual process of converting transit buses to
List of Tables 3
use fuel cells.
Gen H Power Park Team
We designed Gen H Power Park for hydrogen production and electricity for the distributed gen-
eration market. Designed as a proposal for the National Hydrogen Association’s annual design
contest, the design of Gen H Power Park was designed according to specific requirements. The
park must produce and deliver to vehicles 50 kg/d of hydrogen in 2010 and 250 kg/d in 2020. Gen
H Power Park must also be capable to handle a peak dispensing hour at 30 kg/hour. In terms
of electricity, Gen H Power Park must deliver 100kW to the neighboring grid. The design of Gen
H Power Park includes technical design, safety analysis, environmental impact analysis, economic
and business plan, as well as marketing and education programs.
Washington D.C.
One of the greatest challenges to the hydrogen transition is the lack of infrastructure in place.
Ironically, this is a barrier to the development of both infrastructure and FCVs. If there was an
infrastructure in place, then decisions regarding the timing and location of future refueling stations
would be fairly straightforward, and easily controlled by market forces. A hydrogen company could
look at the network, determine areas of high hydrogen demand, choose a suitable location, and
place itself in competition. Without an existing infrastructure, however, it is difficult to determine
profitable areas with high hydrogen demand. This makes investing the money to build one station
a high-risk venture, let alone the investment of money to build multiple stations.
The barrier to developing FCVs is more obvious. Without a strong infrastructure in place, it
is difficult to get the public excited enough to purchase fuel cell cars. This also indirectly affects
the research put into developing such vehicles, especially if the vehicle producers are unconvinced
of hydrogen’s feasibility.
Management, therefore, is a necessity in jumpstarting the transition to a hydrogen-based trans-
portation system. Market forces alone cannot be expected to provide a swift and smooth transition,
and perhaps not enough to start the transition at all.
In the following report, we will explain in detail one method for determining a feasible network.

List of Tables 4
It is unlikely that a single company would undertake this effort alone, but the design assumes that
some authority oversees the development of the network and any companies that are involved.
This authority may be the government, or simply a consortium of companies that pledge to co-
operate. In the first section that follows, we will discuss the background information required to
develop a network, including population statistics, driver preferences, the benefits of government
involvement, and economic analysis. Next, we will outline a design algorithm, and describe the
results of this algorithm in terms of designing a network today. Finally, we will discuss performance
measures that could be used to guide the transition past the initial phase.
Part I
Hybrid Electric Vehicles
5
Chapter 1
Introduction
The need for a transition to an alternative fuel is apparent, and continually growing. US depen-
dence on foreign sources of oil threatens national security and hurts local economies. 63% of crude
oil consumed in America is imported, a quarter of which comes from the Middle East (forbes.com,
2005, eia.doe.gov, 2003 [44] [43]). As Americans buy more vehicles and drive them further, energy
consumption and oil use increase. As a result, carbon monoxide and smog emissions continue to be
problematic, despite rigorous efforts from the Environmental Protection Agency and the California
Air Resources Board. In an ideal world, vehicles would be powered by a clean, efficient fuel, where
the only byproduct of consumption is water. Such a fuel exists, and as hydrogen fuel becomes
more technologically and economically feasible, the promise of a successful hydrogen transition is
made more plausible.
The current innovation in vehicles is the advent of hybrid technology, which uses electric power
from a battery to aid the driving process, especially during low-speed and stop-and-go situations.
The results are better fuel economy and dramatically lower emissions. The popularity of HEVs
may hurt the fuel cell transition, since hybrids help decrease oil dependence and emissions levels.
To further study this possibility, our team focused on the following question: which transition
path is more desirable, a hybrid path that uses hybrid technology as a stepping-stone to fuel cell
vehicles, or a direct one that moves from standard gasoline vehicles to hydrogen-powered ones?
The criteria for answering this question were the effects of the two paths on energy consumption,
oil use, and carbon dioxide production.
The second major question the directed our research was how necessary is government involve-
6

Chapter 1. Introduction 7
ment to make the transition. To answer this question, we considered short term and long term
policies, as well as the level of need for each of them. We also investigated current initiatives for
hybrid and hydrogen transitions, assessing their effectiveness and feasibility. From our investiga-
tion, we hope to show the most effective strategy to launch a successful hydrogen transition in
light vehicles.
Chapter 2
The Hybrid Transition
2.1 HEV Technology Summary
Hybrid gasoline-electric vehicles (HEVs) consist of both the internal combustion engine found in
typical on-road vehicles and an electrical storage device, such as a battery, flywheel, or ultraca-
pacitor, for energy storage (elecdesign.com, 2003 [4]). The configuration of a hybrid can be either
series, parallel, or split. In a series configuration, the engine never directly powers the car. In-
stead, the engine drives a generator, and the generator can either charge the batteries or power an
electric motor that drives the wheels. In a parallel configuration, such as that used by the HEVs
sold today, both the engine and the batteries and electric motor connect to the transmission, so
both the engine and the electric motor can supply power to the wheels, switching back and forth as
driving conditions vary. In a split configuration, such as that used by the Chevrolet Triax concept
vehicle, the engine drives one axle and the electric motor drives the other, so there is no physical
connection between the engine and the motor (transportation.anl.gov, 2004 [6]).
8
2.1. HEV Technology Summary 9
Figure 2.1: Various configurations for a hybrid drivetrain (Altfuels.org [3])
Hybrids can be further subcategorized into mild and strong/full hybrids. Mild HEVs, such
as the Honda Insight and the Honda Civic Hybrid, cannot propel the vehicle by battery power
alone. The engine flywheel is replaced with an electric starter-generator motor or a belt-driven
starter-alternator, which allows the engine to shut off and restart rather than idle and waste fuel.
In addition to this automatic start/shutoff feature, a full hybrid, such as the Toyota Prius and the
upcoming Ford Escape Hybrid, can also run exclusively on the electric motor during low-speed
driving conditions where internal combustion engines are least efficient, further reducing both fuel
consumed and emissions. Full hybrids require a larger battery, making the cost of the overall
system more than that in a mild hybrid, but the full hybrids are also ten to fifteen percent more
2.2. HEV Penetration Scenarios 10
efficient (hydrogenforecast.com, 2004 [2]).
Much of the increased fuel efficiency of HEVs can be attributed to the additional battery and
electric motor, and to the regenerative braking system that charges the battery. Regenerative
braking works by capturing energy normally lost during braking and returning it to the onboard
battery. Approximately sixty percent of the total energy consumed in city driving is spent on
braking, and theoretically over half of this lost energy can be reclaimed by an HEV upon decel-
eration (elecdesign.com, 2003 [4]). The electric motor also provides power to assist the engine in
accelerating, passing, and hill-climbing, which allows for the use of a smaller, more efficient internal
combustion engine (fueleconomy.gov, 2004 [5]).
2.2 HEV Penetration Scenarios
2.2.1 Model Formulation
To create scenarios for hybrid vehicle penetration into the auto market, the HEV team gathered
data on total annual light vehicle sales in the US from 1980 to the present (TEDB, 2004 [9]). Using
the Holts-Winter’s Method of forecasting, the data was projected through 2100. We then found
historical data on the proportion of light truck sales and passenger vehicle sales within the light
vehicle category (TEDB, 2004 [9]). The data showed an increasing proportion of light truck sales,
overtaking passenger vehicle sales in 2003. This data was projected, reaching an asymptote of 60%
light truck sales. The resultant numbers for sales by vehicle type, shown in Figure 2.2, were then
used to begin modeling a hybrid transition.
2.2. HEV Penetration Scenarios 11
Figure 2.2: Vehicle Miles Traveled Projections
Hybrid cars first entered the U.S. market in 1999 with the Honda Insight, selling 3,788 ve-
hicles. Toyota’s introduction of the Prius the following year led to higher sales, totaling 9,350
(bankrate.com, 2004 [15]). Since then, hybrid sales growth has averaged 88.6% annually, reaching
over 43,000 units in 2003 (billingsgazette.com, 2004 [14]). Hybrid light trucks are planned to enter
the market in 2005 with the Ford Escape Hybrid. To forecast sales for the introduction of hybrid
light trucks, we analyzed hybrid passenger vehicle and standard SUV sales. From 1976 to 1979,
SUV sales increased from nearly 60,000 units to over 114,000 (TEDB, 2004 [9]). Comparing a
regression of this data to hybrid sales from 2000-2003, we see that the rates of increase are nearly
identical, as seen in Figure 2.3. From this result, we made the assumption that the first four years
of hybrid SUV sales will match this rate.
2.2. HEV Penetration Scenarios 12
Figure 2.3: Vehicle Miles Traveled Projections
We analyzed three scenarios for hybrid penetration. A pessimistic scenario models the case
where the government offers minimal incentive for consumers to buy hybrids, and the auto indus-
try makes little effort to market the vehicles. An unenthusiastic attitude from the auto industry
and government may not provide consumers with adequate knowledge about the benefits of hybrid
vehicles. These conditions would possibly result in a very slow transition, taking 80 years for full
penetration. The baseline scenario is also market-driven, requiring little government incentive.
This scenario assumes that the auto industry makes some investment into marketing the technol-
ogy, resulting in an approximately 40-year transition. The optimistic scenario is a policy-driven
one, where the government enacts vehicle standards, on either emissions or CAFE, which would
force the auto industry to phase out non-hybrid vehicles. This is analogous to the transition from
carburetors to fuel injection technology during the 1970s and 1980s (ca.auto.yahoo.com, 2004 [13]).
This transition was a result of an oil shortage in the 1970s, which led to the US government’s im-
plementation of emissions controls. The current carburetor technology could not control emissions
to meet these new standards, forcing the auto industry to adopt the more expensive fuel injec-
tion technology. If history repeats itself, the auto industry will force a transition resulting in full
penetration within the next 20 years.
To shape these hybrid market-penetration curves, we used a triangular distribution function
(mathworld.wolfram.com, 2004 [17]), using the penetration start and end dates as parameters. The
results of this analysis are the following scenarios for the transition to hybrids:
2.2. HEV Penetration Scenarios 13
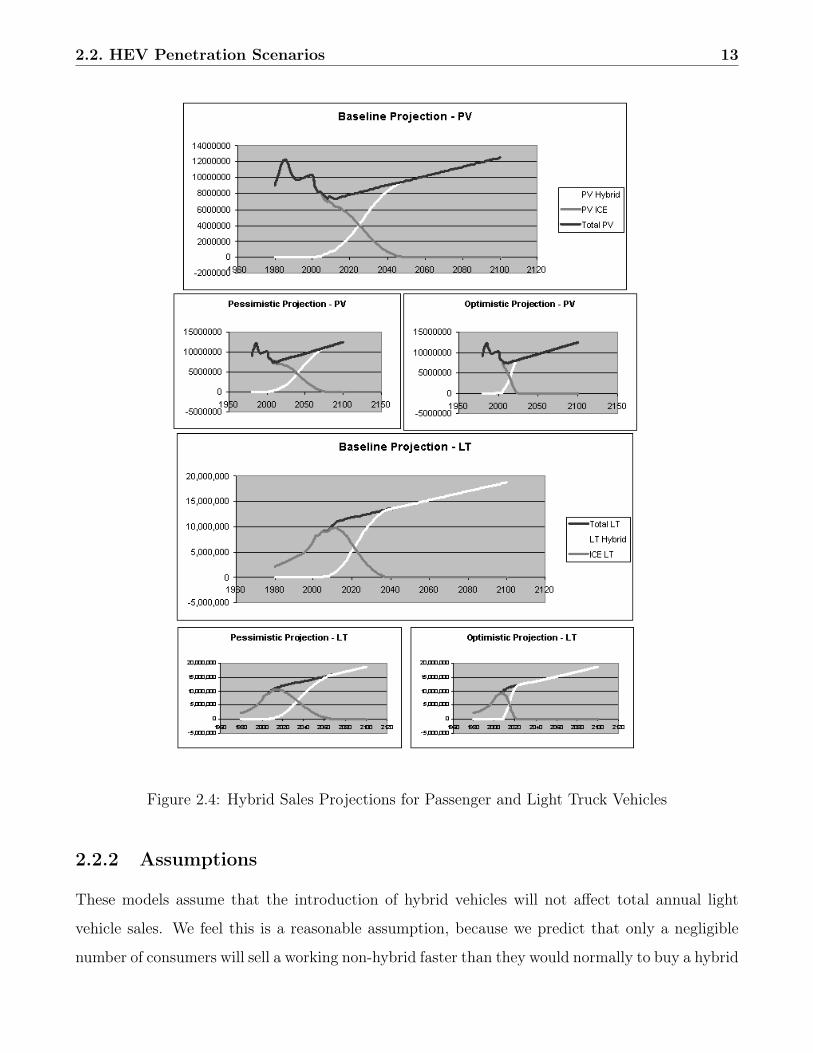
Figure 2.4: Hybrid Sales Projections for Passenger and Light Truck Vehicles
2.2.2 Assumptions
These models assume that the introduction of hybrid vehicles will not affect total annual light
vehicle sales. We feel this is a reasonable assumption, because we predict that only a negligible
number of consumers will sell a working non-hybrid faster than they would normally to buy a hybrid
2.2. HEV Penetration Scenarios 14
vehicle. We also assume that hybrid light truck sales will grow more rapidly than passenger vehicle
sales. This assumption arises from the fact that SUV buyers are generally less price sensitive than
other auto buyers, and that emissions/fuel economy standards affect SUVs the most (maritz.com,
2004 [18]).
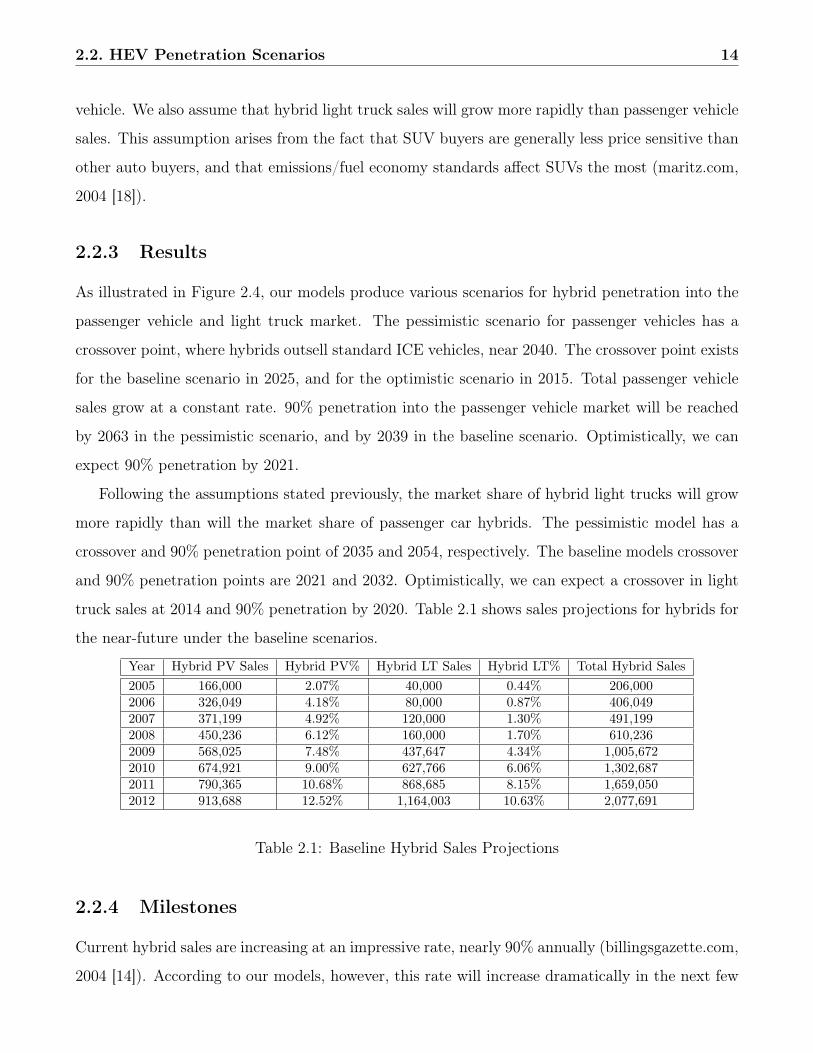
2.2.3 Results
As illustrated in Figure 2.4, our models produce various scenarios for hybrid penetration into the
passenger vehicle and light truck market. The pessimistic scenario for passenger vehicles has a
crossover point, where hybrids outsell standard ICE vehicles, near 2040. The crossover point exists
for the baseline scenario in 2025, and for the optimistic scenario in 2015. Total passenger vehicle
sales grow at a constant rate. 90% penetration into the passenger vehicle market will be reached
by 2063 in the pessimistic scenario, and by 2039 in the baseline scenario. Optimistically, we can
expect 90% penetration by 2021.
Following the assumptions stated previously, the market share of hybrid light trucks will grow
more rapidly than will the market share of passenger car hybrids. The pessimistic model has a
crossover and 90% penetration point of 2035 and 2054, respectively. The baseline models crossover
and 90% penetration points are 2021 and 2032. Optimistically, we can expect a crossover in light
truck sales at 2014 and 90% penetration by 2020. Table 2.1 shows sales projections for hybrids for
the near-future under the baseline scenarios.
Year Hybrid PV Sales Hybrid PV% Hybrid LT Sales Hybrid LT% Total Hybrid Sales2005 166,000 2.07% 40,000 0.44% 206,0002006 326,049 4.18% 80,000 0.87% 406,0492007 371,199 4.92% 120,000 1.30% 491,1992008 450,236 6.12% 160,000 1.70% 610,2362009 568,025 7.48% 437,647 4.34% 1,005,6722010 674,921 9.00% 627,766 6.06% 1,302,6872011 790,365 10.68% 868,685 8.15% 1,659,0502012 913,688 12.52% 1,164,003 10.63% 2,077,691
Table 2.1: Baseline Hybrid Sales Projections
2.2.4 Milestones
Current hybrid sales are increasing at an impressive rate, nearly 90% annually (billingsgazette.com,
2004 [14]). According to our models, however, this rate will increase dramatically in the next few
2.2. HEV Penetration Scenarios 15
years. For this to happen, several milestones are probable. In October, 2004, Gov. Schwarzenegger
of California passed a bill to reduce emissions from all vehicles by 25% (seattlepi.nwsource.com,
2004 [19]). California gave the auto industry until 2009 to develop new emissions controls and
until 2016 to introduce vehicles with the new technology, aggravating automakers. The industry
trade group, Alliance of Automobile Manufacturers, has stated that such implementation would be
“almost as complicated as developing the first automobile,” and estimated an average price increase
of $3000 (seattlepi.nwsource.com, 2004 [19]). California stands as a unique state to challenge
the industry. Representing ten percent of the auto market, California is the only state allowed
to create its own emissions legislation, since the state government began controlling emissions
before the federal government. Other states have the option of adopting Californias emissions
standards over the federal governments, something that seven states, over twenty-five percent of the
vehicle market, have done (knowledge.fhwa.dot.gov, 2003 [21]). In December 2004, the Alliance of
Automobile Manufacturers sued the California government in an effort to block the new standards
(philly.com, 2004 [20]). If this attempt fails, the industry will be forced to introduce vehicles with
lower emissions. Hybrids, which cut smog-forming pollutants by 90% and CO2 emissions in half,
are the best option for the industry to meet this requirement quickly (deq.state.id.us, 2004 [22]).
Along with increased emissions controls, rising gas prices will continue to influence consumer’s
buying habits, leading them towards more fuel efficient cars. The shift has already begun; vehicle
requests in the second quarter of 2004 have dramatically sided in favor of smaller, efficient cars
(autobytel.com, 2004 [23]). In fact, requests for Toyotas hybrid, the Prius, have increased by 41%.
If these trends in gas prices continue, consumer habit trends will follow, placing a demand on the
auto industry for hybrids.
As hybrid technology becomes more established, costs will invariably fall. With falling costs
and increased competition with other hybrid manufacturers, the price premium for hybrid cars will
decrease. This price reduction will result in further demand for hybrids. One can also speculate
that as hybrids enter the mainstream and become commonplace, cultural stigmas against non-
hybrids may arise. If better economy and lower emissions can be purchased with minimal effect
on performance, people may question why some consumers continue to purchase non-hybrids.
Whether this stigma occurs or not, there is enough evidence today that suggests a large increase
in demand for hybrids in the near future. As our models show, different magnitudes of this demand
will result in different penetration curves. These scenarios have different effects on total energy
2.3. Battery Technology Overview / Projections 16
use and oil consumption, as we will illustrate in later chapters.
2.3 Battery Technology Overview / Projections
2.3.1 Introduction
The battery for a hybrid electric vehicle, used in conjunction with an electric motor, serves mainly
as a secondary power source to the drivetrain. Imperfection in the current battery technology,
however, poses a major barrier in producing both high performance and cost-effective HEVs that
could fully compete with conventional automobiles. In this section we will first investigate the
current battery technology in terms of cost and performance then project how the technology
would evolve over time.
2.3.2 Battery Types
There are over twenty unique types of batteries on the market with hundreds of variations. In
particular there are three types of batteries that are closely related to this research: lead-acid
batteries, nickel-metal hydride battery, and lithium-ion battery.
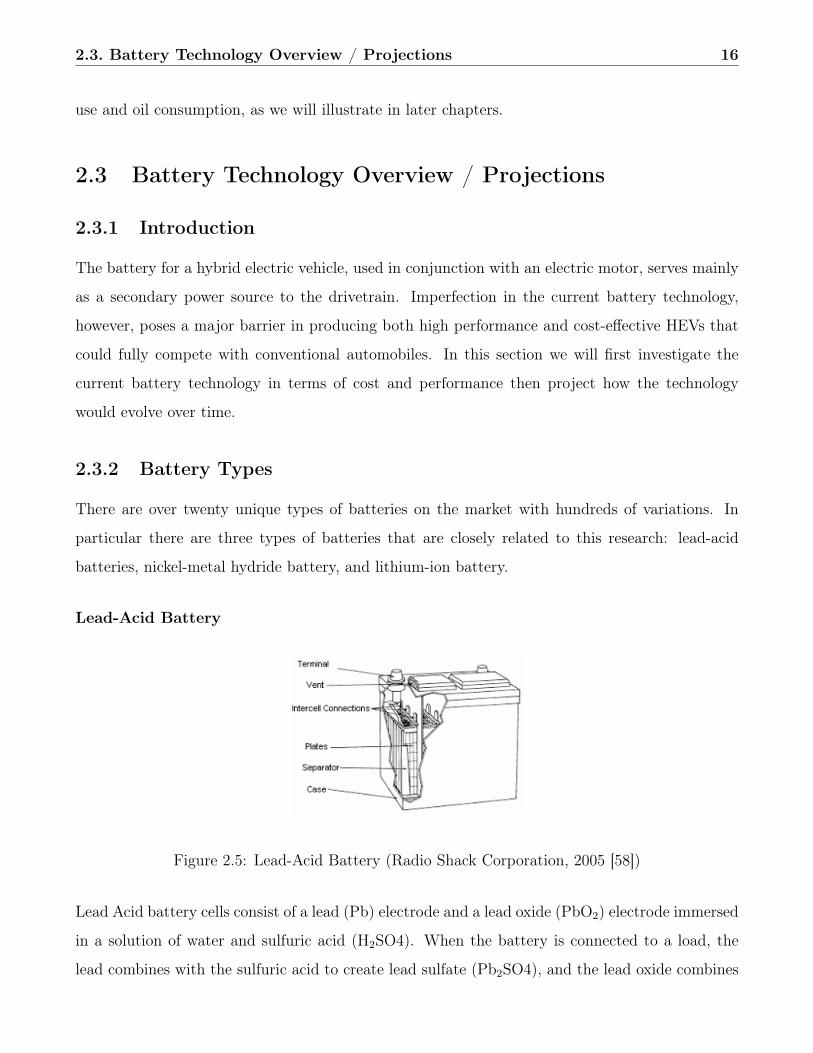
Lead-Acid Battery
Figure 2.5: Lead-Acid Battery (Radio Shack Corporation, 2005 [58])
Lead Acid battery cells consist of a lead (Pb) electrode and a lead oxide (PbO2) electrode immersed
in a solution of water and sulfuric acid (H2SO4). When the battery is connected to a load, the
lead combines with the sulfuric acid to create lead sulfate (Pb2SO4), and the lead oxide combines
2.3. Battery Technology Overview / Projections 17
with hydrogen and sulfuric acid to create lead sulfate and water (H2O). As the battery discharges,
the lead sulfate builds up on the electrodes, and the water builds up in the sulfuric acid solution.
When the battery is charged, the process reverses, with the lead sulfate combining with water to
build up lead and lead oxide on the electrodes (Radio Shack Corporation, 2005 [58]).
Lead-acid batteries can be found in most of today’s conventional internal combustion engine
vehicles in which battery power is critical only during engine startups. During engine startup,
lead-acid batteries are designed to provide strong current for a jump start. After a car is started,
its generator takes over from the battery to provide electricity for the entire electrical system.
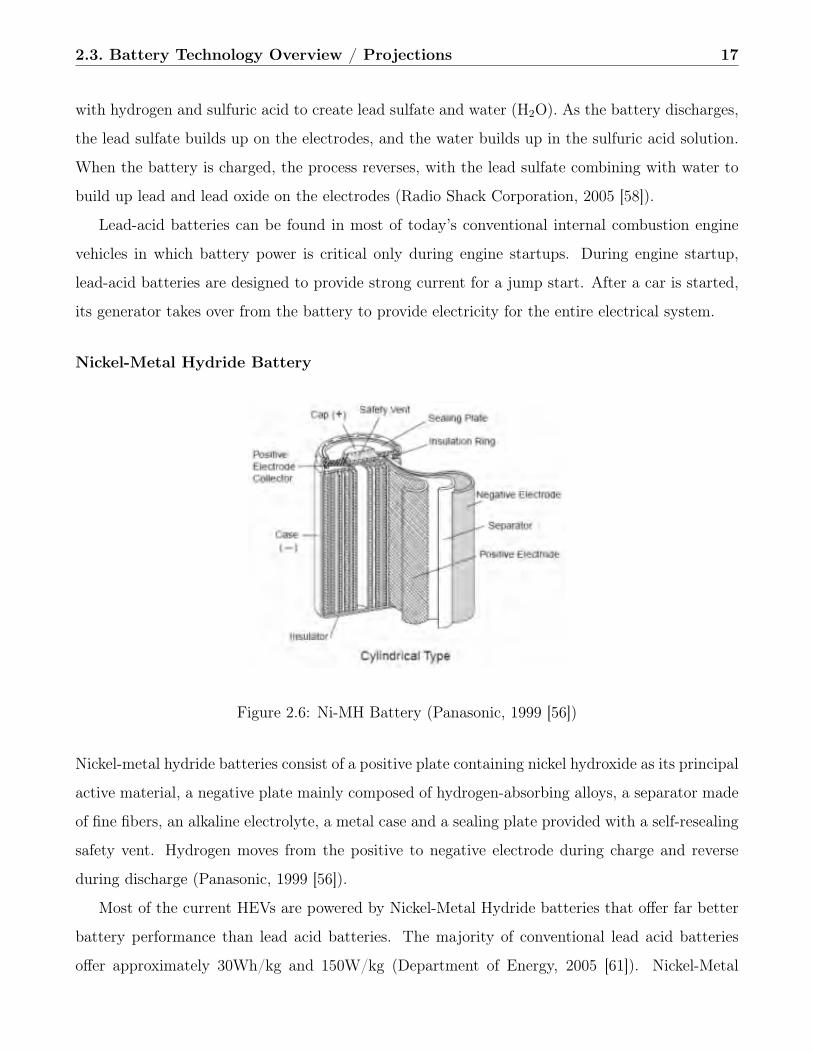
Nickel-Metal Hydride Battery
Figure 2.6: Ni-MH Battery (Panasonic, 1999 [56])
Nickel-metal hydride batteries consist of a positive plate containing nickel hydroxide as its principal
active material, a negative plate mainly composed of hydrogen-absorbing alloys, a separator made
of fine fibers, an alkaline electrolyte, a metal case and a sealing plate provided with a self-resealing
safety vent. Hydrogen moves from the positive to negative electrode during charge and reverse
during discharge (Panasonic, 1999 [56]).
Most of the current HEVs are powered by Nickel-Metal Hydride batteries that offer far better
battery performance than lead acid batteries. The majority of conventional lead acid batteries
offer approximately 30Wh/kg and 150W/kg (Department of Energy, 2005 [61]). Nickel-Metal
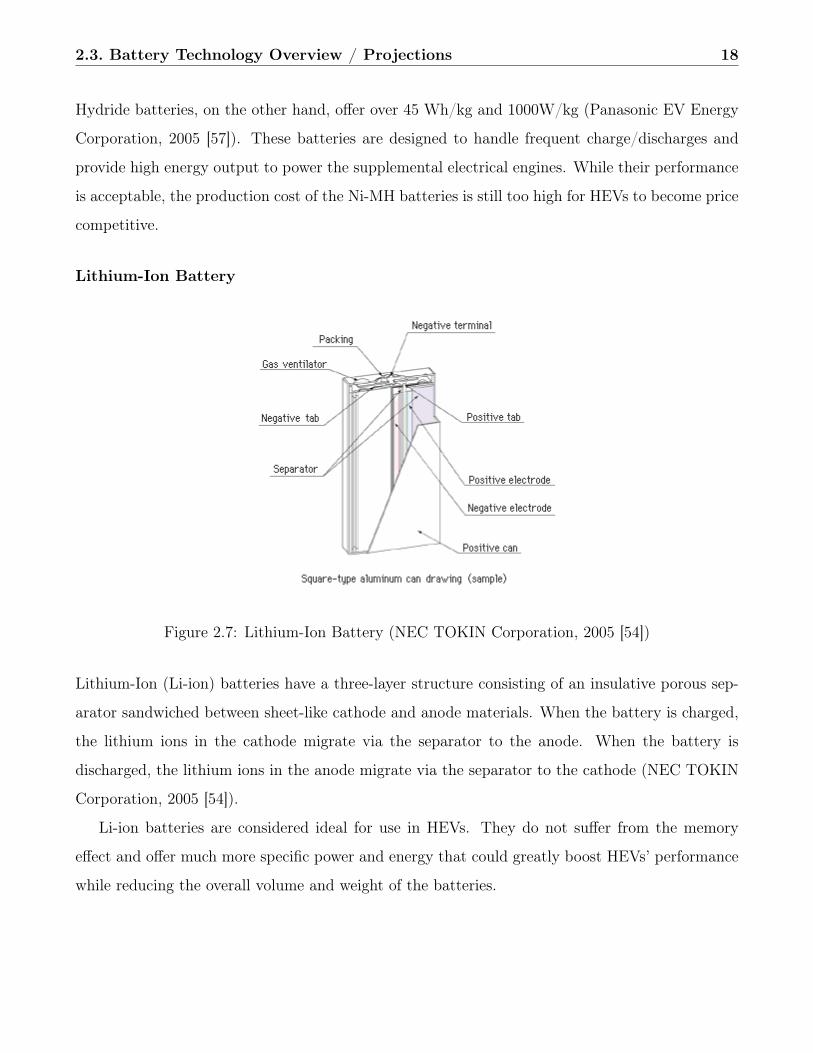
2.3. Battery Technology Overview / Projections 18
Hydride batteries, on the other hand, offer over 45 Wh/kg and 1000W/kg (Panasonic EV Energy
Corporation, 2005 [57]). These batteries are designed to handle frequent charge/discharges and
provide high energy output to power the supplemental electrical engines. While their performance
is acceptable, the production cost of the Ni-MH batteries is still too high for HEVs to become price
competitive.
Lithium-Ion Battery
Figure 2.7: Lithium-Ion Battery (NEC TOKIN Corporation, 2005 [54])
Lithium-Ion (Li-ion) batteries have a three-layer structure consisting of an insulative porous sep-
arator sandwiched between sheet-like cathode and anode materials. When the battery is charged,
the lithium ions in the cathode migrate via the separator to the anode. When the battery is
discharged, the lithium ions in the anode migrate via the separator to the cathode (NEC TOKIN
Corporation, 2005 [54]).
Li-ion batteries are considered ideal for use in HEVs. They do not suffer from the memory
effect and offer much more specific power and energy that could greatly boost HEVs’ performance
while reducing the overall volume and weight of the batteries.
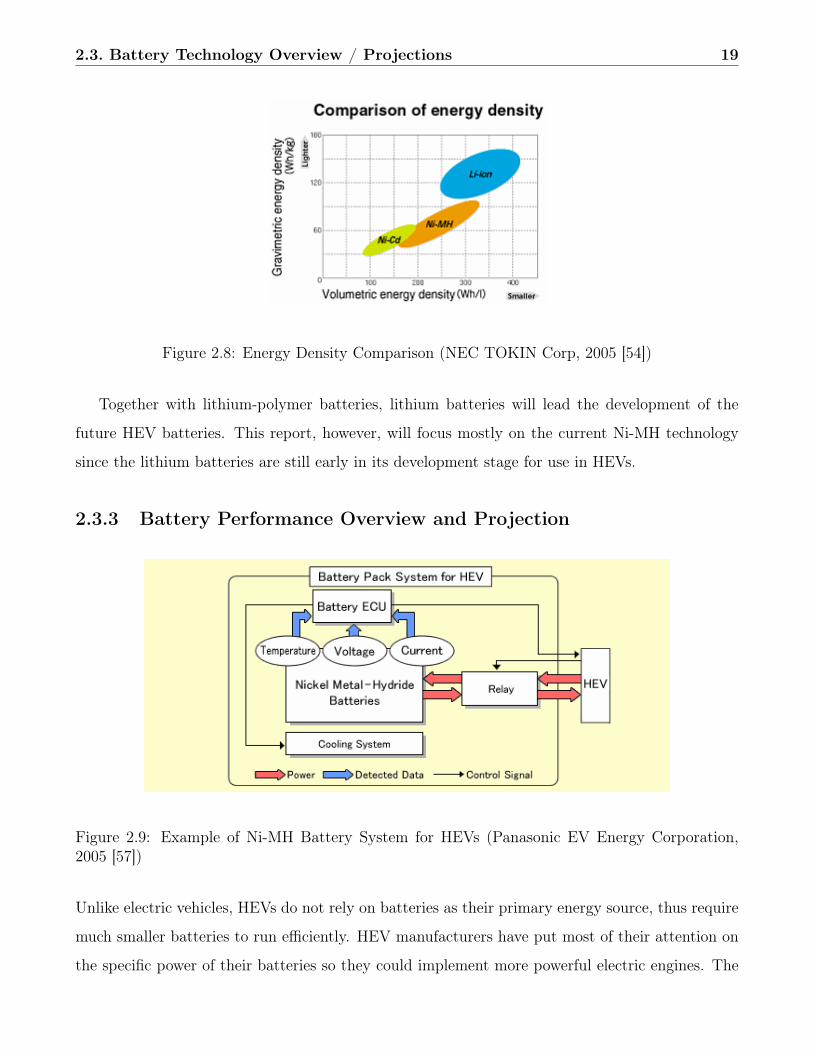
2.3. Battery Technology Overview / Projections 19
Figure 2.8: Energy Density Comparison (NEC TOKIN Corp, 2005 [54])
Together with lithium-polymer batteries, lithium batteries will lead the development of the
future HEV batteries. This report, however, will focus mostly on the current Ni-MH technology
since the lithium batteries are still early in its development stage for use in HEVs.
2.3.3 Battery Performance Overview and Projection
Figure 2.9: Example of Ni-MH Battery System for HEVs (Panasonic EV Energy Corporation,2005 [57])
Unlike electric vehicles, HEVs do not rely on batteries as their primary energy source, thus require
much smaller batteries to run efficiently. HEV manufacturers have put most of their attention on
the specific power of their batteries so they could implement more powerful electric engines. The
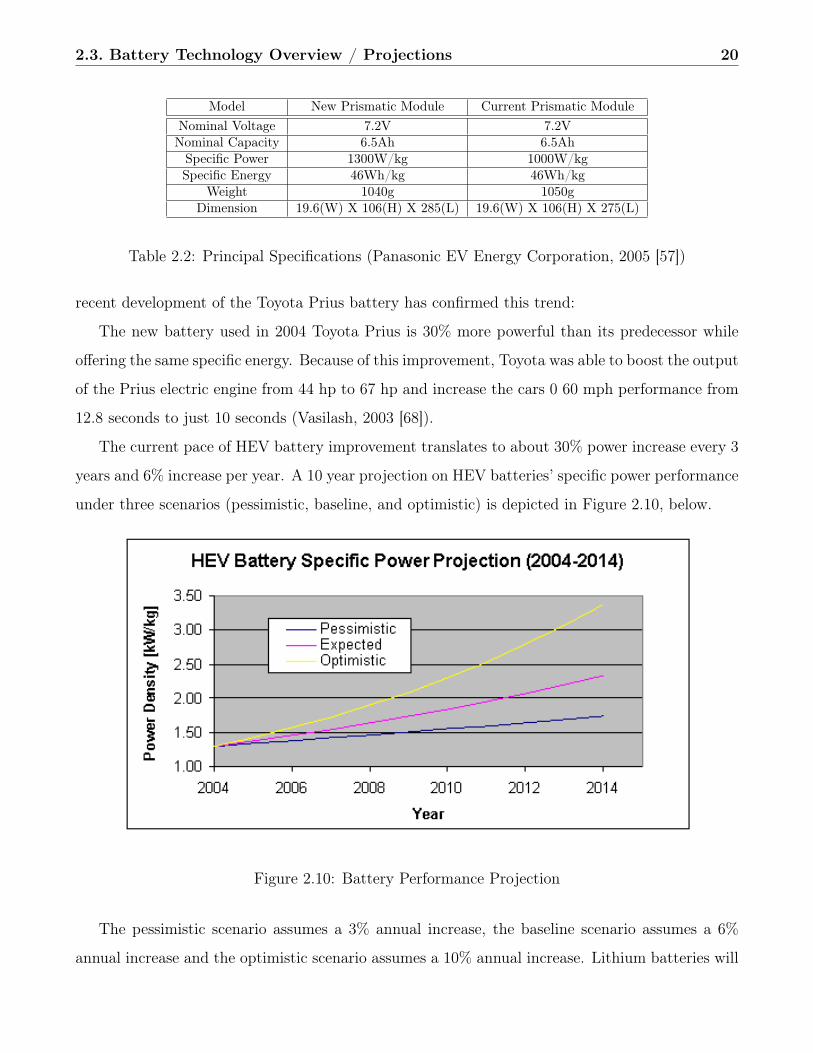
2.3. Battery Technology Overview / Projections 20
Model New Prismatic Module Current Prismatic ModuleNominal Voltage 7.2V 7.2VNominal Capacity 6.5Ah 6.5Ah
Specific Power 1300W/kg 1000W/kgSpecific Energy 46Wh/kg 46Wh/kg
Weight 1040g 1050gDimension 19.6(W) X 106(H) X 285(L) 19.6(W) X 106(H) X 275(L)
Table 2.2: Principal Specifications (Panasonic EV Energy Corporation, 2005 [57])
recent development of the Toyota Prius battery has confirmed this trend:
The new battery used in 2004 Toyota Prius is 30% more powerful than its predecessor while
offering the same specific energy. Because of this improvement, Toyota was able to boost the output
of the Prius electric engine from 44 hp to 67 hp and increase the cars 0 60 mph performance from
12.8 seconds to just 10 seconds (Vasilash, 2003 [68]).
The current pace of HEV battery improvement translates to about 30% power increase every 3
years and 6% increase per year. A 10 year projection on HEV batteries’ specific power performance
under three scenarios (pessimistic, baseline, and optimistic) is depicted in Figure 2.10, below.
Figure 2.10: Battery Performance Projection
The pessimistic scenario assumes a 3% annual increase, the baseline scenario assumes a 6%
annual increase and the optimistic scenario assumes a 10% annual increase. Lithium batteries will
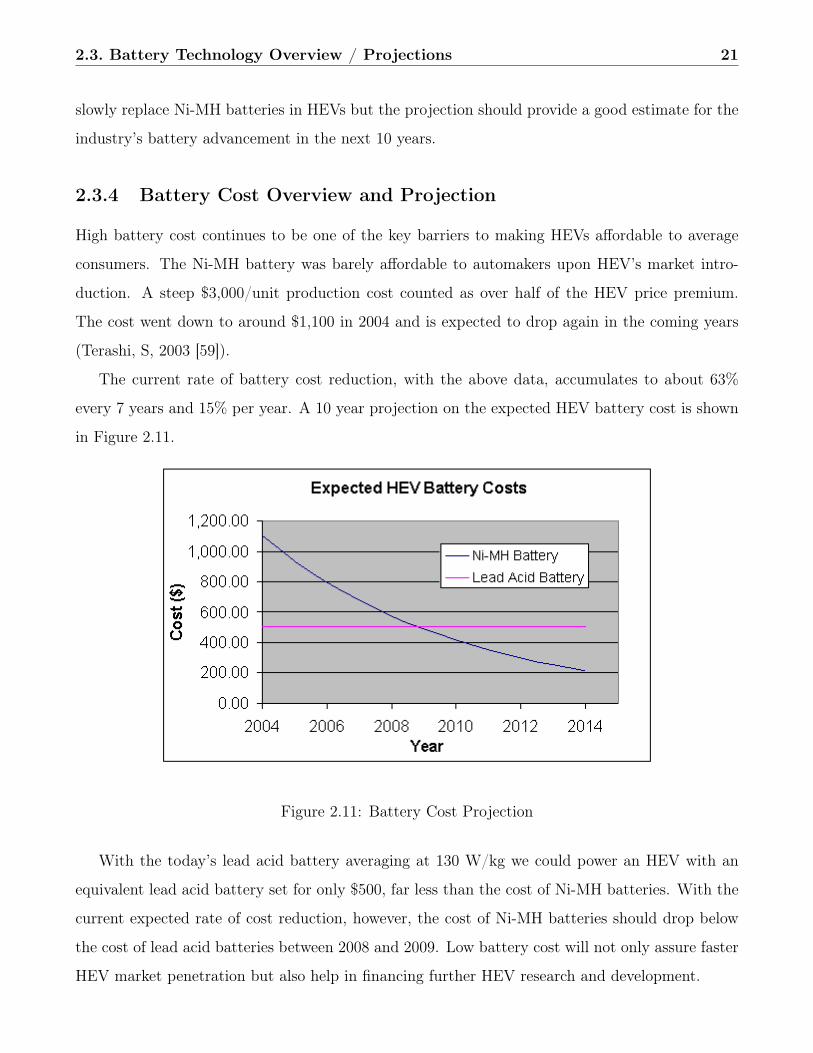
2.3. Battery Technology Overview / Projections 21
slowly replace Ni-MH batteries in HEVs but the projection should provide a good estimate for the
industry’s battery advancement in the next 10 years.
2.3.4 Battery Cost Overview and Projection
High battery cost continues to be one of the key barriers to making HEVs affordable to average
consumers. The Ni-MH battery was barely affordable to automakers upon HEV’s market intro-
duction. A steep $3,000/unit production cost counted as over half of the HEV price premium.
The cost went down to around $1,100 in 2004 and is expected to drop again in the coming years
(Terashi, S, 2003 [59]).
The current rate of battery cost reduction, with the above data, accumulates to about 63%
every 7 years and 15% per year. A 10 year projection on the expected HEV battery cost is shown
in Figure 2.11.
Figure 2.11: Battery Cost Projection
With the today’s lead acid battery averaging at 130 W/kg we could power an HEV with an
equivalent lead acid battery set for only $500, far less than the cost of Ni-MH batteries. With the
current expected rate of cost reduction, however, the cost of Ni-MH batteries should drop below
the cost of lead acid batteries between 2008 and 2009. Low battery cost will not only assure faster
HEV market penetration but also help in financing further HEV research and development.
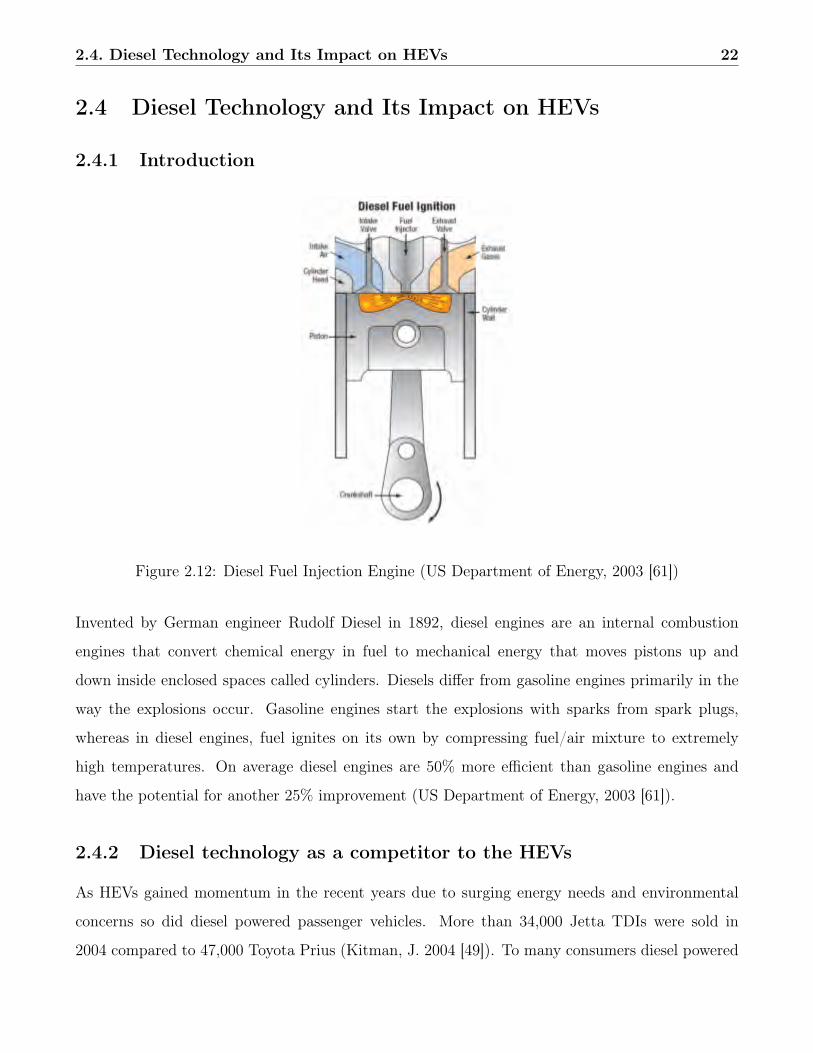
2.4. Diesel Technology and Its Impact on HEVs 22
2.4 Diesel Technology and Its Impact on HEVs
2.4.1 Introduction
Figure 2.12: Diesel Fuel Injection Engine (US Department of Energy, 2003 [61])
Invented by German engineer Rudolf Diesel in 1892, diesel engines are an internal combustion
engines that convert chemical energy in fuel to mechanical energy that moves pistons up and
down inside enclosed spaces called cylinders. Diesels differ from gasoline engines primarily in the
way the explosions occur. Gasoline engines start the explosions with sparks from spark plugs,
whereas in diesel engines, fuel ignites on its own by compressing fuel/air mixture to extremely
high temperatures. On average diesel engines are 50% more efficient than gasoline engines and
have the potential for another 25% improvement (US Department of Energy, 2003 [61]).
2.4.2 Diesel technology as a competitor to the HEVs
As HEVs gained momentum in the recent years due to surging energy needs and environmental
concerns so did diesel powered passenger vehicles. More than 34,000 Jetta TDIs were sold in
2004 compared to 47,000 Toyota Prius (Kitman, J. 2004 [49]). To many consumers diesel powered
2.4. Diesel Technology and Its Impact on HEVs 23
vehicles have been nice alternatives to HEVs because of their closely matched price, performance
and gas efficiency.
2005 Toyota Prius 2005 VW Jetta TDIMSRP ($) 20,875 21,815
Horse Power 110 100Torque (ft-lbs) 82 117
City EPG 60 32Highway EPG 51 430-60 mph (s) 10.7 11.7
Table 2.3: Prius vs. Jetta TDI (Edmund, 2005 [46])
As we can see from the table the newest generation of Toyota Prius holds a clear performance
advantage over Jetta TDI at a comparable price level. On top of its lack of efficiency, the Jetta
TDI emits roughly twenty times more nitrous oxide, almost three times more hydrocarbons, and
twice as much carbon monoxide, even though it is clean by historic diesel standards (Kitman, J.
2004 [49]). As HEVs becomes more and more efficient and environmental friendly, the future of
the diesel passenger vehicles as alternatives to the HEVs holds uncertain.
2.4.3 Diesel technology as a compliment to the HEVs
Even though cars that rely solely on diesel engines may never be as efficient as the hybrids the
diesel technology could bring fresh improvement to HEVs because of the diesel engine’s higher
efficiency compared to gasoline engines. Toyota, for example, has been considering the use of
diesel engines in its new line of hybrid SUVs that could further improve gas efficiency and reduce
emissions by approximately 17 percent (Hofmann, 2004 [47]).
The main long term benefit of using diesel powered HEVs lies in biodiesel fuel. Biodiesel is a
clean burning alternative fuel, produced from domestic, renewable resources. Biodiesel contains
no petroleum, but it can be blended at any level with petroleum diesel to create a biodiesel blend.
It is simple to use, biodegradable, nontoxic, and essentially free of sulfur and aromatics (National
Biodiesel Board, 2005 [53]).
Diesel technology is more likely to be used as a compliment, rather than an alternative to the
hybrids, and the use of Biodiesel fuel could be the most effective way of reducing oil consumption
in the very near future.
Chapter 3
FC Transition and Effects on Energy Use
3.1 Assumptions
3.1.1 FC Transition TimeframeTo model the fuel cell transition, we used the introduction and full penetration dates determinedby the 2003-2004 Cornell Engineering Management Hydrogen Team. From their analysis, theyexpect a 40-year transition, beginning as early as 2020 (Managing Hydrogen, 2004 [24]). PresidentBush’s Hydrogen Initiative plans for a transition launch date of 2020, nearing complete transitionaround 2040 (Hydrogen Energy Transition, 2004 [25]). One of our team’s overriding directives wasto decide whether a direct path to fuel cell vehicles was more desirable than a path using hybridsas a transition technology. To address this question, we needed fuel cell transition scenarios forboth paths. Many sources view the President’s scenario as overly optimistic (Hydrogen EnergyTransition, 2004 [25]). More realistically, a fuel cell transition beginning in 2020 will take 40 yearsto complete. We decided to use this scenario to map our direct path transition, as seen in Figure3.1.
24
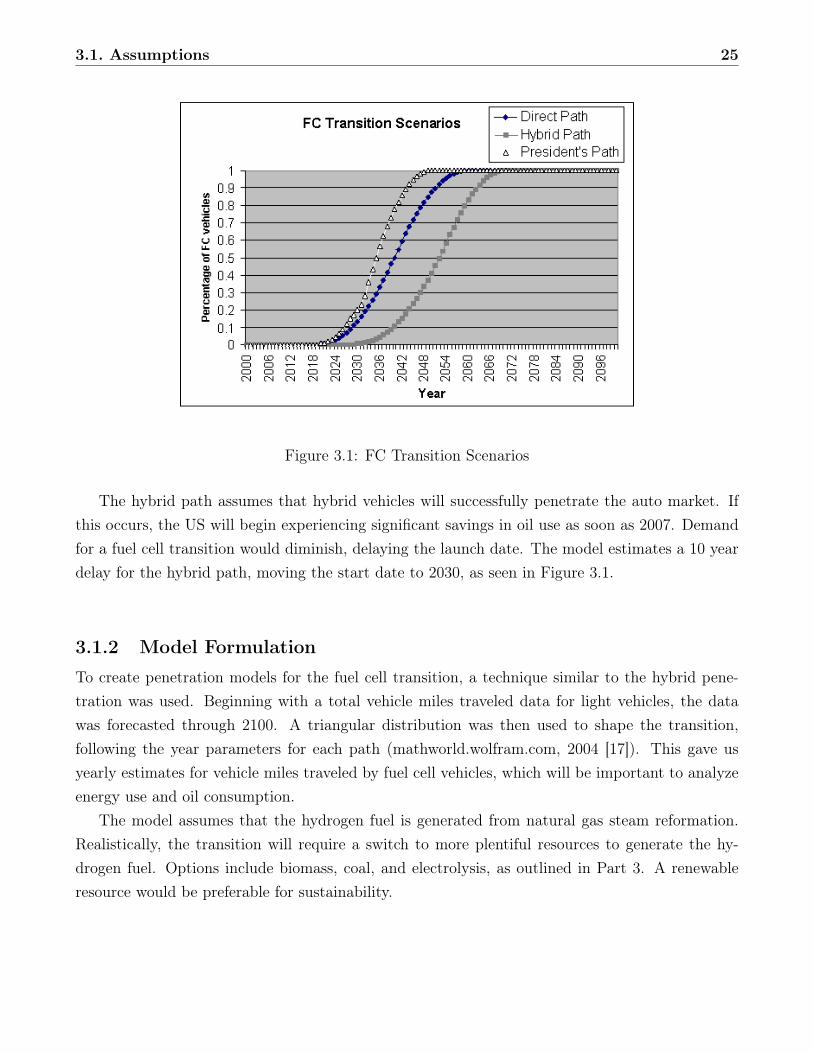
3.1. Assumptions 25
Figure 3.1: FC Transition Scenarios
The hybrid path assumes that hybrid vehicles will successfully penetrate the auto market. Ifthis occurs, the US will begin experiencing significant savings in oil use as soon as 2007. Demandfor a fuel cell transition would diminish, delaying the launch date. The model estimates a 10 yeardelay for the hybrid path, moving the start date to 2030, as seen in Figure 3.1.
3.1.2 Model FormulationTo create penetration models for the fuel cell transition, a technique similar to the hybrid pene-tration was used. Beginning with a total vehicle miles traveled data for light vehicles, the datawas forecasted through 2100. A triangular distribution was then used to shape the transition,following the year parameters for each path (mathworld.wolfram.com, 2004 [17]). This gave usyearly estimates for vehicle miles traveled by fuel cell vehicles, which will be important to analyzeenergy use and oil consumption.
The model assumes that the hydrogen fuel is generated from natural gas steam reformation.Realistically, the transition will require a switch to more plentiful resources to generate the hy-drogen fuel. Options include biomass, coal, and electrolysis, as outlined in Part 3. A renewableresource would be preferable for sustainability.
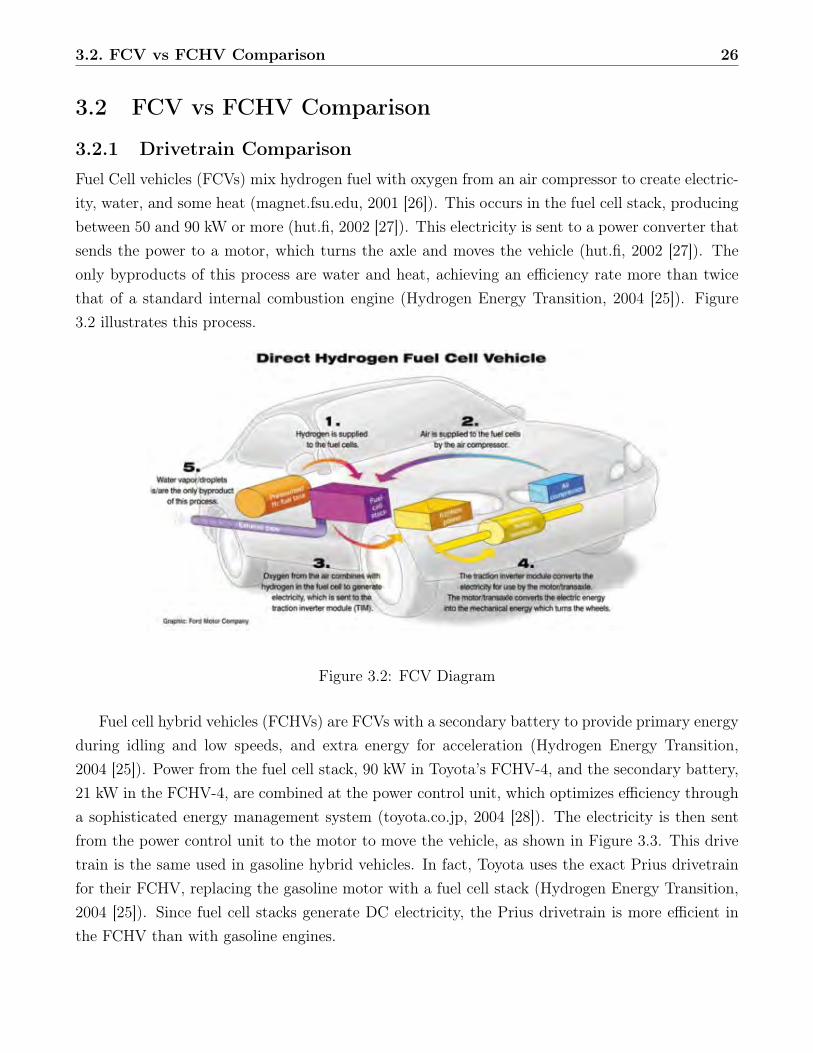
3.2. FCV vs FCHV Comparison 26
3.2 FCV vs FCHV Comparison
3.2.1 Drivetrain ComparisonFuel Cell vehicles (FCVs) mix hydrogen fuel with oxygen from an air compressor to create electric-ity, water, and some heat (magnet.fsu.edu, 2001 [26]). This occurs in the fuel cell stack, producingbetween 50 and 90 kW or more (hut.fi, 2002 [27]). This electricity is sent to a power converter thatsends the power to a motor, which turns the axle and moves the vehicle (hut.fi, 2002 [27]). Theonly byproducts of this process are water and heat, achieving an efficiency rate more than twicethat of a standard internal combustion engine (Hydrogen Energy Transition, 2004 [25]). Figure3.2 illustrates this process.
Figure 3.2: FCV Diagram
Fuel cell hybrid vehicles (FCHVs) are FCVs with a secondary battery to provide primary energyduring idling and low speeds, and extra energy for acceleration (Hydrogen Energy Transition,2004 [25]). Power from the fuel cell stack, 90 kW in Toyota’s FCHV-4, and the secondary battery,21 kW in the FCHV-4, are combined at the power control unit, which optimizes efficiency througha sophisticated energy management system (toyota.co.jp, 2004 [28]). The electricity is then sentfrom the power control unit to the motor to move the vehicle, as shown in Figure 3.3. This drivetrain is the same used in gasoline hybrid vehicles. In fact, Toyota uses the exact Prius drivetrainfor their FCHV, replacing the gasoline motor with a fuel cell stack (Hydrogen Energy Transition,2004 [25]). Since fuel cell stacks generate DC electricity, the Prius drivetrain is more efficient inthe FCHV than with gasoline engines.
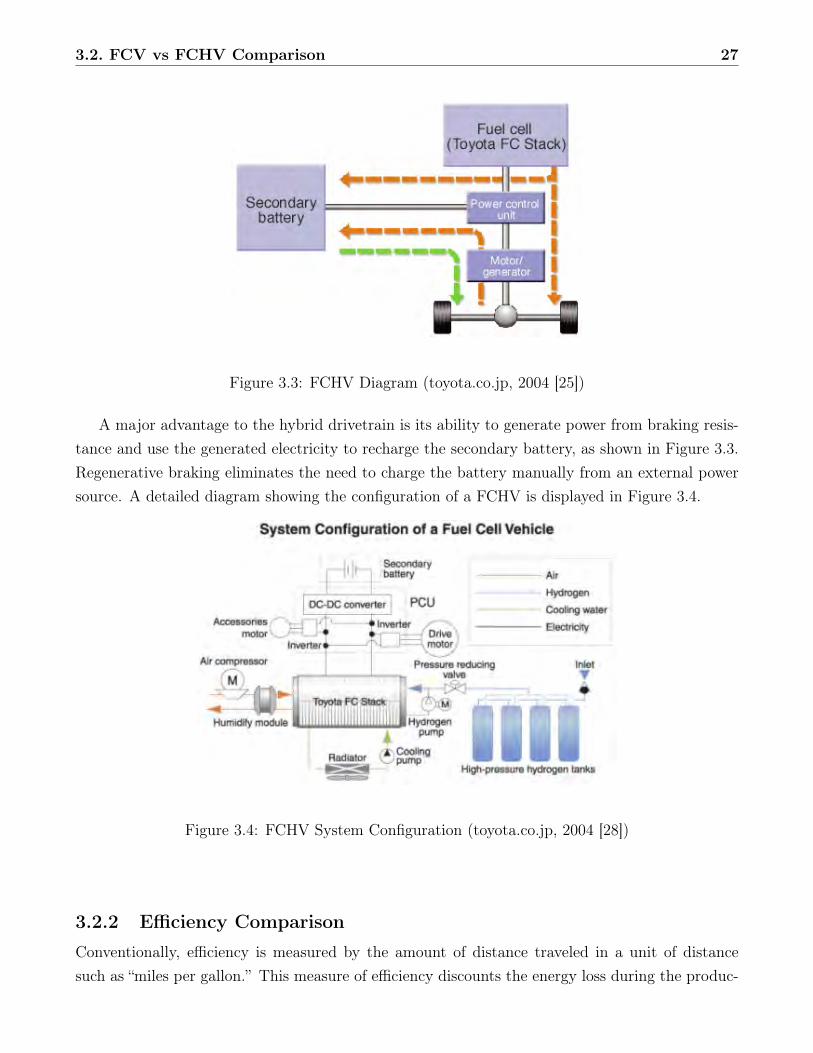
3.2. FCV vs FCHV Comparison 27
Figure 3.3: FCHV Diagram (toyota.co.jp, 2004 [25])
A major advantage to the hybrid drivetrain is its ability to generate power from braking resis-tance and use the generated electricity to recharge the secondary battery, as shown in Figure 3.3.Regenerative braking eliminates the need to charge the battery manually from an external powersource. A detailed diagram showing the configuration of a FCHV is displayed in Figure 3.4.
Figure 3.4: FCHV System Configuration (toyota.co.jp, 2004 [28])
3.2.2 Efficiency ComparisonConventionally, efficiency is measured by the amount of distance traveled in a unit of distancesuch as “miles per gallon.” This measure of efficiency discounts the energy loss during the produc-
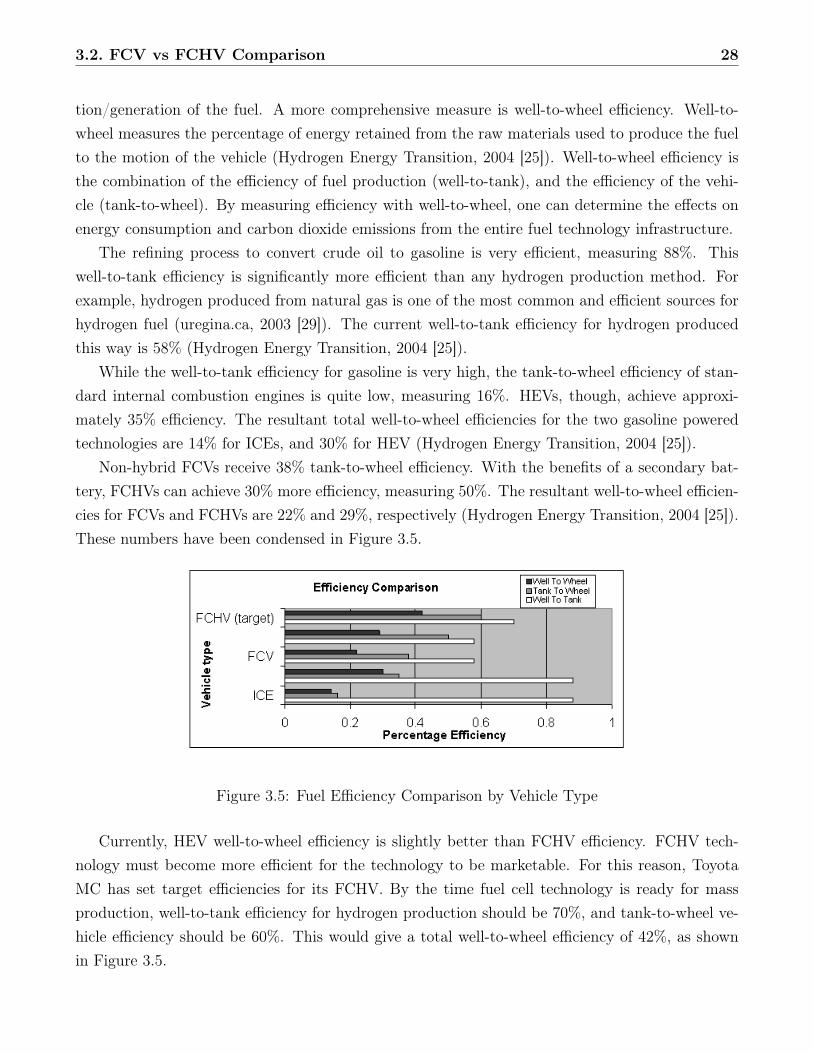
3.2. FCV vs FCHV Comparison 28
tion/generation of the fuel. A more comprehensive measure is well-to-wheel efficiency. Well-to-wheel measures the percentage of energy retained from the raw materials used to produce the fuelto the motion of the vehicle (Hydrogen Energy Transition, 2004 [25]). Well-to-wheel efficiency isthe combination of the efficiency of fuel production (well-to-tank), and the efficiency of the vehi-cle (tank-to-wheel). By measuring efficiency with well-to-wheel, one can determine the effects onenergy consumption and carbon dioxide emissions from the entire fuel technology infrastructure.
The refining process to convert crude oil to gasoline is very efficient, measuring 88%. Thiswell-to-tank efficiency is significantly more efficient than any hydrogen production method. Forexample, hydrogen produced from natural gas is one of the most common and efficient sources forhydrogen fuel (uregina.ca, 2003 [29]). The current well-to-tank efficiency for hydrogen producedthis way is 58% (Hydrogen Energy Transition, 2004 [25]).
While the well-to-tank efficiency for gasoline is very high, the tank-to-wheel efficiency of stan-dard internal combustion engines is quite low, measuring 16%. HEVs, though, achieve approxi-mately 35% efficiency. The resultant total well-to-wheel efficiencies for the two gasoline poweredtechnologies are 14% for ICEs, and 30% for HEV (Hydrogen Energy Transition, 2004 [25]).
Non-hybrid FCVs receive 38% tank-to-wheel efficiency. With the benefits of a secondary bat-tery, FCHVs can achieve 30% more efficiency, measuring 50%. The resultant well-to-wheel efficien-cies for FCVs and FCHVs are 22% and 29%, respectively (Hydrogen Energy Transition, 2004 [25]).These numbers have been condensed in Figure 3.5.
Figure 3.5: Fuel Efficiency Comparison by Vehicle Type
Currently, HEV well-to-wheel efficiency is slightly better than FCHV efficiency. FCHV tech-nology must become more efficient for the technology to be marketable. For this reason, ToyotaMC has set target efficiencies for its FCHV. By the time fuel cell technology is ready for massproduction, well-to-tank efficiency for hydrogen production should be 70%, and tank-to-wheel ve-hicle efficiency should be 60%. This would give a total well-to-wheel efficiency of 42%, as shownin Figure 3.5.
3.2. FCV vs FCHV Comparison 29
3.2.3 ConclusionFCV is the endpoint technology for the direct path scenario for a fuel cell transition, while FCHVis the endpoint for the hybrid path. To help determine which path is the most viable, we mustcompare their endpoints.
FCVs are simpler, requiring relatively less sophisticated components. FCVs do not need thecomplex power control units that FCHVs do. They require no expensive secondary battery, andif hydrogen production efficiency reaches Toyotas target of 70%, then FCVs will have nearly 30%efficiency. One should be careful to note that the technological difference between FCVs andFCHVs is not large, when kept in the larger perspective of the transition, but significant enoughto mention.
FCHVs may require more expensive components, but as battery technology progresses, thecosts are sure to decline. Furthermore, the benefits to efficiency, which translate to savings inenergy consumption and carbon dioxide emissions, add value to FCHVs. FCHV technology canalso have lower transition costs, since FCHVs share a drivetrain with HEVs. Toyota uses the eFCVis the endpoint technology for the direct path scenario for a fuel cell transition, while FCHV is theendpoint for the hybrid path. To help determine which path is the most viable, we must comparetheir endpoints.
FCVs are simpler, requiring relatively less sophisticated components. FCVs do not need thecomplex power control units that FCHVs do. They require no expensive secondary battery, andif hydrogen production efficiency reaches Toyotas target of 70%, then FCVs will have nearly 30%efficiency. One should be careful to note that the technological difference between FCVs andFCHVs is not large, when kept in the larger perspective of the transition, but significant enoughto mention.
FCHVs may require more expensive components, but as battery technology progresses, thecosts are sure to decline. Furthermore, the benefits to efficiency, which translate to savings inenergy consumption and carbon dioxide emissions, add value to FCHVs. FCHV technology canalso have lower transition costs, since FCHVs share a drivetrain with HEVs. Toyota uses the exactPrius drivetrain in their FCHVs. This lowers the cost to modify manufacturing plants to buildfuel cell cars.
Because of the efficiency, manufacturing transition costs, and steadily declining battery costs,FCHV technology is generally better than FCVs. This means that the endpoint for the hybridpath is more desirable than the endpoint of the direct path. The contest between the two pathsis far from over though, as the relative energy consumption and emissions savings have yet to bedetermined. xact Prius drivetrain in their FCHVs. This lowers the cost to modify manufacturingplants to build fuel cell cars.
Because of the efficiency, manufacturing transition costs, and steadily declining battery costs,FCHV technology is generally better than FCVs. This means that the endpoint for the hybrid
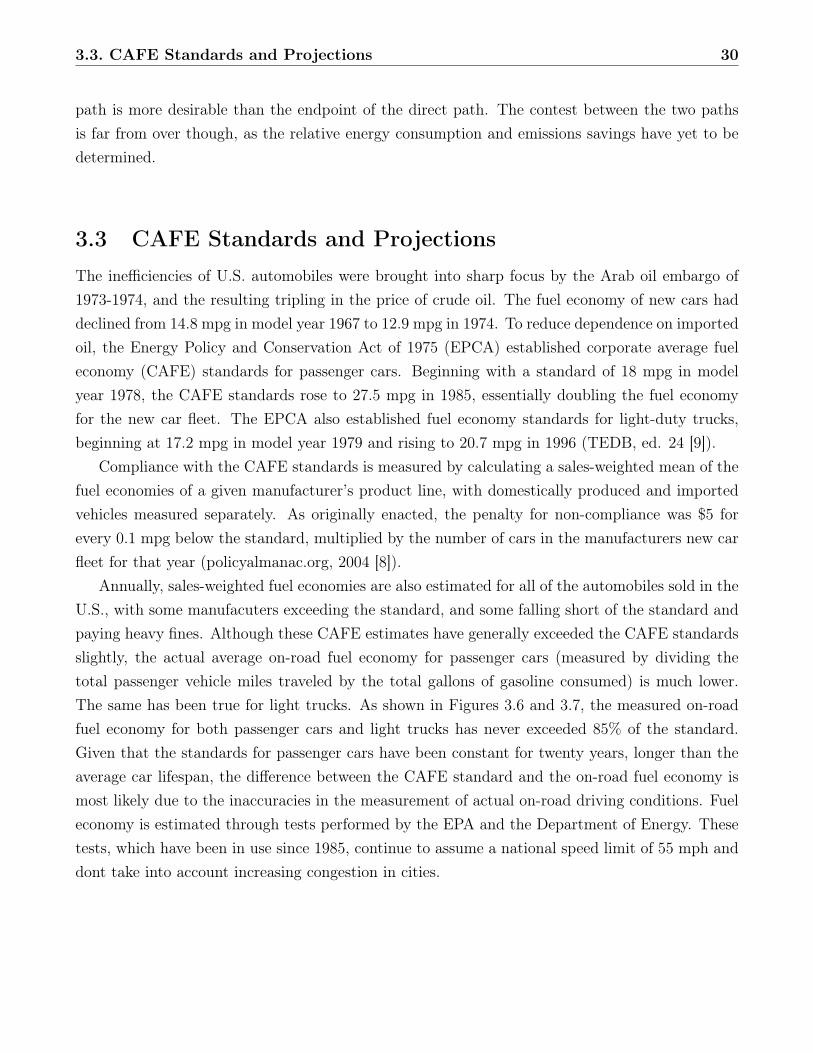
3.3. CAFE Standards and Projections 30
path is more desirable than the endpoint of the direct path. The contest between the two pathsis far from over though, as the relative energy consumption and emissions savings have yet to bedetermined.
3.3 CAFE Standards and ProjectionsThe inefficiencies of U.S. automobiles were brought into sharp focus by the Arab oil embargo of1973-1974, and the resulting tripling in the price of crude oil. The fuel economy of new cars haddeclined from 14.8 mpg in model year 1967 to 12.9 mpg in 1974. To reduce dependence on importedoil, the Energy Policy and Conservation Act of 1975 (EPCA) established corporate average fueleconomy (CAFE) standards for passenger cars. Beginning with a standard of 18 mpg in modelyear 1978, the CAFE standards rose to 27.5 mpg in 1985, essentially doubling the fuel economyfor the new car fleet. The EPCA also established fuel economy standards for light-duty trucks,beginning at 17.2 mpg in model year 1979 and rising to 20.7 mpg in 1996 (TEDB, ed. 24 [9]).
Compliance with the CAFE standards is measured by calculating a sales-weighted mean of thefuel economies of a given manufacturer’s product line, with domestically produced and importedvehicles measured separately. As originally enacted, the penalty for non-compliance was $5 forevery 0.1 mpg below the standard, multiplied by the number of cars in the manufacturers new carfleet for that year (policyalmanac.org, 2004 [8]).
Annually, sales-weighted fuel economies are also estimated for all of the automobiles sold in theU.S., with some manufacuters exceeding the standard, and some falling short of the standard andpaying heavy fines. Although these CAFE estimates have generally exceeded the CAFE standardsslightly, the actual average on-road fuel economy for passenger cars (measured by dividing thetotal passenger vehicle miles traveled by the total gallons of gasoline consumed) is much lower.The same has been true for light trucks. As shown in Figures 3.6 and 3.7, the measured on-roadfuel economy for both passenger cars and light trucks has never exceeded 85% of the standard.Given that the standards for passenger cars have been constant for twenty years, longer than theaverage car lifespan, the difference between the CAFE standard and the on-road fuel economy ismost likely due to the inaccuracies in the measurement of actual on-road driving conditions. Fueleconomy is estimated through tests performed by the EPA and the Department of Energy. Thesetests, which have been in use since 1985, continue to assume a national speed limit of 55 mph anddont take into account increasing congestion in cities.
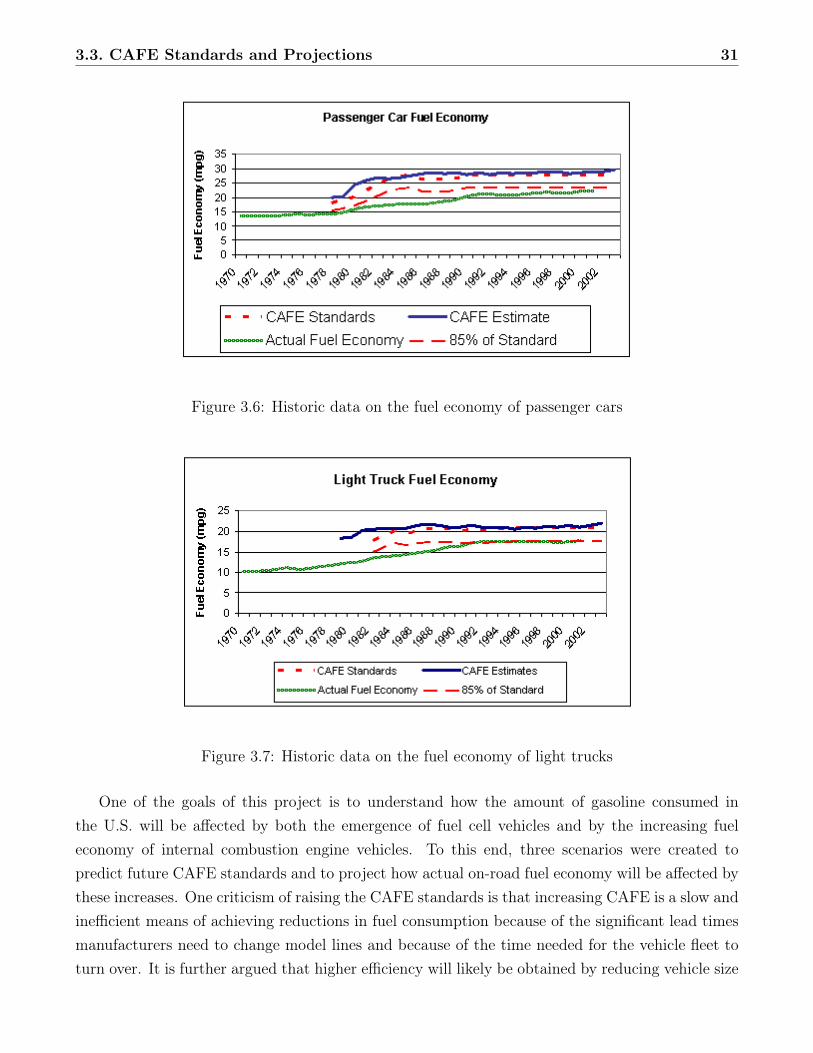
3.3. CAFE Standards and Projections 31
Figure 3.6: Historic data on the fuel economy of passenger cars
Figure 3.7: Historic data on the fuel economy of light trucks
One of the goals of this project is to understand how the amount of gasoline consumed inthe U.S. will be affected by both the emergence of fuel cell vehicles and by the increasing fueleconomy of internal combustion engine vehicles. To this end, three scenarios were created topredict future CAFE standards and to project how actual on-road fuel economy will be affected bythese increases. One criticism of raising the CAFE standards is that increasing CAFE is a slow andinefficient means of achieving reductions in fuel consumption because of the significant lead timesmanufacturers need to change model lines and because of the time needed for the vehicle fleet toturn over. It is further argued that higher efficiency will likely be obtained by reducing vehicle size
3.3. CAFE Standards and Projections 32
and weight, raising concerns about safety. However, proponents of a CAFE increase have arguedthat boosting the standards might bring about the introduction of technological improvementsthat do not compromise features that consumers value, but which would otherwise not be addedbecause these improvements do add to the cost of a new vehicle (policyalmanac.org, 2004 [8]).
A study conducted by the National Academy of Sciences in July 2001 explored raising theCAFE standard for light-duty trucks. It concluded that it was possible to achieve a more thanforty percent improvement in light truck and SUV fuel economy over a ten to fifteen year period atcosts that would be recoverable over the lifetime of ownership. The study does suggest, however,that there may be safety consequences if manufacturers opt to meet higher standards by reducingvehicle weight.
To address these concerns, one scenario for future CAFE standards (the pessimistic scenario)assumes that no increase will be made to the standards through 2100. An optimistic scenariofollows the ACEEE’s (American Council for an Energy Efficient Economy) recommendations forfuel economy increases for both passenger cars and light trucks. This scenario increases the fueleconomy five percent per year from 2008 to 2017, for a total increase of sixty percent, bringing thestandard for passenger cars to 44 mpg and the standard for light trucks to 33.1 mpg. A moderatescenario for CAFE standards increases was also created, which increases the standards by threepercent per year from 2008 to 2016, for a total increase of thirty percent for both passenger carsand light trucks.
Historical data on the CAFE standards and measured fuel economy was used to create a linearregression model to forecast fuel economy through 2100. A limit of 85% of the CAFE standard wasimposed on the fuel economy projections to reflect a more accurate picture of driving conditions,as discussed above. The results of these forecasts are depicted in Figures 3.8 and 3.9, below. Inthe optimistic scenario, on-road fuel economies for the total vehicle population reach 37.4 mpgfor passenger cars and 28.1 mpg for light trucks by 2029, for a sixty percent increase over todaysaverage fuel economies. On-road average fuel economies increase by thirty percent by 2029 in themoderate scenario to 30.5 mpg for passenger cars and to 23.0 mpg for light trucks.
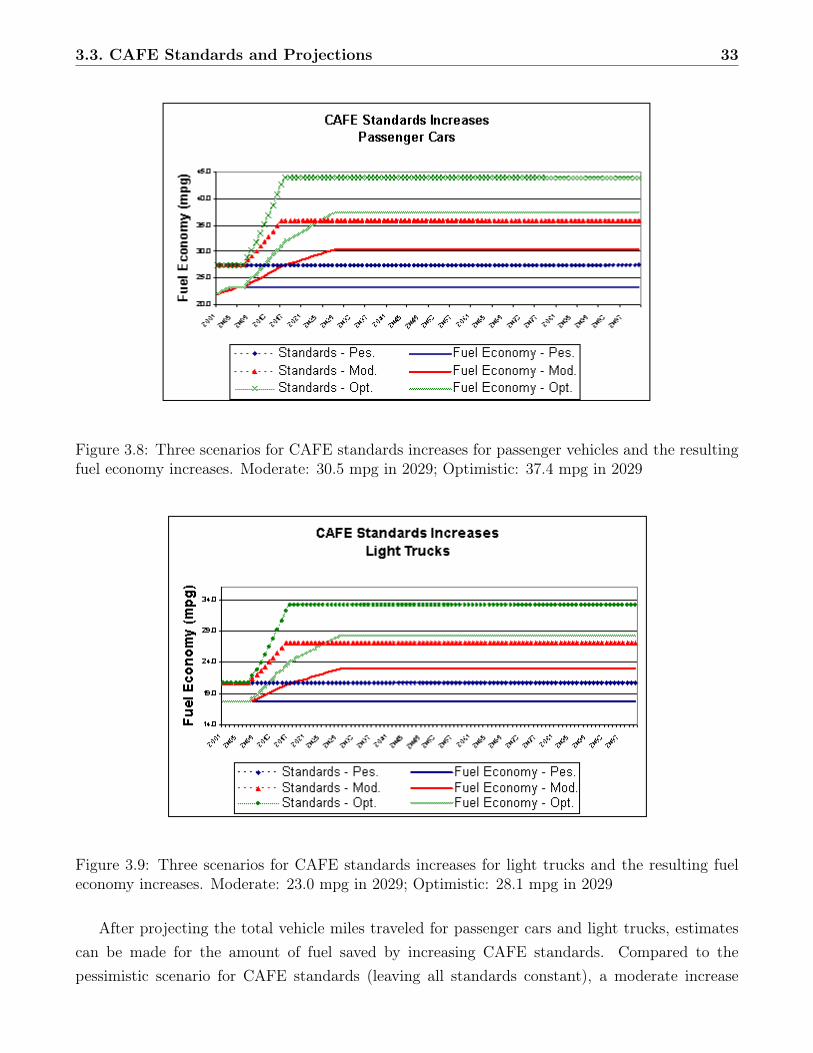
3.3. CAFE Standards and Projections 33
Figure 3.8: Three scenarios for CAFE standards increases for passenger vehicles and the resultingfuel economy increases. Moderate: 30.5 mpg in 2029; Optimistic: 37.4 mpg in 2029
Figure 3.9: Three scenarios for CAFE standards increases for light trucks and the resulting fueleconomy increases. Moderate: 23.0 mpg in 2029; Optimistic: 28.1 mpg in 2029
After projecting the total vehicle miles traveled for passenger cars and light trucks, estimatescan be made for the amount of fuel saved by increasing CAFE standards. Compared to thepessimistic scenario for CAFE standards (leaving all standards constant), a moderate increase
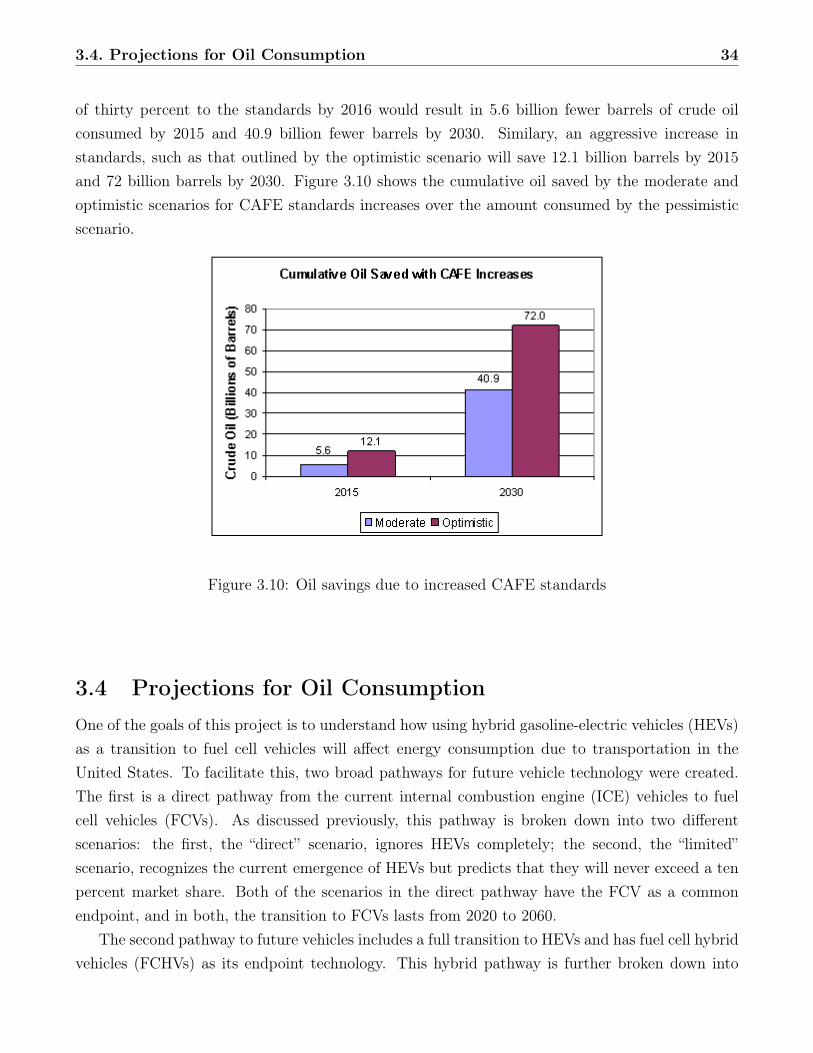
3.4. Projections for Oil Consumption 34
of thirty percent to the standards by 2016 would result in 5.6 billion fewer barrels of crude oilconsumed by 2015 and 40.9 billion fewer barrels by 2030. Similary, an aggressive increase instandards, such as that outlined by the optimistic scenario will save 12.1 billion barrels by 2015and 72 billion barrels by 2030. Figure 3.10 shows the cumulative oil saved by the moderate andoptimistic scenarios for CAFE standards increases over the amount consumed by the pessimisticscenario.
Figure 3.10: Oil savings due to increased CAFE standards
3.4 Projections for Oil ConsumptionOne of the goals of this project is to understand how using hybrid gasoline-electric vehicles (HEVs)as a transition to fuel cell vehicles will affect energy consumption due to transportation in theUnited States. To facilitate this, two broad pathways for future vehicle technology were created.The first is a direct pathway from the current internal combustion engine (ICE) vehicles to fuelcell vehicles (FCVs). As discussed previously, this pathway is broken down into two differentscenarios: the first, the “direct” scenario, ignores HEVs completely; the second, the “limited”scenario, recognizes the current emergence of HEVs but predicts that they will never exceed a tenpercent market share. Both of the scenarios in the direct pathway have the FCV as a commonendpoint, and in both, the transition to FCVs lasts from 2020 to 2060.
The second pathway to future vehicles includes a full transition to HEVs and has fuel cell hybridvehicles (FCHVs) as its endpoint technology. This hybrid pathway is further broken down into
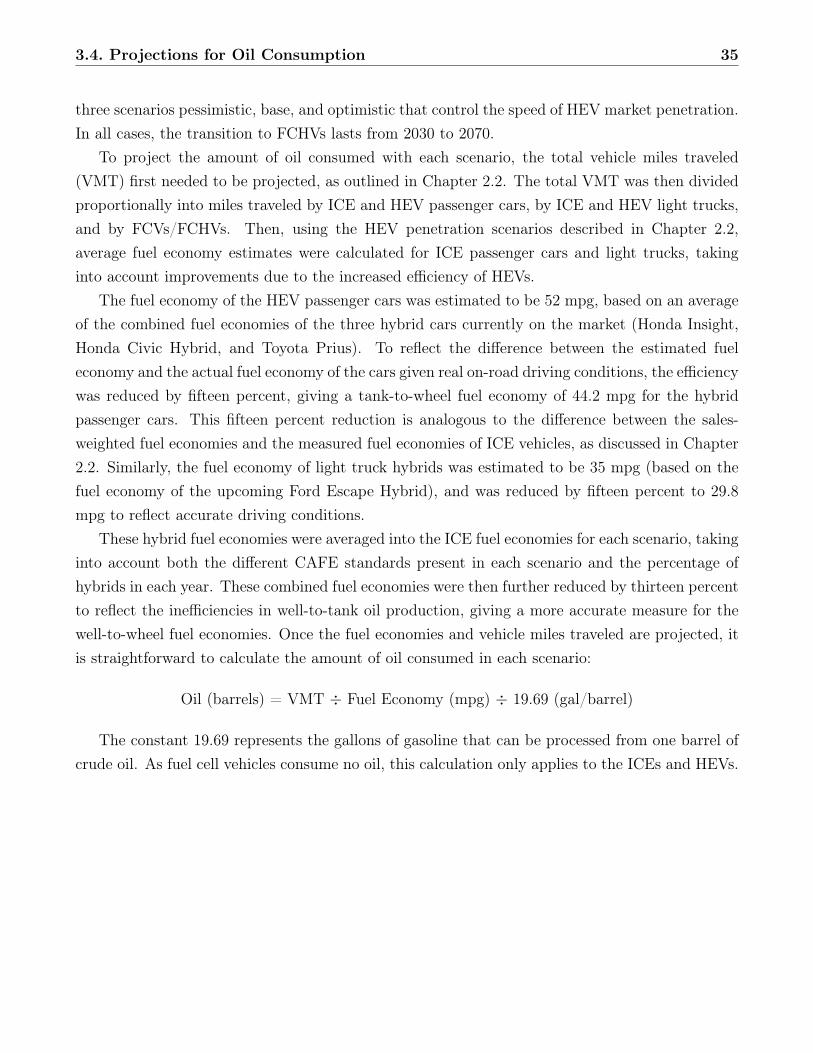
3.4. Projections for Oil Consumption 35
three scenarios pessimistic, base, and optimistic that control the speed of HEV market penetration.In all cases, the transition to FCHVs lasts from 2030 to 2070.
To project the amount of oil consumed with each scenario, the total vehicle miles traveled(VMT) first needed to be projected, as outlined in Chapter 2.2. The total VMT was then dividedproportionally into miles traveled by ICE and HEV passenger cars, by ICE and HEV light trucks,and by FCVs/FCHVs. Then, using the HEV penetration scenarios described in Chapter 2.2,average fuel economy estimates were calculated for ICE passenger cars and light trucks, takinginto account improvements due to the increased efficiency of HEVs.
The fuel economy of the HEV passenger cars was estimated to be 52 mpg, based on an averageof the combined fuel economies of the three hybrid cars currently on the market (Honda Insight,Honda Civic Hybrid, and Toyota Prius). To reflect the difference between the estimated fueleconomy and the actual fuel economy of the cars given real on-road driving conditions, the efficiencywas reduced by fifteen percent, giving a tank-to-wheel fuel economy of 44.2 mpg for the hybridpassenger cars. This fifteen percent reduction is analogous to the difference between the sales-weighted fuel economies and the measured fuel economies of ICE vehicles, as discussed in Chapter2.2. Similarly, the fuel economy of light truck hybrids was estimated to be 35 mpg (based on thefuel economy of the upcoming Ford Escape Hybrid), and was reduced by fifteen percent to 29.8mpg to reflect accurate driving conditions.
These hybrid fuel economies were averaged into the ICE fuel economies for each scenario, takinginto account both the different CAFE standards present in each scenario and the percentage ofhybrids in each year. These combined fuel economies were then further reduced by thirteen percentto reflect the inefficiencies in well-to-tank oil production, giving a more accurate measure for thewell-to-wheel fuel economies. Once the fuel economies and vehicle miles traveled are projected, itis straightforward to calculate the amount of oil consumed in each scenario:
Oil (barrels) = VMT ÷ Fuel Economy (mpg) ÷ 19.69 (gal/barrel)
The constant 19.69 represents the gallons of gasoline that can be processed from one barrel ofcrude oil. As fuel cell vehicles consume no oil, this calculation only applies to the ICEs and HEVs.
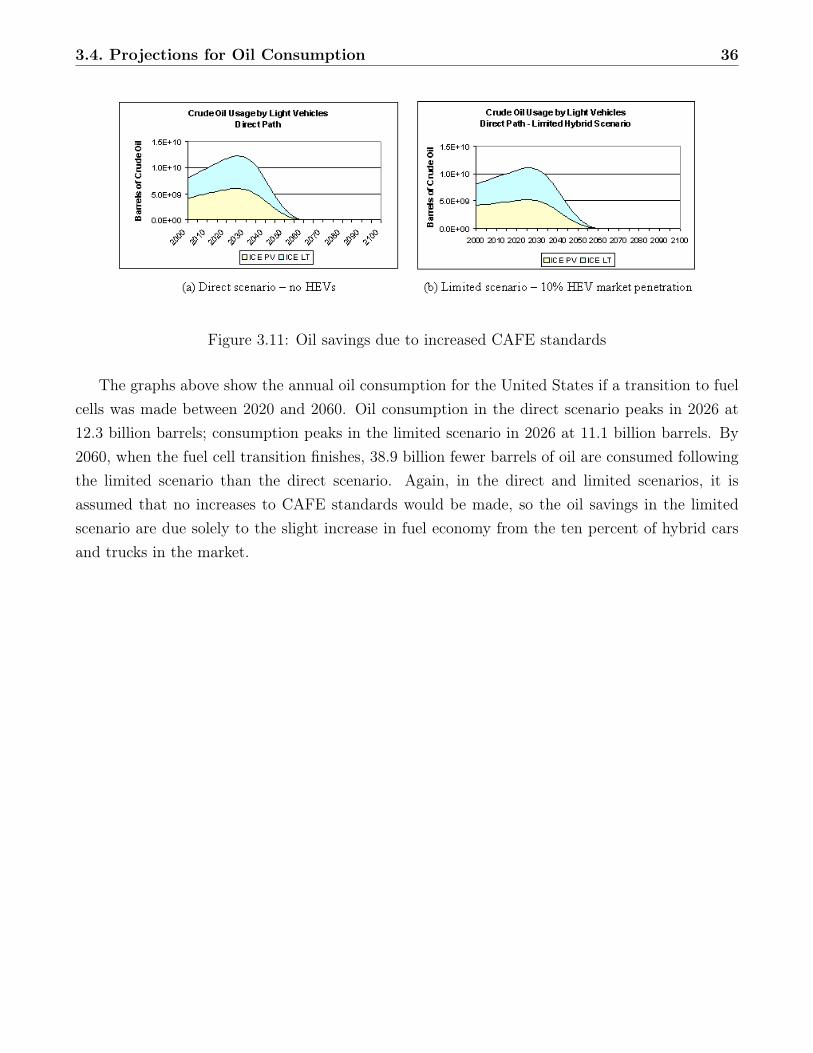
3.4. Projections for Oil Consumption 36
Figure 3.11: Oil savings due to increased CAFE standards
The graphs above show the annual oil consumption for the United States if a transition to fuelcells was made between 2020 and 2060. Oil consumption in the direct scenario peaks in 2026 at12.3 billion barrels; consumption peaks in the limited scenario in 2026 at 11.1 billion barrels. By2060, when the fuel cell transition finishes, 38.9 billion fewer barrels of oil are consumed followingthe limited scenario than the direct scenario. Again, in the direct and limited scenarios, it isassumed that no increases to CAFE standards would be made, so the oil savings in the limitedscenario are due solely to the slight increase in fuel economy from the ten percent of hybrid carsand trucks in the market.
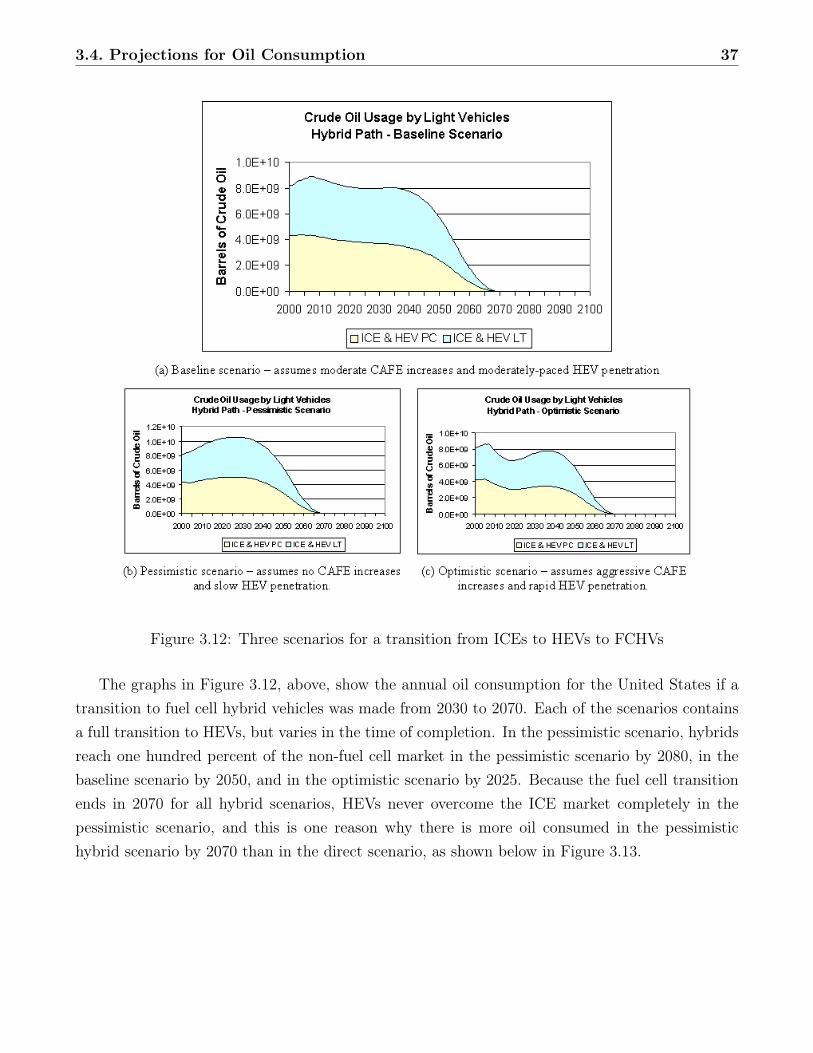
3.4. Projections for Oil Consumption 37
Figure 3.12: Three scenarios for a transition from ICEs to HEVs to FCHVs
The graphs in Figure 3.12, above, show the annual oil consumption for the United States if atransition to fuel cell hybrid vehicles was made from 2030 to 2070. Each of the scenarios containsa full transition to HEVs, but varies in the time of completion. In the pessimistic scenario, hybridsreach one hundred percent of the non-fuel cell market in the pessimistic scenario by 2080, in thebaseline scenario by 2050, and in the optimistic scenario by 2025. Because the fuel cell transitionends in 2070 for all hybrid scenarios, HEVs never overcome the ICE market completely in thepessimistic scenario, and this is one reason why there is more oil consumed in the pessimistichybrid scenario by 2070 than in the direct scenario, as shown below in Figure 3.13.
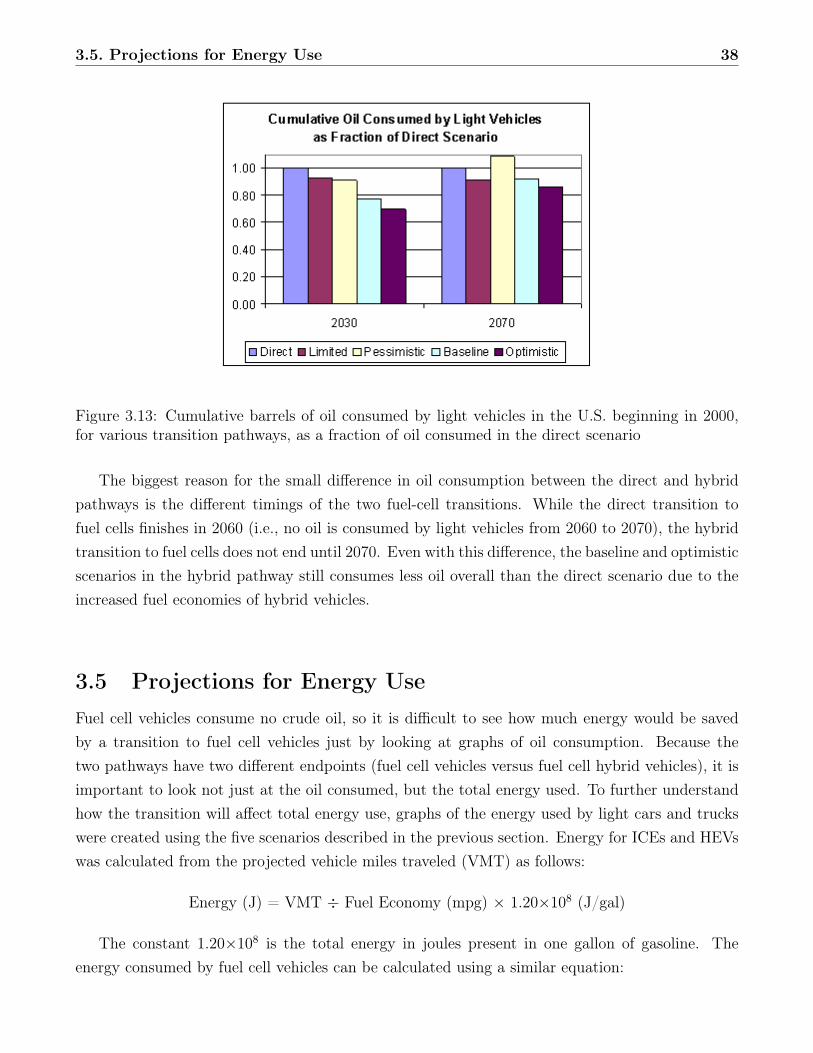
3.5. Projections for Energy Use 38
Figure 3.13: Cumulative barrels of oil consumed by light vehicles in the U.S. beginning in 2000,for various transition pathways, as a fraction of oil consumed in the direct scenario
The biggest reason for the small difference in oil consumption between the direct and hybridpathways is the different timings of the two fuel-cell transitions. While the direct transition tofuel cells finishes in 2060 (i.e., no oil is consumed by light vehicles from 2060 to 2070), the hybridtransition to fuel cells does not end until 2070. Even with this difference, the baseline and optimisticscenarios in the hybrid pathway still consumes less oil overall than the direct scenario due to theincreased fuel economies of hybrid vehicles.
3.5 Projections for Energy UseFuel cell vehicles consume no crude oil, so it is difficult to see how much energy would be savedby a transition to fuel cell vehicles just by looking at graphs of oil consumption. Because thetwo pathways have two different endpoints (fuel cell vehicles versus fuel cell hybrid vehicles), it isimportant to look not just at the oil consumed, but the total energy used. To further understandhow the transition will affect total energy use, graphs of the energy used by light cars and truckswere created using the five scenarios described in the previous section. Energy for ICEs and HEVswas calculated from the projected vehicle miles traveled (VMT) as follows:
Energy (J) = VMT ÷ Fuel Economy (mpg) × 1.20×10⁸ (J/gal)
The constant 1.20×10⁸ is the total energy in joules present in one gallon of gasoline. Theenergy consumed by fuel cell vehicles can be calculated using a similar equation:
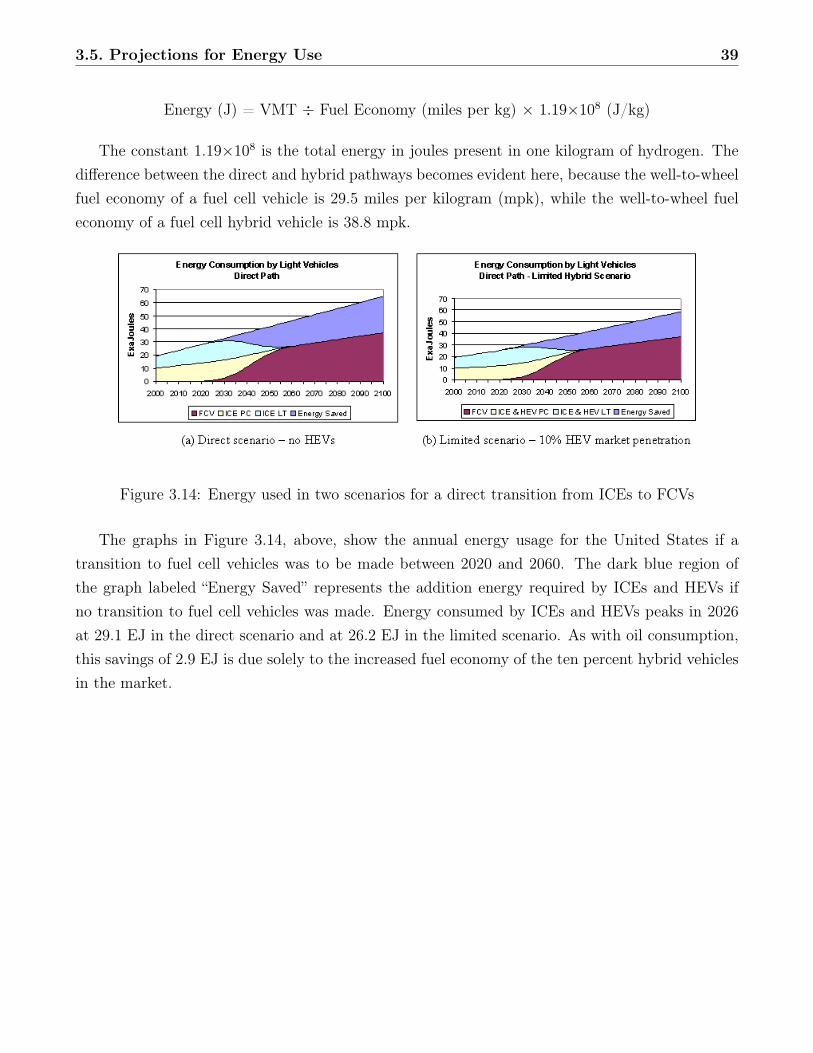
3.5. Projections for Energy Use 39
Energy (J) = VMT ÷ Fuel Economy (miles per kg) × 1.19×10⁸ (J/kg)
The constant 1.19×10⁸ is the total energy in joules present in one kilogram of hydrogen. Thedifference between the direct and hybrid pathways becomes evident here, because the well-to-wheelfuel economy of a fuel cell vehicle is 29.5 miles per kilogram (mpk), while the well-to-wheel fueleconomy of a fuel cell hybrid vehicle is 38.8 mpk.
Figure 3.14: Energy used in two scenarios for a direct transition from ICEs to FCVs
The graphs in Figure 3.14, above, show the annual energy usage for the United States if atransition to fuel cell vehicles was to be made between 2020 and 2060. The dark blue region ofthe graph labeled “Energy Saved” represents the addition energy required by ICEs and HEVs ifno transition to fuel cell vehicles was made. Energy consumed by ICEs and HEVs peaks in 2026at 29.1 EJ in the direct scenario and at 26.2 EJ in the limited scenario. As with oil consumption,this savings of 2.9 EJ is due solely to the increased fuel economy of the ten percent hybrid vehiclesin the market.
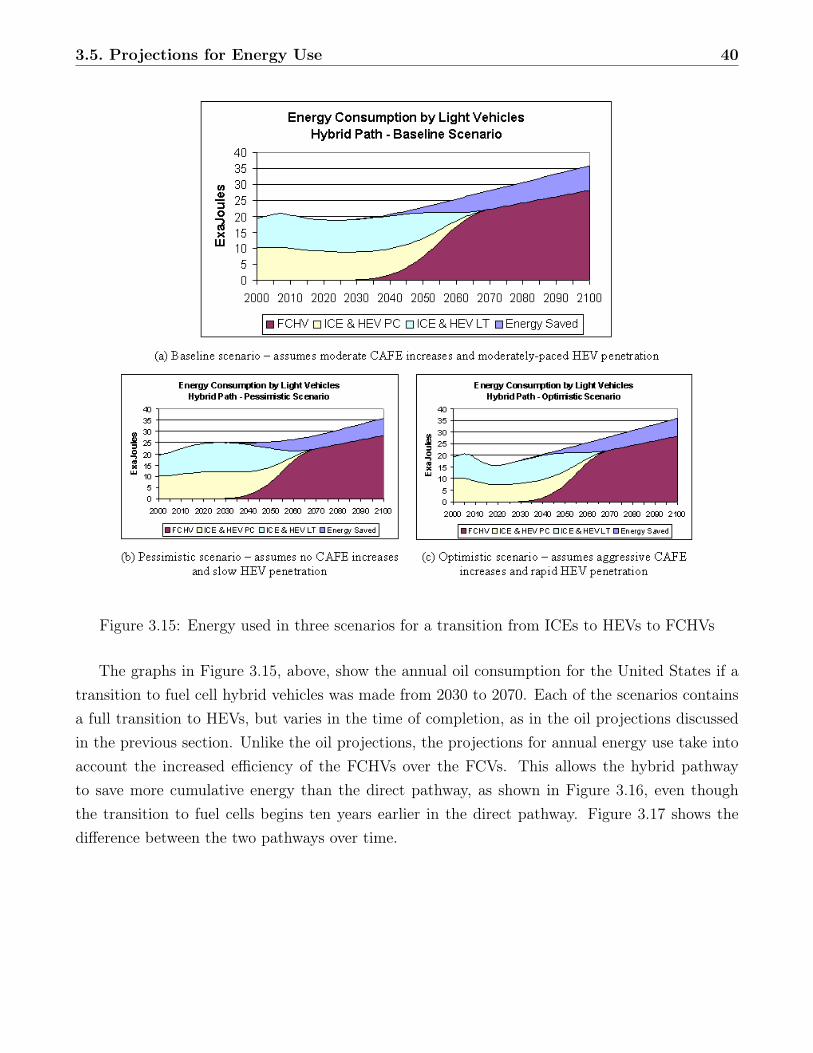
3.5. Projections for Energy Use 40
Figure 3.15: Energy used in three scenarios for a transition from ICEs to HEVs to FCHVs
The graphs in Figure 3.15, above, show the annual oil consumption for the United States if atransition to fuel cell hybrid vehicles was made from 2030 to 2070. Each of the scenarios containsa full transition to HEVs, but varies in the time of completion, as in the oil projections discussedin the previous section. Unlike the oil projections, the projections for annual energy use take intoaccount the increased efficiency of the FCHVs over the FCVs. This allows the hybrid pathwayto save more cumulative energy than the direct pathway, as shown in Figure 3.16, even thoughthe transition to fuel cells begins ten years earlier in the direct pathway. Figure 3.17 shows thedifference between the two pathways over time.
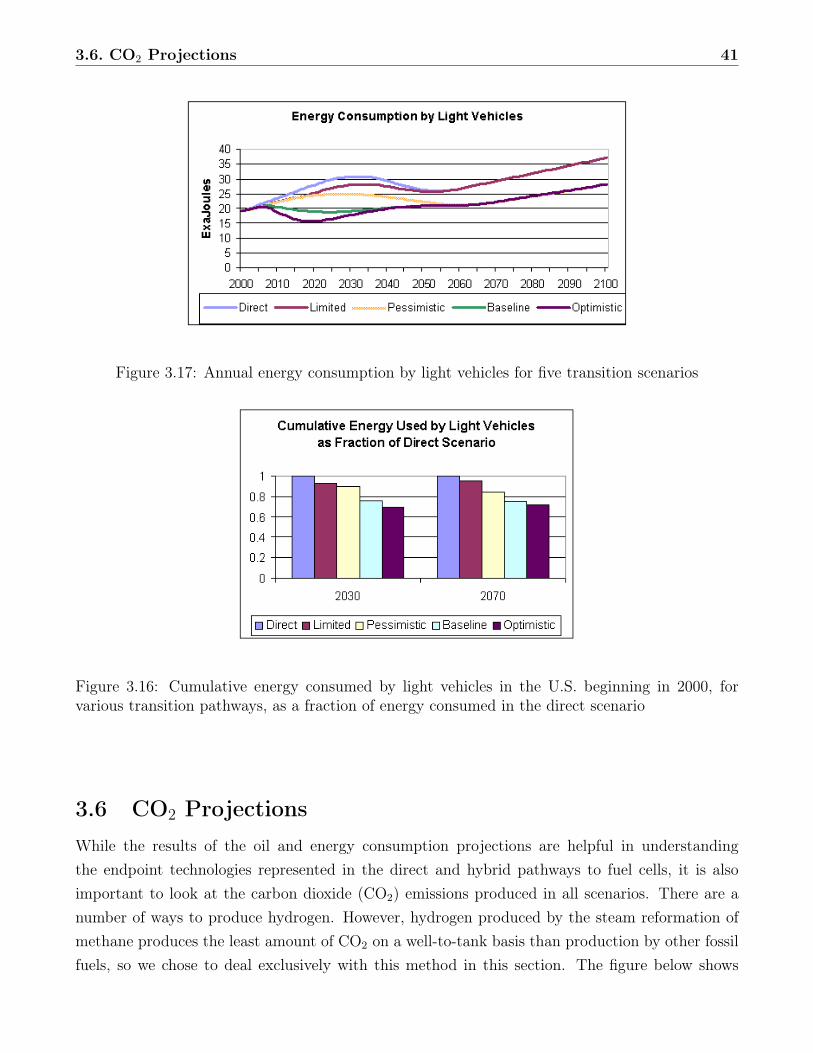
3.6. CO2 Projections 41
Figure 3.17: Annual energy consumption by light vehicles for five transition scenarios
Figure 3.16: Cumulative energy consumed by light vehicles in the U.S. beginning in 2000, forvarious transition pathways, as a fraction of energy consumed in the direct scenario
3.6 CO2 ProjectionsWhile the results of the oil and energy consumption projections are helpful in understandingthe endpoint technologies represented in the direct and hybrid pathways to fuel cells, it is alsoimportant to look at the carbon dioxide (CO2) emissions produced in all scenarios. There are anumber of ways to produce hydrogen. However, hydrogen produced by the steam reformation ofmethane produces the least amount of CO2 on a well-to-tank basis than production by other fossilfuels, so we chose to deal exclusively with this method in this section. The figure below shows
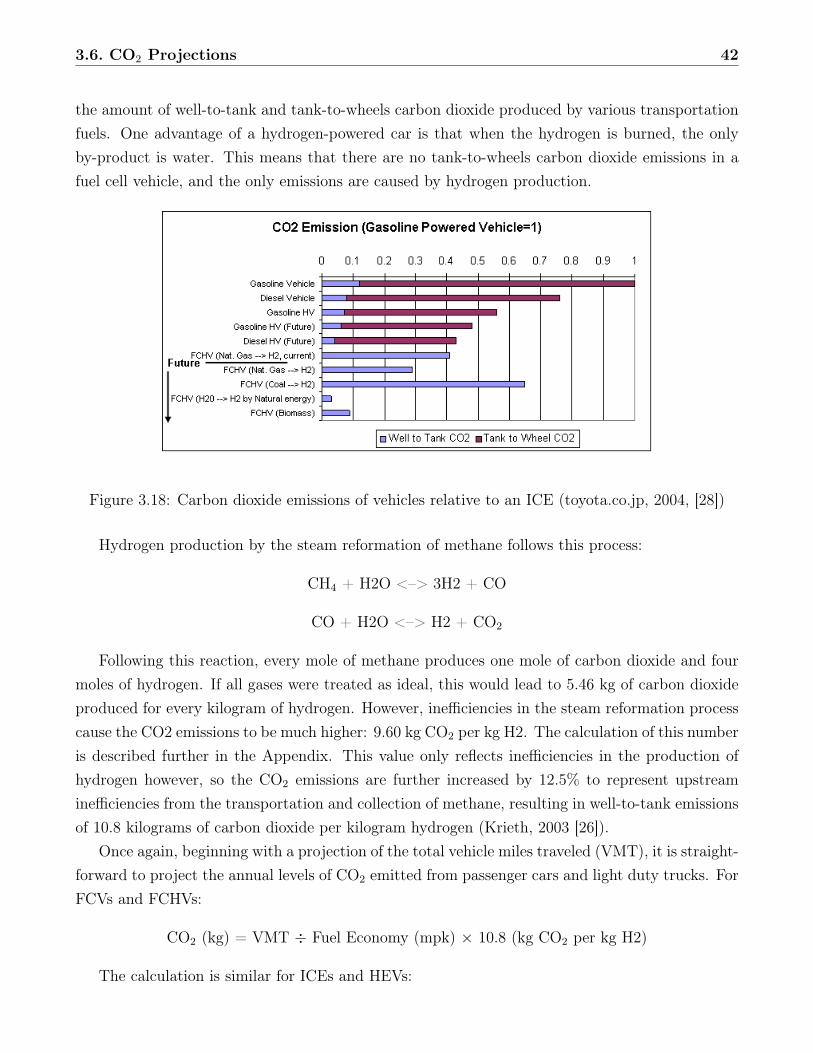
3.6. CO2 Projections 42
the amount of well-to-tank and tank-to-wheels carbon dioxide produced by various transportationfuels. One advantage of a hydrogen-powered car is that when the hydrogen is burned, the onlyby-product is water. This means that there are no tank-to-wheels carbon dioxide emissions in afuel cell vehicle, and the only emissions are caused by hydrogen production.
Figure 3.18: Carbon dioxide emissions of vehicles relative to an ICE (toyota.co.jp, 2004, [28])
Hydrogen production by the steam reformation of methane follows this process:
CH4 + H2O <–> 3H2 + CO
CO + H2O <–> H2 + CO2
Following this reaction, every mole of methane produces one mole of carbon dioxide and fourmoles of hydrogen. If all gases were treated as ideal, this would lead to 5.46 kg of carbon dioxideproduced for every kilogram of hydrogen. However, inefficiencies in the steam reformation processcause the CO2 emissions to be much higher: 9.60 kg CO2 per kg H2. The calculation of this numberis described further in the Appendix. This value only reflects inefficiencies in the production ofhydrogen however, so the CO2 emissions are further increased by 12.5% to represent upstreaminefficiencies from the transportation and collection of methane, resulting in well-to-tank emissionsof 10.8 kilograms of carbon dioxide per kilogram hydrogen (Krieth, 2003 [26]).
Once again, beginning with a projection of the total vehicle miles traveled (VMT), it is straight-forward to project the annual levels of CO2 emitted from passenger cars and light duty trucks. ForFCVs and FCHVs:
CO2 (kg) = VMT ÷ Fuel Economy (mpk) × 10.8 (kg CO2 per kg H2)
The calculation is similar for ICEs and HEVs:
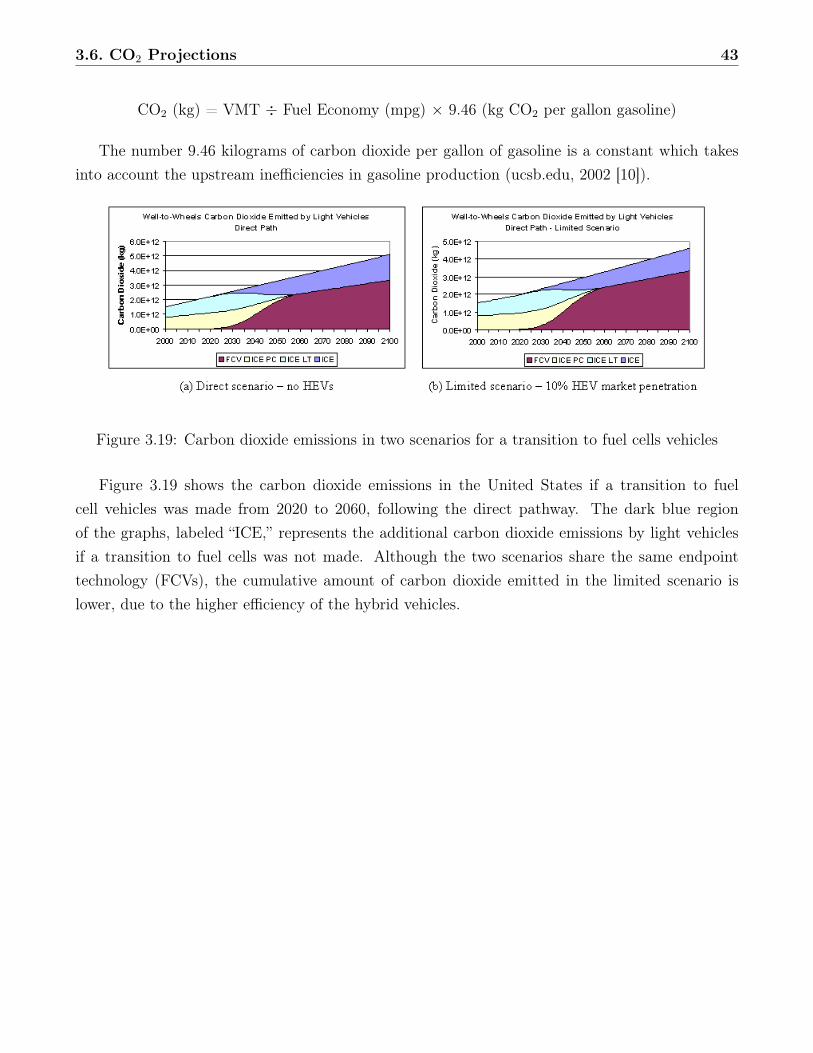
3.6. CO2 Projections 43
CO2 (kg) = VMT ÷ Fuel Economy (mpg) × 9.46 (kg CO2 per gallon gasoline)
The number 9.46 kilograms of carbon dioxide per gallon of gasoline is a constant which takesinto account the upstream inefficiencies in gasoline production (ucsb.edu, 2002 [10]).
Figure 3.19: Carbon dioxide emissions in two scenarios for a transition to fuel cells vehicles
Figure 3.19 shows the carbon dioxide emissions in the United States if a transition to fuelcell vehicles was made from 2020 to 2060, following the direct pathway. The dark blue regionof the graphs, labeled “ICE,” represents the additional carbon dioxide emissions by light vehiclesif a transition to fuel cells was not made. Although the two scenarios share the same endpointtechnology (FCVs), the cumulative amount of carbon dioxide emitted in the limited scenario islower, due to the higher efficiency of the hybrid vehicles.
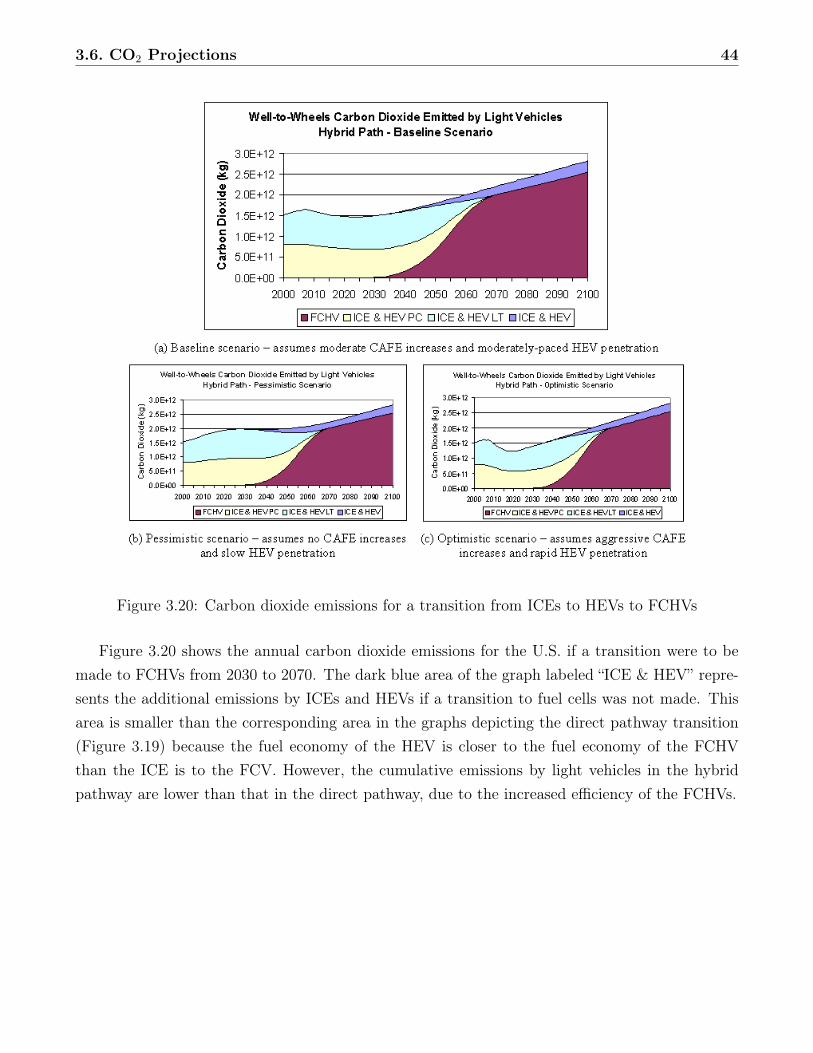
3.6. CO2 Projections 44
Figure 3.20: Carbon dioxide emissions for a transition from ICEs to HEVs to FCHVs
Figure 3.20 shows the annual carbon dioxide emissions for the U.S. if a transition were to bemade to FCHVs from 2030 to 2070. The dark blue area of the graph labeled “ICE & HEV” repre-sents the additional emissions by ICEs and HEVs if a transition to fuel cells was not made. Thisarea is smaller than the corresponding area in the graphs depicting the direct pathway transition(Figure 3.19) because the fuel economy of the HEV is closer to the fuel economy of the FCHVthan the ICE is to the FCV. However, the cumulative emissions by light vehicles in the hybridpathway are lower than that in the direct pathway, due to the increased efficiency of the FCHVs.
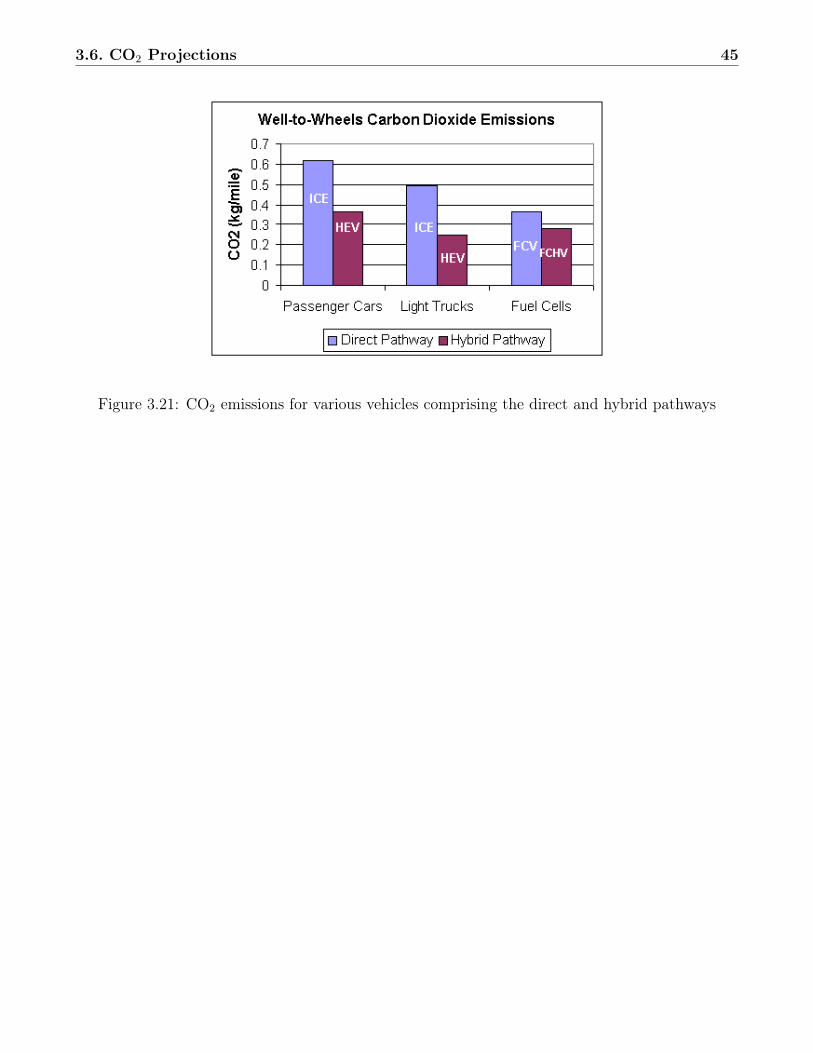
3.6. CO2 Projections 45
Figure 3.21: CO2 emissions for various vehicles comprising the direct and hybrid pathways
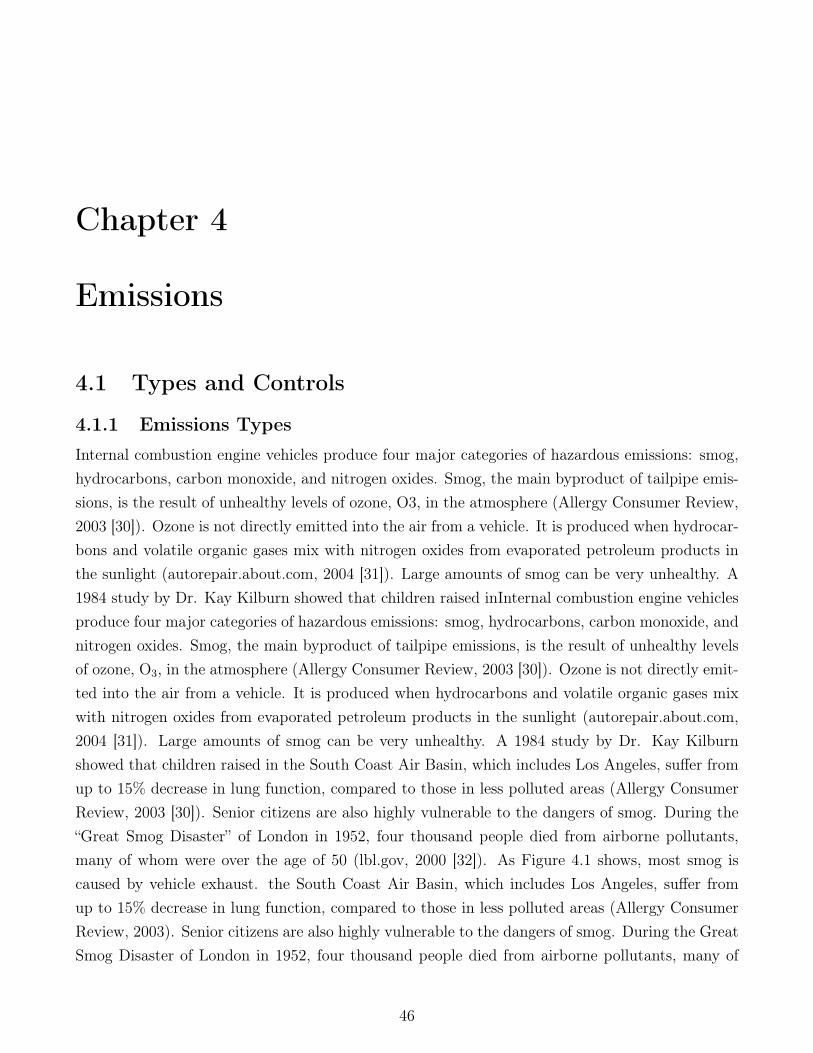
Chapter 4
Emissions
4.1 Types and Controls
4.1.1 Emissions TypesInternal combustion engine vehicles produce four major categories of hazardous emissions: smog,hydrocarbons, carbon monoxide, and nitrogen oxides. Smog, the main byproduct of tailpipe emis-sions, is the result of unhealthy levels of ozone, O3, in the atmosphere (Allergy Consumer Review,2003 [30]). Ozone is not directly emitted into the air from a vehicle. It is produced when hydrocar-bons and volatile organic gases mix with nitrogen oxides from evaporated petroleum products inthe sunlight (autorepair.about.com, 2004 [31]). Large amounts of smog can be very unhealthy. A1984 study by Dr. Kay Kilburn showed that children raised inInternal combustion engine vehiclesproduce four major categories of hazardous emissions: smog, hydrocarbons, carbon monoxide, andnitrogen oxides. Smog, the main byproduct of tailpipe emissions, is the result of unhealthy levelsof ozone, O3, in the atmosphere (Allergy Consumer Review, 2003 [30]). Ozone is not directly emit-ted into the air from a vehicle. It is produced when hydrocarbons and volatile organic gases mixwith nitrogen oxides from evaporated petroleum products in the sunlight (autorepair.about.com,2004 [31]). Large amounts of smog can be very unhealthy. A 1984 study by Dr. Kay Kilburnshowed that children raised in the South Coast Air Basin, which includes Los Angeles, suffer fromup to 15% decrease in lung function, compared to those in less polluted areas (Allergy ConsumerReview, 2003 [30]). Senior citizens are also highly vulnerable to the dangers of smog. During the“Great Smog Disaster” of London in 1952, four thousand people died from airborne pollutants,many of whom were over the age of 50 (lbl.gov, 2000 [32]). As Figure 4.1 shows, most smog iscaused by vehicle exhaust. the South Coast Air Basin, which includes Los Angeles, suffer fromup to 15% decrease in lung function, compared to those in less polluted areas (Allergy ConsumerReview, 2003). Senior citizens are also highly vulnerable to the dangers of smog. During the GreatSmog Disaster of London in 1952, four thousand people died from airborne pollutants, many of
46
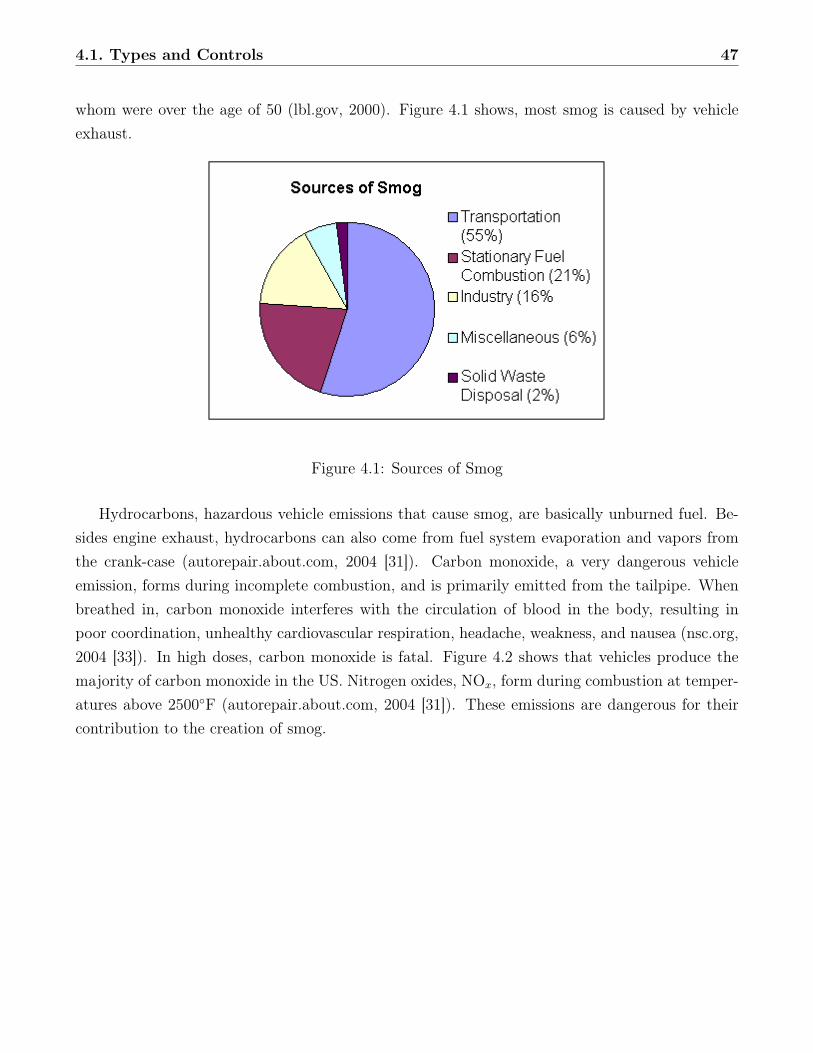
4.1. Types and Controls 47
whom were over the age of 50 (lbl.gov, 2000). Figure 4.1 shows, most smog is caused by vehicleexhaust.
Figure 4.1: Sources of Smog
Hydrocarbons, hazardous vehicle emissions that cause smog, are basically unburned fuel. Be-sides engine exhaust, hydrocarbons can also come from fuel system evaporation and vapors fromthe crank-case (autorepair.about.com, 2004 [31]). Carbon monoxide, a very dangerous vehicleemission, forms during incomplete combustion, and is primarily emitted from the tailpipe. Whenbreathed in, carbon monoxide interferes with the circulation of blood in the body, resulting inpoor coordination, unhealthy cardiovascular respiration, headache, weakness, and nausea (nsc.org,2004 [33]). In high doses, carbon monoxide is fatal. Figure 4.2 shows that vehicles produce themajority of carbon monoxide in the US. Nitrogen oxides, NOx, form during combustion at temper-atures above 2500◦F (autorepair.about.com, 2004 [31]). These emissions are dangerous for theircontribution to the creation of smog.
4.2. Emissions Legislation 48
Figure 4.2: Sources of Carbon Monoxide in the US (Allergy Consumer Review, 2003 [30])
4.1.2 Emissions ControlsICE vehicles have developed methods of reducing vehicle emissions. These systems include: fuelinjection, catalytic converter, fill pipe restrictor, positive crankcase ventilation, evaporative con-trol system, and improved combustion system (autorepair.about.com, 2004 [31]). Fuel injectionis designed to supply fuel to the engine in precise amounts, using feedback systems that monitoratmospheric conditions and exhaust to adjust the amount of fuel supplied. The catalytic con-verter converts harmful pollutants into carbon dioxide and water. The fill pipe restrictor preventslarger diameter fuel nozzles from entering the car, which typically supply leaded fuel. Positivecrankcase ventilation takes vapors from the crankcase and recycles them back into the air fuelmixture, where the vapors are subsequently burned (autorepair.about.com, 2004 [31]). The fueltank also has a closed ventilation system that recycles fuel vapors, called the evaporative controlsystem. Finally, design changes in the 1960s helped reduce hydrocarbon and carbon monoxideemissions through small changes to the carburetor, primary air system, and spark timing controls(autorepair.about.com, 2004 [31]).
4.2 Emissions Legislation
4.2.1 US Emission Controls HistoryAir quality legislation in the US dates back as early as 1881, when the cities of Cincinnati andChicago passed laws to limit the amount of industrial air pollution being generated (American
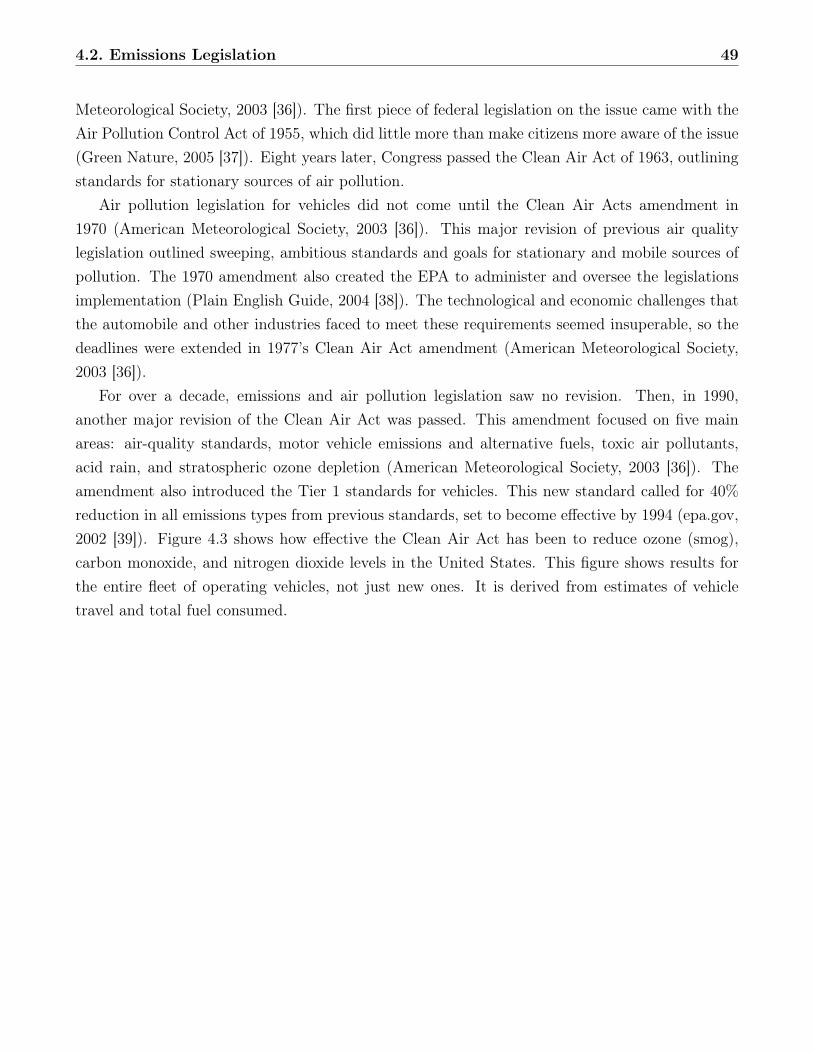
4.2. Emissions Legislation 49
Meteorological Society, 2003 [36]). The first piece of federal legislation on the issue came with theAir Pollution Control Act of 1955, which did little more than make citizens more aware of the issue(Green Nature, 2005 [37]). Eight years later, Congress passed the Clean Air Act of 1963, outliningstandards for stationary sources of air pollution.
Air pollution legislation for vehicles did not come until the Clean Air Acts amendment in1970 (American Meteorological Society, 2003 [36]). This major revision of previous air qualitylegislation outlined sweeping, ambitious standards and goals for stationary and mobile sources ofpollution. The 1970 amendment also created the EPA to administer and oversee the legislationsimplementation (Plain English Guide, 2004 [38]). The technological and economic challenges thatthe automobile and other industries faced to meet these requirements seemed insuperable, so thedeadlines were extended in 1977’s Clean Air Act amendment (American Meteorological Society,2003 [36]).
For over a decade, emissions and air pollution legislation saw no revision. Then, in 1990,another major revision of the Clean Air Act was passed. This amendment focused on five mainareas: air-quality standards, motor vehicle emissions and alternative fuels, toxic air pollutants,acid rain, and stratospheric ozone depletion (American Meteorological Society, 2003 [36]). Theamendment also introduced the Tier 1 standards for vehicles. This new standard called for 40%reduction in all emissions types from previous standards, set to become effective by 1994 (epa.gov,2002 [39]). Figure 4.3 shows how effective the Clean Air Act has been to reduce ozone (smog),carbon monoxide, and nitrogen dioxide levels in the United States. This figure shows results forthe entire fleet of operating vehicles, not just new ones. It is derived from estimates of vehicletravel and total fuel consumed.
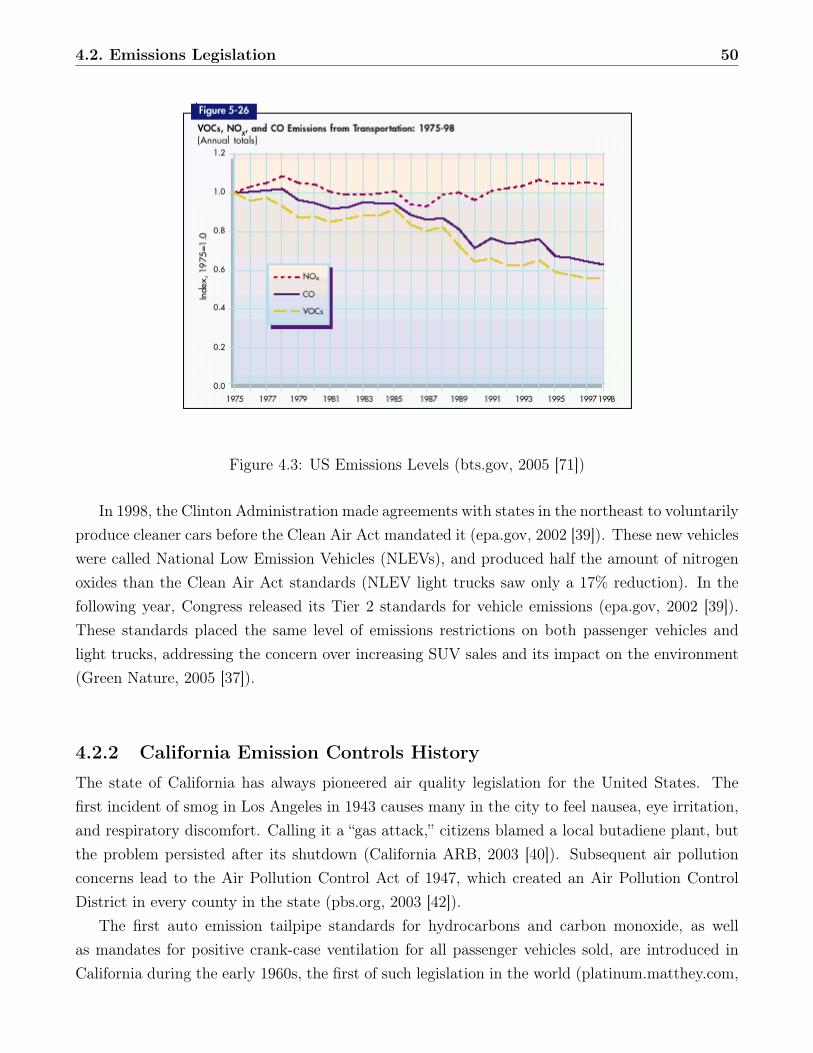
4.2. Emissions Legislation 50
Figure 4.3: US Emissions Levels (bts.gov, 2005 [71])
In 1998, the Clinton Administration made agreements with states in the northeast to voluntarilyproduce cleaner cars before the Clean Air Act mandated it (epa.gov, 2002 [39]). These new vehicleswere called National Low Emission Vehicles (NLEVs), and produced half the amount of nitrogenoxides than the Clean Air Act standards (NLEV light trucks saw only a 17% reduction). In thefollowing year, Congress released its Tier 2 standards for vehicle emissions (epa.gov, 2002 [39]).These standards placed the same level of emissions restrictions on both passenger vehicles andlight trucks, addressing the concern over increasing SUV sales and its impact on the environment(Green Nature, 2005 [37]).
4.2.2 California Emission Controls HistoryThe state of California has always pioneered air quality legislation for the United States. Thefirst incident of smog in Los Angeles in 1943 causes many in the city to feel nausea, eye irritation,and respiratory discomfort. Calling it a “gas attack,” citizens blamed a local butadiene plant, butthe problem persisted after its shutdown (California ARB, 2003 [40]). Subsequent air pollutionconcerns lead to the Air Pollution Control Act of 1947, which created an Air Pollution ControlDistrict in every county in the state (pbs.org, 2003 [42]).
The first auto emission tailpipe standards for hydrocarbons and carbon monoxide, as wellas mandates for positive crank-case ventilation for all passenger vehicles sold, are introduced inCalifornia during the early 1960s, the first of such legislation in the world (platinum.matthey.com,
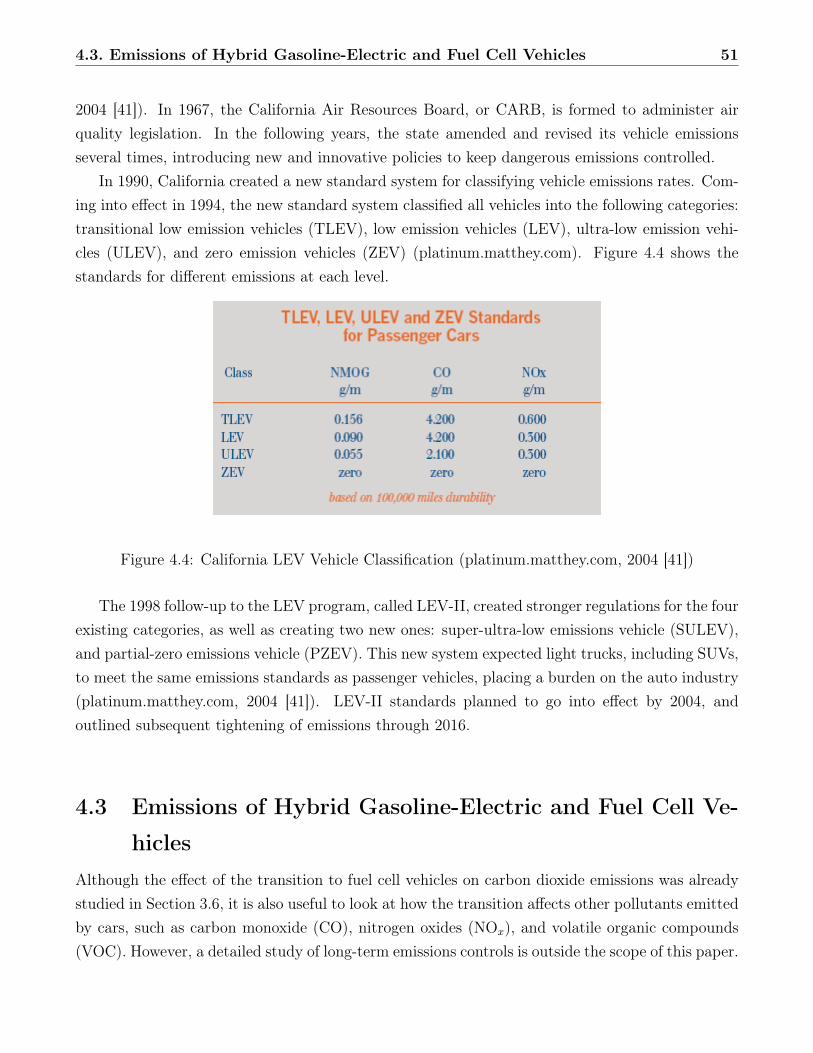
4.3. Emissions of Hybrid Gasoline-Electric and Fuel Cell Vehicles 51
2004 [41]). In 1967, the California Air Resources Board, or CARB, is formed to administer airquality legislation. In the following years, the state amended and revised its vehicle emissionsseveral times, introducing new and innovative policies to keep dangerous emissions controlled.
In 1990, California created a new standard system for classifying vehicle emissions rates. Com-ing into effect in 1994, the new standard system classified all vehicles into the following categories:transitional low emission vehicles (TLEV), low emission vehicles (LEV), ultra-low emission vehi-cles (ULEV), and zero emission vehicles (ZEV) (platinum.matthey.com). Figure 4.4 shows thestandards for different emissions at each level.
Figure 4.4: California LEV Vehicle Classification (platinum.matthey.com, 2004 [41])
The 1998 follow-up to the LEV program, called LEV-II, created stronger regulations for the fourexisting categories, as well as creating two new ones: super-ultra-low emissions vehicle (SULEV),and partial-zero emissions vehicle (PZEV). This new system expected light trucks, including SUVs,to meet the same emissions standards as passenger vehicles, placing a burden on the auto industry(platinum.matthey.com, 2004 [41]). LEV-II standards planned to go into effect by 2004, andoutlined subsequent tightening of emissions through 2016.
4.3 Emissions of Hybrid Gasoline-Electric and Fuel Cell Ve-
hiclesAlthough the effect of the transition to fuel cell vehicles on carbon dioxide emissions was alreadystudied in Section 3.6, it is also useful to look at how the transition affects other pollutants emittedby cars, such as carbon monoxide (CO), nitrogen oxides (NOx), and volatile organic compounds(VOC). However, a detailed study of long-term emissions controls is outside the scope of this paper.
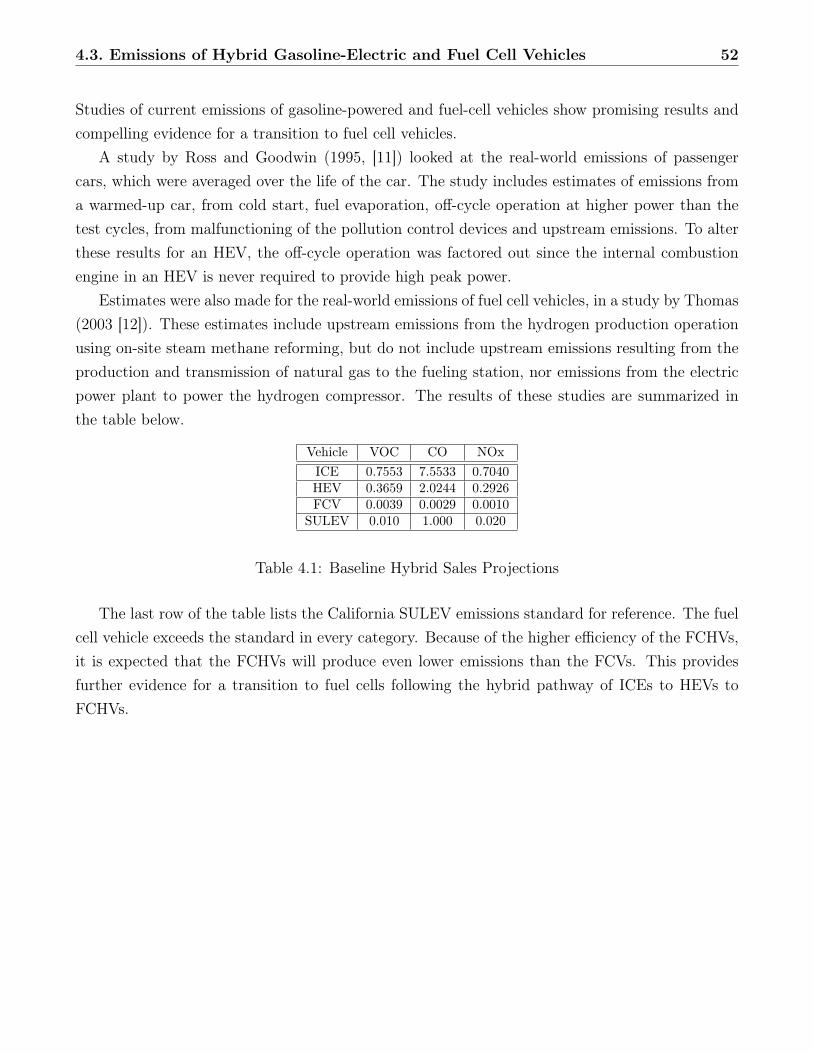
4.3. Emissions of Hybrid Gasoline-Electric and Fuel Cell Vehicles 52
Studies of current emissions of gasoline-powered and fuel-cell vehicles show promising results andcompelling evidence for a transition to fuel cell vehicles.
A study by Ross and Goodwin (1995, [11]) looked at the real-world emissions of passengercars, which were averaged over the life of the car. The study includes estimates of emissions froma warmed-up car, from cold start, fuel evaporation, off-cycle operation at higher power than thetest cycles, from malfunctioning of the pollution control devices and upstream emissions. To alterthese results for an HEV, the off-cycle operation was factored out since the internal combustionengine in an HEV is never required to provide high peak power.
Estimates were also made for the real-world emissions of fuel cell vehicles, in a study by Thomas(2003 [12]). These estimates include upstream emissions from the hydrogen production operationusing on-site steam methane reforming, but do not include upstream emissions resulting from theproduction and transmission of natural gas to the fueling station, nor emissions from the electricpower plant to power the hydrogen compressor. The results of these studies are summarized inthe table below.
Vehicle VOC CO NOxICE 0.7553 7.5533 0.7040HEV 0.3659 2.0244 0.2926FCV 0.0039 0.0029 0.0010
SULEV 0.010 1.000 0.020
Table 4.1: Baseline Hybrid Sales Projections
The last row of the table lists the California SULEV emissions standard for reference. The fuelcell vehicle exceeds the standard in every category. Because of the higher efficiency of the FCHVs,it is expected that the FCHVs will produce even lower emissions than the FCVs. This providesfurther evidence for a transition to fuel cells following the hybrid pathway of ICEs to HEVs toFCHVs.
Chapter 5
Government Policy Analysis
5.1 History of government involvement in automobile tran-
sitions
5.1.1 The Fuel Injection Transition
The US government influences the automobile industry mainly through the use of emission control
and tax policies. Its involvement was first made visible when Congress passed the Air Pollution
Control Act of 1955, the first federal legislation of its kind. The Clean Air Act later succeeded the
Air Pollution Control Act in 1963. It intended to improve, strengthen, and accelerate programs for
the prevention and abatement of air pollution that first recognized the dangers of motor vehicle
exhaust. With $95 million in granted funding, the legislature triggered a series of ongoing research,
investigations, surveys and experiments to pollution control (The American Meteorological Society,
2004 [36]).
A major amendment to the Clean Air Act was passed in 1970. It was the first in a series of
tightened automobile emission controls that forced the U.S. automakers to move from carburetors
to fuel injection engines from the early-1970s to the mid-1980s:
• 1970 – A major revision of the Clean Air Act created the first set of emission standards for
automobile to control the amount of CO, volatile organic compounds, and nitrogen oxides.
At the time it was impossible for carburetors to meet these standards so automakers were
forced to adopt to fuel injected engines.
53
5.1. History of government involvement in automobile transitions 54
• 1977 – Congress tightened standards for nitrogen oxide emissions for passenger vehicles.
• 1979 – New standards were extended to light trucks.
• 1988 – New standards were extended to heavy trucks.
(The US Environmental Protection Agency, 1999)
As a result, most domestic automakers completed the transition from the electromechanical
carburetors to fuel injection by the mid-1980s.
There are many similarities between the fuel injection transition and the hydrogen transition
such as technical difficulties and government support, but unfortunately we cannot make direct
comparisons between the two. The fuel injection transition took place when the new technology
had already been successfully adopted throughout Europe and clearly showed its advantages and
benefit. The fuel cell technology is still too immature for the government to force a similar
transition. This is why the Department of Energy set 2015 as its earliest target decision date
in its latest roadmap for the hydrogen transition (DOE, 2004 [61]).
A more suitable comparison could be made to the current transition to HEV technology. If
the government keeps tightening the emissions standards the current ICE engines will be hard
pressed to meet future regulations. Furthermore, the HEV technology clearly shows that it is
highly feasible and continues to produce better efficiency and performance, and lower emissions.
The government, therefore, needs to balance its short term policies on helping both HEVs and
FCVs.
5.1.2 The Hybrid Electric Vehicle Transition
The U.S. government has extended very limited additional support for HEV since its introduction
in 2000 mainly due to resistance from the domestic auto industry. The federal emissions standards
are still too relaxed to force a HEV transition and a $2,000 tax deduction initiated in 2004 is set
to expire in 2006. The state and local governments, on the other hand, have put much more effort
into the promotion of the HEVs.
California is the most actively involved state with HEVs. On September 23, 2004 California
state governor Arnold Schwarzenegger signed a measure granting drivers of hybrid vehicles access
5.1. History of government involvement in automobile transitions 55
to freeway carpool lanes (Oakland Tribune, 2004 [55]). The city of Los Angeles started a six month
free parking program to all hybrid vehicles on Oct 1, 2004 and the city of San Jose also offers free
street parking for all hybrid owners who purchased their cars within the city. These policy changes
have led to long waiting lists for perspective HEV buyers in California. Other states have also
offered similar promotions.
Government support may not be critical for the HEV transition anymore due to hybrids growing
popularity and support. The transition, after all, is not as a big step forward as it is for a hydrogen
transition. On the other hand, there is a chance that the fast market penetration of today’s HEVs
would falter if the government withdrew its support. Such government policy change has highly
unpredictable market impacts and may require further research and studies. The U.S. government
has much more to do, however, in meeting the challenges faced by the current fuel cell technology
before a hydrogen transition could fully take place.
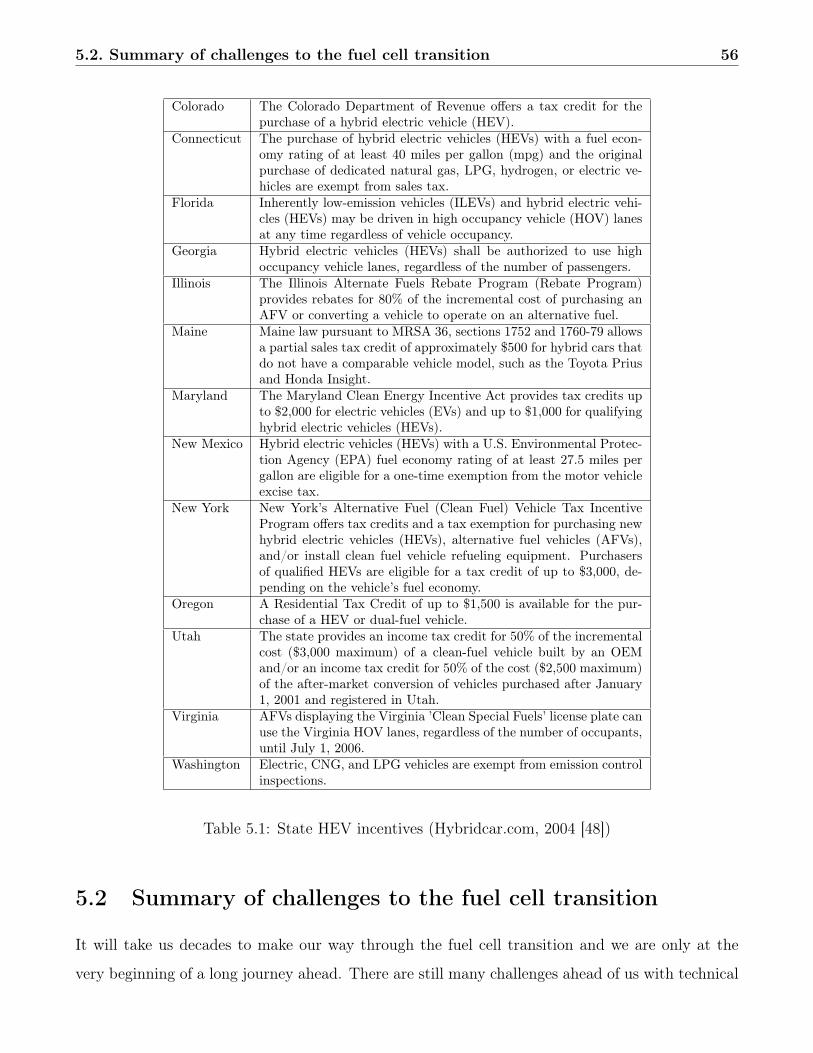
5.2. Summary of challenges to the fuel cell transition 56
Colorado The Colorado Department of Revenue offers a tax credit for thepurchase of a hybrid electric vehicle (HEV).
Connecticut The purchase of hybrid electric vehicles (HEVs) with a fuel econ-omy rating of at least 40 miles per gallon (mpg) and the originalpurchase of dedicated natural gas, LPG, hydrogen, or electric ve-hicles are exempt from sales tax.
Florida Inherently low-emission vehicles (ILEVs) and hybrid electric vehi-cles (HEVs) may be driven in high occupancy vehicle (HOV) lanesat any time regardless of vehicle occupancy.
Georgia Hybrid electric vehicles (HEVs) shall be authorized to use highoccupancy vehicle lanes, regardless of the number of passengers.
Illinois The Illinois Alternate Fuels Rebate Program (Rebate Program)provides rebates for 80% of the incremental cost of purchasing anAFV or converting a vehicle to operate on an alternative fuel.
Maine Maine law pursuant to MRSA 36, sections 1752 and 1760-79 allowsa partial sales tax credit of approximately $500 for hybrid cars thatdo not have a comparable vehicle model, such as the Toyota Priusand Honda Insight.
Maryland The Maryland Clean Energy Incentive Act provides tax credits upto $2,000 for electric vehicles (EVs) and up to $1,000 for qualifyinghybrid electric vehicles (HEVs).
New Mexico Hybrid electric vehicles (HEVs) with a U.S. Environmental Protec-tion Agency (EPA) fuel economy rating of at least 27.5 miles pergallon are eligible for a one-time exemption from the motor vehicleexcise tax.
New York New York’s Alternative Fuel (Clean Fuel) Vehicle Tax IncentiveProgram offers tax credits and a tax exemption for purchasing newhybrid electric vehicles (HEVs), alternative fuel vehicles (AFVs),and/or install clean fuel vehicle refueling equipment. Purchasersof qualified HEVs are eligible for a tax credit of up to $3,000, de-pending on the vehicle’s fuel economy.
Oregon A Residential Tax Credit of up to $1,500 is available for the pur-chase of a HEV or dual-fuel vehicle.
Utah The state provides an income tax credit for 50% of the incrementalcost ($3,000 maximum) of a clean-fuel vehicle built by an OEMand/or an income tax credit for 50% of the cost ($2,500 maximum)of the after-market conversion of vehicles purchased after January1, 2001 and registered in Utah.
Virginia AFVs displaying the Virginia ’Clean Special Fuels’ license plate canuse the Virginia HOV lanes, regardless of the number of occupants,until July 1, 2006.
Washington Electric, CNG, and LPG vehicles are exempt from emission controlinspections.
Table 5.1: State HEV incentives (Hybridcar.com, 2004 [48])
5.2 Summary of challenges to the fuel cell transition
It will take us decades to make our way through the fuel cell transition and we are only at the
very beginning of a long journey ahead. There are still many challenges ahead of us with technical
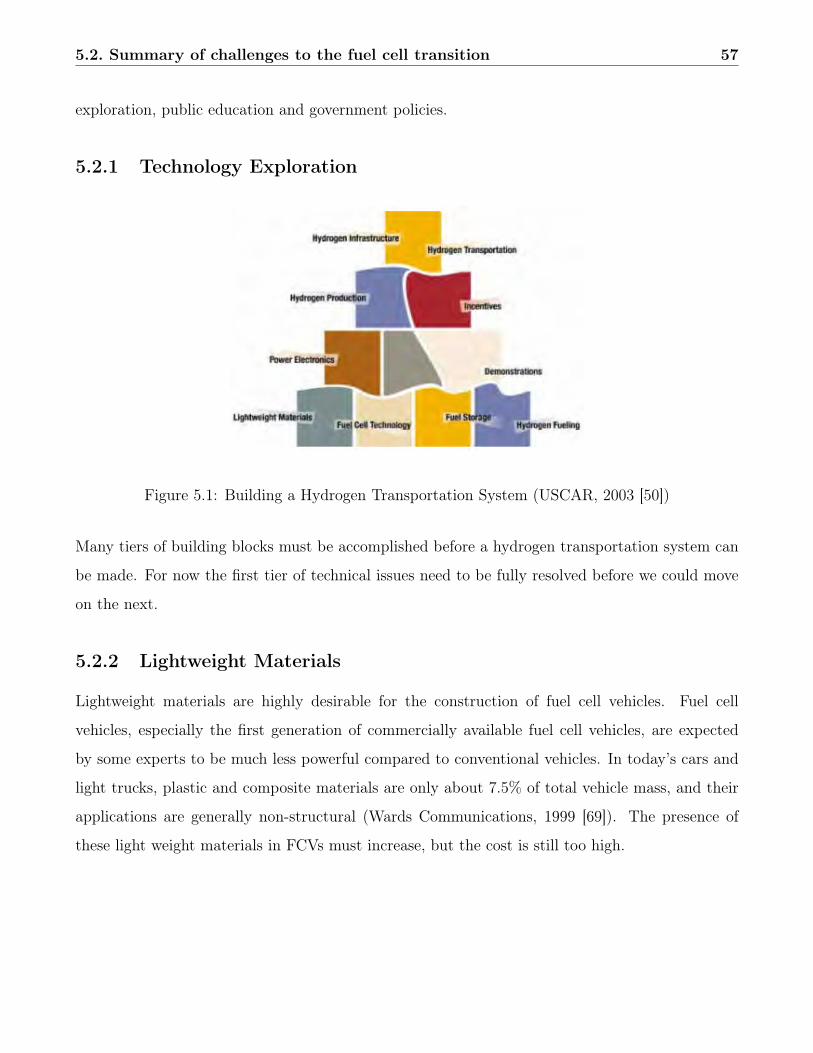
5.2. Summary of challenges to the fuel cell transition 57
exploration, public education and government policies.
5.2.1 Technology Exploration
Figure 5.1: Building a Hydrogen Transportation System (USCAR, 2003 [50])
Many tiers of building blocks must be accomplished before a hydrogen transportation system can
be made. For now the first tier of technical issues need to be fully resolved before we could move
on the next.
5.2.2 Lightweight Materials
Lightweight materials are highly desirable for the construction of fuel cell vehicles. Fuel cell
vehicles, especially the first generation of commercially available fuel cell vehicles, are expected
by some experts to be much less powerful compared to conventional vehicles. In today’s cars and
light trucks, plastic and composite materials are only about 7.5% of total vehicle mass, and their
applications are generally non-structural (Wards Communications, 1999 [69]). The presence of
these light weight materials in FCVs must increase, but the cost is still too high.
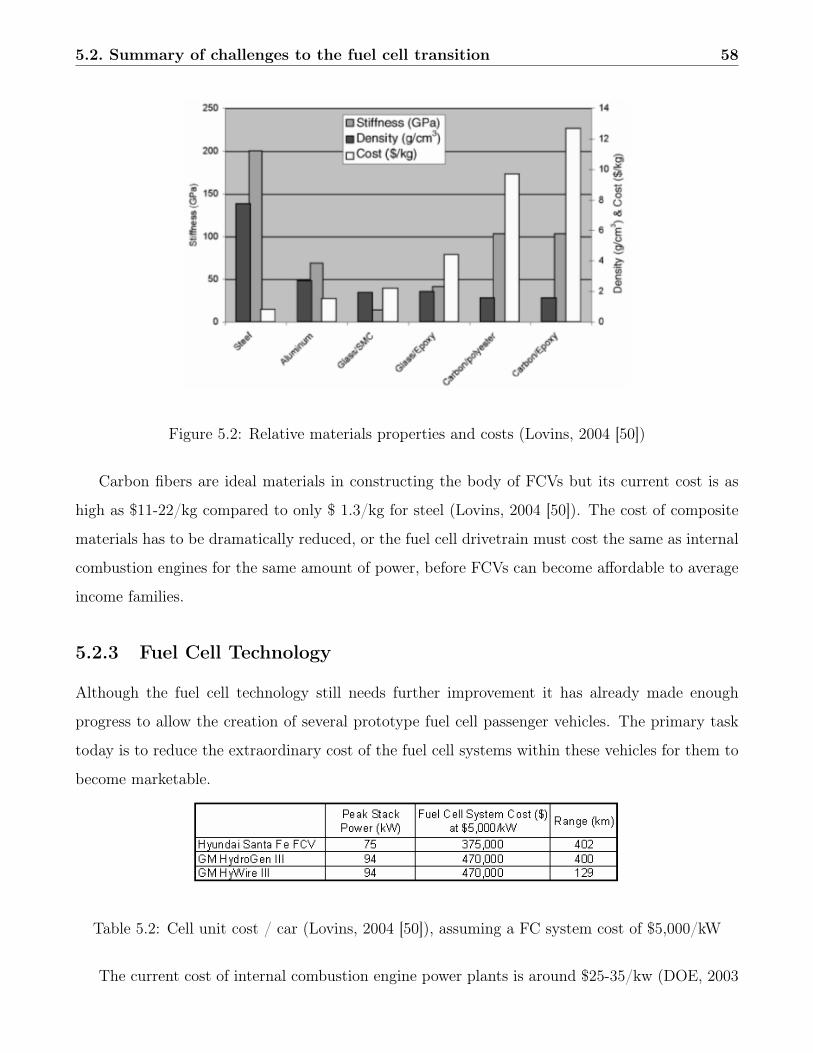
5.2. Summary of challenges to the fuel cell transition 58
Figure 5.2: Relative materials properties and costs (Lovins, 2004 [50])
Carbon fibers are ideal materials in constructing the body of FCVs but its current cost is as
high as $11-22/kg compared to only $ 1.3/kg for steel (Lovins, 2004 [50]). The cost of composite
materials has to be dramatically reduced, or the fuel cell drivetrain must cost the same as internal
combustion engines for the same amount of power, before FCVs can become affordable to average
income families.
5.2.3 Fuel Cell Technology
Although the fuel cell technology still needs further improvement it has already made enough
progress to allow the creation of several prototype fuel cell passenger vehicles. The primary task
today is to reduce the extraordinary cost of the fuel cell systems within these vehicles for them to
become marketable.
Table 5.2: Cell unit cost / car (Lovins, 2004 [50]), assuming a FC system cost of $5,000/kW
The current cost of internal combustion engine power plants is around $25-35/kw (DOE, 2003
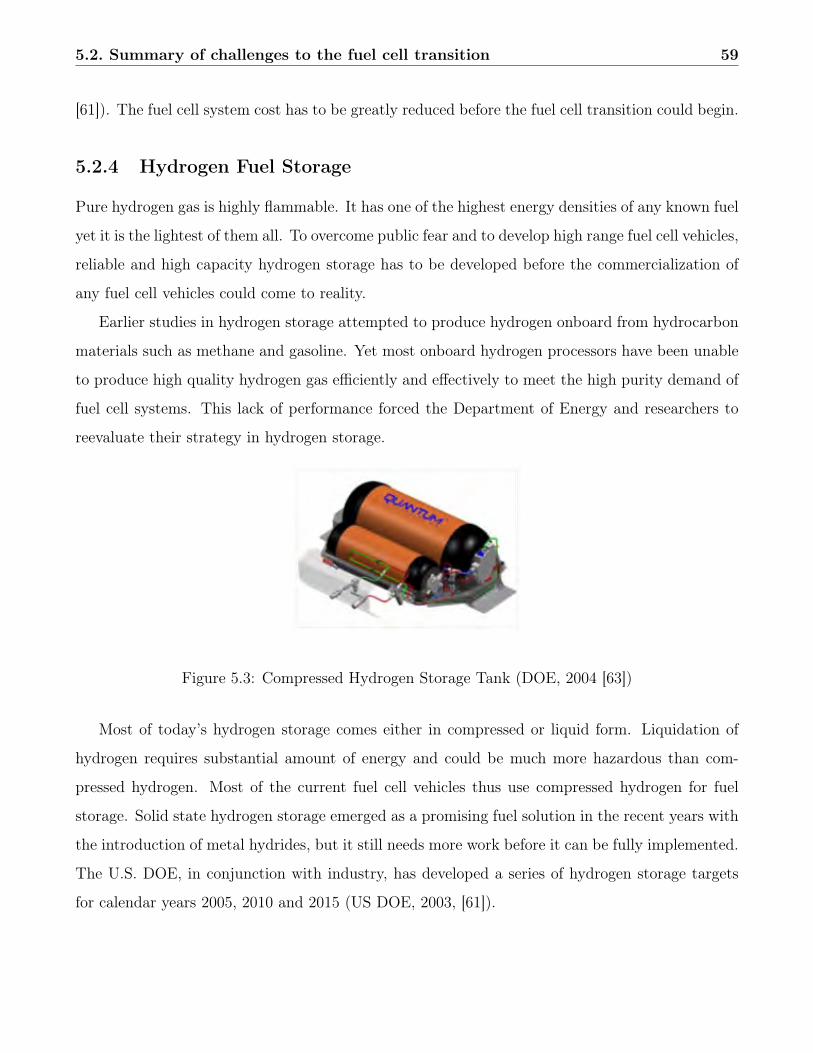
5.2. Summary of challenges to the fuel cell transition 59
[61]). The fuel cell system cost has to be greatly reduced before the fuel cell transition could begin.
5.2.4 Hydrogen Fuel Storage
Pure hydrogen gas is highly flammable. It has one of the highest energy densities of any known fuel
yet it is the lightest of them all. To overcome public fear and to develop high range fuel cell vehicles,
reliable and high capacity hydrogen storage has to be developed before the commercialization of
any fuel cell vehicles could come to reality.
Earlier studies in hydrogen storage attempted to produce hydrogen onboard from hydrocarbon
materials such as methane and gasoline. Yet most onboard hydrogen processors have been unable
to produce high quality hydrogen gas efficiently and effectively to meet the high purity demand of
fuel cell systems. This lack of performance forced the Department of Energy and researchers to
reevaluate their strategy in hydrogen storage.
Figure 5.3: Compressed Hydrogen Storage Tank (DOE, 2004 [63])
Most of today’s hydrogen storage comes either in compressed or liquid form. Liquidation of
hydrogen requires substantial amount of energy and could be much more hazardous than com-
pressed hydrogen. Most of the current fuel cell vehicles thus use compressed hydrogen for fuel
storage. Solid state hydrogen storage emerged as a promising fuel solution in the recent years with
the introduction of metal hydrides, but it still needs more work before it can be fully implemented.
The U.S. DOE, in conjunction with industry, has developed a series of hydrogen storage targets
for calendar years 2005, 2010 and 2015 (US DOE, 2003, [61]).
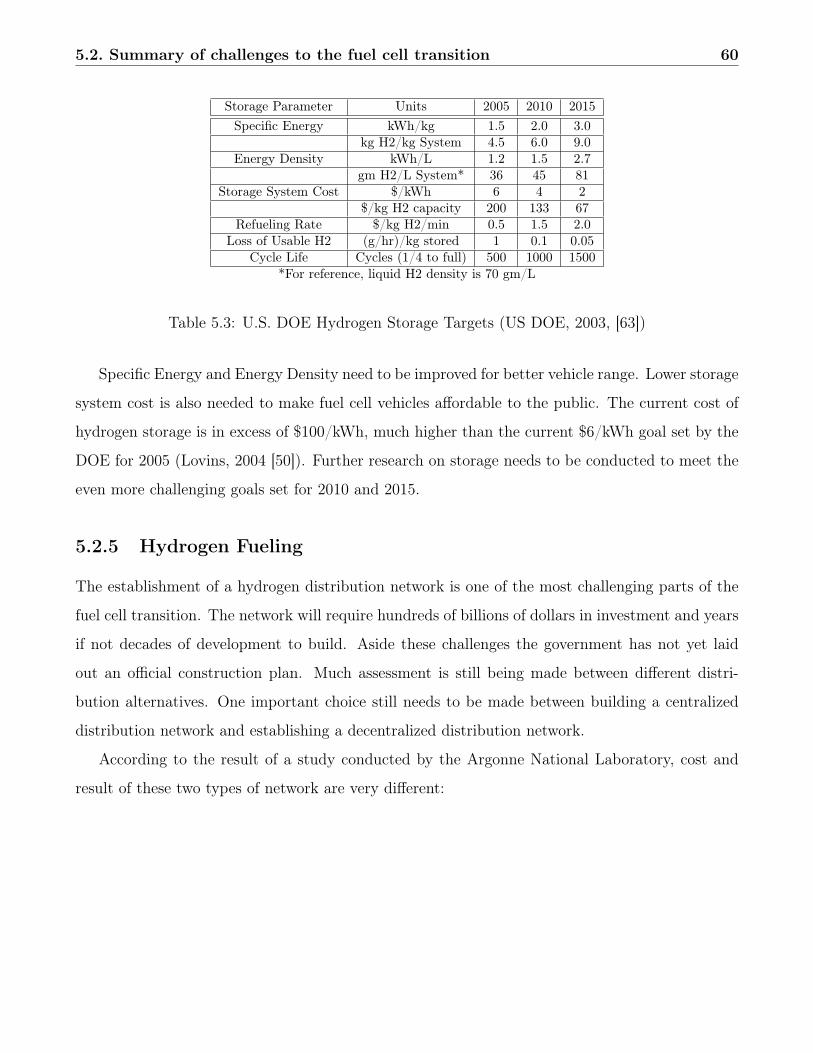
5.2. Summary of challenges to the fuel cell transition 60
Storage Parameter Units 2005 2010 2015Specific Energy kWh/kg 1.5 2.0 3.0
kg H2/kg System 4.5 6.0 9.0Energy Density kWh/L 1.2 1.5 2.7
gm H2/L System* 36 45 81Storage System Cost $/kWh 6 4 2
$/kg H2 capacity 200 133 67Refueling Rate $/kg H2/min 0.5 1.5 2.0
Loss of Usable H2 (g/hr)/kg stored 1 0.1 0.05Cycle Life Cycles (1/4 to full) 500 1000 1500
*For reference, liquid H2 density is 70 gm/L
Table 5.3: U.S. DOE Hydrogen Storage Targets (US DOE, 2003, [63])
Specific Energy and Energy Density need to be improved for better vehicle range. Lower storage
system cost is also needed to make fuel cell vehicles affordable to the public. The current cost of
hydrogen storage is in excess of $100/kWh, much higher than the current $6/kWh goal set by the
DOE for 2005 (Lovins, 2004 [50]). Further research on storage needs to be conducted to meet the
even more challenging goals set for 2010 and 2015.
5.2.5 Hydrogen Fueling
The establishment of a hydrogen distribution network is one of the most challenging parts of the
fuel cell transition. The network will require hundreds of billions of dollars in investment and years
if not decades of development to build. Aside these challenges the government has not yet laid
out an official construction plan. Much assessment is still being made between different distri-
bution alternatives. One important choice still needs to be made between building a centralized
distribution network and establishing a decentralized distribution network.
According to the result of a study conducted by the Argonne National Laboratory, cost and
result of these two types of network are very different:
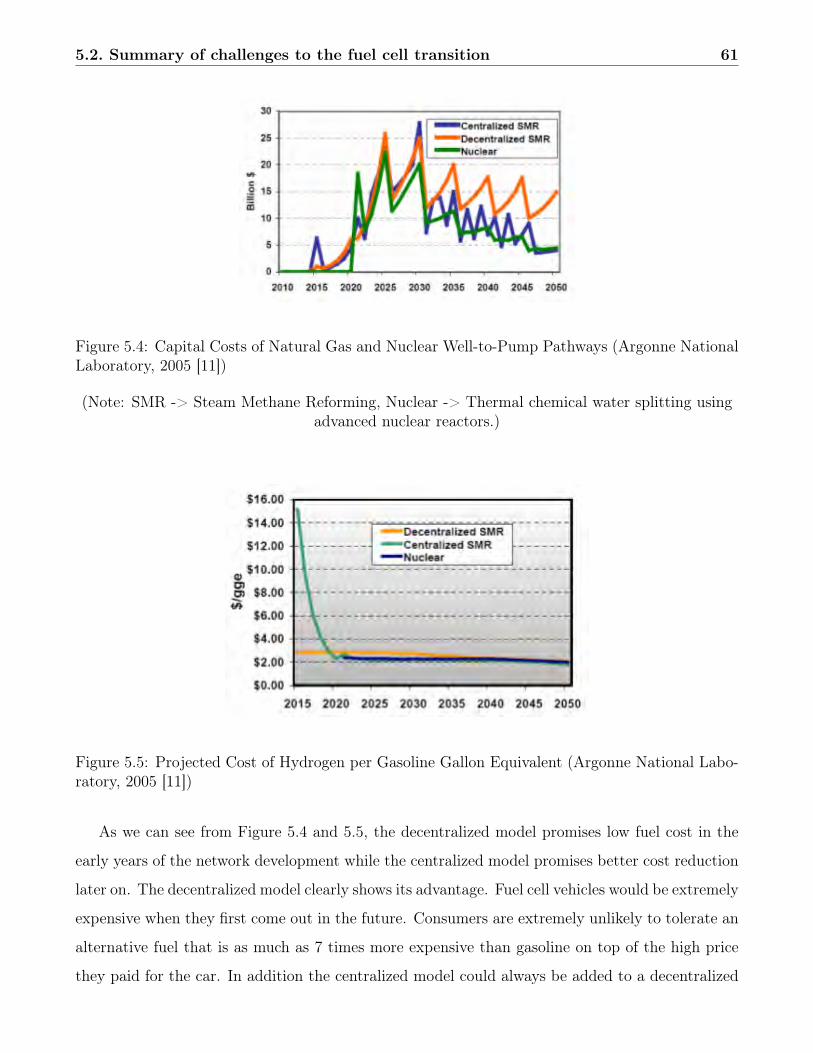
5.2. Summary of challenges to the fuel cell transition 61
Figure 5.4: Capital Costs of Natural Gas and Nuclear Well-to-Pump Pathways (Argonne NationalLaboratory, 2005 [11])
(Note: SMR -> Steam Methane Reforming, Nuclear -> Thermal chemical water splitting usingadvanced nuclear reactors.)
Figure 5.5: Projected Cost of Hydrogen per Gasoline Gallon Equivalent (Argonne National Labo-ratory, 2005 [11])
As we can see from Figure 5.4 and 5.5, the decentralized model promises low fuel cost in the
early years of the network development while the centralized model promises better cost reduction
later on. The decentralized model clearly shows its advantage. Fuel cell vehicles would be extremely
expensive when they first come out in the future. Consumers are extremely unlikely to tolerate an
alternative fuel that is as much as 7 times more expensive than gasoline on top of the high price
they paid for the car. In addition the centralized model could always be added to a decentralized
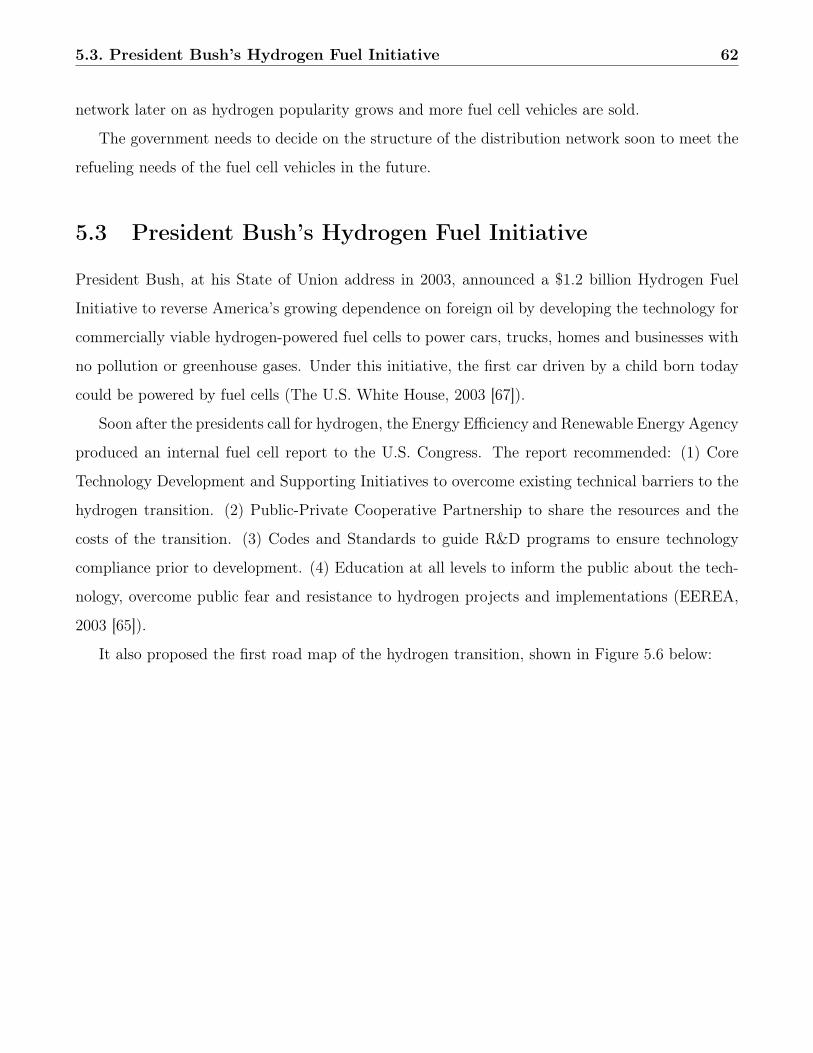
5.3. President Bush’s Hydrogen Fuel Initiative 62
network later on as hydrogen popularity grows and more fuel cell vehicles are sold.
The government needs to decide on the structure of the distribution network soon to meet the
refueling needs of the fuel cell vehicles in the future.
5.3 President Bush’s Hydrogen Fuel Initiative
President Bush, at his State of Union address in 2003, announced a $1.2 billion Hydrogen Fuel
Initiative to reverse America’s growing dependence on foreign oil by developing the technology for
commercially viable hydrogen-powered fuel cells to power cars, trucks, homes and businesses with
no pollution or greenhouse gases. Under this initiative, the first car driven by a child born today
could be powered by fuel cells (The U.S. White House, 2003 [67]).
Soon after the presidents call for hydrogen, the Energy Efficiency and Renewable Energy Agency
produced an internal fuel cell report to the U.S. Congress. The report recommended: (1) Core
Technology Development and Supporting Initiatives to overcome existing technical barriers to the
hydrogen transition. (2) Public-Private Cooperative Partnership to share the resources and the
costs of the transition. (3) Codes and Standards to guide R&D programs to ensure technology
compliance prior to development. (4) Education at all levels to inform the public about the tech-
nology, overcome public fear and resistance to hydrogen projects and implementations (EEREA,
2003 [65]).
It also proposed the first road map of the hydrogen transition, shown in Figure 5.6 below:
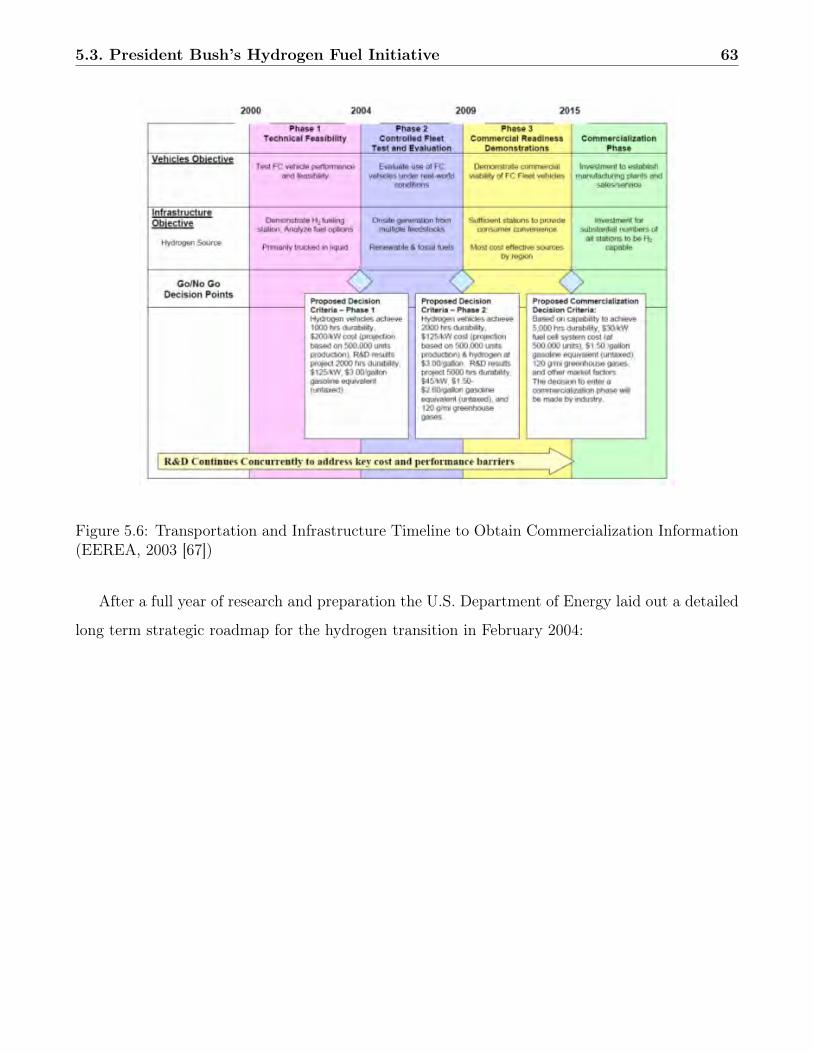
5.3. President Bush’s Hydrogen Fuel Initiative 63
Figure 5.6: Transportation and Infrastructure Timeline to Obtain Commercialization Information(EEREA, 2003 [67])
After a full year of research and preparation the U.S. Department of Energy laid out a detailed
long term strategic roadmap for the hydrogen transition in February 2004:
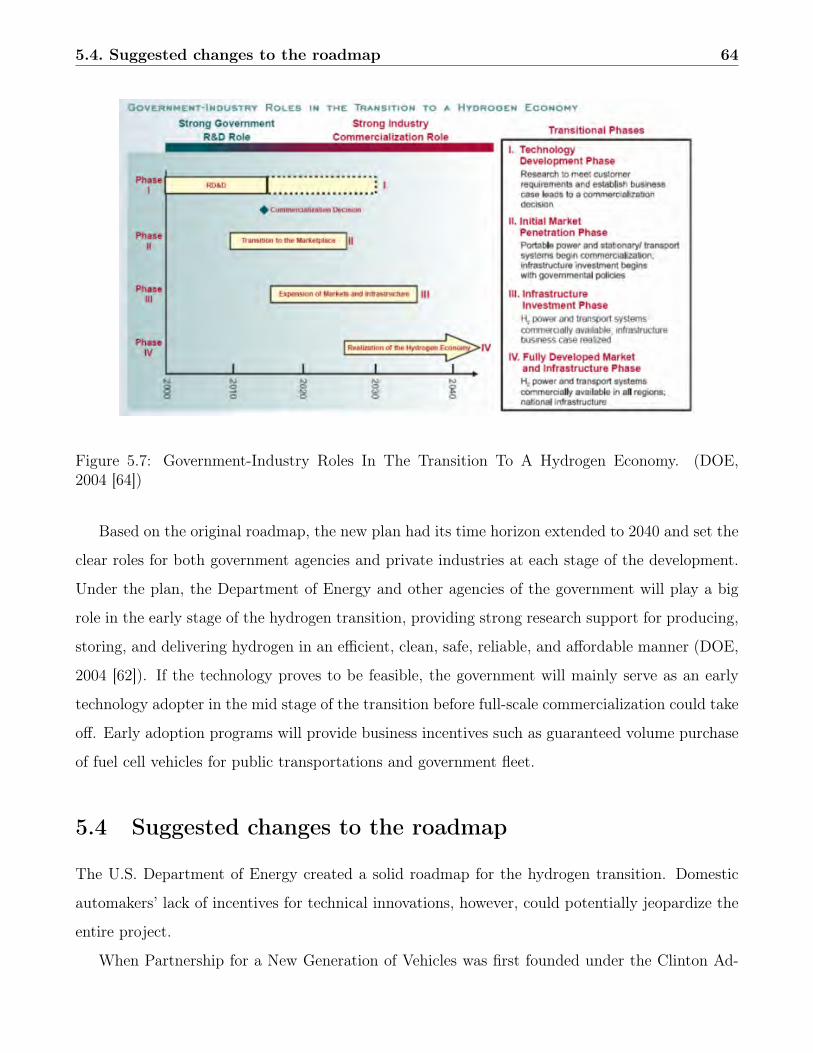
5.4. Suggested changes to the roadmap 64
Figure 5.7: Government-Industry Roles In The Transition To A Hydrogen Economy. (DOE,2004 [64])
Based on the original roadmap, the new plan had its time horizon extended to 2040 and set the
clear roles for both government agencies and private industries at each stage of the development.
Under the plan, the Department of Energy and other agencies of the government will play a big
role in the early stage of the hydrogen transition, providing strong research support for producing,
storing, and delivering hydrogen in an efficient, clean, safe, reliable, and affordable manner (DOE,
2004 [62]). If the technology proves to be feasible, the government will mainly serve as an early
technology adopter in the mid stage of the transition before full-scale commercialization could take
off. Early adoption programs will provide business incentives such as guaranteed volume purchase
of fuel cell vehicles for public transportations and government fleet.
5.4 Suggested changes to the roadmap
The U.S. Department of Energy created a solid roadmap for the hydrogen transition. Domestic
automakers’ lack of incentives for technical innovations, however, could potentially jeopardize the
entire project.
When Partnership for a New Generation of Vehicles was first founded under the Clinton Ad-
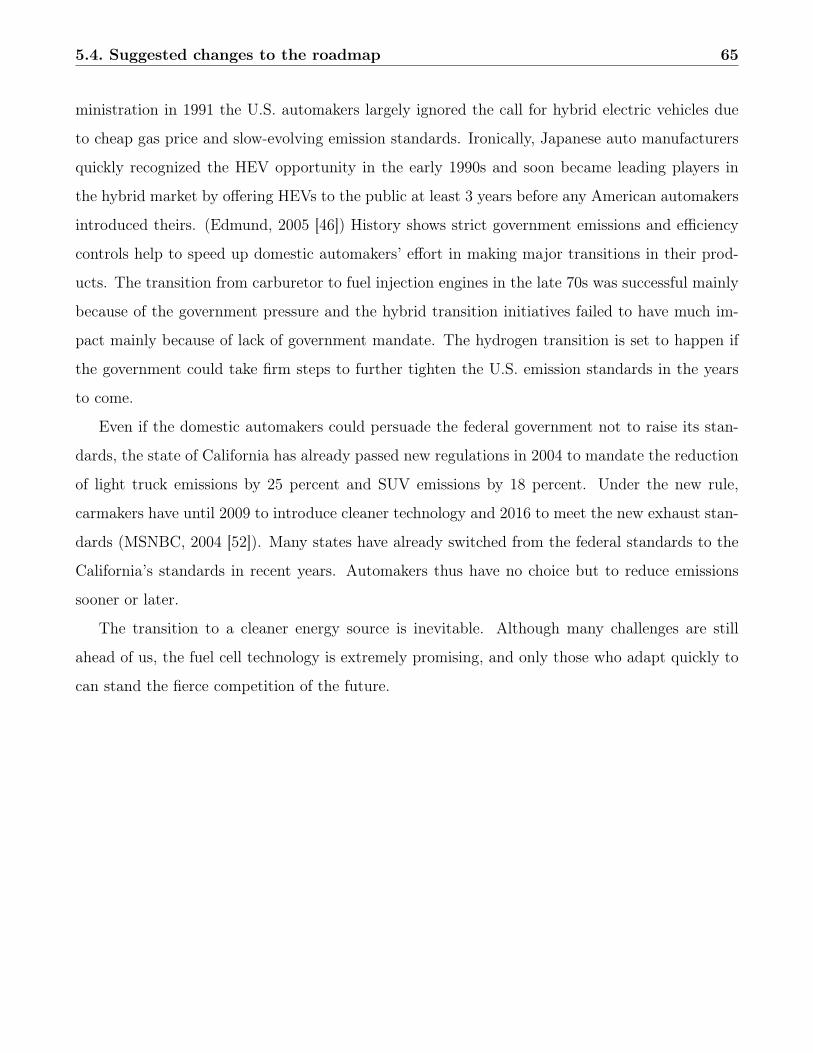
5.4. Suggested changes to the roadmap 65
ministration in 1991 the U.S. automakers largely ignored the call for hybrid electric vehicles due
to cheap gas price and slow-evolving emission standards. Ironically, Japanese auto manufacturers
quickly recognized the HEV opportunity in the early 1990s and soon became leading players in
the hybrid market by offering HEVs to the public at least 3 years before any American automakers
introduced theirs. (Edmund, 2005 [46]) History shows strict government emissions and efficiency
controls help to speed up domestic automakers’ effort in making major transitions in their prod-
ucts. The transition from carburetor to fuel injection engines in the late 70s was successful mainly
because of the government pressure and the hybrid transition initiatives failed to have much im-
pact mainly because of lack of government mandate. The hydrogen transition is set to happen if
the government could take firm steps to further tighten the U.S. emission standards in the years
to come.
Even if the domestic automakers could persuade the federal government not to raise its stan-
dards, the state of California has already passed new regulations in 2004 to mandate the reduction
of light truck emissions by 25 percent and SUV emissions by 18 percent. Under the new rule,
carmakers have until 2009 to introduce cleaner technology and 2016 to meet the new exhaust stan-
dards (MSNBC, 2004 [52]). Many states have already switched from the federal standards to the
California’s standards in recent years. Automakers thus have no choice but to reduce emissions
sooner or later.
The transition to a cleaner energy source is inevitable. Although many challenges are still
ahead of us, the fuel cell technology is extremely promising, and only those who adapt quickly to
can stand the fierce competition of the future.

Part II
Heavy-Duty Vehicles
66

Chapter 6
Introduction
For the purpose of this report, heavy-duty vehicles are defined as vehicles that have more than
two axles, including transit buses, combination trucks (such as tractor trailers), and single trucks
with six or more wheels (such as Class 8 trucks and municipal waste disposal vehicles). This class
of vehicles, which uses less than 20% of total transportation energy demand in the United States,
accounts for a significantly high percentage the total amount of nitrous oxides and particulates
emitted by the U.S. transportation sector each year (Gordon, 1991 [149], Farrell et al., 2003 [196]).
For this reason, the use of alternative fuels is being investigated, particularly in the area of transit
buses. Over thirteen percent of all U.S. transit buses are currently powered by alternative fuels
(APTA, 2004 [75]). Transit buses are a great platform for alternative fuel demonstration since they
run relatively short routes, the majority are part of a fleet, and they are well-maintained (Jollie,
2004 [159]).
Of the numerous types of alternative fuels, hydrogen is believed by many experts to potentially
be the lowest cost option (Ogden, 2000 [173]). While a transition to hydrogen fuel is not expected
to occur quickly, car manufacturers expect the first hydrogen fuel-cell powered vehicles to enter
showroom by 2010, and many scenarios predict the mainstream use of low-emission and hydrogen
fuel-cell vehicles by the year 2050 (Van der Veer, 2003 [189]). We will assess the potential for
development of hydrogen-powered fuel cell heavy-duty vehicles, paying particular attention to the
transit bus as a transition platform for this technology.
Researchers are embracing the fuel cell as the keystone for advancing hydrogen-based technol-
ogy. Fuel cells operate at a higher efficiency than their internal combustion engine counterparts
67
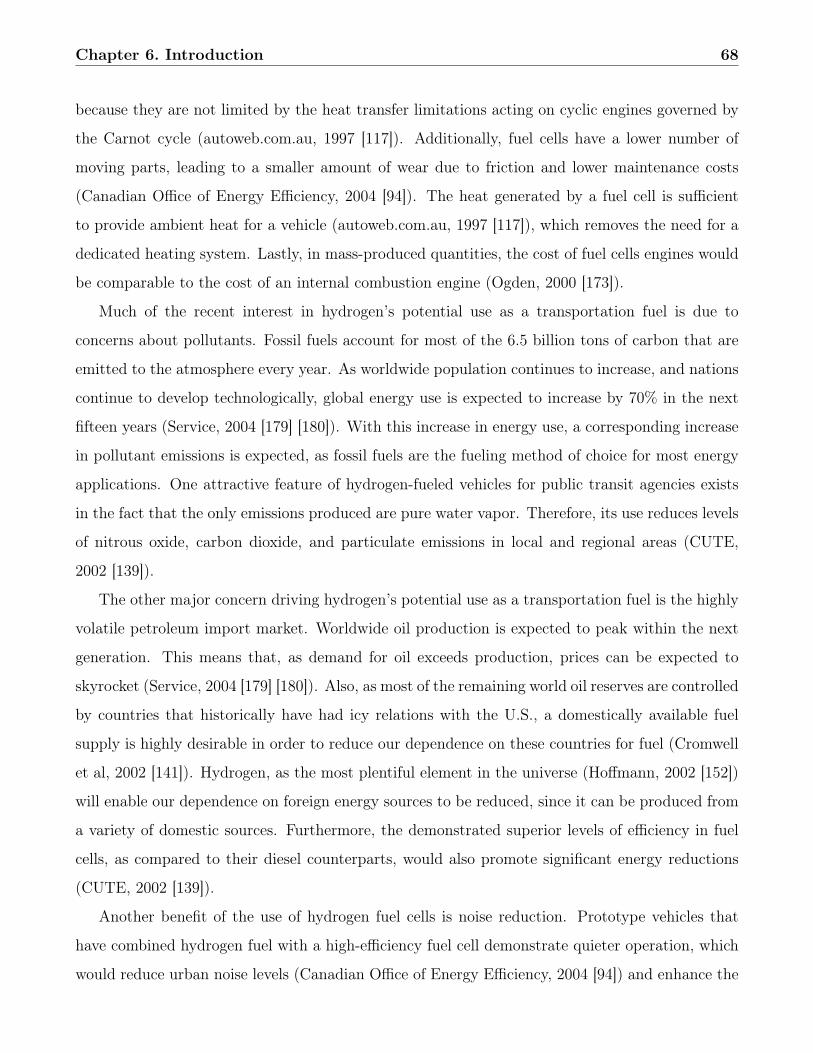
Chapter 6. Introduction 68
because they are not limited by the heat transfer limitations acting on cyclic engines governed by
the Carnot cycle (autoweb.com.au, 1997 [117]). Additionally, fuel cells have a lower number of
moving parts, leading to a smaller amount of wear due to friction and lower maintenance costs
(Canadian Office of Energy Efficiency, 2004 [94]). The heat generated by a fuel cell is sufficient
to provide ambient heat for a vehicle (autoweb.com.au, 1997 [117]), which removes the need for a
dedicated heating system. Lastly, in mass-produced quantities, the cost of fuel cells engines would
be comparable to the cost of an internal combustion engine (Ogden, 2000 [173]).
Much of the recent interest in hydrogen’s potential use as a transportation fuel is due to
concerns about pollutants. Fossil fuels account for most of the 6.5 billion tons of carbon that are
emitted to the atmosphere every year. As worldwide population continues to increase, and nations
continue to develop technologically, global energy use is expected to increase by 70% in the next
fifteen years (Service, 2004 [179] [180]). With this increase in energy use, a corresponding increase
in pollutant emissions is expected, as fossil fuels are the fueling method of choice for most energy
applications. One attractive feature of hydrogen-fueled vehicles for public transit agencies exists
in the fact that the only emissions produced are pure water vapor. Therefore, its use reduces levels
of nitrous oxide, carbon dioxide, and particulate emissions in local and regional areas (CUTE,
2002 [139]).
The other major concern driving hydrogen’s potential use as a transportation fuel is the highly
volatile petroleum import market. Worldwide oil production is expected to peak within the next
generation. This means that, as demand for oil exceeds production, prices can be expected to
skyrocket (Service, 2004 [179] [180]). Also, as most of the remaining world oil reserves are controlled
by countries that historically have had icy relations with the U.S., a domestically available fuel
supply is highly desirable in order to reduce our dependence on these countries for fuel (Cromwell
et al, 2002 [141]). Hydrogen, as the most plentiful element in the universe (Hoffmann, 2002 [152])
will enable our dependence on foreign energy sources to be reduced, since it can be produced from
a variety of domestic sources. Furthermore, the demonstrated superior levels of efficiency in fuel
cells, as compared to their diesel counterparts, would also promote significant energy reductions
(CUTE, 2002 [139]).
Another benefit of the use of hydrogen fuel cells is noise reduction. Prototype vehicles that
have combined hydrogen fuel with a high-efficiency fuel cell demonstrate quieter operation, which
would reduce urban noise levels (Canadian Office of Energy Efficiency, 2004 [94]) and enhance the
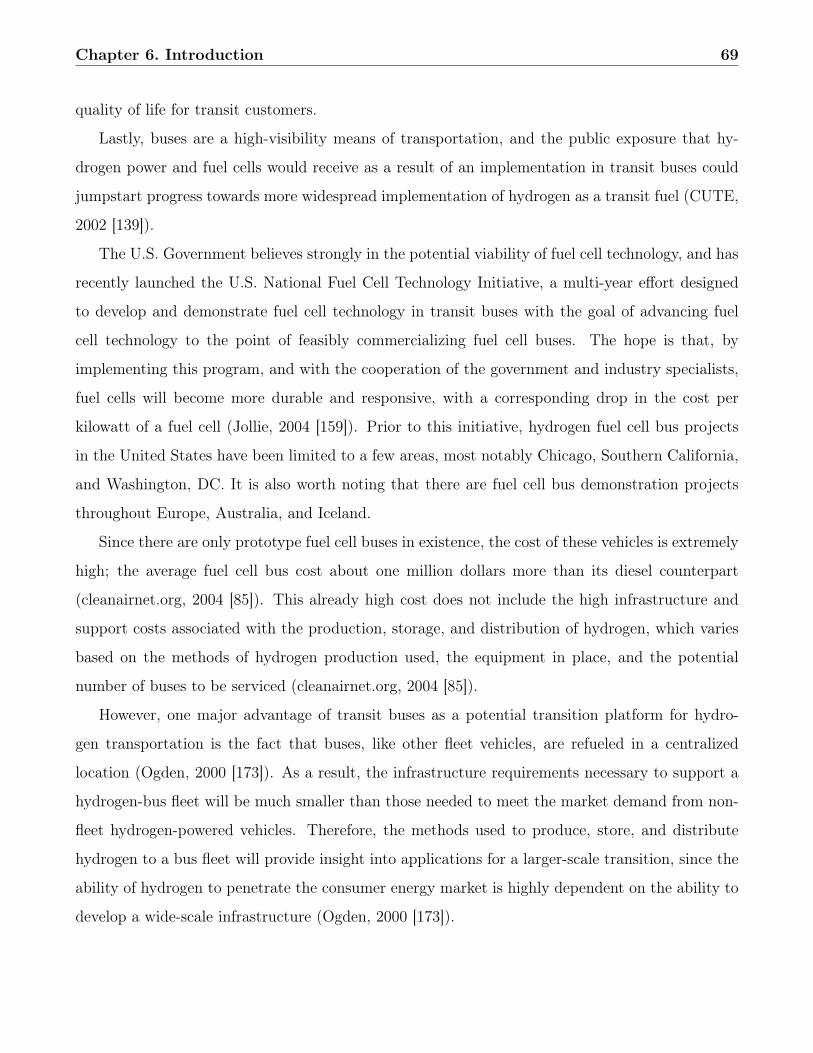
Chapter 6. Introduction 69
quality of life for transit customers.
Lastly, buses are a high-visibility means of transportation, and the public exposure that hy-
drogen power and fuel cells would receive as a result of an implementation in transit buses could
jumpstart progress towards more widespread implementation of hydrogen as a transit fuel (CUTE,
2002 [139]).
The U.S. Government believes strongly in the potential viability of fuel cell technology, and has
recently launched the U.S. National Fuel Cell Technology Initiative, a multi-year effort designed
to develop and demonstrate fuel cell technology in transit buses with the goal of advancing fuel
cell technology to the point of feasibly commercializing fuel cell buses. The hope is that, by
implementing this program, and with the cooperation of the government and industry specialists,
fuel cells will become more durable and responsive, with a corresponding drop in the cost per
kilowatt of a fuel cell (Jollie, 2004 [159]). Prior to this initiative, hydrogen fuel cell bus projects
in the United States have been limited to a few areas, most notably Chicago, Southern California,
and Washington, DC. It is also worth noting that there are fuel cell bus demonstration projects
throughout Europe, Australia, and Iceland.
Since there are only prototype fuel cell buses in existence, the cost of these vehicles is extremely
high; the average fuel cell bus cost about one million dollars more than its diesel counterpart
(cleanairnet.org, 2004 [85]). This already high cost does not include the high infrastructure and
support costs associated with the production, storage, and distribution of hydrogen, which varies
based on the methods of hydrogen production used, the equipment in place, and the potential
number of buses to be serviced (cleanairnet.org, 2004 [85]).
However, one major advantage of transit buses as a potential transition platform for hydro-
gen transportation is the fact that buses, like other fleet vehicles, are refueled in a centralized
location (Ogden, 2000 [173]). As a result, the infrastructure requirements necessary to support a
hydrogen-bus fleet will be much smaller than those needed to meet the market demand from non-
fleet hydrogen-powered vehicles. Therefore, the methods used to produce, store, and distribute
hydrogen to a bus fleet will provide insight into applications for a larger-scale transition, since the
ability of hydrogen to penetrate the consumer energy market is highly dependent on the ability to
develop a wide-scale infrastructure (Ogden, 2000 [173]).
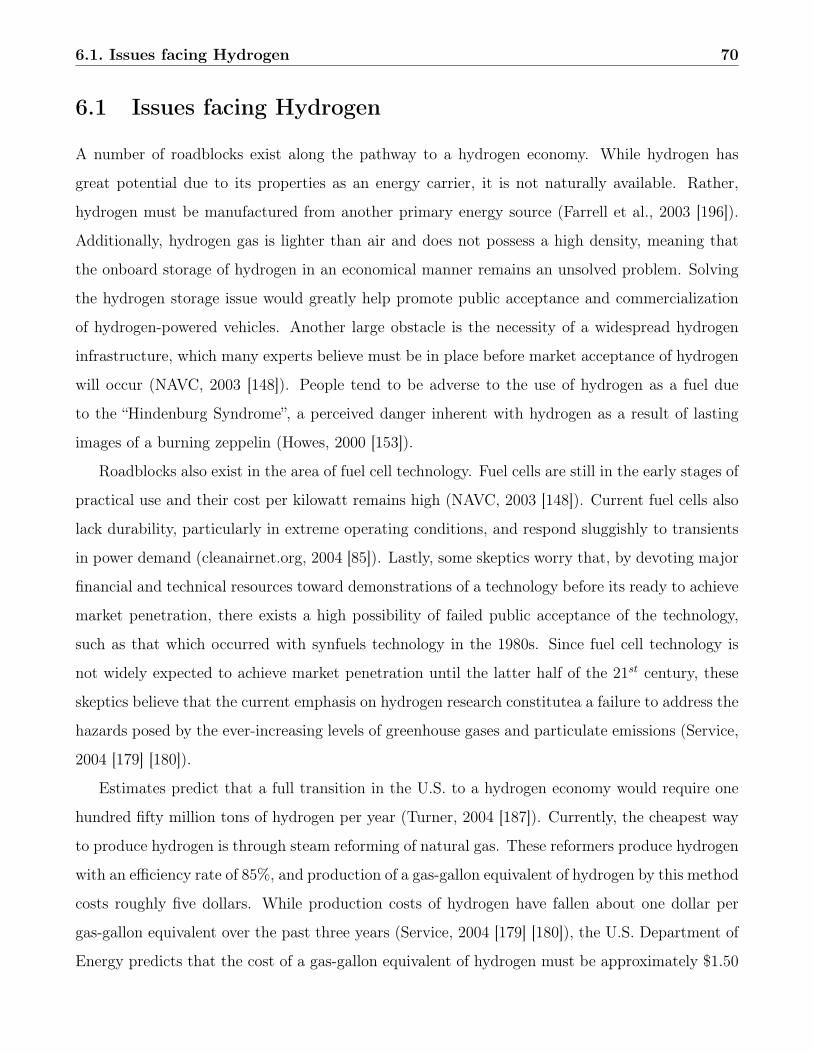
6.1. Issues facing Hydrogen 70
6.1 Issues facing Hydrogen
A number of roadblocks exist along the pathway to a hydrogen economy. While hydrogen has
great potential due to its properties as an energy carrier, it is not naturally available. Rather,
hydrogen must be manufactured from another primary energy source (Farrell et al., 2003 [196]).
Additionally, hydrogen gas is lighter than air and does not possess a high density, meaning that
the onboard storage of hydrogen in an economical manner remains an unsolved problem. Solving
the hydrogen storage issue would greatly help promote public acceptance and commercialization
of hydrogen-powered vehicles. Another large obstacle is the necessity of a widespread hydrogen
infrastructure, which many experts believe must be in place before market acceptance of hydrogen
will occur (NAVC, 2003 [148]). People tend to be adverse to the use of hydrogen as a fuel due
to the “Hindenburg Syndrome”, a perceived danger inherent with hydrogen as a result of lasting
images of a burning zeppelin (Howes, 2000 [153]).
Roadblocks also exist in the area of fuel cell technology. Fuel cells are still in the early stages of
practical use and their cost per kilowatt remains high (NAVC, 2003 [148]). Current fuel cells also
lack durability, particularly in extreme operating conditions, and respond sluggishly to transients
in power demand (cleanairnet.org, 2004 [85]). Lastly, some skeptics worry that, by devoting major
financial and technical resources toward demonstrations of a technology before its ready to achieve
market penetration, there exists a high possibility of failed public acceptance of the technology,
such as that which occurred with synfuels technology in the 1980s. Since fuel cell technology is
not widely expected to achieve market penetration until the latter half of the 21st century, these
skeptics believe that the current emphasis on hydrogen research constitutea a failure to address the
hazards posed by the ever-increasing levels of greenhouse gases and particulate emissions (Service,
2004 [179] [180]).
Estimates predict that a full transition in the U.S. to a hydrogen economy would require one
hundred fifty million tons of hydrogen per year (Turner, 2004 [187]). Currently, the cheapest way
to produce hydrogen is through steam reforming of natural gas. These reformers produce hydrogen
with an efficiency rate of 85%, and production of a gas-gallon equivalent of hydrogen by this method
costs roughly five dollars. While production costs of hydrogen have fallen about one dollar per
gas-gallon equivalent over the past three years (Service, 2004 [179] [180]), the U.S. Department of
Energy predicts that the cost of a gas-gallon equivalent of hydrogen must be approximately $1.50
6.1. Issues facing Hydrogen 71
in order to achieve market penetration (Service, 2004 [179] [180]). While this figure may be low
due to the recent increases in the cost of gasoline, it is still apparent that continued improvements
must be made in hydrogen production technology.
These advancements in hydrogen production may be possible through electrolyzer technol-
ogy. With this technology, hydrogen is produced through the electrolysis of water. Currently,
only about 4% of the hydrogen produced each year is by electrolysis (Heller, 2004 [151]). Most
of the cost of hydrogen production by electrolysis is from the cost of electricity, and as most of
the world’s electricity is produced by the burning of fossil fuels, this entire exercise may seem
counterproductive. However, economic ways to produce electricity from environmentally-friendly
sources, or to produce hydrogen from fossil fuels without releasing CO2 into the atmosphere, are
currently being researched. For example, one transit company in California is using solar power
to supplement grid energy as a source of power for its electrolyzer (Hydrogen Fuel Cell & Infras-
tructure Technologies Program, 2003 [156]). In Iceland, electricity is produced from the country’s
vast hydroelectric resources, and experiments with geothermal energy as the heat medium for
electrolysis are also underway (Sigfusson, 2003 [181]). Generating electricity from wind is another
environmentally-friendly method being considered. The European Wind Association predicts that
wind will produce about 10% of the worlds power by 2020. According to the American Wind
Energy Association, one kilowatt-hour of energy currently costs roughly three to five cents. Once
the price of wind power drops to one-and-a-half cents per kilowatt hour, experts believe that the
costs of generating hydrogen through wind-powered hydrolysis will be competitive with projected
gasoline equivalent prices (Heller, 2004 [151]). The U.S. Department of Energy also reports that
in some areas of the country, wind power prices are competitive with natural gas prices.
Another major issue facing hydrogen technology is storage. Due to hydrogen’s low density, it
would require twenty-one tanker trucks to transport the energy equivalent of one gasoline tanker
truck. Hydrogen can be liquefied to increase density, but in order for hydrogen to reach its liquid
state, it must be cooled to -253oC, and up to 30% of the energy in a volume of hydrogen would
be lost in maintaining hydrogen in this liquid state (Service, 2004 [179] [180]). Also, the low
energy density of hydrogen requires storage systems which are currently larger than their diesel
counterparts, and may translate into decreases in vehicle range and payload volume (Farrell et al.,
2003 [196]).
While hydrogen may have the greatest potential out of all the alternative-fueling methods, it

6.1. Issues facing Hydrogen 72
simultaneously poses the largest infrastructure challenge. In addition to the aforementioned pro-
duction and storage issues, cost-effective methods for distribution of hydrogen must be discovered
and implemented. Current estimates by Shell Hydrogen representatives place the initial cost of
creating an infrastructure designed to provide hydrogen to 2% of U.S. vehicles at $20 billion (Van
der Veer, 2003 [189]). The solution to the infrastructure problem may lie in the creation of small-
scale hydrogen production facilities which serve a limited area, an idea similar to the “localized
dairy farm” theory: since it is difficult to keep dairy products fresh during long transits, most
major cities are surrounded by a number of dairy producers (Vanek, 2004 [190]). Shell Hydrogen
believes that the cost of small-scale hydrogen production will decrease over the next five to ten
years as the technology matures (Van der Veer, 2003 [189]).
Despite these obstacles, transit buses still provide an excellent way to demonstrate fuel cell
technology, for a number of reasons. Transit buses comprise a tiny fraction of the number of
vehicles on urban roadways (Gordon, 1991 [149]). From a spatial standpoint, buses do not have
the same limitations as light-duty vehicles. In addition, the cost of a bus fuel cell can be higher,
while staying competitive with the cost of diesel bus engines, the cost of which is higher than that
of light duty vehicle engines (Ogden, 2000 [173]). Current hydrogen bus applications feature a
rooftop fuel cell and storage system, promoting increased safety while preventing the reduction of
passenger space (fuel-cell-bus-club.com, 2004 [93] ). Using hydrogen fuel cells in practice would
help to illustrate any potential problems with the technology. Once identified, these problems
can be addressed and corrected (Farrell et al., 2003 [196]), thereby making fuel cell technology
more viable. Increasing demand for fuel cell buses would also translate into increased production
of fuel cells, resulting in a decrease in the per kilowatt cost of a fuel cell. Lastly, transit buses
are high-visibility means of transportation. By interacting with hydrogen buses on a daily basis,
consumer’s fears about the dangers of hydrogen would be alleviated.
Improvements in technology alone will not drive a transition to a hydrogen-based transportation
system. Factors such as an increased desire for improved air quality, lower emissions, as well as
an increased need for security in our energy supply must be reflected in price signals within the
marketplace. While the rate of improvements and the level of research in fuel cell technology have
been increasing in recent years, the combined, enthusiastic efforts of the government, corporations,
and consumers are required to further promote advancements in hydrogen-based technology (Van
der Veer, 2003 [189]). The government can provide support in the form of increases in research

6.1. Issues facing Hydrogen 73
allocations, rebates, and other methods to reduce the risks for investors embracing expensive pilot
projects (Bennett, 2003 [134]), as well as creating educational programs to improve the public’s
perception of hydrogen. Despite plans to invest $1.2 billion in the hydrogen economy over the
next five years, Energy Secretary Spencer Abraham is reluctant to allocate more money towards
hydrogen technology research until positive results are seen (Bennett, 2003 [134]). Therefore, it
is also imperative that private sector stakeholders, such as the automotive and energy industries,
deliver large investments towards facilitating advancements in fuel cell technology and hydrogen
infrastructure development (Van der Veer, 2003 [189]).
Chapter 7
The Transition Model
7.1 IntroductionWhen presented with a choice there are very few people who would not prefer it if vehicles in theUnited States were emission free and powered by renewable energy. This desire by many to seea shift to a more renewable and environmentally friendly technology in our transportation sectorhas led to a great deal of work being done examining the form a transition from oil based fuelsto a “cleaner” technology like hydrogen fuel cells might take, especially in the area of commercialpassenger vehicles. Despite this widespread enthusiasm there has been little actual work doneregarding what exactly the transition period from diesel to hydrogen in heavy duty vehicles willbe like. This is especially unfortunate considering it is this area, particularly transit buses, we notonly consider to be the best starting point for a transition, but also the area most likely to driveall other aspects of a hydrogen transition.
Therefore, one of our main goals since the beginning of this project has been rectifying thisunfortunate gap in the overall planning for the transition to a hydrogen based economy. To dothis we have created a model that will show as accurately as possible what the transition fromdiesel engines to hydrogen fuel cells in urban passenger bus will entail. The first step towardscreating this transition model was to forecast the number of buses that will be needed over thenext 50 years. Once this forecast is completed is possible to create the actual transition model.Then finally the model was used to examine some of the scenarios that are likely to occur duringthe transition, paying particular attention to the feasibility of the Department of Transportation’sstated goals for the transition in terms of a timeline for hydrogen fuel cells penetration in thenational bus fleet.
In the course of creating this model several possibilities that ultimately proved infeasible werepursued. As an alternative model for the transition to hydrogen fuel cells in passenger buses theuse of an optimization model was considered. Another area of research that we originally viewed
74
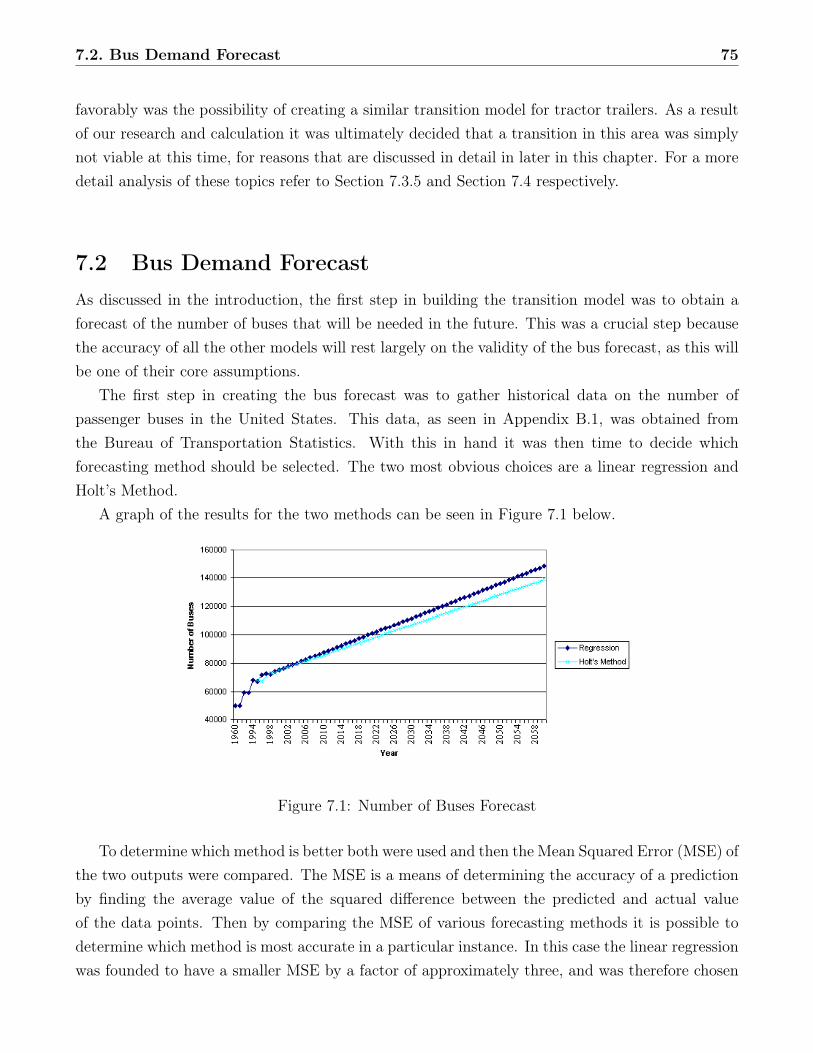
7.2. Bus Demand Forecast 75
favorably was the possibility of creating a similar transition model for tractor trailers. As a resultof our research and calculation it was ultimately decided that a transition in this area was simplynot viable at this time, for reasons that are discussed in detail in later in this chapter. For a moredetail analysis of these topics refer to Section 7.3.5 and Section 7.4 respectively.
7.2 Bus Demand ForecastAs discussed in the introduction, the first step in building the transition model was to obtain aforecast of the number of buses that will be needed in the future. This was a crucial step becausethe accuracy of all the other models will rest largely on the validity of the bus forecast, as this willbe one of their core assumptions.
The first step in creating the bus forecast was to gather historical data on the number ofpassenger buses in the United States. This data, as seen in Appendix B.1, was obtained fromthe Bureau of Transportation Statistics. With this in hand it was then time to decide whichforecasting method should be selected. The two most obvious choices are a linear regression andHolt’s Method.
A graph of the results for the two methods can be seen in Figure 7.1 below.
Figure 7.1: Number of Buses Forecast
To determine which method is better both were used and then the Mean Squared Error (MSE) ofthe two outputs were compared. The MSE is a means of determining the accuracy of a predictionby finding the average value of the squared difference between the predicted and actual valueof the data points. Then by comparing the MSE of various forecasting methods it is possible todetermine which method is most accurate in a particular instance. In this case the linear regressionwas founded to have a smaller MSE by a factor of approximately three, and was therefore chosen
7.3. The Transition Model 76
as the basis of all further bus forecasts.This linear regression produced the parameters:
alpha -2358530.143beta 1216.857
These parameters are used to create a line that is best possible fit for the data. Alpha representsthe y-intercept of this line and beta represents the slope. The forecast for the number of buseseach year, through 2060, this linear regression produces can be seen in Appendix B.2.
7.3 The Transition ModelIn this section all assumptions and steps in the physical creation of the transition model will bediscussed in detail, as well as the various scenarios for the transition to hydrogen buses the modelwas used to create.
7.3.1 AssumptionsBefore the practicalities of creating the transition model are discussed it is important to list allassumptions that went into the creation of the model, so that they can be kept in mind as the moremundane details of the model are examined. These assumptions, which we feel to be sufficientlyconservative enough to not cast doubt on the structure of the model, are as follows:
1. All parties involved the hydrogen transition (government, vehicle manufacturers, energy com-panies, R&D organizations, the general public, etc.) will act in good faith, without attemptsto interrupt or unduly influence the transition for personal gain
2. Technical challenges in adapting hydrogen to HDVs will be overcome; it is only a questionof when this will happen.
3. There will be no unforeseen, revolutionary advances in technologies that render hydrogenfuel cells obsolete as a power source.
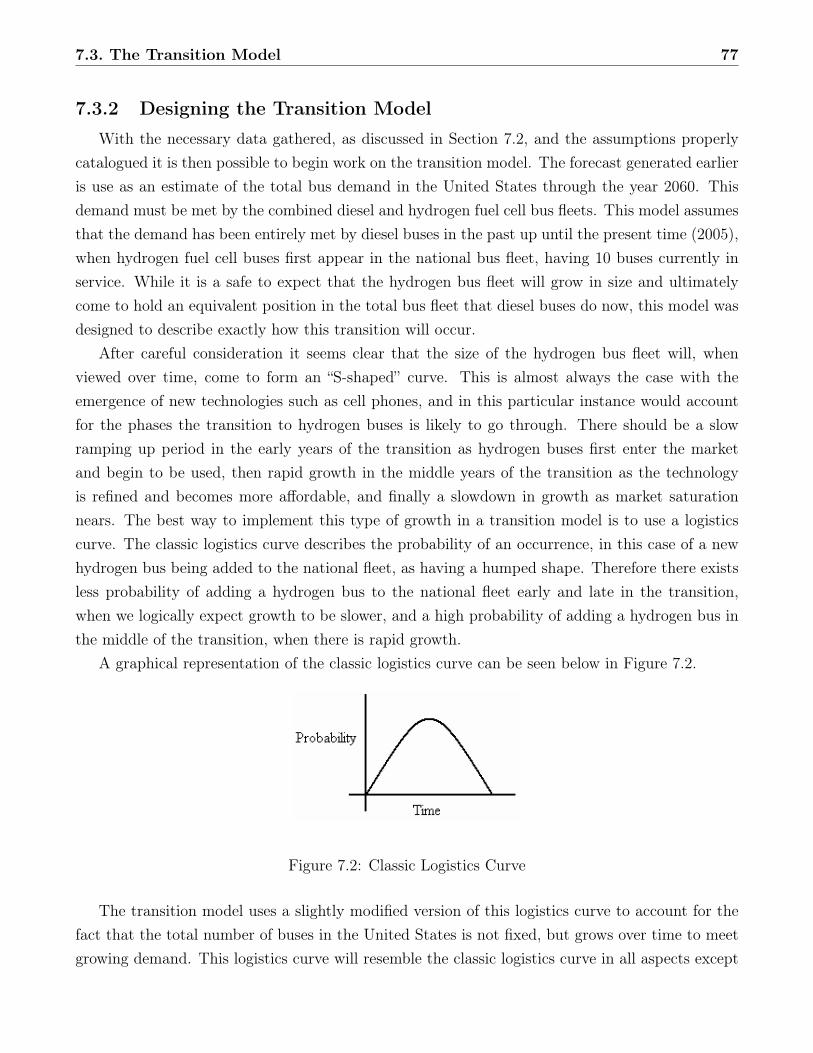
7.3. The Transition Model 77
7.3.2 Designing the Transition ModelWith the necessary data gathered, as discussed in Section 7.2, and the assumptions properly
catalogued it is then possible to begin work on the transition model. The forecast generated earlieris use as an estimate of the total bus demand in the United States through the year 2060. Thisdemand must be met by the combined diesel and hydrogen fuel cell bus fleets. This model assumesthat the demand has been entirely met by diesel buses in the past up until the present time (2005),when hydrogen fuel cell buses first appear in the national bus fleet, having 10 buses currently inservice. While it is a safe to expect that the hydrogen bus fleet will grow in size and ultimatelycome to hold an equivalent position in the total bus fleet that diesel buses do now, this model wasdesigned to describe exactly how this transition will occur.
After careful consideration it seems clear that the size of the hydrogen bus fleet will, whenviewed over time, come to form an “S-shaped” curve. This is almost always the case with theemergence of new technologies such as cell phones, and in this particular instance would accountfor the phases the transition to hydrogen buses is likely to go through. There should be a slowramping up period in the early years of the transition as hydrogen buses first enter the marketand begin to be used, then rapid growth in the middle years of the transition as the technologyis refined and becomes more affordable, and finally a slowdown in growth as market saturationnears. The best way to implement this type of growth in a transition model is to use a logisticscurve. The classic logistics curve describes the probability of an occurrence, in this case of a newhydrogen bus being added to the national fleet, as having a humped shape. Therefore there existsless probability of adding a hydrogen bus to the national fleet early and late in the transition,when we logically expect growth to be slower, and a high probability of adding a hydrogen bus inthe middle of the transition, when there is rapid growth.
A graphical representation of the classic logistics curve can be seen below in Figure 7.2.
Figure 7.2: Classic Logistics Curve
The transition model uses a slightly modified version of this logistics curve to account for thefact that the total number of buses in the United States is not fixed, but grows over time to meetgrowing demand. This logistics curve will resemble the classic logistics curve in all aspects except
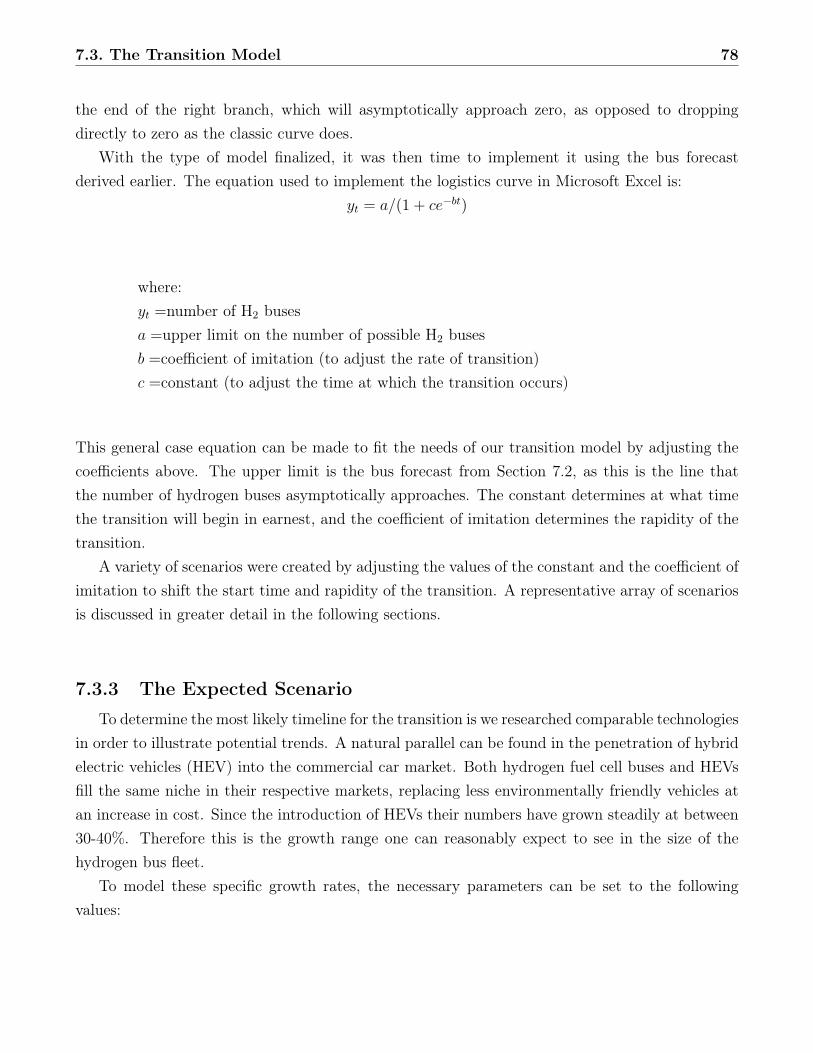
7.3. The Transition Model 78
the end of the right branch, which will asymptotically approach zero, as opposed to droppingdirectly to zero as the classic curve does.
With the type of model finalized, it was then time to implement it using the bus forecastderived earlier. The equation used to implement the logistics curve in Microsoft Excel is:
yt = a/(1 + ce−bt)
where:yt =number of H2 busesa =upper limit on the number of possible H2 busesb =coefficient of imitation (to adjust the rate of transition)c =constant (to adjust the time at which the transition occurs)
This general case equation can be made to fit the needs of our transition model by adjusting thecoefficients above. The upper limit is the bus forecast from Section 7.2, as this is the line thatthe number of hydrogen buses asymptotically approaches. The constant determines at what timethe transition will begin in earnest, and the coefficient of imitation determines the rapidity of thetransition.
A variety of scenarios were created by adjusting the values of the constant and the coefficient ofimitation to shift the start time and rapidity of the transition. A representative array of scenariosis discussed in greater detail in the following sections.
7.3.3 The Expected ScenarioTo determine the most likely timeline for the transition is we researched comparable technologies
in order to illustrate potential trends. A natural parallel can be found in the penetration of hybridelectric vehicles (HEV) into the commercial car market. Both hydrogen fuel cell buses and HEVsfill the same niche in their respective markets, replacing less environmentally friendly vehicles atan increase in cost. Since the introduction of HEVs their numbers have grown steadily at between30-40%. Therefore this is the growth range one can reasonably expect to see in the size of thehydrogen bus fleet.
To model these specific growth rates, the necessary parameters can be set to the followingvalues:
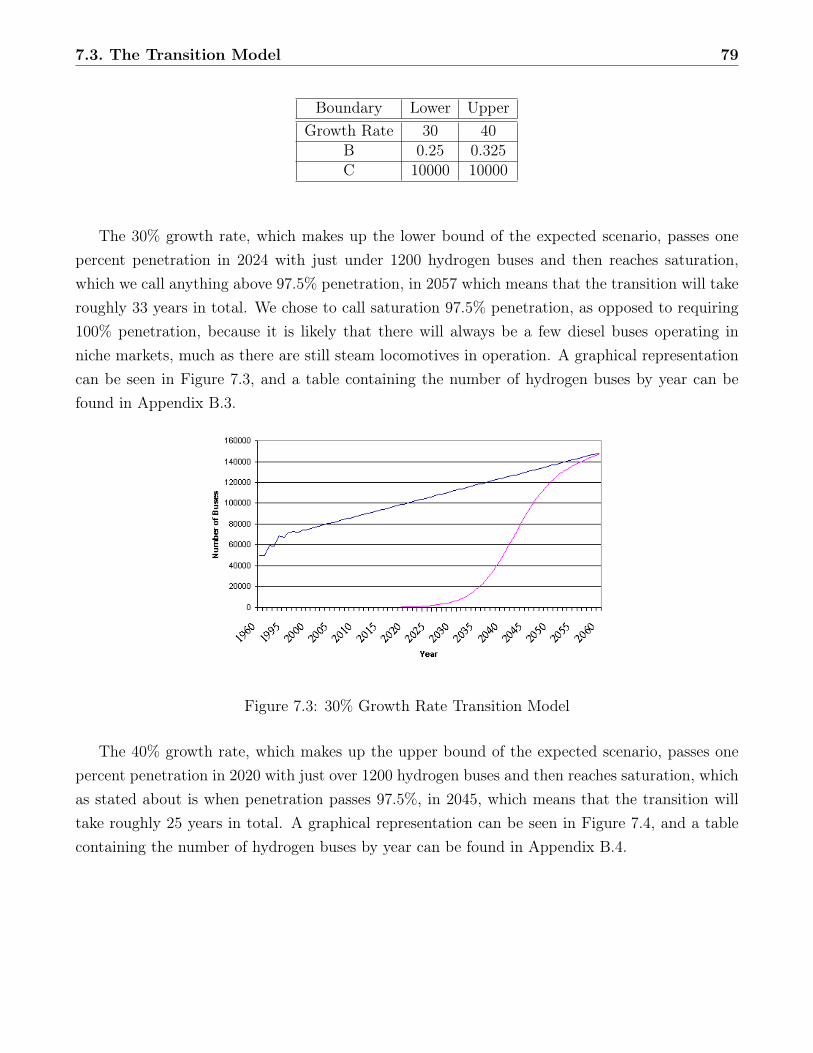
7.3. The Transition Model 79
Boundary Lower UpperGrowth Rate 30 40
B 0.25 0.325C 10000 10000
The 30% growth rate, which makes up the lower bound of the expected scenario, passes onepercent penetration in 2024 with just under 1200 hydrogen buses and then reaches saturation,which we call anything above 97.5% penetration, in 2057 which means that the transition will takeroughly 33 years in total. We chose to call saturation 97.5% penetration, as opposed to requiring100% penetration, because it is likely that there will always be a few diesel buses operating inniche markets, much as there are still steam locomotives in operation. A graphical representationcan be seen in Figure 7.3, and a table containing the number of hydrogen buses by year can befound in Appendix B.3.
Figure 7.3: 30% Growth Rate Transition Model
The 40% growth rate, which makes up the upper bound of the expected scenario, passes onepercent penetration in 2020 with just over 1200 hydrogen buses and then reaches saturation, whichas stated about is when penetration passes 97.5%, in 2045, which means that the transition willtake roughly 25 years in total. A graphical representation can be seen in Figure 7.4, and a tablecontaining the number of hydrogen buses by year can be found in Appendix B.4.
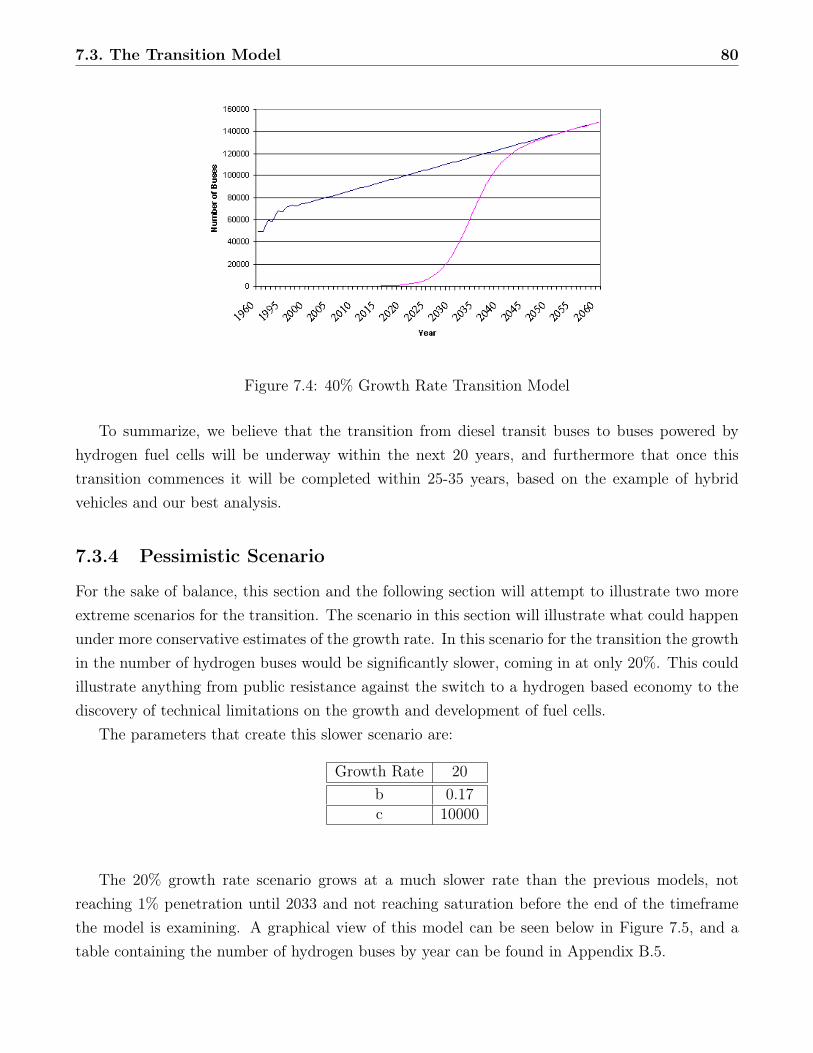
7.3. The Transition Model 80
Figure 7.4: 40% Growth Rate Transition Model
To summarize, we believe that the transition from diesel transit buses to buses powered byhydrogen fuel cells will be underway within the next 20 years, and furthermore that once thistransition commences it will be completed within 25-35 years, based on the example of hybridvehicles and our best analysis.
7.3.4 Pessimistic Scenario
For the sake of balance, this section and the following section will attempt to illustrate two moreextreme scenarios for the transition. The scenario in this section will illustrate what could happenunder more conservative estimates of the growth rate. In this scenario for the transition the growthin the number of hydrogen buses would be significantly slower, coming in at only 20%. This couldillustrate anything from public resistance against the switch to a hydrogen based economy to thediscovery of technical limitations on the growth and development of fuel cells.
The parameters that create this slower scenario are:
Growth Rate 20b 0.17c 10000
The 20% growth rate scenario grows at a much slower rate than the previous models, notreaching 1% penetration until 2033 and not reaching saturation before the end of the timeframethe model is examining. A graphical view of this model can be seen below in Figure 7.5, and atable containing the number of hydrogen buses by year can be found in Appendix B.5.
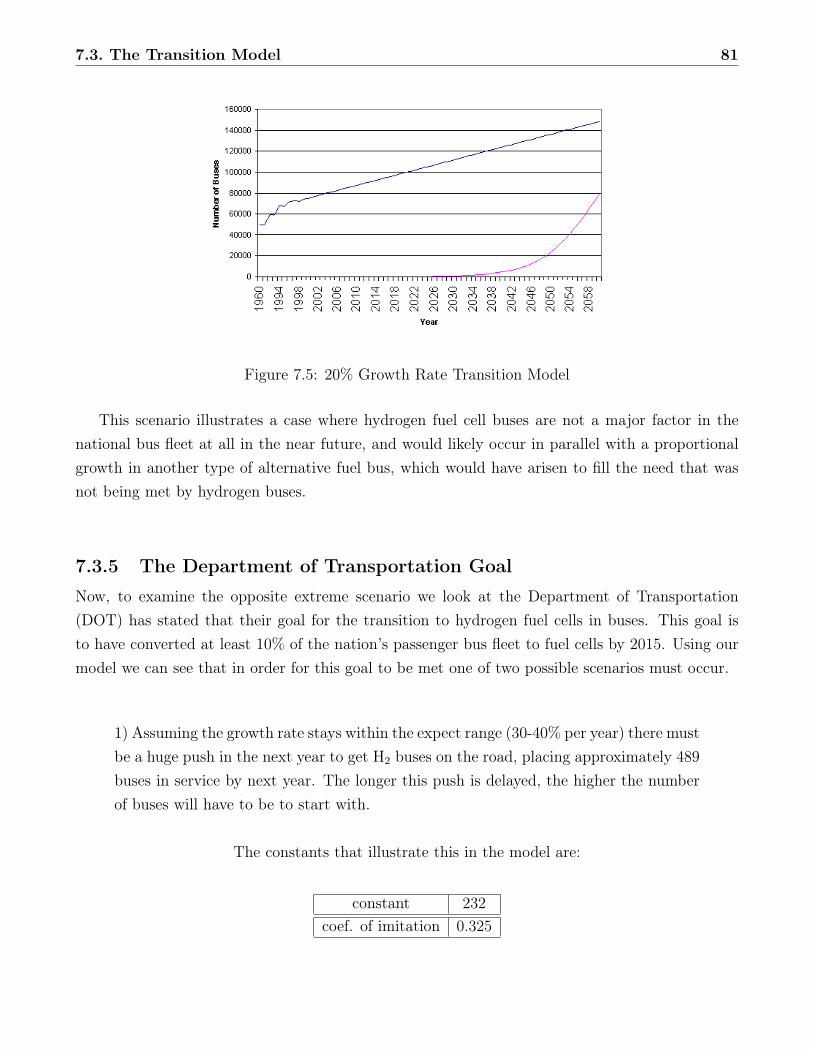
7.3. The Transition Model 81
Figure 7.5: 20% Growth Rate Transition Model
This scenario illustrates a case where hydrogen fuel cell buses are not a major factor in thenational bus fleet at all in the near future, and would likely occur in parallel with a proportionalgrowth in another type of alternative fuel bus, which would have arisen to fill the need that wasnot being met by hydrogen buses.
7.3.5 The Department of Transportation GoalNow, to examine the opposite extreme scenario we look at the Department of Transportation(DOT) has stated that their goal for the transition to hydrogen fuel cells in buses. This goal isto have converted at least 10% of the nation’s passenger bus fleet to fuel cells by 2015. Using ourmodel we can see that in order for this goal to be met one of two possible scenarios must occur.
1) Assuming the growth rate stays within the expect range (30-40% per year) there mustbe a huge push in the next year to get H2 buses on the road, placing approximately 489buses in service by next year. The longer this push is delayed, the higher the numberof buses will have to be to start with.
The constants that illustrate this in the model are:
constant 232coef. of imitation 0.325
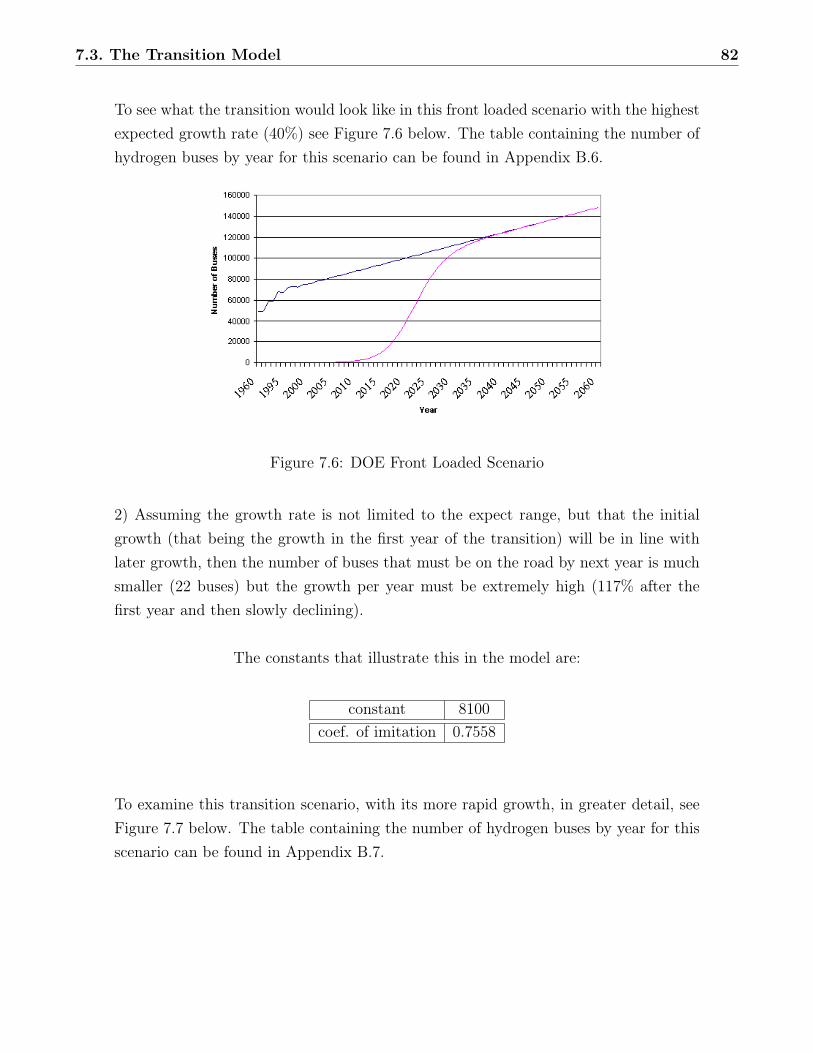
7.3. The Transition Model 82
To see what the transition would look like in this front loaded scenario with the highestexpected growth rate (40%) see Figure 7.6 below. The table containing the number ofhydrogen buses by year for this scenario can be found in Appendix B.6.
Figure 7.6: DOE Front Loaded Scenario
2) Assuming the growth rate is not limited to the expect range, but that the initialgrowth (that being the growth in the first year of the transition) will be in line withlater growth, then the number of buses that must be on the road by next year is muchsmaller (22 buses) but the growth per year must be extremely high (117% after thefirst year and then slowly declining).
The constants that illustrate this in the model are:
constant 8100coef. of imitation 0.7558
To examine this transition scenario, with its more rapid growth, in greater detail, seeFigure 7.7 below. The table containing the number of hydrogen buses by year for thisscenario can be found in Appendix B.7.
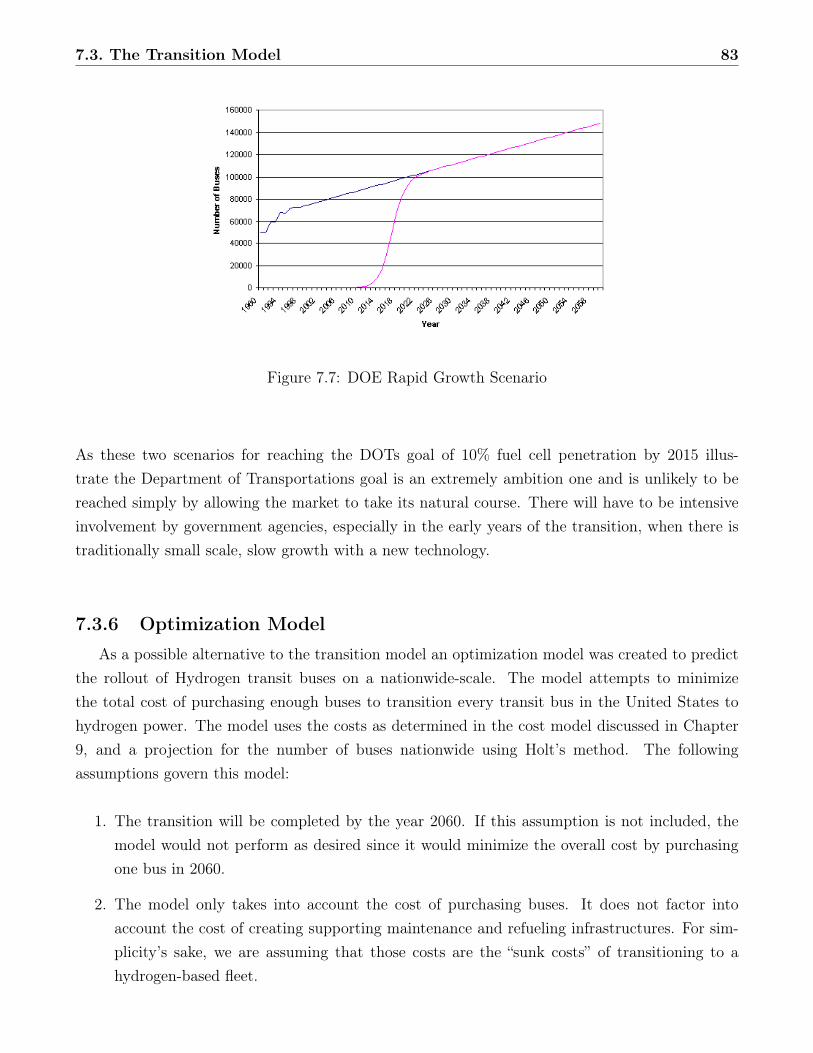
7.3. The Transition Model 83
Figure 7.7: DOE Rapid Growth Scenario
As these two scenarios for reaching the DOTs goal of 10% fuel cell penetration by 2015 illus-trate the Department of Transportations goal is an extremely ambition one and is unlikely to bereached simply by allowing the market to take its natural course. There will have to be intensiveinvolvement by government agencies, especially in the early years of the transition, when there istraditionally small scale, slow growth with a new technology.
7.3.6 Optimization ModelAs a possible alternative to the transition model an optimization model was created to predict
the rollout of Hydrogen transit buses on a nationwide-scale. The model attempts to minimizethe total cost of purchasing enough buses to transition every transit bus in the United States tohydrogen power. The model uses the costs as determined in the cost model discussed in Chapter9, and a projection for the number of buses nationwide using Holt’s method. The followingassumptions govern this model:
1. The transition will be completed by the year 2060. If this assumption is not included, themodel would not perform as desired since it would minimize the overall cost by purchasingone bus in 2060.
2. The model only takes into account the cost of purchasing buses. It does not factor intoaccount the cost of creating supporting maintenance and refueling infrastructures. For sim-plicity’s sake, we are assuming that those costs are the “sunk costs” of transitioning to ahydrogen-based fleet.
7.3. The Transition Model 84
3. A demand for hydrogen bus technology.
4. A bus’ service life is only 10 years. Currently, the average bus service life is a little over 7years (APTA, 2003). With the advent of fuel cells and the corresponding reduction in thenumber of moving parts, it can be assumed that bus service life can be expected to increaseas a result.
5. A demand for buses of 10% of the estimated number of vehicles required for a given yearbased on this service life of 10 years, this model assumes. This is due to the fact that,with a 10-year service life, it can be assumed that approximately 10% of a bus fleet requiresreplacement in a given year.
6. That a higher priority will be placed on replacing already-transitioned hydrogen buses beforetransitioning existing diesel buses to hydrogen. This ensures that the model is not “back-loaded”, with all purchases coming in the later time frame. This also ensures that hydrogenbuses are being continually manufactured, thus facilitating a continued reduction in costs.
7. That at least 10% of the nationwide bus fleet will be transitioned by the year 2015, inaccordance with Department of Energy goals.
The optimization model can be described mathematically as follows:
MIN Σ Cn
s.t. Xn≤ Dn - Rn
ΣXn ≤ An
ΣXn ≤ Zn
ΣXn = 0.1 * Z2060 n is all years from 2005 through 2015ΣXn= Z2060
All Xn ≥ 0
where:
Cn = cost of Hydrogen buses in year n
Xn = number of Hydrogen buses purchased for transition in year n
Dn = demand for all buses in year n
Rn = number of Hydrogen buses requiring replacement in year n
Zn= estimated total number of transit buses nationwide in year n
7.3. The Transition Model 85
An= potential total number of Hydrogen buses manufactured by year n
After attempting to implement this model, a number of shortcomings were noted. In particular,Microsoft Excel Solver was unable to determine a feasible solution for a year-by-year rollout, asthe required number of variables exceeded its capacity. Modifications to the data set were requiredto reduce the number of variables in order to achieve any functional answer. Eventually, theoptimization model was shortened to a modified biennial rollout model. However, the shape ofthe resultant solution appeared to have three steps, meaning that the rollout would occur in threedistinct phases. This does not appear to be a realistic depiction of a rollout, as most historicalrollouts have taken the form of an s-shape in terms of cumulative distribution.
Another factor that contributed to the inability to successfully implement this model wasthe lack of sufficient data. Data with respect to fuel cell bus cost, number of fuel cell busesin existence, bus demand, expected growth of bus demand, budgets for new bus purchases, andrevenue generated by bus travel in the various national bus fleets would have been extremely helpfulin creating an optimization function to minimize the overall cost of transitioning to hydrogen busesand realistic constraints governing such a transition. This lack of data led to the generation of anunrealistic solution, and contributed to the high degree of uncertainty inherent in this model.
In conclusion, an optimization model, while highly successful in predicting short-term strategieswith solid foundations of data, may not be appropriate for developing long-term strategies forsituations with highly speculative data, as is the case in this situation.
7.3.7 Possible Impact of Alternative TechnologiesAs with all real world situations, the question of what should be done with the national bus
fleet to combat the problems of rising emissions and fuel costs does not necessarily have only onesolution. In this section the four leading alternatives to hydrogen fuel cell technology will be ex-amined and their potential impact on the transition to hydrogen buses will be considered. Eachtechnology will be examined independently in one of the three following sub-sections.
Hybrid-Electric Buses
Hybrid-Electric, or HEV, buses are conventional diesel buses that included some means of recharg-ing a battery during operation, usually a form of regenerative braking where the force appliedwhen the brakes are used is harnessed to generate electricity. This battery is then used to drive anelectric motor in situations when the use of the ICE engine is inefficient. The use of this systemof an ICE and electric motor in parallel makes it possible to both simultaneously increase fuelefficiency and reduce emissions. The HEV buses function, for all intents and purposes, exactly as
7.3. The Transition Model 86
if they were conventional diesel buses while still gaining the benefits of this new technology. Thismakes HEV buses extremely attractive to many transit companies, as they can be used by thoseunwilling, or unable, to pay the extensive costs inherent with the transition to hydrogen buseswhile still allowing them to achieving at least some of the benefits of a cleaner and more efficienttechnology. All without the need for a commitment to a new technology and infrastructure thatthe hydrogen transition requires.
This makes hybrid technology simultaneously the largest direct competitor and the greatestsource of potential improvement for hydrogen fuel cell buses. Opponents of the hydrogen transitionoften recommend that research efforts be devoted to improving and adapting hybrid technologyand treat resources spent on hydrogen technology as practically wasted (Keith, 2003 [196]). Whilehybrid technology may be more cost-effective in the near term, and provides its nearly comparablebenefits, this view is very short sighted. No matter how efficient it uses fuel, hybrid diesel busesstill use diesel, which is created from a finite supply of oil. As time goes on the world’s supply of oilwill inevitably become scarcer, and eventually be depleted. Hydrogen is under no such constraintand is available in effectively infinite supply, assuming it is made from non-fossil fuel sources.
The potential improvement hybrid technology can make in hydrogen fuel cell buses arises fromthe fact that the hybrid technology can just as easily be adapted to work in parallel with fuel cellsas it has been adapted to work with conventional ICEs, providing a large array of benefits. Withan electric motor in parallel it would be possible to use a smaller fuel cell, which would greatlyreduce overall costs, especially in these early years when the technology is at its most expensive.The parallel system would also reduce the strain placed on the fuel cell during peak power draws.The improvements to the fuel efficiency of hydrogen buses can also be expected to be comparableto that found in diesel hybrids, which could both reduce the size of on board storage and increasethe range of hydrogen buses (FCW + IE).
While hybrid technology is the one most likely to come into direct competition with hydrogenfuel cells, it will ultimately provide a boon to the hydrogen transition by improving the performanceof the hydrogen buses. It is likely that diesel HEV buses will grow at a quicker rate that fuel cellbuses, but in 20 to 30 years, when we expect the transition to hydrogen fuel cells to begin in earnest,HEV buses will fall by the wayside along with the other diesel vehicles due to its inextricable tiesto a limited source of fuel.
Hydrogen Internal Combustion Engine
As is well known, due to the highly publicized accident aboard the Hindenburg in 1937, hydrogen ishighly flammable. A possible practical application of this fact in transportation is to use hydrogenas the fuel in an internal combustion engine (ICE). This is exactly what is done in the class of
7.3. The Transition Model 87
buses we will refer to as H2 ICE buses.This is a very new technology and the first vehicles implementing it are not expected to roll
off assembly lines for several more years though major automotive makers such as BMW and Fordhave committed to producing H2 ICE vehicles. These buses work by injecting hydrogen gas, insteadof gasoline, into the engine’s cylinders, where it combines with oxygen and combusts, driving thepistons and powering the bus. A benefit of using hydrogen as opposed to gas or diesel is that thehydrogen will still burn even when the air-fuel mix contains too little hydrogen to consume all theoxygen. Unfortunately, a downside of using hydrogen in this kind of application is that its lowdensity means less oxygen can fit into the cylinder, leading to a decrease in overall power (53).
The H2 ICE technology is one that can greatly assist the hydrogen transition. Many of the com-panies involved in research in this area often consider it to be an ideal bridge technology betweencurrent ICE buses and hydrogen fuel cell buses. The automotive industry is well acquainted withbuilding ICE vehicles, which means there will be little uncertainty or new knowledge needed tobeginning producing hydrogen ICE buses in large quantities. This will allow the industry to focuson developing a hydrogen infrastructure to support these new hydrogen ICE buses. As this is anendeavor for which there are no parallels in recent decades, it is likely to be extremely complicatedand will require a great deal amount of effort and expertise. This hydrogen infrastructure will bereadily in place when the hydrogen transition finally takes place, which is yet another benefit ofH2 ICE technology (53).
Hythane Buses
Another alternative transportation technology is to adapt compressed natural gas (CNG) busesto run on a combination of hydrogen and natural gas, called Hythane. This gas is made of 80%methane (CH4) and 20% hydrogen. Use of this combination as opposed to the traditional CNGfuel, which is composed primarily of methane, reduces NOx emissions by as much as 43% and CO2
emissions by 7%. Sunline, which services 9 cities in California, has been running Hythane busesin an experimental capacity for several years and have found that the efficiency is comparable toother CNG buses and that there have been no increase in maintenance problems and safety issues,though the buses have not been run during extremely hot periods in the summer due to the costof installing A/C systems on board (Cromwell et al, 2002 [141]).
Many companies, including Sunline, are pursuing Hythane technology purely as a bridge tech-nology to hydrogen fuel cells. These companies believe that Hythane buses are the best choice forthe present, and are also an excellent means to develop hydrogen as a major transportation fuel, aswell as the national infrastructure this entails. Hythane buses also create a market for renewablehydrogen that will be invaluable later in the transition. Also considering fuel cell and H2 ICE
7.4. Medium Duty Vehicles 88
buses are not widely available commercially at this time, Hythane buses are commonly regardedas the best way to begin the hydrogen transition now and accelerate it as much as possible.
7.4 Medium Duty VehiclesMedium Duty Vehicles (MDVs) are those that fall between Light Duty Vehicles, such as smalltrucks, and Heavy Duty Vehicles, such as the passenger buses and tractor trailers this report hasdealt with. Specifically, when we discuss MDVs in this section we are referring to delivery trucks,such as those used by the United States Post Service and companies such as UPS and FedEx.
UPS recently launched a program to test the feasibility of replacing their diesel delivery truckfleet of 88,000 trucks with hydrogen fuel cell trucks. The beginning stage of this test involvesrunning three hydrogen delivery trucks in Los Angeles, Sacramento, and Ann Arbor Michigan.These delivery trucks use DiamlerChrysler’s second generation fuel cells and have a range of ap-proximately 155 miles, which is equivalent to that of traditional diesel delivery trucks. These newdelivery trucks have the same handling and pickup as the diesel delivery trucks, as well as anadditional 10% cargo carrying capacity due to the more compact drive train fuel cells use. Theseexperimental vehicles have been fueling at 10 hydrogen refueling stations available to commercialfleets in California, and at the EPA’s refueling station in Ann Arbor (Nguyen, 2004 [172]).
These hydrogen fuel cell delivery trucks can only help accelerate the hydrogen transition. Thereis no direct competition between hydrogen buses and delivery trucks, so there will be no negativecompetition. Any situation that leads to more fuel cells being produced, in this case for use indelivery trucks, will lead to increases in the performance and reductions of the cost of fuel cells,both of which will accelerate the transition to hydrogen.
7.5 Fuel Cell Tractor Trailer InfeasibilityThere have not been any major prototype fuel cell tractor trailer projects. This may be due tothe fact that the drive cycle for trucks hauling freight great distances is an excellent applicationfor Diesel internal combustion engines, which translate the high energy density of Diesel fuel intothe massive power outputs needed to tow freight trailers long distances at highway speeds (NAVC,2003 [148]). Since fuel cost is a major consideration for freight trucking corporations, and sinceDiesel fuel is an extremely cost-effective option, there is no incentive to switch to fuel cell power(NAVC, 2003 [148]), as imposing the additional costs of hydrogen fuel would lead to lower profitsand higher prices for consumers, who would be likely to take their business elsewhere (Farrell etal., 2003 [196]). However, improving fuel economy would result in lower overall costs (Farrell et al.,
7.5. Fuel Cell Tractor Trailer Infeasibility 89
2003 [196]), and many studies have shown that fuel cells are much more efficient at converting fuelto energy than their Diesel counterparts. In addition, freight trucks are responsible for generatingtwice as many nitrous oxide pollutants and ten times as many particulate emissions as the averagepassenger vehicle (Farrell et al., 2003 [196]). Using hydrogen would eliminate these emissions fromthese high-polluting vehicles.
To determine the feasibility of producing a fuel cell-powered tractor scenario, two scenarioswere investigated. The first scenario assumes replacement of the internal combustion engine witha fuel cell, with no gain in overall efficiency. The second scenario assumes a gain of fifty percentin efficiency by using a fuel cell instead of an internal combustion engine.
Scenario 1: This scenario assumes that the overall efficiency of a hydrogen fuel cell willbe the same as that of a diesel ICE.
Amount of Power needed for example tractor trailer = 425-525 HP => 317-391.5 kW
Energy Density of Fuels:
Diesel = 39 MJ/m3
Liquid Hydrogen = 10 MJ/m3
Compressed Hydrogen = 3 MJ/m3
Fuel Economy of tractor trailer = 6.1 miles/gal
Two 140 gallon fuel tanks are standard on example tractor trailer (Freightliner Coron-ado)
Overall range = 2*140*6.1 = 1,708 miles
140 gallons = 0.53 m3 => 2 tanks = 1.06 m3 of diesel storage space
Required amount of energy = 39 MJ/m3 * 1.06 m3 = 41.337 MJ
Liquid Hydrogen tank parameters:
0.5 meters diameter5.5 meters length90 pounds fully loaded
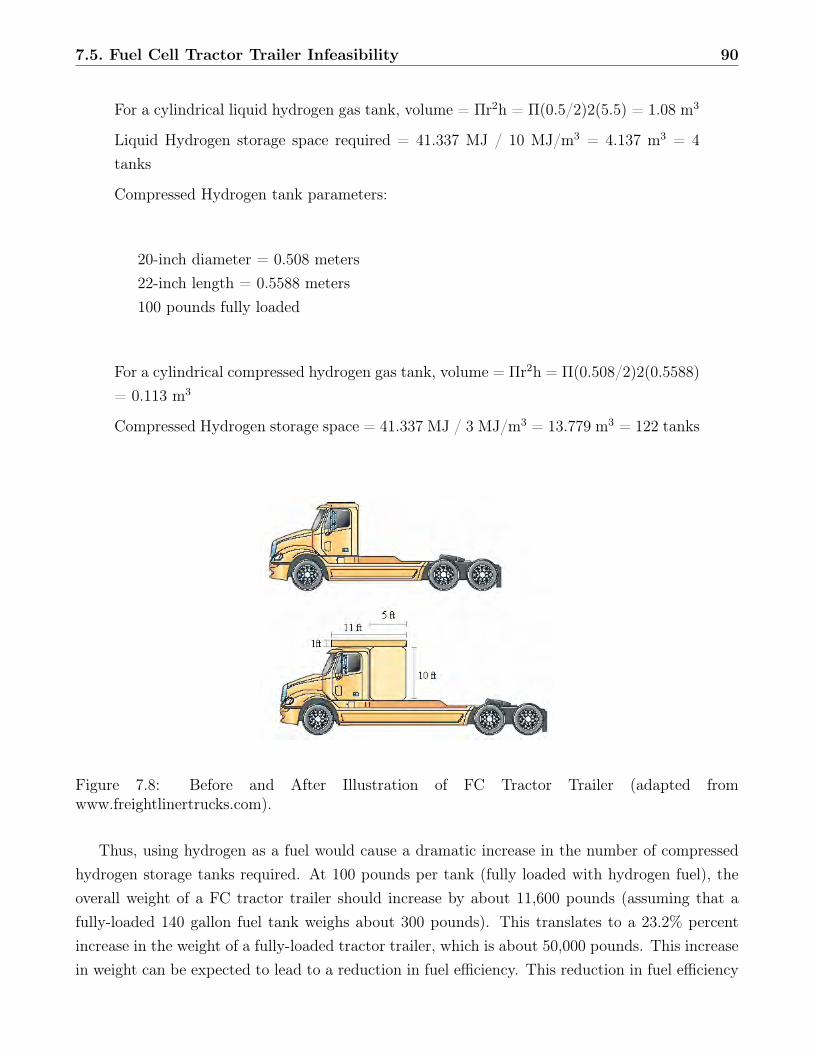
7.5. Fuel Cell Tractor Trailer Infeasibility 90
For a cylindrical liquid hydrogen gas tank, volume = Πr2h = Π(0.5/2)2(5.5) = 1.08 m3
Liquid Hydrogen storage space required = 41.337 MJ / 10 MJ/m3 = 4.137 m3 = 4tanks
Compressed Hydrogen tank parameters:
20-inch diameter = 0.508 meters22-inch length = 0.5588 meters100 pounds fully loaded
For a cylindrical compressed hydrogen gas tank, volume = Πr2h = Π(0.508/2)2(0.5588)= 0.113 m3
Compressed Hydrogen storage space = 41.337 MJ / 3 MJ/m3 = 13.779 m3 = 122 tanks
Figure 7.8: Before and After Illustration of FC Tractor Trailer (adapted fromwww.freightlinertrucks.com).
Thus, using hydrogen as a fuel would cause a dramatic increase in the number of compressedhydrogen storage tanks required. At 100 pounds per tank (fully loaded with hydrogen fuel), theoverall weight of a FC tractor trailer should increase by about 11,600 pounds (assuming that afully-loaded 140 gallon fuel tank weighs about 300 pounds). This translates to a 23.2% percentincrease in the weight of a fully-loaded tractor trailer, which is about 50,000 pounds. This increasein weight can be expected to lead to a reduction in fuel efficiency. This reduction in fuel efficiency
7.5. Fuel Cell Tractor Trailer Infeasibility 91
is not considered in this scenario. Also, using hydrogen as a fuel would result in an addition offive feet to the overall length of the truck.
The amount of hydrogen needed can be calculated as follows:
15 gallons of diesel = 5 kg of Hydrogen in LDV applications
HDV fuel efficiency/LDV fuel efficiency= 6.1 mpg/22.1 mpg = 0.276
15(.276) = 4.14 gallons of diesel = 5 kg of hydrogen in HDV (estimated)
=> 280 gallons of diesel=> 338.16 kg Hydrogen
Cost of FC stack and Compressed Hydrogen storage tanks now
= 317 (5,000) + 122 (35,000)= $5.855 million (425 HP version)= 391.5 (5,000) + 122 (35,000)= $6.2275 million (525 HP version)
⇒ This is much more than the $125,000 selling price of a new tractor trailer!
Cost of FC stack and Compressed Hydrogen storage tanks at goals
= 317 (50) + 122 (350)= $58,500 (425 HP version)= 391.5 (50) + 122 (350)= $62,275 (525 HP version)
⇒This is about twice the cost of an ICE and 2 fuel tanks in the current tractor trailer
7.5. Fuel Cell Tractor Trailer Infeasibility 92
This calculation assumes that all power for a tractor trailer, even at peak demands, comes solelyfrom a fuel cell-powered engine. Thus, there is no “hybrid drive” system, where another powersource is present to provide additional power if needed.
In actuality, the fuel cell, at least in bus applications, has demonstrated an efficiency of 46%,compared to the 20% of its Diesel ICE counterpart (Cole, 1998 [140]). However, buses spend themajority of their operational time making continuous starts and stops, with frequent intervals ofacceleration and deceleration. For an application like tractor trailers, which spend the majorityof their operational time traveling continuously at highway speeds, we can expect a smaller-scaleimprovement in the overall efficiency of a fuel cell as compared to its ICE counterpart. Also, despitethe increase in tractor trailer weight due to hydrogen storage, the overall increase in efficiency dueto the use of a fuel cell should still be much greater than that of its Diesel counterpart, leadingto greater fuel efficiency. Furthermore, it can be expected that, with greater fuel efficiency, lesshydrogen will have to be carried onboard, thus reducing the required area for storage.
Scenario 2: This scenario assumes that there is a 50% improvement in efficiency byusing a fuel cell in tractor trailer applications. Based on this increase in efficiency, wecan determine the expected reduction in fuel storage area by using the ratio:
(ICE Efficiency)(ICE Fuel Storage) = (FC Efficiency)(FC Fuel Storage)
Setting the ICE Parameters as a baseline of 1, we see the following:
(1)(1) = (1.5)(x) => x = 0.667
= a 33% reduction in our originally calculated storage area can be expected.
Applying this reduction to the appropriate calculations from Scenario 1 yields thefollowing results:
Liquid Hydrogen storage space required= (41.337 MJ / 10 MJ/m3)*.667 = 2.76 m3 = 3 tanksCompressed Hydrogen storage space required= (41.337 MJ / 3 MJ/m3)*.667 = 9.19 m3 = 82 tanks
At 100 pounds per tank (fully loaded with hydrogen fuel), the overall weight of a FC tractor trailershould increase by about 7,600 pounds (assuming that a fully-loaded 140 gallon fuel tank weighsabout 300 pounds). This translates to a 15.2% percent increase in the weight of a fully-loadedtractor trailer, which is about 50,000 pounds. As in the first scenario, this increase in weight
7.5. Fuel Cell Tractor Trailer Infeasibility 93
can be expected to result in a reduction in fuel efficiency. This reduction in fuel efficiency is notconsidered in this scenario.
The amount of hydrogen needed can be calculated as follows:
4.14 gallons of diesel = 5 kg of Hydrogen in HDV applications (estimated)
=> 280 gallons of diesel=> 338.16 kg * 0.667 = 225.56 kg Hydrogen
Cost of FC stack and Compressed Hydrogen storage tanks now
= 317 (5,000) + 82 (35,000)= $4.455 million (425 HP version)= 391.5 (5,000) + 82 (35,000)= $4.8275 million (525 HP version)
⇒This is still much higher than the $125,000 selling price of a new tractor trailer!
Cost of FC stack and Compressed Hydrogen storage tanks at goals
= 317 (50) + 82 (350)= $44,550 (425 HP version)= 391.5 (50) + 82 (350)= $48,275 (525 HP version)
⇒This is about one-and-a-half times the cost of its Diesel ICE counterpart.
While the greater efficiency of the fuel cell leads to better fuel economy, the required storage areafor hydrogen is still much greater than the area needed for Diesel storage. This extra storage arearesults in close to a 4-ton increase in weight, as defined in scenario 2. While longer storage tankscan be used which would be lighter than an equivalent number of small storage tanks (since theincrease in weight of a longer tank could be expected to be less than proportional to the weight
7.5. Fuel Cell Tractor Trailer Infeasibility 94
increase of using an equivalent volume of smaller tanks), the discount in weight realized by usinglonger tanks will not alleviate the substantial overall weight increase as a result of in the requiredincrease in storage area. Furthermore, this weight increase will impact other design factors of thetractor trailer, since the added weight may result in the necessity for stronger axles, shocks, andother weight-bearing components of a tractor trailer. As the need for stronger parts arises, costsfor these parts will also be much greater than those currently used on tractor trailers. However,researchers at Pacific Northwest National Laboratory are investigating ways of producing lighterweight, higher strength materials cost-effectively in order to reduce the weight of tractor-trailercombo by 20%, or about 6,000 pounds (Breakthroughs, 2002 [102]). Hydrogen storage requirementwould offset the effects of this weight decrease, but would eliminate the need for using strongeraxles, shocks, and weight-bearing components, since the weight of the tractor trailer would beroughly the same as we see today.
Lastly, while it may seem that liquefaction of hydrogen is a better alternative for hydrogenstorage in tractor trailers due to the vast difference in the required number of tanks (3-4 versus82-122), the costs to liquefy hydrogen are extremely high, and 30% of the energy in liquid hydrogenis expended while keeping the hydrogen in liquid form (Service, 2004 [179] [180]). Thus, a fewadditional tanks would need to be added to compensate for this energy loss. Additionally, thepotentially high cost of installing systems to keep the temperature of the liquid hydrogen below-253oC (the temperature at which hydrogen reaches a state of liquefaction), both onboard thevehicle (which has no large-scale prototype in existence), and at the points of refueling (which haverelatively few large-scale prototype in existence), must also be considered. Since manufacturersand experts are focusing on gaseous hydrogen as the preferred state of hydrogen for transportationapplications, it can be assumed that the total cost of using a liquid hydrogen-based storage systemwould greatly exceed that of using a gaseous hydrogen-based storage system.
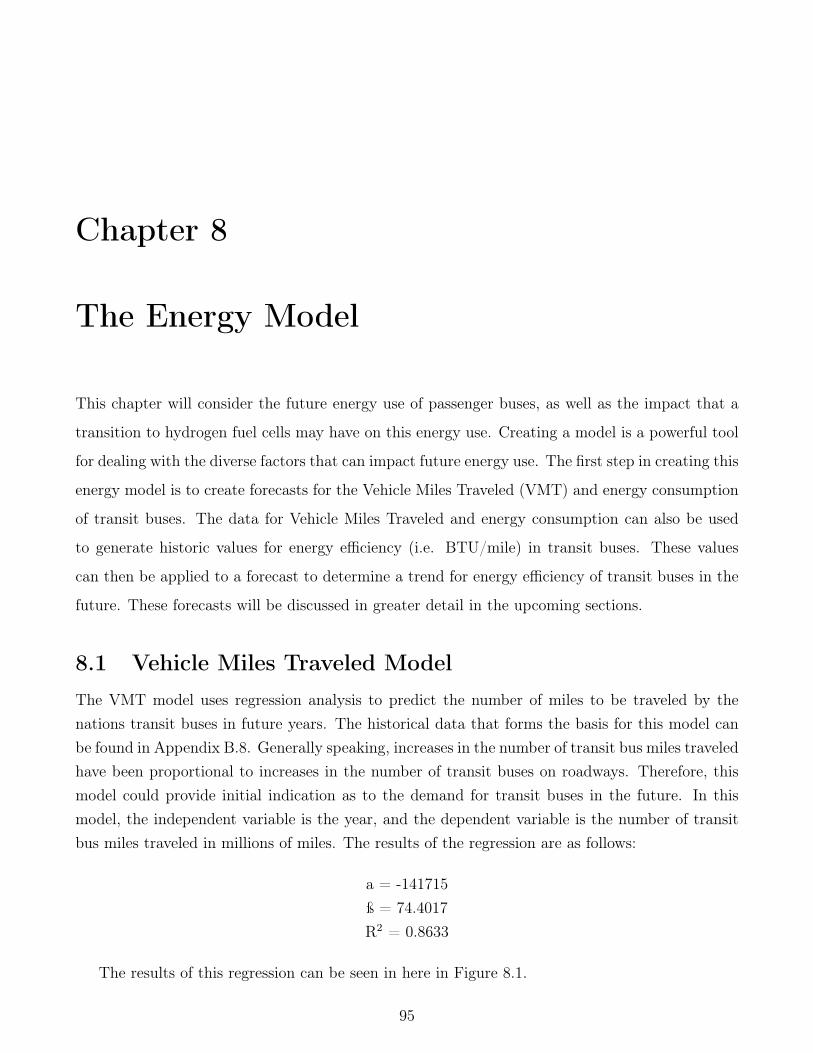
Chapter 8
The Energy Model
This chapter will consider the future energy use of passenger buses, as well as the impact that a
transition to hydrogen fuel cells may have on this energy use. Creating a model is a powerful tool
for dealing with the diverse factors that can impact future energy use. The first step in creating this
energy model is to create forecasts for the Vehicle Miles Traveled (VMT) and energy consumption
of transit buses. The data for Vehicle Miles Traveled and energy consumption can also be used
to generate historic values for energy efficiency (i.e. BTU/mile) in transit buses. These values
can then be applied to a forecast to determine a trend for energy efficiency of transit buses in the
future. These forecasts will be discussed in greater detail in the upcoming sections.
8.1 Vehicle Miles Traveled ModelThe VMT model uses regression analysis to predict the number of miles to be traveled by thenations transit buses in future years. The historical data that forms the basis for this model canbe found in Appendix B.8. Generally speaking, increases in the number of transit bus miles traveledhave been proportional to increases in the number of transit buses on roadways. Therefore, thismodel could provide initial indication as to the demand for transit buses in the future. In thismodel, the independent variable is the year, and the dependent variable is the number of transitbus miles traveled in millions of miles. The results of the regression are as follows:
a = -141715ß = 74.4017R2 = 0.8633
The results of this regression can be seen in here in Figure 8.1.
95
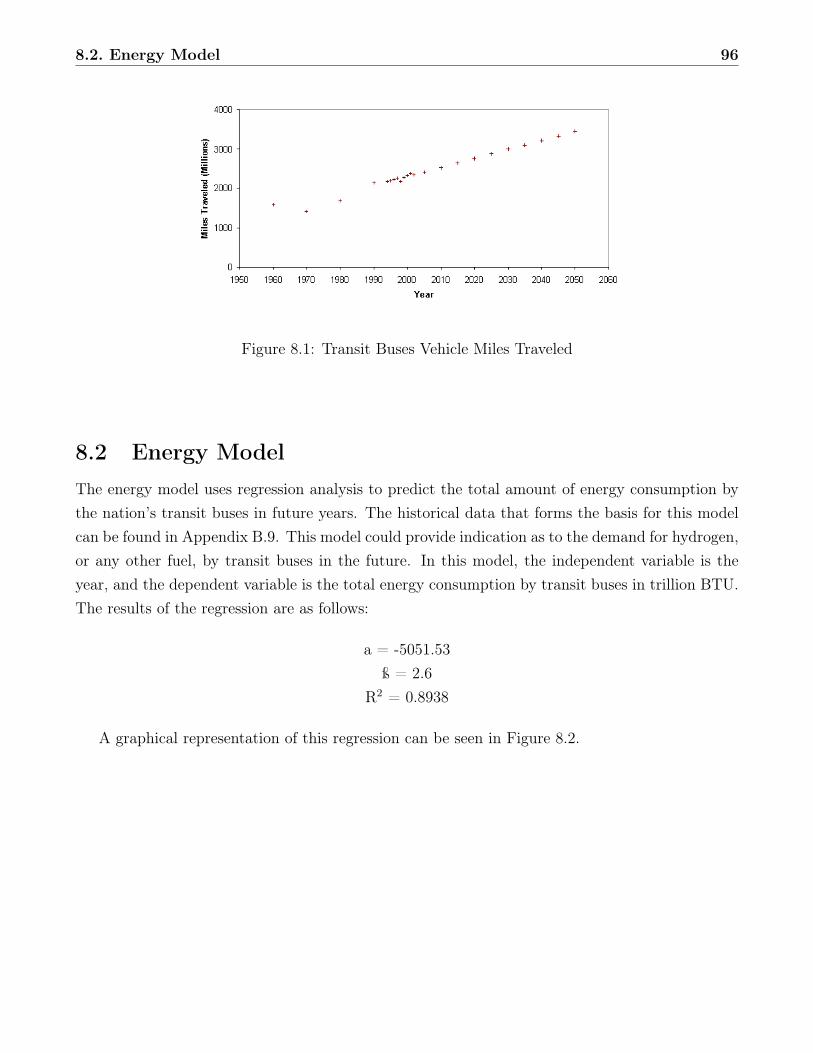
8.2. Energy Model 96
Figure 8.1: Transit Buses Vehicle Miles Traveled
8.2 Energy ModelThe energy model uses regression analysis to predict the total amount of energy consumption bythe nation’s transit buses in future years. The historical data that forms the basis for this modelcan be found in Appendix B.9. This model could provide indication as to the demand for hydrogen,or any other fuel, by transit buses in the future. In this model, the independent variable is theyear, and the dependent variable is the total energy consumption by transit buses in trillion BTU.The results of the regression are as follows:
a = -5051.53ß = 2.6
R2 = 0.8938
A graphical representation of this regression can be seen in Figure 8.2.
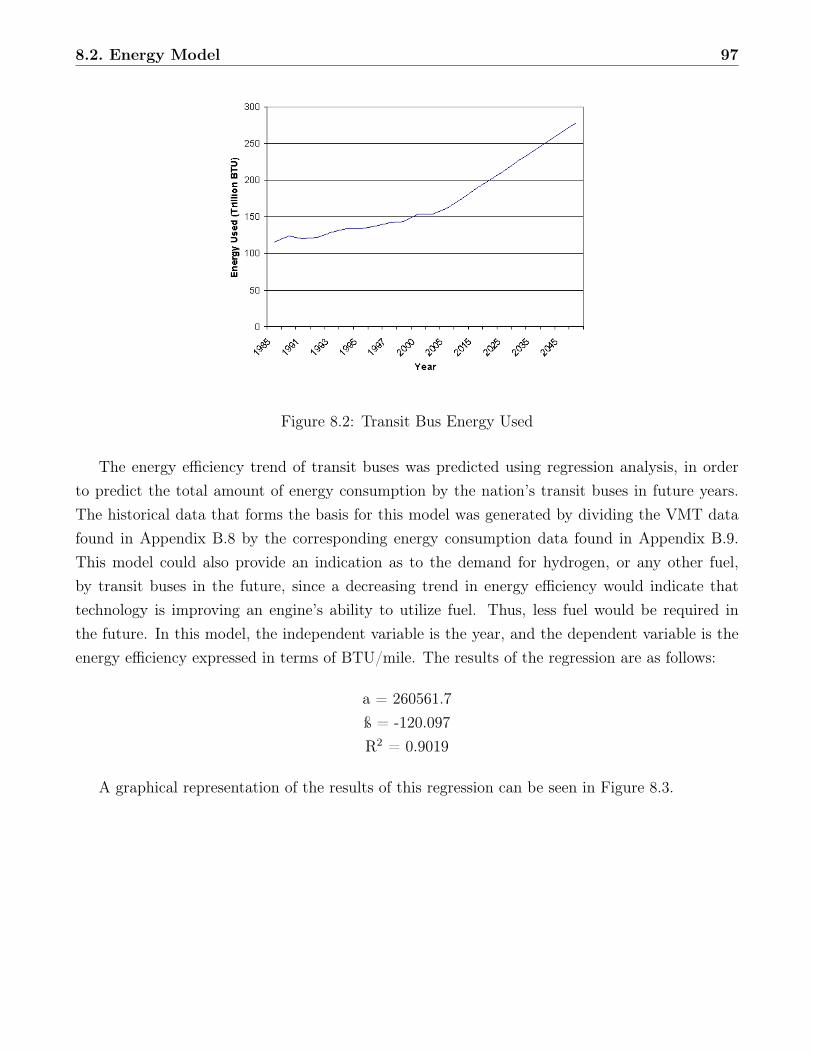
8.2. Energy Model 97
Figure 8.2: Transit Bus Energy Used
The energy efficiency trend of transit buses was predicted using regression analysis, in orderto predict the total amount of energy consumption by the nation’s transit buses in future years.The historical data that forms the basis for this model was generated by dividing the VMT datafound in Appendix B.8 by the corresponding energy consumption data found in Appendix B.9.This model could also provide an indication as to the demand for hydrogen, or any other fuel,by transit buses in the future, since a decreasing trend in energy efficiency would indicate thattechnology is improving an engine’s ability to utilize fuel. Thus, less fuel would be required inthe future. In this model, the independent variable is the year, and the dependent variable is theenergy efficiency expressed in terms of BTU/mile. The results of the regression are as follows:
a = 260561.7ß = -120.097R2 = 0.9019
A graphical representation of the results of this regression can be seen in Figure 8.3.
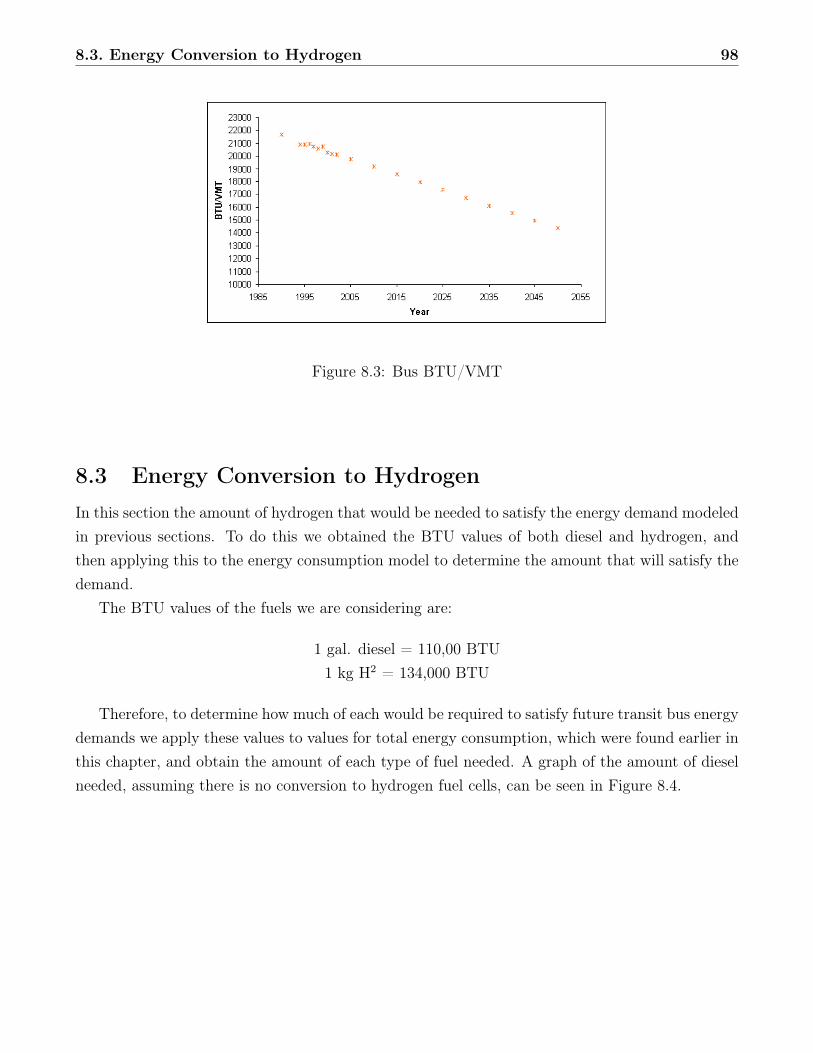
8.3. Energy Conversion to Hydrogen 98
Figure 8.3: Bus BTU/VMT
8.3 Energy Conversion to HydrogenIn this section the amount of hydrogen that would be needed to satisfy the energy demand modeledin previous sections. To do this we obtained the BTU values of both diesel and hydrogen, andthen applying this to the energy consumption model to determine the amount that will satisfy thedemand.
The BTU values of the fuels we are considering are:
1 gal. diesel = 110,00 BTU1 kg H2 = 134,000 BTU
Therefore, to determine how much of each would be required to satisfy future transit bus energydemands we apply these values to values for total energy consumption, which were found earlier inthis chapter, and obtain the amount of each type of fuel needed. A graph of the amount of dieselneeded, assuming there is no conversion to hydrogen fuel cells, can be seen in Figure 8.4.
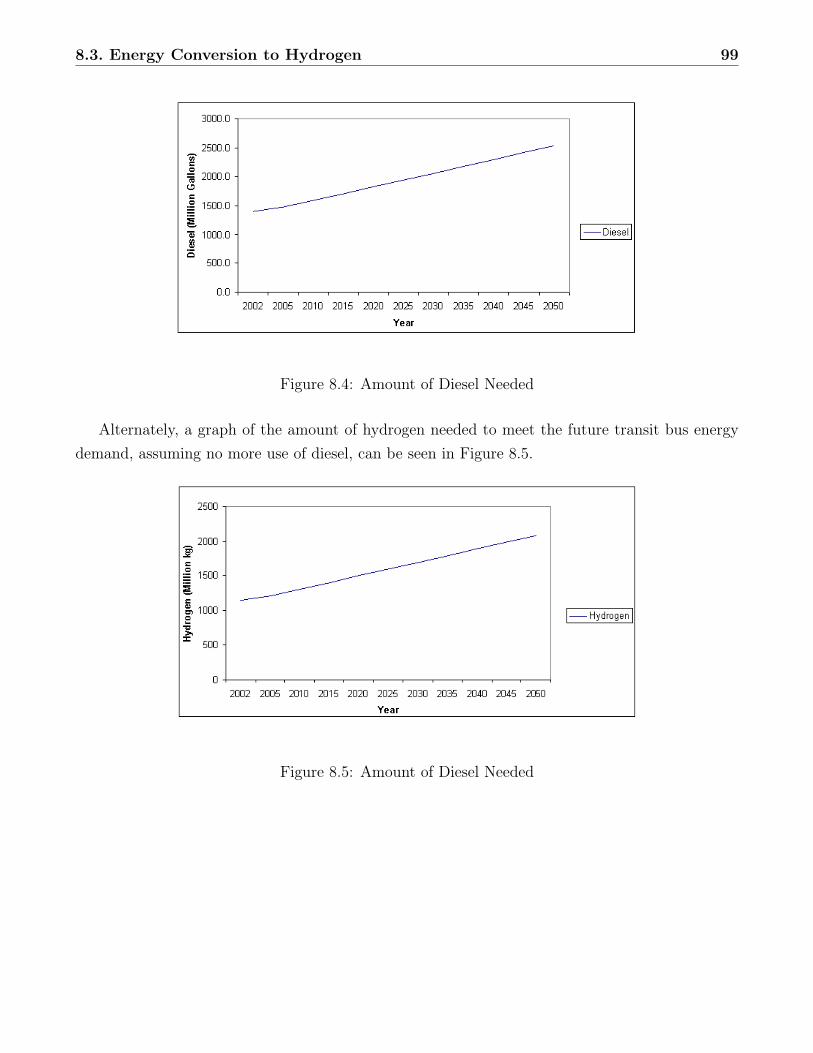
8.3. Energy Conversion to Hydrogen 99
Figure 8.4: Amount of Diesel Needed
Alternately, a graph of the amount of hydrogen needed to meet the future transit bus energydemand, assuming no more use of diesel, can be seen in Figure 8.5.
Figure 8.5: Amount of Diesel Needed
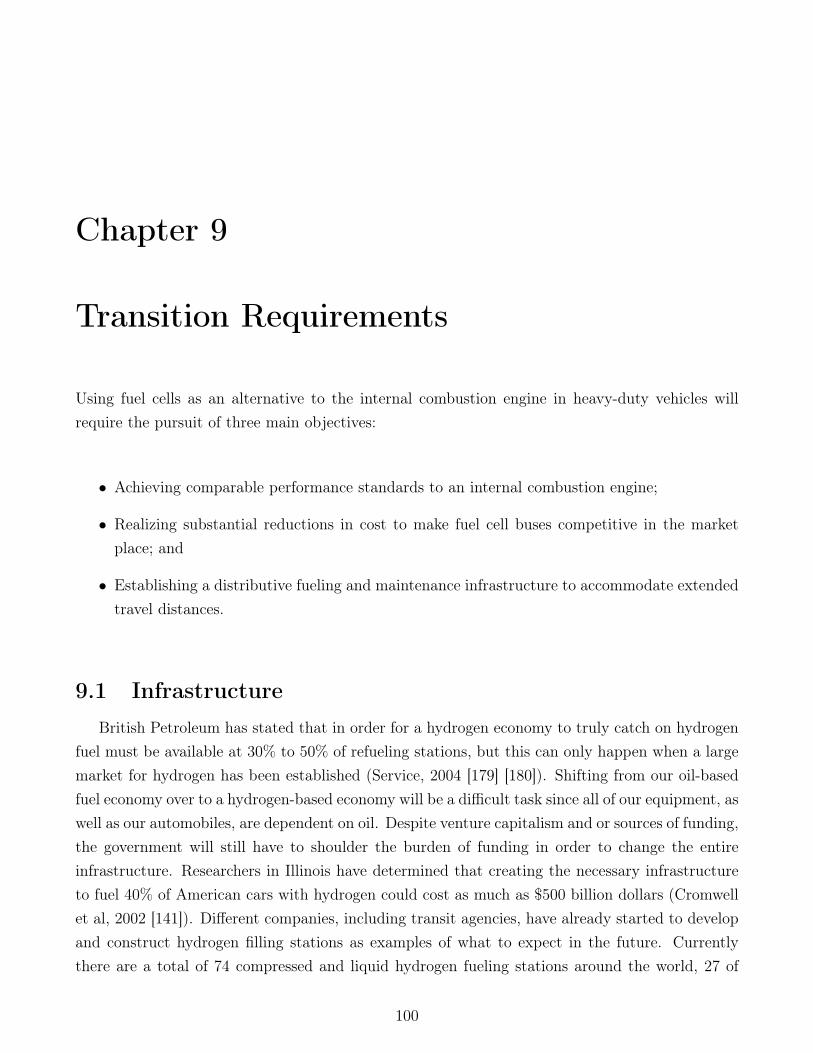
Chapter 9
Transition Requirements
Using fuel cells as an alternative to the internal combustion engine in heavy-duty vehicles willrequire the pursuit of three main objectives:
• Achieving comparable performance standards to an internal combustion engine;
• Realizing substantial reductions in cost to make fuel cell buses competitive in the marketplace; and
• Establishing a distributive fueling and maintenance infrastructure to accommodate extendedtravel distances.
9.1 InfrastructureBritish Petroleum has stated that in order for a hydrogen economy to truly catch on hydrogen
fuel must be available at 30% to 50% of refueling stations, but this can only happen when a largemarket for hydrogen has been established (Service, 2004 [179] [180]). Shifting from our oil-basedfuel economy over to a hydrogen-based economy will be a difficult task since all of our equipment, aswell as our automobiles, are dependent on oil. Despite venture capitalism and or sources of funding,the government will still have to shoulder the burden of funding in order to change the entireinfrastructure. Researchers in Illinois have determined that creating the necessary infrastructureto fuel 40% of American cars with hydrogen could cost as much as $500 billion dollars (Cromwellet al, 2002 [141]). Different companies, including transit agencies, have already started to developand construct hydrogen filling stations as examples of what to expect in the future. Currentlythere are a total of 74 compressed and liquid hydrogen fueling stations around the world, 27 of
100
9.1. Infrastructure 101
those in United States. In addition, 15 of these 27 are in California (Worldwide Hydrogen FuelingStations, 2002 [126]).
These pilot projects are usually broken down into three separate phases, which can take aslong as four years to complete. The first phase includes the overall design of the station, as wellas feasibility studies. The second phase is to construct subsystem development, while the thirdphase is the assembly and demonstration of the fully intergraded system (Kumar et al, 2002 [161]).During the developmental phase, it is important to maximize the potential for technological innova-tion while keeping costs at a minimum, primarily by limiting the size of the refueling infrastructure.
9.1.1 Physical RequirementsThe physical requirements for designing a hydrogen bus refueling station consist of a hydrogen
generation system, compression system, storage system, fuel dispenser, and piping. A bus mainte-nance facility or holding bay is also needed. The hydrogen generation can use various methods toproduce hydrogen gas, such as electrolysis, natural gas steam reforming, purification of chemicalby-products. Fueling stations have the option of generating their own hydrogen on-site or havingit delivered in liquid form.
For on-site production, most agencies are currently using electrolysis and natural gas steamreforming as the preferred method of hydrogen generation. As an example, Stuart Energy uses anelectrolyzer to generate hydrogen at 363 psi. In order to supply hydrogen for 100 to 2000 cars perday, an electrolyzer would have to produce 5 to 8 Megawatts (MW) of electricity.
A compressor is then used to raise the pressure of hydrogen up to 6,000 psi before it can beproperly stored. The storage module is built with either double wall carbon steel or carbon fibercomposite tanks, and stores the hydrogen using a buffer or a cascade method. The buffer methodstores hydrogen using a configuration consisting of a series of interconnected tanks that are filledand emptied as if they were one large tank. The cascade method stores hydrogen in a seriesof “banks,” managed by a control system that determines which bank is able to receive or deliverhydrogen. When hydrogen is being pumped out, the first bank delivers hydrogen until the pressureinside this bank equals that of the receiving tank. As the pressure equalizes, the next bank beginsto deliver its reservoir of hydrogen, and so on. This method is best for fast-fill vehicle fueling, aswell as minimizing on-site hydrogen storage space.
The fuel dispenser module consists of a hose, nozzle, and a management system that controlsthe operation of the dispenser and the flow of hydrogen to the vehicle. The system has the abilityto determine when the vehicle tank has reached full capacity, at which time it will automaticallystop dispensing. The system dispenses hydrogen at high pressure and takes an average of 10minutes to fill up a bus. The interface is the same as a gas station, which asks the customer touse a PIN number or a credit card as a form of payment (Stuart Energy Station, 2004 [110]).
9.1. Infrastructure 102
For off-site hydrogen production a distribution network is necessary. The hydrogen transporta-tion can be delivered using either pipelines or tanker trucks. It is preferable that the location ofthe filling station be in close proximity to the hydrogen production plant, in order to minimizetransportation costs. In some cases, hydrogen will be delivered in liquid form, requiring storagein underground liquid hydrogen storage tanks. From the storage tank, there will be a pump thatvaporizes the hydrogen and transfers gaseous hydrogen over to the filling station in compressedform. This type of system was used during the early onset of hydrogen technology in places likeChicago and Vancouver (The Bus of the Future, 2004 [113]).
During cold weather the buses must be kept warm in specially designed bays. If the buseswere to be left out in the cold the water vapor residual would freeze, thus damaging the fuelcells. However, the newer generations of fuel cells being design are much drier and may not needthis protection (Vogel, 2004 [191]). Xcellsis developed a “out-door style” bus maintenance facility,which can hold up to five buses at the time. This facility has tent-like structures consisting ofaluminum frame, fire proof canvas, and explosion proof lighting. This facility is designed to allowthe hydrogen to escape if in the event of a leak. However, this type of facility would not work inall climate zones, unless the facilities were to be heated during winter (Eudy et al, 2001 [145]).
The fueling facilities must follow specific guidelines for developing and constructing a hydro-gen dispensing station. The facility must be located outdoors, away from any operating electricalmachinery or overhead wires, and must provide appropriate mechanical design, electrical design,adequate clearances, safety provisions and equipment, appropriate use of materials, and security.As part of the mechanical design and electrical design of a filling station, there are many re-quirements that must be followed which include (Maintenance and Fueling Facility Guidelines,2001 [100]):
• The hose, compressor, tanks, piping manifold, and other hydrogen containing portions mustall be grounded properly.
• Check valves must be installed to ensure no blowback occurs.
• There must be pressure relief devices installed for the tanks in case of overpressure.
• The compressor must be explosion proof.
• The fuel dispenser must have a breakaway connection on each hose that limits the breakawayforce to 150 lbs.
• The fueling system must prevent entry of air into the vehicle fuel system.
• The fuel system must be automatically interrupted when the bus fuel tank contains lowpressure which indicates the presents of air.
9.1. Infrastructure 103
• There must be an Auto shut off capability when the bus is full.
• The fuel dispenser must have temperature compensation system.
• There must be vent provisions capable of discharging entire contents of vehicles fuel storageinto atmosphere.
• Any electrical equipment that produces sparks may not be used.
• All Electrical equipment must be grounded.
• Infrared or Ultraviolet flame sensors are required in the vicinity of the fueling facility.
• An emergency stop button is required, along with fire extinguishers.
One of the leading global providers of hydrogen refueling systems is Stuart Energy, which hasteamed up with various cities around the world in order to develop hydrogen fueling stations aswell as developing a hydrogen refueling system of their own at their headquarters in Mississauga,Ontario, Canada. The generator, which uses electrolysis, is capable of producing 25 kg/day ofhydrogen (12 Nm3/h) as well as storing 60 kg at 5,000 psi (Delivered Stuart Energy Stations,2004 [78]).
There are a number of Stuart Energy Stations currently in use around the world, which havethe ability to generate anywhere from 80 kg to 120 kg of hydrogen while servicing three buses a day.In Sacramento, California there is a hydrogen refueling station that consists of a 4,500 gallon liquidhydrogen storage tank, a compressor to raise the pressure to 6,250 psi, and two dispenser systemsto deliver hydrogen gas at 3,600 psi and 5,000 psi (California Fuel Cell Partnership, 2004 [95]).The fill time for each bus is approximately four minutes. Luxembourg, which is part of the CUTEproject, is running a two-year demonstration of a hydrogen dispensing system. In this case thehydrogen is delivered from off-site production. The fill time at this station is 10 minutes with atotal of 40 kg of hydrogen per bus. Amsterdam has a similar system, except that hydrogen isproduced on-site using electrolysis (The CUTE Amsterdam Project, 2004 [115]). AC Transit inCalifornia has two fueling stations in service, both using Stuart Energy electrolyzers. The firststation produces 24 kg/day of hydrogen, and the second puts out 50 kg/day, which can refuel upto 3 buses at 5,000 psi (California Fuel Cell Bus Trials, 2004 [77]). Ann Arbor, Michigan has astation which stores up to 1,500 gallons of hydrogen in liquid form. The fuel is then vaporized toform compressed hydrogen gas, producing enough fuel to fill four to five buses at a time and eightor more per day (Hydrogen Fueling Station, 2004 [95]).
General Electric has developed a hydrogen generation system designed for vehicle refueling. Thesystem uses a reformer to convert fuels to a hydrogen rich gas that can be easily purified. This
9.1. Infrastructure 104
technique can be applied for production of hydrogen from natural gas, diesel, coal, and renewablefeed-stock, such as biomass. The system also includes a purification unit, hydrogen compressor,high pressure tanks, and a dispensing unit. The efficiency of the generator was calculated tobe roughly 80%. However, some factors which could affect the efficiency of hydrogen productioninclude the conversion in the reformer, recovery of hydrogen, utilization of process heat to generateprocess steam, and minimization of parasitic losses. The system is built to produce 40 kg ofhydrogen and can refuel one bus or eight cars per day. (Kumar et al, 2002 [161]).
Sunline Agency in California uses two solar and grid power electrolyzers to produce hydrogen,though they also use steam reforming for hythane. The capacity of the electrolyzer is 1,400 standardcubic feet hour (SCFH). The storage system consists of a tube trailer and stationary tanks holdingapproximately 118,000 SCF of compressed hydrogen. In addition, there is a two-hose fuelingstation, one supplying compressed hydrogen gas, the other supplying Hythane. Since opening in2000, Sunline has used the hydrogen gas to fuel vehicles including a number of prototype FCVsand Hythane buses. This has allowed them to learn how to transition from compressed natural gasbuses to hydrogen buses while examining the reliability and maintainability of hydrogen poweredbuses (Cromwell III et al, 2002 [141]).
If the United States were to build larger hydrogen infrastructure systems to accommodate morebuses then the refueling plants would have to change to meet new needs. To meet the needs of6 to 30 buses a micro on-site generator would have to be built. For fleets of 30 to 200 buses, asmall on-site steam reformer or production plant would be required in order to accommodate thefleet. For a fleet of 200 to 2,000 buses, an off-site production plant with pipelines connected to therest of the system. Finally systems supplying 2,000 to 10,000 buses would require an integratedlarge-scale hydrogen plant to produce enough hydrogen.
As hydrogen technology evolves the United States must conduct initial demonstrations of hy-drogen systems including buses, support and maintenance facilities. As the load at each siteincreases, the on-site plant must expand proportionally. The next step would be to create largerplants with local pipelines until a large centralized production plant is created with multiple modesof distribution (Raman, 2000 [175]). An even better solution to energy storage would be to buildstationary reformers at existing compressed natural gas filling stations so hydrogen could be useddirectly as an energy carrier. The reformers would continuously run and would be shared by alarge number of consumers, thus minimizing developmental cost.
9.1.2 Financial RequirementsIn order to determine the financial requirements for building a hydrogen refueling facility, the
cost of building each component and the current cost of hydrogen must be considered. For hydrogen
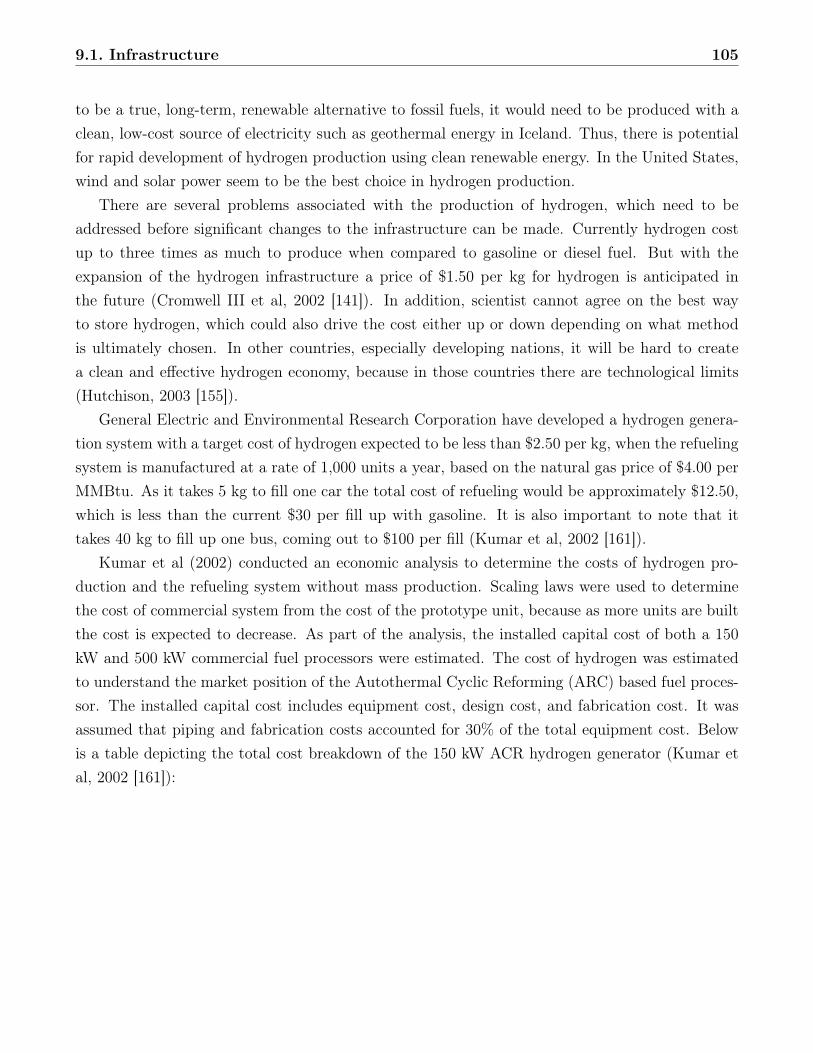
9.1. Infrastructure 105
to be a true, long-term, renewable alternative to fossil fuels, it would need to be produced with aclean, low-cost source of electricity such as geothermal energy in Iceland. Thus, there is potentialfor rapid development of hydrogen production using clean renewable energy. In the United States,wind and solar power seem to be the best choice in hydrogen production.
There are several problems associated with the production of hydrogen, which need to beaddressed before significant changes to the infrastructure can be made. Currently hydrogen costup to three times as much to produce when compared to gasoline or diesel fuel. But with theexpansion of the hydrogen infrastructure a price of $1.50 per kg for hydrogen is anticipated inthe future (Cromwell III et al, 2002 [141]). In addition, scientist cannot agree on the best wayto store hydrogen, which could also drive the cost either up or down depending on what methodis ultimately chosen. In other countries, especially developing nations, it will be hard to createa clean and effective hydrogen economy, because in those countries there are technological limits(Hutchison, 2003 [155]).
General Electric and Environmental Research Corporation have developed a hydrogen genera-tion system with a target cost of hydrogen expected to be less than $2.50 per kg, when the refuelingsystem is manufactured at a rate of 1,000 units a year, based on the natural gas price of $4.00 perMMBtu. As it takes 5 kg to fill one car the total cost of refueling would be approximately $12.50,which is less than the current $30 per fill up with gasoline. It is also important to note that ittakes 40 kg to fill up one bus, coming out to $100 per fill (Kumar et al, 2002 [161]).
Kumar et al (2002) conducted an economic analysis to determine the costs of hydrogen pro-duction and the refueling system without mass production. Scaling laws were used to determinethe cost of commercial system from the cost of the prototype unit, because as more units are builtthe cost is expected to decrease. As part of the analysis, the installed capital cost of both a 150kW and 500 kW commercial fuel processors were estimated. The cost of hydrogen was estimatedto understand the market position of the Autothermal Cyclic Reforming (ARC) based fuel proces-sor. The installed capital cost includes equipment cost, design cost, and fabrication cost. It wasassumed that piping and fabrication costs accounted for 30% of the total equipment cost. Belowis a table depicting the total cost breakdown of the 150 kW ACR hydrogen generator (Kumar etal, 2002 [161]):
9.1. Infrastructure 106
Table 9.1: Cost Breakdown of 150 kW ACR hydrogen generator
This is only the cost of the hydrogen generator, which excludes cost of hydrogen compressor,storage tanks, and dispenser. It was assumed that the equipment costs of mass-produced unitswould decrease by 5% when commercial units are built. For specialty equipment such as the steamgenerator the design were reduced by 50% and the fabrication costs were decreased by 25% asmore units are designed and built. The 500 kW system was scaled using the following power law:
(cost of 500kW system) = (costs of 150 kW system)(500/150)0.29
It was assumed that the scaling factor from 150 kW to 500 kW was a constant value of 0.29.Results in an installed capital cost of $675,000 for a 500 kW commercial hydrogen generator. Thecost of hydrogen generation for a 500 kW commercial unit was calculated based on the net revenuerequired, which was determined from the capital investment, operating and maintenance costs,and fuel and electricity costs. This was the cost estimated through the economical analysis thatwas conducted. It did not consider the cost reduction due to mass production and the cost ofhydrogen compression, storage and dispensing (Kumar et al, 2002 [161]).
The Stuart Energy P3 electrolyzer has the capability to produce 1,400 SCFH of hydrogen.The cost of purchasing a Stuart elctrolyzer, which includes the compressor, is $350,000. Stuart’stube trailer storage unit can cost up to $115,000, while the fixed ground storage unit cost $54,000.Stuart’s hydrogen dispenser is priced at $50,000. These prices are for the cost of the individualunit, but do not take into account the cost of design and fabrication (Cromwell III et al, 2002 [141]).If someone were to design a system with off-site hydrogen production, it is important to minimizethe delivery distance. If the delivery distance were to exceed several hundred miles, then thetransportation cost of hydrogen would exceed its production cost.
In 1998, Chicago Transit Authority, the second largest U.S. public transportation system, hada hydrogen station, including a maintenance facility, built as a part of a two-year demonstrationprogram. The cost per bus was estimated to be $1.4 million, for three buses in total. The fuelingstation and fuel cost $600,000, along with $1.6 million for spare parts and technical assistance.During the winter the weather in Chicago can drop below freezing, which meant $1.5 million wasneeded to be spent modify the garage for the buses. An additional $1 million was spent on training,
9.2. Reconfiguration of HDVs 107
maintenance, and project management (Lang, 2000 [162]).The cost of designing a new infrastructure can be expected to vary for different transportation
agencies. It depends on the manufacturer, the state in which the agency is located, and the amountof funding received. Sunline Transit in California had developed an on-site partial oxidationreformer of natural gas which has the ability to fuel four or five buses per day. The cost of thissystem was $450,000. The storage system consisted of 16 tube trailer cylinder tanks (104,000SCF), at a total price of $104,000, and two stationary cylinder tanks (14,000 SCF) at a total priceof $54,000 (Eudy et al, 2001 [145]). Funding from the California Transportation Authority wasdivided amongst different agencies for the construction of buses, infrastructure, and operations.Sunline received $4 million while AC Transit and VTA were awarded $15 million and $18.45 millionrespectively (California Fuel Cell Bus Trials, 2005 [77]).
Los Angeles International Airport has built the first retail hydrogen fueling station, whichopened in October of 2004. Praxair was contacted to design, engineer, equip, construct, and operatethe 600 ft2 state-of-the-art facility. The facility was built with high pressure hydrogen storage onthe roof. The total cost came out to $1,580,048. Praxair funded construction by spending $550,000of its own funds, while the rest of the money came from grants totaling $1,030,048. The airportcurrently has 50% of its vehicles running on alternative fuels, and is a great step toward changingthe infrastructure. The lease agreement for this facility is for three years with no fees and has atwo year option for Praxair to extend the lease at $27,355 a year (Hydrogen Now, 2005 [98]).
There are several other projects worth nothing around the world. The project that is currentlyunderway in Amsterdam as a part of the CUTE program received funding worth $9.9 million topurchase hydrogen buses as well as design, construct, and operate the infrastructure. In WesternAustralia there is a two-year fuel cell bus demonstration that operates three fuel cell buses as apart of the CUTE program. The total funding for this project was calculated to be $9.95 million.As for the construction of maintenance facilities, Xcellsis redesigned a five bus holding bay in orderto keep the buses warm during the winter season for $95,000.
9.2 Reconfiguration of HDVsIn the last ten years, fuel cell technology has made significant developmental strides in the
automotive industry. Fuel cells have become the future, aiming to replace internal combustionengines with a clean, quiet, efficient, and environmentally sound alternative. The design of heavy-duty fuel cell engines has been refined to the point that 40 foot urban transit buses poweredby one and weighing in excess of 13,600 kg, is able to carry 70 to 80 passengers up grades inexcess of 15% and travel on the highway at top speeds of 65 mph, all while offering quick andmore efficient acceleration. Despite this, there are many questions that still need to be answered,
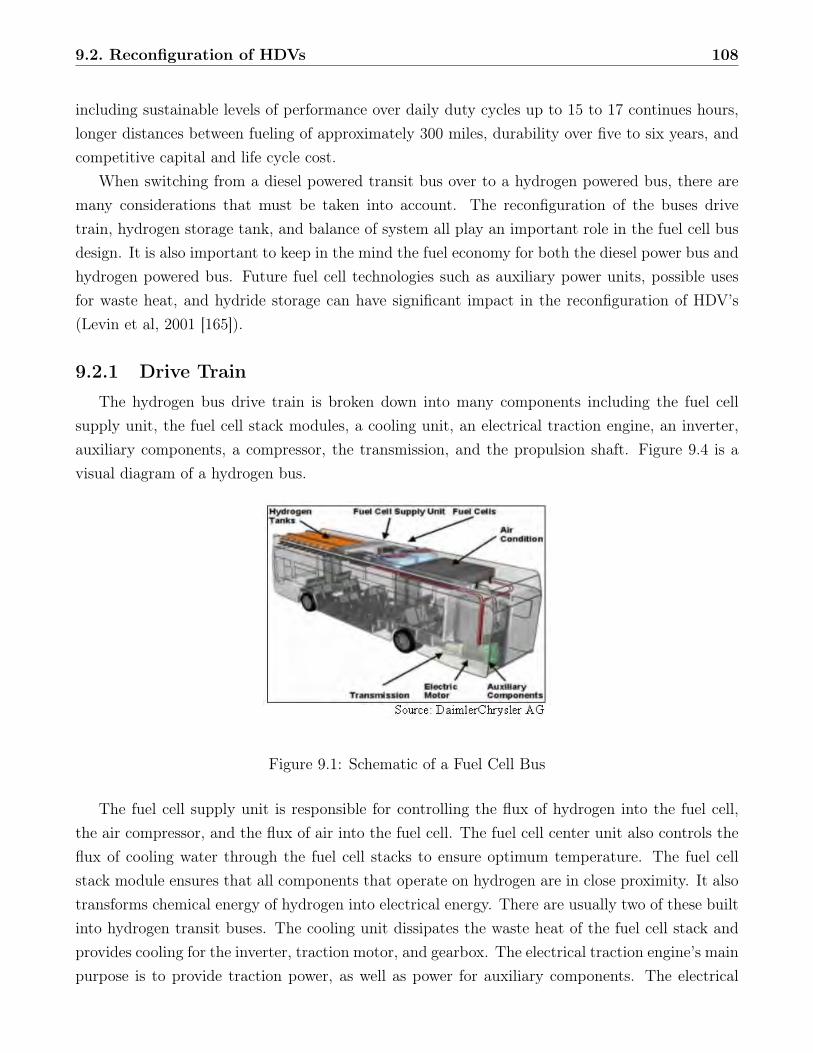
9.2. Reconfiguration of HDVs 108
including sustainable levels of performance over daily duty cycles up to 15 to 17 continues hours,longer distances between fueling of approximately 300 miles, durability over five to six years, andcompetitive capital and life cycle cost.
When switching from a diesel powered transit bus over to a hydrogen powered bus, there aremany considerations that must be taken into account. The reconfiguration of the buses drivetrain, hydrogen storage tank, and balance of system all play an important role in the fuel cell busdesign. It is also important to keep in the mind the fuel economy for both the diesel power bus andhydrogen powered bus. Future fuel cell technologies such as auxiliary power units, possible usesfor waste heat, and hydride storage can have significant impact in the reconfiguration of HDV’s(Levin et al, 2001 [165]).
9.2.1 Drive TrainThe hydrogen bus drive train is broken down into many components including the fuel cell
supply unit, the fuel cell stack modules, a cooling unit, an electrical traction engine, an inverter,auxiliary components, a compressor, the transmission, and the propulsion shaft. Figure 9.4 is avisual diagram of a hydrogen bus.
Figure 9.1: Schematic of a Fuel Cell Bus
The fuel cell supply unit is responsible for controlling the flux of hydrogen into the fuel cell,the air compressor, and the flux of air into the fuel cell. The fuel cell center unit also controls theflux of cooling water through the fuel cell stacks to ensure optimum temperature. The fuel cellstack module ensures that all components that operate on hydrogen are in close proximity. It alsotransforms chemical energy of hydrogen into electrical energy. There are usually two of these builtinto hydrogen transit buses. The cooling unit dissipates the waste heat of the fuel cell stack andprovides cooling for the inverter, traction motor, and gearbox. The electrical traction engine’s mainpurpose is to provide traction power, as well as power for auxiliary components. The electrical
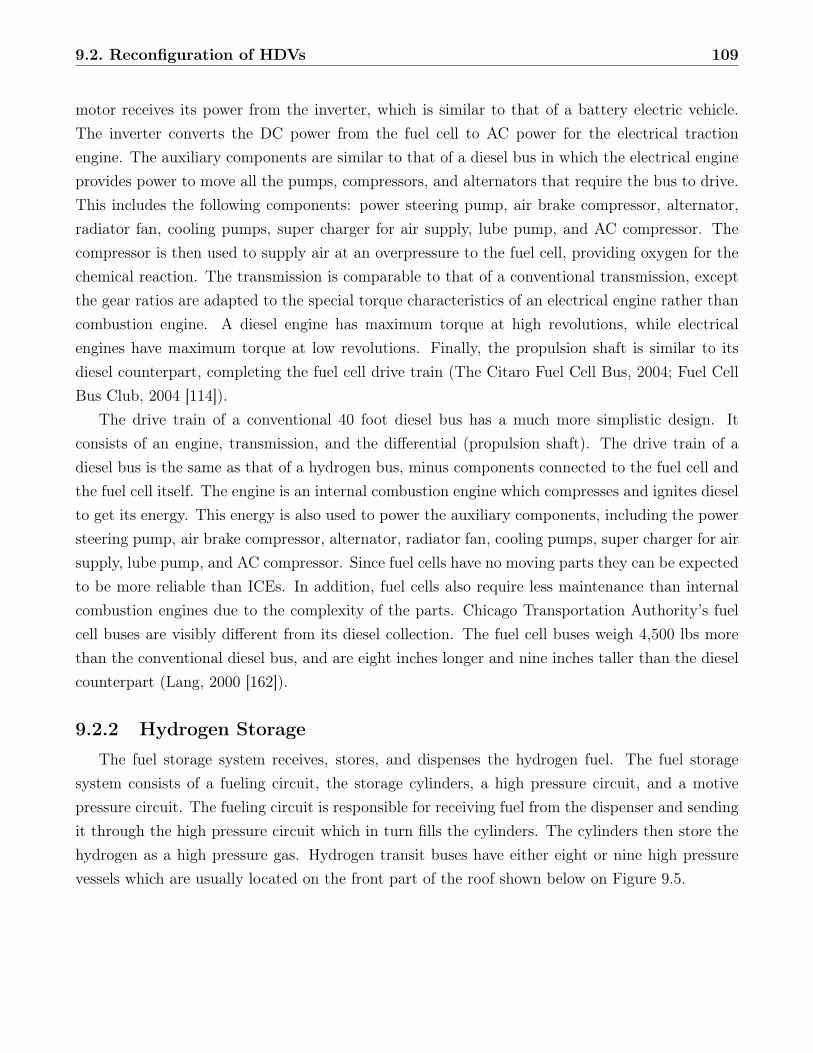
9.2. Reconfiguration of HDVs 109
motor receives its power from the inverter, which is similar to that of a battery electric vehicle.The inverter converts the DC power from the fuel cell to AC power for the electrical tractionengine. The auxiliary components are similar to that of a diesel bus in which the electrical engineprovides power to move all the pumps, compressors, and alternators that require the bus to drive.This includes the following components: power steering pump, air brake compressor, alternator,radiator fan, cooling pumps, super charger for air supply, lube pump, and AC compressor. Thecompressor is then used to supply air at an overpressure to the fuel cell, providing oxygen for thechemical reaction. The transmission is comparable to that of a conventional transmission, exceptthe gear ratios are adapted to the special torque characteristics of an electrical engine rather thancombustion engine. A diesel engine has maximum torque at high revolutions, while electricalengines have maximum torque at low revolutions. Finally, the propulsion shaft is similar to itsdiesel counterpart, completing the fuel cell drive train (The Citaro Fuel Cell Bus, 2004; Fuel CellBus Club, 2004 [114]).
The drive train of a conventional 40 foot diesel bus has a much more simplistic design. Itconsists of an engine, transmission, and the differential (propulsion shaft). The drive train of adiesel bus is the same as that of a hydrogen bus, minus components connected to the fuel cell andthe fuel cell itself. The engine is an internal combustion engine which compresses and ignites dieselto get its energy. This energy is also used to power the auxiliary components, including the powersteering pump, air brake compressor, alternator, radiator fan, cooling pumps, super charger for airsupply, lube pump, and AC compressor. Since fuel cells have no moving parts they can be expectedto be more reliable than ICEs. In addition, fuel cells also require less maintenance than internalcombustion engines due to the complexity of the parts. Chicago Transportation Authority’s fuelcell buses are visibly different from its diesel collection. The fuel cell buses weigh 4,500 lbs morethan the conventional diesel bus, and are eight inches longer and nine inches taller than the dieselcounterpart (Lang, 2000 [162]).
9.2.2 Hydrogen StorageThe fuel storage system receives, stores, and dispenses the hydrogen fuel. The fuel storage
system consists of a fueling circuit, the storage cylinders, a high pressure circuit, and a motivepressure circuit. The fueling circuit is responsible for receiving fuel from the dispenser and sendingit through the high pressure circuit which in turn fills the cylinders. The cylinders then store thehydrogen as a high pressure gas. Hydrogen transit buses have either eight or nine high pressurevessels which are usually located on the front part of the roof shown below on Figure 9.5.
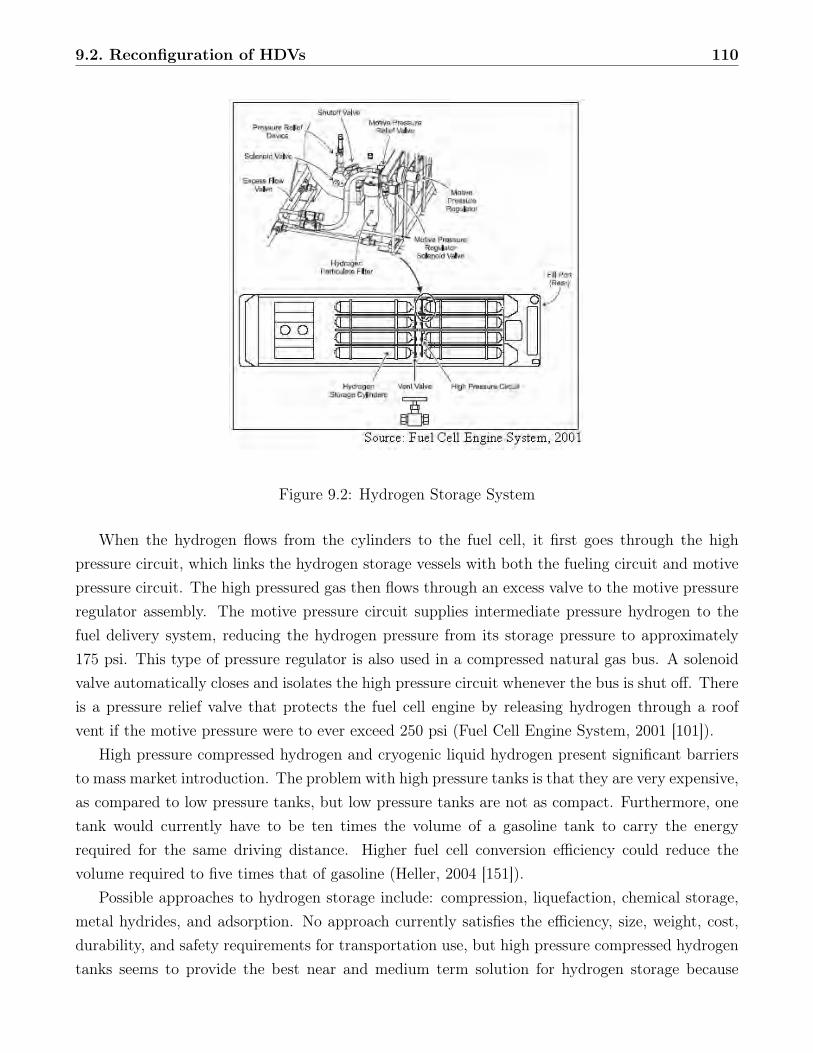
9.2. Reconfiguration of HDVs 110
Figure 9.2: Hydrogen Storage System
When the hydrogen flows from the cylinders to the fuel cell, it first goes through the highpressure circuit, which links the hydrogen storage vessels with both the fueling circuit and motivepressure circuit. The high pressured gas then flows through an excess valve to the motive pressureregulator assembly. The motive pressure circuit supplies intermediate pressure hydrogen to thefuel delivery system, reducing the hydrogen pressure from its storage pressure to approximately175 psi. This type of pressure regulator is also used in a compressed natural gas bus. A solenoidvalve automatically closes and isolates the high pressure circuit whenever the bus is shut off. Thereis a pressure relief valve that protects the fuel cell engine by releasing hydrogen through a roofvent if the motive pressure were to ever exceed 250 psi (Fuel Cell Engine System, 2001 [101]).
High pressure compressed hydrogen and cryogenic liquid hydrogen present significant barriersto mass market introduction. The problem with high pressure tanks is that they are very expensive,as compared to low pressure tanks, but low pressure tanks are not as compact. Furthermore, onetank would currently have to be ten times the volume of a gasoline tank to carry the energyrequired for the same driving distance. Higher fuel cell conversion efficiency could reduce thevolume required to five times that of gasoline (Heller, 2004 [151]).
Possible approaches to hydrogen storage include: compression, liquefaction, chemical storage,metal hydrides, and adsorption. No approach currently satisfies the efficiency, size, weight, cost,durability, and safety requirements for transportation use, but high pressure compressed hydrogentanks seems to provide the best near and medium term solution for hydrogen storage because
9.2. Reconfiguration of HDVs 111
significant cost reductions are possible with future optimization coupled with economics of scale(Sirosh et al, 2003 [182]).
Goals for hydrogen storage cylinders consist of cutting costs, increasing efficiency, and prepa-rations for mass production. Therefore, funding for research is critical; the DOE has been askedto triple research funding from $11 million to $30 million for bus storage tanks in 2004. Currentlya 5,000 psi tank can hold enough hydrogen for 182 miles while a 10,000 psi tank has an efficiencyof 300 miles. The cost of these high pressured tanks ranges from $20,000 to $50,000 per tank.The goal is to bring the price range down to $200 to $500 per tank. To cut costs, researchers areworking on finding ways to improve and mechanize tank construction by applying carbon fiber tothe outside. Carbon fiber is one of the strongest yet lightest materials and costs $10 per pound(Bennett, 2003 [134]). The only problem is the cost of carbon fiber is too high to achieve DOEscost goal of $5 per kWH, even if significant raw material cost reduction due to economics of scale istaken into account. Since carbon fiber cost is a large portion of the overall cost of building storagetanks, the amount of carbon fiber would have to be reduced while maintaining equivalent levels ofperformance and safety (Ko et al, 2004 [160]).
What makes hydrogen unique is that at room temperature and standard pressure, hydrogentakes up roughly 3,000 times as much space as gasoline. Thus, 10,000 psi tanks take up to eighttimes the volume of a current gas tank to store the equivalent amount of fuel (Cromwell III et al,2002 [141]). The current dimension for a 5,000 psi compressed hydrogen storage tank for buseshas a diameter of 11 inches and a length of 83 inches and weighs five kg.
The DOEs target for hydrogen storage systems in 2010 is to extract from hydrogen a usablespecific energy of about 2.0 kWH per kg and a energy density of 1.5 kWH per Liter. The DOErequest the hydrogen delivery temperature to be in a range of -30oC to 100oC with a cost of $4.00per kWH and a cycle life of 1,000 cycles (Sachtler, 2004 [177]).
9.2.3 Balance of SystemThe balance of system for a hydrogen bus is similar to that of a conventional diesel bus. The only
differences are the added safety features to protect the hydrogen tanks from direct impact as well asdetect any possible leaks in the system. The opportunity for hydrogen to escape in large volume’sis rare, but could occur due to tank rupture or breaking of connecting lines between tanks and theshut-off device. Also, the release of small quantities of hydrogen could be due to leaky fittings orconnections. Therefore, a leak detection system is added to detect the presence of hydrogen andpasses alarm signals to the vehicle’s control system. The leak detection system consists of a seriesof leak sensors, leak indicators, and a junction box. The leak sensors are calibrated to measurehydrogen gas concentrations and are strategically placed with in the bus. The hydrogen leakindicator associated with the sensor compensates for resistance change by altering the electricalpower fed which is proportional to the amount of gas present and records a measurement of the
9.2. Reconfiguration of HDVs 112
current gas concentration. Thus, each leak indicator powers a single sensor and displays the gasconcentration detected by that sensor. If the gas concentration on any hydrogen leak indicatorexceeds an internal threshold, a warning is sent from the indicator through a junction box to thecontrol system, which in turn alerts the driver and shuts the engine down. There is also a firesuppression system organized in a series of zones that serve specific areas in the bus. The systemis active at all times unless the battery power is interrupted. The fire sensors are located in areasof highest fire probability (Fuel Cell Engine System, 2001 [101]).
In order to protect the tanks from direct impact, mechanical safety features must be constructedin such a way as to prevent explosions from happening. All of the hydrogen buses must be builtwith a reinforced body frame to protect tanks in case of side collision. Earlier models like theliquid hydrogen buses which ran in Germany had the tanks mounted close to the centerline at thebottom of the bus due to limited knowledge of roof installation. There was also protective panelingbeneath the tanks to prevent from stone chipping damage. Having the tanks located beneath thebus seemed like a dangerous idea, and they were then moved to the roof (Davis/Sacramento,2000 [92]).
Weight discounts can be realized with advancement in technology. Pacific Northwest NationalLaboratory and the Northwest Alliance for Transportation Technology (NATT), in partnershipwith DaimlerChrysler, the DOE, and Alcoa, have developed three prototype lightweight vehicleframes that are steel and aluminum hybrids. This provides close to a 30% weight reduction inthe Dodge Durango. Prototype windshields that are supposed to be 30% lighter than currentwindshield, which also retain optical, thermal and safety properties, are in the process of beingdeveloped (PNNL Breakthroughs Magazine, 2002 [102]).
9.2.4 Fuel EconomyThe current generation of fuel cell buses have 205 kW PEM fuel cells on board. Most use
compressed hydrogen gas and can travel between 124 to 250 miles before refueling (Fuel Cell Buses,2000 [87]). During demonstration of the fuel cell bus, there have been many comparisons made toits diesel counterpart. It can be said that the system efficiency of fuel cell buses will be higher thanthat of diesel buses, resulting in lower fuel consumption. In fact, researchers have noticed thatthe fuel cell demonstrated 46% fuel efficiency, while the diesel engine demonstrated only 20% fuelefficiency (Cole, 1998 [140]). Since production, compression, cooling and transport of hydrogenrequire energy, the impact of fuel cell usage will depend on the methods and materials used in theseprocesses. This means that well-to-wheel efficiencies and life cycle assessments must be calculatedto determine the overall environmental and technical effects of fuel cell usage compared to diesel.
Currently, Sunline has the Thunderpower bus which is being used for fuel cell demonstration.The Thunderpower bus looks like a standard diesel bus but is able to cover 11 miles per gallon ofdiesel equivalent, which is currently three times that of the fuel economy of a 40 foot conventional
9.2. Reconfiguration of HDVs 113
bus which gets 3.5 miles per gallon of diesel. The Thunderpower accommodates 26 passengersand has a range of 175 to 200 miles before requiring refueling (Sunline Test Drives Hydrogen Bus,2003 [156]).
9.2.5 Future FC TechnologyIn this section we will discuss potential future development in fuel cells, and their possible
impact in heavy-duty vehicles. This will include the use of fuel cell auxiliary power units in tractortrailer trucks during idling, possible use of hydrides as a fuel storage medium, and possible use ofwaste heat to heat the hydride compound.
Fuel Cell Auxiliary Power Units
Fuel cell auxiliary power units (APU) have been discussed as a possible option for truck idling.Since truck drivers spend majority of their time on the highway, they often use rest stops as aplace to sleep. Heavy-duty line-haul engines idle approximately 20-40% of the time the engine isrunning, to control heating in the cabin and sleep compartment accessories. The EPA estimatesthat a truck spends up to an average of 8 hours a day for 300 days in a year idling, in some caseswith line-haul sleeper tractors up to a total of 10 hours each day. Idling is a big problem becauseit increases air pollution and energy use, as well as wear down the engine. Currently there is nofederal law against idling, but a patchwork of idling rules has been adopted by local and stategovernment (UCD, 2002 [81]). In Massachusetts there is a law that prohibits unnecessary idling ofall motor vehicles that are stopped for a foreseeable period of time over five minutes. Effectively,if your vehicle is going to be stopped for more than five minutes, the engine must be shut down.Drivers who violate this law may be subject to a fine (EPA, 2004 [76]). Idling engines operatevery inefficiently, with only a 3% energy efficiency, compared to 40% efficiency when running onthe highway. An estimated $1 billion is spent on fuel for idling and another $1 billion on enginewear and maintenance due to idling. For this reason the concept of a fuel cell APU system wasdeveloped by Freightliner and Ballard Power Systems. The fuel cell APU diminishes idling time byutilizing advanced emissions free fuel cell technology to deliver electrical power. It has been saidthat the fuel cell APU could save between 0.2 and 1 ton NOx which is between 6% and 29% NOx
emissions reduction in addition to reducing cost spent on fuel and engine repair (UCD, 2002 [81]).Researchers are currently looking into using a 5 kW PEM fuel cell to provide electrical power
to the cabin. The cost of a fuel cell ranges from $2,000 to $9,000 per kW, including fuel cell stack,auxiliary systems, and power & control electronics, but not the hydrogen storage system. Usingan average price of $5,000 per kW the 5 kW PEM fuel cell would cost up to $25,000. There areadditional capital costs associated with the fuel cell APUs, including fuel tank cost, installationcost, operation and maintenance, auxiliary heater and air conditioner, plumbing and wiring cost
9.2. Reconfiguration of HDVs 114
and trace inverter cost. Using these costs along with the price of diesel per gallon and the priceof hydrogen per gigajoule, an optimistic payback period of approximately 4.5 years was calculatedusing a $3,000 per kW fuel cell. The number of years would increase if the price range per kW washigher (UCD, 2002 [81]).
The United States Army has also adopted the idea of using a fuel cell APU in their trucksin order to improve the efficiency of its mobile power systems through increased fuel economy,reduced emissions, and the prospect of significant logistical savings. A 5 kW solid oxide fuelcell was installed in one of their tractor-trailers. The 42 volts of energy provides power for airconditioning, environmental controls and other electrical equipment. The fuel cell provides a cleanand quiet alternative energy source, which helps the army especially with stealth capabilities whenon watch (Newswire, 2002 [121]).
Hydrides and Waste Heat Use
One of the most significant barriers to the widespread application of hydrogen-based propulsionis the current state of on-board storage systems. Current hydrogen storage methods include com-pressed gas, liquid, metal hydrides and chemical hydrides. All have advantages and disadvantages,but none have proven to be more superior to the other (Anton et al, 2003 [127]).
Hydrides, believed by some experts to be the future of hydrogen storage technology, consist ofmetals, or other elements, and hydrogen. The metal hydrides are metallic compounds producedin much the same way as other metal alloys but have one differentiating factor. When exposedto hydrogen at certain pressures and temperatures, they absorb large quantities of gases, such ashydrogen (HERA, 2004 [118]).
Metal hydrides are the safest way to store flammable hydrogen gas. These metal hydridesreact at near room temperature to hydrogen at pressures a few times greater than the earthsatmosphere. The process of absorption works by taking a metal crystal and surrounding it withhydrogen gas molecules, forcing the hydrogen molecules to stick to the metal surface and breakdown into hydrogen atoms. The hydrogen atoms then penetrate into the interior of the metalcrystal to form the metal hydride. In order for this process to begin the pressure must be aboveequilibrium, meaning heat will be released. The process of desorption takes in heat in order to forcethe hydrogen atoms to surface, recombine into hydrogen molecules, thus flow away as hydrogengas. This will happen only if the pressure is below equilibrium.
Figure 9.6 below shows the process of absorption and desorption (Solid-HTM , 2004 [107]).
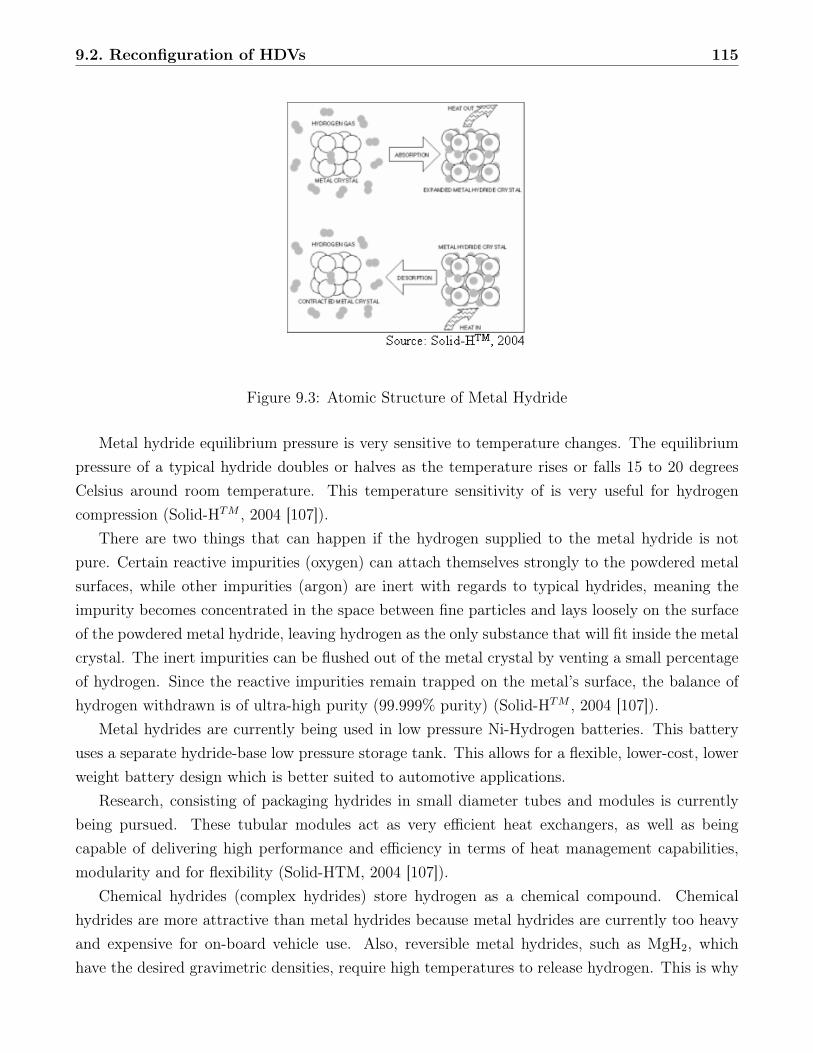
9.2. Reconfiguration of HDVs 115
Figure 9.3: Atomic Structure of Metal Hydride
Metal hydride equilibrium pressure is very sensitive to temperature changes. The equilibriumpressure of a typical hydride doubles or halves as the temperature rises or falls 15 to 20 degreesCelsius around room temperature. This temperature sensitivity of is very useful for hydrogencompression (Solid-HTM , 2004 [107]).
There are two things that can happen if the hydrogen supplied to the metal hydride is notpure. Certain reactive impurities (oxygen) can attach themselves strongly to the powdered metalsurfaces, while other impurities (argon) are inert with regards to typical hydrides, meaning theimpurity becomes concentrated in the space between fine particles and lays loosely on the surfaceof the powdered metal hydride, leaving hydrogen as the only substance that will fit inside the metalcrystal. The inert impurities can be flushed out of the metal crystal by venting a small percentageof hydrogen. Since the reactive impurities remain trapped on the metal’s surface, the balance ofhydrogen withdrawn is of ultra-high purity (99.999% purity) (Solid-HTM , 2004 [107]).
Metal hydrides are currently being used in low pressure Ni-Hydrogen batteries. This batteryuses a separate hydride-base low pressure storage tank. This allows for a flexible, lower-cost, lowerweight battery design which is better suited to automotive applications.
Research, consisting of packaging hydrides in small diameter tubes and modules is currentlybeing pursued. These tubular modules act as very efficient heat exchangers, as well as beingcapable of delivering high performance and efficiency in terms of heat management capabilities,modularity and for flexibility (Solid-HTM, 2004 [107]).
Chemical hydrides (complex hydrides) store hydrogen as a chemical compound. Chemicalhydrides are more attractive than metal hydrides because metal hydrides are currently too heavyand expensive for on-board vehicle use. Also, reversible metal hydrides, such as MgH2, whichhave the desired gravimetric densities, require high temperatures to release hydrogen. This is why
9.3. Cost Model 116
there is currently there is no metal hydride that meets all of the DOE 2010 storage system targets.Therefore, complex hydrides, such as NaAlH4, have been the focal point of research. They havethe ability to reversibly absorb hydrogen at lower pressures and temperatures than MgH4, andhave a higher gravimetric capacity and lower cost than LaNi5H6n (another metal hydride) (Leschet al, 2004 [164]).
Metal hydrides and chemical hydride both have their advantages and disadvantages. In partic-ular, a disadvantage of metal hydrides is their low hydrogen capacities, less than 2 wt% for alloyswith discharge temperatures that the waste heat for a PEM fuel can provide. On the other hand,chemical hydride materials have high capacities but are classified as irreversible, meaning the entirematerial must be replaced during refueling, as opposed to being simply charged with hydrogen gas.There is research that focuses on the reversible chemical hydride, NaAlH4, which has a capacityof 5.5 wt%, and seeks to enhance the material for improved charging and discharging rates as wellas increased capacity. This could be applied to developing a storage system which will reversiblystore a high wt% of hydrogen at lower pressure for an indefinite amount of time (Anton, et al,2003 [127]).
Another problem with hydride-based systems is that they cost several thousand dollars perkilogram of stored hydrogen and for large prototypes it can cost up to tens of thousands of dollars.But in mass produced quantities this price will go down substantially. The hydrides currentlyused are nevertheless expensive and do not store enough hydrogen to allow their commercialconsideration in vehicular applications (Hubert email, 2004 [154]). A small metal hydride unitcan cost up to $60,000 per kg, with units having been constructed to hold as much as 27 kg ofhydrogen (NREL, 1998 [128]).
9.3 Cost ModelAnother useful tool in examining the potential of hydrogen as a fuel for transit buses is a modeldescribing the aggregate production cost of a bus based on its major components. This is quiteimportant, as the cost of hydrogen buses will be a major consideration in any transition. Forthe purposes of this model, the costs of transit buses were divided into three components; powersystem, fuel storage, and balance of system. The power system consists of the power system andall attendant systems, and in hydrogen fuel cell buses, is effectively determined entirely by thecost of the fuel cell. The fuel storage category contains the fuel storage tanks and the fuel deliverysystem, though again, in hydrogen buses, the cost is dominated by the more exotic technology; inthis case the hydrogen storage tanks. Finally, the balance of system encompasses all other partsof the bus, and is consistent across both conventional and hydrogen buses.
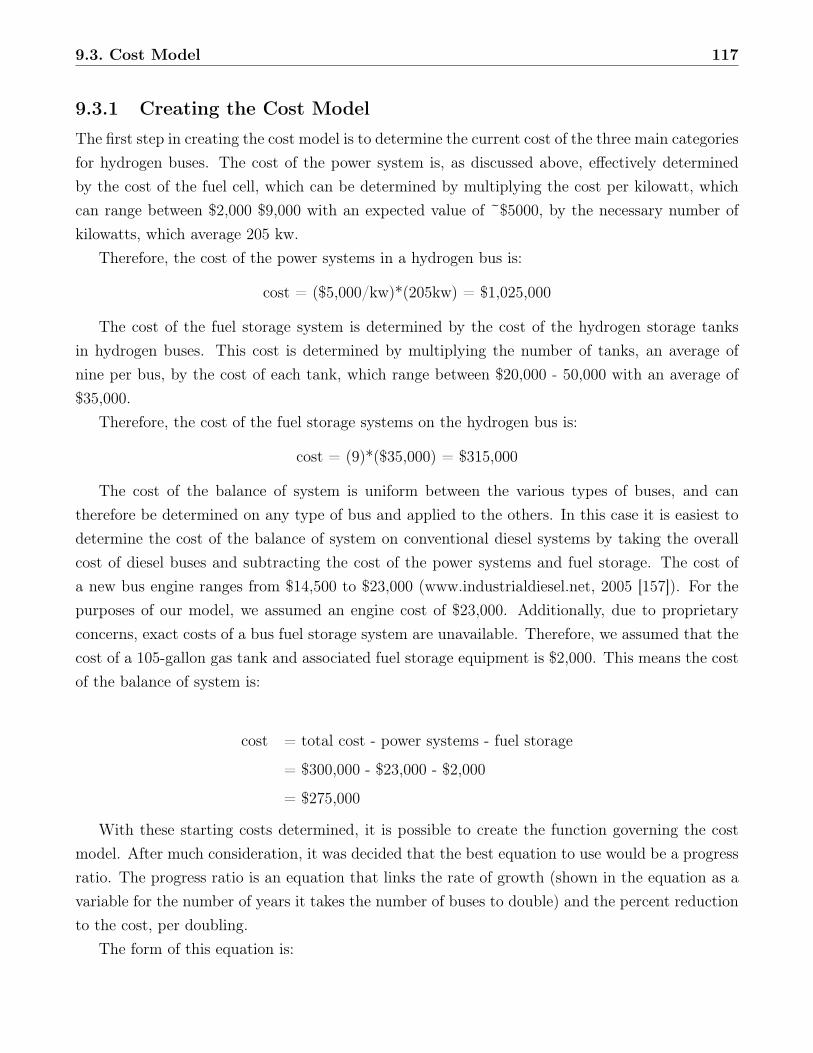
9.3. Cost Model 117
9.3.1 Creating the Cost ModelThe first step in creating the cost model is to determine the current cost of the three main categoriesfor hydrogen buses. The cost of the power system is, as discussed above, effectively determinedby the cost of the fuel cell, which can be determined by multiplying the cost per kilowatt, whichcan range between $2,000 $9,000 with an expected value of ~$5000, by the necessary number ofkilowatts, which average 205 kw.
Therefore, the cost of the power systems in a hydrogen bus is:
cost = ($5,000/kw)*(205kw) = $1,025,000
The cost of the fuel storage system is determined by the cost of the hydrogen storage tanksin hydrogen buses. This cost is determined by multiplying the number of tanks, an average ofnine per bus, by the cost of each tank, which range between $20,000 - 50,000 with an average of$35,000.
Therefore, the cost of the fuel storage systems on the hydrogen bus is:
cost = (9)*($35,000) = $315,000
The cost of the balance of system is uniform between the various types of buses, and cantherefore be determined on any type of bus and applied to the others. In this case it is easiest todetermine the cost of the balance of system on conventional diesel systems by taking the overallcost of diesel buses and subtracting the cost of the power systems and fuel storage. The cost ofa new bus engine ranges from $14,500 to $23,000 (www.industrialdiesel.net, 2005 [157]). For thepurposes of our model, we assumed an engine cost of $23,000. Additionally, due to proprietaryconcerns, exact costs of a bus fuel storage system are unavailable. Therefore, we assumed that thecost of a 105-gallon gas tank and associated fuel storage equipment is $2,000. This means the costof the balance of system is:
cost = total cost - power systems - fuel storage
= $300,000 - $23,000 - $2,000
= $275,000
With these starting costs determined, it is possible to create the function governing the costmodel. After much consideration, it was decided that the best equation to use would be a progressratio. The progress ratio is an equation that links the rate of growth (shown in the equation as avariable for the number of years it takes the number of buses to double) and the percent reductionto the cost, per doubling.
The form of this equation is:
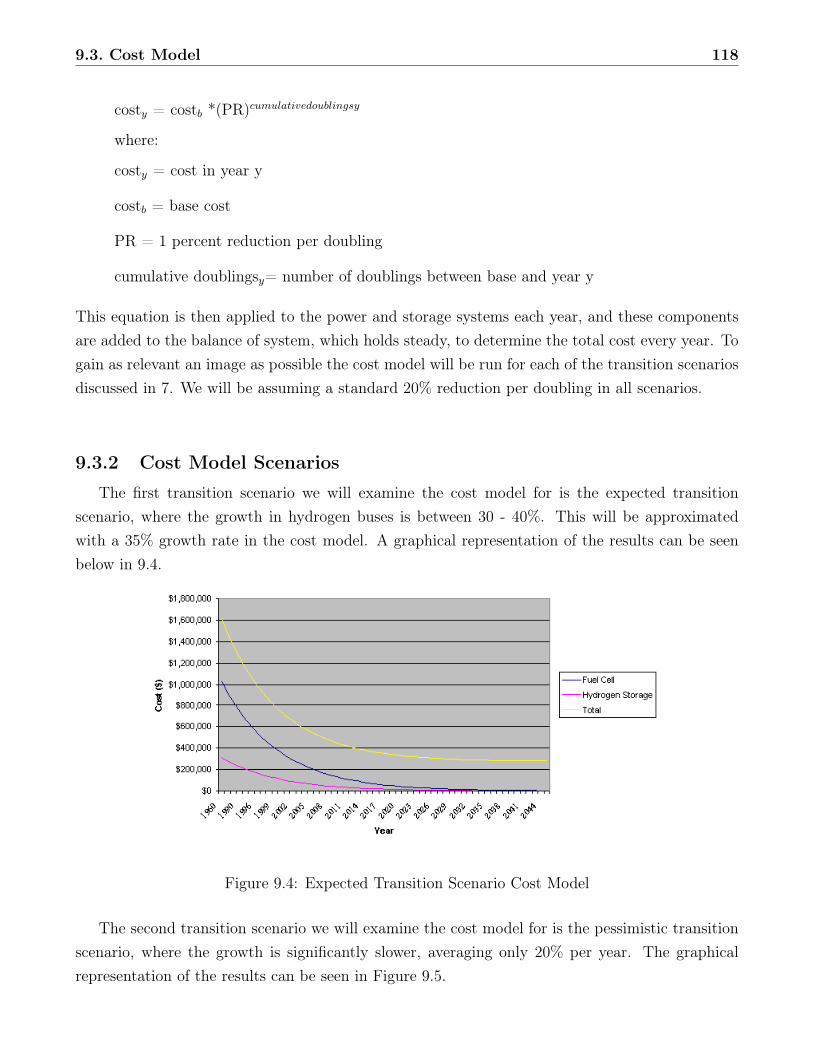
9.3. Cost Model 118
costy = costb *(PR)cumulativedoublingsy
where:
costy = cost in year y
costb = base cost
PR = 1 percent reduction per doubling
cumulative doublingsy= number of doublings between base and year y
This equation is then applied to the power and storage systems each year, and these componentsare added to the balance of system, which holds steady, to determine the total cost every year. Togain as relevant an image as possible the cost model will be run for each of the transition scenariosdiscussed in 7. We will be assuming a standard 20% reduction per doubling in all scenarios.
9.3.2 Cost Model ScenariosThe first transition scenario we will examine the cost model for is the expected transition
scenario, where the growth in hydrogen buses is between 30 - 40%. This will be approximatedwith a 35% growth rate in the cost model. A graphical representation of the results can be seenbelow in 9.4.
Figure 9.4: Expected Transition Scenario Cost Model
The second transition scenario we will examine the cost model for is the pessimistic transitionscenario, where the growth is significantly slower, averaging only 20% per year. The graphicalrepresentation of the results can be seen in Figure 9.5.
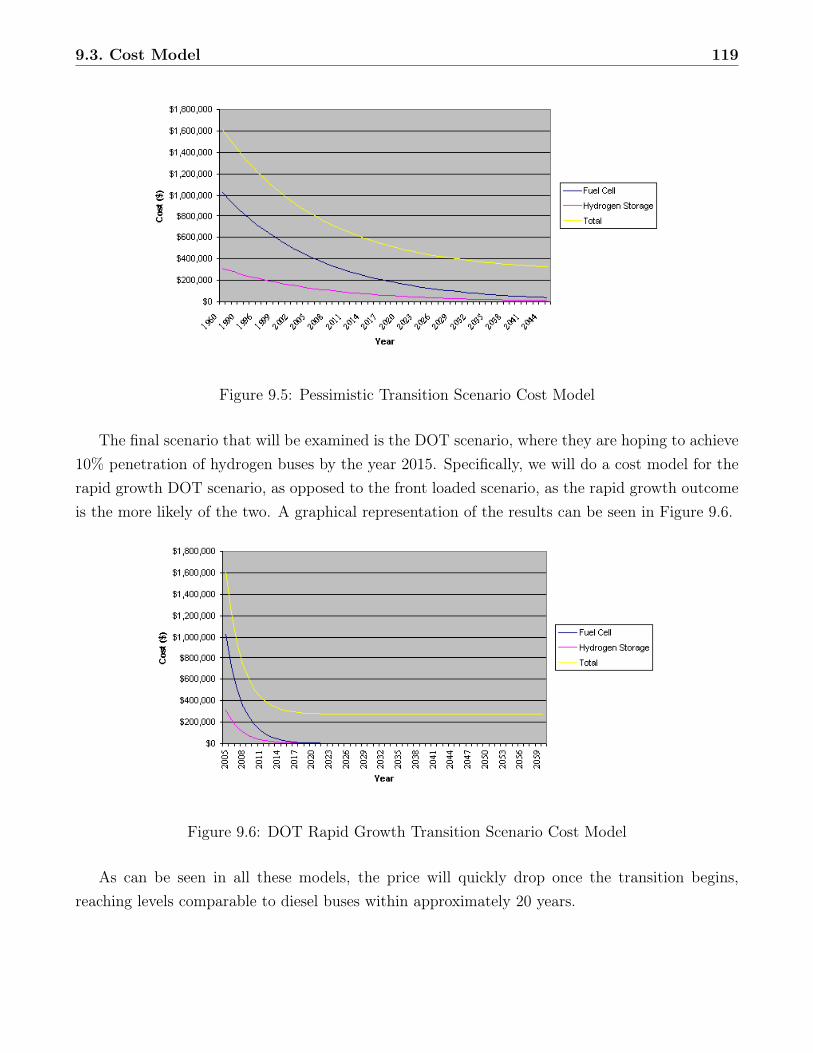
9.3. Cost Model 119
Figure 9.5: Pessimistic Transition Scenario Cost Model
The final scenario that will be examined is the DOT scenario, where they are hoping to achieve10% penetration of hydrogen buses by the year 2015. Specifically, we will do a cost model for therapid growth DOT scenario, as opposed to the front loaded scenario, as the rapid growth outcomeis the more likely of the two. A graphical representation of the results can be seen in Figure 9.6.
Figure 9.6: DOT Rapid Growth Transition Scenario Cost Model
As can be seen in all these models, the price will quickly drop once the transition begins,reaching levels comparable to diesel buses within approximately 20 years.
Chapter 10
Case Studies
10.1 Clean Urban Transport in Europe
Most interest in hydrogen’s potential use as a transportation fuel is due to concerns about pol-
lutants and the petroleum import market. As stated earlier, fossil fuels account for the majority
of the carbon that is released into the atmosphere each year. As worldwide population continues
to increase, and nations continue to develop technologically, global energy use is expected to in-
crease drastically (Service, 2004 [179] [180]). As most of the worlds energy is generated through
the consumption of fossil fuels, the projected increase in energy use will likely be accompanied
by a corresponding increase in pollutant emissions. To counteract this, the world community is
investigating the use of alternative fuels in a variety of applications. One example of this is the
stated goal of the European Commission to have 20% of its energy provided by alternative fuels
by 2020 (CUTE, 2002 [139]). Pursuant to this goal, a pan-European demonstration of hydrogen
fuel-cell buses is in progress.
Clean Urban Transport in Europe (CUTE) is a pilot program with twenty-seven hydrogen
fuel-cell buses in nine European cities: Amsterdam, The Netherlands; Barcelona, Spain; Hamburg,
Germany; London, England; Luxembourg; Madrid, Spain; Porto, Spain; Stockholm, Sweden, and
Stuttgart, Germany (CUTE, 2002 [139]). An additional three fuel-cell buses are operating in a
satellite extension of the program in Perth, Australia (Davidson, 2003 [142]). The goal of CUTE
is to demonstrate the possibility of a zero-emission, low-noise means of public transportation.
Throughout the pilot program, data will be collected to determine the safety of hydrogen fuel, the
120
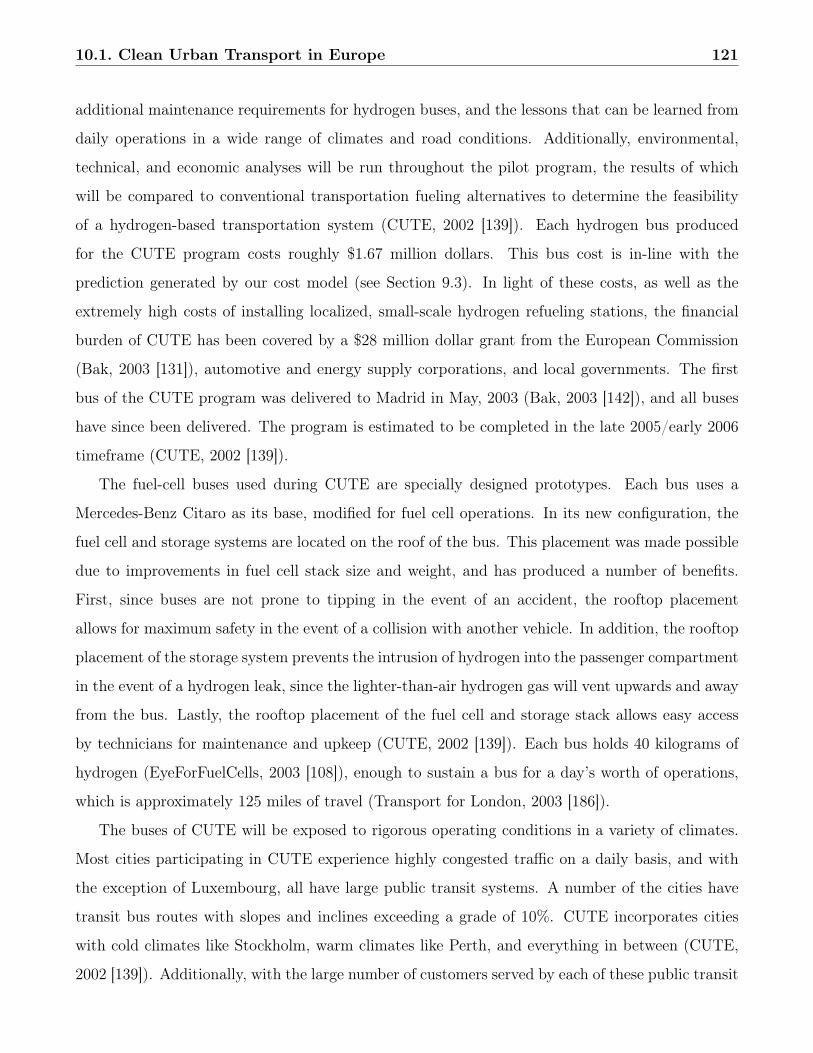
10.1. Clean Urban Transport in Europe 121
additional maintenance requirements for hydrogen buses, and the lessons that can be learned from
daily operations in a wide range of climates and road conditions. Additionally, environmental,
technical, and economic analyses will be run throughout the pilot program, the results of which
will be compared to conventional transportation fueling alternatives to determine the feasibility
of a hydrogen-based transportation system (CUTE, 2002 [139]). Each hydrogen bus produced
for the CUTE program costs roughly $1.67 million dollars. This bus cost is in-line with the
prediction generated by our cost model (see Section 9.3). In light of these costs, as well as the
extremely high costs of installing localized, small-scale hydrogen refueling stations, the financial
burden of CUTE has been covered by a $28 million dollar grant from the European Commission
(Bak, 2003 [131]), automotive and energy supply corporations, and local governments. The first
bus of the CUTE program was delivered to Madrid in May, 2003 (Bak, 2003 [142]), and all buses
have since been delivered. The program is estimated to be completed in the late 2005/early 2006
timeframe (CUTE, 2002 [139]).
The fuel-cell buses used during CUTE are specially designed prototypes. Each bus uses a
Mercedes-Benz Citaro as its base, modified for fuel cell operations. In its new configuration, the
fuel cell and storage systems are located on the roof of the bus. This placement was made possible
due to improvements in fuel cell stack size and weight, and has produced a number of benefits.
First, since buses are not prone to tipping in the event of an accident, the rooftop placement
allows for maximum safety in the event of a collision with another vehicle. In addition, the rooftop
placement of the storage system prevents the intrusion of hydrogen into the passenger compartment
in the event of a hydrogen leak, since the lighter-than-air hydrogen gas will vent upwards and away
from the bus. Lastly, the rooftop placement of the fuel cell and storage stack allows easy access
by technicians for maintenance and upkeep (CUTE, 2002 [139]). Each bus holds 40 kilograms of
hydrogen (EyeForFuelCells, 2003 [108]), enough to sustain a bus for a day’s worth of operations,
which is approximately 125 miles of travel (Transport for London, 2003 [186]).
The buses of CUTE will be exposed to rigorous operating conditions in a variety of climates.
Most cities participating in CUTE experience highly congested traffic on a daily basis, and with
the exception of Luxembourg, all have large public transit systems. A number of the cities have
transit bus routes with slopes and inclines exceeding a grade of 10%. CUTE incorporates cities
with cold climates like Stockholm, warm climates like Perth, and everything in between (CUTE,
2002 [139]). Additionally, with the large number of customers served by each of these public transit
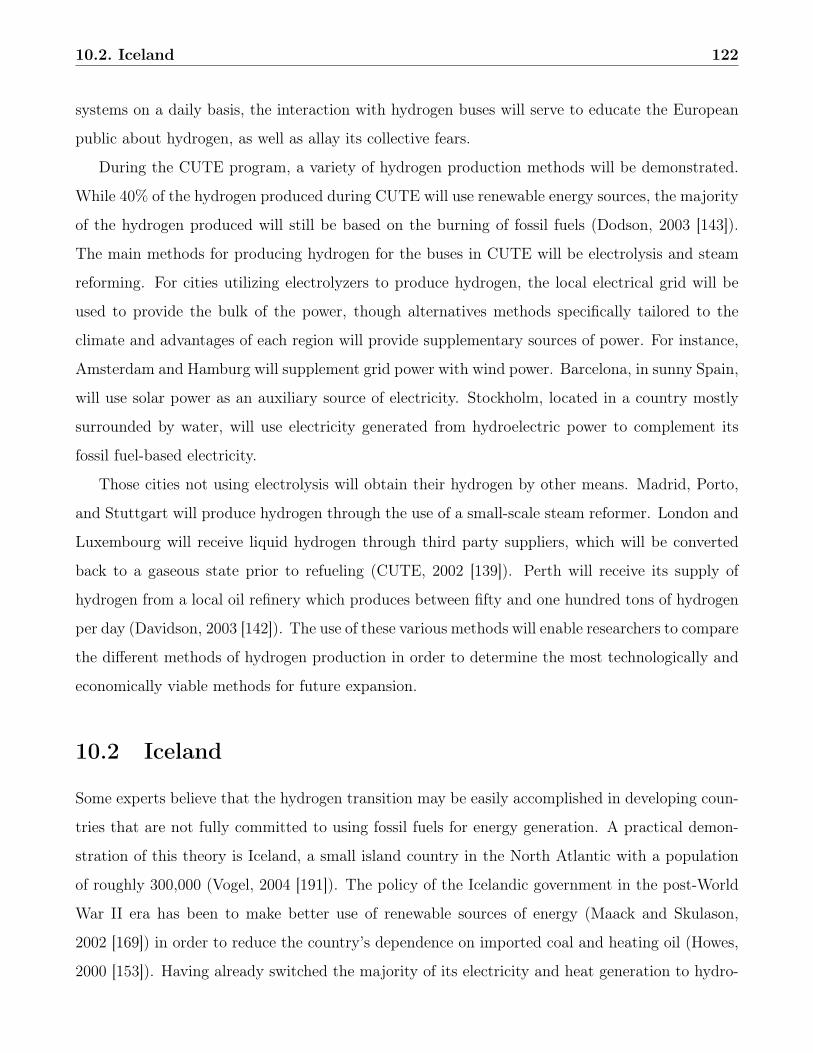
10.2. Iceland 122
systems on a daily basis, the interaction with hydrogen buses will serve to educate the European
public about hydrogen, as well as allay its collective fears.
During the CUTE program, a variety of hydrogen production methods will be demonstrated.
While 40% of the hydrogen produced during CUTE will use renewable energy sources, the majority
of the hydrogen produced will still be based on the burning of fossil fuels (Dodson, 2003 [143]).
The main methods for producing hydrogen for the buses in CUTE will be electrolysis and steam
reforming. For cities utilizing electrolyzers to produce hydrogen, the local electrical grid will be
used to provide the bulk of the power, though alternatives methods specifically tailored to the
climate and advantages of each region will provide supplementary sources of power. For instance,
Amsterdam and Hamburg will supplement grid power with wind power. Barcelona, in sunny Spain,
will use solar power as an auxiliary source of electricity. Stockholm, located in a country mostly
surrounded by water, will use electricity generated from hydroelectric power to complement its
fossil fuel-based electricity.
Those cities not using electrolysis will obtain their hydrogen by other means. Madrid, Porto,
and Stuttgart will produce hydrogen through the use of a small-scale steam reformer. London and
Luxembourg will receive liquid hydrogen through third party suppliers, which will be converted
back to a gaseous state prior to refueling (CUTE, 2002 [139]). Perth will receive its supply of
hydrogen from a local oil refinery which produces between fifty and one hundred tons of hydrogen
per day (Davidson, 2003 [142]). The use of these various methods will enable researchers to compare
the different methods of hydrogen production in order to determine the most technologically and
economically viable methods for future expansion.
10.2 Iceland
Some experts believe that the hydrogen transition may be easily accomplished in developing coun-
tries that are not fully committed to using fossil fuels for energy generation. A practical demon-
stration of this theory is Iceland, a small island country in the North Atlantic with a population
of roughly 300,000 (Vogel, 2004 [191]). The policy of the Icelandic government in the post-World
War II era has been to make better use of renewable sources of energy (Maack and Skulason,
2002 [169]) in order to reduce the country’s dependence on imported coal and heating oil (Howes,
2000 [153]). Having already switched the majority of its electricity and heat generation to hydro-
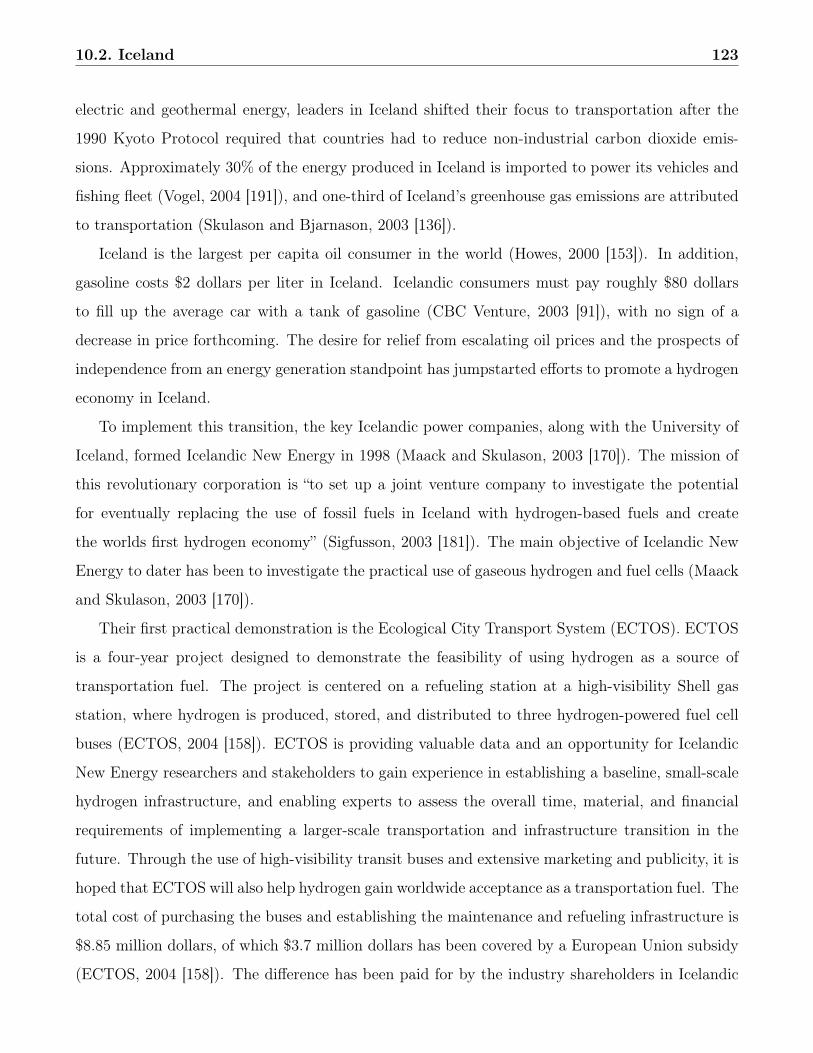
10.2. Iceland 123
electric and geothermal energy, leaders in Iceland shifted their focus to transportation after the
1990 Kyoto Protocol required that countries had to reduce non-industrial carbon dioxide emis-
sions. Approximately 30% of the energy produced in Iceland is imported to power its vehicles and
fishing fleet (Vogel, 2004 [191]), and one-third of Iceland’s greenhouse gas emissions are attributed
to transportation (Skulason and Bjarnason, 2003 [136]).
Iceland is the largest per capita oil consumer in the world (Howes, 2000 [153]). In addition,
gasoline costs $2 dollars per liter in Iceland. Icelandic consumers must pay roughly $80 dollars
to fill up the average car with a tank of gasoline (CBC Venture, 2003 [91]), with no sign of a
decrease in price forthcoming. The desire for relief from escalating oil prices and the prospects of
independence from an energy generation standpoint has jumpstarted efforts to promote a hydrogen
economy in Iceland.
To implement this transition, the key Icelandic power companies, along with the University of
Iceland, formed Icelandic New Energy in 1998 (Maack and Skulason, 2003 [170]). The mission of
this revolutionary corporation is “to set up a joint venture company to investigate the potential
for eventually replacing the use of fossil fuels in Iceland with hydrogen-based fuels and create
the worlds first hydrogen economy” (Sigfusson, 2003 [181]). The main objective of Icelandic New
Energy to dater has been to investigate the practical use of gaseous hydrogen and fuel cells (Maack
and Skulason, 2003 [170]).
Their first practical demonstration is the Ecological City Transport System (ECTOS). ECTOS
is a four-year project designed to demonstrate the feasibility of using hydrogen as a source of
transportation fuel. The project is centered on a refueling station at a high-visibility Shell gas
station, where hydrogen is produced, stored, and distributed to three hydrogen-powered fuel cell
buses (ECTOS, 2004 [158]). ECTOS is providing valuable data and an opportunity for Icelandic
New Energy researchers and stakeholders to gain experience in establishing a baseline, small-scale
hydrogen infrastructure, and enabling experts to assess the overall time, material, and financial
requirements of implementing a larger-scale transportation and infrastructure transition in the
future. Through the use of high-visibility transit buses and extensive marketing and publicity, it is
hoped that ECTOS will also help hydrogen gain worldwide acceptance as a transportation fuel. The
total cost of purchasing the buses and establishing the maintenance and refueling infrastructure is
$8.85 million dollars, of which $3.7 million dollars has been covered by a European Union subsidy
(ECTOS, 2004 [158]). The difference has been paid for by the industry shareholders in Icelandic
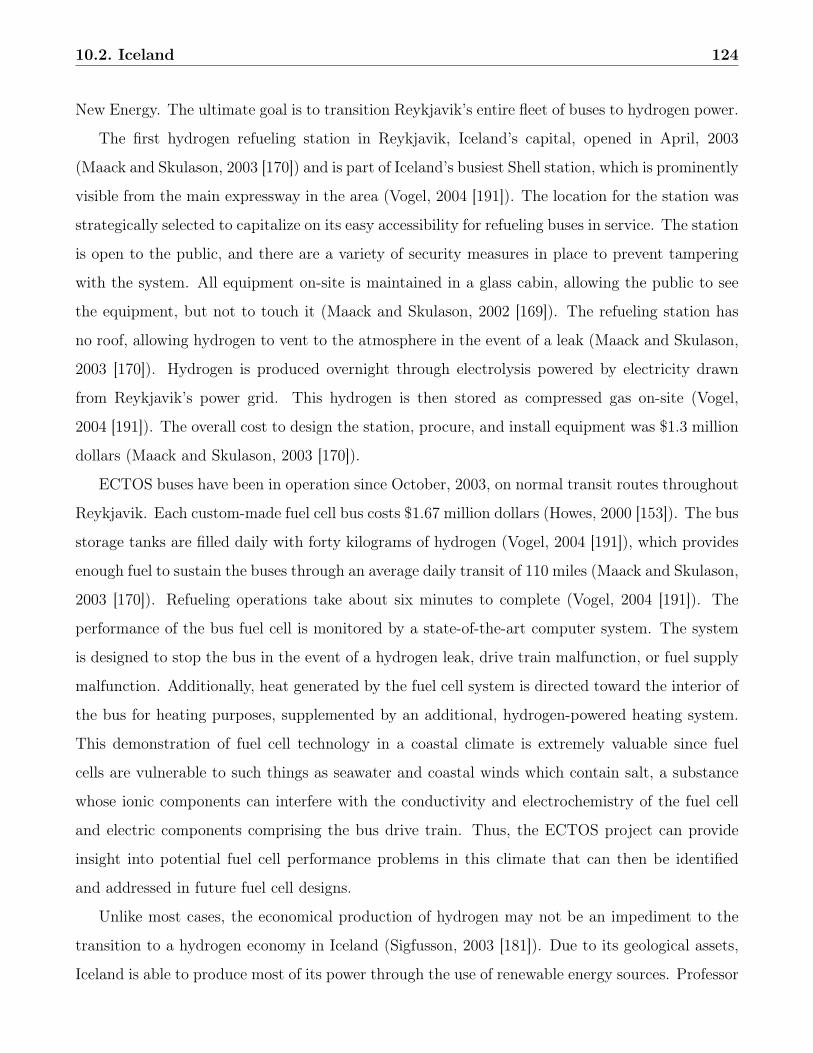
10.2. Iceland 124
New Energy. The ultimate goal is to transition Reykjavik’s entire fleet of buses to hydrogen power.
The first hydrogen refueling station in Reykjavik, Iceland’s capital, opened in April, 2003
(Maack and Skulason, 2003 [170]) and is part of Iceland’s busiest Shell station, which is prominently
visible from the main expressway in the area (Vogel, 2004 [191]). The location for the station was
strategically selected to capitalize on its easy accessibility for refueling buses in service. The station
is open to the public, and there are a variety of security measures in place to prevent tampering
with the system. All equipment on-site is maintained in a glass cabin, allowing the public to see
the equipment, but not to touch it (Maack and Skulason, 2002 [169]). The refueling station has
no roof, allowing hydrogen to vent to the atmosphere in the event of a leak (Maack and Skulason,
2003 [170]). Hydrogen is produced overnight through electrolysis powered by electricity drawn
from Reykjavik’s power grid. This hydrogen is then stored as compressed gas on-site (Vogel,
2004 [191]). The overall cost to design the station, procure, and install equipment was $1.3 million
dollars (Maack and Skulason, 2003 [170]).
ECTOS buses have been in operation since October, 2003, on normal transit routes throughout
Reykjavik. Each custom-made fuel cell bus costs $1.67 million dollars (Howes, 2000 [153]). The bus
storage tanks are filled daily with forty kilograms of hydrogen (Vogel, 2004 [191]), which provides
enough fuel to sustain the buses through an average daily transit of 110 miles (Maack and Skulason,
2003 [170]). Refueling operations take about six minutes to complete (Vogel, 2004 [191]). The
performance of the bus fuel cell is monitored by a state-of-the-art computer system. The system
is designed to stop the bus in the event of a hydrogen leak, drive train malfunction, or fuel supply
malfunction. Additionally, heat generated by the fuel cell system is directed toward the interior of
the bus for heating purposes, supplemented by an additional, hydrogen-powered heating system.
This demonstration of fuel cell technology in a coastal climate is extremely valuable since fuel
cells are vulnerable to such things as seawater and coastal winds which contain salt, a substance
whose ionic components can interfere with the conductivity and electrochemistry of the fuel cell
and electric components comprising the bus drive train. Thus, the ECTOS project can provide
insight into potential fuel cell performance problems in this climate that can then be identified
and addressed in future fuel cell designs.
Unlike most cases, the economical production of hydrogen may not be an impediment to the
transition to a hydrogen economy in Iceland (Sigfusson, 2003 [181]). Due to its geological assets,
Iceland is able to produce most of its power through the use of renewable energy sources. Professor
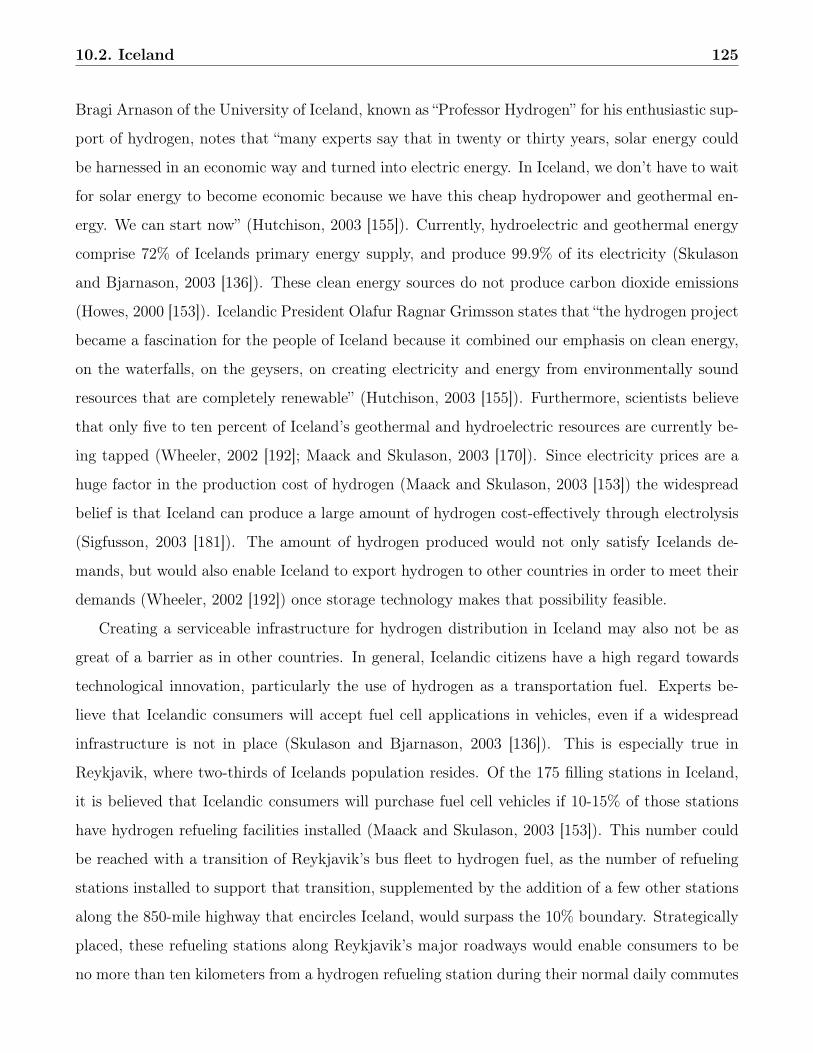
10.2. Iceland 125
Bragi Arnason of the University of Iceland, known as “Professor Hydrogen” for his enthusiastic sup-
port of hydrogen, notes that “many experts say that in twenty or thirty years, solar energy could
be harnessed in an economic way and turned into electric energy. In Iceland, we don’t have to wait
for solar energy to become economic because we have this cheap hydropower and geothermal en-
ergy. We can start now” (Hutchison, 2003 [155]). Currently, hydroelectric and geothermal energy
comprise 72% of Icelands primary energy supply, and produce 99.9% of its electricity (Skulason
and Bjarnason, 2003 [136]). These clean energy sources do not produce carbon dioxide emissions
(Howes, 2000 [153]). Icelandic President Olafur Ragnar Grimsson states that “the hydrogen project
became a fascination for the people of Iceland because it combined our emphasis on clean energy,
on the waterfalls, on the geysers, on creating electricity and energy from environmentally sound
resources that are completely renewable” (Hutchison, 2003 [155]). Furthermore, scientists believe
that only five to ten percent of Iceland’s geothermal and hydroelectric resources are currently be-
ing tapped (Wheeler, 2002 [192]; Maack and Skulason, 2003 [170]). Since electricity prices are a
huge factor in the production cost of hydrogen (Maack and Skulason, 2003 [153]) the widespread
belief is that Iceland can produce a large amount of hydrogen cost-effectively through electrolysis
(Sigfusson, 2003 [181]). The amount of hydrogen produced would not only satisfy Icelands de-
mands, but would also enable Iceland to export hydrogen to other countries in order to meet their
demands (Wheeler, 2002 [192]) once storage technology makes that possibility feasible.
Creating a serviceable infrastructure for hydrogen distribution in Iceland may also not be as
great of a barrier as in other countries. In general, Icelandic citizens have a high regard towards
technological innovation, particularly the use of hydrogen as a transportation fuel. Experts be-
lieve that Icelandic consumers will accept fuel cell applications in vehicles, even if a widespread
infrastructure is not in place (Skulason and Bjarnason, 2003 [136]). This is especially true in
Reykjavik, where two-thirds of Icelands population resides. Of the 175 filling stations in Iceland,
it is believed that Icelandic consumers will purchase fuel cell vehicles if 10-15% of those stations
have hydrogen refueling facilities installed (Maack and Skulason, 2003 [153]). This number could
be reached with a transition of Reykjavik’s bus fleet to hydrogen fuel, as the number of refueling
stations installed to support that transition, supplemented by the addition of a few other stations
along the 850-mile highway that encircles Iceland, would surpass the 10% boundary. Strategically
placed, these refueling stations along Reykjavik’s major roadways would enable consumers to be
no more than ten kilometers from a hydrogen refueling station during their normal daily commutes
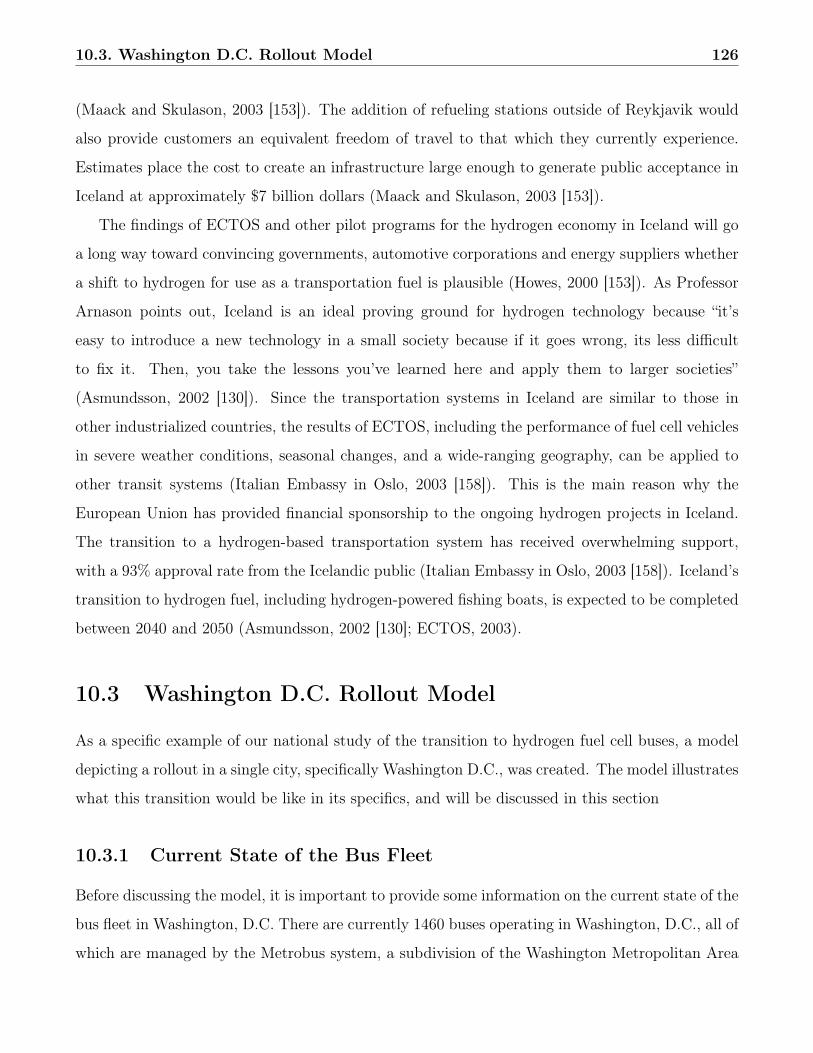
10.3. Washington D.C. Rollout Model 126
(Maack and Skulason, 2003 [153]). The addition of refueling stations outside of Reykjavik would
also provide customers an equivalent freedom of travel to that which they currently experience.
Estimates place the cost to create an infrastructure large enough to generate public acceptance in
Iceland at approximately $7 billion dollars (Maack and Skulason, 2003 [153]).
The findings of ECTOS and other pilot programs for the hydrogen economy in Iceland will go
a long way toward convincing governments, automotive corporations and energy suppliers whether
a shift to hydrogen for use as a transportation fuel is plausible (Howes, 2000 [153]). As Professor
Arnason points out, Iceland is an ideal proving ground for hydrogen technology because “it’s
easy to introduce a new technology in a small society because if it goes wrong, its less difficult
to fix it. Then, you take the lessons you’ve learned here and apply them to larger societies”
(Asmundsson, 2002 [130]). Since the transportation systems in Iceland are similar to those in
other industrialized countries, the results of ECTOS, including the performance of fuel cell vehicles
in severe weather conditions, seasonal changes, and a wide-ranging geography, can be applied to
other transit systems (Italian Embassy in Oslo, 2003 [158]). This is the main reason why the
European Union has provided financial sponsorship to the ongoing hydrogen projects in Iceland.
The transition to a hydrogen-based transportation system has received overwhelming support,
with a 93% approval rate from the Icelandic public (Italian Embassy in Oslo, 2003 [158]). Iceland’s
transition to hydrogen fuel, including hydrogen-powered fishing boats, is expected to be completed
between 2040 and 2050 (Asmundsson, 2002 [130]; ECTOS, 2003).
10.3 Washington D.C. Rollout Model
As a specific example of our national study of the transition to hydrogen fuel cell buses, a model
depicting a rollout in a single city, specifically Washington D.C., was created. The model illustrates
what this transition would be like in its specifics, and will be discussed in this section
10.3.1 Current State of the Bus Fleet
Before discussing the model, it is important to provide some information on the current state of the
bus fleet in Washington, D.C. There are currently 1460 buses operating in Washington, D.C., all of
which are managed by the Metrobus system, a subdivision of the Washington Metropolitan Area
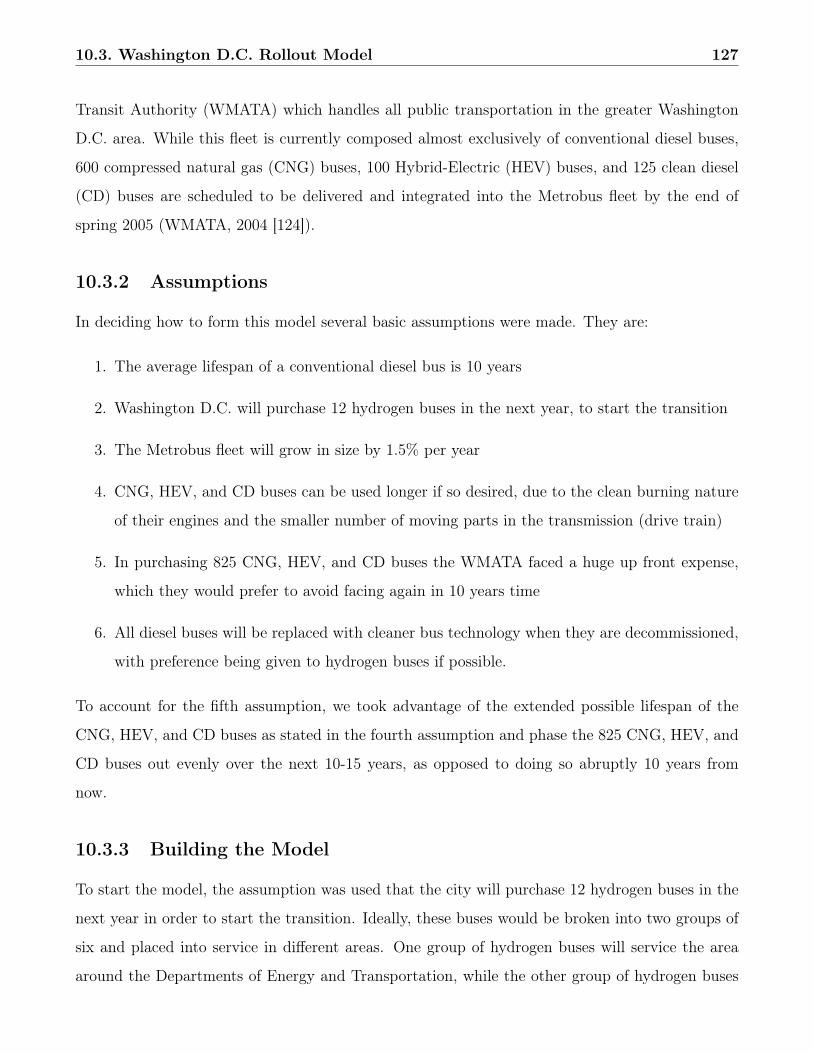
10.3. Washington D.C. Rollout Model 127
Transit Authority (WMATA) which handles all public transportation in the greater Washington
D.C. area. While this fleet is currently composed almost exclusively of conventional diesel buses,
600 compressed natural gas (CNG) buses, 100 Hybrid-Electric (HEV) buses, and 125 clean diesel
(CD) buses are scheduled to be delivered and integrated into the Metrobus fleet by the end of
spring 2005 (WMATA, 2004 [124]).
10.3.2 Assumptions
In deciding how to form this model several basic assumptions were made. They are:
1. The average lifespan of a conventional diesel bus is 10 years
2. Washington D.C. will purchase 12 hydrogen buses in the next year, to start the transition
3. The Metrobus fleet will grow in size by 1.5% per year
4. CNG, HEV, and CD buses can be used longer if so desired, due to the clean burning nature
of their engines and the smaller number of moving parts in the transmission (drive train)
5. In purchasing 825 CNG, HEV, and CD buses the WMATA faced a huge up front expense,
which they would prefer to avoid facing again in 10 years time
6. All diesel buses will be replaced with cleaner bus technology when they are decommissioned,
with preference being given to hydrogen buses if possible.
To account for the fifth assumption, we took advantage of the extended possible lifespan of the
CNG, HEV, and CD buses as stated in the fourth assumption and phase the 825 CNG, HEV, and
CD buses out evenly over the next 10-15 years, as opposed to doing so abruptly 10 years from
now.
10.3.3 Building the Model
To start the model, the assumption was used that the city will purchase 12 hydrogen buses in the
next year in order to start the transition. Ideally, these buses would be broken into two groups of
six and placed into service in different areas. One group of hydrogen buses will service the area
around the Departments of Energy and Transportation, while the other group of hydrogen buses

10.3. Washington D.C. Rollout Model 128
will service the area near the Pentagon. This would create the largest possible exposure among
people with the power the assist the transition to hydrogen fuel cells, as well as maximize the
exposure and return on investment the city would see.
Over the first ten years of the model, it is assumed that the rest of the conventional diesel
buses in the Metrobus fleet will be decommissioned, leading to an average of approximately 64
buses per year being replaced. Over this period, the number of hydrogen buses will grow at a
steady rate, with the limit on growth being the number of buses decommissioned per year plus the
overall growth of the Metrobus fleet. We assumed that any decommissioned buses not replaced by
hydrogen buses were replaced by HEV or CD buses, which will still provide an environmental and
efficiency improvement over conventional diesel buses.
The year after all the conventional diesel buses in the Metrobus fleet have been decommissioned,
what would traditionally be considered the lifespan of the HEV and CD buses purchased in 2005 is
completed. As mentioned earlier though, we stretched their use over the next five years to factor in
the benefits of their cleaner burning engines. Assuming these buses are phased out evenly over the
next five year period, that means 165 buses will need to be replaced each year. This replacement
is handled in the same manner as the replacement of the conventional diesel buses was, with the
hydrogen buses growing at a steady rate up to the number of buses being replaced and the growth
of the Metrobus fleet, and any buses not replaced by hydrogen buses being replaced by HEV or
CD buses.
Once this period of replacing the large number of HEV and CD buses is over, we then phased
out the HEV and CD buses that were purchased to fill the shortfall between the number of buses
being decommissioned and the number of hydrogen buses being purchased, and replaced them
with hydrogen buses, as the growth in the number of hydrogen buses can easily accommodate the
number being decommissioned at that point. From then onward we assumed the composition of
the Metrobus fleet enters a steady state, where any new growth and hydrogen buses that need to
be decommissioned were replaced by new hydrogen buses.
A graphical representation of this rollout, where we assume a growth rate for the hydrogen
buses of 35%, can be seen below in Figure 10.1.
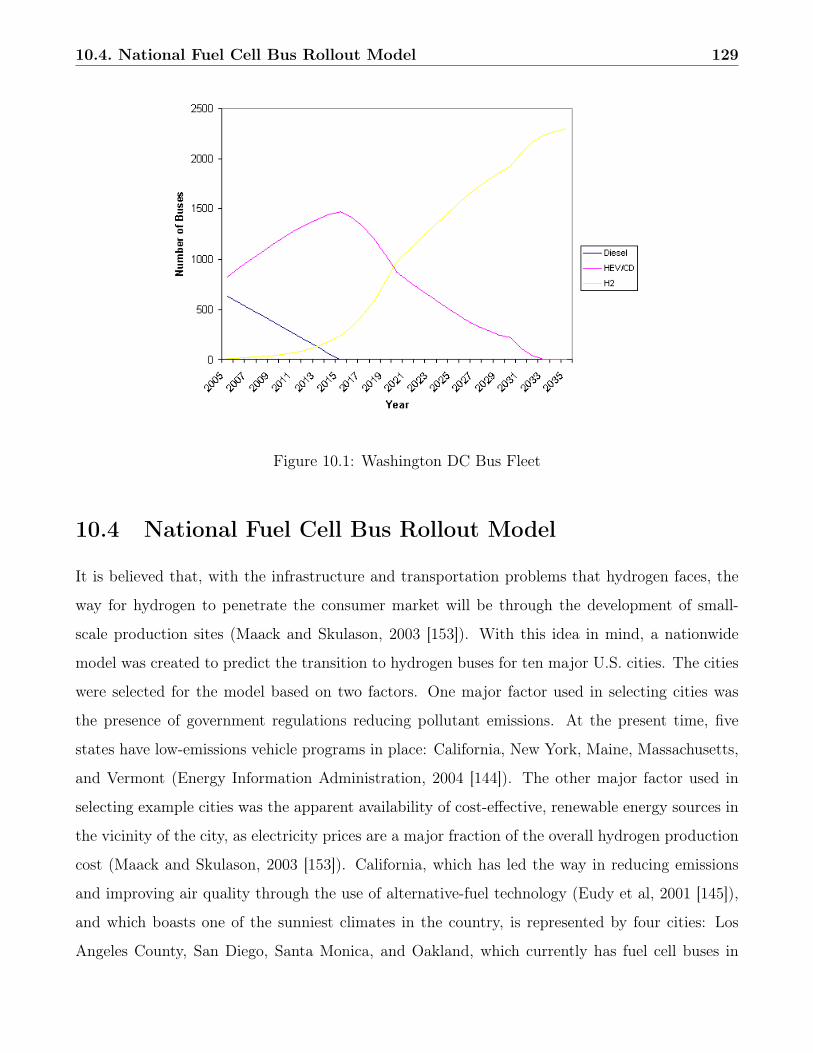
10.4. National Fuel Cell Bus Rollout Model 129
Figure 10.1: Washington DC Bus Fleet
10.4 National Fuel Cell Bus Rollout Model
It is believed that, with the infrastructure and transportation problems that hydrogen faces, the
way for hydrogen to penetrate the consumer market will be through the development of small-
scale production sites (Maack and Skulason, 2003 [153]). With this idea in mind, a nationwide
model was created to predict the transition to hydrogen buses for ten major U.S. cities. The cities
were selected for the model based on two factors. One major factor used in selecting cities was
the presence of government regulations reducing pollutant emissions. At the present time, five
states have low-emissions vehicle programs in place: California, New York, Maine, Massachusetts,
and Vermont (Energy Information Administration, 2004 [144]). The other major factor used in
selecting example cities was the apparent availability of cost-effective, renewable energy sources in
the vicinity of the city, as electricity prices are a major fraction of the overall hydrogen production
cost (Maack and Skulason, 2003 [153]). California, which has led the way in reducing emissions
and improving air quality through the use of alternative-fuel technology (Eudy et al, 2001 [145]),
and which boasts one of the sunniest climates in the country, is represented by four cities: Los
Angeles County, San Diego, Santa Monica, and Oakland, which currently has fuel cell buses in
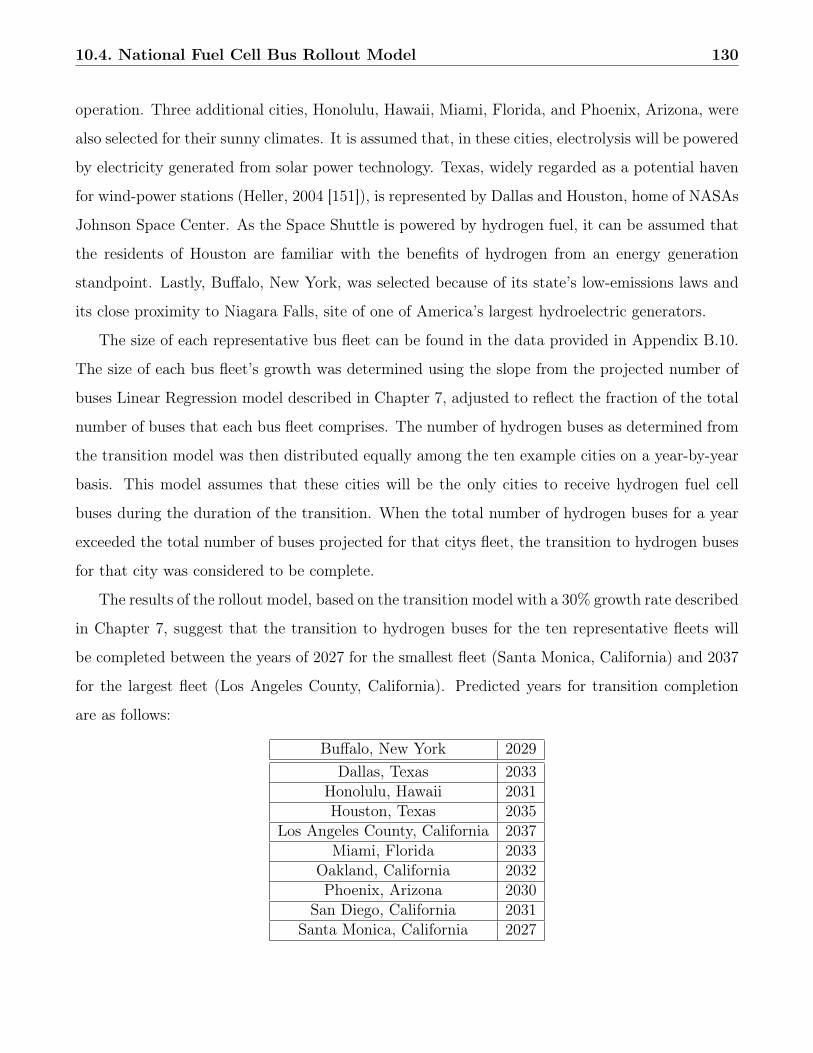
10.4. National Fuel Cell Bus Rollout Model 130
operation. Three additional cities, Honolulu, Hawaii, Miami, Florida, and Phoenix, Arizona, were
also selected for their sunny climates. It is assumed that, in these cities, electrolysis will be powered
by electricity generated from solar power technology. Texas, widely regarded as a potential haven
for wind-power stations (Heller, 2004 [151]), is represented by Dallas and Houston, home of NASAs
Johnson Space Center. As the Space Shuttle is powered by hydrogen fuel, it can be assumed that
the residents of Houston are familiar with the benefits of hydrogen from an energy generation
standpoint. Lastly, Buffalo, New York, was selected because of its state’s low-emissions laws and
its close proximity to Niagara Falls, site of one of America’s largest hydroelectric generators.
The size of each representative bus fleet can be found in the data provided in Appendix B.10.
The size of each bus fleet’s growth was determined using the slope from the projected number of
buses Linear Regression model described in Chapter 7, adjusted to reflect the fraction of the total
number of buses that each bus fleet comprises. The number of hydrogen buses as determined from
the transition model was then distributed equally among the ten example cities on a year-by-year
basis. This model assumes that these cities will be the only cities to receive hydrogen fuel cell
buses during the duration of the transition. When the total number of hydrogen buses for a year
exceeded the total number of buses projected for that citys fleet, the transition to hydrogen buses
for that city was considered to be complete.
The results of the rollout model, based on the transition model with a 30% growth rate described
in Chapter 7, suggest that the transition to hydrogen buses for the ten representative fleets will
be completed between the years of 2027 for the smallest fleet (Santa Monica, California) and 2037
for the largest fleet (Los Angeles County, California). Predicted years for transition completion
are as follows:
Buffalo, New York 2029Dallas, Texas 2033
Honolulu, Hawaii 2031Houston, Texas 2035
Los Angeles County, California 2037Miami, Florida 2033
Oakland, California 2032Phoenix, Arizona 2030
San Diego, California 2031Santa Monica, California 2027
Chapter 11
Conclusion
In conclusion to our research and analysis, it can be said the transit buses provide an ideal starting
point for the hydrogen transition for numerous reasons. The size of transit buses allows them to
more easily accommodate the bulky nature of prototype fuel cells and hydrogen storage tanks.
Size is less of a limiting factor on larger vehicles, and the removal of size as a constraint on the
prototype technology will enable it to develop more quickly. The local, centralized, nature of transit
bus fueling and maintenance greatly benefits early hydrogen technology, by reducing the amount
of money that must be invested to develop the infrastructure at the beginning of the transition and
makes the use of shorter range hydrogen technology viable as hydrogen storage issues are addressed
(Levin et all, 2001 [165]). The high profile nature of transit buses will help maximize the public’s
exposure to hydrogen technology. Despite the fact that transit buses make up only 1% of the total
vehicles on the road, a disproportionately large number of people interact with them each day.
This makes transit buses an ideal way to raise awareness of hydrogen technology. The majority of
transit buses operate in high traffic urban areas where pollution is a major issue, exactly the type
of area where a zero-emissions technology is the most vital and will be most appreciated (Eudy
et all,2001 [145]). Lastly transit bus fleets are, in nearly every case, subsidized by the government
at either the local, state, or federal level. This counteracts one of the traditional faults of a new
technology, its extremely high initial price.
It is important to note that not all heavy duty vehicles are a suitable launch pad for the hydrogen
transition. For example, intercity trucking is one of the worst possible areas to begin the hydrogen
transition. Intercity trucks cover long distances per trip, requiring a correspondingly large fueling
131

Chapter 11. Conclusion 132
and maintenance infrastructure to support them as they go about their duties. Intercity trucking
is also a purely commercial venture, meaning that cost is an overriding concern.
Therefore we recommend launching the hydrogen transition through the creation of new pi-
lot programs for hydrogen buses and the expansion of programs that are already in operation.
Additionally we recommend the promotion of bridge technologies such as Hythane or hydrogen
ICE buses in parallel with these pilot programs will help accelerate the growth of the hydrogen
infrastructure. The combination of these programs will bring about the hydrogen transition in the
quickest, most cost effective way possible.

Part III
Washington D.C. Rollout
133

Chapter 12
Introduction
One of the greatest challenges to the hydrogen transition is the lack of infrastructure in place.
Ironically, this is a barrier to the development of both infrastructure and FCVs. If there was
already a large infrastructure in place, as there is with gasoline stations, the decision to where and
when to build would be fairly straightforward, and easily controlled by market forces. A hydrogen
company could look at the network, determine what areas have high demand, choose a suitable
location, and place itself in competition. Without an existing infrastructure, however, it is difficult
to predict what areas would be most profitable to build in. This makes it intimidating to sink the
money to build one station, let alone multiple ones.
The barrier to developing FCVs is more obvious. Without a strong infrastructure in place, it
is difficult to get the public excited enough to purchase the cars. This also indirectly affects the
research put into developing such vehicles, especially if the vehicle producers are unconvinced of
hydrogen’s feasibility.
Management, therefore, is a necessity in jumpstarting the transition. Market forces alone can
not be expected to provide a swift and smooth transition, and perhaps not enough to start the
transition at all.
In the following part of the report, we will explain in detail one method for determining a feasible
network. It is unlikely that a single company would undertake this effort alone, but the design
assumes that some authority oversees the development of the network and whatever companies are
involved. This authority may be the government, or simply a consortium of companies that pledge
to cooperate. In the first section that follows, we will discuss what sort of background information
134

Chapter 12. Introduction 135
might go into the development of a network, including population statistics, driver preferences,
the benefits of government involvement, and economic analysis. Next, we will outline a design
algorithm, and the results of this algorithm if the network was designed today. Finally, we will
discuss performance measures that could be used to guide the transition past the initial phase.
Chapter 13
Background Data
13.1 Zoning Regulations
13.1.1 Zones that allow gasoline stations
According to the District of Columbia Office of Zoning, the Zoning Regulations of D.C. were
introduced in 1920 and their purpose was to restrict the density of population, sizes of property,
uses of land and other related issues of each zoning division. It also prevents inappropriate use or
overcrowding. By doing so, the D.C. area was divided in zone districts by different purposes and
represented by different codes as shown in the table on the next page.
According to the Zoning Regulations (Zoning, 2004 [197]), the only zones allotted to gasoline
service establishments are coded as follows,
C-1 (Zoning Regulation 701.1 & 706.1)
C-2 (726.1)
C-3 (741.1, 741.2 & 743.1)
C-4 (&51.2)
C-5 (761.1)
C-M (2302.1)
M (2302.1)
Other zones used for other purposes are prohibited for any gasoline service. We assumed that
the initial phase for hydrogen transition in D.C. area is to use the existing gasoline stations. The
station location should be carefully verified so that the chance of any violations of regulations can
136
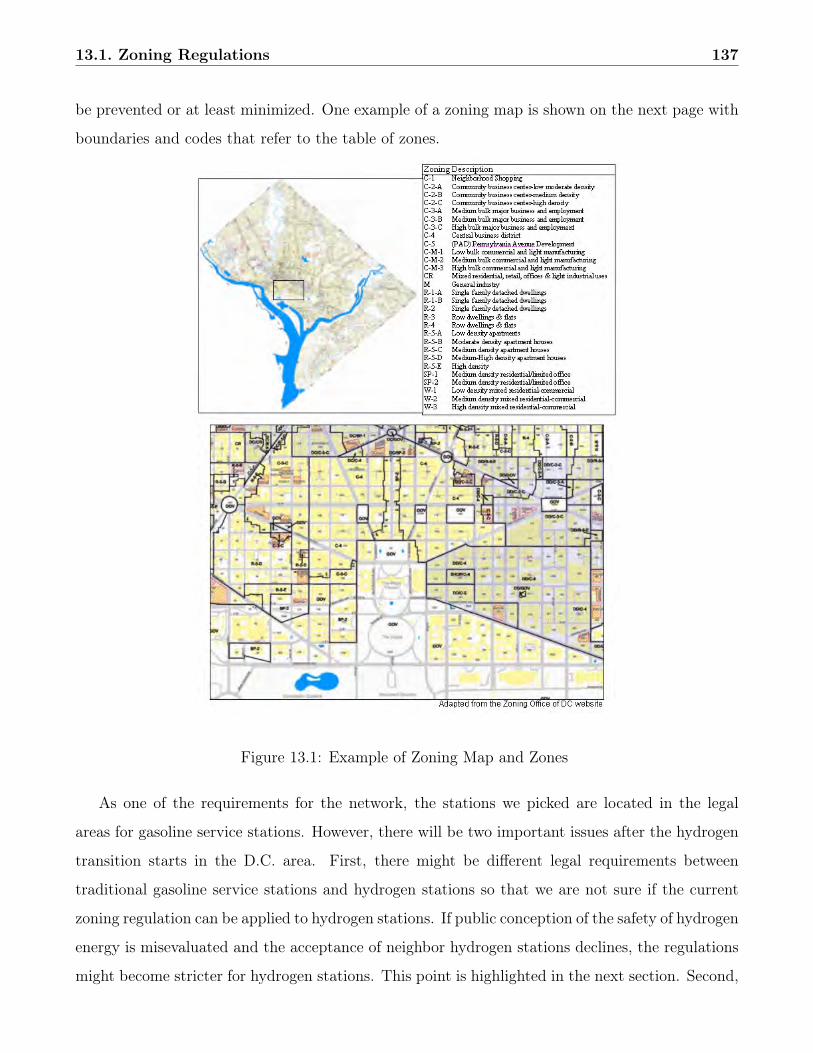
13.1. Zoning Regulations 137
be prevented or at least minimized. One example of a zoning map is shown on the next page with
boundaries and codes that refer to the table of zones.
Figure 13.1: Example of Zoning Map and Zones
As one of the requirements for the network, the stations we picked are located in the legal
areas for gasoline service stations. However, there will be two important issues after the hydrogen
transition starts in the D.C. area. First, there might be different legal requirements between
traditional gasoline service stations and hydrogen stations so that we are not sure if the current
zoning regulation can be applied to hydrogen stations. If public conception of the safety of hydrogen
energy is misevaluated and the acceptance of neighbor hydrogen stations declines, the regulations
might become stricter for hydrogen stations. This point is highlighted in the next section. Second,
13.1. Zoning Regulations 138
if the new hydrogen stations are established based on the existing gasoline stations, the change of
structure or capacity has to be evaluated to make sure that the new construction will not violate
any regulations.
In summary, it is a good idea to check the potential hydrogen stations for zoning violations so
that appropriate locations are chosen.
13.1.2 Public Sentiment
It is worthwhile to note that zoning regulations are intimately connected to public opinion. Plan-
ning and zoning boards determine what gets built in towns, and average citizens of the town sit on
those boards. Currently, it looks like the first hydrogen stations will be piggybacked on the existing
gasoline station infrastructure to reduce costs. While gasoline stations are already regulated under
zoning laws, it is not necessarily true that those regulations will automatically be sufficient to
regulate gasoline stations. While hydrogen is potentially much less dangerous than gasoline, since
it does not pool on the ground and the connection is very carefully designed to prevent leaks, the
public does not necessarily share this perception. This is evident in the following excerpt from an
article about the opening of the DC Shell Hydrogen station on the Sierra Club’s website:
Some residents of the surrounding River Terrace community are not as upbeat
about the station’s launch. Residents accuse Shell Hydrogen and the city government
of environmental racism for placing this station around the corner from an elementary
school Key concerns cited by community members are the questionable safety of trans-
porting a chemical into the community, the station’s proximity to the school in case of
emergency and the District’s regulatory permitting process regarding the renovation of
existing gasoline stations (Sierra Club, 2004 [198]).
In response to the community’s concerns, Shell agreed to limit the times of day that deliveries took
place. It also held open houses to educate the members of the community of its efforts to ensure
that no accidents occur. Eventually, the residents became more positive. Commissioner Christine
Tolson now says that the new station “represents vision for our nation as well as our community”
even though she was not always a staunch supporter. She goes on to state that initially, she
had some misconceptions about hydrogen due to some of the negative things associated with the
element, but has since learned more.
13.2. Driver Behavior 139
Without the careful response and outreach that Shell engaged in, misconceptions might have
gone unchecked and the community may have sought to block the pilot project through regulation
and legislation, effectively sinking the project.
13.2 Driver Behavior
Driver behavior, while an important factor in how well a hydrogen refueling network will perform,
is perhaps the most difficult to quantify in a meaningful way. Research suggests that two major
areas of concern are whether consumers will be inspired to buy a hydrogen fuel cell vehicle by their
observations of the network, and what patterns they follow when they own an FCV and need to
refuel it.
13.2.1 Decision to Purchase FCVs
In “Refueling and the Vehicle Purchase Decision: The Diesel Car Case”, (Sperling, 1987 [199]) the
researchers explored the acceptance of diesel-fueled vehicles in the 1970s and 1980s in California
to quantify what factors might affect the acceptance of a fuel with limited availability. The study
concluded that prior to 1982, approximately 10%-20% of refueling stations offered diesel fuel.
During this time, 80% of diesel fuel car purchasers were somewhat concerned or not concerned
at all about being able to find diesel fuel. Further more, even though more than 20% of stations
offered diesel fuel after 1982, the levels of concern remained about the same for new purchasers.
Finally, the researchers determined that no matter what their initial level of apprehension was,
most diesel vehicle purchasers reported that their concerns were the same or less after buying the
car.
Although the paper does not directly address the acceptance of hydrogen fuel cell technology,
it does talk about the possibility of a network that provides methanol and compressed natural gas
as a fuel source. The paper expresses concern over acceptance of these technologies, especially if
they did not have a network as extensive as the diesel one was at the beginning of the study period.
In addition, these newer types of vehicles would likely have a shorter range than diesel vehicles,
which were themselves improvements over the range and efficiency of more traditional gasoline
cars. This shorter range would decrease purchaser confidence below that of the diesel users, which
13.2. Driver Behavior 140
had a moderate to large amount of concern despite the favorability of diesel fuel.
Finally, the paper recommends a network size of at least 15% that of the existing gasoline
network to reduce consumer concern and subsequently enable significant market penetration of
the new technology. This number refers to the scenario where the primary users own vehicles
that only use the new fuel technology. For hybrid technology cars that can accept the new fuel
or traditional gasoline, the initial size requirement is slightly lower but still better than 10%.
(Sperling, 1987 [199]).
13.2.2 Relationship to Design of Network –Where/When to refuel
According to the research in Davis, most drivers could not precisely identify the least and most
expensive gas available to them. Drivers were also more aware of stations in downtown or neigh-
borhood locations than freeway exit locations. In this research, the authors recommended that
this study is applicable for the design of a network of refueling stations for alternative fuels such
as alcohols, gas, or hydrogen.
According to the research in Davis, most drivers tended to refuel their cars out of habit. Home
was the typical origin of the refueling trip, and work was the most common destination. Drivers
tend to refuel without going out of their way or at least no distance exceeding two blocks. Davis
states that drivers on a refueling trip were less able to identify the cheapest or most expensive
stations than drivers on other kinds of trips. On average, the Davis drivers had more accurate
mental map knowledge about their six closest neighborhood stations than they did about their
seven closest freeway stations. The features of the three downtown stations were less well known
than were those of the suburban neighborhood stations. Because of these facts, the Davis experi-
ence supports a strategy of selecting an in-town station instead of a freeway exit station to ensure
that the maximum number of local residents will be made aware of the availability of a new fuel
opportunity.
In the survey, Davis drivers are relatively unconcerned about the price of fuel. Most of the
Davis drivers bought fuel often or always from the same station, simply out of habit. While some
people in the Davis research exhibited some price-conscious behaviors, they are far from being
optimizers. Many have habits of patronage at expensive but more convenient stations, and over 80
percent rank location and quality as more important than price in selecting their regular station
13.3. Information Derived from Japan 141
(Dingemans, 1986 [200]).
In summary, convenience of location was most important, especially for the 10 percent of
refueling trips that were single purpose trips for refueling alone. This pattern of refueling close
to home or work is expected to be found elsewhere, even in large metropolitan areas and more
complex situations with more refueling options. In a parallel situation, few ordinary drivers could
be expected to learn of the availability of an alternative fuel in Davis unless they had already
begun to consider the possibility of buying an alternative fuel vehicle. Thus, local information
dissemination programs might be needed to make all potential purchasers of a new fuel vehicle
aware of the local availability of that new fuel. In locating the first few, decision makers should
be most aware of the great premium placed on locational convenience (Diffusion, 2004 [201]).
Home was the most common origin or destination, accounting for 74.8 percent of trips. And
the most popular time to refuel was when the home is the trip origin. Most people prefer to refuel
five minutes from their origin or destination, accounting for 71.9% percent of trips. Drivers also
show a strong tendency to refuel at the beginning of the journey. Kitamura and Sperling indicate
that consumers prefer to refuel near their home, and to a lesser extent, their work. They suggest
that a large amount of refueling occurs along the commute route (Kitamura, 1987 [202]).
13.3 Information Derived from Japan
Due to a scarcity of US data such as construction cost and hydrogen price, we researched Japan’s
hydrogen project data. Japan has one of the most advanced experiences in hydrogen fuel projects,
with some of the most advanced technologies. The New Energy and Industrial Technology De-
velopment Organization (NEDO) and the Japan Hydrogen & Fuel Cell Demonstration Project
(JHFC), both of which are established by the Japanese Government, have played important roles
in developing hydrogen fuel vehicles and hydrogen fuel stations.
Although the JHFC project is ongoing and information about costs is confidential, NEDO
has already conducted extensive researches on hydrogen fueling facilities that are available to the
public. Since available US cost information is scarce, the Japanese research seemed to be a good
alternative.
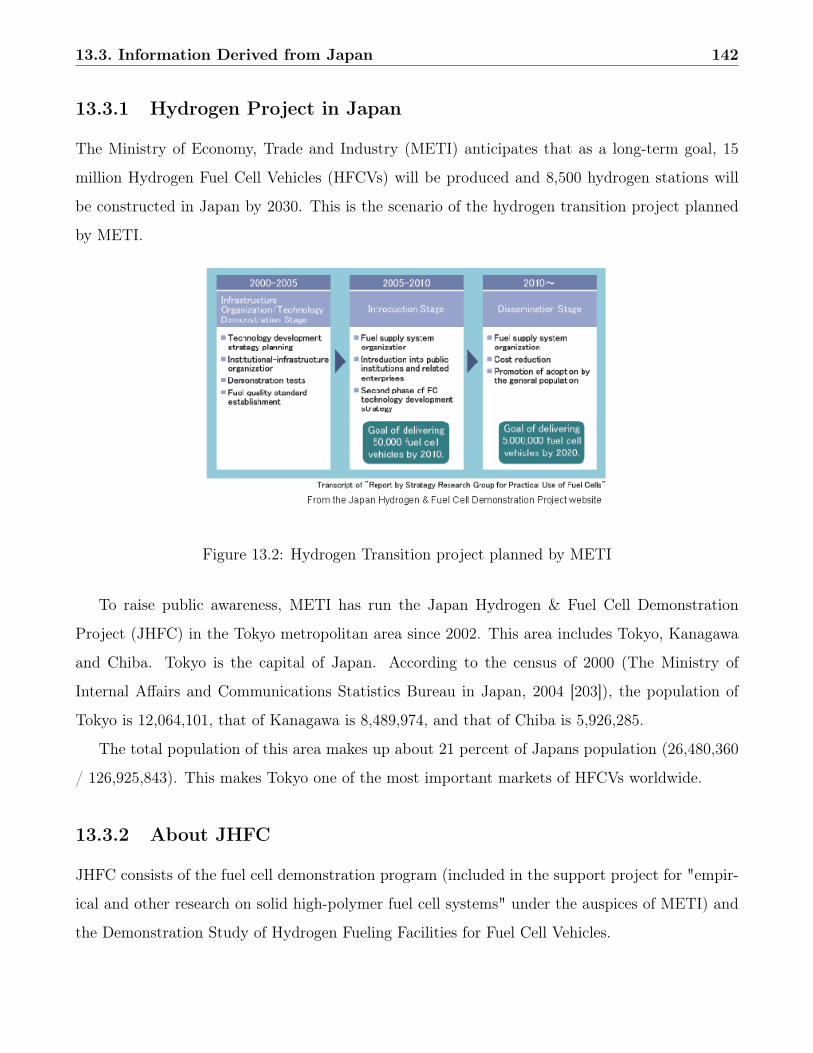
13.3. Information Derived from Japan 142
13.3.1 Hydrogen Project in Japan
The Ministry of Economy, Trade and Industry (METI) anticipates that as a long-term goal, 15
million Hydrogen Fuel Cell Vehicles (HFCVs) will be produced and 8,500 hydrogen stations will
be constructed in Japan by 2030. This is the scenario of the hydrogen transition project planned
by METI.
Figure 13.2: Hydrogen Transition project planned by METI
To raise public awareness, METI has run the Japan Hydrogen & Fuel Cell Demonstration
Project (JHFC) in the Tokyo metropolitan area since 2002. This area includes Tokyo, Kanagawa
and Chiba. Tokyo is the capital of Japan. According to the census of 2000 (The Ministry of
Internal Affairs and Communications Statistics Bureau in Japan, 2004 [203]), the population of
Tokyo is 12,064,101, that of Kanagawa is 8,489,974, and that of Chiba is 5,926,285.
The total population of this area makes up about 21 percent of Japans population (26,480,360
/ 126,925,843). This makes Tokyo one of the most important markets of HFCVs worldwide.
13.3.2 About JHFC
JHFC consists of the fuel cell demonstration program (included in the support project for "empir-
ical and other research on solid high-polymer fuel cell systems" under the auspices of METI) and
the Demonstration Study of Hydrogen Fueling Facilities for Fuel Cell Vehicles.
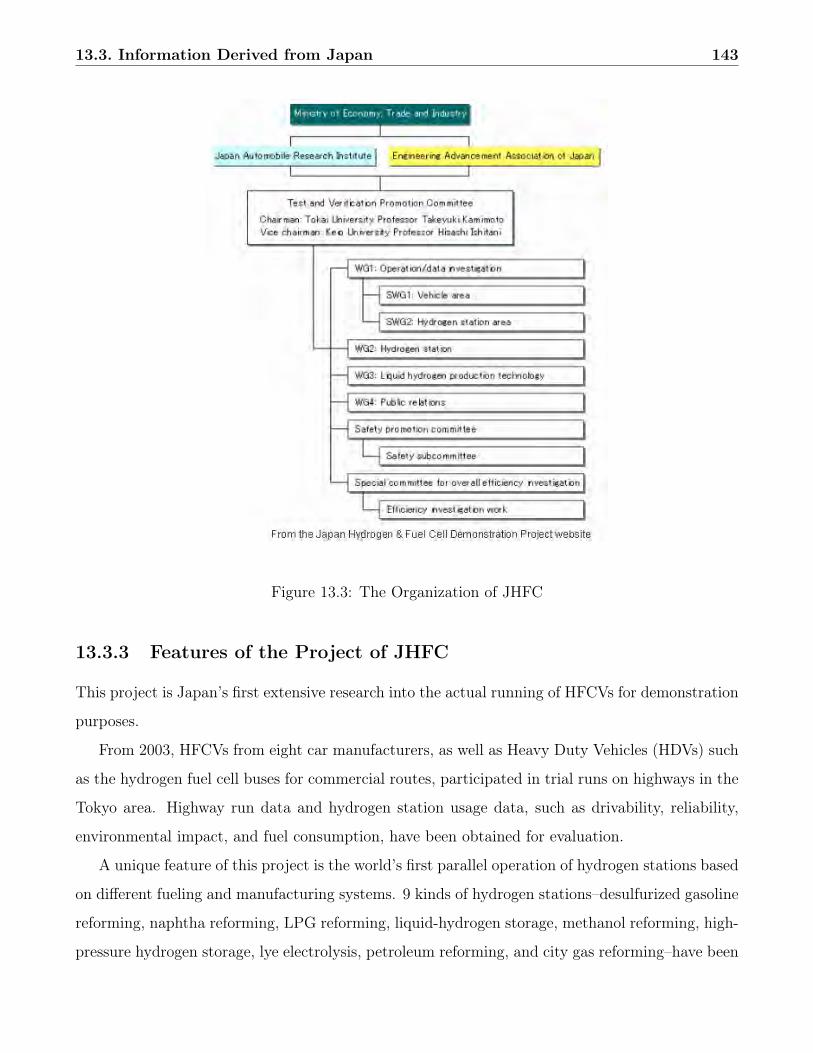
13.3. Information Derived from Japan 143
Figure 13.3: The Organization of JHFC
13.3.3 Features of the Project of JHFC
This project is Japan’s first extensive research into the actual running of HFCVs for demonstration
purposes.
From 2003, HFCVs from eight car manufacturers, as well as Heavy Duty Vehicles (HDVs) such
as the hydrogen fuel cell buses for commercial routes, participated in trial runs on highways in the
Tokyo area. Highway run data and hydrogen station usage data, such as drivability, reliability,
environmental impact, and fuel consumption, have been obtained for evaluation.
A unique feature of this project is the world’s first parallel operation of hydrogen stations based
on different fueling and manufacturing systems. 9 kinds of hydrogen stations–desulfurized gasoline
reforming, naphtha reforming, LPG reforming, liquid-hydrogen storage, methanol reforming, high-
pressure hydrogen storage, lye electrolysis, petroleum reforming, and city gas reforming–have been
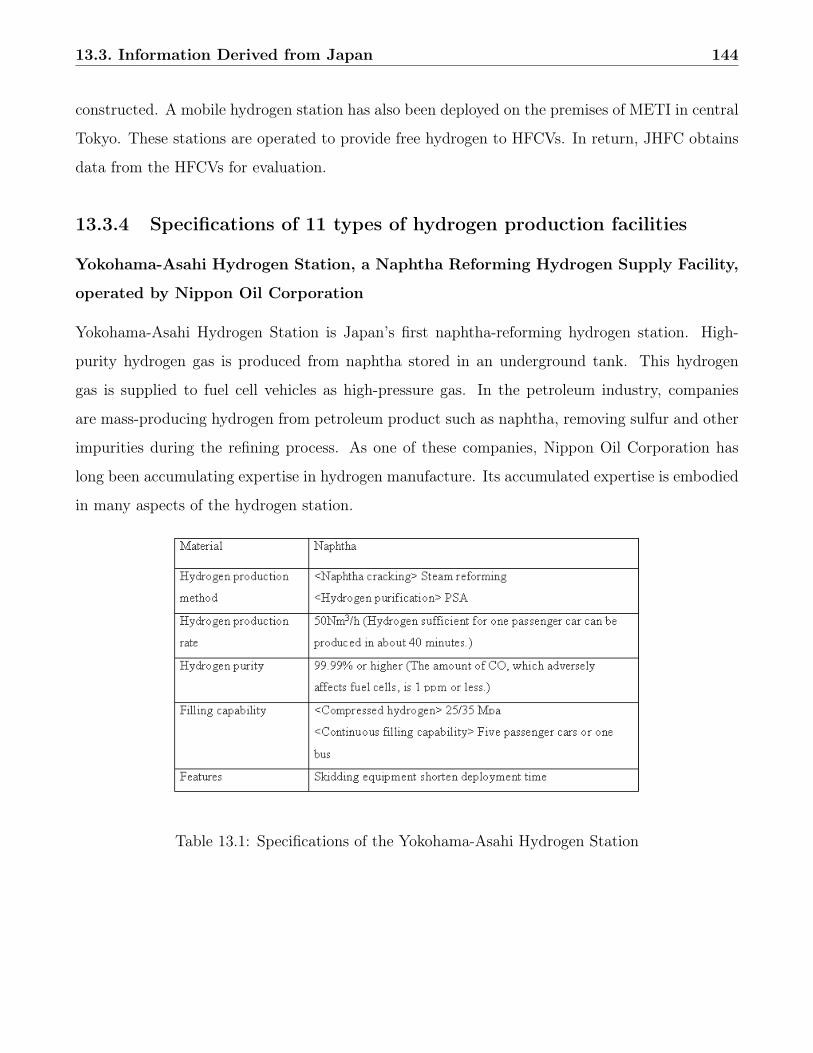
13.3. Information Derived from Japan 144
constructed. A mobile hydrogen station has also been deployed on the premises of METI in central
Tokyo. These stations are operated to provide free hydrogen to HFCVs. In return, JHFC obtains
data from the HFCVs for evaluation.
13.3.4 Specifications of 11 types of hydrogen production facilities
Yokohama-Asahi Hydrogen Station, a Naphtha Reforming Hydrogen Supply Facility,
operated by Nippon Oil Corporation
Yokohama-Asahi Hydrogen Station is Japan’s first naphtha-reforming hydrogen station. High-
purity hydrogen gas is produced from naphtha stored in an underground tank. This hydrogen
gas is supplied to fuel cell vehicles as high-pressure gas. In the petroleum industry, companies
are mass-producing hydrogen from petroleum product such as naphtha, removing sulfur and other
impurities during the refining process. As one of these companies, Nippon Oil Corporation has
long been accumulating expertise in hydrogen manufacture. Its accumulated expertise is embodied
in many aspects of the hydrogen station.
Table 13.1: Specifications of the Yokohama-Asahi Hydrogen Station
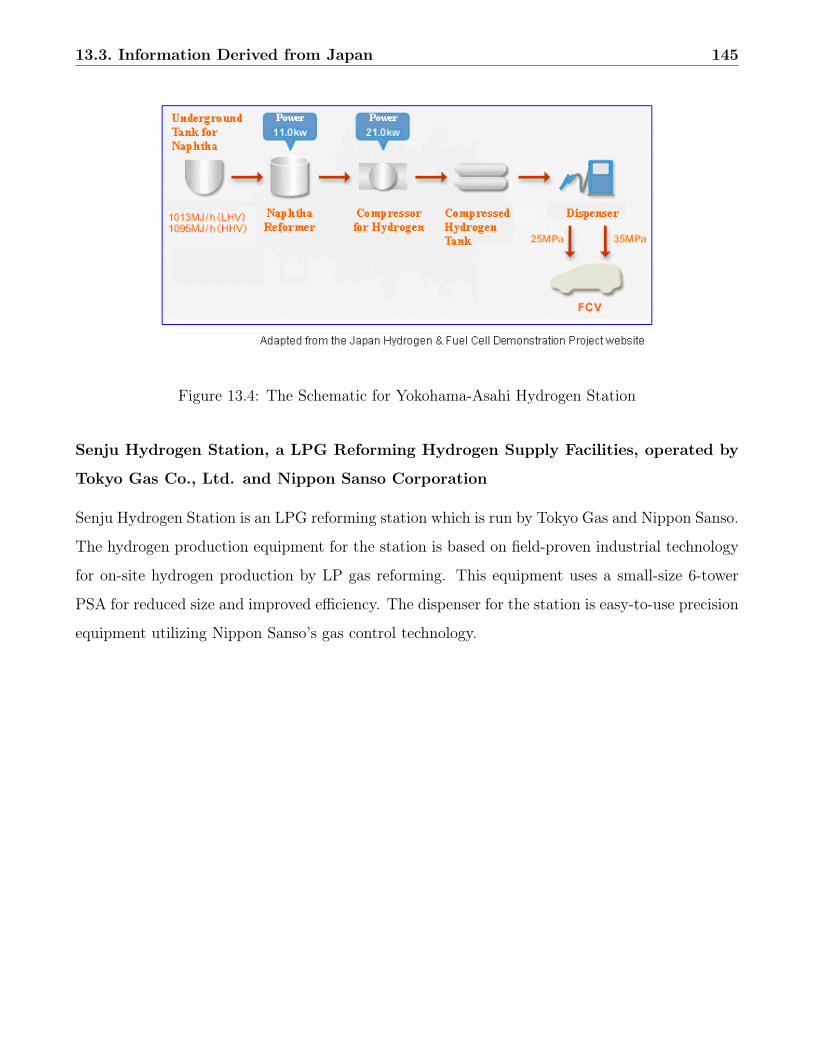
13.3. Information Derived from Japan 145
Figure 13.4: The Schematic for Yokohama-Asahi Hydrogen Station
Senju Hydrogen Station, a LPG Reforming Hydrogen Supply Facilities, operated by
Tokyo Gas Co., Ltd. and Nippon Sanso Corporation
Senju Hydrogen Station is an LPG reforming station which is run by Tokyo Gas and Nippon Sanso.
The hydrogen production equipment for the station is based on field-proven industrial technology
for on-site hydrogen production by LP gas reforming. This equipment uses a small-size 6-tower
PSA for reduced size and improved efficiency. The dispenser for the station is easy-to-use precision
equipment utilizing Nippon Sanso’s gas control technology.
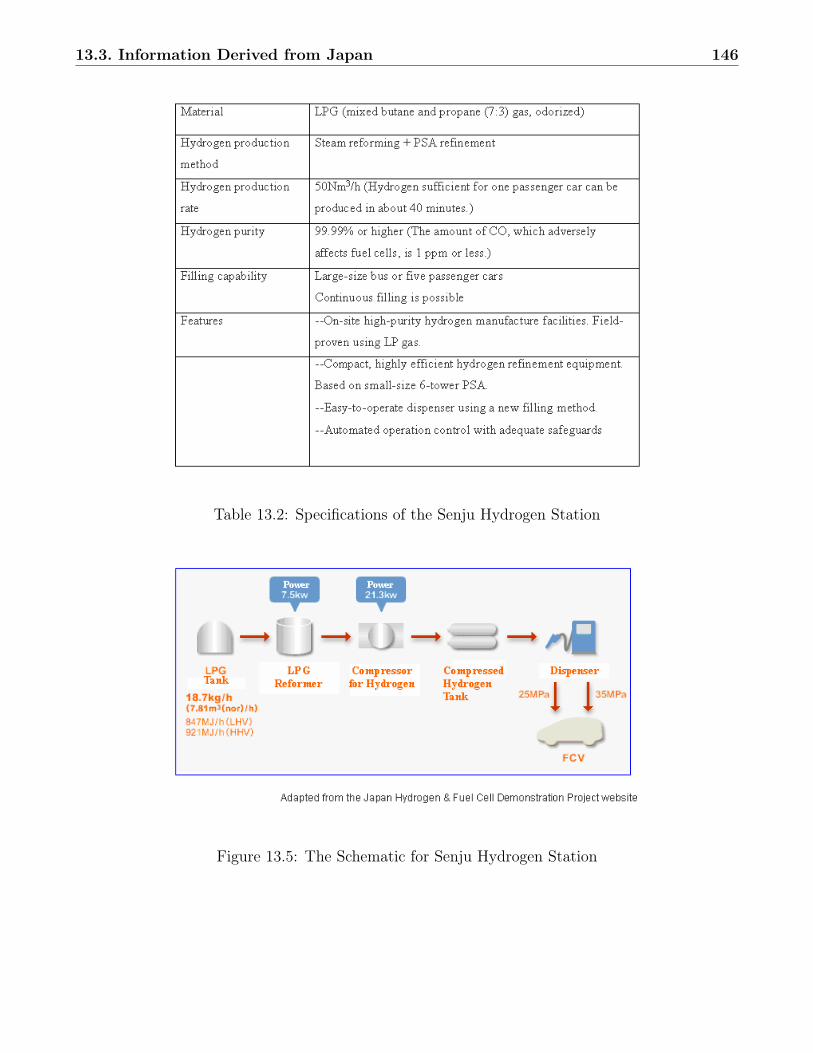
13.3. Information Derived from Japan 146
Table 13.2: Specifications of the Senju Hydrogen Station
Figure 13.5: The Schematic for Senju Hydrogen Station
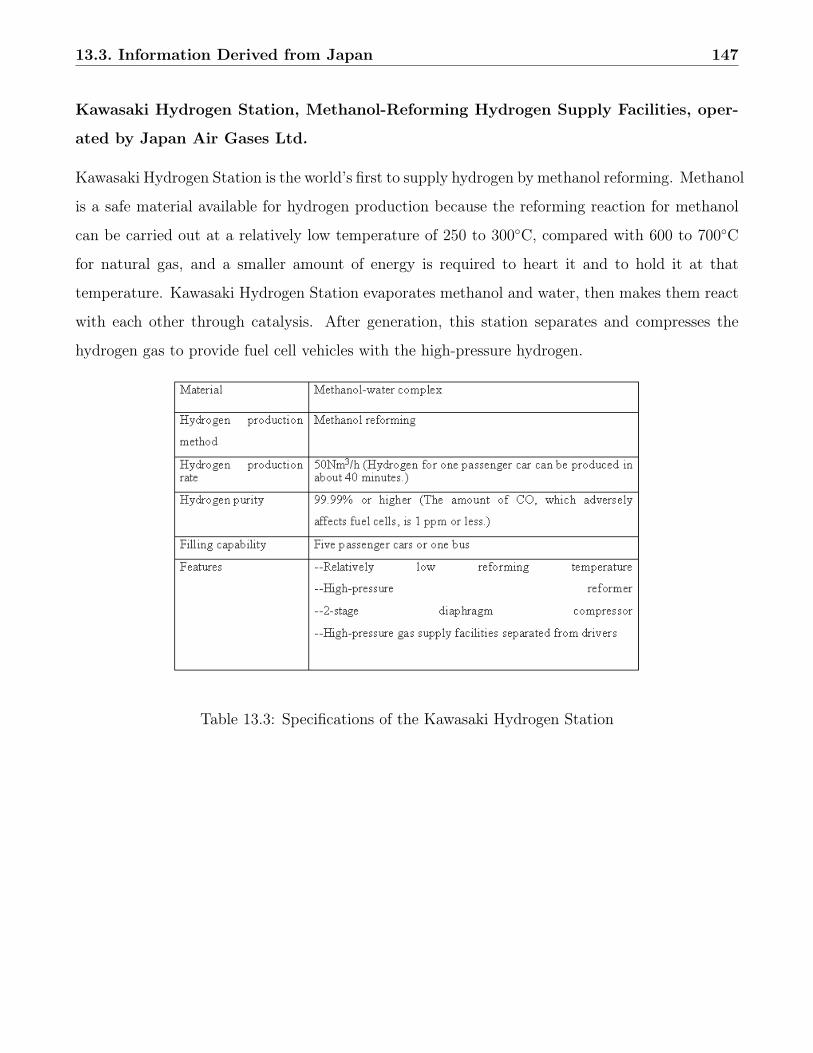
13.3. Information Derived from Japan 147
Kawasaki Hydrogen Station, Methanol-Reforming Hydrogen Supply Facilities, oper-
ated by Japan Air Gases Ltd.
Kawasaki Hydrogen Station is the world’s first to supply hydrogen by methanol reforming. Methanol
is a safe material available for hydrogen production because the reforming reaction for methanol
can be carried out at a relatively low temperature of 250 to 300◦C, compared with 600 to 700◦C
for natural gas, and a smaller amount of energy is required to heart it and to hold it at that
temperature. Kawasaki Hydrogen Station evaporates methanol and water, then makes them react
with each other through catalysis. After generation, this station separates and compresses the
hydrogen gas to provide fuel cell vehicles with the high-pressure hydrogen.
Table 13.3: Specifications of the Kawasaki Hydrogen Station
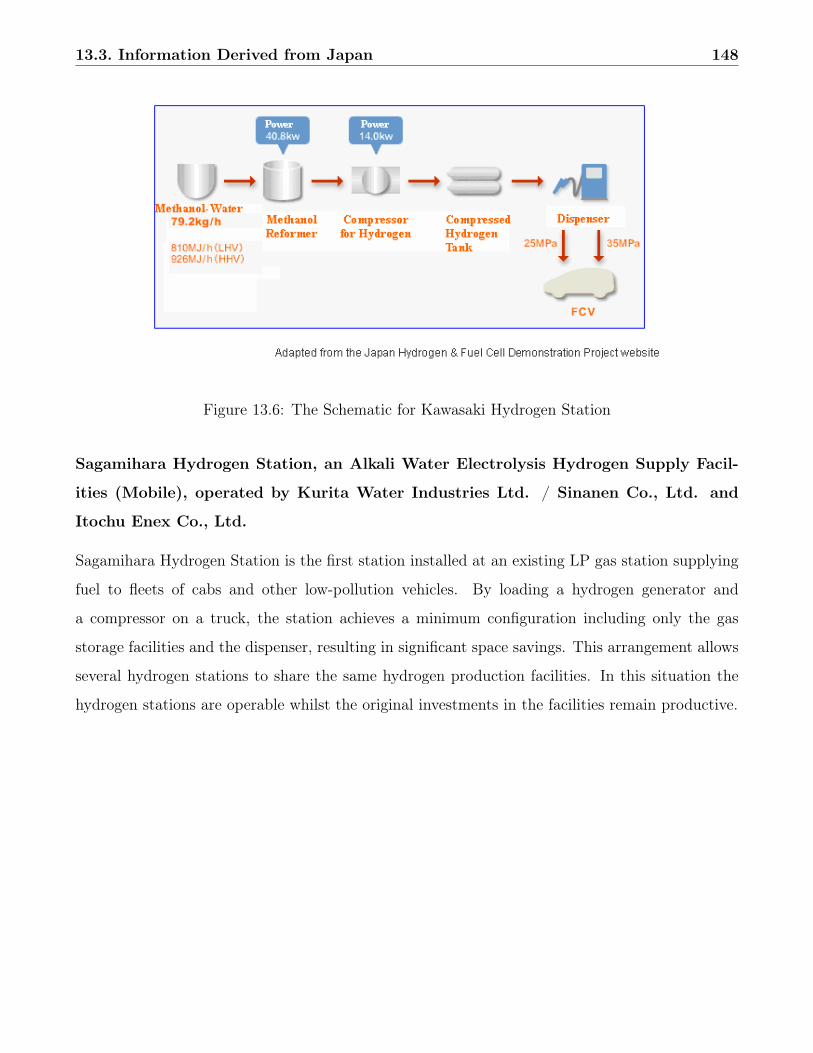
13.3. Information Derived from Japan 148
Figure 13.6: The Schematic for Kawasaki Hydrogen Station
Sagamihara Hydrogen Station, an Alkali Water Electrolysis Hydrogen Supply Facil-
ities (Mobile), operated by Kurita Water Industries Ltd. / Sinanen Co., Ltd. and
Itochu Enex Co., Ltd.
Sagamihara Hydrogen Station is the first station installed at an existing LP gas station supplying
fuel to fleets of cabs and other low-pollution vehicles. By loading a hydrogen generator and
a compressor on a truck, the station achieves a minimum configuration including only the gas
storage facilities and the dispenser, resulting in significant space savings. This arrangement allows
several hydrogen stations to share the same hydrogen production facilities. In this situation the
hydrogen stations are operable whilst the original investments in the facilities remain productive.
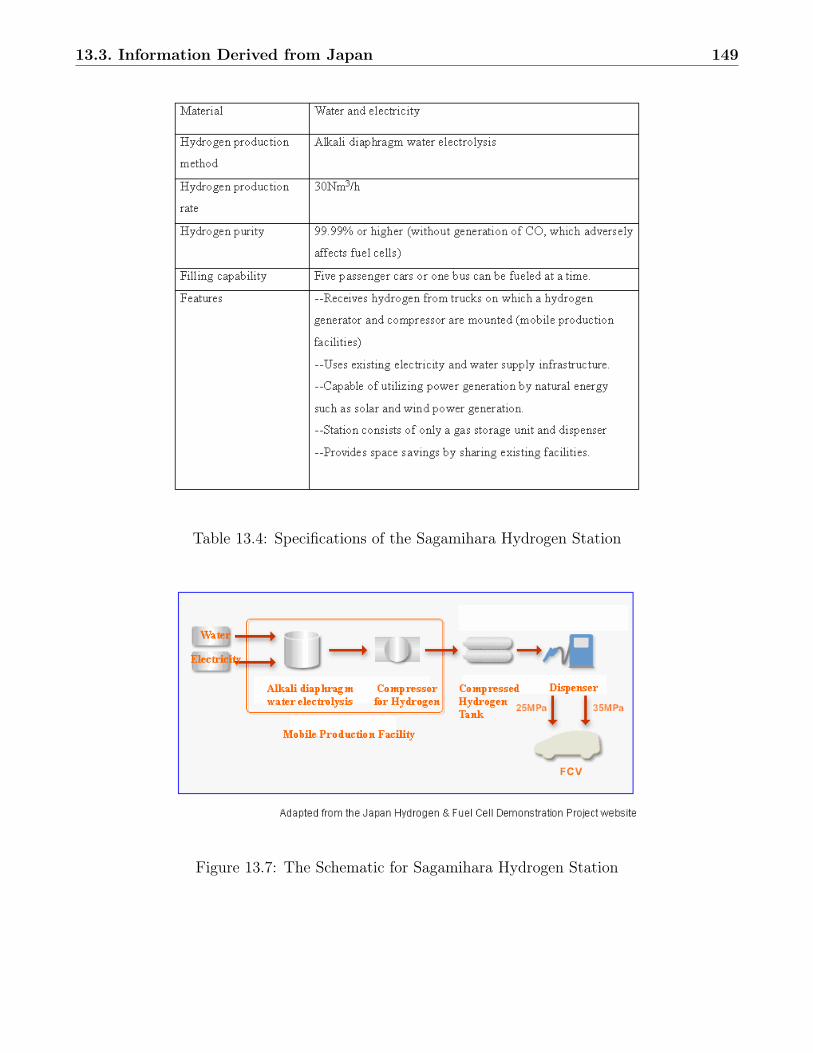
13.3. Information Derived from Japan 149
Table 13.4: Specifications of the Sagamihara Hydrogen Station
Figure 13.7: The Schematic for Sagamihara Hydrogen Station
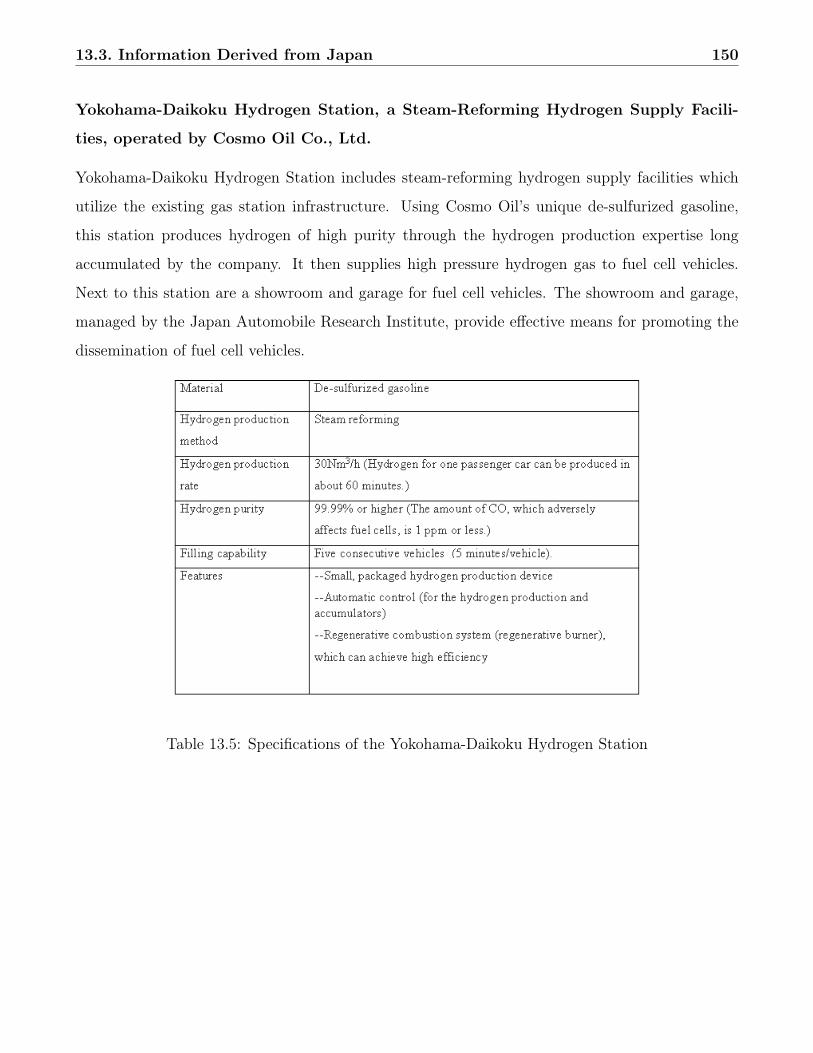
13.3. Information Derived from Japan 150
Yokohama-Daikoku Hydrogen Station, a Steam-Reforming Hydrogen Supply Facili-
ties, operated by Cosmo Oil Co., Ltd.
Yokohama-Daikoku Hydrogen Station includes steam-reforming hydrogen supply facilities which
utilize the existing gas station infrastructure. Using Cosmo Oil’s unique de-sulfurized gasoline,
this station produces hydrogen of high purity through the hydrogen production expertise long
accumulated by the company. It then supplies high pressure hydrogen gas to fuel cell vehicles.
Next to this station are a showroom and garage for fuel cell vehicles. The showroom and garage,
managed by the Japan Automobile Research Institute, provide effective means for promoting the
dissemination of fuel cell vehicles.
Table 13.5: Specifications of the Yokohama-Daikoku Hydrogen Station
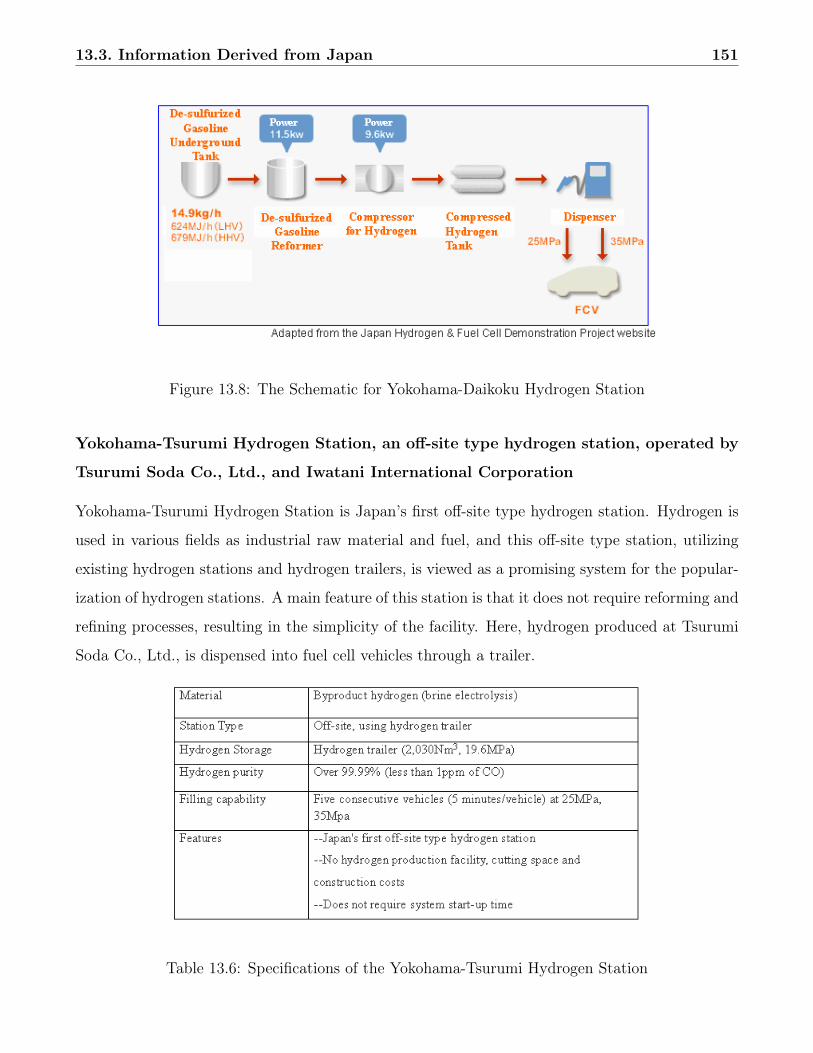
13.3. Information Derived from Japan 151
Figure 13.8: The Schematic for Yokohama-Daikoku Hydrogen Station
Yokohama-Tsurumi Hydrogen Station, an off-site type hydrogen station, operated by
Tsurumi Soda Co., Ltd., and Iwatani International Corporation
Yokohama-Tsurumi Hydrogen Station is Japan’s first off-site type hydrogen station. Hydrogen is
used in various fields as industrial raw material and fuel, and this off-site type station, utilizing
existing hydrogen stations and hydrogen trailers, is viewed as a promising system for the popular-
ization of hydrogen stations. A main feature of this station is that it does not require reforming and
refining processes, resulting in the simplicity of the facility. Here, hydrogen produced at Tsurumi
Soda Co., Ltd., is dispensed into fuel cell vehicles through a trailer.
Table 13.6: Specifications of the Yokohama-Tsurumi Hydrogen Station
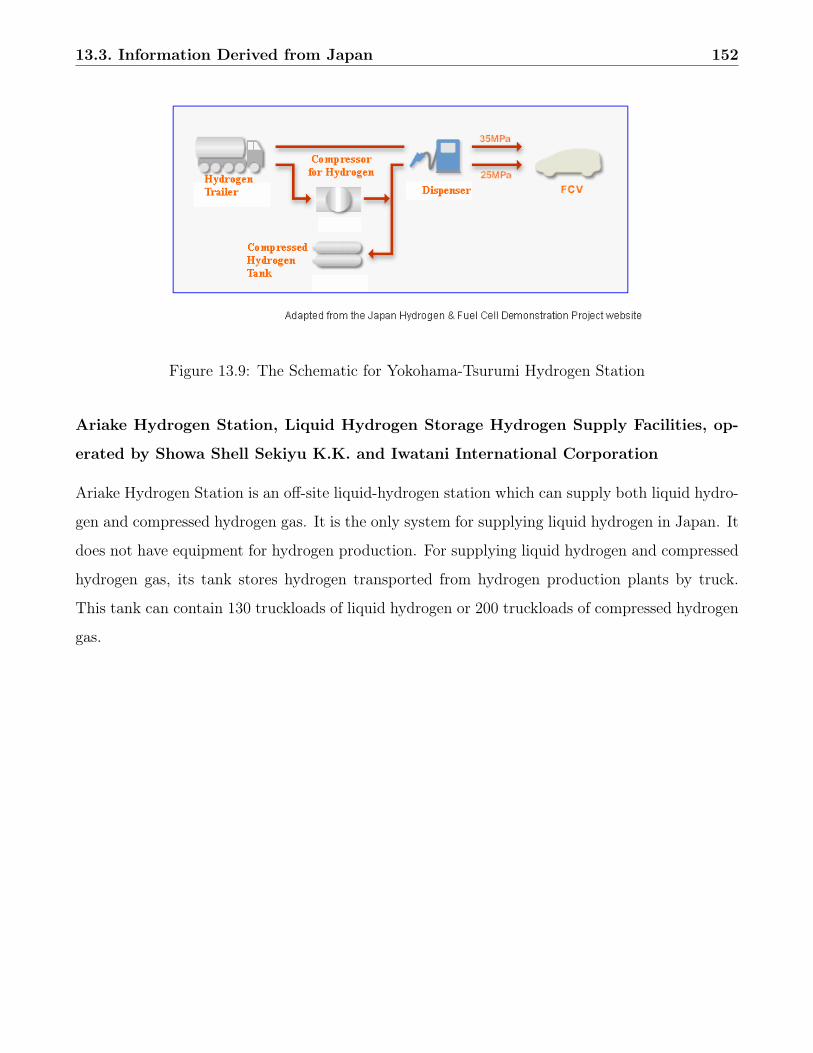
13.3. Information Derived from Japan 152
Figure 13.9: The Schematic for Yokohama-Tsurumi Hydrogen Station
Ariake Hydrogen Station, Liquid Hydrogen Storage Hydrogen Supply Facilities, op-
erated by Showa Shell Sekiyu K.K. and Iwatani International Corporation
Ariake Hydrogen Station is an off-site liquid-hydrogen station which can supply both liquid hydro-
gen and compressed hydrogen gas. It is the only system for supplying liquid hydrogen in Japan. It
does not have equipment for hydrogen production. For supplying liquid hydrogen and compressed
hydrogen gas, its tank stores hydrogen transported from hydrogen production plants by truck.
This tank can contain 130 truckloads of liquid hydrogen or 200 truckloads of compressed hydrogen
gas.
13.3. Information Derived from Japan 153
Table 13.7: Specifications of the Ariake Hydrogen Station
Figure 13.10: The Schematic for Ariake Hydrogen Station
Ome Hydrogen Station, a Natural Gas Reforming Hydrogen Supply Facilities, oper-
ated by Babcock-Hitachi K.K.
The Oume Hydrogen Station includes facilities for producing hydrogen by reforming natural gas
(city gas). The production costs of this hydrogen production can be reduced because the infras-
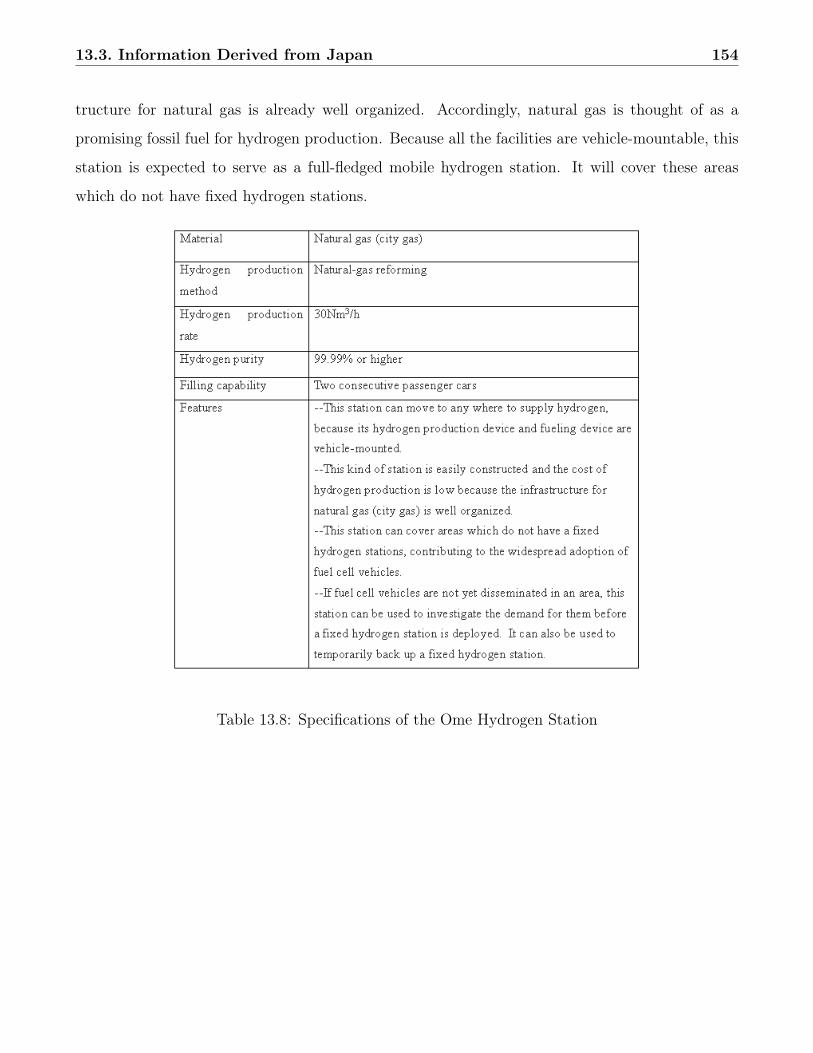
13.3. Information Derived from Japan 154
tructure for natural gas is already well organized. Accordingly, natural gas is thought of as a
promising fossil fuel for hydrogen production. Because all the facilities are vehicle-mountable, this
station is expected to serve as a full-fledged mobile hydrogen station. It will cover these areas
which do not have fixed hydrogen stations.
Table 13.8: Specifications of the Ome Hydrogen Station
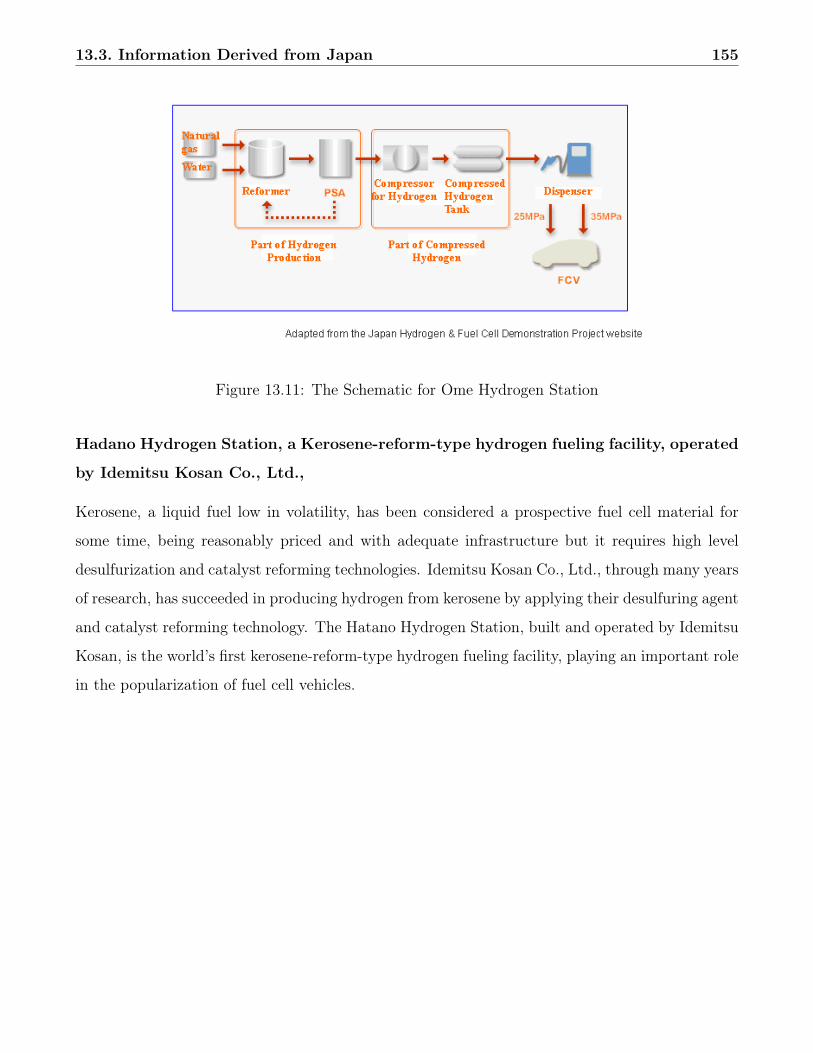
13.3. Information Derived from Japan 155
Figure 13.11: The Schematic for Ome Hydrogen Station
Hadano Hydrogen Station, a Kerosene-reform-type hydrogen fueling facility, operated
by Idemitsu Kosan Co., Ltd.,
Kerosene, a liquid fuel low in volatility, has been considered a prospective fuel cell material for
some time, being reasonably priced and with adequate infrastructure but it requires high level
desulfurization and catalyst reforming technologies. Idemitsu Kosan Co., Ltd., through many years
of research, has succeeded in producing hydrogen from kerosene by applying their desulfuring agent
and catalyst reforming technology. The Hatano Hydrogen Station, built and operated by Idemitsu
Kosan, is the world’s first kerosene-reform-type hydrogen fueling facility, playing an important role
in the popularization of fuel cell vehicles.

13.3. Information Derived from Japan 156
Table 13.9: Specifications of the Hadano Hydrogen Station
Figure 13.12: The Schematic for Hadano Hydrogen Station
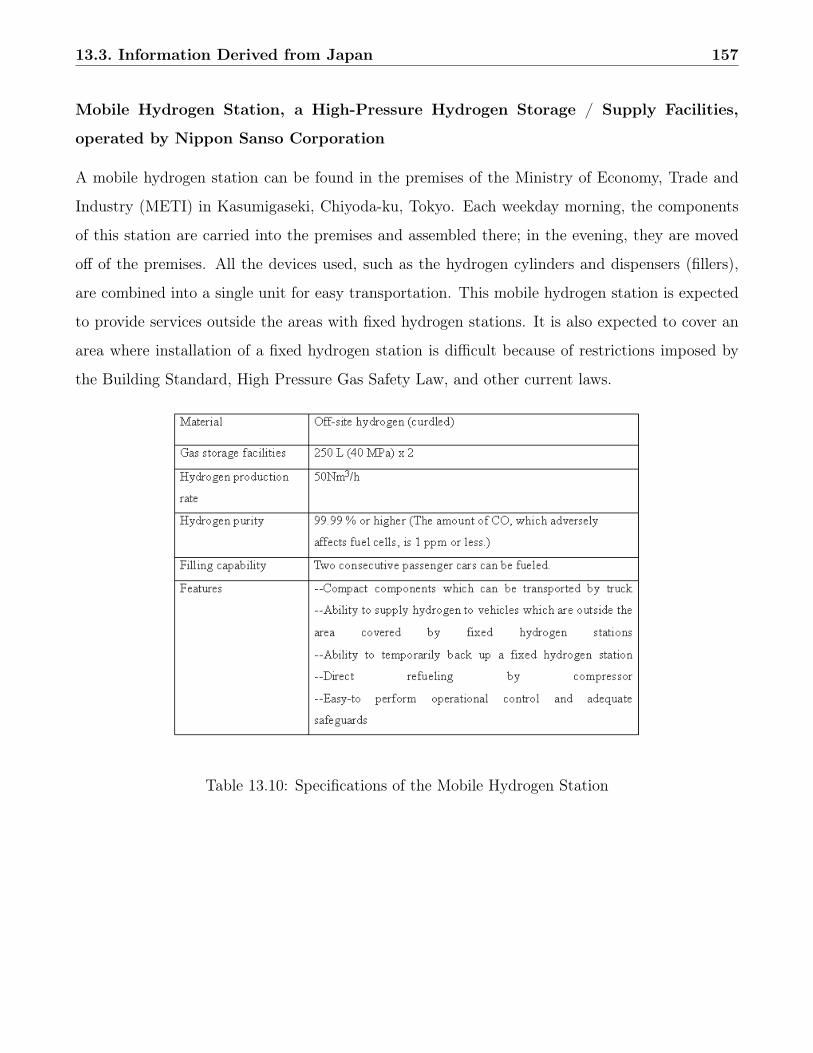
13.3. Information Derived from Japan 157
Mobile Hydrogen Station, a High-Pressure Hydrogen Storage / Supply Facilities,
operated by Nippon Sanso Corporation
A mobile hydrogen station can be found in the premises of the Ministry of Economy, Trade and
Industry (METI) in Kasumigaseki, Chiyoda-ku, Tokyo. Each weekday morning, the components
of this station are carried into the premises and assembled there; in the evening, they are moved
off of the premises. All the devices used, such as the hydrogen cylinders and dispensers (fillers),
are combined into a single unit for easy transportation. This mobile hydrogen station is expected
to provide services outside the areas with fixed hydrogen stations. It is also expected to cover an
area where installation of a fixed hydrogen station is difficult because of restrictions imposed by
the Building Standard, High Pressure Gas Safety Law, and other current laws.
Table 13.10: Specifications of the Mobile Hydrogen Station
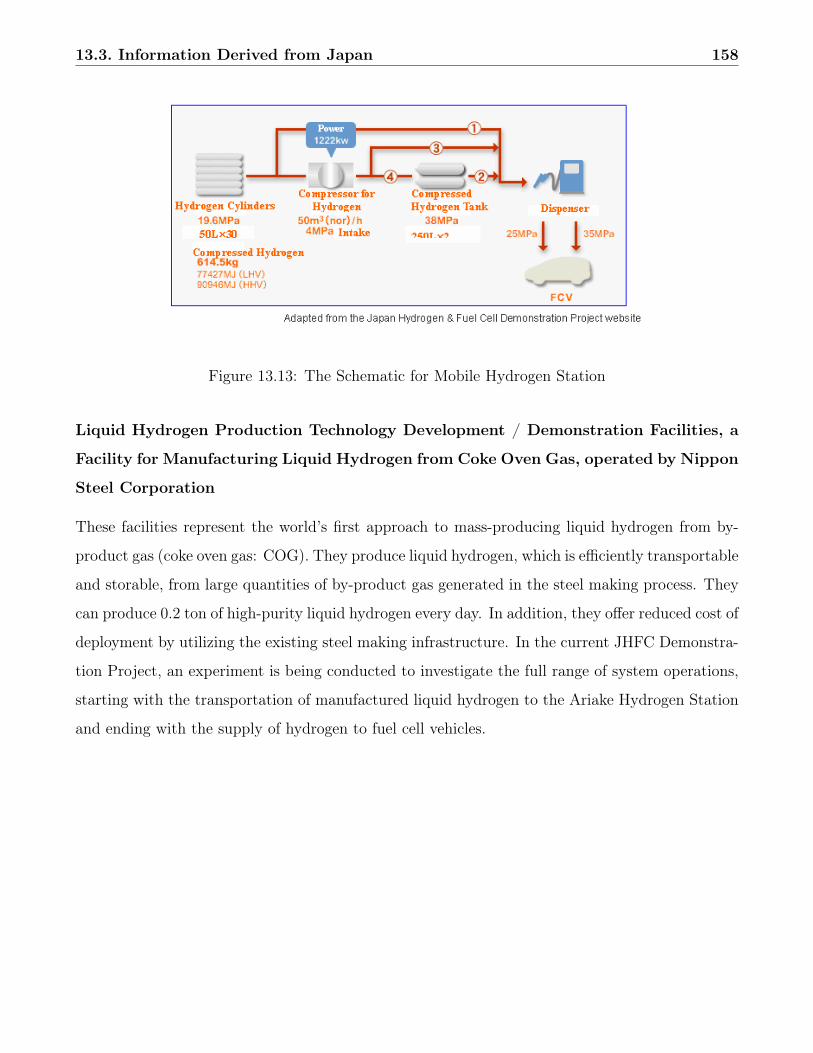
13.3. Information Derived from Japan 158
Figure 13.13: The Schematic for Mobile Hydrogen Station
Liquid Hydrogen Production Technology Development / Demonstration Facilities, a
Facility for Manufacturing Liquid Hydrogen from Coke Oven Gas, operated by Nippon
Steel Corporation
These facilities represent the world’s first approach to mass-producing liquid hydrogen from by-
product gas (coke oven gas: COG). They produce liquid hydrogen, which is efficiently transportable
and storable, from large quantities of by-product gas generated in the steel making process. They
can produce 0.2 ton of high-purity liquid hydrogen every day. In addition, they offer reduced cost of
deployment by utilizing the existing steel making infrastructure. In the current JHFC Demonstra-
tion Project, an experiment is being conducted to investigate the full range of system operations,
starting with the transportation of manufactured liquid hydrogen to the Ariake Hydrogen Station
and ending with the supply of hydrogen to fuel cell vehicles.
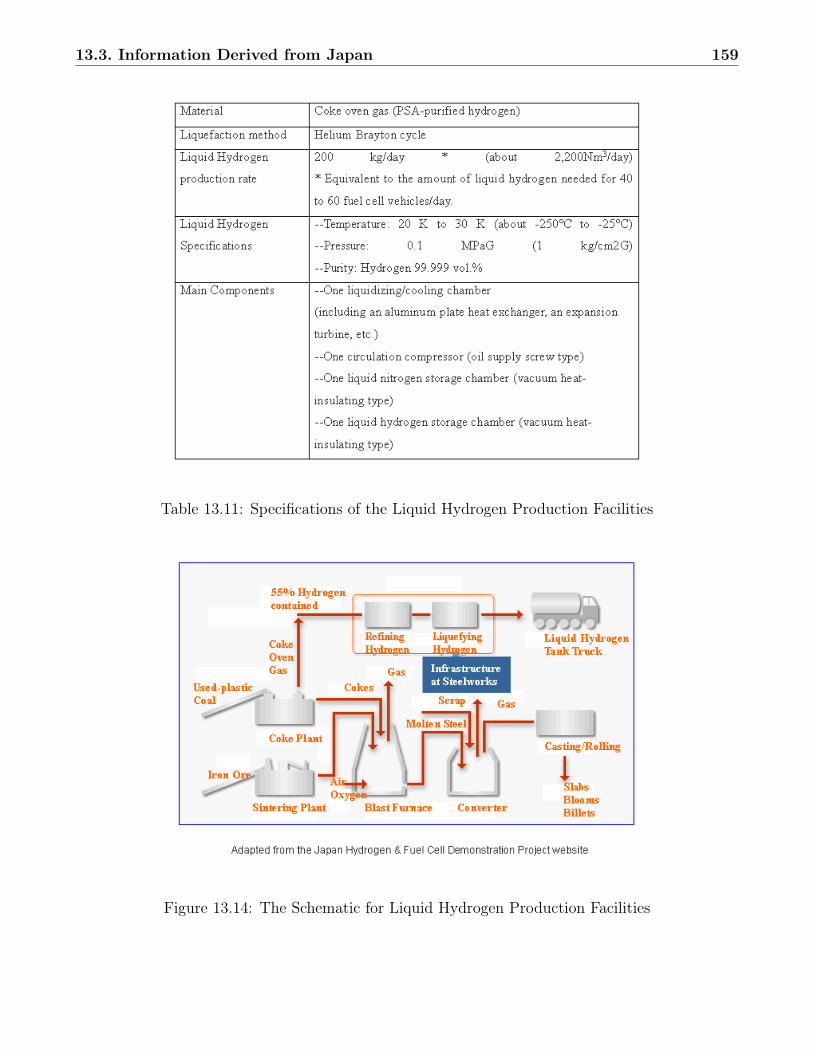
13.3. Information Derived from Japan 159
Table 13.11: Specifications of the Liquid Hydrogen Production Facilities
Figure 13.14: The Schematic for Liquid Hydrogen Production Facilities
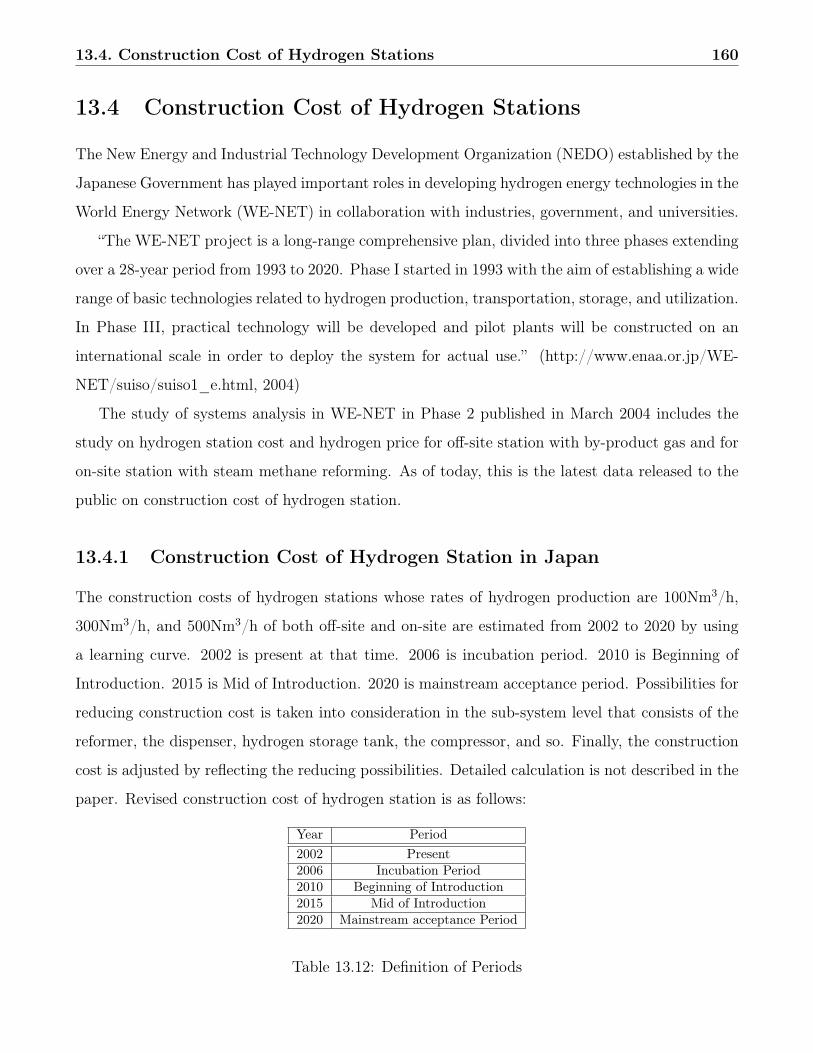
13.4. Construction Cost of Hydrogen Stations 160
13.4 Construction Cost of Hydrogen Stations
The New Energy and Industrial Technology Development Organization (NEDO) established by the
Japanese Government has played important roles in developing hydrogen energy technologies in the
World Energy Network (WE-NET) in collaboration with industries, government, and universities.
“The WE-NET project is a long-range comprehensive plan, divided into three phases extending
over a 28-year period from 1993 to 2020. Phase I started in 1993 with the aim of establishing a wide
range of basic technologies related to hydrogen production, transportation, storage, and utilization.
In Phase III, practical technology will be developed and pilot plants will be constructed on an
international scale in order to deploy the system for actual use.” (http://www.enaa.or.jp/WE-
NET/suiso/suiso1_e.html, 2004)
The study of systems analysis in WE-NET in Phase 2 published in March 2004 includes the
study on hydrogen station cost and hydrogen price for off-site station with by-product gas and for
on-site station with steam methane reforming. As of today, this is the latest data released to the
public on construction cost of hydrogen station.
13.4.1 Construction Cost of Hydrogen Station in Japan
The construction costs of hydrogen stations whose rates of hydrogen production are 100Nm3/h,
300Nm3/h, and 500Nm3/h of both off-site and on-site are estimated from 2002 to 2020 by using
a learning curve. 2002 is present at that time. 2006 is incubation period. 2010 is Beginning of
Introduction. 2015 is Mid of Introduction. 2020 is mainstream acceptance period. Possibilities for
reducing construction cost is taken into consideration in the sub-system level that consists of the
reformer, the dispenser, hydrogen storage tank, the compressor, and so. Finally, the construction
cost is adjusted by reflecting the reducing possibilities. Detailed calculation is not described in the
paper. Revised construction cost of hydrogen station is as follows:
Year Period2002 Present2006 Incubation Period2010 Beginning of Introduction2015 Mid of Introduction2020 Mainstream acceptance Period
Table 13.12: Definition of Periods
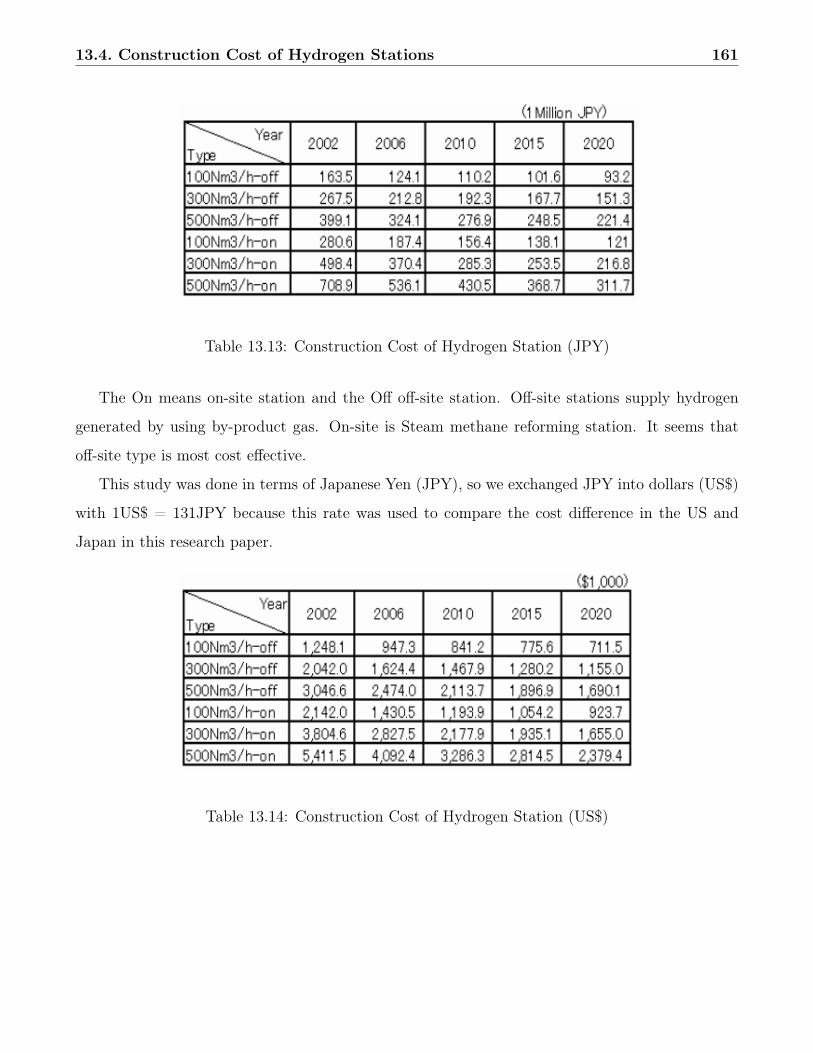
13.4. Construction Cost of Hydrogen Stations 161
Table 13.13: Construction Cost of Hydrogen Station (JPY)
The On means on-site station and the Off off-site station. Off-site stations supply hydrogen
generated by using by-product gas. On-site is Steam methane reforming station. It seems that
off-site type is most cost effective.
This study was done in terms of Japanese Yen (JPY), so we exchanged JPY into dollars (US$)
with 1US$ = 131JPY because this rate was used to compare the cost difference in the US and
Japan in this research paper.
Table 13.14: Construction Cost of Hydrogen Station (US$)
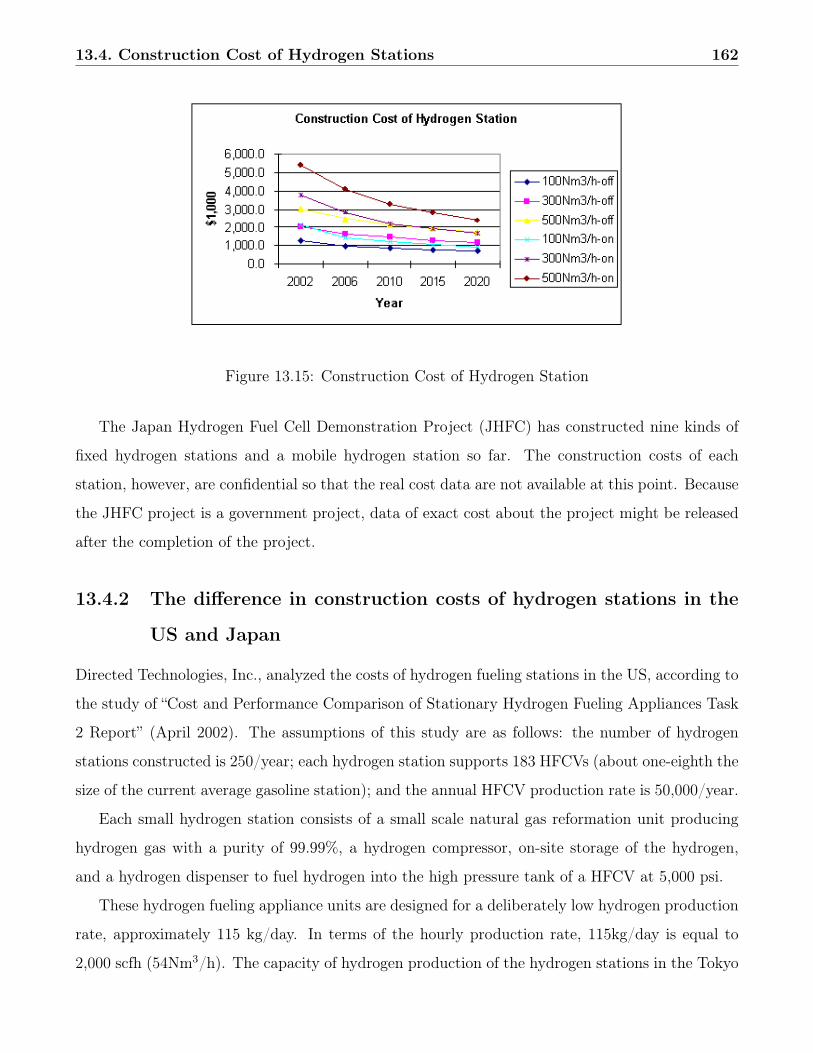
13.4. Construction Cost of Hydrogen Stations 162
Figure 13.15: Construction Cost of Hydrogen Station
The Japan Hydrogen Fuel Cell Demonstration Project (JHFC) has constructed nine kinds of
fixed hydrogen stations and a mobile hydrogen station so far. The construction costs of each
station, however, are confidential so that the real cost data are not available at this point. Because
the JHFC project is a government project, data of exact cost about the project might be released
after the completion of the project.
13.4.2 The difference in construction costs of hydrogen stations in the
US and Japan
Directed Technologies, Inc., analyzed the costs of hydrogen fueling stations in the US, according to
the study of “Cost and Performance Comparison of Stationary Hydrogen Fueling Appliances Task
2 Report” (April 2002). The assumptions of this study are as follows: the number of hydrogen
stations constructed is 250/year; each hydrogen station supports 183 HFCVs (about one-eighth the
size of the current average gasoline station); and the annual HFCV production rate is 50,000/year.
Each small hydrogen station consists of a small scale natural gas reformation unit producing
hydrogen gas with a purity of 99.99%, a hydrogen compressor, on-site storage of the hydrogen,
and a hydrogen dispenser to fuel hydrogen into the high pressure tank of a HFCV at 5,000 psi.
These hydrogen fueling appliance units are designed for a deliberately low hydrogen production
rate, approximately 115 kg/day. In terms of the hourly production rate, 115kg/day is equal to
2,000 scfh (54Nm3/h). The capacity of hydrogen production of the hydrogen stations in the Tokyo
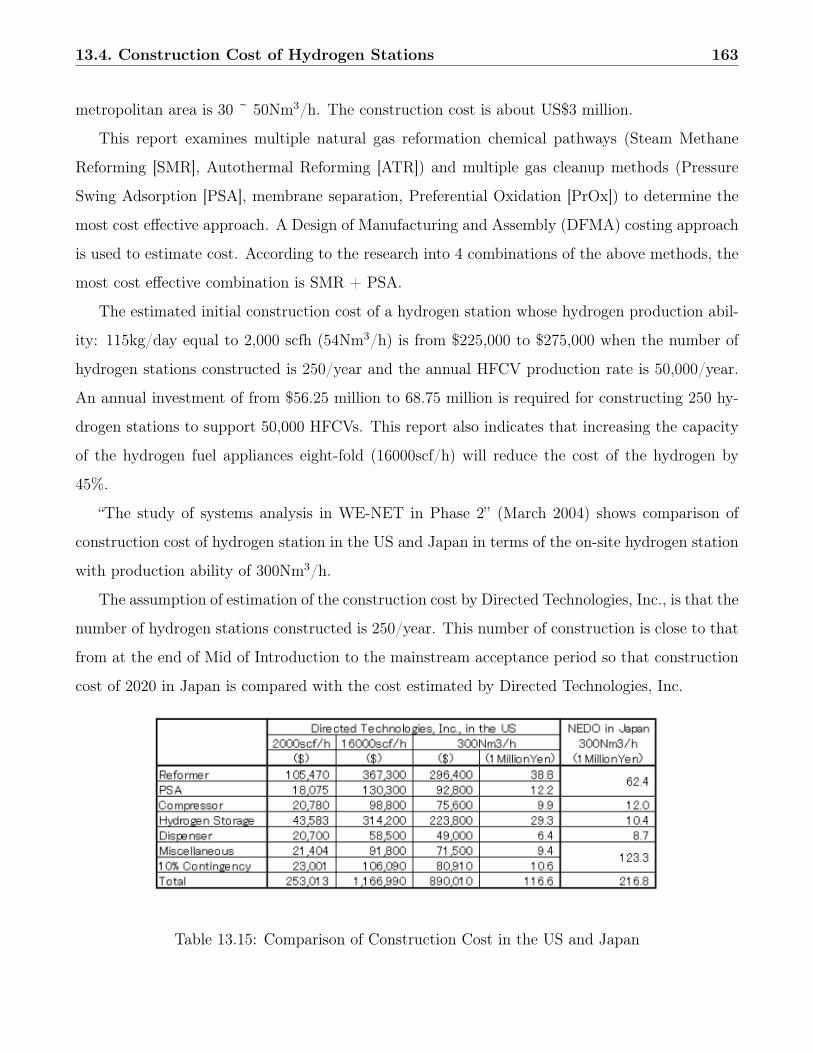
13.4. Construction Cost of Hydrogen Stations 163
metropolitan area is 30 ~ 50Nm3/h. The construction cost is about US$3 million.
This report examines multiple natural gas reformation chemical pathways (Steam Methane
Reforming [SMR], Autothermal Reforming [ATR]) and multiple gas cleanup methods (Pressure
Swing Adsorption [PSA], membrane separation, Preferential Oxidation [PrOx]) to determine the
most cost effective approach. A Design of Manufacturing and Assembly (DFMA) costing approach
is used to estimate cost. According to the research into 4 combinations of the above methods, the
most cost effective combination is SMR + PSA.
The estimated initial construction cost of a hydrogen station whose hydrogen production abil-
ity: 115kg/day equal to 2,000 scfh (54Nm3/h) is from $225,000 to $275,000 when the number of
hydrogen stations constructed is 250/year and the annual HFCV production rate is 50,000/year.
An annual investment of from $56.25 million to 68.75 million is required for constructing 250 hy-
drogen stations to support 50,000 HFCVs. This report also indicates that increasing the capacity
of the hydrogen fuel appliances eight-fold (16000scf/h) will reduce the cost of the hydrogen by
45%.
“The study of systems analysis in WE-NET in Phase 2” (March 2004) shows comparison of
construction cost of hydrogen station in the US and Japan in terms of the on-site hydrogen station
with production ability of 300Nm3/h.
The assumption of estimation of the construction cost by Directed Technologies, Inc., is that the
number of hydrogen stations constructed is 250/year. This number of construction is close to that
from at the end of Mid of Introduction to the mainstream acceptance period so that construction
cost of 2020 in Japan is compared with the cost estimated by Directed Technologies, Inc.
Table 13.15: Comparison of Construction Cost in the US and Japan
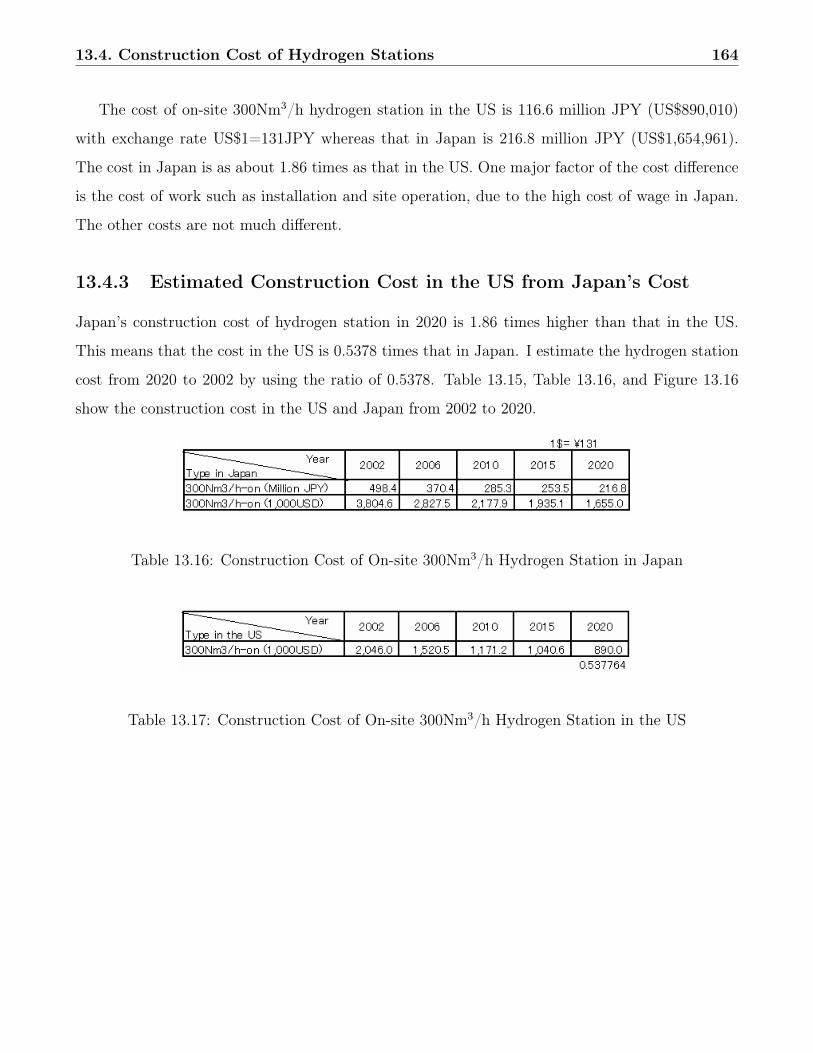
13.4. Construction Cost of Hydrogen Stations 164
The cost of on-site 300Nm3/h hydrogen station in the US is 116.6 million JPY (US$890,010)
with exchange rate US$1=131JPY whereas that in Japan is 216.8 million JPY (US$1,654,961).
The cost in Japan is as about 1.86 times as that in the US. One major factor of the cost difference
is the cost of work such as installation and site operation, due to the high cost of wage in Japan.
The other costs are not much different.
13.4.3 Estimated Construction Cost in the US from Japan’s Cost
Japan’s construction cost of hydrogen station in 2020 is 1.86 times higher than that in the US.
This means that the cost in the US is 0.5378 times that in Japan. I estimate the hydrogen station
cost from 2020 to 2002 by using the ratio of 0.5378. Table 13.15, Table 13.16, and Figure 13.16
show the construction cost in the US and Japan from 2002 to 2020.
Table 13.16: Construction Cost of On-site 300Nm3/h Hydrogen Station in Japan
Table 13.17: Construction Cost of On-site 300Nm3/h Hydrogen Station in the US
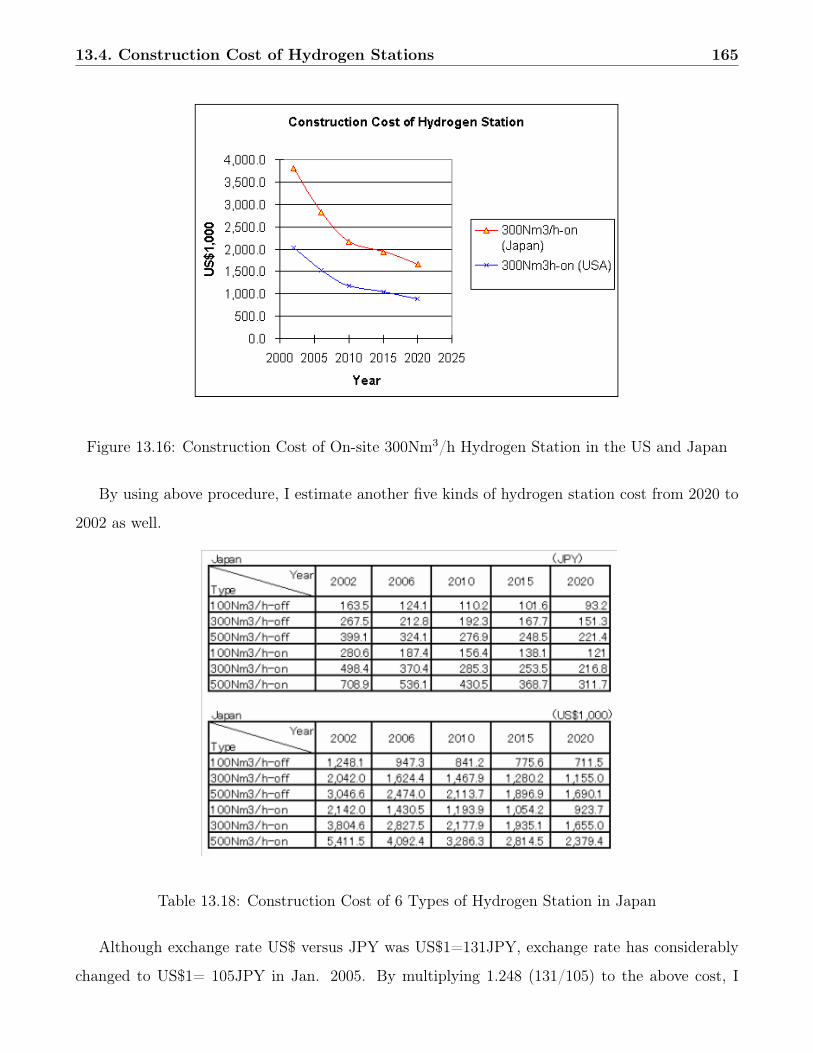
13.4. Construction Cost of Hydrogen Stations 165
Figure 13.16: Construction Cost of On-site 300Nm3/h Hydrogen Station in the US and Japan
By using above procedure, I estimate another five kinds of hydrogen station cost from 2020 to
2002 as well.
Table 13.18: Construction Cost of 6 Types of Hydrogen Station in Japan
Although exchange rate US$ versus JPY was US$1=131JPY, exchange rate has considerably
changed to US$1= 105JPY in Jan. 2005. By multiplying 1.248 (131/105) to the above cost, I
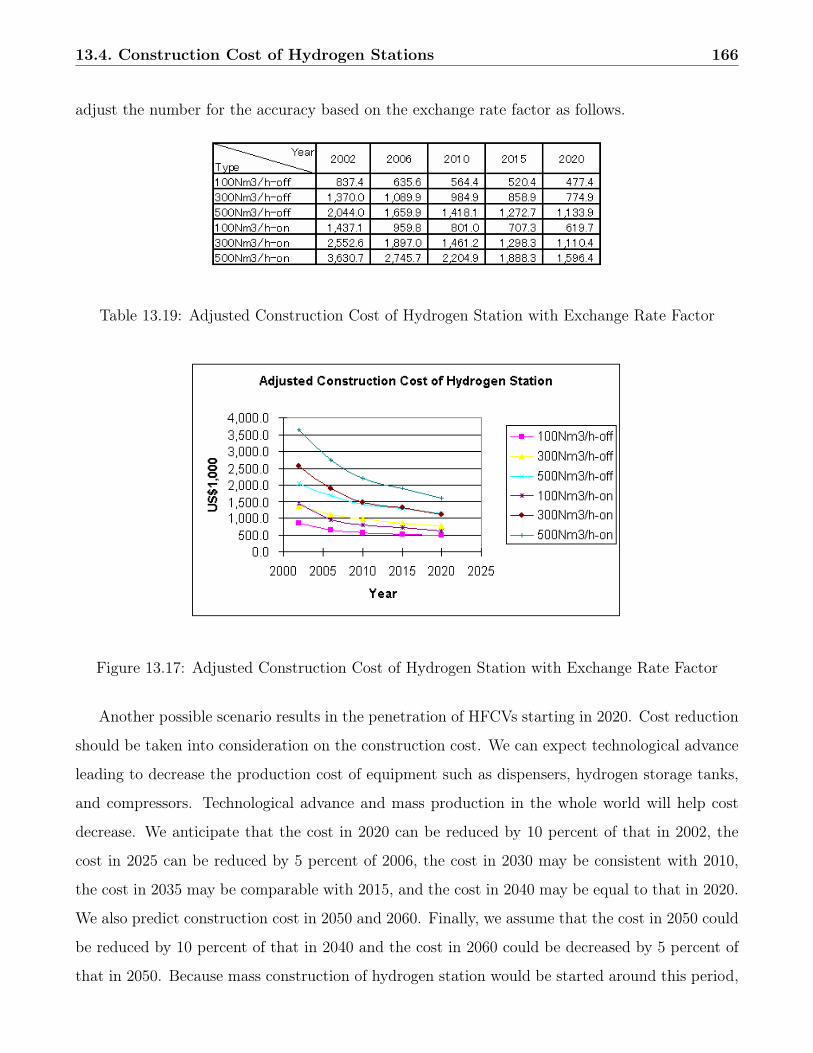
13.4. Construction Cost of Hydrogen Stations 166
adjust the number for the accuracy based on the exchange rate factor as follows.
Table 13.19: Adjusted Construction Cost of Hydrogen Station with Exchange Rate Factor
Figure 13.17: Adjusted Construction Cost of Hydrogen Station with Exchange Rate Factor
Another possible scenario results in the penetration of HFCVs starting in 2020. Cost reduction
should be taken into consideration on the construction cost. We can expect technological advance
leading to decrease the production cost of equipment such as dispensers, hydrogen storage tanks,
and compressors. Technological advance and mass production in the whole world will help cost
decrease. We anticipate that the cost in 2020 can be reduced by 10 percent of that in 2002, the
cost in 2025 can be reduced by 5 percent of 2006, the cost in 2030 may be consistent with 2010,
the cost in 2035 may be comparable with 2015, and the cost in 2040 may be equal to that in 2020.
We also predict construction cost in 2050 and 2060. Finally, we assume that the cost in 2050 could
be reduced by 10 percent of that in 2040 and the cost in 2060 could be decreased by 5 percent of
that in 2050. Because mass construction of hydrogen station would be started around this period,
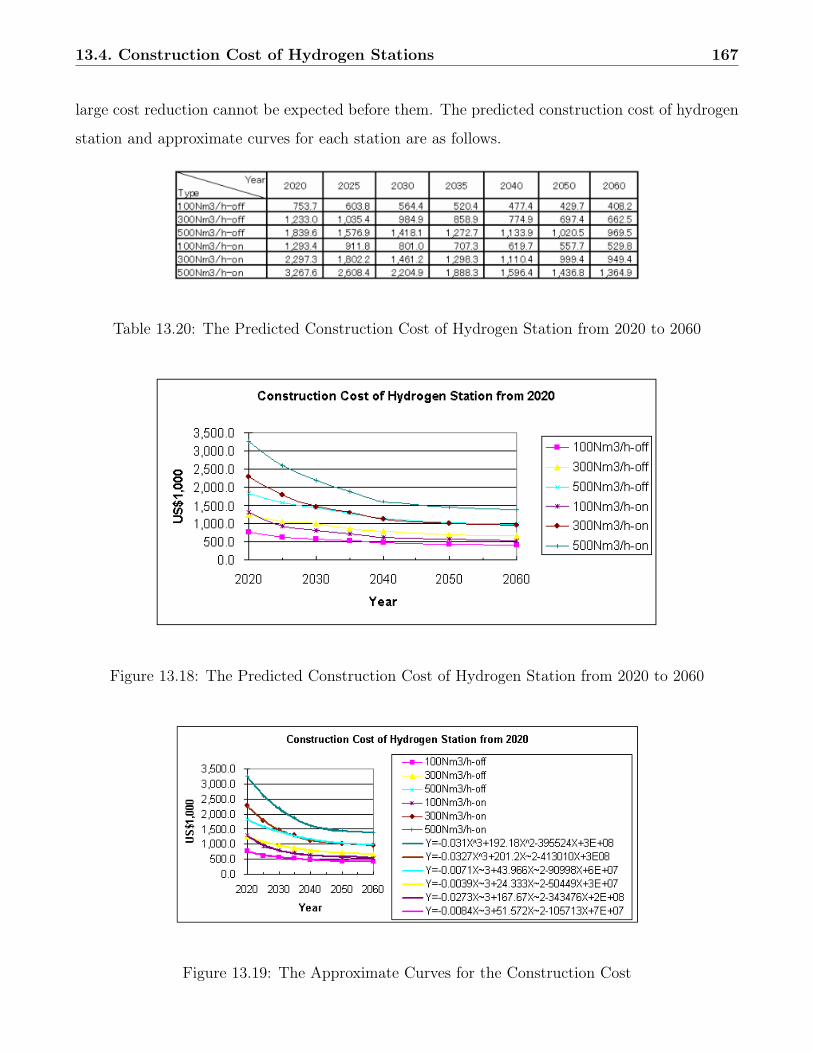
13.4. Construction Cost of Hydrogen Stations 167
large cost reduction cannot be expected before them. The predicted construction cost of hydrogen
station and approximate curves for each station are as follows.
Table 13.20: The Predicted Construction Cost of Hydrogen Station from 2020 to 2060
Figure 13.18: The Predicted Construction Cost of Hydrogen Station from 2020 to 2060
Figure 13.19: The Approximate Curves for the Construction Cost
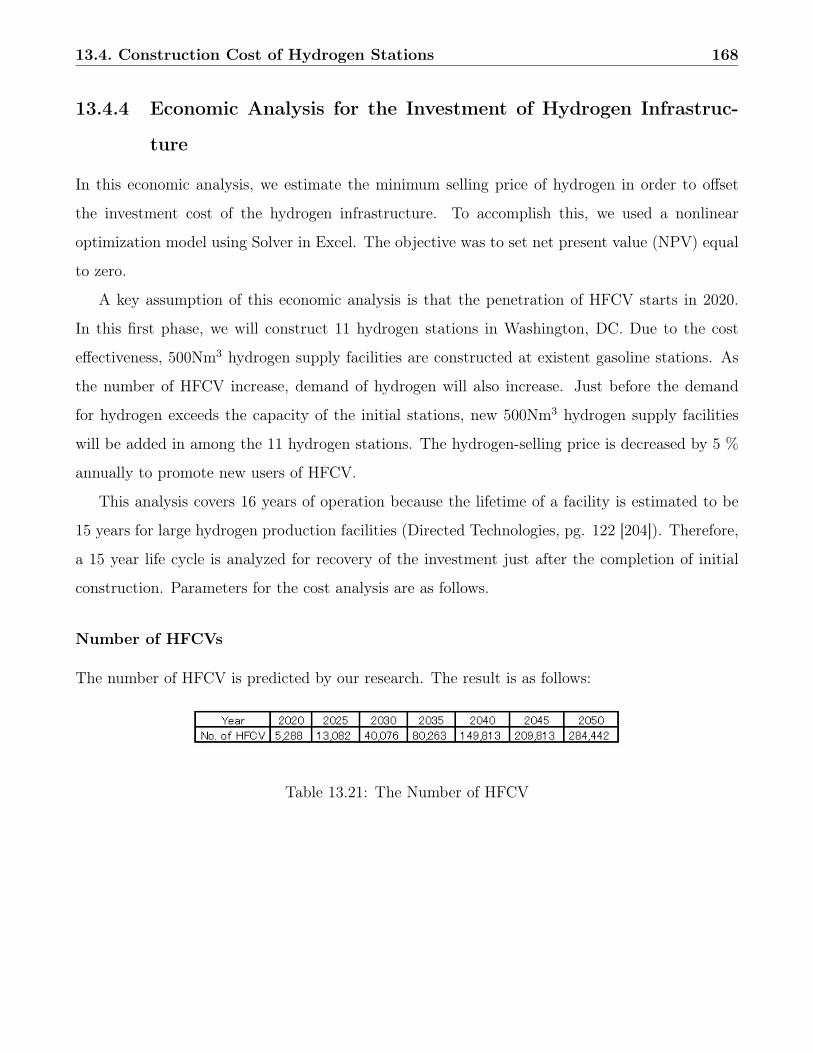
13.4. Construction Cost of Hydrogen Stations 168
13.4.4 Economic Analysis for the Investment of Hydrogen Infrastruc-
ture
In this economic analysis, we estimate the minimum selling price of hydrogen in order to offset
the investment cost of the hydrogen infrastructure. To accomplish this, we used a nonlinear
optimization model using Solver in Excel. The objective was to set net present value (NPV) equal
to zero.
A key assumption of this economic analysis is that the penetration of HFCV starts in 2020.
In this first phase, we will construct 11 hydrogen stations in Washington, DC. Due to the cost
effectiveness, 500Nm3 hydrogen supply facilities are constructed at existent gasoline stations. As
the number of HFCV increase, demand of hydrogen will also increase. Just before the demand
for hydrogen exceeds the capacity of the initial stations, new 500Nm3 hydrogen supply facilities
will be added in among the 11 hydrogen stations. The hydrogen-selling price is decreased by 5 %
annually to promote new users of HFCV.
This analysis covers 16 years of operation because the lifetime of a facility is estimated to be
15 years for large hydrogen production facilities (Directed Technologies, pg. 122 [204]). Therefore,
a 15 year life cycle is analyzed for recovery of the investment just after the completion of initial
construction. Parameters for the cost analysis are as follows.
Number of HFCVs
The number of HFCV is predicted by our research. The result is as follows:
Table 13.21: The Number of HFCV
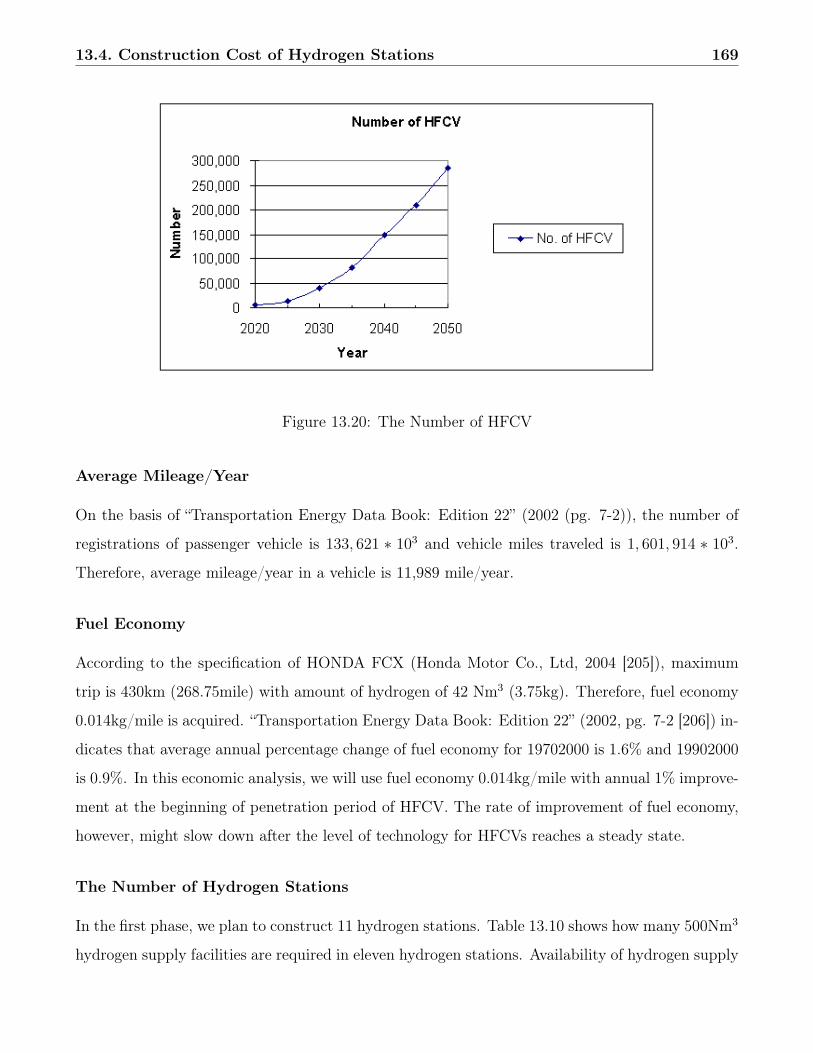
13.4. Construction Cost of Hydrogen Stations 169
Figure 13.20: The Number of HFCV
Average Mileage/Year
On the basis of “Transportation Energy Data Book: Edition 22” (2002 (pg. 7-2)), the number of
registrations of passenger vehicle is 133, 621 ∗ 103 and vehicle miles traveled is 1, 601, 914 ∗ 103.
Therefore, average mileage/year in a vehicle is 11,989 mile/year.
Fuel Economy
According to the specification of HONDA FCX (Honda Motor Co., Ltd, 2004 [205]), maximum
trip is 430km (268.75mile) with amount of hydrogen of 42 Nm3 (3.75kg). Therefore, fuel economy
0.014kg/mile is acquired. “Transportation Energy Data Book: Edition 22” (2002, pg. 7-2 [206]) in-
dicates that average annual percentage change of fuel economy for 19702000 is 1.6% and 19902000
is 0.9%. In this economic analysis, we will use fuel economy 0.014kg/mile with annual 1% improve-
ment at the beginning of penetration period of HFCV. The rate of improvement of fuel economy,
however, might slow down after the level of technology for HFCVs reaches a steady state.
The Number of Hydrogen Stations
In the first phase, we plan to construct 11 hydrogen stations. Table 13.10 shows how many 500Nm3
hydrogen supply facilities are required in eleven hydrogen stations. Availability of hydrogen supply
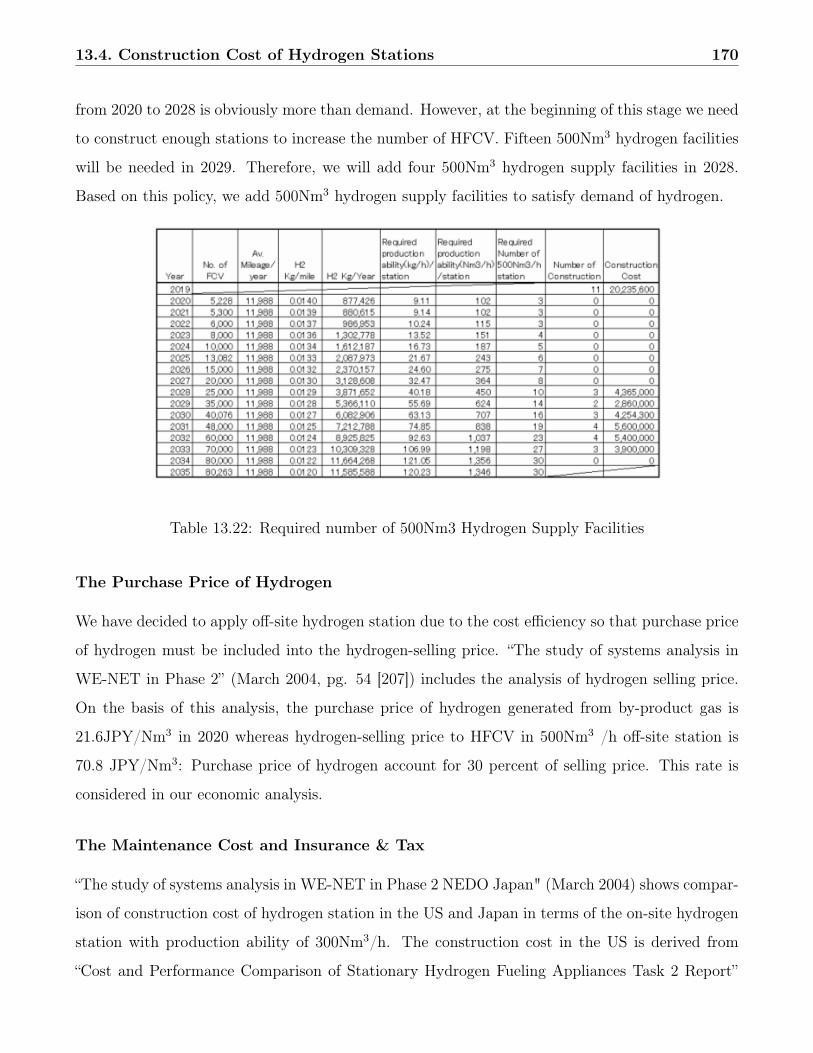
13.4. Construction Cost of Hydrogen Stations 170
from 2020 to 2028 is obviously more than demand. However, at the beginning of this stage we need
to construct enough stations to increase the number of HFCV. Fifteen 500Nm3 hydrogen facilities
will be needed in 2029. Therefore, we will add four 500Nm3 hydrogen supply facilities in 2028.
Based on this policy, we add 500Nm3 hydrogen supply facilities to satisfy demand of hydrogen.
Table 13.22: Required number of 500Nm3 Hydrogen Supply Facilities
The Purchase Price of Hydrogen
We have decided to apply off-site hydrogen station due to the cost efficiency so that purchase price
of hydrogen must be included into the hydrogen-selling price. “The study of systems analysis in
WE-NET in Phase 2” (March 2004, pg. 54 [207]) includes the analysis of hydrogen selling price.
On the basis of this analysis, the purchase price of hydrogen generated from by-product gas is
21.6JPY/Nm3 in 2020 whereas hydrogen-selling price to HFCV in 500Nm3 /h off-site station is
70.8 JPY/Nm3: Purchase price of hydrogen account for 30 percent of selling price. This rate is
considered in our economic analysis.
The Maintenance Cost and Insurance & Tax
“The study of systems analysis in WE-NET in Phase 2 NEDO Japan" (March 2004) shows compar-
ison of construction cost of hydrogen station in the US and Japan in terms of the on-site hydrogen
station with production ability of 300Nm3/h. The construction cost in the US is derived from
“Cost and Performance Comparison of Stationary Hydrogen Fueling Appliances Task 2 Report”
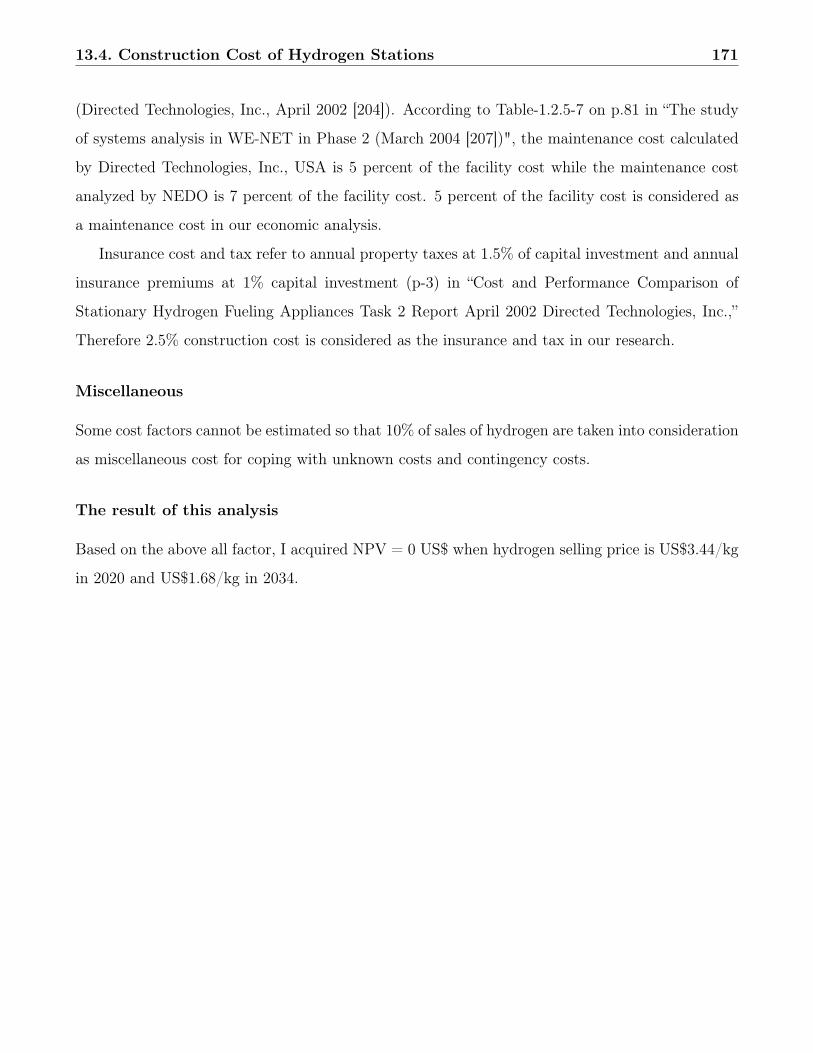
13.4. Construction Cost of Hydrogen Stations 171
(Directed Technologies, Inc., April 2002 [204]). According to Table-1.2.5-7 on p.81 in “The study
of systems analysis in WE-NET in Phase 2 (March 2004 [207])", the maintenance cost calculated
by Directed Technologies, Inc., USA is 5 percent of the facility cost while the maintenance cost
analyzed by NEDO is 7 percent of the facility cost. 5 percent of the facility cost is considered as
a maintenance cost in our economic analysis.
Insurance cost and tax refer to annual property taxes at 1.5% of capital investment and annual
insurance premiums at 1% capital investment (p-3) in “Cost and Performance Comparison of
Stationary Hydrogen Fueling Appliances Task 2 Report April 2002 Directed Technologies, Inc.,”
Therefore 2.5% construction cost is considered as the insurance and tax in our research.
Miscellaneous
Some cost factors cannot be estimated so that 10% of sales of hydrogen are taken into consideration
as miscellaneous cost for coping with unknown costs and contingency costs.
The result of this analysis
Based on the above all factor, I acquired NPV = 0 US$ when hydrogen selling price is US$3.44/kg
in 2020 and US$1.68/kg in 2034.
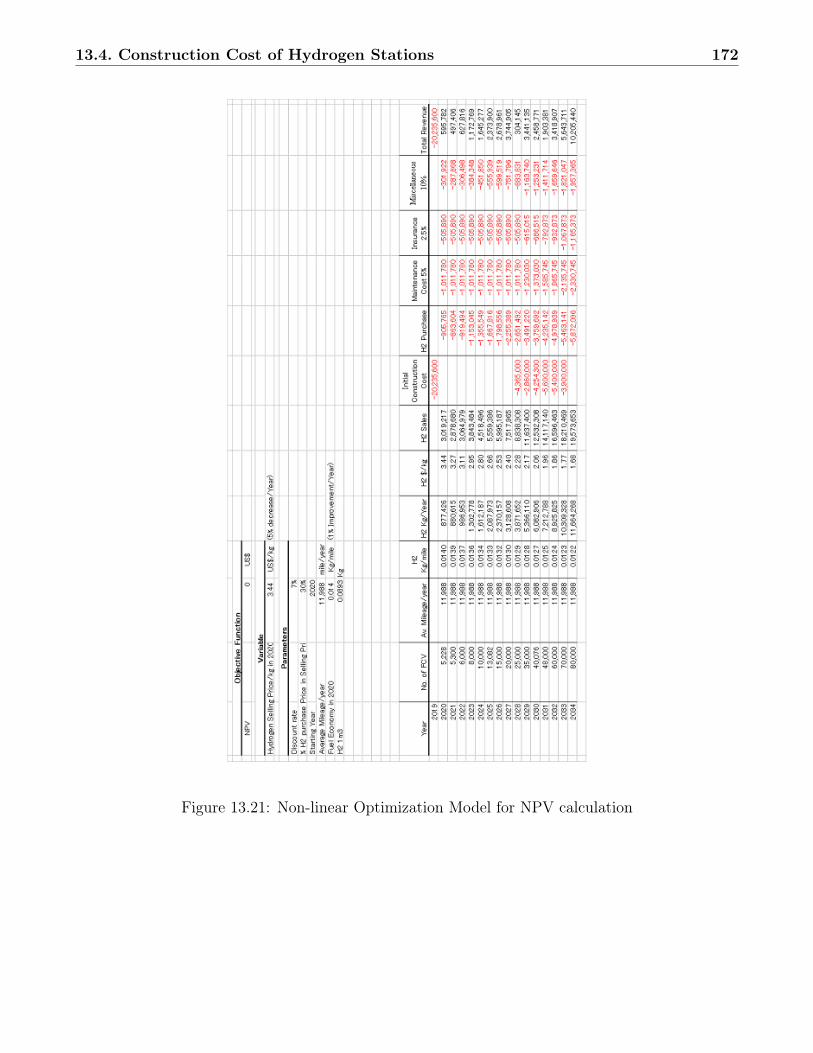
13.4. Construction Cost of Hydrogen Stations 172
Figure 13.21: Non-linear Optimization Model for NPV calculation
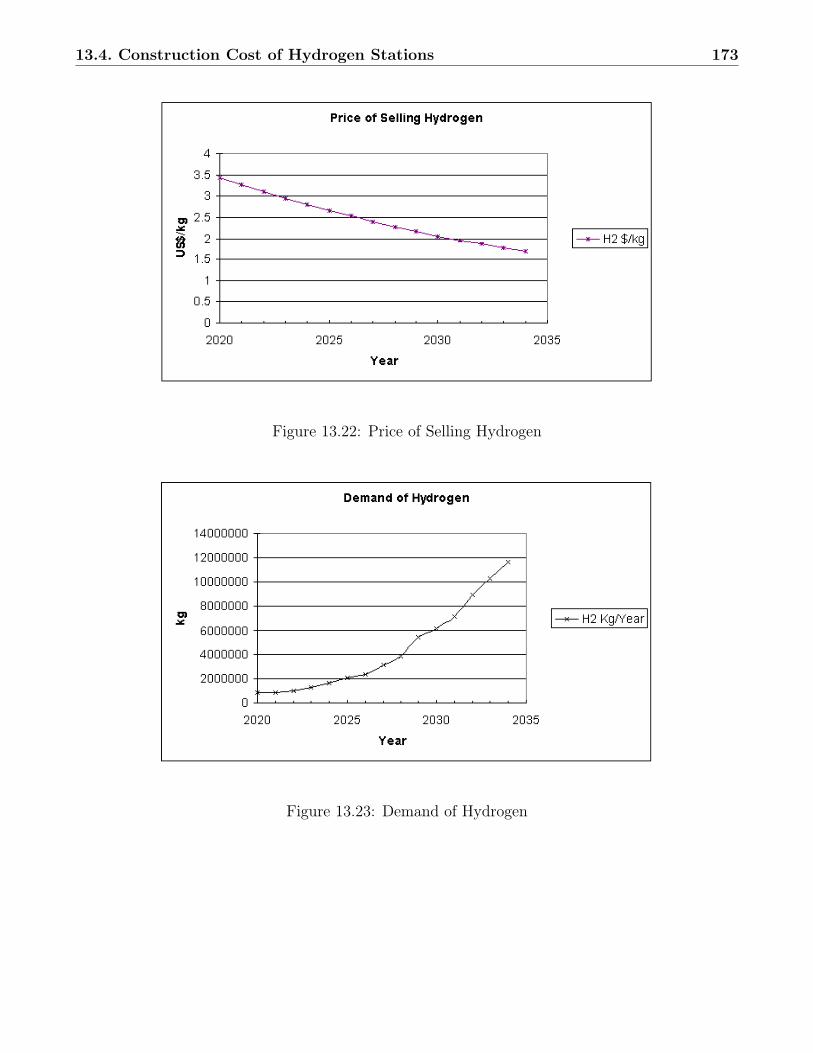
13.4. Construction Cost of Hydrogen Stations 173
Figure 13.22: Price of Selling Hydrogen
Figure 13.23: Demand of Hydrogen
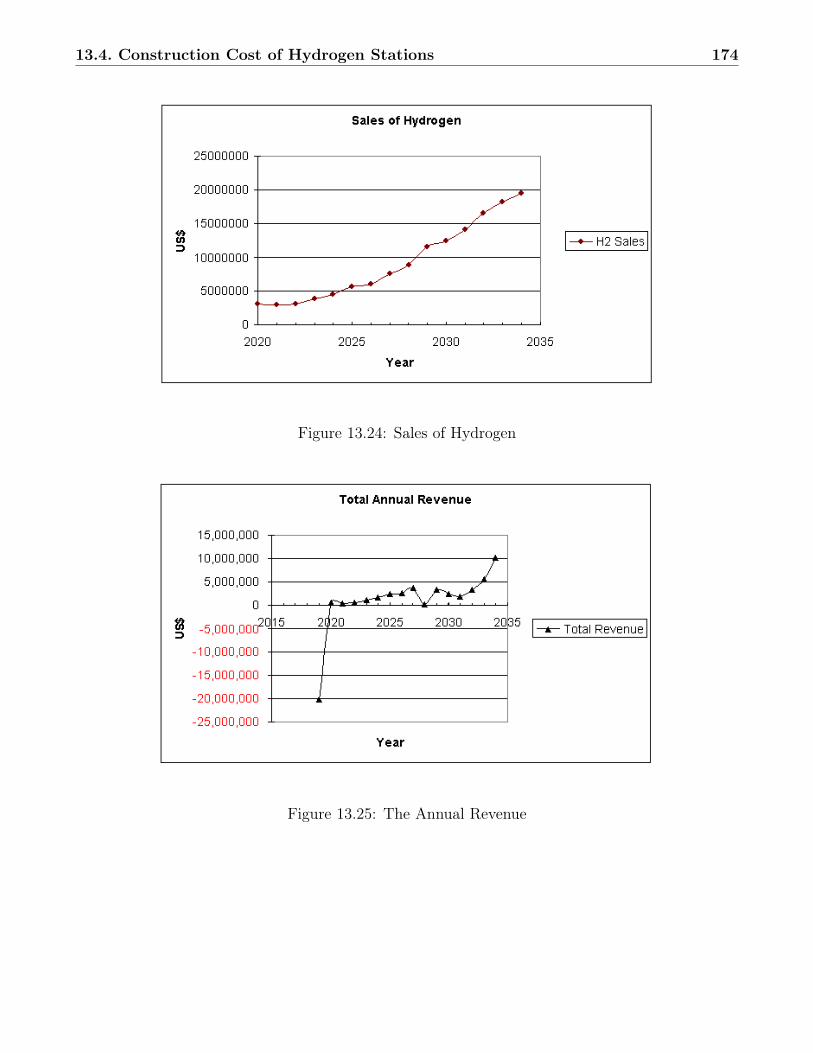
13.4. Construction Cost of Hydrogen Stations 174
Figure 13.24: Sales of Hydrogen
Figure 13.25: The Annual Revenue
Chapter 14
Design of Network
14.1 Design of Network
14.1.1 Sufficient Number for Initial Stage
According to Melaina (2003) [208], the criteria of the initial hydrogen stations are as follows:
• Located in close proximity to higher traffic volumes.
• Located in high profile areas to increase public awareness.
• Accessible to potential first FCV buyers.
• Located to provide fuel to vehicles during long distance trips.
The research also provides 3 approaches for estimating a sufficient number of early hydrogen
stations.
Approach 1, Percentage of existing stations
Transforming a certain percent of existing gasoline stations into hydrogen stations is suggested
because of customer expectation, habit and affinity. The research suggested 5% for the initial first
stage for metropolitan stations to provide an alternative fuel penetration and 15% of all stations
for the second stage. However, we will focus on the stations managed by major oil companies since
they are more likely to support the conversion to hydrogen. Since we are looking at the Greater
175
14.1. Design of Network 176
DC area as a whole, we will not distinguish between metropolitan and urban areas. Thus, we
divide the initial stage into two phases with approximate 10% and 20% of stations for a gradual
penetration. This corroborates the research cited earlier in this report by Sperling (1987) [199]
that 10-15% of the existing network would be necessary to begin significant market penetration.
Approach 2, Metropolitan land area
Assigning a certain amount of metropolitan land area to the hydrogen stations in the beginning
is an analytical measure to check if the number is sufficient for a metropolitan area. However,
since we already have good estimates for how many stations we need, and we felt this method
had limited value. It seemed to be a method with very little value other than providing a general
estimate, and its general benefit was implicitly included in our own algorithm.
Approach 3, Principal arterial roads
It is a good idea to identify the major urban arterials since they are part of a structured urban
network. As Marc Melaina mentioned in this approach, most urban residents do a significant
amount of routine driving on major arterial roads. This means that the locations related to arterial
roads account for a significant volume of vehicle miles traveled. Furthermore, in this project we
take major interstate roads into consideration due to a large amount of commuters from Virginia
and Maryland.
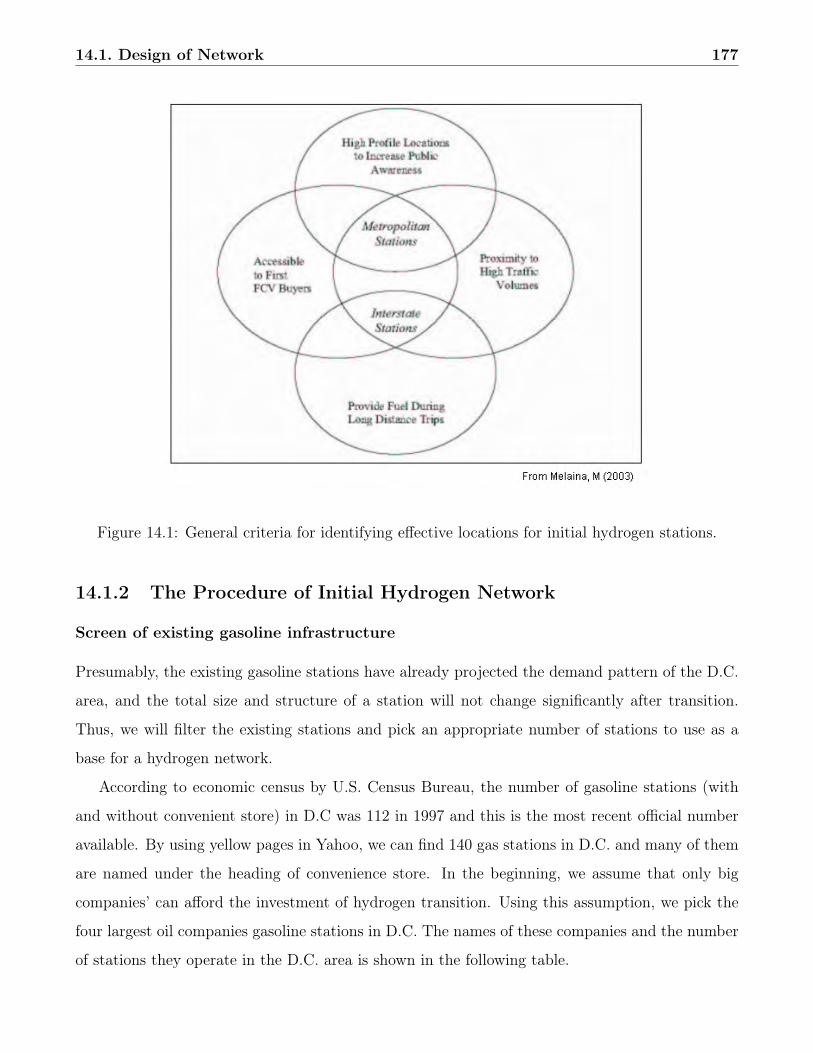
14.1. Design of Network 177
Figure 14.1: General criteria for identifying effective locations for initial hydrogen stations.
14.1.2 The Procedure of Initial Hydrogen Network
Screen of existing gasoline infrastructure
Presumably, the existing gasoline stations have already projected the demand pattern of the D.C.
area, and the total size and structure of a station will not change significantly after transition.
Thus, we will filter the existing stations and pick an appropriate number of stations to use as a
base for a hydrogen network.
According to economic census by U.S. Census Bureau, the number of gasoline stations (with
and without convenient store) in D.C was 112 in 1997 and this is the most recent official number
available. By using yellow pages in Yahoo, we can find 140 gas stations in D.C. and many of them
are named under the heading of convenience store. In the beginning, we assume that only big
companies’ can afford the investment of hydrogen transition. Using this assumption, we pick the
four largest oil companies gasoline stations in D.C. The names of these companies and the number
of stations they operate in the D.C. area is shown in the following table.
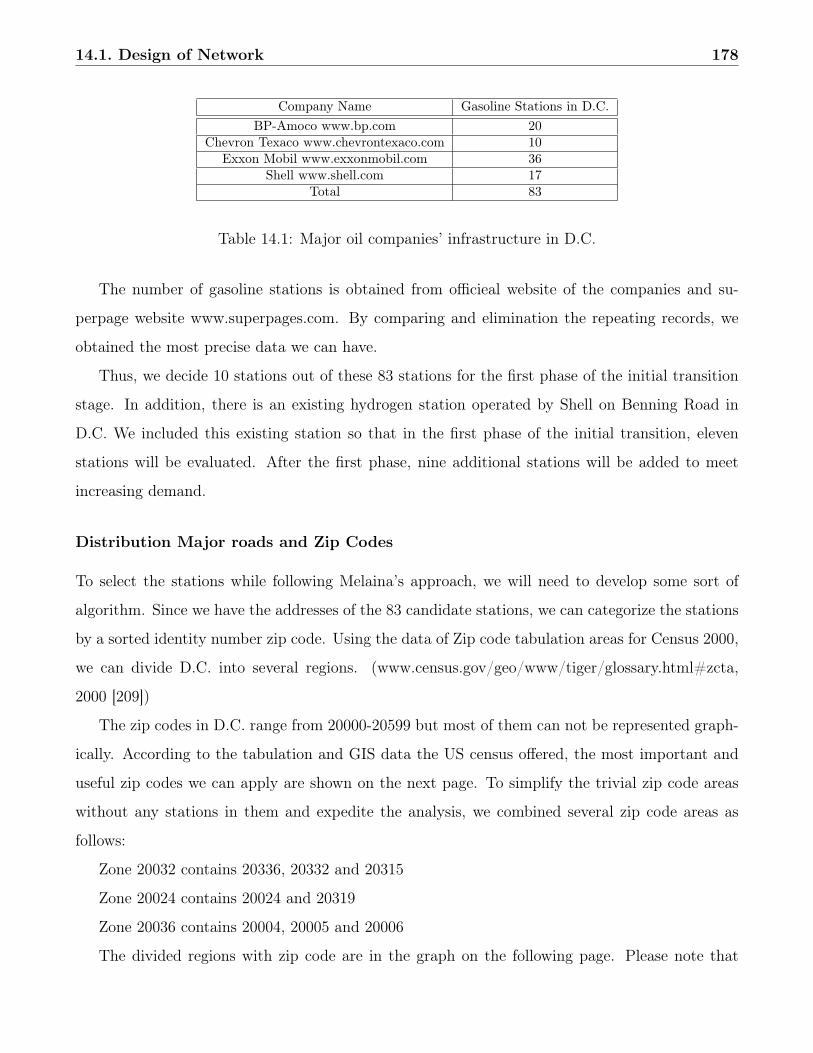
14.1. Design of Network 178
Company Name Gasoline Stations in D.C.BP-Amoco www.bp.com 20
Chevron Texaco www.chevrontexaco.com 10Exxon Mobil www.exxonmobil.com 36
Shell www.shell.com 17Total 83
Table 14.1: Major oil companies’ infrastructure in D.C.
The number of gasoline stations is obtained from officieal website of the companies and su-
perpage website www.superpages.com. By comparing and elimination the repeating records, we
obtained the most precise data we can have.
Thus, we decide 10 stations out of these 83 stations for the first phase of the initial transition
stage. In addition, there is an existing hydrogen station operated by Shell on Benning Road in
D.C. We included this existing station so that in the first phase of the initial transition, eleven
stations will be evaluated. After the first phase, nine additional stations will be added to meet
increasing demand.
Distribution Major roads and Zip Codes
To select the stations while following Melaina’s approach, we will need to develop some sort of
algorithm. Since we have the addresses of the 83 candidate stations, we can categorize the stations
by a sorted identity number zip code. Using the data of Zip code tabulation areas for Census 2000,
we can divide D.C. into several regions. (www.census.gov/geo/www/tiger/glossary.html#zcta,
2000 [209])
The zip codes in D.C. range from 20000-20599 but most of them can not be represented graph-
ically. According to the tabulation and GIS data the US census offered, the most important and
useful zip codes we can apply are shown on the next page. To simplify the trivial zip code areas
without any stations in them and expedite the analysis, we combined several zip code areas as
follows:
Zone 20032 contains 20336, 20332 and 20315
Zone 20024 contains 20024 and 20319
Zone 20036 contains 20004, 20005 and 20006
The divided regions with zip code are in the graph on the following page. Please note that
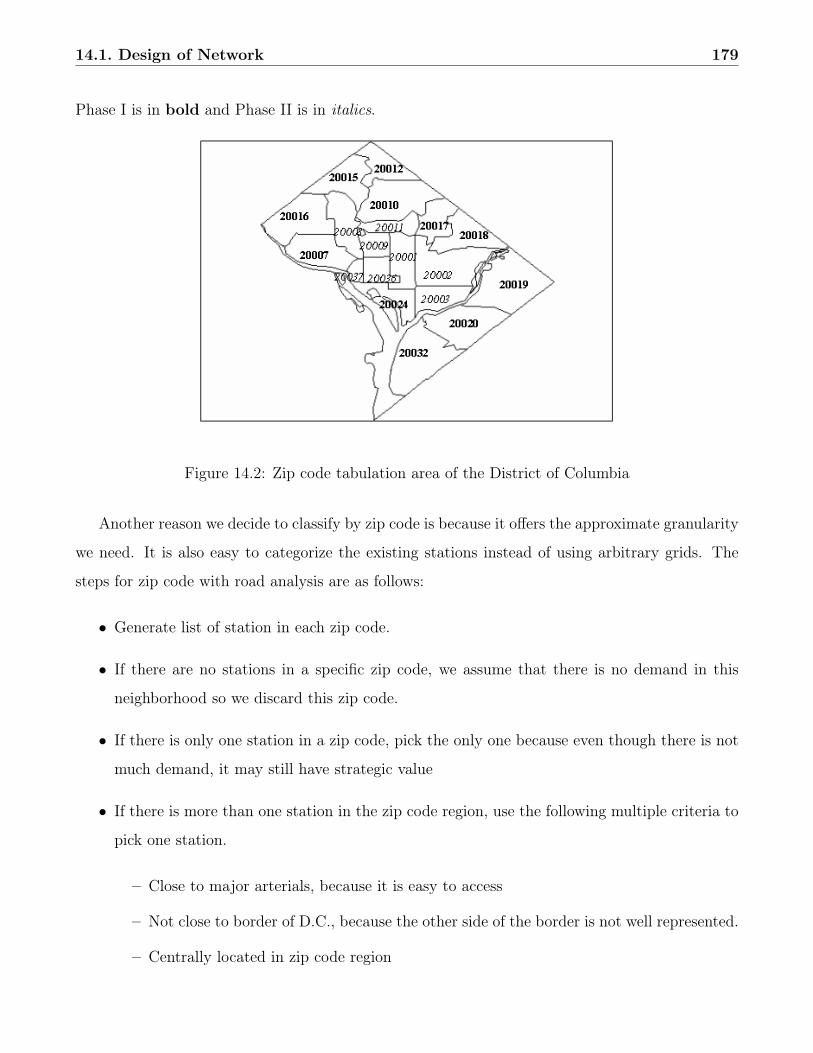
14.1. Design of Network 179
Phase I is in bold and Phase II is in italics.
Figure 14.2: Zip code tabulation area of the District of Columbia
Another reason we decide to classify by zip code is because it offers the approximate granularity
we need. It is also easy to categorize the existing stations instead of using arbitrary grids. The
steps for zip code with road analysis are as follows:
• Generate list of station in each zip code.
• If there are no stations in a specific zip code, we assume that there is no demand in this
neighborhood so we discard this zip code.
• If there is only one station in a zip code, pick the only one because even though there is not
much demand, it may still have strategic value
• If there is more than one station in the zip code region, use the following multiple criteria to
pick one station.
– Close to major arterials, because it is easy to access
– Not close to border of D.C., because the other side of the border is not well represented.
– Centrally located in zip code region
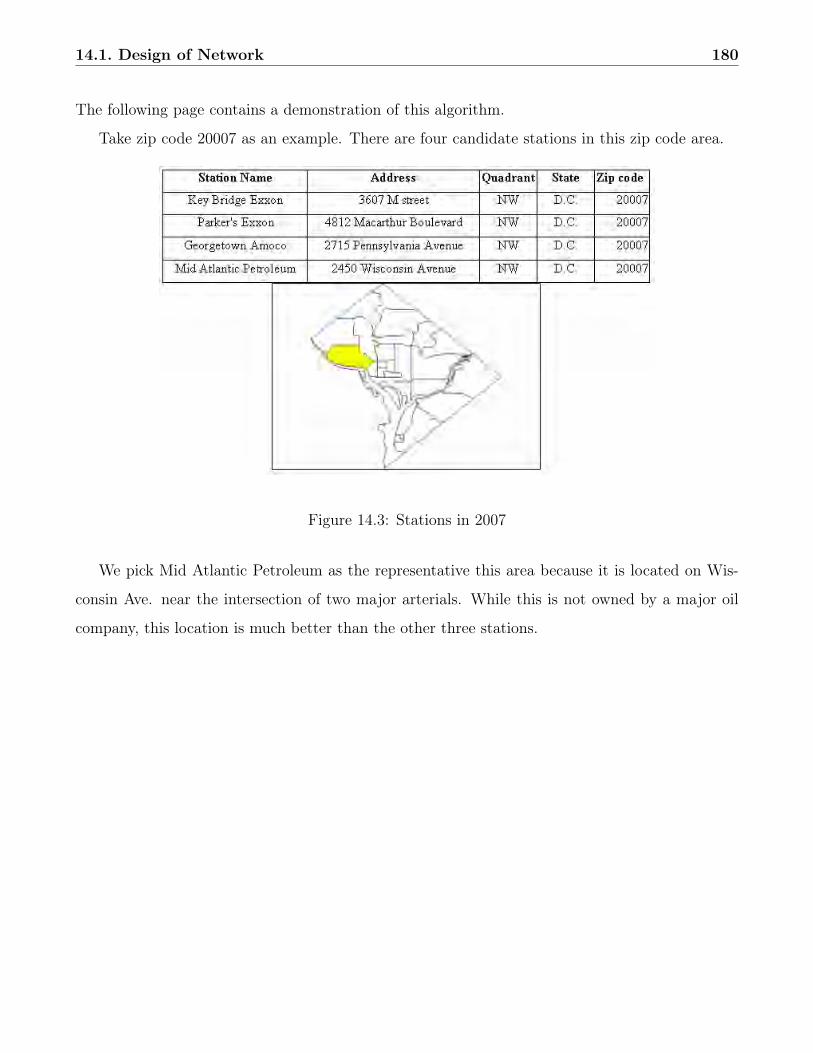
14.1. Design of Network 180
The following page contains a demonstration of this algorithm.
Take zip code 20007 as an example. There are four candidate stations in this zip code area.
Figure 14.3: Stations in 2007
We pick Mid Atlantic Petroleum as the representative this area because it is located on Wis-
consin Ave. near the intersection of two major arterials. While this is not owned by a major oil
company, this location is much better than the other three stations.

14.1. Design of Network 181
Figure 14.4: Mid Atlantic Petroleum on Wisconsin Avenue
Following this procedure, 11 primary choices were selected, with 9 secondary choices. These
two sets make up the first and second phases of our project, respectively. The stations are listed
in the table that appears in Section 14.1.3. Also, detailed maps of the location of each station can
be found in the Appendix.
Decision to avoid downtown area
The downtown D.C. area is mostly occupied by government agencies and bureaus. Furthermore,
high security landmarks and monuments like the White House are in this area. Even though
hydrogen technology is proven stable, this alone may not be convincing enough to locate hydrogen
stations in these high security areas. In addition, most areas in this central D.C. area are not
zoned for refueling stations, leaving few options.
Another reason to set the stations away from downtown is because of the impact on traffic.
Setting hydrogen stations in the downtown area will make it harder for drivers to refuel their cars,
especially in a congested area. According to the research mentioned before, drivers tend to refuel
near their house rather than their work place. Thus, it is reasonable to set the initial stations
away from downtown and more towards the suburbs where commuters reside. Moreover, if we
apply off-site hydrogen stations, the refueling fleets for stations will have difficulty reaching them,
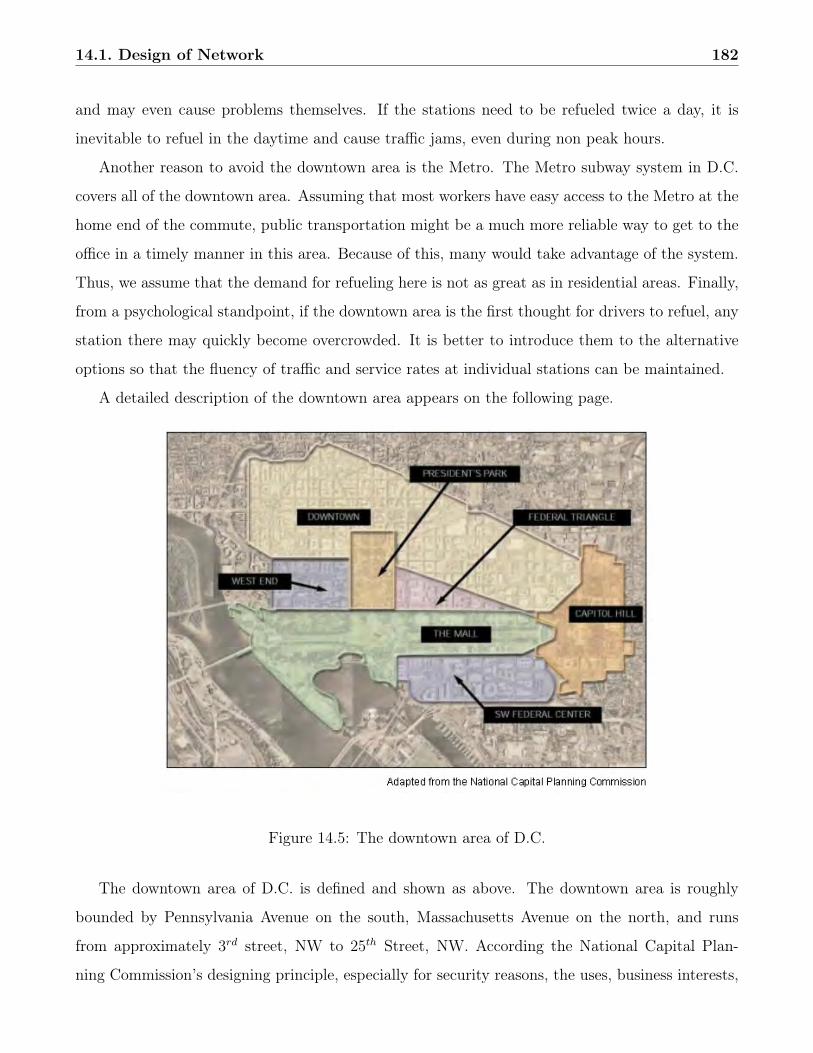
14.1. Design of Network 182
and may even cause problems themselves. If the stations need to be refueled twice a day, it is
inevitable to refuel in the daytime and cause traffic jams, even during non peak hours.
Another reason to avoid the downtown area is the Metro. The Metro subway system in D.C.
covers all of the downtown area. Assuming that most workers have easy access to the Metro at the
home end of the commute, public transportation might be a much more reliable way to get to the
office in a timely manner in this area. Because of this, many would take advantage of the system.
Thus, we assume that the demand for refueling here is not as great as in residential areas. Finally,
from a psychological standpoint, if the downtown area is the first thought for drivers to refuel, any
station there may quickly become overcrowded. It is better to introduce them to the alternative
options so that the fluency of traffic and service rates at individual stations can be maintained.
A detailed description of the downtown area appears on the following page.
Figure 14.5: The downtown area of D.C.
The downtown area of D.C. is defined and shown as above. The downtown area is roughly
bounded by Pennsylvania Avenue on the south, Massachusetts Avenue on the north, and runs
from approximately 3rd street, NW to 25th Street, NW. According the National Capital Plan-
ning Commission’s designing principle, especially for security reasons, the uses, business interests,
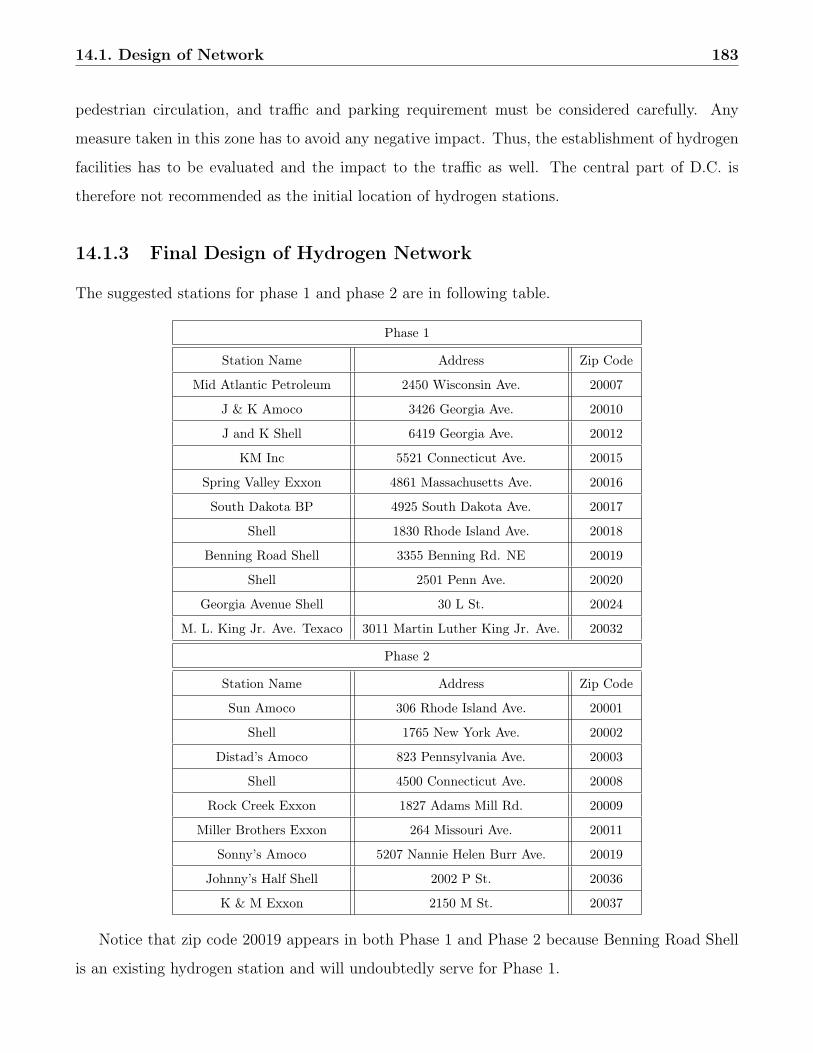
14.1. Design of Network 183
pedestrian circulation, and traffic and parking requirement must be considered carefully. Any
measure taken in this zone has to avoid any negative impact. Thus, the establishment of hydrogen
facilities has to be evaluated and the impact to the traffic as well. The central part of D.C. is
therefore not recommended as the initial location of hydrogen stations.
14.1.3 Final Design of Hydrogen Network
The suggested stations for phase 1 and phase 2 are in following table.
Phase 1
Station Name Address Zip Code
Mid Atlantic Petroleum 2450 Wisconsin Ave. 20007
J & K Amoco 3426 Georgia Ave. 20010
J and K Shell 6419 Georgia Ave. 20012
KM Inc 5521 Connecticut Ave. 20015
Spring Valley Exxon 4861 Massachusetts Ave. 20016
South Dakota BP 4925 South Dakota Ave. 20017
Shell 1830 Rhode Island Ave. 20018
Benning Road Shell 3355 Benning Rd. NE 20019
Shell 2501 Penn Ave. 20020
Georgia Avenue Shell 30 L St. 20024
M. L. King Jr. Ave. Texaco 3011 Martin Luther King Jr. Ave. 20032
Phase 2
Station Name Address Zip Code
Sun Amoco 306 Rhode Island Ave. 20001
Shell 1765 New York Ave. 20002
Distad’s Amoco 823 Pennsylvania Ave. 20003
Shell 4500 Connecticut Ave. 20008
Rock Creek Exxon 1827 Adams Mill Rd. 20009
Miller Brothers Exxon 264 Missouri Ave. 20011
Sonny’s Amoco 5207 Nannie Helen Burr Ave. 20019
Johnny’s Half Shell 2002 P St. 20036
K & M Exxon 2150 M St. 20037
Notice that zip code 20019 appears in both Phase 1 and Phase 2 because Benning Road Shell
is an existing hydrogen station and will undoubtedly serve for Phase 1.

14.1. Design of Network 184
14.1.4 Background on Implementation Decisions
The path of fuel transition from gasoline to hydrogen will affect the impact of the new technology.
For instance, if we decide to use a station as part of the beginning phase of the transition, there
are three ways to transform it from a traditional gasoline service station to an innovative pioneer.
We could either add a new hydrogen pump, convert an existing gasoline pump into a hydrogen
one, or expand the gasoline station to include a separate hydrogen facility.
Changing or adding one or several pumps in the gasoline stations we picked is a gradual and
more conservative method, especially for the stations not located in early-adapter communities.
This kind of transition is also similar to the diesel-gasoline transition because in the beginning of
that transition, the consumers could access two fuel sources. It can also avoid customer discon-
tent from the routine patronage if they have not changed their vehicles. Moreover, it may raise
the curiosity of those drivers that have not made the switch and decrease the unfamiliarity and
uncomfortable feelings.
Totally converting a traditional station into a new one might be a risky method. From the
market point of view, if the routine patronage and community were not previously notified, this
will cause not only complaints from people but also affect the growth and adaptation of potential
customers. However, the switching cost might be more economical if there is no significant drop
in facility expense. For a more detailed discussion of construction costs and the effect of multiple
station production, see Section 13.4, Construction Cost of Hydrogen Stations.
Expanding the existing structure is limited by not only the space available but also restricted
by the zoning regulation. As we mentioned before, zoning regulations determine the borders
and the purpose of each region so that the expansion of a current station may not be allowed if
extends beyond the zone border. Also, we should still need to take into consideration if there is
any discrepancy in the zoning code between traditional gasoline stations and hydrogen stations,
especially due to the legislation which is from public animosity.
From another viewpoint, the switch for the eleven stations we chose can be gradual or rapid.
Gradual transition means that we switch these eleven stations gradually. Assuming that the
duration for system switch is similar for each station, gradual transition will not allow the trans-
formation for any two of them begin at the same time. In other words, the overlap of the stations
reconstruction should not be long. For stations that are completely switched over to hydrogen,

14.1. Design of Network 185
this can reduce inconvenience at a certain level because even though customers could not get fuel
at the converted station, another station would still be available. As such, the impact felt by an
area such as D.C. could be alleviated.
A rapid transition, by contrast, means that the switch of these eleven stations will begin
at approximately the same time and would be complete all at once. In a small area, it will
definitely cause an impact because eleven gasoline stations would suddenly not be in service.
For the hydrogen transition in D.C. area, the impact might be less serious because these eleven
stations are distributed far enough apart that drivers still have another option to refuel. However,
the impact on traffic due to construction at so many crucial points of major roads or the heavy
load of short-term budget would be an issue.
An expansion transition also means that the initial location will not be limited to current
stations. In our project, we use the existing stations for the beginning stage because we consider
the validation in zoning, familiarity of the patronage and community, and the economical issues.
However, if these there criteria can be met, choosing a new location for a hydrogen station for the
first stage can be discussed further.

Chapter 15
Network Analysis
To analyze the DC network, we first needed to decide what performance measures we wanted to
use. Due to the limited amount of data available about a network that only exists on paper and
describes a future time, the best projections and estimates in conjunction with modeling techniques
had to be used to come up with these measures.
One performance measure is related to the chicken and egg problem previously discussed.
The underlying question is the seemingly contradictory problem of needing hydrogen refueling
stations on the road to support hydrogen cars, while simultaneously needing hydrogen cars to
justify building the refueling stations. While it is difficult to quantify this performance measure,
the consequences of a network that scores poorly on this measure are fairly obvious. If there are
too few stations, owners of hydrogen cars will become frustrated as they have to contort their
schedules to refuel in a sparse network or have to deal with long queues at the stations available.
In fact, research suggests that potential customers may simply opt out of buying hydrogen vehicles
if their impression is that the network is insufficient (Sperling & Kurani, 1987 [199]).
At the other extreme, a large and redundant network would make consumers very happy,
but would be difficult on those who are financing the development. Hydrogen fuel sellers would
be unwilling to sink the necessary funds into a network if they would not see some return on
investment fairly soon. In the event that the development is heavily subsidized by the government,
the taxpayer burden would be needlessly high if a large, inefficient network was built. The measure
can thus be defined as minimizing initial investment costs while maximizing the service level.
Moreover, service level is a difficult thing to define as well. From a transportation engineering
186
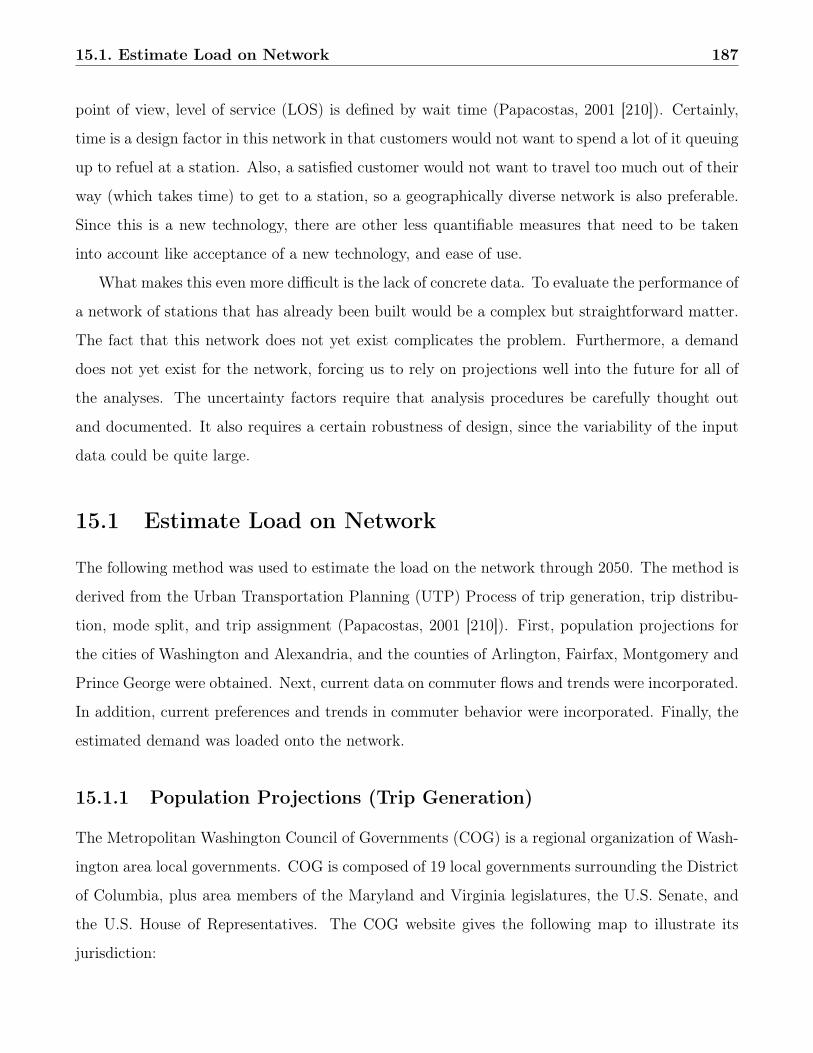
15.1. Estimate Load on Network 187
point of view, level of service (LOS) is defined by wait time (Papacostas, 2001 [210]). Certainly,
time is a design factor in this network in that customers would not want to spend a lot of it queuing
up to refuel at a station. Also, a satisfied customer would not want to travel too much out of their
way (which takes time) to get to a station, so a geographically diverse network is also preferable.
Since this is a new technology, there are other less quantifiable measures that need to be taken
into account like acceptance of a new technology, and ease of use.
What makes this even more difficult is the lack of concrete data. To evaluate the performance of
a network of stations that has already been built would be a complex but straightforward matter.
The fact that this network does not yet exist complicates the problem. Furthermore, a demand
does not yet exist for the network, forcing us to rely on projections well into the future for all of
the analyses. The uncertainty factors require that analysis procedures be carefully thought out
and documented. It also requires a certain robustness of design, since the variability of the input
data could be quite large.
15.1 Estimate Load on Network
The following method was used to estimate the load on the network through 2050. The method is
derived from the Urban Transportation Planning (UTP) Process of trip generation, trip distribu-
tion, mode split, and trip assignment (Papacostas, 2001 [210]). First, population projections for
the cities of Washington and Alexandria, and the counties of Arlington, Fairfax, Montgomery and
Prince George were obtained. Next, current data on commuter flows and trends were incorporated.
In addition, current preferences and trends in commuter behavior were incorporated. Finally, the
estimated demand was loaded onto the network.
15.1.1 Population Projections (Trip Generation)
The Metropolitan Washington Council of Governments (COG) is a regional organization of Wash-
ington area local governments. COG is composed of 19 local governments surrounding the District
of Columbia, plus area members of the Maryland and Virginia legislatures, the U.S. Senate, and
the U.S. House of Representatives. The COG website gives the following map to illustrate its
jurisdiction:
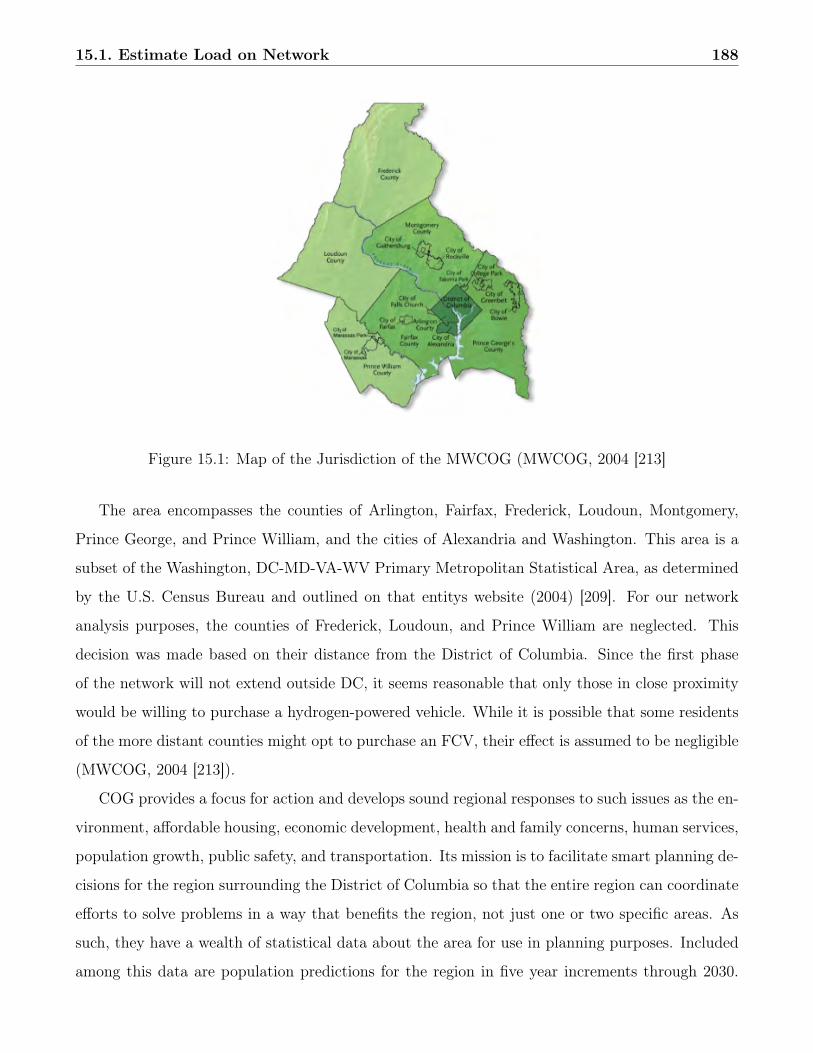
15.1. Estimate Load on Network 188
Figure 15.1: Map of the Jurisdiction of the MWCOG (MWCOG, 2004 [213]
The area encompasses the counties of Arlington, Fairfax, Frederick, Loudoun, Montgomery,
Prince George, and Prince William, and the cities of Alexandria and Washington. This area is a
subset of the Washington, DC-MD-VA-WV Primary Metropolitan Statistical Area, as determined
by the U.S. Census Bureau and outlined on that entitys website (2004) [209]. For our network
analysis purposes, the counties of Frederick, Loudoun, and Prince William are neglected. This
decision was made based on their distance from the District of Columbia. Since the first phase
of the network will not extend outside DC, it seems reasonable that only those in close proximity
would be willing to purchase a hydrogen-powered vehicle. While it is possible that some residents
of the more distant counties might opt to purchase an FCV, their effect is assumed to be negligible
(MWCOG, 2004 [213]).
COG provides a focus for action and develops sound regional responses to such issues as the en-
vironment, affordable housing, economic development, health and family concerns, human services,
population growth, public safety, and transportation. Its mission is to facilitate smart planning de-
cisions for the region surrounding the District of Columbia so that the entire region can coordinate
efforts to solve problems in a way that benefits the region, not just one or two specific areas. As
such, they have a wealth of statistical data about the area for use in planning purposes. Included
among this data are population predictions for the region in five year increments through 2030.
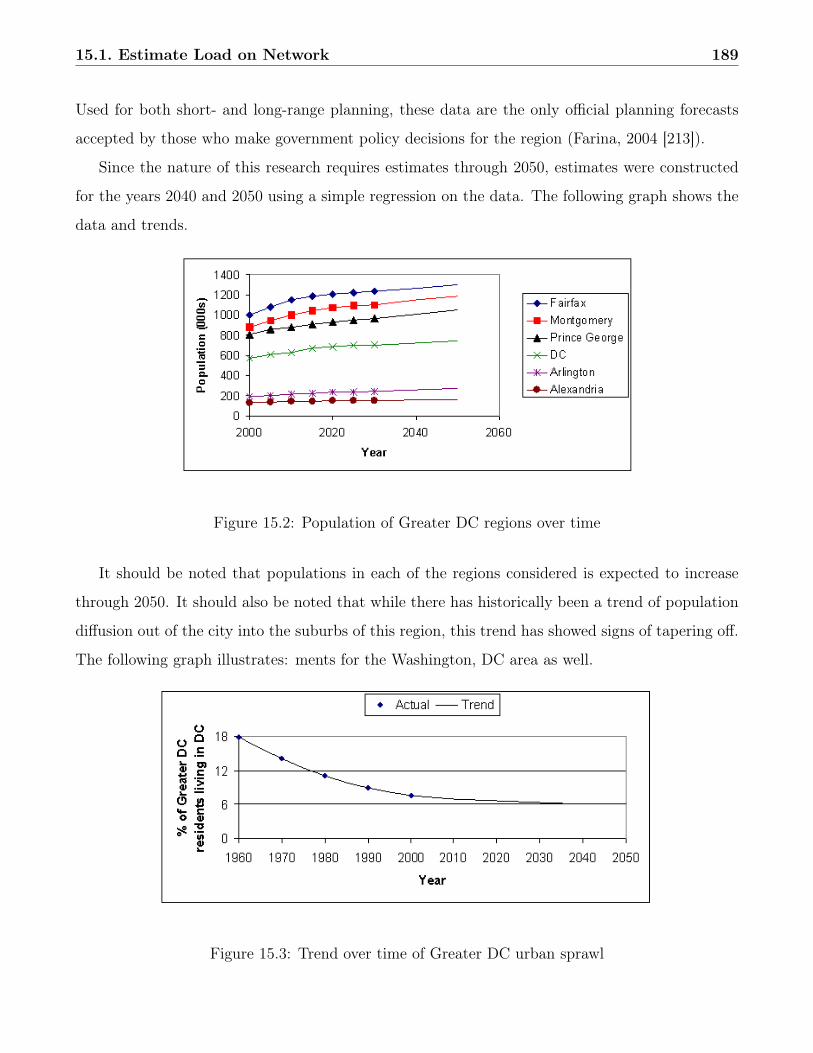
15.1. Estimate Load on Network 189
Used for both short- and long-range planning, these data are the only official planning forecasts
accepted by those who make government policy decisions for the region (Farina, 2004 [213]).
Since the nature of this research requires estimates through 2050, estimates were constructed
for the years 2040 and 2050 using a simple regression on the data. The following graph shows the
data and trends.
Figure 15.2: Population of Greater DC regions over time
It should be noted that populations in each of the regions considered is expected to increase
through 2050. It should also be noted that while there has historically been a trend of population
diffusion out of the city into the suburbs of this region, this trend has showed signs of tapering off.
The following graph illustrates: ments for the Washington, DC area as well.
Figure 15.3: Trend over time of Greater DC urban sprawl
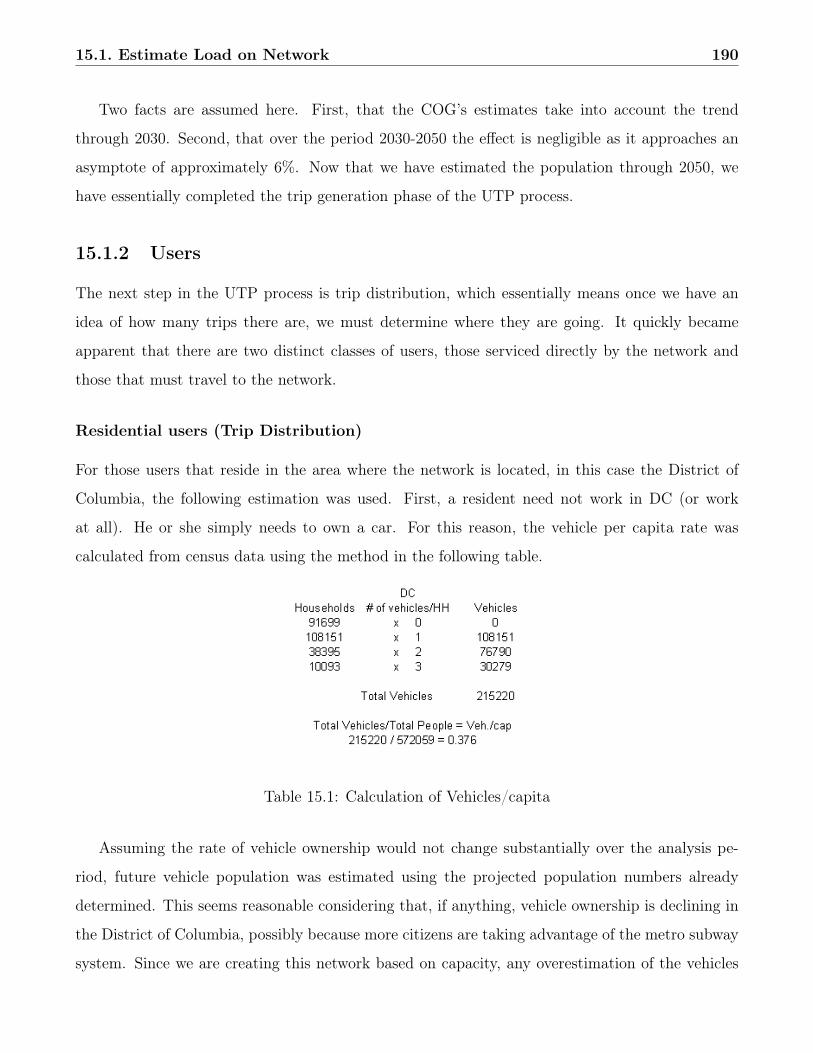
15.1. Estimate Load on Network 190
Two facts are assumed here. First, that the COG’s estimates take into account the trend
through 2030. Second, that over the period 2030-2050 the effect is negligible as it approaches an
asymptote of approximately 6%. Now that we have estimated the population through 2050, we
have essentially completed the trip generation phase of the UTP process.
15.1.2 Users
The next step in the UTP process is trip distribution, which essentially means once we have an
idea of how many trips there are, we must determine where they are going. It quickly became
apparent that there are two distinct classes of users, those serviced directly by the network and
those that must travel to the network.
Residential users (Trip Distribution)
For those users that reside in the area where the network is located, in this case the District of
Columbia, the following estimation was used. First, a resident need not work in DC (or work
at all). He or she simply needs to own a car. For this reason, the vehicle per capita rate was
calculated from census data using the method in the following table.
Table 15.1: Calculation of Vehicles/capita
Assuming the rate of vehicle ownership would not change substantially over the analysis pe-
riod, future vehicle population was estimated using the projected population numbers already
determined. This seems reasonable considering that, if anything, vehicle ownership is declining in
the District of Columbia, possibly because more citizens are taking advantage of the metro subway
system. Since we are creating this network based on capacity, any overestimation of the vehicles
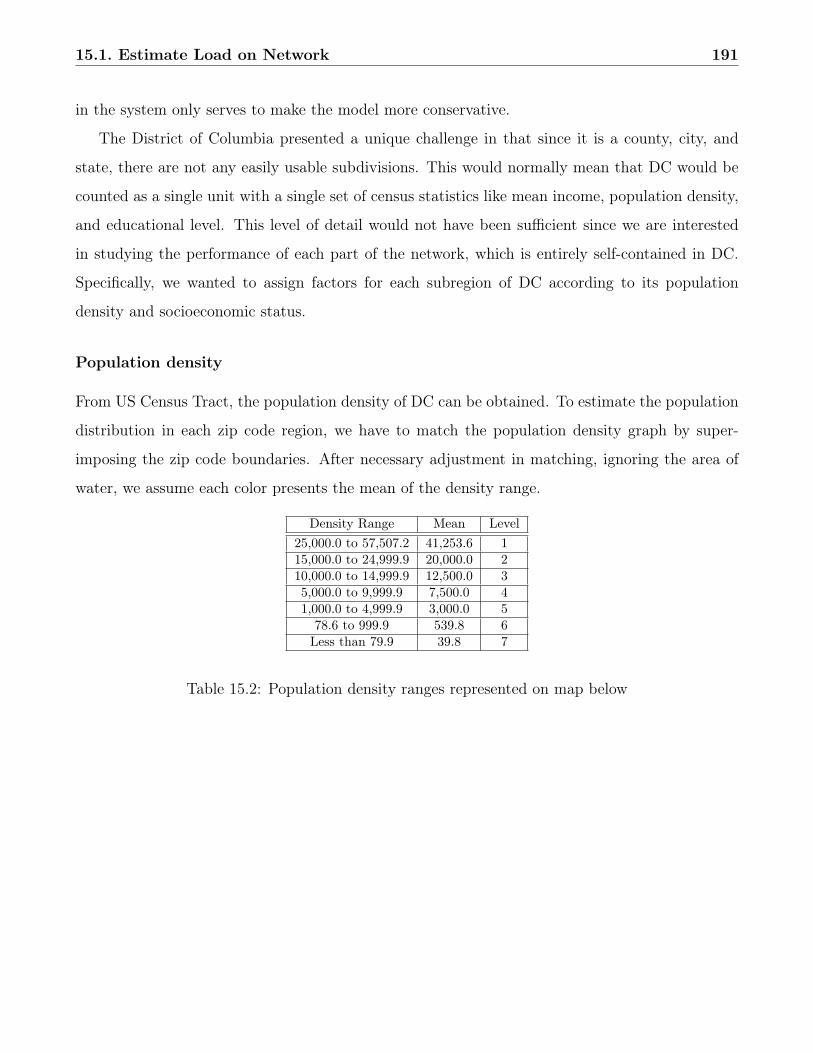
15.1. Estimate Load on Network 191
in the system only serves to make the model more conservative.
The District of Columbia presented a unique challenge in that since it is a county, city, and
state, there are not any easily usable subdivisions. This would normally mean that DC would be
counted as a single unit with a single set of census statistics like mean income, population density,
and educational level. This level of detail would not have been sufficient since we are interested
in studying the performance of each part of the network, which is entirely self-contained in DC.
Specifically, we wanted to assign factors for each subregion of DC according to its population
density and socioeconomic status.
Population density
From US Census Tract, the population density of DC can be obtained. To estimate the population
distribution in each zip code region, we have to match the population density graph by super-
imposing the zip code boundaries. After necessary adjustment in matching, ignoring the area of
water, we assume each color presents the mean of the density range.
Density Range Mean Level25,000.0 to 57,507.2 41,253.6 115,000.0 to 24,999.9 20,000.0 210,000.0 to 14,999.9 12,500.0 35,000.0 to 9,999.9 7,500.0 41,000.0 to 4,999.9 3,000.0 5
78.6 to 999.9 539.8 6Less than 79.9 39.8 7
Table 15.2: Population density ranges represented on map below
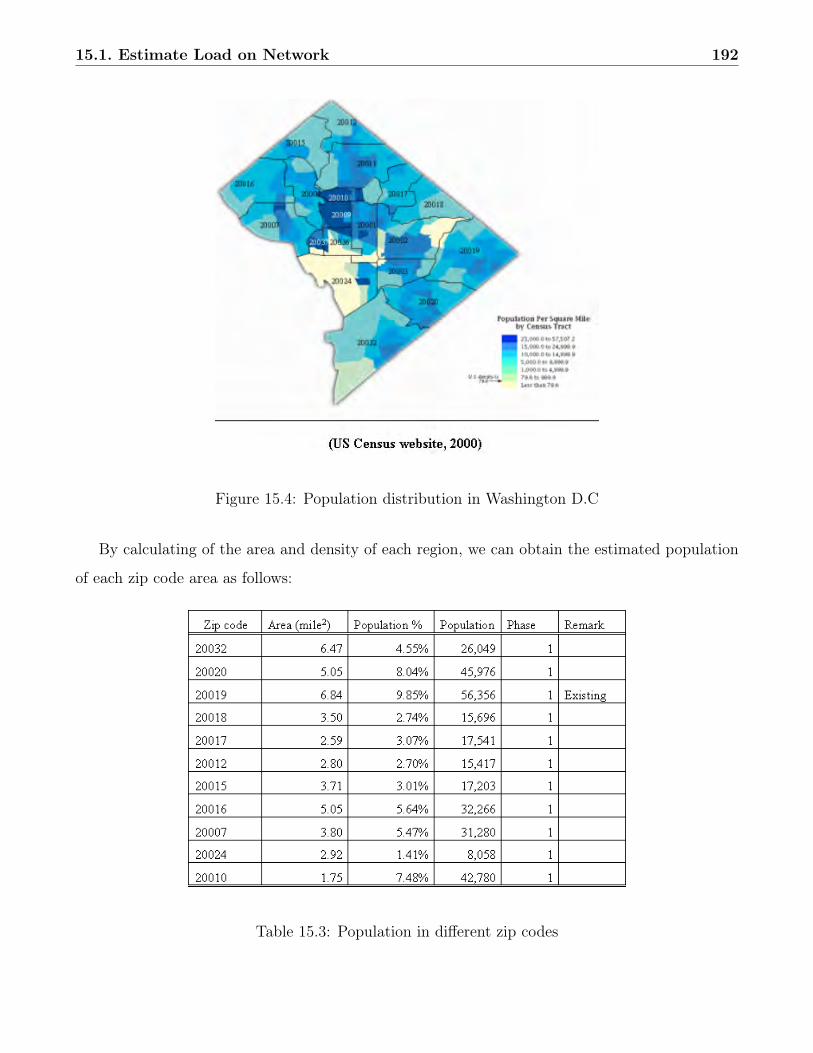
15.1. Estimate Load on Network 192
Figure 15.4: Population distribution in Washington D.C
By calculating of the area and density of each region, we can obtain the estimated population
of each zip code area as follows:
Table 15.3: Population in different zip codes
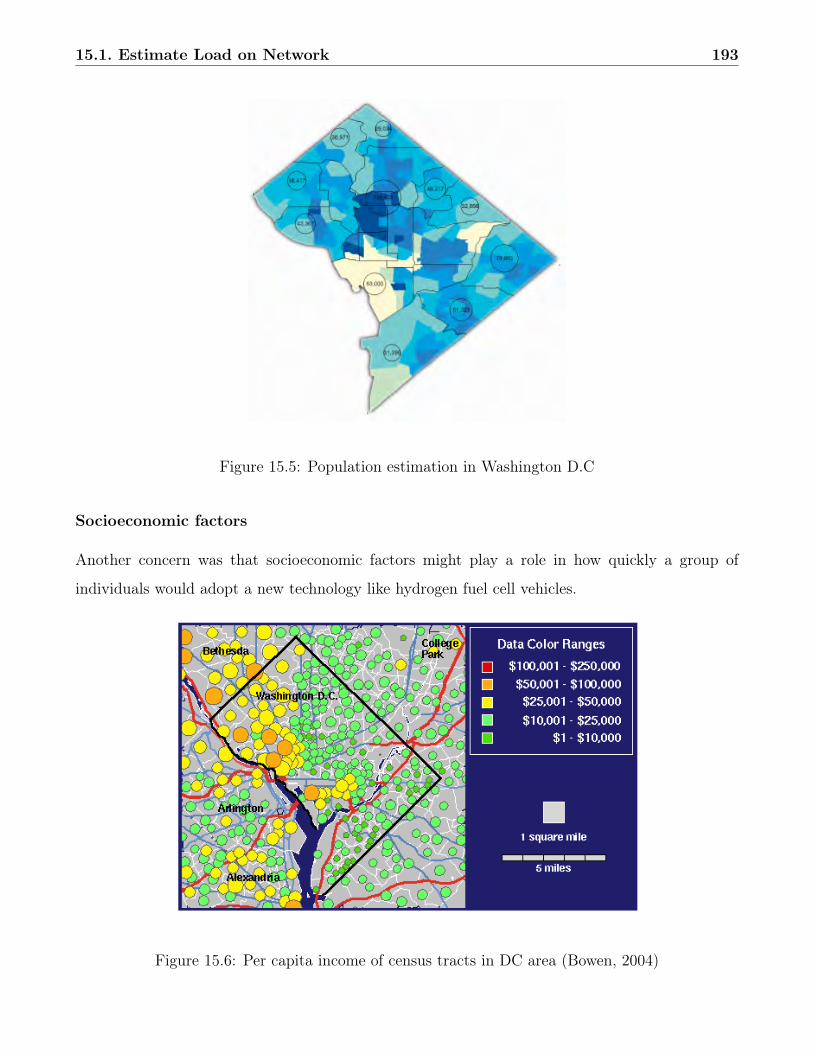
15.1. Estimate Load on Network 193
Figure 15.5: Population estimation in Washington D.C
Socioeconomic factors
Another concern was that socioeconomic factors might play a role in how quickly a group of
individuals would adopt a new technology like hydrogen fuel cell vehicles.
Figure 15.6: Per capita income of census tracts in DC area (Bowen, 2004)
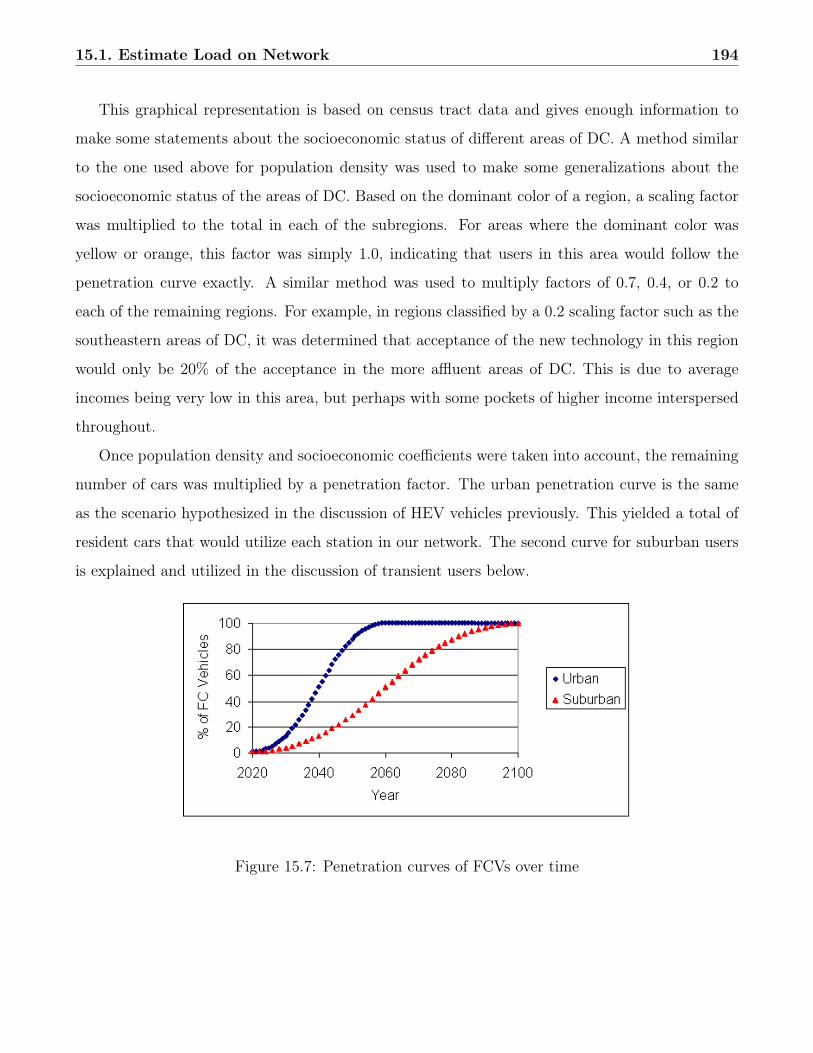
15.1. Estimate Load on Network 194
This graphical representation is based on census tract data and gives enough information to
make some statements about the socioeconomic status of different areas of DC. A method similar
to the one used above for population density was used to make some generalizations about the
socioeconomic status of the areas of DC. Based on the dominant color of a region, a scaling factor
was multiplied to the total in each of the subregions. For areas where the dominant color was
yellow or orange, this factor was simply 1.0, indicating that users in this area would follow the
penetration curve exactly. A similar method was used to multiply factors of 0.7, 0.4, or 0.2 to
each of the remaining regions. For example, in regions classified by a 0.2 scaling factor such as the
southeastern areas of DC, it was determined that acceptance of the new technology in this region
would only be 20% of the acceptance in the more affluent areas of DC. This is due to average
incomes being very low in this area, but perhaps with some pockets of higher income interspersed
throughout.
Once population density and socioeconomic coefficients were taken into account, the remaining
number of cars was multiplied by a penetration factor. The urban penetration curve is the same
as the scenario hypothesized in the discussion of HEV vehicles previously. This yielded a total of
resident cars that would utilize each station in our network. The second curve for suburban users
is explained and utilized in the discussion of transient users below.
Figure 15.7: Penetration curves of FCVs over time
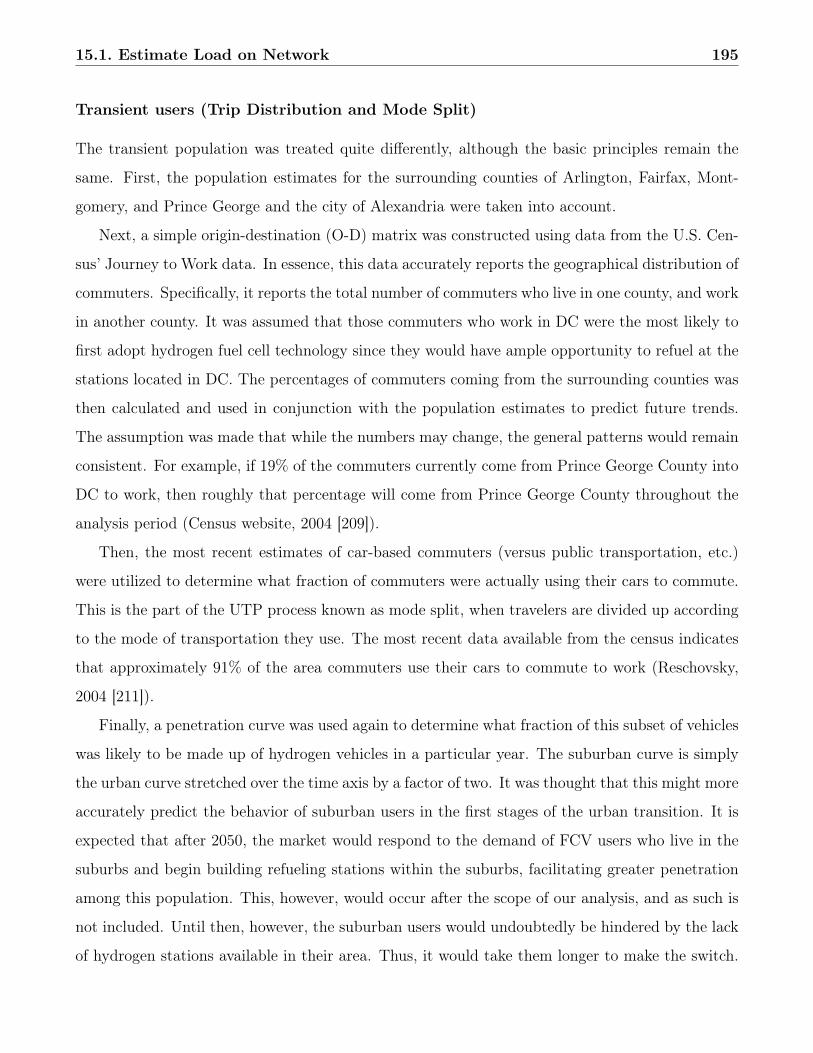
15.1. Estimate Load on Network 195
Transient users (Trip Distribution and Mode Split)
The transient population was treated quite differently, although the basic principles remain the
same. First, the population estimates for the surrounding counties of Arlington, Fairfax, Mont-
gomery, and Prince George and the city of Alexandria were taken into account.
Next, a simple origin-destination (O-D) matrix was constructed using data from the U.S. Cen-
sus’ Journey to Work data. In essence, this data accurately reports the geographical distribution of
commuters. Specifically, it reports the total number of commuters who live in one county, and work
in another county. It was assumed that those commuters who work in DC were the most likely to
first adopt hydrogen fuel cell technology since they would have ample opportunity to refuel at the
stations located in DC. The percentages of commuters coming from the surrounding counties was
then calculated and used in conjunction with the population estimates to predict future trends.
The assumption was made that while the numbers may change, the general patterns would remain
consistent. For example, if 19% of the commuters currently come from Prince George County into
DC to work, then roughly that percentage will come from Prince George County throughout the
analysis period (Census website, 2004 [209]).
Then, the most recent estimates of car-based commuters (versus public transportation, etc.)
were utilized to determine what fraction of commuters were actually using their cars to commute.
This is the part of the UTP process known as mode split, when travelers are divided up according
to the mode of transportation they use. The most recent data available from the census indicates
that approximately 91% of the area commuters use their cars to commute to work (Reschovsky,
2004 [211]).
Finally, a penetration curve was used again to determine what fraction of this subset of vehicles
was likely to be made up of hydrogen vehicles in a particular year. The suburban curve is simply
the urban curve stretched over the time axis by a factor of two. It was thought that this might more
accurately predict the behavior of suburban users in the first stages of the urban transition. It is
expected that after 2050, the market would respond to the demand of FCV users who live in the
suburbs and begin building refueling stations within the suburbs, facilitating greater penetration
among this population. This, however, would occur after the scope of our analysis, and as such is
not included. Until then, however, the suburban users would undoubtedly be hindered by the lack
of hydrogen stations available in their area. Thus, it would take them longer to make the switch.
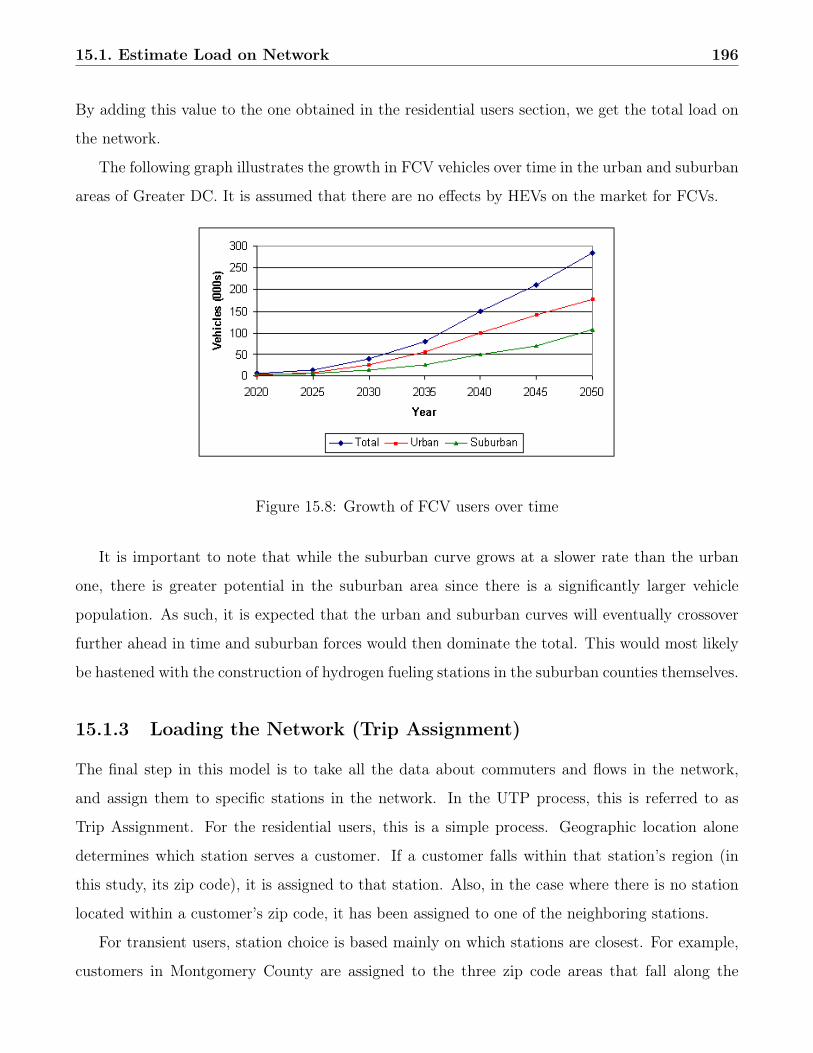
15.1. Estimate Load on Network 196
By adding this value to the one obtained in the residential users section, we get the total load on
the network.
The following graph illustrates the growth in FCV vehicles over time in the urban and suburban
areas of Greater DC. It is assumed that there are no effects by HEVs on the market for FCVs.
Figure 15.8: Growth of FCV users over time
It is important to note that while the suburban curve grows at a slower rate than the urban
one, there is greater potential in the suburban area since there is a significantly larger vehicle
population. As such, it is expected that the urban and suburban curves will eventually crossover
further ahead in time and suburban forces would then dominate the total. This would most likely
be hastened with the construction of hydrogen fueling stations in the suburban counties themselves.
15.1.3 Loading the Network (Trip Assignment)
The final step in this model is to take all the data about commuters and flows in the network,
and assign them to specific stations in the network. In the UTP process, this is referred to as
Trip Assignment. For the residential users, this is a simple process. Geographic location alone
determines which station serves a customer. If a customer falls within that station’s region (in
this study, its zip code), it is assigned to that station. Also, in the case where there is no station
located within a customer’s zip code, it has been assigned to one of the neighboring stations.
For transient users, station choice is based mainly on which stations are closest. For example,
customers in Montgomery County are assigned to the three zip code areas that fall along the
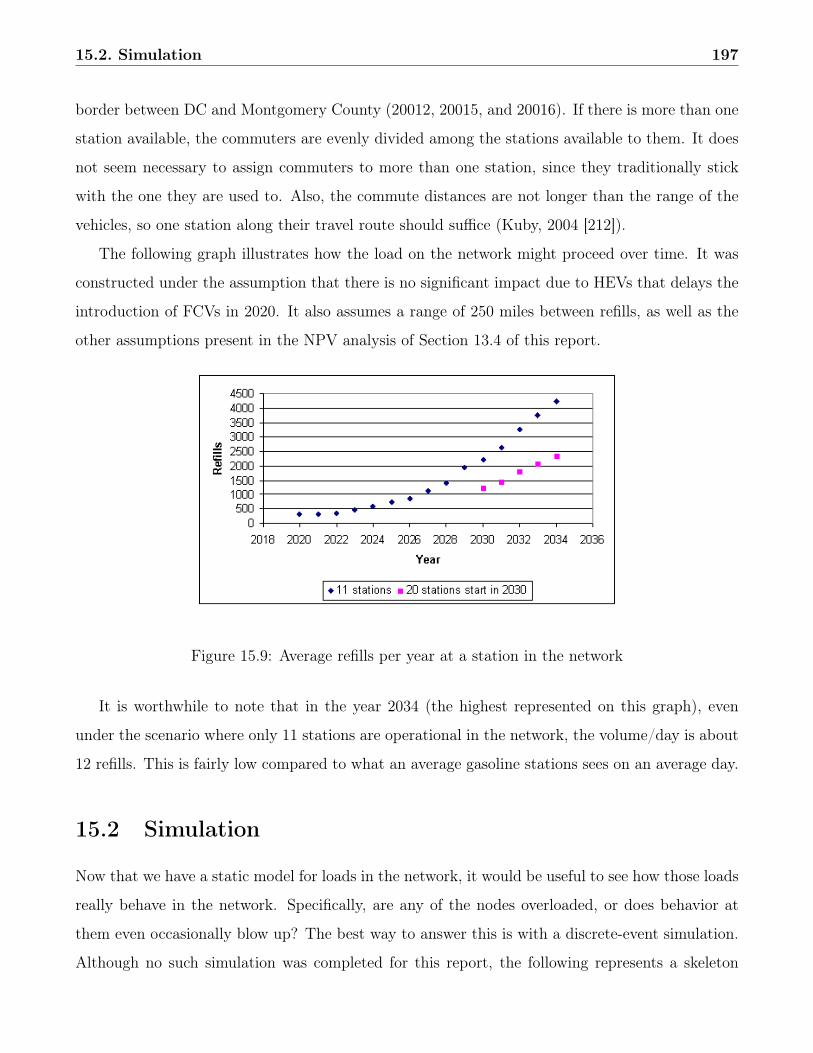
15.2. Simulation 197
border between DC and Montgomery County (20012, 20015, and 20016). If there is more than one
station available, the commuters are evenly divided among the stations available to them. It does
not seem necessary to assign commuters to more than one station, since they traditionally stick
with the one they are used to. Also, the commute distances are not longer than the range of the
vehicles, so one station along their travel route should suffice (Kuby, 2004 [212]).
The following graph illustrates how the load on the network might proceed over time. It was
constructed under the assumption that there is no significant impact due to HEVs that delays the
introduction of FCVs in 2020. It also assumes a range of 250 miles between refills, as well as the
other assumptions present in the NPV analysis of Section 13.4 of this report.
Figure 15.9: Average refills per year at a station in the network
It is worthwhile to note that in the year 2034 (the highest represented on this graph), even
under the scenario where only 11 stations are operational in the network, the volume/day is about
12 refills. This is fairly low compared to what an average gasoline stations sees on an average day.
15.2 Simulation
Now that we have a static model for loads in the network, it would be useful to see how those loads
really behave in the network. Specifically, are any of the nodes overloaded, or does behavior at
them even occasionally blow up? The best way to answer this is with a discrete-event simulation.
Although no such simulation was completed for this report, the following represents a skeleton
15.2. Simulation 198
version that could be created and modified for further study.
First, a profile of use throughout the day needs to be constructed. The material from Papacostas
& Prevedouros, previously modified in the Contest part of this report, should serve as a good
approximation. This following version of the graph just shows the percentage of total demand
throughout the day, thus allowing it to be scaled to whichever station is being studied.
Figure 15.10: Approx. hourly usage of a gasoline station (derived from Papacostas, 2001 [210])
Presumably, our primary concern would be during the morning peak hour, since that time
experiences the largest load in a short period of time. A simple queuing model that models the
arrival and service times of customers at a station would provide information as to how close to
capacity this node in the network is. The standard way of processing arrival times for this sort
of problem is to treat it as a Poisson process. This simply means that the time between arrivals
is exponentially distributed around the arrival rate. To model the service time, we would use a
uniform distribution over the interval 5-10 minutes. This should accurately represent the prediction
that refueling time will be designed with the current system in mind to ease the transition. The
pumps would be modeled as a 2-server queue, again with the consideration that a single pump
would probably be double-sided, as the ones today are.
It is hoped that the results of this simulation could be used to predict the appropriate time to
expand the network. Specifically, when a station begins to experience long queues, we would want
to plan to expand capacity in that part of the network so that the additional pumps come online
before the problem becomes too much of a concern.
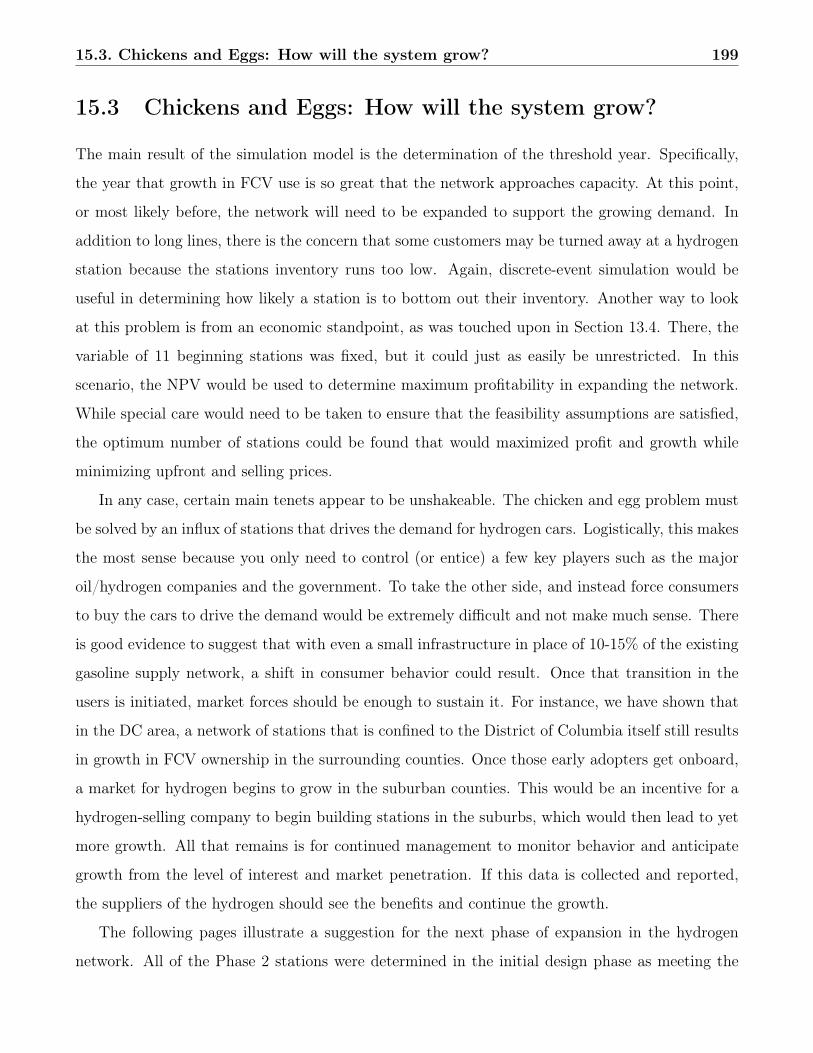
15.3. Chickens and Eggs: How will the system grow? 199
15.3 Chickens and Eggs: How will the system grow?
The main result of the simulation model is the determination of the threshold year. Specifically,
the year that growth in FCV use is so great that the network approaches capacity. At this point,
or most likely before, the network will need to be expanded to support the growing demand. In
addition to long lines, there is the concern that some customers may be turned away at a hydrogen
station because the stations inventory runs too low. Again, discrete-event simulation would be
useful in determining how likely a station is to bottom out their inventory. Another way to look
at this problem is from an economic standpoint, as was touched upon in Section 13.4. There, the
variable of 11 beginning stations was fixed, but it could just as easily be unrestricted. In this
scenario, the NPV would be used to determine maximum profitability in expanding the network.
While special care would need to be taken to ensure that the feasibility assumptions are satisfied,
the optimum number of stations could be found that would maximized profit and growth while
minimizing upfront and selling prices.
In any case, certain main tenets appear to be unshakeable. The chicken and egg problem must
be solved by an influx of stations that drives the demand for hydrogen cars. Logistically, this makes
the most sense because you only need to control (or entice) a few key players such as the major
oil/hydrogen companies and the government. To take the other side, and instead force consumers
to buy the cars to drive the demand would be extremely difficult and not make much sense. There
is good evidence to suggest that with even a small infrastructure in place of 10-15% of the existing
gasoline supply network, a shift in consumer behavior could result. Once that transition in the
users is initiated, market forces should be enough to sustain it. For instance, we have shown that
in the DC area, a network of stations that is confined to the District of Columbia itself still results
in growth in FCV ownership in the surrounding counties. Once those early adopters get onboard,
a market for hydrogen begins to grow in the suburban counties. This would be an incentive for a
hydrogen-selling company to begin building stations in the suburbs, which would then lead to yet
more growth. All that remains is for continued management to monitor behavior and anticipate
growth from the level of interest and market penetration. If this data is collected and reported,
the suppliers of the hydrogen should see the benefits and continue the growth.
The following pages illustrate a suggestion for the next phase of expansion in the hydrogen
network. All of the Phase 2 stations were determined in the initial design phase as meeting the
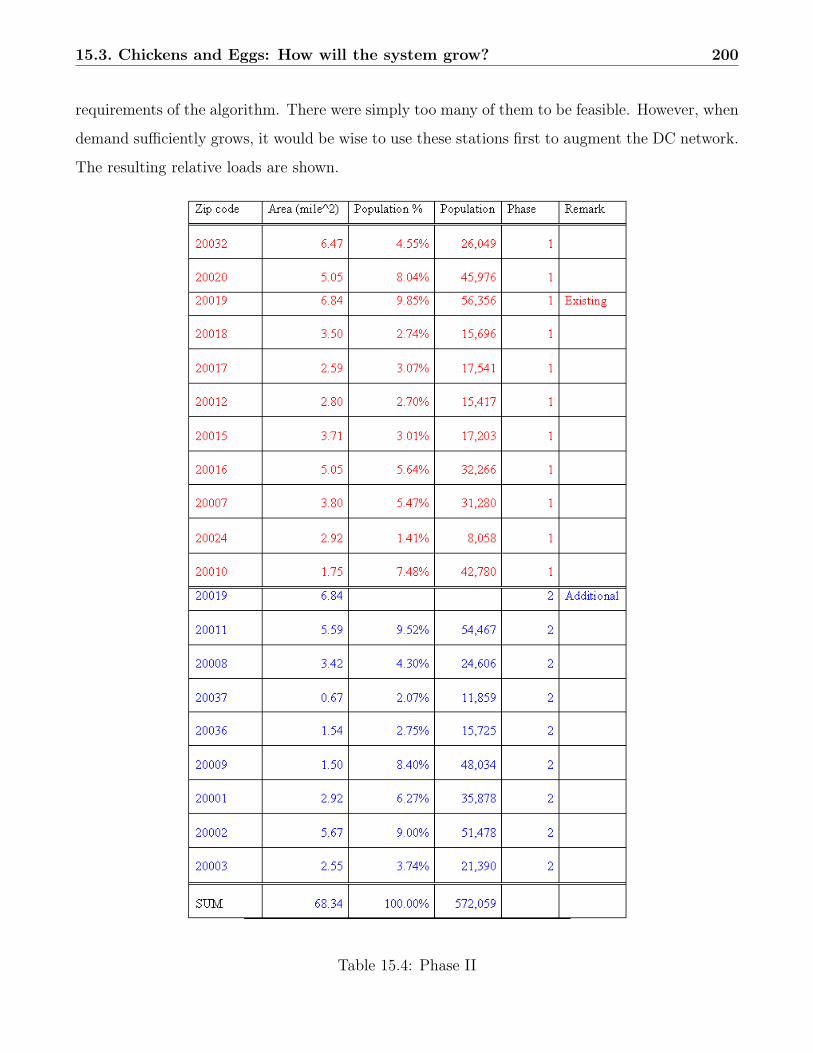
15.3. Chickens and Eggs: How will the system grow? 200
requirements of the algorithm. There were simply too many of them to be feasible. However, when
demand sufficiently grows, it would be wise to use these stations first to augment the DC network.
The resulting relative loads are shown.
Table 15.4: Phase II
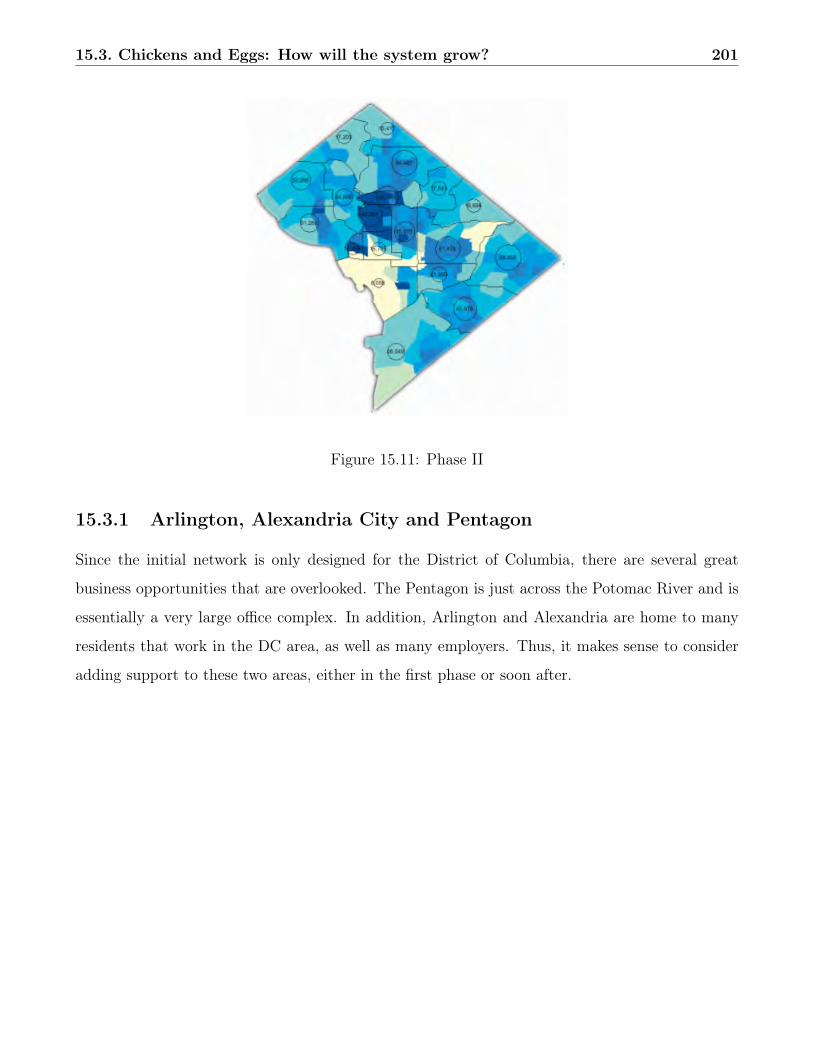
15.3. Chickens and Eggs: How will the system grow? 201
Figure 15.11: Phase II
15.3.1 Arlington, Alexandria City and Pentagon
Since the initial network is only designed for the District of Columbia, there are several great
business opportunities that are overlooked. The Pentagon is just across the Potomac River and is
essentially a very large office complex. In addition, Arlington and Alexandria are home to many
residents that work in the DC area, as well as many employers. Thus, it makes sense to consider
adding support to these two areas, either in the first phase or soon after.

15.3. Chickens and Eggs: How will the system grow? 202
Figure 15.12: Arlington, Alexandria City and Pentagon
Assuming we pick 11 stations for the initial requirement in D.C. area, it is reasonable to pick 6
stations for North Virginia (Arlington county and Alexandria city) based on the population ratio
of D.C. in the first phase. Alexandria city and Arlington Country have similar populations, so we
assumed each of them would house 3 hydrogen stations. Because of the large amount of employees
in the Pentagon (approx. 23,000), it is reasonable to put one station in Pentagon City even though
some portion of these workers use the Metro subway system to commute.
Because the D.C. area is the focus of our topics, we will not go into great detail about where
these 6 additional stations should be located. However, the following maps suggest possible prime
locations. Notice that although these areas are primarily residential areas, the stations are near
major roads. Also, we are not concerned with avoiding those areas that are served by the Metro
system. It should also be noted that it is beneficial to the main D.C. network to add support to
these areas as it would reduce the strain on sections of the D.C. network. Currently, if FCV owners

15.4. Conclusion 203
in the Alexandria or southern Fairfax areas want to refill, their preferred station is just across the
river in the 20024 zip code area. Because of this, that station carries the highest load compared
to the others in the network. Diverting some of its demand to other areas would thus increase the
robustness of the DC network.
Figure 15.13: Station Locations in Arlington, Alexandria City
15.4 Conclusion
To implement a fully functional and efficient network, much information and consideration will
have to go into the planning. Sources like census data and surveys of public opinion will be a
necessity to ensure success. Like any complex system, the network will not operate unless the
users desires and behavior are taken into account. At a minimum, accurate demand projections
and cooperation with automakers will be a necessity. To maximize acceptance, the interface must
be simple and as convenient as possible. A good benchmark will be the most current gasoline

15.4. Conclusion 204
technologies. Any sharp increase in the time or complexity of the refueling process will only hinder
public acceptance.
Studies suggest that the infancy of the hydrogen transition will take place within the current
gasoline infrastructure. Many of the major oil companies have already begun to anticipate this
switch and have conducted extensive research into the process of converting the industry from oil
and natural gas to hydrogen. To begin with, a percentage of gasoline stations will have hydrogen
pumps added to them. It is believed that this will enable customers to easily see the availability
of hydrogen, as well as reduce construction costs. Research suggests that an appropriate threshold
would be 10% of the gasoline stations in service. For the city of Washington, this is about 11
stations.
Cost of this program is widely dependent on the capacity and design of the new stations. Larger
capacity and on-site production stations will in general cost more than their off site and smaller
companions. It will also depend on when the first stations are constructed, and the development of
hydrogen technologies at that time. This study has determined that an off site production station
with a capacity of 500 Nm3/h in the year 2020 will cost between $1.2 million and $1.8 million,
depending on the number being constructed and the current level of technology. At this level of
investment, a selling price of $3.44/kg of H2 will result in a successful business model over a 15
year life cycle.
Overall success of the network will be determined by how well it balances the two objectives of
reducing cost yet increasing support for hydrogen fuel cell vehicle owners in the beginning. Over
time, a successful network will allow users to easily locate stations at which they can quickly refuel.
It will also have management of its growth so that the network grows with demand in a seamless
way.
Without question, management is especially crucial in this phase of the hydrogen transition.
Market forces alone can not be expected to facilitate the implementation of an effective network. It
also seems fairly certain that one company can not be expected to manage the transition alone. The
process will require the cooperation of many companies, and most likely the council of governments
for the Washington, DC area as well.

Part IV
Gen H Power Park Design
205
Chapter 16
Technical Design
As the world’s demand for gasoline steadily increases, the amount of the world’s fossil fuels show
a steady decrease to levels that require a new solution. This crisis necessitates a new paradigm in
energy generation – the hydrogen generation.
The design of the hydrogen support infrastructure represents one critical obstacle to successful
implementation. How will the next generation get their hydrogen? Gen H Power Park demon-
strates that the solution to the infrastructure obstacle may be just around the block.
Gen H eschews short-sighted answers that involve further mining of limited fossil fuels, for more
long-term solutions that integrate environmental concern with technical and economic feasibility.
Accordingly, Gen H Power Park’s HMax derives its fuel from an inexhaustible source of hydrogen
and produces eMax via clean electricity production methods.
Gen H Power Park is a beacon of progress for the next generation. What better place to locate
such a beacon than in the nation’s capital? Not only will the location serve to better show the
country and the world that the solution to the hydrogen infrastructure challenge has been found,
but it will also expedite the development of the relationship between government and the hydrogen
community, a necessary element in making the hydrogen economy a reality.
16.1 Park Location
Gen H Power Park is designed to serve the Washington D.C.-Maryland-Virginia-West Virginia
Primary Metropolitan Statistical Area (PMSA, as referred to by the U.S. Census Bureau). As of
the year 2000, the area had a population of 4,923,153. The following 25 counties and cities make
206
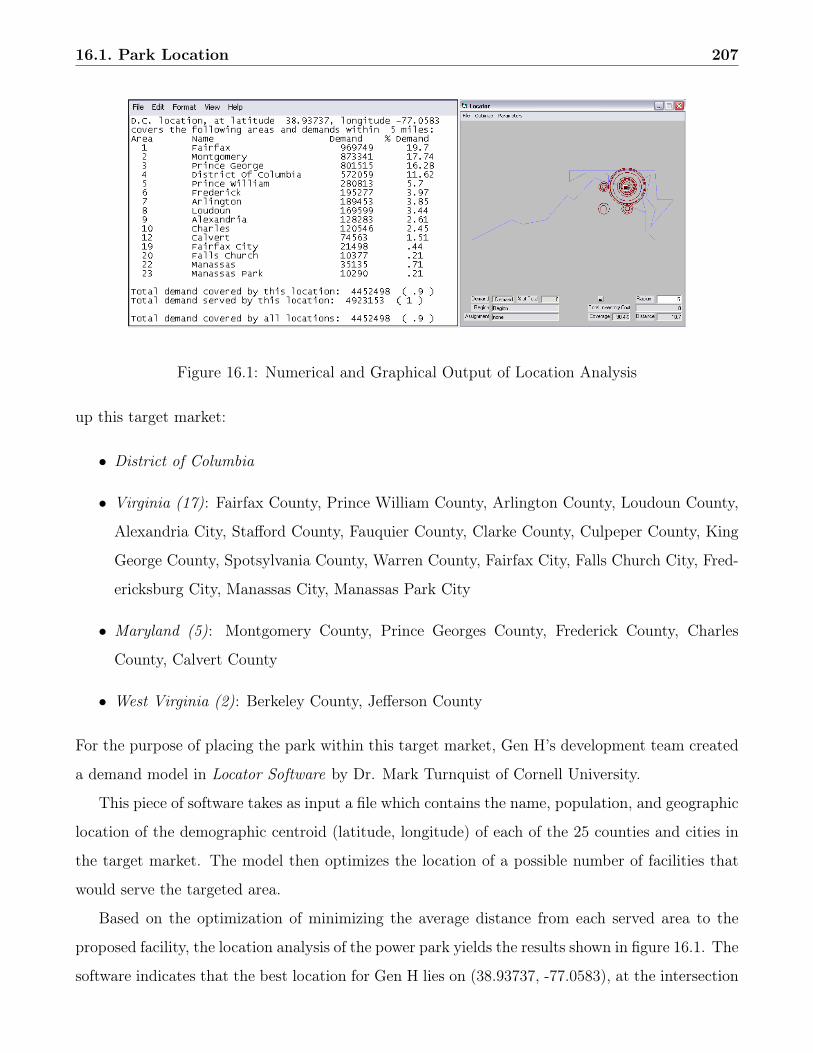
16.1. Park Location 207
Figure 16.1: Numerical and Graphical Output of Location Analysis
up this target market:
• District of Columbia
• Virginia (17): Fairfax County, Prince William County, Arlington County, Loudoun County,
Alexandria City, Stafford County, Fauquier County, Clarke County, Culpeper County, King
George County, Spotsylvania County, Warren County, Fairfax City, Falls Church City, Fred-
ericksburg City, Manassas City, Manassas Park City
• Maryland (5): Montgomery County, Prince Georges County, Frederick County, Charles
County, Calvert County
• West Virginia (2): Berkeley County, Jefferson County
For the purpose of placing the park within this target market, Gen H’s development team created
a demand model in Locator Software by Dr. Mark Turnquist of Cornell University.
This piece of software takes as input a file which contains the name, population, and geographic
location of the demographic centroid (latitude, longitude) of each of the 25 counties and cities in
the target market. The model then optimizes the location of a possible number of facilities that
would serve the targeted area.
Based on the optimization of minimizing the average distance from each served area to the
proposed facility, the location analysis of the power park yields the results shown in figure 16.1. The
software indicates that the best location for Gen H lies on (38.93737, -77.0583), at the intersection

16.2. Hydrogen Source 208
Figure 16.2: Gen H Location
of Connecticut Avenue SW and Ordway Street SW, in D.C. Placed here, the facility covers 90.4% of
the overall demand, with an average distance of 10.7 miles to the population centers. Unfortunately,
local zoning laws do not allow for the placement of a power plant there.
The nearest available zone classified as “M” (suitable for manufacturing) lies near the Blue
Plains Advanced Wastewater Treatment Plant (AWTP), only 7 miles away from the optimal solu-
tion suggested by the model. The Blue Plains AWTP is the largest advanced wastewater treatment
facility of its type in the United States [241], providing Gen H Power Park with its inexhaustible
source of hydrogen. This alternative location also minimizes the cost of the material transport
pipeline. Therefore, Gen H Power Park is located at the southernmost tip of Shepherd Parkway,
S.W, east of I-295, just across the street from its source of hydrogen.
16.2 Hydrogen Source
Wastewater collected from the District of Columbia and the Maryland and Virginia suburbs is de-
livered to the Blue Plains AWTP, which maintains a rated average capacity of 370 million gallons
per day [242]. The existing wastewater treatment processes at the Blue Plains AWTP consists of
preliminary treatment, secondary treatment, nitrification/denitrification, effluent filtration, chlo-
rination, dechlorination, and post aeration. Presently, Blue Plains AWTP does not digest their
biosolids, creating unusable waste that must be disposed of in environmentally harmful ways.
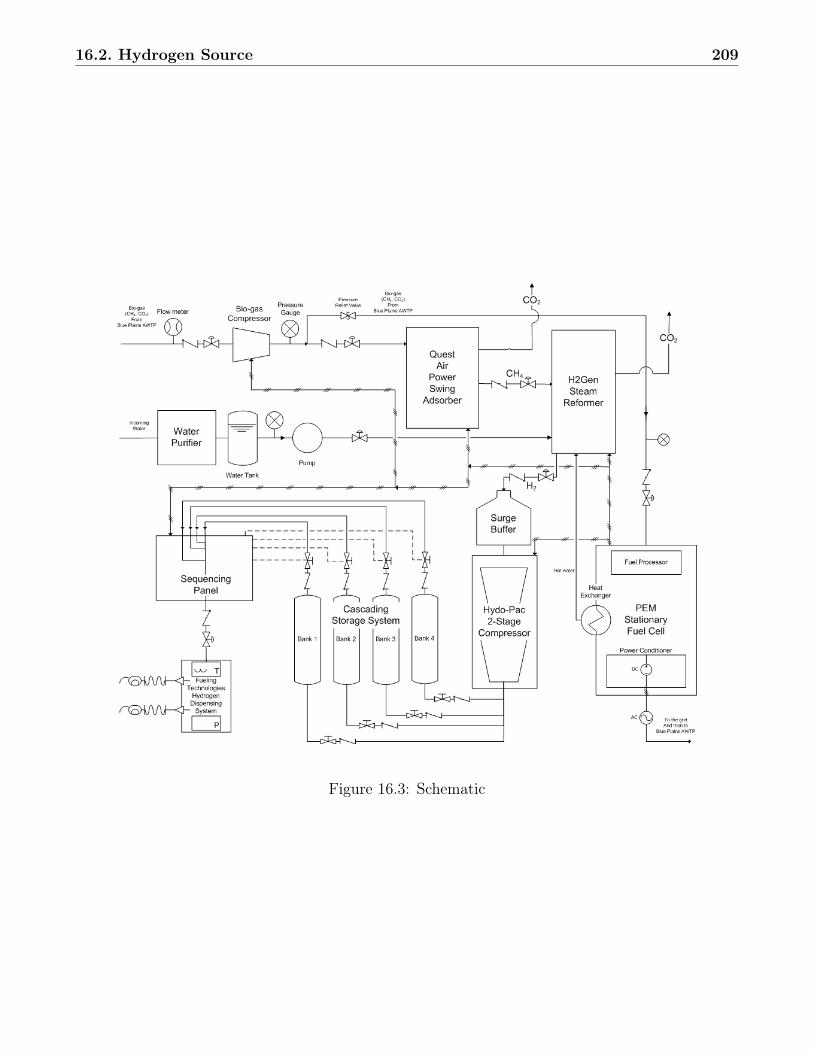
16.2. Hydrogen Source 209
Figure 16.3: Schematic
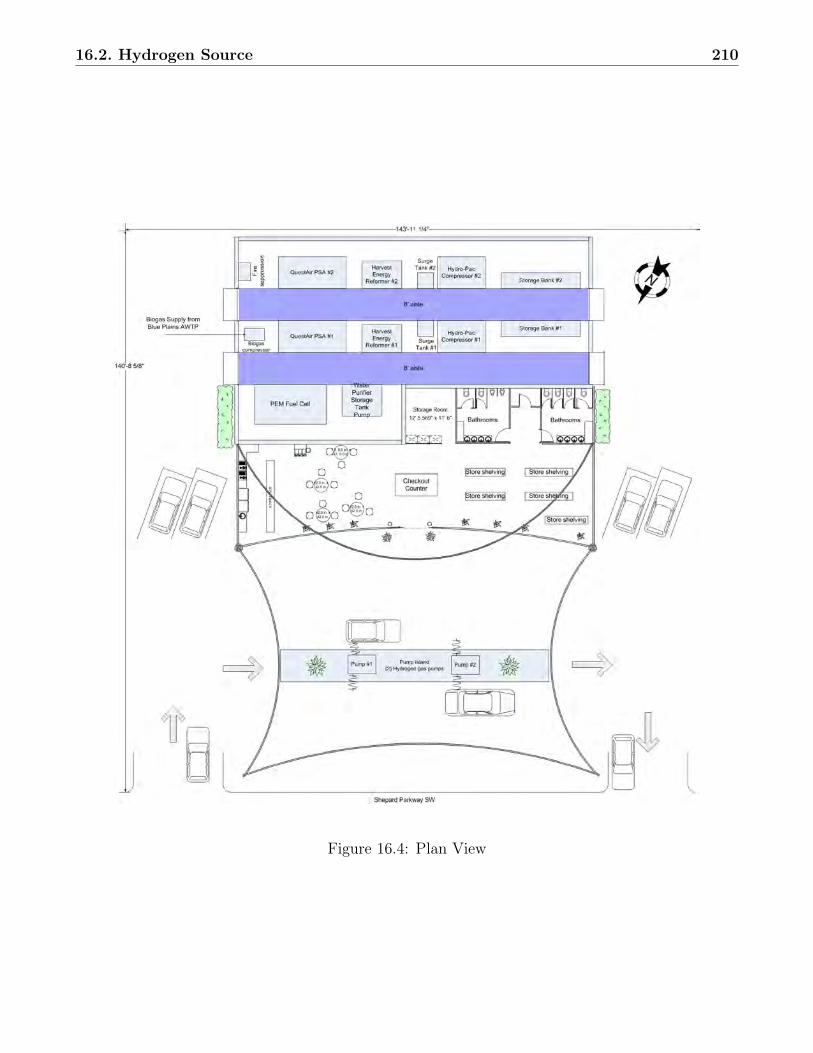
16.2. Hydrogen Source 210
Figure 16.4: Plan View
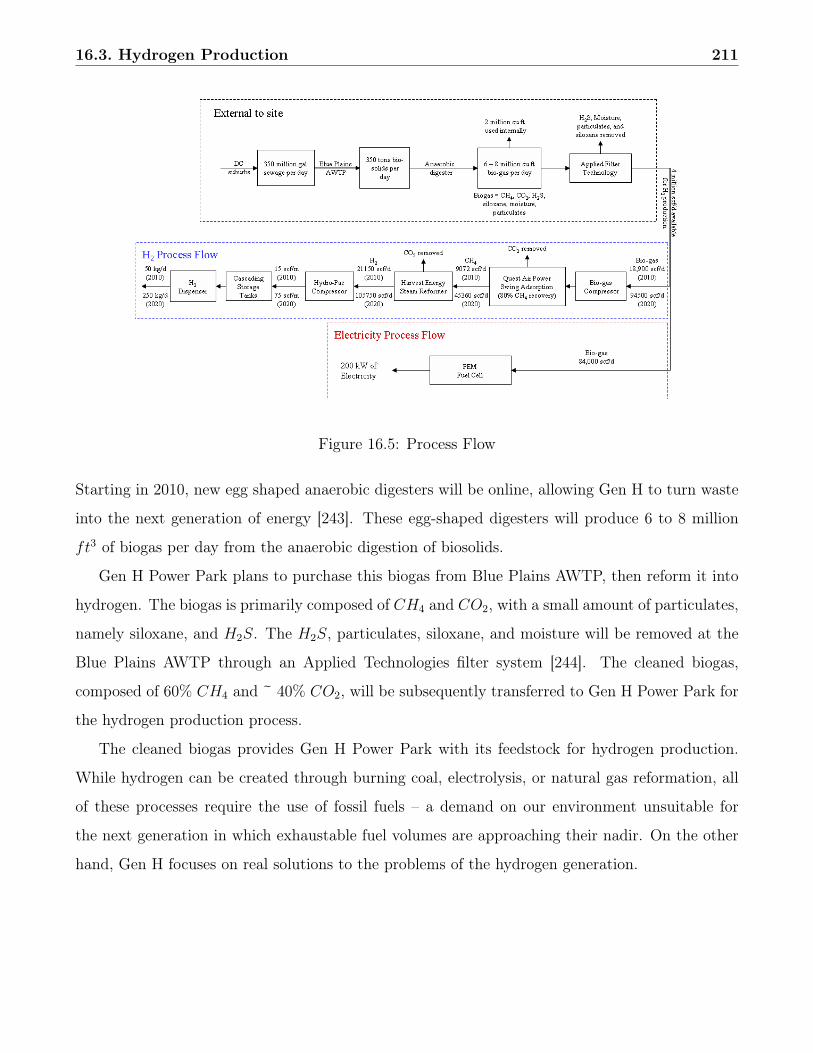
16.3. Hydrogen Production 211
Figure 16.5: Process Flow
Starting in 2010, new egg shaped anaerobic digesters will be online, allowing Gen H to turn waste
into the next generation of energy [243]. These egg-shaped digesters will produce 6 to 8 million
ft3 of biogas per day from the anaerobic digestion of biosolids.
Gen H Power Park plans to purchase this biogas from Blue Plains AWTP, then reform it into
hydrogen. The biogas is primarily composed of CH4 and CO2, with a small amount of particulates,
namely siloxane, and H2S. The H2S, particulates, siloxane, and moisture will be removed at the
Blue Plains AWTP through an Applied Technologies filter system [244]. The cleaned biogas,
composed of 60% CH4 and ~ 40% CO2, will be subsequently transferred to Gen H Power Park for
the hydrogen production process.
The cleaned biogas provides Gen H Power Park with its feedstock for hydrogen production.
While hydrogen can be created through burning coal, electrolysis, or natural gas reformation, all
of these processes require the use of fossil fuels – a demand on our environment unsuitable for
the next generation in which exhaustable fuel volumes are approaching their nadir. On the other
hand, Gen H focuses on real solutions to the problems of the hydrogen generation.
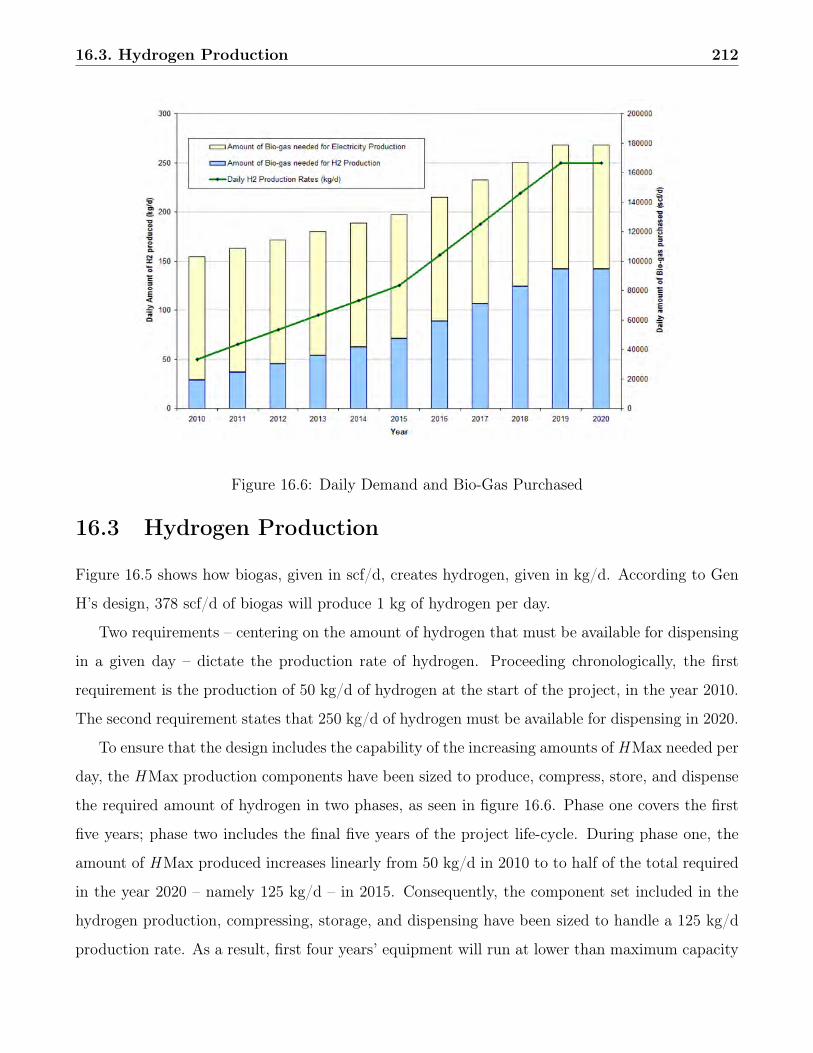
16.3. Hydrogen Production 212
Figure 16.6: Daily Demand and Bio-Gas Purchased
16.3 Hydrogen Production
Figure 16.5 shows how biogas, given in scf/d, creates hydrogen, given in kg/d. According to Gen
H’s design, 378 scf/d of biogas will produce 1 kg of hydrogen per day.
Two requirements – centering on the amount of hydrogen that must be available for dispensing
in a given day – dictate the production rate of hydrogen. Proceeding chronologically, the first
requirement is the production of 50 kg/d of hydrogen at the start of the project, in the year 2010.
The second requirement states that 250 kg/d of hydrogen must be available for dispensing in 2020.
To ensure that the design includes the capability of the increasing amounts of HMax needed per
day, the HMax production components have been sized to produce, compress, store, and dispense
the required amount of hydrogen in two phases, as seen in figure 16.6. Phase one covers the first
five years; phase two includes the final five years of the project life-cycle. During phase one, the
amount of HMax produced increases linearly from 50 kg/d in 2010 to to half of the total required
in the year 2020 – namely 125 kg/d – in 2015. Consequently, the component set included in the
hydrogen production, compressing, storage, and dispensing have been sized to handle a 125 kg/d
production rate. As a result, first four years’ equipment will run at lower than maximum capacity
16.3. Hydrogen Production 213
to achieve the required amount.1
In 2015, a second set of components will be purchased and installed. Starting in 2016, both
sets of components will run at a production rate that will linear increase the amount of HMax
produced at rate so that 250 kg/d will be generated by 2019. The design ensures that the 250
kg/d requirement will be met achieving the maximum capacity one year in advance. This al-
lows for additional capacity to be added if unforeseen circumstances make the maximum capacity
unachievable in 2019.
In order to size the total biogas requirement purchased from Blue Plains AWTP, Gen H consid-
ered both both hydrogen production and electricity generation. While the above paragraphs justify
the amount of biogas necessary to support Gen H’s hydrogen requirements, electricity production
components run completely independently (see the distinct branch for electricity production in
figure 16.5).
The electricity production is constant for the life cyle of the project; therefore, the amount of
biogas purchased for the electricity production is constant. Figure 16.6 depicts the total amount
of hydrogen produced and the subsequent amount of biogas purchased from the AWTP.
16.3.1 Hydrogen Production Process
Gen H’s strategic location enables pipeline to be laid between the power park and Blue Plains
AWTP, providing for the ready supply of the necessary biogas.
Before the methane can be converted into hydrogen, it must be separated from the carbon-
dioxide in the cleaned biogas. To create pure methane from the gas stream, the design of the Gen H
Power Park has included a QuestAir M-3200 Power Swing Adsorption system (PSA). The M-3200
PSA is a compact, economical, and reliable gas purification system designed for the removal of
CO2 from CH4 [245]. The PSA process is based on physical adsorption of gases onto specialized
beds of adsorbents. The M-3200 system employs six adsorber beds used in parallel to ensure a
constant flow of product gas. Since the reformer requires a methane rich gas stream at 150 psig,
the PSA has been designed to deliver a pure stream of gas at 150 psig. This required boosting the
incoming biogas to the PSA to around 175 psig, and hence requiring the addition of a compressor
1The component manufacturer suggested that the two phase approach would be the most cost efficient solutionto the increasing demand set forth by the Gen H design.
16.4. Hydrogen Distribution Process 214
in the design.
The power park design includes a GrimmerSchmidt Industrial Air Compressor to boost the
incoming modified bio-gas to 175 psig. The compressor would need modifications in order to
handle a combustible gas, at a cost of $60,000 [246]. The compressor would be able to handle the
required flow rate when the power park is producing 250 kg of HMax per day, or 94,500 scf of
bio-gas per day.
While there are several different ways to produce hydrogen from methane (or natural gas), the
most cost-effective option is to utilize a steam methane reforming (SMR) process with subsequent
pressure swing adsorption [247]. For Gen H’s design a hydrogen generator from Harvest Energy
Technology, Inc. (HET) has been incorporated [248] . The HET reformer generates hydrogen from
a pure stream of methane and input water through the following two chemical reactions.
CH4 + H2O 99K 3H2 + CO
CO + H2O 99K H2 + CO2
The first reaction combines methane with steam to create hydrogen gas and carbon-monoxide.
The second reaction combines the carbon monoxide with the water to produce more hydrogen and
carbon dioxide. The HET SMR System collects the hydrogen gas, cools it, and purifies it with an
internal PSA – effectively producing 99.9998% pure hydrogen. As a result, HMax is reliably and
predictably produced to the production rate requirements.
16.4 Hydrogen Distribution Process
Gen H Power Park was designed to accommodate a mature fuel cell vehicle market even though the
rate of production and required dispensing rate for the first few years reflects a smaller, less mature
fleet. For large stations, the price difference between a booster compression and a cascading storage
system is negligible [249]. Coupled with the fact that the most common approach for hydrogen
refueling is a cascading storage system [250], Gen H’s design includes a cascading storage system
that employs a high-pressure compressor, a four bank storage system, and two dispensers. Each
16.4. Hydrogen Distribution Process 215
bank can independently be filled via the compressor or discharged via the dispenser. The term
“bank” describes a total amount of hydrogen available at a certain pressure. A sequencing panel
controls the banks for priority filling. Each phase of the cascading system is described below. The
analysis described below uses a hydrogen fuel cell vehicle that stores 5 kg of hydrogen at 5000 psig.
Each bank will store the required amount of hydrogen at 6500 psig. The refueling components were
designed with the use of the CASCADE software [251]. The CASCADE software allows the user
to size the compressor and storage banks to meet a demand entered by the user. A full description
of the software and how it aided the design is included in appendix D.1 on page 302.
16.4.1 Hydrogen Compression
The cascading storage system requires storing the hydrogen at a pressure greater than the pressure
needed in the fuel cell vehicle. The Gen H Power Park employs a Hydro-PacTM LX Series Gas
Compressor, model # C07-60-140-200LX/SS [252]. The design requires a compressor capable of
compressing the hydrogen from 150 psig to 6500 psig, with a flow equal to the production flow rate.
Because hydrogen production proceeds in two phases with two sets of equipment, Gen H Power
Park sized the compressor to meet a 125 kg/d flow rate and will purchase two compressors, one at
the beginning of the project and another in the midway point. The production and compression
of the hydrogen will run at a constant rate throughout the day. A 125 kg/d production rate
requires a compressor size of approximately 37 scf/m [253]. The Hydro-PacTM LX Series Gas
Compressor is a two-stage, electro-hydraulically driven, nonlubricated unit that includes an electric
motor, hydraulic pump, hydraulic oil reserve, high-pressure gas intensifier and intensifier shifting
mechanism. Each unit consumes approximately 32 kW of power.
16.4.2 Hydrogen Storage
Gen H will purchase and install its storage system in two phases, similar to the compression and
production equipment. The total size of the cascading storage tanks was calculated using a 250
kg/d requirement and then divided in half to create the required volume for each set of storage
tanks. The size of the storage was calculated using the following formula taken from Thomas and
Reardon [254].
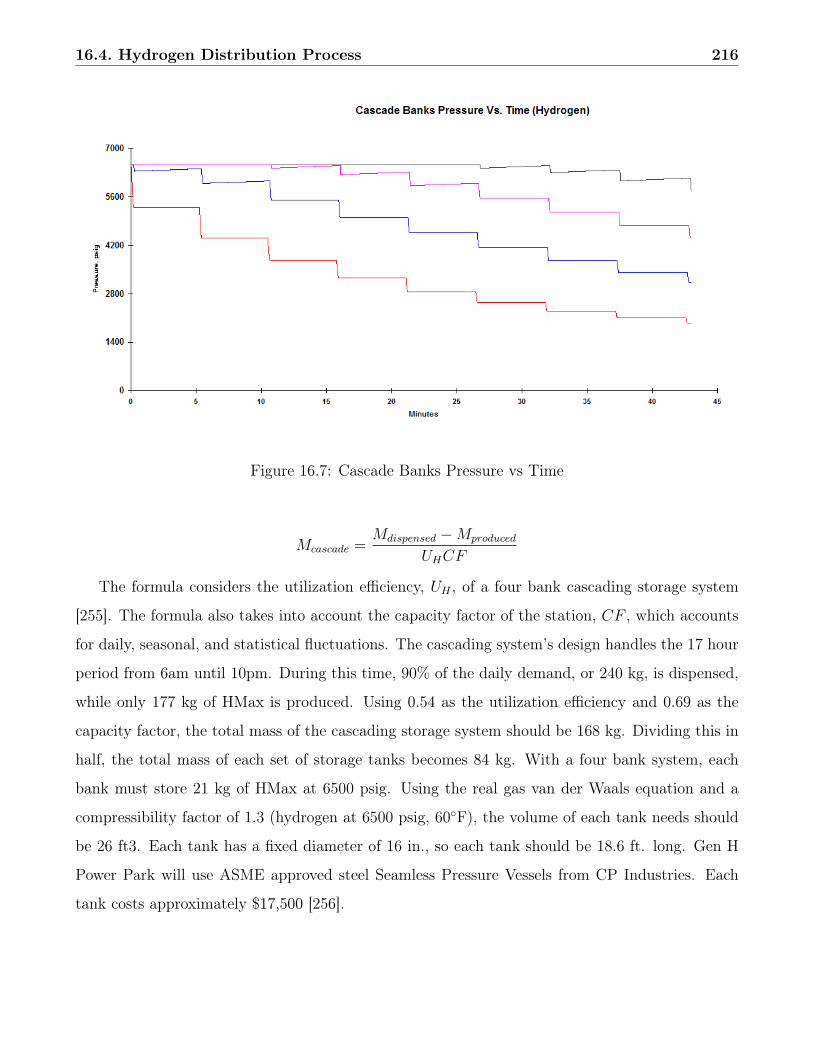
16.4. Hydrogen Distribution Process 216
Figure 16.7: Cascade Banks Pressure vs Time
Mcascade =Mdispensed −Mproduced
UHCF
The formula considers the utilization efficiency, UH , of a four bank cascading storage system
[255]. The formula also takes into account the capacity factor of the station, CF , which accounts
for daily, seasonal, and statistical fluctuations. The cascading system’s design handles the 17 hour
period from 6am until 10pm. During this time, 90% of the daily demand, or 240 kg, is dispensed,
while only 177 kg of HMax is produced. Using 0.54 as the utilization efficiency and 0.69 as the
capacity factor, the total mass of the cascading storage system should be 168 kg. Dividing this in
half, the total mass of each set of storage tanks becomes 84 kg. With a four bank system, each
bank must store 21 kg of HMax at 6500 psig. Using the real gas van der Waals equation and a
compressibility factor of 1.3 (hydrogen at 6500 psig, 60◦F), the volume of each tank needs should
be 26 ft3. Each tank has a fixed diameter of 16 in., so each tank should be 18.6 ft. long. Gen H
Power Park will use ASME approved steel Seamless Pressure Vessels from CP Industries. Each
tank costs approximately $17,500 [256].
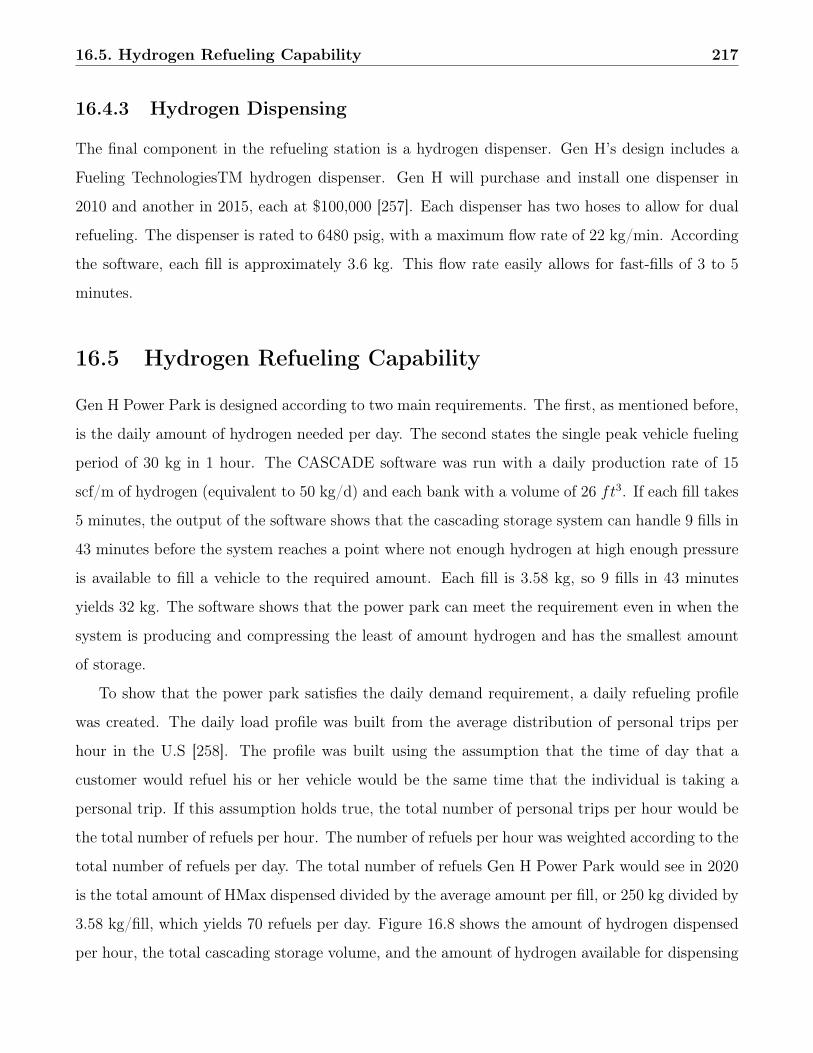
16.5. Hydrogen Refueling Capability 217
16.4.3 Hydrogen Dispensing
The final component in the refueling station is a hydrogen dispenser. Gen H’s design includes a
Fueling TechnologiesTM hydrogen dispenser. Gen H will purchase and install one dispenser in
2010 and another in 2015, each at $100,000 [257]. Each dispenser has two hoses to allow for dual
refueling. The dispenser is rated to 6480 psig, with a maximum flow rate of 22 kg/min. According
the software, each fill is approximately 3.6 kg. This flow rate easily allows for fast-fills of 3 to 5
minutes.
16.5 Hydrogen Refueling Capability
Gen H Power Park is designed according to two main requirements. The first, as mentioned before,
is the daily amount of hydrogen needed per day. The second states the single peak vehicle fueling
period of 30 kg in 1 hour. The CASCADE software was run with a daily production rate of 15
scf/m of hydrogen (equivalent to 50 kg/d) and each bank with a volume of 26 ft3. If each fill takes
5 minutes, the output of the software shows that the cascading storage system can handle 9 fills in
43 minutes before the system reaches a point where not enough hydrogen at high enough pressure
is available to fill a vehicle to the required amount. Each fill is 3.58 kg, so 9 fills in 43 minutes
yields 32 kg. The software shows that the power park can meet the requirement even in when the
system is producing and compressing the least of amount hydrogen and has the smallest amount
of storage.
To show that the power park satisfies the daily demand requirement, a daily refueling profile
was created. The daily load profile was built from the average distribution of personal trips per
hour in the U.S [258]. The profile was built using the assumption that the time of day that a
customer would refuel his or her vehicle would be the same time that the individual is taking a
personal trip. If this assumption holds true, the total number of personal trips per hour would be
the total number of refuels per hour. The number of refuels per hour was weighted according to the
total number of refuels per day. The total number of refuels Gen H Power Park would see in 2020
is the total amount of HMax dispensed divided by the average amount per fill, or 250 kg divided by
3.58 kg/fill, which yields 70 refuels per day. Figure 16.8 shows the amount of hydrogen dispensed
per hour, the total cascading storage volume, and the amount of hydrogen available for dispensing
16.6. Fuel Cell 218
Figure 16.8: Hydrogen Dispensing Simulation
in 2020. The amount available for dispensing is the total production amount multiplied by the
utilization efficiency. The figure shows that enough HMax will always remain for dispensing during
the day. Appendix D.1 explains how the CASCADE software was used to ensure that hydrogen
always remained at high enough pressure to meet the hourly distribution of refueling trips.
16.6 Fuel Cell
Gen H Power Park uses a Proton Exchange Membrane (PEM) fuel cell2 for its electricity, known
as eMax. The PEM fuel cell’s total cost ranks among cheaper fuel cells when installation, mainte-
nance, and operating costs are included. The main strength of the PEM fuel cell is the commercial
and technical viability. Companies such as Ballard, GM, Plug Power, and UTC have invested a
high degree of research into this particular technology. Thus, to ensure that Gen H Power Park
will produce electricity from a green source in 2010, a PEM fuel cell was chosen as the production
component. While there are other forms of producing electricity, Gen H Power Park is designed
not only to provide the consumer with electricity, but to do so without harming the environment.
This was a key concern when researching and choosing the different methods of production.
2The PEM fuel cell manufacturer requested their name be left out of the report due to the proprietary natureof this emerging technology. All data, including cost, is consistent with present literature (Shipley, et al. [262])
16.6. Fuel Cell 219
Other viable fuel cell options include phosphoric acid fuel cells (PAFC), solid oxide fuel cells
(SOFC), and molten carbonate fuel cells (MCFC). The difference among these fuel cells lies in the
type of electrolyte used in the interior of the fuel cell. PEM fuel cells and PAFCs use hydrogen
ions as the medium to transfer the electrons through the electrolyte, where as SOFC use oxide
ions and MCFC use carbonate ions. The sole manufacture of PAFCs has stopped developing this
technology and has decided to concentrate on PEM fuel cell technology (Shipley, et al. [262]).
SOFCs and MCFCs have shown promise, but are still in the pre-commercial stage of development.
Neither technology is commercially or technically viable in the next five years. Therefore, the only
possible choice for Gen H’s fuel cell was a PEM fuel cell.
16.6.1 The PEM Fuel Cell
The PEM fuel cell operates in the same way as the other fuel cell designs. It is comprised of an
anode, a cathode, and an electrolyte in between. In this case, the proton exchange membrane
serves as the electrolyte. The membrane is only porous to protons. Since electrons cannot travel
through the electrolyte, they instead must travel around the anode to cathode through an external
circuit. The current that results in this circuit produces the electricity that Gen H sells to the
local grid uses internally to run the hydrogen production and dispensing processes.
The PEM fuel cell that Gen H Power Park will use has its own hydrogen reformer, fuel cell,
heat exchanger, and electric conditioner. The fuel cell will accept the cleaned biogas from the
AWTP and reform it into hydrogen. The hydrogen will then pass through the fuel cell, creating
electricity. The electricity created by the fuel cell is in direct current, DC, and must be converted
into alternating current, AC. The fuel cell employs it own electric conditioner capable of converting
the DC current to AC current. The fuel cell can produce 200 kW of power with a fuel flow of
3500 scf/h of biogas. The fuel cell also employs its own heat exchanger, with a capacity of 300,000
btu/h at rated power up to 250 ◦F.
16.6.2 PEM Fuel Cell Operational Characteristics
Gen H plans to produce a constant rate of 200 kW, 24 hours a day. The power park will use
100 kW internall. A rough calculation of the power needed to run the power park indicates that
100 kW is sufficient. In fact, for the first five years, the facility will be running at a power rate

16.6. Fuel Cell 220
much lower than 100 kW. This additional electricity not needed by Gen H Power Park could be
added to the 100 kW of electricity being sold to the grid, increasing profit margins. While this will
most likely be the case, the added benefit was not included in the economic analysis, keeping the
economic analysis conservative.
The other 100 kW will be sold to the local electric grid, at the present green electric rate
of $0.0865/kWh at a constant rate throughout the life cycle of this project. The documented
efficiency of the PEM fuel cell is 40%, but the actual efficiency of the PEM fuel cell in 2010 is
difficult to establish due to the technological advancements that will take place between now and
when this fuel cell becomes operational.3 The efficiency of the fuel would degrade if run at a lower
power output, but Gen H Power Park does not plan on this operation, as the grid provides an
infinite sink.
3This information was to given to us from the fuel cell manufacturer.
Chapter 17
Safety Analysis
Gen H considers safety to be of the foremost importance as a determining factor in the success of
Gen H Power Park. Today’s general public still harbors the misconception that hydrogen is unsafe,
particularly when compared with petroleum. In order to convince them that the hydrogen economy
is safe and has great potential, Gen H Power Park must convey a sense that the customers and
workers of Gen H Power Park can enjoy an accident-free environment. All production components
must operate safely at all times and storage tanks must be guarded and inspected regularly.
Accordingly, Gen H Power Park is created in such a way as to meet the standards and codes
established by widely-recognized organizations, such as ASME, NFPA, CGA, SAE, and ISO. The
relevant codes are listed in the appendix for reference.
Gen H employs Failure Modes and Effects Analysis (FMEA) to identify possible failure modes
and their consequences [259]. This method is comprehensive and allows for the ranking of failure
modes in order of significance. The results are then used to generate mitigation plans and improved
safety controls. Subsequently, performing Fault Tree analysis provides sensitivity analysis on
system performance before and after the mitigation and contingency plans are in place. All of
these efforts go towards making Gen H Power Park far safer for its workers and customers.
17.1 Failure Modes and Effects Analysis
Using FMEA effectively obtains a comprehensive list of failures for all components with relative
significance. In the analysis, the causes and effects of the failure modes are tracked along with
the probabilities and severity of the consequences. Since the effects of system failures on human
221
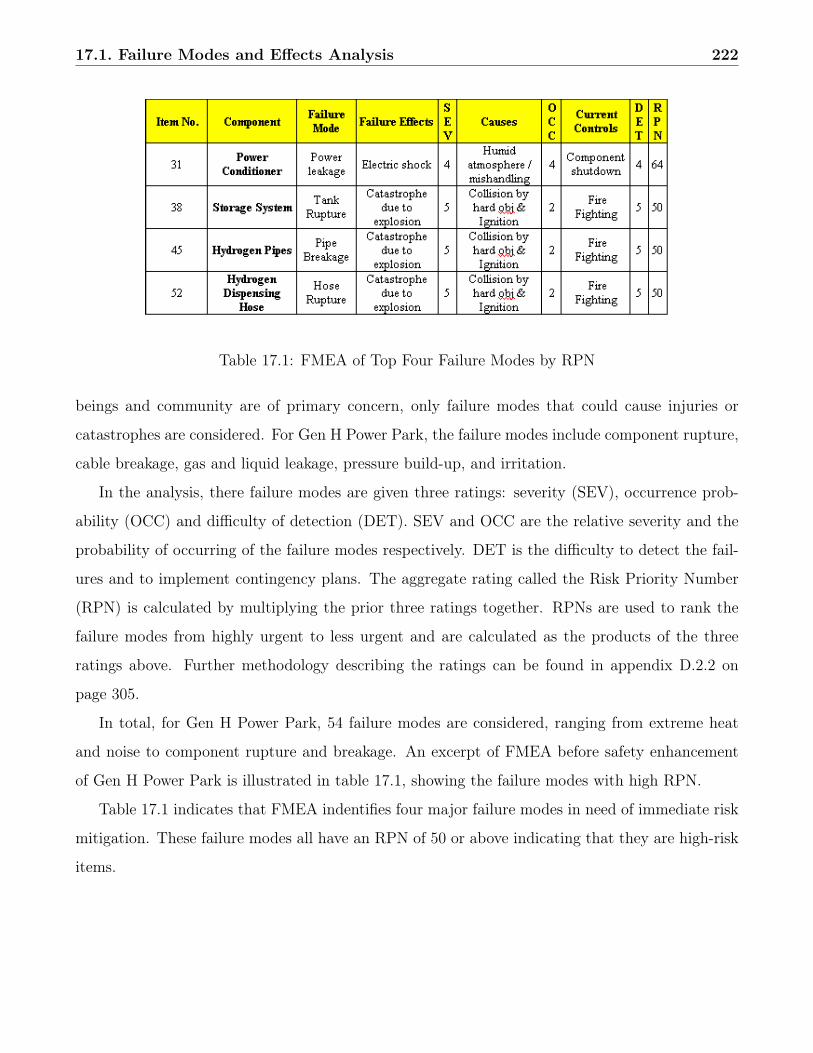
17.1. Failure Modes and Effects Analysis 222
Table 17.1: FMEA of Top Four Failure Modes by RPN
beings and community are of primary concern, only failure modes that could cause injuries or
catastrophes are considered. For Gen H Power Park, the failure modes include component rupture,
cable breakage, gas and liquid leakage, pressure build-up, and irritation.
In the analysis, there failure modes are given three ratings: severity (SEV), occurrence prob-
ability (OCC) and difficulty of detection (DET). SEV and OCC are the relative severity and the
probability of occurring of the failure modes respectively. DET is the difficulty to detect the fail-
ures and to implement contingency plans. The aggregate rating called the Risk Priority Number
(RPN) is calculated by multiplying the prior three ratings together. RPNs are used to rank the
failure modes from highly urgent to less urgent and are calculated as the products of the three
ratings above. Further methodology describing the ratings can be found in appendix D.2.2 on
page 305.
In total, for Gen H Power Park, 54 failure modes are considered, ranging from extreme heat
and noise to component rupture and breakage. An excerpt of FMEA before safety enhancement
of Gen H Power Park is illustrated in table 17.1, showing the failure modes with high RPN.
Table 17.1 indicates that FMEA indentifies four major failure modes in need of immediate risk
mitigation. These failure modes all have an RPN of 50 or above indicating that they are high-risk
items.
17.2. Risk Mitigation 223
17.2 Risk Mitigation
17.2.1 Power Conditioner
The main failure mode for power conditioner is power leakage. It occurs when the worker does
not follow the standard procedures or operates it with wet hands. When power leaks, the control
process requires the component to shut down completely. This causes downtime in production,
potential loss of customers as well as possible additional injuries to other workers. In order to
mitigate such risks and to reduce the significance of effects, the following controls are employed.
• Lockout / tagout procedures.
• The workers are required to wear insulating boots which prevent them from being grounded.
Plastic guards are placed on the power conditioner to prevent workers from touching the
conducting parts.
• In the event of power leakage, technicians will be deployed immediately to fix the components
in order to prevent further damage to the conditioner and to the workers.
• Safety procedures are enforced and the workers will need to take qualification exams to
become certified power conditioner operators or technicians.
With the above controls and preventive procedures, the OCC rating lowers to 3 and the DET
rating to 2.
17.2.2 Storage System
In the event of vandalism or a terrorist attack, the storage tanks could rupture and catch on fire
or explode if the tanks are hit hard enough and ignition occurs. It is important then to ensure
that preventative measures are in place such that the storage tanks can be protected from such
attacks. Otherwise, in the event of an attack, the sheer amount of hydrogen stored in tank could
create a massive explosion. The following preventive systems and procedures are used to improve
the safety of the tanks.
• Fire suppression systems are employed to prevent fire from spreading into the production
area (see the plan view on on page 210).
17.2. Risk Mitigation 224
• No Smoking, Highly Flammable, and Explosion Hazard signs are placed visibly in the storage
area and within Gen H Power Park.
• Ventilation to prevent buildup of hydrogen gas.
• Concrete walls surround the storage tanks to prevent non-workers from accessing the storage
tanks.
• In the event of unauthorized entry to the storage area and breakage due to vandalism or
terrorism, an alarm system will go off, notifying the police department automatically.
• All equipment should be Ex rated1 or intrinsically safe for explosion protection and spark
free operation [260].
With the above controls and preventive procedures, the OCC rating lowers to 1 and the DET
rating to 2.
17.2.3 Hydrogen Pipes and Dispensing Hoses
Hydrogen pipes and dispensing hoses are exposed to similar risks as the storage system. In addition
to those risks mentioned in section 17.2.2, additional accidents could occur, breaking the pipes.
The following approaches are taken to improve safety.
• Pipes are built underground to minimize exposure.
• The monitoring system is equipped with pressure gauges, shutting off valves to prevent
further leakage in the event of breakage or rupture.
• The dispensing system is equipped with an alarm directly connected to the police department
to stop vandalism.
Both OCCs are lowered to 1 and DETs to 2. After the new safety system is employed, the FMEA
is updated with new data (table 17.2).
1Based on the safety rating in the Automotive handbook.
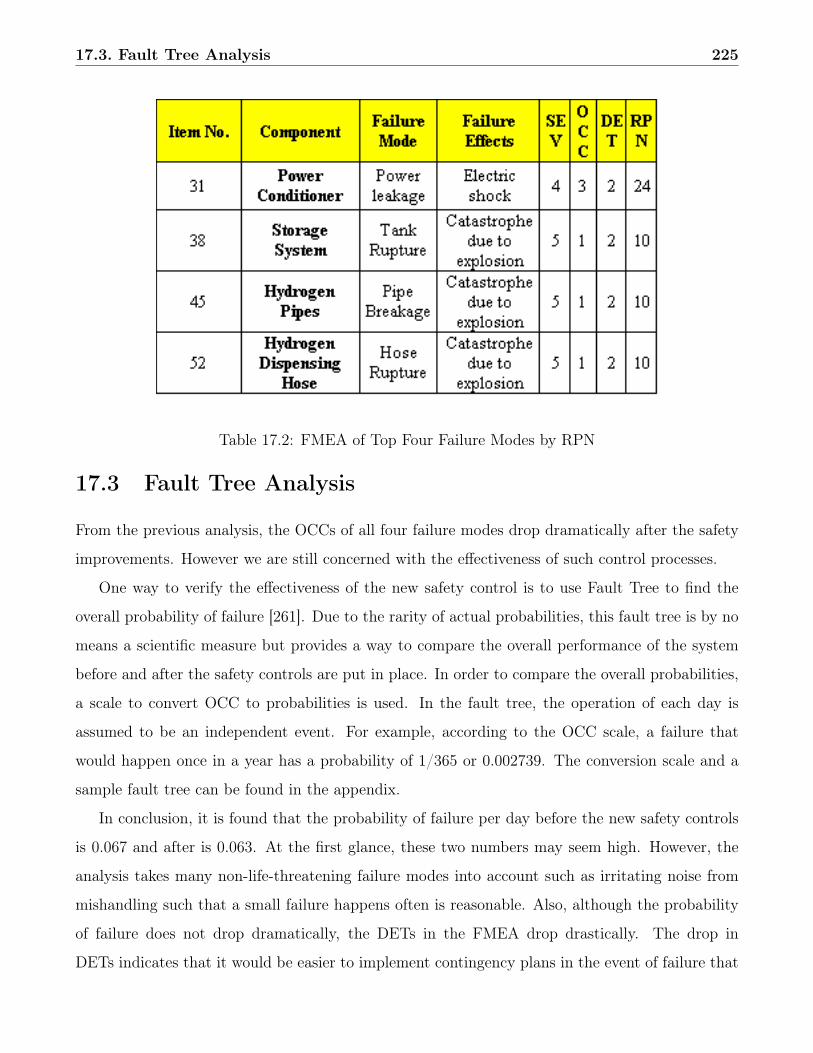
17.3. Fault Tree Analysis 225
Table 17.2: FMEA of Top Four Failure Modes by RPN
17.3 Fault Tree Analysis
From the previous analysis, the OCCs of all four failure modes drop dramatically after the safety
improvements. However we are still concerned with the effectiveness of such control processes.
One way to verify the effectiveness of the new safety control is to use Fault Tree to find the
overall probability of failure [261]. Due to the rarity of actual probabilities, this fault tree is by no
means a scientific measure but provides a way to compare the overall performance of the system
before and after the safety controls are put in place. In order to compare the overall probabilities,
a scale to convert OCC to probabilities is used. In the fault tree, the operation of each day is
assumed to be an independent event. For example, according to the OCC scale, a failure that
would happen once in a year has a probability of 1/365 or 0.002739. The conversion scale and a
sample fault tree can be found in the appendix.
In conclusion, it is found that the probability of failure per day before the new safety controls
is 0.067 and after is 0.063. At the first glance, these two numbers may seem high. However, the
analysis takes many non-life-threatening failure modes into account such as irritating noise from
mishandling such that a small failure happens often is reasonable. Also, although the probability
of failure does not drop dramatically, the DETs in the FMEA drop drastically. The drop in
DETs indicates that it would be easier to implement contingency plans in the event of failure that
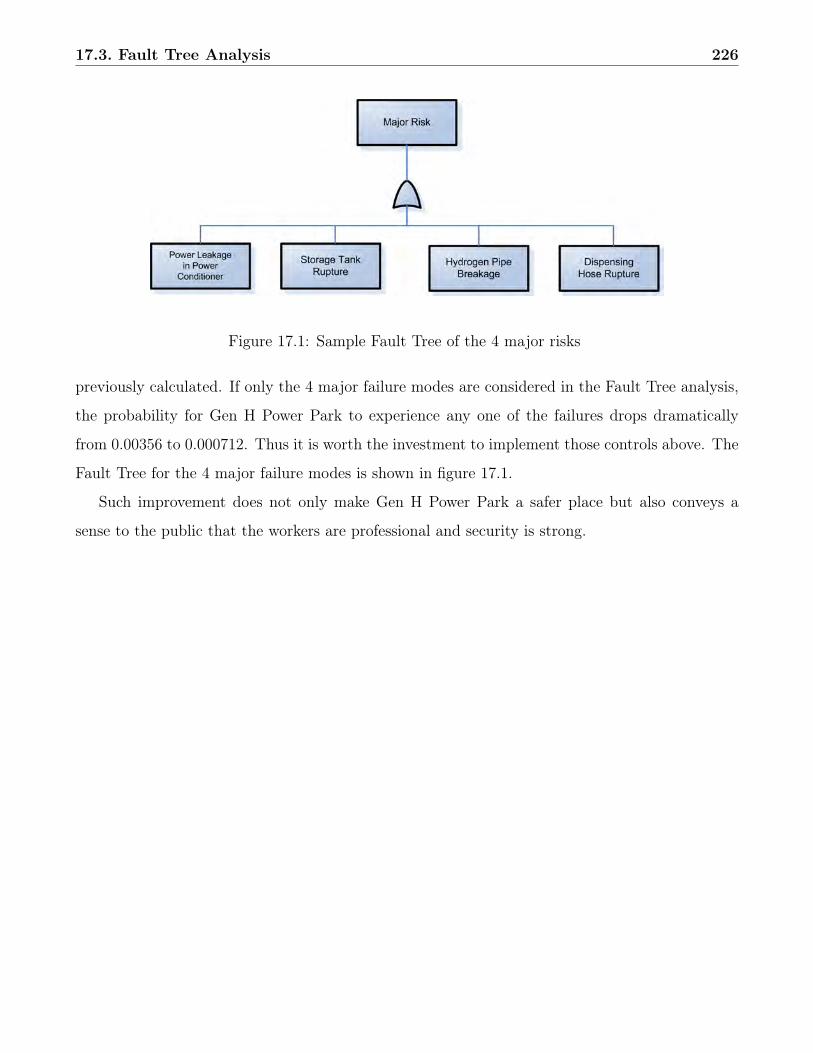
17.3. Fault Tree Analysis 226
Figure 17.1: Sample Fault Tree of the 4 major risks
previously calculated. If only the 4 major failure modes are considered in the Fault Tree analysis,
the probability for Gen H Power Park to experience any one of the failures drops dramatically
from 0.00356 to 0.000712. Thus it is worth the investment to implement those controls above. The
Fault Tree for the 4 major failure modes is shown in figure 17.1.
Such improvement does not only make Gen H Power Park a safer place but also conveys a
sense to the public that the workers are professional and security is strong.
Chapter 18
Economic Analysis
A primary goal of Gen H Power Park is to demonstrate the economic feasibility of a key com-
ponent of the hydrogen infrastructure. Since hydrogen production for vehicular use is at initial
development stage, capital costs of equipments represent a major concern in the economic model.
Costs are minimized wherever possible by comparing devices from different vendors and revenue is
maximized by adding a convenience store to improve the business profitability. All costs are quoted
directly from vendors to give the most accurate data. The references for all the costs are included
in the appendix. Various costs and economic analyses are discussed in the following section.
18.1 Cost Structure
18.1.1 Capital Cost
Cost is split into capital cost and operating expenditure. All pieces of equipment are installed
before the inauguration of Gen H Power Park so that there is no capital cost incurred in 2010.
In order to expand Gen H Power Park to meet capacity, more components are purchased in early
2015, at the midway point of the power park’s expected life cycle. The components added in 2015
include a reformer, a PSA, a dispensing system, a hydrogen compressor, four hydrogen storage
tanks, as well as the core of the fuel cell. Incremental purchase lowers the front-loaded capital cost
before inauguration, while still meeting the expected demand.
227
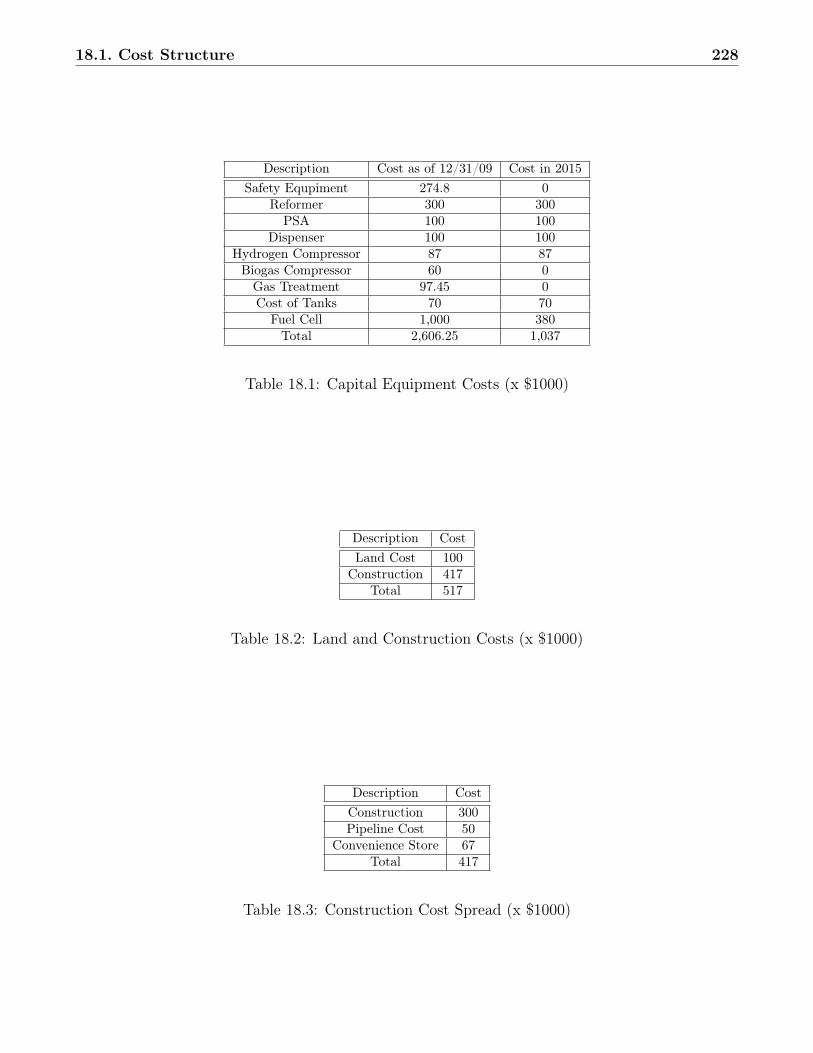
18.1. Cost Structure 228
Description Cost as of 12/31/09 Cost in 2015Safety Equpiment 274.8 0
Reformer 300 300PSA 100 100
Dispenser 100 100Hydrogen Compressor 87 87
Biogas Compressor 60 0Gas Treatment 97.45 0Cost of Tanks 70 70
Fuel Cell 1,000 380Total 2,606.25 1,037
Table 18.1: Capital Equipment Costs (x $1000)
Description CostLand Cost 100
Construction 417Total 517
Table 18.2: Land and Construction Costs (x $1000)
Description CostConstruction 300Pipeline Cost 50
Convenience Store 67Total 417
Table 18.3: Construction Cost Spread (x $1000)
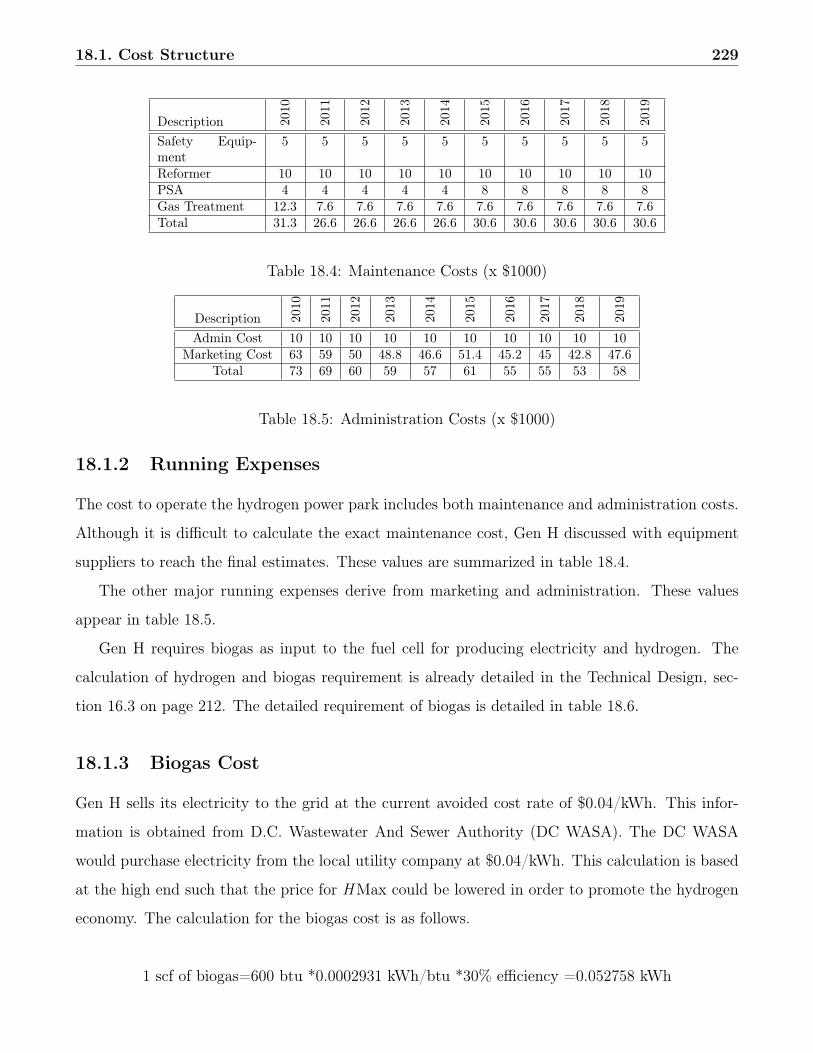
18.1. Cost Structure 229
Description 2010
2011
2012
2013
2014
2015
2016
2017
2018
2019
Safety Equip-ment
5 5 5 5 5 5 5 5 5 5
Reformer 10 10 10 10 10 10 10 10 10 10PSA 4 4 4 4 4 8 8 8 8 8Gas Treatment 12.3 7.6 7.6 7.6 7.6 7.6 7.6 7.6 7.6 7.6Total 31.3 26.6 26.6 26.6 26.6 30.6 30.6 30.6 30.6 30.6
Table 18.4: Maintenance Costs (x $1000)
Description 2010
2011
2012
2013
2014
2015
2016
2017
2018
2019
Admin Cost 10 10 10 10 10 10 10 10 10 10Marketing Cost 63 59 50 48.8 46.6 51.4 45.2 45 42.8 47.6
Total 73 69 60 59 57 61 55 55 53 58
Table 18.5: Administration Costs (x $1000)
18.1.2 Running Expenses
The cost to operate the hydrogen power park includes both maintenance and administration costs.
Although it is difficult to calculate the exact maintenance cost, Gen H discussed with equipment
suppliers to reach the final estimates. These values are summarized in table 18.4.
The other major running expenses derive from marketing and administration. These values
appear in table 18.5.
Gen H requires biogas as input to the fuel cell for producing electricity and hydrogen. The
calculation of hydrogen and biogas requirement is already detailed in the Technical Design, sec-
tion 16.3 on page 212. The detailed requirement of biogas is detailed in table 18.6.
18.1.3 Biogas Cost
Gen H sells its electricity to the grid at the current avoided cost rate of $0.04/kWh. This infor-
mation is obtained from D.C. Wastewater And Sewer Authority (DC WASA). The DC WASA
would purchase electricity from the local utility company at $0.04/kWh. This calculation is based
at the high end such that the price for HMax could be lowered in order to promote the hydrogen
economy. The calculation for the biogas cost is as follows.
1 scf of biogas=600 btu *0.0002931 kWh/btu *30% efficiency =0.052758 kWh
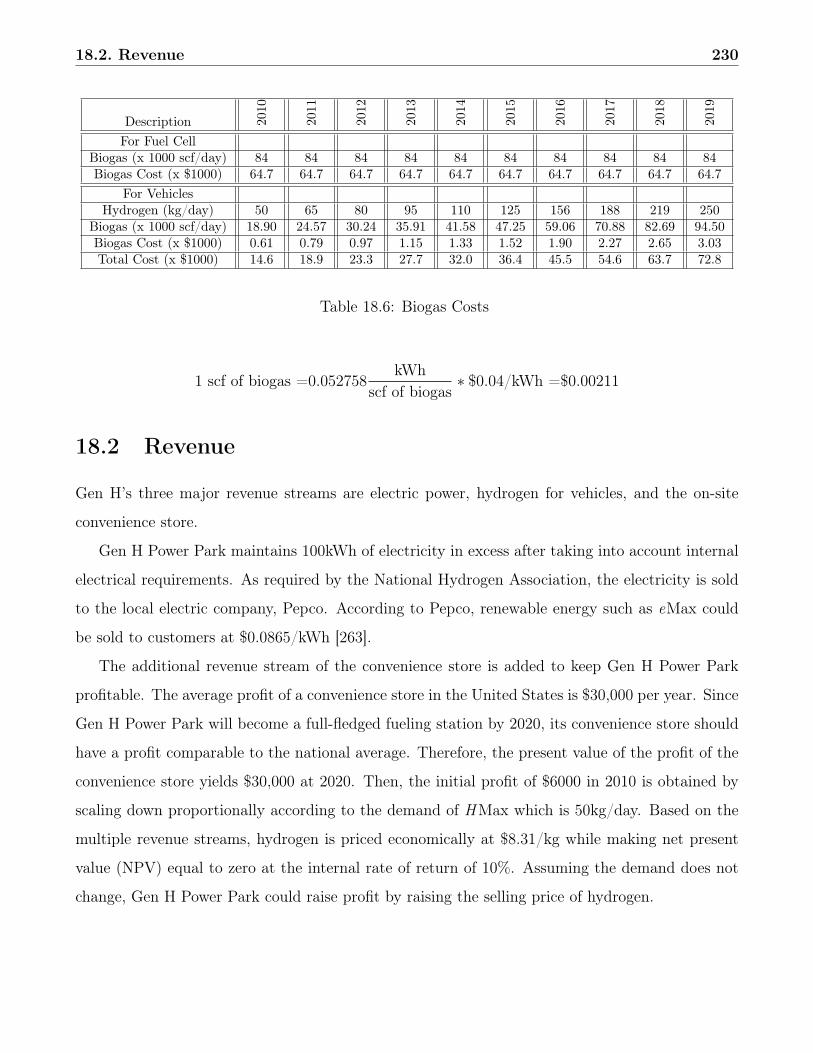
18.2. Revenue 230
Description 2010
2011
2012
2013
2014
2015
2016
2017
2018
2019
For Fuel CellBiogas (x 1000 scf/day) 84 84 84 84 84 84 84 84 84 84Biogas Cost (x $1000) 64.7 64.7 64.7 64.7 64.7 64.7 64.7 64.7 64.7 64.7
For VehiclesHydrogen (kg/day) 50 65 80 95 110 125 156 188 219 250
Biogas (x 1000 scf/day) 18.90 24.57 30.24 35.91 41.58 47.25 59.06 70.88 82.69 94.50Biogas Cost (x $1000) 0.61 0.79 0.97 1.15 1.33 1.52 1.90 2.27 2.65 3.03Total Cost (x $1000) 14.6 18.9 23.3 27.7 32.0 36.4 45.5 54.6 63.7 72.8
Table 18.6: Biogas Costs
1 scf of biogas =0.052758kWh
scf of biogas∗ $0.04/kWh =$0.00211
18.2 Revenue
Gen H’s three major revenue streams are electric power, hydrogen for vehicles, and the on-site
convenience store.
Gen H Power Park maintains 100kWh of electricity in excess after taking into account internal
electrical requirements. As required by the National Hydrogen Association, the electricity is sold
to the local electric company, Pepco. According to Pepco, renewable energy such as eMax could
be sold to customers at $0.0865/kWh [263].
The additional revenue stream of the convenience store is added to keep Gen H Power Park
profitable. The average profit of a convenience store in the United States is $30,000 per year. Since
Gen H Power Park will become a full-fledged fueling station by 2020, its convenience store should
have a profit comparable to the national average. Therefore, the present value of the profit of the
convenience store yields $30,000 at 2020. Then, the initial profit of $6000 in 2010 is obtained by
scaling down proportionally according to the demand of HMax which is 50kg/day. Based on the
multiple revenue streams, hydrogen is priced economically at $8.31/kg while making net present
value (NPV) equal to zero at the internal rate of return of 10%. Assuming the demand does not
change, Gen H Power Park could raise profit by raising the selling price of hydrogen.
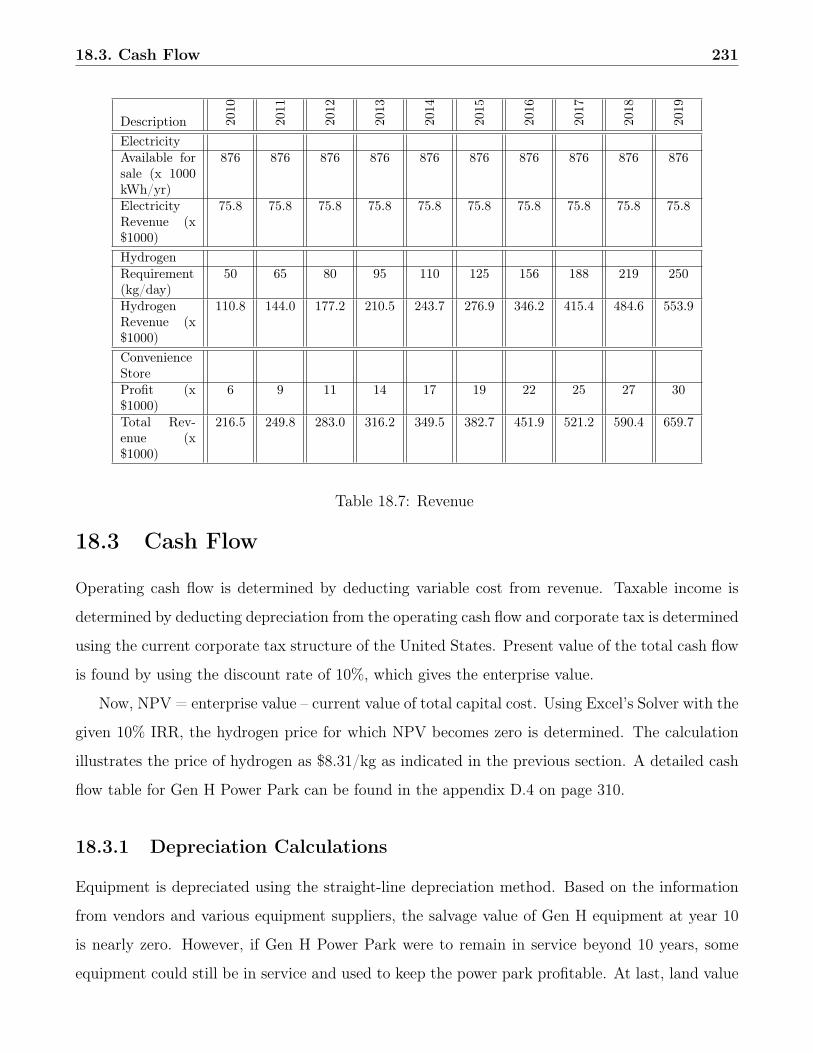
18.3. Cash Flow 231
Description 2010
2011
2012
2013
2014
2015
2016
2017
2018
2019
ElectricityAvailable forsale (x 1000kWh/yr)
876 876 876 876 876 876 876 876 876 876
ElectricityRevenue (x$1000)
75.8 75.8 75.8 75.8 75.8 75.8 75.8 75.8 75.8 75.8
HydrogenRequirement(kg/day)
50 65 80 95 110 125 156 188 219 250
HydrogenRevenue (x$1000)
110.8 144.0 177.2 210.5 243.7 276.9 346.2 415.4 484.6 553.9
ConvenienceStoreProfit (x$1000)
6 9 11 14 17 19 22 25 27 30
Total Rev-enue (x$1000)
216.5 249.8 283.0 316.2 349.5 382.7 451.9 521.2 590.4 659.7
Table 18.7: Revenue
18.3 Cash Flow
Operating cash flow is determined by deducting variable cost from revenue. Taxable income is
determined by deducting depreciation from the operating cash flow and corporate tax is determined
using the current corporate tax structure of the United States. Present value of the total cash flow
is found by using the discount rate of 10%, which gives the enterprise value.
Now, NPV = enterprise value – current value of total capital cost. Using Excel’s Solver with the
given 10% IRR, the hydrogen price for which NPV becomes zero is determined. The calculation
illustrates the price of hydrogen as $8.31/kg as indicated in the previous section. A detailed cash
flow table for Gen H Power Park can be found in the appendix D.4 on page 310.
18.3.1 Depreciation Calculations
Equipment is depreciated using the straight-line depreciation method. Based on the information
from vendors and various equipment suppliers, the salvage value of Gen H equipment at year 10
is nearly zero. However, if Gen H Power Park were to remain in service beyond 10 years, some
equipment could still be in service and used to keep the power park profitable. At last, land value

18.4. Conclusions 232
is assumed to appreciate at 10% per year with a terminal value of $259,374.
18.4 Conclusions
With HMax and eMax priced at $8.31/kg and $0.0865/kWh, Gen H maintains high profitability
while still meeting the production requirement set by National Hydrogen Association. Gen H has
great potential to keep its business beyond 2020 and remain profitable. Therefore, with Gen H
Power Park, the transition to the hydrogen economy shows great promise.
Chapter 19
Environmental Analysis
Production methods represent a determining factor in the success of hydrogen as an energy trans-
mission medium. Using fossil fuels such as natural gas or coal as feedstocks does not alleviate
the global warming effects and consumption of exhaustible reserves of carbon based energy. Gen
H Power Park produces hydrogen from products that would otherwise remain unused as waste,
preventing the entry of methane into the atmosphere, and reducing global warming effects.
A strength of Gen H’s design is its high environmental performance. Because the hydrogen
source is biosolids, no net CO2 is actually produced. Presently, Blue Plains AWTP creates waste
that must be disposed of in landfills. Gen H will work with Blue Plains AWTP so that the waste will
become valuable fertilizer and energy. While this will result in limited carbon dioxide emissions,
the net result will be much less than the amount produced by combustion of fossil fuels. The
sewage sludge processed by Blue Plains is highly suitable for fertilizer, as the anaerobic digestion
process serves to sterilize the product and concentrates nutrients, creating a closed loop cycle of
biomass usage.
19.1 Hydrogen Production Emissions
A major concern of Gen H Power Park is its carbon dioxide emissions. Carbon dioxide results from
two seperate stages in the hydrogen production process, as illustrated by figure 19.1. First, the
Power Swing Adsorber takes the biogas, composed of 40% CO2 and 60% CH4, and separates the
carbon dioxide from the usable methane. For every kilogram of hydrogen produced, 7.96 grams
of CO2 is extracted from the biogas. However, because the biogas is not a fossil fuel but instead
233
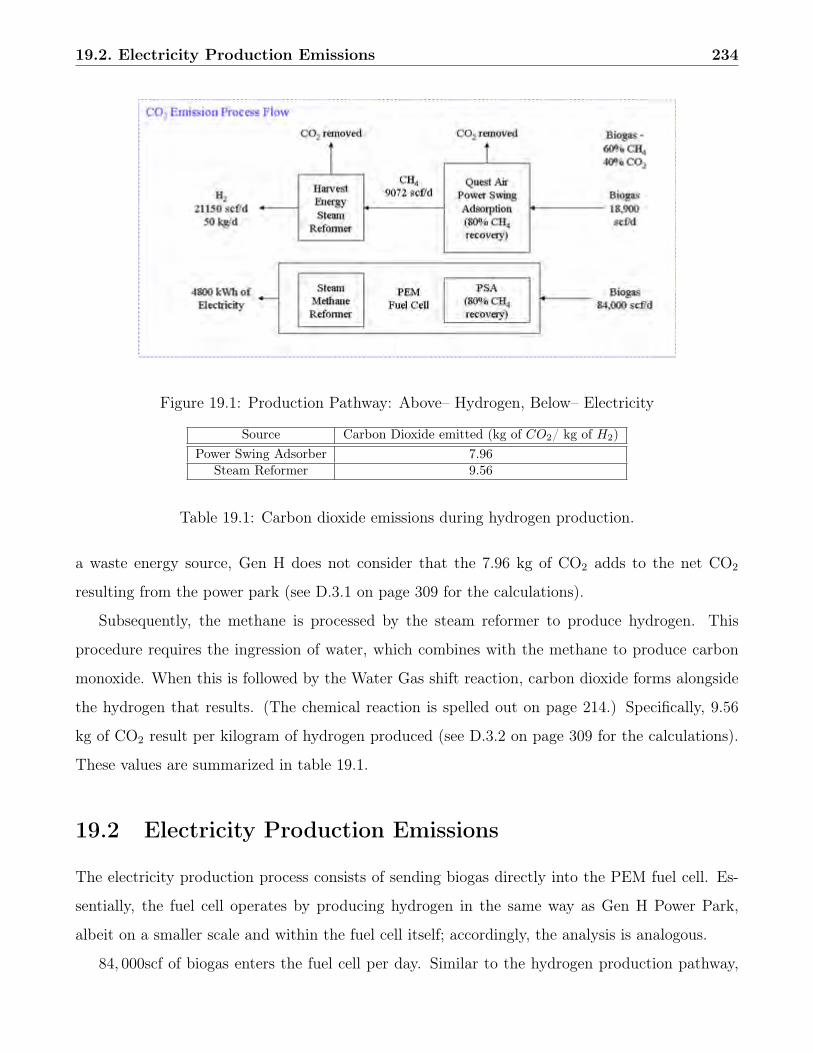
19.2. Electricity Production Emissions 234
Figure 19.1: Production Pathway: Above– Hydrogen, Below– Electricity
Source Carbon Dioxide emitted (kg of CO2/ kg of H2)Power Swing Adsorber 7.96
Steam Reformer 9.56
Table 19.1: Carbon dioxide emissions during hydrogen production.
a waste energy source, Gen H does not consider that the 7.96 kg of CO2 adds to the net CO2
resulting from the power park (see D.3.1 on page 309 for the calculations).
Subsequently, the methane is processed by the steam reformer to produce hydrogen. This
procedure requires the ingression of water, which combines with the methane to produce carbon
monoxide. When this is followed by the Water Gas shift reaction, carbon dioxide forms alongside
the hydrogen that results. (The chemical reaction is spelled out on page 214.) Specifically, 9.56
kg of CO2 result per kilogram of hydrogen produced (see D.3.2 on page 309 for the calculations).
These values are summarized in table 19.1.
19.2 Electricity Production Emissions
The electricity production process consists of sending biogas directly into the PEM fuel cell. Es-
sentially, the fuel cell operates by producing hydrogen in the same way as Gen H Power Park,
albeit on a smaller scale and within the fuel cell itself; accordingly, the analysis is analogous.
84, 000scf of biogas enters the fuel cell per day. Similar to the hydrogen production pathway,
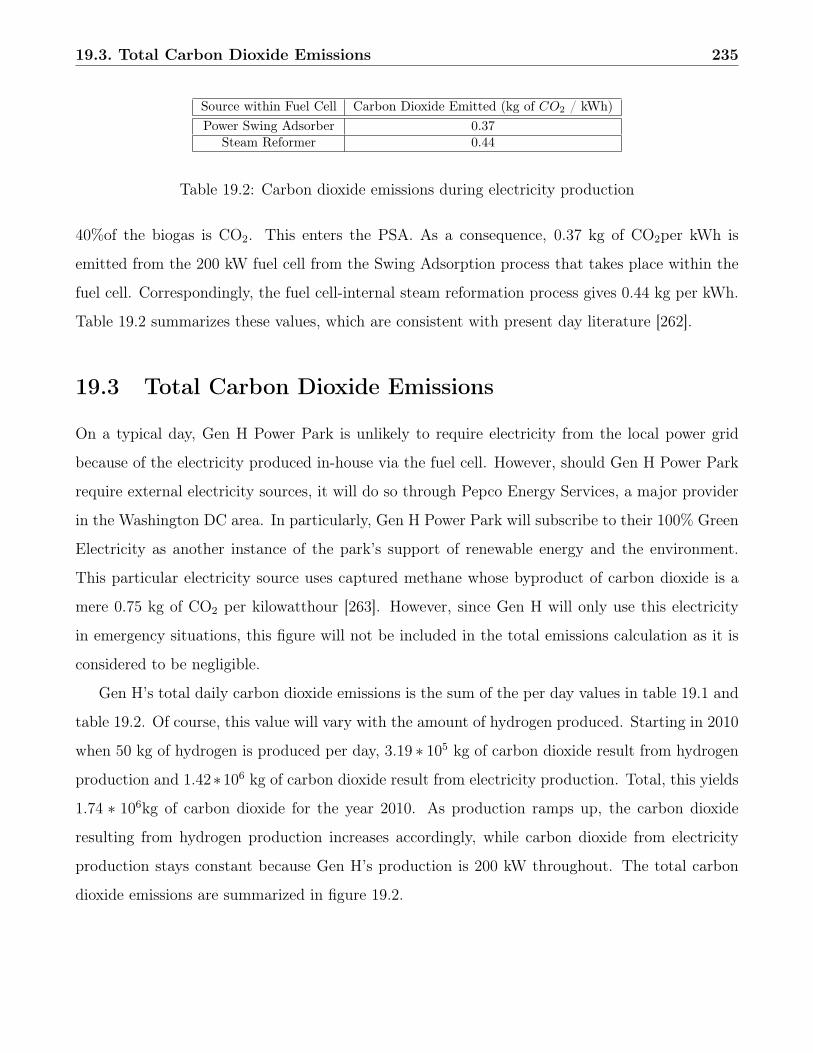
19.3. Total Carbon Dioxide Emissions 235
Source within Fuel Cell Carbon Dioxide Emitted (kg of CO2 / kWh)Power Swing Adsorber 0.37
Steam Reformer 0.44
Table 19.2: Carbon dioxide emissions during electricity production
40%of the biogas is CO2. This enters the PSA. As a consequence, 0.37 kg of CO2per kWh is
emitted from the 200 kW fuel cell from the Swing Adsorption process that takes place within the
fuel cell. Correspondingly, the fuel cell-internal steam reformation process gives 0.44 kg per kWh.
Table 19.2 summarizes these values, which are consistent with present day literature [262].
19.3 Total Carbon Dioxide Emissions
On a typical day, Gen H Power Park is unlikely to require electricity from the local power grid
because of the electricity produced in-house via the fuel cell. However, should Gen H Power Park
require external electricity sources, it will do so through Pepco Energy Services, a major provider
in the Washington DC area. In particularly, Gen H Power Park will subscribe to their 100% Green
Electricity as another instance of the park’s support of renewable energy and the environment.
This particular electricity source uses captured methane whose byproduct of carbon dioxide is a
mere 0.75 kg of CO2 per kilowatthour [263]. However, since Gen H will only use this electricity
in emergency situations, this figure will not be included in the total emissions calculation as it is
considered to be negligible.
Gen H’s total daily carbon dioxide emissions is the sum of the per day values in table 19.1 and
table 19.2. Of course, this value will vary with the amount of hydrogen produced. Starting in 2010
when 50 kg of hydrogen is produced per day, 3.19 ∗ 105 kg of carbon dioxide result from hydrogen
production and 1.42∗106 kg of carbon dioxide result from electricity production. Total, this yields
1.74 ∗ 106kg of carbon dioxide for the year 2010. As production ramps up, the carbon dioxide
resulting from hydrogen production increases accordingly, while carbon dioxide from electricity
production stays constant because Gen H’s production is 200 kW throughout. The total carbon
dioxide emissions are summarized in figure 19.2.
19.4. Net Carbon Dioxide Emissions 236
Figure 19.2: Total Carbon Dioxide Emissions
19.4 Net Carbon Dioxide Emissions
Gen H Power Park is carbon neutral. All of the carbon dioxide emitted by the power park is from a
fuel that is already in the waste stream, whose carbon content originally came from the atmosphere,
and not fossil fuels. So while the power park does give off CO2, this does not add carbon dioxide
to the atmosphere whose presence has not already been accounted for because the biogas comes
from anerobically digested wastewater. Because there are no net carbon dioxide emissions to the
atmosphere, Gen H Power Park compares favorably with its competitors, particularly those who
use fossil fuels.
The hydrogen generation demands thinking about problems in new ways as part of a world in
which it will no longer be possible to sweep the waste underneath the rug. Gen H does more than
look for different ways to hide its dirty business – Gen H puts it to good use. Starting in 2010,
one man’s trash will become another man’s clean energy.

Chapter 20
Marketing and Education
Due to the pioneering nature of hydrogen energy-generating technologies, Gen Hs marketing and
education plan aims to educate the public on the promise of hydrogen as the solution to many of
todays environmental and energy issues. Gen H considers the planets health as merely indistin-
guishable from its power parks purpose, thus forming a natural marketing tie – Gen H: Energy for
the Hydrogen Generation. This slogan incorporates hydrogen as the parks product but also as its
purpose: to usher in a new generation dedicated to preserving the earths resources.
Unfortunately, a high percentage of the population does not possess familiarity with the basic
concepts of hydrogen technologies. In order to ease this transition into an effective and accepted
implementation of the power park, the Gen H team has formulated an awareness, marketing and
education plan. This plan outlines the key focus areas and measures to build support, allay fears,
reduce resistance, and raise awareness of hydrogen in the D.C. area that will echo throughout the
nation. The plan includes two sections: Education and Public Awareness, and Marketing.
20.1 Education and Public Awareness
20.1.1 General Public
The Gen H team will contact Neighborhood Watch programs. Together, they can help to endorse
the hydrogen transition by holding regular meetings and open discussions for communities inter-
ested in learning more about hydrogen. Representatives from national agencies, such as the NHA
can visit them and guide their efforts. The Gen H team will financially support these visits. The
237

20.1. Education and Public Awareness 238
power park will hold town meetings with the local D.C. authorities and host open forums, where
citizens can express their concerns and voice their questions. This will help educate and reassure
the population that HMax and eMAx are a safe choice. Total 10 year budget: $86,400.
20.1.2 Academic Outreach
College Level
Gen H will advocate for universities to offer more advertised, encouraged, and even required
seminars and classes, i.e. “Alternative Energy Sources”. These will hold an open enrollment,
and can be taken for a letter grade or for the mere learning experience. This flexibility encourages
exploration and awareness among the students. Variable credit options can also be offered, with the
opportunity of independent projects and research papers. The existence of student and professional
organizations will aid with the implementation of this plan. Many non-profit organizations, such
as Engineers for a Sustainable World (ESW), can further transmit Gen H’s message in a structured
manner. With the cooperation of faculty and students, the Gen H team will form committees and
sponsor competitions dedicated solely to the hydrogen transition. Total 10 year budget: $42,000.
High School Level
Gen H will help institutions offer various elective modules focusing on hydrogen as an upcoming
energy source. Focused career path programs can be created for those interested in hydrogen
from a relatively early age in order to guide their educational efforts. A proactive setting and
educational environment will facilitate this support through hands-on activities, field trips, and
semester-long projects. These events will culminate in an end of the year science fair, where the
students can showcase their independent or group projects. Each respective school may apply for
funds from Gen H to reward those students who participate. Gen H will also provide them with
special recognition and certificates. Gen H will extend an invitation to professional organizations
to take part in the science fair. By being present at high schools, these organizations can begin
recruiting future members early and convincingly. Total 10 year budget: $42,000.
20.2. Marketing 239
Junior High School Level
Due to the brevity but high importance of this educational stage, Gen H’s programs will focus on
having on-site activities and plant tours that will help the kids become better acquainted with the
hydrogen technology and processes. The teenage years prove critical in developing young peoples
minds. By conveying a message of safety, reliability, and convenience, Gen H Power Park and the
hydrogen industry will benefit greatly. Total 10 year budget: $39,000.
Elementary School Level
At an early age, children must be stimulated and challenged to think creatively. Gen H will sponsor
annual coloring contests for children in grades 1st – 3rd and essay contests for children in grades 4th
– 6th to ignite this creativity. By providing the younger kids with drawings of hydrogen-related
scenes and their significance, they will become more familiar and comfortable with Gen H and
hydrogen use. The essays will serve the same function, as well as push for further thoughts and
curiosity among the childrens parents. Total 10 year budget: $50,000.
20.2 Marketing
• The production of GREEN Hydrogen will serve as the main point of Gen H’s marketing
campaign.
• Gen H will produce promotional videos. These will be offered for free or at a discount to
qualifying organizations such as ESW, Neighborhood Watch boards, and academic institu-
tions.
• Educational, appealing ads will appear in magazines, newspapers, and local TV stations.
• Most radio stations offer free public service announcements for non-profit organizations.
These will prove useful when promoting Gen H after forming partnerships with entities such
as the NHA. Total 10 year budget for the above: $100,000.
• Gen H will present proposals for toy lines to selected manufacturers, including Fisher Price.
These can be especially marketed at stores throughout the nation: Total budget: $20,000.

20.2. Marketing 240
Figure 20.1: H:can:2, HydroRanger
– Ages 3-10: HydroCities, the building block toy line, will be marketed towards this
age group. Different components such as trucks, stations, little people, and cars will
be produced and sold separately. Since all the components will be directly related to
hydrogen, collecting the different styles in order to build cities will promote the idea of
self-sufficient communities relying on hydrogen-generated energy. This will set the young
kids mindset of approval at an early stage. City-building contests will be held locally,
sponsored by Gen H, and winners will advance to a national showdown in Washington
D.C. Gen H will request dual sponsorship from the NHA for this event.
– Ages 10-15: Small scale models of robots, fuel cells, and other more technologically
advanced components will be offered for this age group. This will increase the childrens
familiarity and awareness with hydrogen technologies, and serves as a continuing toy
line following HydroCities.
– Gen H has developed a logo for the toy line, H:can:2, as well as a character, HydroR-
anger. (see figure 20.1)
• Gen H will submit a proposal to Lego Inc., requesting that they add a small hydrogen module
to their existing amusement park in San Diego, CA. This will make parents and youngsters
aware of the reliability, promise, and future of H2. Total budget: $7,500.
• Various proposals will be written to different video game manufacturers (i.e. Nintendo, Sony
Playstation, and Microsoft X-Box) to request for the development of new titles that include
sustainability and hydrogen energy as a theme. The extensive and diverse market of video
games will further extend the reach of Gen H’s marketing campaign. Total budget: $7,500.
• The H2 challenge: Total budget: $105,000.
– Gen H will invite the general public to the power park on a given day every month.

20.2. Marketing 241
– Some fuel cell vehicles will be on-site, and Gen H will help the visitors to become more
familiar and comfortable with them. This includes the opportunity to fuel the vehicles
themselves.
– Gen H will encourage the participants to drive the cars. Do they feel and perform the
same? Of course!
– Gen H will award prizes, including free fuel and discounts, to participants of the H2
challenge, especially to those who consider converting to hydrogen fuel and electricity.
– Gen H will hold a closing ceremony at one of the parks offices.
– FFM (Free Fuel for a Month) for owners of hydrogen-powered vehicles in the area.
• Total Plan Cost: $499,400

Part V
Conclusions
242
Chapter 21
Recommendations for Shell Gas & Power
Before the beginning of this project, the advisor of this project, Francis Vanek, approached the
Shell Hydrogen Washington D.C. project to generate a list of questions that were of interest to
Shell as part of the hydrogen transition. The four questions that were agreed upon are:
1. What are all the possible ways to generate hydrogen?
2. What can Non-Governmental Organizations (NGOs) do to support the transition?
3. What can be done to overcome the public’s concern about hydrogen?
4. Are government incentives really necessary?
In the course of this project we have stressed to examine each of these questions in detail. While wehave compiled the answers to the questions in this part, additional information about the specificresearch and analysis can be found in various chapters through this report.
21.1 Various Ways to Generate Hydrogen
There are a number of methods to produce hydrogen using a variety of sources. As part of theJapan Hydrogen Fuel Cell Demonstration Project (JHFC), the Japanese government has investi-gated many different types of hydrogen production methods and considers the following to be themost feasible. The JHFC has implemented stations that use naphtha reforming, LPG reforming,methanol reforming, electrolysis, de-sulfurized gasoline reforming, high-pressure hydrogen storageliquid-hydrogen storage, natural gas reforming, and petroleum reforming. A mobile station and a
243
21.1. Various Ways to Generate Hydrogen 244
facility for mass-producing liquid hydrogen from by-product gas (coke oven gas: COG) has alsobeen constructed.
In the naphtha reforming method, high-purity hydrogen gas is produced from naphtha withsteam reforming and pressure swing adsorption (PSA). This hydrogen gas is supplied to fuel cellvehicles as high-pressure gas. In the petroleum industry, companies are mass-producing hydrogenfrom petroleum product such as naphtha, removing sulfur and other impurities during the refiningprocess.
LPG reforming involves the use of LPG (mixed butane and propane (7:3) gas, odorized) toproduce hydrogen by steam reforming with PSA refinement. The hydrogen production equipmentfor the station is based on field-proven industrial technology for on-site hydrogen production byLP gas reforming. This equipment uses a small-size 6-tower PSA for reduced size and improvedefficiency. The dispenser for the station is easy-to-use precision equipment utilizing Nippon Sanso’sgas control technology.
Methanol reforming is appealing because Methanol is the safest of all the materials available forhydrogen production. Another benefit is that the reforming reaction for methanol can be carriedout at a relatively low temperature of 250 to 300◦C, compared with 600 to 700◦C for natural gas,and a smaller amount of energy is required to heart it and to hold it at that temperature. Stationsimplementing Methanol reforming evaporate methanol and water, then cause them to react witheach other through catalysts. After generation, hydrogen is separated and compressed to providefuel cell vehicles with the high-pressure hydrogen.
Currently, the most cost-effective method for hydrogen production involves reforming naturalgas. The production costs of this hydrogen production can be reduced because the infrastructurefor natural gas is already well organized. Accordingly, natural gas is thought of as a promisingfossil fuel for hydrogen production. Because all the facilities are vehicle-mountable, this station isexpected to serve as a full-fledged mobile hydrogen station. It will cover these areas which do nothave fixed hydrogen stations.
Kerosene, a liquid fuel low in volatility, has been considered a prospective fuel cell materialfor some time, being reasonably priced and with adequate infrastructure but it requires highlevel desulphurization and catalyst reforming technologies. Idemitsu Kosan Co., Ltd., throughlong years of research, has succeeded in producing hydrogen from kerosene by applying theirdesulphuring agent and catalyst reforming technology. The method of desulphurization is anadsorption desulphurization. Hydrogen is produced with vapor reform with PSA. The HadanoHydrogen Station, built and operated by Idemitsu Kosan, is the world’s first kerosene-reform-typehydrogen fueling facility, playing an important role in the popularization of fuel cell vehicles.
A mobile hydrogen station can be found in the premises of the Ministry of Economy, Trade andIndustry (METI) in Kasumigaseki, Chiyoda-ku, Tokyo. Each weekday morning, the componentsof this station are carried into the premises and assembled there; in the evening, they are moved
21.1. Various Ways to Generate Hydrogen 245
off of the premises. All the devices used, such as the hydrogen cylinders and dispensers (fillers),are combined into a single unit for easy transportation. This mobile hydrogen station is expectedto provide services outside the areas with fixed hydrogen stations. It is also expected to cover anarea where installation of a fixed hydrogen station is difficult because of restrictions imposed bythe Building Standard, High Pressure Gas Safety Law, and other current laws.
A facility for Manufacturing Liquid Hydrogen from Coke Oven Gas is currently operation inJapan. This facility represents the world’s first approach to mass-producing liquid hydrogen fromlarge quantities of by-product gas (coke oven gas: COG) generated in the steel making process.The plant can produce 0.2 tons of high-purity liquid hydrogen every day. In addition, they offerreduced cost of deployment by utilizing the existing steel making infrastructure. Advantages ofLiquid Hydrogen include its ability to be efficiently transportable and storable. In the currentJHFC Demonstration Project, an experiment is being conducted to investigate the full range ofsystem operations, starting with the transportation of manufactured liquid hydrogen and endingwith the supply of hydrogen to fuel cell vehicles.
Advancements in hydrogen production may be possible through electrolyzer technology. Withthis technology, hydrogen is produced through the electrolysis of water. Most of the cost of hydro-gen production by electrolysis is from the cost of electricity, and as most of the worlds electricity isproduced by the burning of fossil fuels, this entire exercise may seem counterproductive. However,economic ways to produce electricity from environmentally-friendly sources are currently beingresearched. For example, one transit company in California is using solar power to supplementgrid energy as a source of power for its electrolyzer.
Additionally, one effective way to produce hydrogen, investigated by our Power Park team,involves the use of biogas. Biogas can be obtained by anaerobically digesting the sludge createdby treating wastewater. Hydrogen obtained from this source is an ideal choice for as a productionmethod because of its environmental friendliness. Since the carbon present in biogas would bevented to atmosphere regardless of whether hydrogen is removed, the production of hydrogen frombiogas would effectively be carbon neutral, causing no net increase in the emissions of carbondioxide or carbon monoxide into the atmosphere. In the design of Gen H Power Park in theprevious section, the power park purchases biogas from Blue Plains AWTP to produce hydrogen.
Biogas is 60% methane and 40% carbon dioxide. Hydrogen is produced by stripping thehydrogen from the methane gas. The PSA process is required to harness pure methane, and isbased on physical adsorption of gases onto specialized beds of adsorbents. For example, the M-3200system from QuestAir employs six adsorber beds that are used in parallel to ensure a constantflow of product gas. Then, the methane-rich gas is fed into a reformer at about 150 psig using acompressor.
While there are several different ways to produce hydrogen from methane (or natural gas), themost cost-effective option is to utilize a steam methane reforming (SMR) process with subsequent
21.2. Possible NGOs’ Involvement in the Transition 246
pressure swing adsorption. For the Gen H Power Park design, a hydrogen generator from HarvestEnergy Technology, Inc. (HET) is incorporated to generate hydrogen from a pure stream ofmethane and input water through the following two chemical reactions.
CH4 + H2O −→ 3H2 + CO
CO + H2O −→ H2 + CO2
The first reaction takes the methane and combines it with steam to create hydrogen gas andcarbon-monoxide. The second reaction combines the carbon monoxide with the water to producemore hydrogen and carbon dioxide.
21.2 Possible NGOs’ Involvement in the Transition
The term Nongovernmental Organizations (NGOs) is an umbrella term that covers a range oforganizations that work in the public interest without being part of local, state, or federal gov-ernment. With increased organization and support, NGOs are now a major influence in nationaland world politics. NGOs have a wide palette, ranging from topics as diverse as international aidto protecting wildlife, and their actions can greatly influence public opinion and public policy1.With so much of the hydrogen transition dependent on these two aspects, it would be a mistaketo exclude them from consideration.
Three NGOs that have shown particular interest in hydrogen fuel cell vehicles are the SierraClub, the World Resources Institute, and the National Resources Defense Council. All haveenvironmental issues as part of their core mission, and have specifically addressed hydrogen asa fuel source. In addition, each has a variety of outlets, including newsletters, magazines, pressreleases, and extensive websites with which to get their message out to the public. Finally, eachhas a large office in Washington, DC, so a successful demonstration of the benefits of hydrogenthere could be very influential.
The Sierra Club is America’s oldest and largest grassroots environmental organization2. Sincetheir mission is mainly to protect our communities and the planet, they are most concerned withhydrogens ability to reduce emissions and consumption of fossil fuels. As such, they do not approveof great investment in hydrogen infrastructure now unless there are clean sources.
1http://www.ngowatch.org/2http://florida.sierraclub.org/central/Issues/iss_0305_hydrogen_society.htm
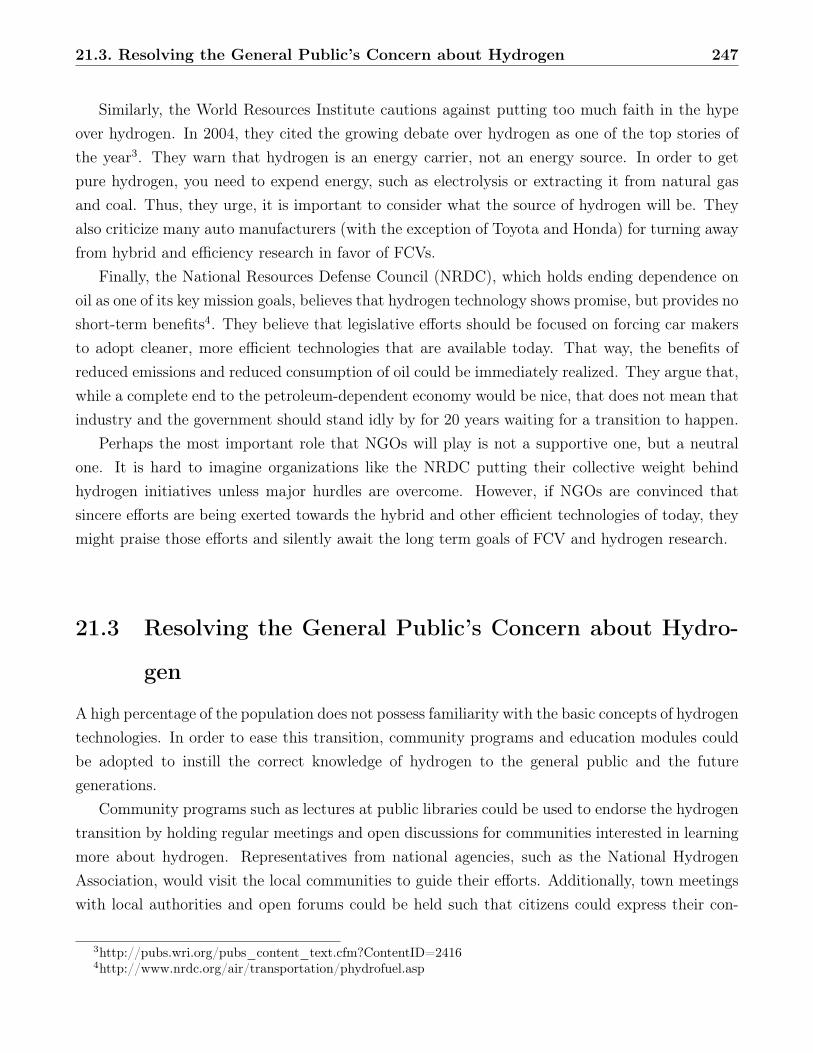
21.3. Resolving the General Public’s Concern about Hydrogen 247
Similarly, the World Resources Institute cautions against putting too much faith in the hypeover hydrogen. In 2004, they cited the growing debate over hydrogen as one of the top stories ofthe year3. They warn that hydrogen is an energy carrier, not an energy source. In order to getpure hydrogen, you need to expend energy, such as electrolysis or extracting it from natural gasand coal. Thus, they urge, it is important to consider what the source of hydrogen will be. Theyalso criticize many auto manufacturers (with the exception of Toyota and Honda) for turning awayfrom hybrid and efficiency research in favor of FCVs.
Finally, the National Resources Defense Council (NRDC), which holds ending dependence onoil as one of its key mission goals, believes that hydrogen technology shows promise, but provides noshort-term benefits4. They believe that legislative efforts should be focused on forcing car makersto adopt cleaner, more efficient technologies that are available today. That way, the benefits ofreduced emissions and reduced consumption of oil could be immediately realized. They argue that,while a complete end to the petroleum-dependent economy would be nice, that does not mean thatindustry and the government should stand idly by for 20 years waiting for a transition to happen.
Perhaps the most important role that NGOs will play is not a supportive one, but a neutralone. It is hard to imagine organizations like the NRDC putting their collective weight behindhydrogen initiatives unless major hurdles are overcome. However, if NGOs are convinced thatsincere efforts are being exerted towards the hybrid and other efficient technologies of today, theymight praise those efforts and silently await the long term goals of FCV and hydrogen research.
21.3 Resolving the General Public’s Concern about Hydro-
gen
A high percentage of the population does not possess familiarity with the basic concepts of hydrogentechnologies. In order to ease this transition, community programs and education modules couldbe adopted to instill the correct knowledge of hydrogen to the general public and the futuregenerations.
Community programs such as lectures at public libraries could be used to endorse the hydrogentransition by holding regular meetings and open discussions for communities interested in learningmore about hydrogen. Representatives from national agencies, such as the National HydrogenAssociation, would visit the local communities to guide their efforts. Additionally, town meetingswith local authorities and open forums could be held such that citizens could express their con-
3http://pubs.wri.org/pubs_content_text.cfm?ContentID=24164http://www.nrdc.org/air/transportation/phydrofuel.asp
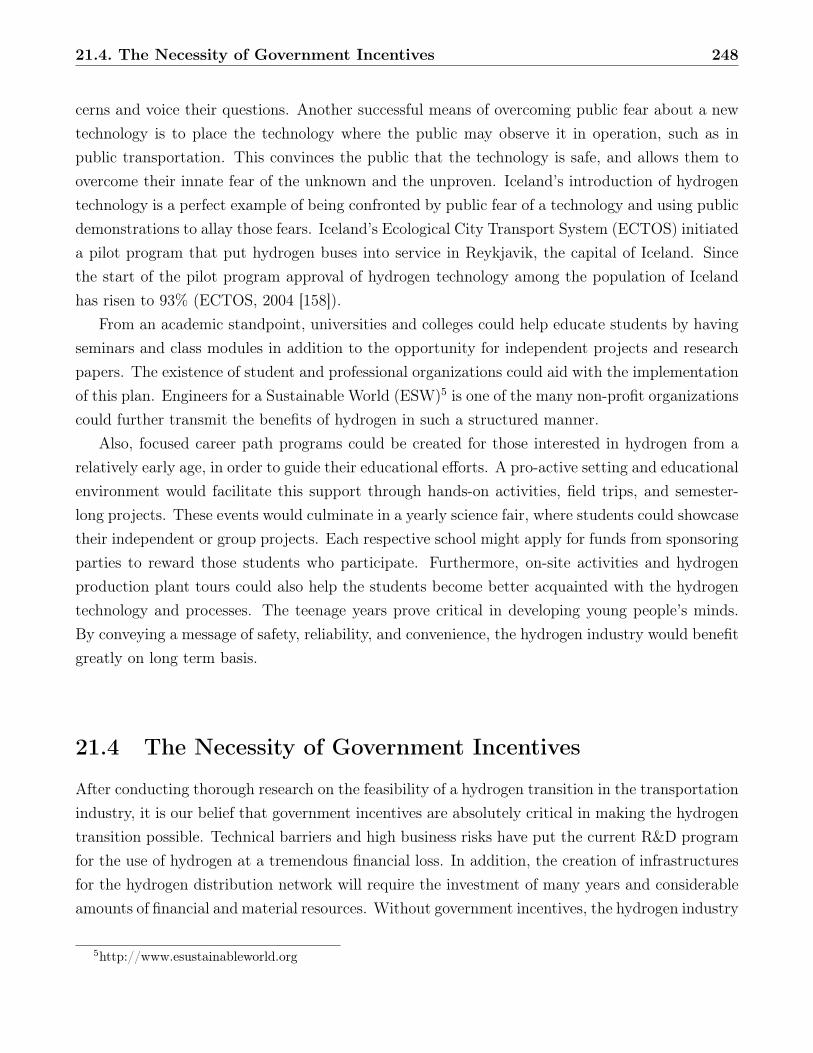
21.4. The Necessity of Government Incentives 248
cerns and voice their questions. Another successful means of overcoming public fear about a newtechnology is to place the technology where the public may observe it in operation, such as inpublic transportation. This convinces the public that the technology is safe, and allows them toovercome their innate fear of the unknown and the unproven. Iceland’s introduction of hydrogentechnology is a perfect example of being confronted by public fear of a technology and using publicdemonstrations to allay those fears. Iceland’s Ecological City Transport System (ECTOS) initiateda pilot program that put hydrogen buses into service in Reykjavik, the capital of Iceland. Sincethe start of the pilot program approval of hydrogen technology among the population of Icelandhas risen to 93% (ECTOS, 2004 [158]).
From an academic standpoint, universities and colleges could help educate students by havingseminars and class modules in addition to the opportunity for independent projects and researchpapers. The existence of student and professional organizations could aid with the implementationof this plan. Engineers for a Sustainable World (ESW)5 is one of the many non-profit organizationscould further transmit the benefits of hydrogen in such a structured manner.
Also, focused career path programs could be created for those interested in hydrogen from arelatively early age, in order to guide their educational efforts. A pro-active setting and educationalenvironment would facilitate this support through hands-on activities, field trips, and semester-long projects. These events would culminate in a yearly science fair, where students could showcasetheir independent or group projects. Each respective school might apply for funds from sponsoringparties to reward those students who participate. Furthermore, on-site activities and hydrogenproduction plant tours could also help the students become better acquainted with the hydrogentechnology and processes. The teenage years prove critical in developing young people’s minds.By conveying a message of safety, reliability, and convenience, the hydrogen industry would benefitgreatly on long term basis.
21.4 The Necessity of Government Incentives
After conducting thorough research on the feasibility of a hydrogen transition in the transportationindustry, it is our belief that government incentives are absolutely critical in making the hydrogentransition possible. Technical barriers and high business risks have put the current R&D programfor the use of hydrogen at a tremendous financial loss. In addition, the creation of infrastructuresfor the hydrogen distribution network will require the investment of many years and considerableamounts of financial and material resources. Without government incentives, the hydrogen industry
5http://www.esustainableworld.org
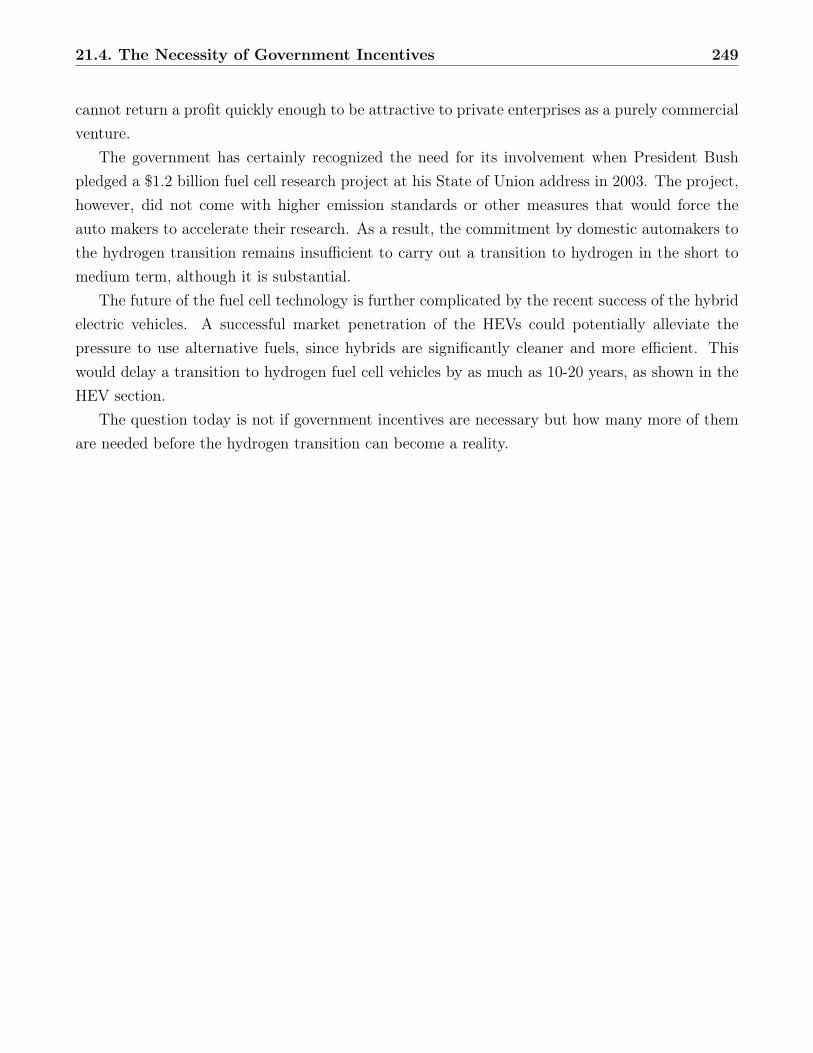
21.4. The Necessity of Government Incentives 249
cannot return a profit quickly enough to be attractive to private enterprises as a purely commercialventure.
The government has certainly recognized the need for its involvement when President Bushpledged a $1.2 billion fuel cell research project at his State of Union address in 2003. The project,however, did not come with higher emission standards or other measures that would force theauto makers to accelerate their research. As a result, the commitment by domestic automakers tothe hydrogen transition remains insufficient to carry out a transition to hydrogen in the short tomedium term, although it is substantial.
The future of the fuel cell technology is further complicated by the recent success of the hybridelectric vehicles. A successful market penetration of the HEVs could potentially alleviate thepressure to use alternative fuels, since hybrids are significantly cleaner and more efficient. Thiswould delay a transition to hydrogen fuel cell vehicles by as much as 10-20 years, as shown in theHEV section.
The question today is not if government incentives are necessary but how many more of themare needed before the hydrogen transition can become a reality.
Chapter 22
Project Conclusions
22.1 Findings and Results
22.1.1 HEV
We conclude that HEVs will fully penetrate the light vehicle market by 2080 at the latest, and assoon as 2030. This transition will significantly increase average light vehicle efficiency, leading todecreased energy and oil consumption, and reduced carbon dioxide emissions. Successful hybridpenetration will also delay fuel cell vehicle introduction by at least 10 years, since the expecteddecrease in oil consumption will ease the pressing need to find alternative fuels. Considering allaspects of the two transitions, we find that the hybrid path is more desirable than a direct path tofuel cell vehicles. We say this because the endpoint technology is more efficient, and the cumulativesavings in energy and carbon dioxide emissions are greater.
After lengthy investigation, we deem that government involvement is necessary for fuel cellvehicles to successfully enter the market in the next 30 years. We considered the technologicaland economic difficulties surrounding the transition, and assessed the associated costs. Using thegovernment’s current fuel cell roadmap, we determined that business incentives, pilot governmentfleets, educational programs, and further increased CAFE and emissions standards can help makethe hydrogen economy a reality.
22.1.2 HDV
In conclusion to our research and analysis, we believe that transit buses provide an ideal startingpoint for the hydrogen transition for numerous reasons. The size of transit buses allows them to
250
22.1. Findings and Results 251
more easily accommodate the bulky nature of prototype fuel cells and hydrogen storage tanks.Size is less of a limiting factor on larger vehicles, and the removal of size as a constraint on theprototype technology will enable it to develop more quickly. Also, the local, centralized, natureof transit bus fueling and maintenance greatly benefits early hydrogen technology, by reducingthe amount of money that must be invested to develop the infrastructure at the beginning of thetransition, and making use of shorter-range hydrogen technology as hydrogen storage issues areaddressed (Levin et al, 2001 [165]). Furthermore, the high profile nature of transit buses willhelp maximize the public’s exposure to hydrogen technology. Despite the fact that transit busesmake up only 1% of the total vehicles on the road, a disproportionately large number of peopleinteract with them each day. This makes transit buses an ideal way to raise awareness of hydrogentechnology. In addition, the majority of transit buses operate in high traffic urban areas wherepollution is a major issue, exactly the type of area where a zero-emissions technology is the mostvital and will be most appreciated (Eudy et al, 2001 [145]). Lastly, transit bus fleets are, in nearlyevery case, subsidized by the government at the local, state, or federal levels. This counteractsone of the traditional faults of a new technology, its extremely high initial price.
It is important to note that not all heavy duty vehicles are a suitable launch pad for thehydrogen transition. For example, intercity trucking is one of the worst possible areas to begin thehydrogen transition. Intercity trucks cover long distances per trip, and require a correspondinglylarge fueling and maintenance infrastructure to support their transits. Intercity trucking is also apurely commercial venture, meaning that cost is an overriding concern.
Therefore, we recommend launching the hydrogen transition through the creation of new pi-lot programs for hydrogen buses and the expansion of programs that are already in operation.Additionally, we recommend the promotion of bridge technologies such as Hythane or hydrogenICE buses in parallel with these pilot programs. These bridge technologies will help accelerate thegrowth of the hydrogen infrastructure. The combination of these programs will bring about thehydrogen transition in the quickest, most cost-effective way possible.
22.1.3 Gen H Power Park Design:
With the footprint of 21,000 sq. ft., Gen H Power Park is located at the southernmost tip ofShepherd Parkway, S.W, east of I-295 in Washington D.C.. It is designed to serve WashingtonD.C., Maryland, Virginia, and West Virginia Primary Metropolitan Area with an average distanceof 14 miles from population centers. Based on analysis using LOCATOR software, the location ofGen H Power Park is only 500 ft away from our energy source, Blue Plains Wastewater TreatmentPlant.
Blue Plains Wastewater Treatment Plant is the sole provider of biogas, a source of renewable
22.1. Findings and Results 252
energy. In order to meet the electricity and hydrogen requirements set by the National HydrogenAssociation, Gen H acquires 102,900 scf/day of bio gas in 2010 to 178,500 scf/day in 2020. Pro-ducing hydrogen, Gen H Power Park utilizes the Steam Methane Reforming process (SMR) withsubsequent pressure swing absorption because of its effective cost-saving property. The hydrogenharvested from the process is stored in a cascading storage system for dispensing. The storagesystem consists of 4 banks in which each bank stores 21kg of hydrogen at 6500 psig. Use of thelow-maintenance SMR system from Harvest Energy Technologies, along with other cost-savingsystems, enables Gen H to offer hydrogen at $8.31/kg for vehicle use.
The remaining biogas acquired from Blue Plains Wastewater Treatment Plant is fed into aProton Exchange Membrane (PEM) fuel cell for electricity generation to provide power for GenH Power Park, as well as the neighborhood it serves. The commercial viability, low maintenanceand operating costs of the PEM fuel cell help make Gen H Power Park economically competitiveover other designs. The cost of electricity that Gen H charges the public is $0.0865/kWh.
Another great advantage of Gen H Power Park is its low probability of accidents, enabling work-ers to enjoy a relatively accident-free environment. Failure Modes and Effects Analysis (FMEA)and Fault Tree analysis are used to identify 54 different failure modes, and to mitigate the 4modes most susceptible to accident occurrence. New safety measures and controls, such as spark-free equipment, insulating materials, and a security alarm system directly connected to policedepartment, are in place to effectively prevent Gen H Power Park from catastrophic failures andterrorism attacks.
From the community perspective, Gen H Power Park is designed to be environmentally friendly.Since the energy source is biogas, the only emission is CO2 from the power swing absorber and thesteam reformer. The total emission in 2010 is 1.74 ∗ 106g. However, the process is carbon-neutraldue to the fact that the input source is not fossil fuel, but biogas, which is renewable.
In order to promote the hydrogen economy, Gen H Power Park has to have a whole rangeof marketing and education plan. Academic modules are designed to instill hydrogen economyknowledge to different levels of education. Competitions such as H2 Challenge, toy lines with LegoInc., and free fuel coupons, along with other campaigns, will be used to educate the public abouthydrogen and increase sales of Gen H, the future of hydrogen economy.
22.1.4 Washington D.C. Rollout
A great deal of information and consideration is needed in order to implement a fully functionaland efficient network. Sources like census data and surveys of public opinion will be a necessity toensure success. Like any complex system, the network will not operate unless the users desires andbehavior are taken into account. Accurate demand projections and cooperation with automakers
22.2. Recommendations 253
will be a necessity. To maximize acceptance, the interface must be simple and as convenient aspossible. A good benchmark will be the most current gasoline technologies. Any sharp increase inthe time or complexity of the refueling process will only hinder public acceptance.
Studies suggest that the infancy of the hydrogen transition will take place within the currentgasoline infrastructure. Many of the major oil companies have already begun to anticipate thisswitch, and have conducted extensive research into the process of converting the industry from oilto natural gas and hydrogen. To begin with, a percentage of gasoline stations will have hydrogenpumps added to them. It is believed that this will enable customers to easily see the availabilityof hydrogen, while reducing the overall construction costs. Research suggests that an appropriatethreshold would be 10% of the gasoline stations in service. For the city of Washington, this isabout 11 stations.
The cost of this program is widely dependent on the capacity and design of the new stations.Larger capacity and on-site production stations will, in general, cost more than their off-site andsmaller companions. Cost will also be dependent on the time when the first stations are con-structed, and the development of hydrogen technologies at that time. This study has determinedthat an off site production station with a capacity of 500 Nm3/h in the year 2020 will cost between$1.2 million and $1.8 million, depending on the number being constructed and the current level oftechnology. At this level of investment, a selling price of $3.44/kg of H2 will result in a successfulbusiness model over a 15 year life cycle.
Overall success of the network will be determined by its ability to balance the two objectivesof reducing cost and increasing support for hydrogen fuel cell vehicle owners in the beginning.Over time, a successful network will allow users to easily locate stations at which they can quicklyrefuel. It will also have management of its growth such that expansion with demand will occur ina seamless way.
Without question, management is especially crucial in this phase of the hydrogen transition.Market forces alone can not be expected to facilitate the implementation of an effective network.One company can not be expected to manage the transition alone. The process will require thecooperation of many companies, and most likely, the council of governments for the Washington,DC area as well.
22.2 Recommendations
After completing our research, our group has determined a number of topics related to the hydrogeneconomy that could be researched further. These topic areas are as follows:
22.2. Recommendations 254
1. Economic and socio-political analysis of potential government incentive plans and their im-pact on the hydrogen transition.
2. In-depth research to determine U.S. cities that would be viable candidates for hydrogen-powered fleets, based on their proximity to sources of renewable energy and other factors.
3. Quantitative analyses of other fleet-based vehicles to determine if the transition to hydrogenpower is feasible.
4. In-depth analysis on the benefits of high-pressure hydrogen storage tanks and metal hydrides.
5. Refine and implement network simulation model to improve performance.
6. Obtain more accurate information pertaining to fuel cell cost, storage system cost, andbalance-of-system cost to improve accuracy of cost models.
7. Further exploration into alternative green sources of hydrogen production.
8. Examine requirements for national infrastructure, focusing on possible expansion of pilotprograms to satisfy these requirements.
9. Analysis of the American public’s perception to hydrogen as well as ways to improve aware-ness.
10. Detailed risk analysis and risk management plan for hydrogen infrastructure.

Chapter 23
Reflections
23.1 HEV
Nicole Kalb
My role in this project was a researcher on the Hybrid-Electric Vehicles (HEV) team. The HEVteam, consisting of Ghan, Peng, and myself, was organized very informally, with the team managercoordinating actions between the other teams. We all contributed equally to both the researchand the direction of the project, which helped gain buy-in. Our initial focus on planning andscheduling prevented us from spending too much time to any one topic, yet enabled us to guidethe direction of our research as the project progressed. I was also lucky enough to work with twoincredible teammates who were both very enthusiastic and dedicated to the project, and the groupbenefited from their consistent hard work throughout the fall semester and winter session.
Ghan Patel
When I decided to join this research group, I was both excited and curious. I had never been apart of a large scale research team, and had only classroom experience with the research tools wewould use: forecasting, modeling, simulation, to name a few. I found that our initial designs andresearch work were significantly altered by the time we reconvened during the winter. I supposeevery important journey involves retracing steps to find the best path to ones destination.
I learned a lot from this experience, and believe I got what I wanted out of it. I wanted todevelop my public speaking abilities, apply my classroom knowledge of analysis techniques, andlearn more about the world of alternative fuels. Every one of these goals was met and I feel that
255
23.2. HDV 256
the time and effort I spent for the group was not unrewarded.I enjoyed the company, friendship, and teamwork of my fellow group mates. They were all
hardworking, intelligent individuals eager to help and learn together. Managing the HEV teamwas made easy by having such cooperative and knowledgeable members as Peng Wei and NicoleKalb. Finally, our professor, Francis Vanek, gave us invaluable help and support. Without hisleadership and insight, our team would have floundered.
Peng Wei
My role as the project manager for the hydrogen transition team has been the most rewardingpart of my research experience. Throughout the project the team faced many hard decisions anddifficulties. I was extremely fortunate to be able to work closely with a group of highly intelligentand dedicated members.
Our hydrogen research was conducted through four individual teams. The Hybrid ElectricTeam investigated the impact of hybrid electric vehicles on the fuel cells. The Heavy Duty VehicleTeam focused on heavy duty vehicles such as fuel cell public transit buses. The Contest Teamresearched on hydrogen productions, and the Washington D.C. Team looked at the distribution ofhydrogen fuel in the D.C. areas. Each team was led by a team manager who oversees the overallprogress of the team.
Besides being a project manager, I was also a member of the HEV team. I conducted researchon the current battery technology, diesel technology and government policies. The other twomembers of the team are Ghan and Nicole and we worked very effectively as a team.
The most important lesson I learned from the project was how to build trust. The existenceof team trust was absolutely crucial in making a cohesive and productive working unit. The mosteffective way of building trust, I found, was to allow all team members to voice their visions andconcerns, and to give them plenty of autonomy in working as a team.
Everyone has weaknesses, yet with unquestionable trust and unselfish personal sacrifices wewere able to build a powerful team out of our finest strength and skills.
23.2 HDV
Frederic Bruneau
The HDV team consisted of Dan, Jon, and I. Dan was nominated as the team leader making Jonand I group members. I mainly worked on research of the Transition requirements for HDV such

23.2. HDV 257
as the infrastructure, reconfiguration, and future fuel cell technologies. Our team seemed to getalong really well. Dan delegated the work in a responsible matter, making sure me and Jon hadenough work but not too much. I felt that our team was well organized and that we scheduled ourwork in a timely fashion. Due to the loose structure of our team, we were able to get most of ourwork done ahead of schedule, which also enabled us to use our creativity. I learned that in projectmanagement it is important to know when to micro manage and when not to. At the start of theproject Dan did not feel necessary to micro manage our group, therefore letting us search for largeamounts of material on the internet. Toward the end of the project micro management helpedin order to meet the deadlines. I also felt that the communication between the groups was open,in such a way that any member from any group could request information without having to gothrough the team managers. The Friday evening happy hours also contributed to the cohesivenessof the individual teams as well as the entire project team.
Daniel Chituc
As the HDV team manager I would like to first and foremost thank Jon and Fred for being suchphenomenal team members. Our work would not have gone as smoothly, or been of as high quality,without you both. It has been a privilege to be your manager for this project.
With that said, I would like to discuss some of the more important lessons I feel I have learnedover the course of our work. The most worthwhile things I feel I have gained are those practicallessons that can only be learned by actually leading. First among these lessons is the need to knowthe tendencies and personalities of your team members and, as much as possible, match theseinnate abilities to the tasks that need to be done.
I also cannot emphasis enough the benefits of being more easy going and allowing your teammembers to guide their own work when possible. This will lead to both your team and yourselfbeing more relaxed and will instill a greater sense of team. Then, when the situation requiresa more authoritarian style of management the negative aspects of this style will hopefully bemitigated, as your team will understand it is the situation that requires the changes, and notcapricious or poor management. I feel it was this more than anything else that set the entire tonefor our teams interactions and made it such an enjoyable work environment.
Jon Leisner
My role in the HDV was that of a team member. In this role, I felt that the group had openand effective lines of communication with the group leader throughout the project. Tasks were

23.3. Washington D.C. Rollout 258
assigned fairly democratically, without complaint from any team member. The team was notmicro-managed, and I feel that this led to results being ahead of schedule, as members of the teamwere internally motivated to work, as opposed to being forced to work. I feel that this also led toour groups ability to fully learn about the material we were researching.
I think that the only thing we should have done differently would have been to take notes onthe materials that we had researched earlier and at intervals. It was extremely difficult for us toread and take notes on 125 documents in about 5 days to prepare for writing the paper. Perhapswe, as a group, could have managed this better.
I learned that there’s not much of a difference between the work ethic of a hard-working sailorand the work ethic of a graduate-level college student. Thus, the leadership skills that enable oneto lead sailors effectively, for instance, the ability to have trust in the talents of others, the abilityto delegate tasks effectively, and the ability to provide assistance and motivation, when needed,are also applicable in the project setting. I feel that the leaders in this project did a great job ofattempting to balance project tasks with the needs of the members of the project.
Lastly, I feel that the happy hours that were organized throughout the project did an excellentjob of helping to jell the nucleus of the team, particularly in January, when much of the grunt workhad to be accomplished. It was nice to interact with my fellow project members in a social setting,in order to understand the different cultures, backgrounds, and interests that were represented.This helped me gain an understanding of everyone’s talents and motivation, and I am certain thatothers in the group would agree with me.
23.3 Washington D.C. Rollout
Koji Akeno
I really enjoyed working for this project with our group members. We were self-motivated, dedi-cated and proactive. In collaboration with each other, all members devoted to the success of thisproject. We were always considerate for each other, leading to derive our excellent abilities fromeach. That is the most important thing that I have again realized. Another important thing is thatI have learned how to cope with unfamiliar matters in the project. I had anxiety to the project atthe beginning because I did not have any knowledge about hydrogen fuel. Through the project,I have developed skills for gathering and analyzing information. This project was a really goodopportunity to use our knowledge that I had acquired.
I was glad to introduce Japans hydrogen project to our project. I did not know Japan hasalready developed 9 hydrogen stations before I joined this project. Now that I noticed Japanese
23.3. Washington D.C. Rollout 259
auto manufacturers are eager to develop HFCVs as well. So, I hope that I will be the first to owna HFCV among our project members.
Dan Herstine
Kang, Koji and I worked together on the DC team. Though I didnt have any aspirations of being ateam leader, I was elected because I think Kang and Koji were unsure about their communicationskills and felt I could interact better with the other team managers and our advisor. Perhapsbecause of this, I made communication a top priority in my managerial duties. I quickly learned thevalue of understanding, and the consequences when it was absent. I tried to always be absolutelyclear in what I said and my team and I often engaged in open discussion to make sure that everyonewas on the same page. It was very important to me that I allow information to flow easily frommy team members to my fellow team leaders and the advisor. I hope very much that I succeededin at least this aspect of my management.
In the larger scheme, I felt that the group as a whole worked very well together. The atmosphereon the project as well as in the classes we shared was always one of openness and helpfulness. Itpains me to think that I might not see some of these people nearly as often in the office, as Ienjoyed the camaraderie as well as the extra support system. I think our advisor Francis can takesome credit for this, as he always stressed the importance of cooperativeness over competitivenessand friendliness over formality.
If I had the chance to redo the project, I would have done more detailed planning at thebeginning. While its hard to know what the final scope is going to be on such a dynamic project, Ifeel like we could have done a better job of anticipating some of the delays and getting some of themore tedious tasks out of the way before the winter session began. However, I am not disappointedat all in the final project that we presented. There were times when I was simply amazed at howdedicated and efficient my team could be. I feel like we did a fantastic job throughout, and I wouldwelcome the chance to work with Kang and Koji again.
Kang-Wei Hsiao
Our team is an international team; members come from different countries with the same passionfor our project. We worked together for moths and demonstrated the unrivaled esprit de corps fromstem to stern. As a staff in DC team, the best thing that worked well for me was communicationmechanism. Because of well communication, diversity in opinion became not an obstacle in the waybut an opportunity to the prime. Everyones ideas would be respected and discussed conscientiously;

23.4. Gen H Power Park 260
the sparkle of our team then kept flaming. Our team is really the one with self-motivation, efficiencyand competitiveness in a harmony atmosphere. I learned much not only from this project but alsofrom my teammates. Every time when we were together and discussing, I was so confident thatany problem would be gone and then new ideas popped up. This is a good example of how a globalteam in a project should work to success and I am glad to be part of it.
23.4 Gen H Power Park
Walter Chen
The Contest Team organized itself around the contest. Jason was named the team leader in chargeof communicating with the other groups. JJ handled most of the internal group management, doinga lot of work delegation and scheduling and the sort. Each team member was put in charge ofa particular subject area within the project. For instance, I was named Lead EnvironmentalAnalyst. Accordingly, a large part of my role was making sure that the environmental analysis wascompleted properly. However, I, like the other team members, also supported the leaders of othersections. I did some safety analysis research as well as contributing to the discussions surroundingthe technical design. Because of my proficiency with LATEX, I took charge of assembling the finaldocument, editing it for composition, and typesetting it according to the contest specifications.Generally, this worked out well for our team, as things proceeded smoothly.
However, some problems did present themselves. For example, while we each took charge ofseparate parts of the project, we oftentimes did not check over each others’ work. By the time wechecked things over, the project was nearing its deadline. In effect, this compounded the amountof work necessary to complete the project prior to the deadline. In terms of what I would havedone differently for next time – I would have more vigorously tried to meet our schedule whichindicated that we were to be completely done with research prior to Christmas break. Then, wewould have had all of the winter session to polish up our final product.
Learning from one’s mistakes is an important part of management. Per the statements above,I have indicated a few mistakes, which I should not like to repeat. As far as people are concerned– it is easy to work with people who are as highly self-motivated and intelligent as my power parkcolleagues. However, even then, such people (including myself) need a kick in the pants.

23.4. Gen H Power Park 261
Perla Lastra
The team was sub-divided into 5 focus areas: Technical Design, Environmental Analysis, EconomicAnalysis, Marketing & Education, and Safety Analysis. Though we all collaborated with ideas andresearch in these areas, I was in charge of the Marketing & Education Plan as well as a section inthe Technical Design regarding the power parks location.
All team members were dedicated and open to suggestions, willing to be flexible and adapt tosituations as needed. We worked effectively together.
Planning out the necessary project tasks more thoroughly would have saved some time as wellas provided more direction in critical moments. Time is of the essence in this particular project,since the National Hydrogen Association contest deadline is a crucial two weeks before the finalM Eng. group deadline. Never underestimate the time it takes to compile a final version of thereport.
It is always challenging to juggle the many classes and commitments of a group’s members in or-der to find appropriate meeting times, work methods, and measures of performance. Nevertheless,the effort can be very rewarding if done so properly.
This project is highly inter-disciplinary. It offers great opportunities in systems engineering,project management, business administration, and performance analysis.
Jason Leung
Being a team leader for the contest team, my role had several functions. In terms of the GenH Power Park design, I was in charge of the safety analysis and assisted in technical designand economic analysis. From a project management perspective, I had to ensure all the designrequirements were met, designated roles to members according to interests and strengths andmade sure the team was on track. Managing the team gave me a good experience of how the teamdynamics works and how to influence people without using authority.
As a team, we had a very diverse group of members in terms of interests and majors. Thediversity helped us accomplish all parts of the design. Although there were conflicts in dealingwith technical designs and formatting, all obstacles were overcome peacefully and objectively. Ifwe were given another chance, we should finish all the research and to start the write-up earliersuch that we would not have to stress at the late stage of the project. The most important thingthat I learned was listen to all opinions from all members and pick the best option for the team.When a member had a concern, he or she should let the whole group know such that the groupcould acknowledge it and make corresponding accommodation.
After all, I would like to thank my team for being such a good team striving for the same goal.

23.4. Gen H Power Park 262
Joseph W. Schwarz IV
The Gen H Power Park design team was organized into the five different areas. I was in charge ofthe Technical Design portion of the power park design. While, each of us was put in charge of acertain section, everyone participated in all aspects of the report.
We worked well with each other and seemed to really share ideas and research amongst thegroup well.
I think we should have worked a little earlier in the process. We should have afforded moretime and effort in contacting manufacturers as well as looking at the different parts of the report(economic, safety, and environmental) earlier in the process.
The most important thing about a project like this is getting a good schedule and plan togetherand then work the plan. We could have done a better job at this, saving us a lot of headache laterin the project.
Everyone has a their own ideas about how certain things should be done, and as a group youhave to get the ideas out on the table so the group can acknowledge them.
Overall, I thought this was a really good project. The team interactions and transitions couldhave been smoother. I would recommend this project to anyone who is interested in applying amultitude of systems engineering skills to a project.
Bibliography
[1] School of Civil and Environmental Engineering http://www.cee.cornell.edu
References for the Hybrid Electric Vehicles
[2] Brooke, Lindsay (2004). Despite Challenges, Hybrids are a Bridge to FCVs. HydrogenForecast: The Hydrogen Economys Leading News Source. Website, available on-line athttp://hydrogenforecast.com/JulyArticles/hfc_csmcolumn071504.html. Accessed January 22,2005.
[3] Looper, Mark (2004). Alternative Drivetrains. Website, available on-line athttp://www.altfuels.org/backgrnd/altdrive.html. Accessed January 22, 2005.
[4] Morrison, David G. and L. Eccles (2001). Construction and Classificationof Hybrid-Electric Vehicles. Electronic Design. Website, available on-line athttp://www.elecdesign.com/Articles/ArticleID/4331/4331.html. Accessed January 22,2005.
[5] U.S. Department of Energy: Office of Energy Efficiency and Renewable Energy(2004). How do Hybrid Electric Vehicles Work? Website, available on-line athttp://www.fueleconomy.gov/feg/hybridtech.shtml. Accessed January 22, 2005.
[6] U.S. Department of Energy: Office of Energy Efficiency and Renewable Energy (2004).Technology Snapshot Featuring the Honda Civic Hybrid. Website, available on-line athttp://www.transportation.anl.gov/pdfs/HV/257.pdf. Accessed January 22, 2005.
[7] American Council for an Energy Efficient Economy (2005). Vehicle Fuel EconomyStandards: Big Energy Savings at a Modest Cost. Website, available on-line athttp://www.aceee.org/energy/cafe.htm. Accessed January 21, 2005.
[8] Bamberger, Robert. (2002). Automobile and Light Truck Fuel Economy: TheCAFE Standards. Almanac of Policy Issues. Website, available on-line athttp://www.policyalmanac.org/environment/archive/crs_cafe_standards.shtml. AccessedJanuary 21, 2005.
[9] Davis, Stacy and Susan Diegel. U.S. Department of Energys Transportation Energy Data Book(Edition 24, 2004). Website, available on-line at http://www-cta.ornl.gov/data/Index.html.Accessed January 21, 2005.
263
Bibliography 264
[10] University of California, Santa Barbara (2004). Useful Information About the Earth.Website, available on-line at http://oceanography.geol.ucsb.edu/AWP/Class_Info/GS-4/a_s2003/resources/Appendix-Info%20re%20Earth.htm. Accessed January 21, 2005.
[11] Ross, M., R. Goodwin, & R. Watkins (University of Michigan), M. Q. Wang (Argonne NationalLaboratory) and T. Wenzel (Lawrence Berkeley Laboratory), Real-World Emissions from ModelYear 1993, 2000 and 2010 Passenger Cars, distributed by the American Council for an Energy-Efficient Economy, November 1995.
[12] Thomas, C.E. (2003). Hydrogen-Fueled Vehicles: Hybrids vs. Fuel Cells. Presented to theInternational Vehicle Technology Symposium on Climate Change, March 11-13, 2003.
[13] Fuel Injection History. 2004. <http://ca.autos.yahoo.com/maintain/fuel_injection_answer1.html>
[14] Associated Press. US Sales of Hybrid Cars Rise. Billings Gazette. May 9, 2004. Jan 16, 2005.<http://www.billingsgazette.com/index.php?id=1&display=rednews/2004/05/09/build/business/60-hybrid-cars.inc>
[15] Lazarony, Lucy. Hybrid Car Sales Heat Up. Bankrate.com. Jan 16, 2005.<http://www.bankrate.com/brm/news/auto/20030507a2.asp>
[16] Sharp Increase Expected on US HEV Sales. International Energy Agency. November, 2003.Jan 16, 2005. <www.vtt.fi/virtual/hevannex1/news/news_november_20031.htm>
[17] Triangular Distribution. Wolfram Research. Jan 16, 2005.<http://mathworld.wolfram.com/TriangularDistribution.html>
[18] Rusert, Beth and Jennifer Larson. SUV and Truck Owners Rarely Consider Gas Mileage whenPurchasing Vehicles. Maritz Inc. <http://www.maritz.com/maritz-gas-mileage.html>
[19] Malloy, Tim. Worlds Strictest Emissions Standards. Seattle Post-Intelligencer. September 29,2004. <http://seattlepi.nwsource.com/national/192409_emissions25.html>
[20] Barbassa, Julia. Automakers Sue over Californias Tough Ve-hicle Emissions Rules. Philadelphia Inquirer. Dec 8, 2004.<http://www.philly.com/mld/philly/business/personal_finance/10365411.htm?1c>
[21] Other States may Follow Calif. on GHG Emissions. June 11, 2004. Italladdsup.gov.<http://knowledge.fhwa.dot.gov/cops/italladdsup.nsf/0/638329e56c55cb9b85256eb000830bf1?OpenDocument>
[22] Air Quality: Vehicle Emissions and Air Quality. Idaho Department of Environmental Quality.Jan 16 2005. <http://www.deq.state.id.us/air/prog_issues/pollutants/vehicles.cfm>
[23] Autobytel Consumer Choice: Data for Second Quarter Shows Strong ShiftToward Smaller, More Fuel-Efficient Cars. Autobytel.com. July 6, 2004.<http://www.autobytel.com/content/home/help/pressroom/pressreleases/index.cfm?id=4;ABTL&action=template&ArticleID=139365>
Bibliography 265
[24] 2003-2004 Cornell Engineering Management Hydrogen Team Research Paper. Cornell Univer-sity, 2004.
[25] Sperling, Daniel and James S. Cannon. The Hydrogen Energy Transition. Elsevier AcademicPress, Burlington MA. 2004.
[26] Parry-Hill, Matthew, Robert Sutter and Michael Davidson. Hydrogen Fuel Cell Basics. Molec-ular Expressions. Jan 16, 2005. <http://micro.magnet.fsu.edu/primer/java/fuelcell/>
[27] Mikkola, Mikko. Fuel Cells. Helsinki University of Technology. 2002. Jan 16, 2005.<http://www.hut.fi/Units/AES/projects/renew/fuelcell/posters/fuelcells.html>
[28] How It Works. FCHV Basics. Toyota MC. Jan 16 2005.<http://www.toyota.co.jp/en/special/fchv/fchv_2.html>
[29] Damen, Kay, Martijn van Troost, André Faaij, and Wim Turkenburg. An Integral Comparisonof Hydrogen and Electricity Production Systems. Copernicus Institute, Dept. STS, UtrechtUniversity. Jan 16, 2005. <http://uregina.ca/ghgt7/PDF/papers/nonpeer/138.pdf>
[30] Smog and Health. Jan 2003. Jan 16, 2005. <http://www.allergyconsumerreview.com/smog.html>
[31] Ciulla, Vincent. A Short History Of US Emission Controls. About.com. Jan16, 2005.<http://autorepair.about.com/library/weekly/aa052904a.htm>
[32] How Can Air Pollution Hurt My Health? Jan 16, 2005.<http://www.lbl.gov/Education/ELSI/Frames/pollution-health-effects-f.html>
[33] Carbon Monoxide. April 5, 2004. Jan 16, 2005. <http://www.nsc.org/library/facts/carbmono.htm>
[34] The History of Reducing Tailpipe Emissions. United States Environmental Protection Agency.May 1999. Jan 16, 2005. <http://www.ehso.com/ehshome/auto-emissions_chronol.htm>
[35] Associated Press. California OKs toughest car emission rules. MSNBC News. Sept 24, 2004.<http://www.msnbc.msn.com/id/6091913/>
[36] Fleming, James and Bethany R. Knorr. History of the Clean Air Act. American MeteorologicalSociety. 1999. Jan 16, 2005. < http://www.ametsoc.org/sloan/cleanair/>
[37] Michaels, Patricia. Air Pollution. Green Nature, 2000. Jan 16, 2005.<http://greennature.com/article246.html>
[38] The Plain English Guide to the Clean Air Act, U.S. Environmental Protection Agency, EPA400-K-93-001, April 1993.
[39] The History of Reducing Tailpipe Emissions. US Environmental Protection Agency, EPA420-F-99-017, May 1999. Jan 16, 2005. <http://www.epa.gov/otaq/consumer/f99017.pdf>
[40] California’s Air Quality History Key Events. California Air Resources Board. Jan 16, 2005.<http://www.arb.ca.gov/html/brochure/history.htm>
Bibliography 266
[41] Automotive Leglislation in California. Platinum 2001. Jan 16, 2005.<http://www.platinum.matthey.com/uploaded_files/publications/autoemca.pdf>
[42] Deadly Smog Overview. Jan 13, 2003. Jan 16, 2005.<http://www.pbs.org/now/science/smog.html>
[43] Crude Oil Imports from Persian Gulf. Energy Information Administration, June 17,2003. <http://www.eia.doe.gov/pub/oil_gas/petroleum/data_publications/company_level_imports/current/summary2002.html>
[44] Woodall, Bernard. U.S. oil imports set record in 2003, trend seen up. Reuters. Dec 31, 2003.Jan 16, 2005. <http://www.forbes.com/newswire/2003/12/31/rtr1194997.html>
[45] The American Meteorological Society, 2005, website available at(http://www.ametsoc.org/sloan/cleanair/), accessed 12/20/2004
[46] Edmund, 2005, website available at (http://www.edmund.com), accessed 01/12/2005
[47] Hofmann, T. Toyota Considering Making Diesel-Electric Hybrid Vehicles, Canadian AutoPress. August 2004
[48] Hybridcars.com, 2004, website available at (www.hybridcars.com)
[49] Kitman, J. 2004, Green Living: Toyota Prius and VolkswagenJetta Diesel Compared, Automobile Magazine, website available at(http://automobilemag.com/reviews/0409_prius_jetta_comparo/index.html), accessed01/02/2005
[50] Lovins, A. B., Cramer, D.R., 2004, Hypercars, hydrogen, and the automotive transition.
[51] Mintz M., Molburg J, Folga S., Hydrogen Distribution Infrastructure, Argonne National Lab-oratory, Center for Transportation Research and Decision and Information Sciences Division,2005
[52] MSNBC, 2004, California OKs toughest car emission rules
[53] National Biodisel Board, 2005, website available at (http://www.biodiesel.org/resources/biodiesel_basics/default.shtm), accessed 01/07/2005
[54] NEC TOKIN Corporation, website available at (http://www.nec-tokin.com/english/product/me/chisiki/index.html), accessed 1/04/2005
[55] Oakland Tribune, Sep 24. 2004, Hybrids Can Enjoy Carpool Privilege
[56] Panasonic Corporation, Nickel Metal Hydride Handbook, 2003
[57] Panasonic EV Energy Corporation (2005), website available at(http://www.peve.panasonic.co.jp/catalog/e_kaku.html), accessed 1/03/2005
[58] Radio Shack Corporation, website available at (http://support.radioshack.com/support_tutorials/batteries/bt-ldac-main.htm), accessed 01/06/2005
Bibliography 267
[59] Terashi, S (2003), Personal communication.
[60] The United States Council for Automotive Research, 2005, Creating an infrastructure forHydrogen: A Major Challenge in the Transition to Fuel Cells
[61] The US Department of Energy, Hydrogen, Fuel Cell and Infrastructure Technologies : FY 2003Annual Progress Report, 2003
[62] The US Department of Energy, Energy Efficiency and Renewable Energy, 2004 website avail-able at (http://www.eere.energy.gov/hydrogenandfuelcells/storage/compressed_gas.html), ac-cessed 01/15/2004
[63] The US Department of Energy, EV Batteries, website available at(http://avt.inel.gov/evb.html), accessed 01/02/2005
[64] The US Department of Energy, Just the Basics: Diesel Engine, August 2003
[65] The US Energy Efficiency and Renewable Energy Agency, 2003, Fuel Cell Report to Congress
[66] The US Environmental Protection Agency, 1999, The History of Reducing Tailpipe Emissions
[67] The U.S. White House, 2003, News Press
[68] Vasilash, G.S. The Toyota Prius: The Most Important ’04 Model? Yes, Automotive.com,2003
[69] Wards Communications, 1999, Motor Vehicle Facts & Figures, Wards Communications, Inc.,Southfield, MI.
[70] Wikipedia, 2005, website available at (http://en.wikipedia.org/wiki/Hybrid_car), accessed01/11/2004
[71] BTS: The Changing Face of Transportation. Jan 16, 2005.<http://www.bts.gov/publications/the_changing_face_of_transportation/>
References for the Heavy Duty Vehicles
[72] A Primer on Gasoline Prices. Brochure, Energy Information Administration. Accessed 24September 2004. Available at www.eia.doe.gov/neic/brochure/oil_gas/primer/primer.htm
[73] Alternative Power Vehicles by Mode, 2004. Table, American Public Trans-portation Association Bus and Trolleybus Statistics, 2003. Available atwww.apta.com/research/stats/vehicles/vehalpow.cfm
[74] Average New Bus and Trolleybus Costs, 2003-2004, Thousands of Dollars. Table, Amer-ican Public Transportation Association Bus and Trolleybus Statistics, 2003. Available atwww.apta.com/research/stats/bus/buscost.cfm
[75] Average Vehicle Age by Mode, 2004. Table, American Public Trans-portation Association Bus and Trolleybus Statistics, 2003. Available atwww.apta.com/research/stats/vehicles/vehage.cfm
Bibliography 268
[76] Bus Engine Idling. Brochure, EPA New England, 2004. Available atwww.epa.gov/boston/eco/diesel/assets/pdfs/Dieselbus_Factsheet_Bus_Idling.pdf
[77] California Fuel Cell Bus Trials. Scope document, Northeast Advanced Vehicle Consortium,2004. Available at www.navc.org/California.html
[78] Delivered Stuart Energy Stations. Brochure, Stuart Energy, December 2004. Available atwww.stuartenergy.com/pdfs/delivered_success_brochure_20041207_web.pdf
[79] Electricity Generation. Rocky Mountain Institute, 2004. Available atwww.rmi.org/sitepages/pid424.php
[80] Energy Consumption by Mode of Transportation. Table, Bureau of Transportation Statistics,U.S. Department of Transportation, 2003.
[81] Evaluation of Fuel Cell Auxiliary Power Units for Heavy-Duty Diesel Trucks. Paper, Instituteof Transportation Studies, University of California at Davis, 2002.
[82] Existing Hydrogen Refueling Station Projects. Table, www.h2cars.de, February 2003. Avail-able at www.h2cars.de/filling/h2fueling.html
[83] Freightliner Columbia Features and Benefits. Information Sheet, Freightliner Corpora-tion, accessed 11 November 2004. Available at www.freightlinertrucks.com/trucks/find-by-model/features-benefits.asp?id=3
[84] Freightliner Coronado Features and Benefits. Information Sheet, Freightliner Corporation, ac-cessed 3 January 2005. Available at www.freightlinertrucks.com/trucks/find-by-model/features-benefits.asp?id=1
[85] Fuel Cell Bus. Clean Air Initiative in Latin American Cities, 2004. Available atwww.cleanairnet.org/infopool/1411/propertyvalue-17736.html
[86] Fuel Cell Buses Whos Making Fuel Cell Buses? Information sheet, Northeast AdvancedVehicle Consortium, accessed 28 October 2004. Available at www.navc.org/whomakes.html
[87] Fuel Cell Buses. Table, Fuel Cells 2000, November 2004. Available atwww.fuelcells.org/info/charts/buses.pdf
[88] Fuel Cell Price Points. Renewable Energy Policy Project, 2004. Available at sol-stice.crest.org/hydrogen/hydrogen_fuelcell_pricepoints.html
[89] Fuel Cells in Transit Buses. Fuel Cell Vehicle World Survey 2003. Break-through Technologies Institute, Energy Efficiency and Renewable EnergyDepartment, U.S. Department of Energy, February 2004, Available atwww.eere.energy.gov/hydrogenandfuelcells/pdfs/fc_transit_buses.pdf
[90] GM Launches Japans 1st Commercial Fuel-Cell Vehicle. USA Today, 9 July 2003. Availableat www.usatoday.com/money/autos/2003-07-09-gm-fedex_x.htm
[91] H2 Powering the Future. CBC Venture. 2 March 2003. Available atwww.cbc.ca/venture/fuelcell/iceland.html
Bibliography 269
[92] Hydrogen Bus Technology Validation Program, Davis/Sacramento, California. Scope Doc-ument, University of California at Davis, March 2000. Available at www.its.davis.edu/e-news/hydrogen.html
[93] Hydrogen Fuel Cell Engine. Information sheet, Fuel Cell BusClub, accessed 18 November 2004. Available at www.fuel-cell-bus-club.com/index.php?module=pagesetter&func=viewpub&tid=1&pid=138
[94] Hydrogen Fuel Cell Powered Bus. Press release, Canadian Office of Energy Efficiency, 2004.Available at oee.nrcan.gc.ca/Publications/infosource/Pub/ici/caddet/english/Do35.cfm?text=N&printview=N
[95] Hydrogen Fueling Station. Information Sheet, California Fuel Cell Partnership. Available atwww.fuelcellpartnership.org/documents/Hydrogen%20Fuel%20Station.pdf
[96] Hydrogen Fueling Station. Press release, U.S. Environmental Protection Agency, 4 November2004. Available at www.epa.gov/otaq/fuelcell/hydrogenstation.htm
[97] Liquid Hydrogen Storage. Information sheet, Energie, accessed 10 January 2005. Available atwww.euweb.de/fuel-cell-bus/storage.htm
[98] Los Angeles Airport to Have Nations First Commercial Compressed Hydrogen Fueling Demon-stration Station. Press release, Los Angeles International Airport, 5 April 2004. Available atwww.hydrogennow.org/HNews/PressReleases/LAX/LAX-1stCommFuelingStation.htm
[99] Major Bus and Trolleybus Agency Vehicle Data, Fiscal Year 2002. Table, Ameri-can Public Transportation Association Bus and Trolleybus Statistics, 2003. Available atwww.apta.com/research/stats/bus/vehicles.cfm
[100] Module 10: Maintenance and Fueling Facility Guidelines. Hydrogen FuelCell Engines and Related Technologies. Energy Efficiency and Renewable En-ergy Department, U.S. Department of Energy, December, 2001. Available atwww.eere.energy.gov/hydrogenandfuelcells/tech_validation/pdfs/fcm10r0.pdf
[101] Module 5: Fuel Cell Engine Systems. Hydrogen Fuel Cell Enginesand Related Technologies. Energy Efficiency and Renewable Energy De-partment, U.S. Department of Energy, December, 2001. Available atwww.eere.energy.gov/hydrogenandfuelcells/tech_validation/pdfs/fcm05r0.pdf
[102] New Lightweight Materials Produce Cars of the Future. PNNL Breakthroughs Magazine,Summer 2002. Available at www.pnl.gov/breakthroughs/fall02/special4.stm
[103] Overview of Photovoltaic Technologies. Accessed 4 January 2005. Available atwww.eere.energy.gov/consumerinfo/pdfs/pv_overview.pdf
[104] Perth Fuel Cell Bus Trial. Scope document, Northeast Advanced Vehicle Consortium, 2004.Available at www.navc.org/Perth.html
[105] QUANTUM and Thiokol Successfully Complete First 5,000 PSI Hydrogen Cy-cling Test. Press release, IMPCO Technologies. 4 October 2001. Available atwww.spaceref.com/news/viewpr.html?pid=6188
Bibliography 270
[106] QUANTUM Developing Hydrogen Storage for DOE Bus Program. Pressrelease, QUANTUM Technologies, 27 June 2001. Available at compos-ite.about.com/library/PR/2001/blquantum3.htm
[107] Solid-H Metal Hydrides. Information sheet, Hydrogen Components, accessed 16 September2004. Available at www.hydrogen.components.com/hydride.html
[108] Stockholm Taps Stuart Energy to Supply Hydrogen Fueling Station for CUTE Project. 30January 2003. Available at www.eyeforfuelcells.com/ReportDisplay.asp?ReportID=1868
[109] Stuart Energy Awarded Funding from Government of Canada for Phase I Engineering ofThree Hydrogen Fueling Stations. Press release, Stuart Energy, 27 September 2004. Availableat www.stuartenergy.com/media_center/press_releases/press_sept_27_2004.html
[110] Stuart Energy Station. Brochure, Stuart Energy, December 2004. Available atwww.stuartenergy.com/pdfs/ses_brochure_20041207_web.pdf
[111] Summary of Fuel-Cell System Costs. Institute for the Analysis of Global Security, 2003.Available at www.iags.org/fccost.html
[112] Technical Guideline for Hydrogen Refueling Stations. Paper, Engineer-ing Advancement Association of Japan, November 2003. Available atwww.iccsafe.org/cs/cc/h2g/agenda8guideline.pdf
[113] The Bus of the Future. Brochure, London Buses. Available atwww.tfl.gov.uk/buses/downloads/fuel-cell-buses.pdf
[114] The Citaro Fuel Cell Bus. Fuel Cell Bus Club, 2004. Available at www.fuel-cell-bus-club.com/index.php?module=pagesetter&func=viewpub&tid=1&pid=116
[115] The CUTE Amsterdam Project. Project Description, Shell Hydrogen. Available at www-static.shell.com/static/hydrogen-en/downloads/projects/background_amsterdam.pdf
[116] The Luxembourg Launch. Project Description, Shell Hydrogen. Available at www-static.shell.com/static/hydrogen-en/downloads/projects/background_luxembourg.pdf
[117] The Nebus Fuel Cell Bus from Daimler-Benz. 7 July 1997. Available atwww.autoweb.com.au/cms/newsarticle.html?&M=mernews&article=mer9707071
[118] The Technology of Hydrides. Information sheet, HERA Hydrogen Storage Systems, 2004.Available at www.herahydrogen.com/en/tech_hydrides.html
[119] Thiokol Aims for 10,000 PSI Conformable Storage Tank. Accessed 10 January 2005. Availableat www.energy-futures.com/samples/301cfr/H3.htm
[120] Transit Profile. Table, Bureau of Transportation Statistics, U.S. Department of Transporta-tion, 2003.
[121] U.S. Army Receives Fuel Cell for 21st Century Truck. Press release, PR Newswire, 18 Novem-ber 2002. Available at www.rmi.org/sitepages/pid762.php
Bibliography 271
[122] UPS Puts Fuel Cell Vans on the Road. News release, MSNBC, 26 August 2004. Available atmsnbc.msn.com/id/5829841
[123] UPS to use Fuel Cell Trucks in Ann Arbor, Michigan. The Detroit News, 28 August 2004.Available at www.detnews.com/2004/autosinsider/0408/30/autos-256552.htm
[124] WMATA Facts. Press release, 2004. Available at www.wmata.com/about/metrofacts.pdf
[125] Worlds first hydrogen filling station on way to Ice-land. Press release, Hydro, 7 March 2003. Available atwww.hydro.com/en/press_room/news/archive/2003_03/electrolyser_iceland_en.html
[126] Worldwide Hydrogen Fueling Stations. Table, Fuel Cells 2000, November 2004. Available atwww.fuelcells.org/info/charts/h2fuelingstations.pdf
[127] Zero Emission Buses Hit Chicago Streets. Press release, Illinois Environmental ProtectionAgency, Spring 1998. Available at www.epa.state.il.us/environmental-progress/v23/n1/zero-emission-buses.html
[128] Amos, Wade A. Costs of Storing and Transporting Hydrogen. Pa-per, National Renewable Energy Laboratory, November 1998. Available atwww.eere.energy.gov/hydrogenandfuelcells/pdfs/25106.pdf
[129] Anton, Donald L., S.M. Opalka, and D.A. Moser. High Density Hydrogen Stor-age System Demonstration Using NaAlH4 Based Complex Compound Hydrides. ProgressReport, Hydrogen, Fuel Cells, and Infrastructure Technologies, 2003. Available atwww.eere.energy.gov/hydrogenandfuelcells/pdfs/iiib4_anton.pdf
[130] Asmundsson, Jon Knutur. Will Fuel Cells Make Iceland the Kuwait of the North? 15 Febru-ary, 2002. Available at www.worldpress.org/europe/0123iceland.htm
[131] Bak, Poul Erik. Air Products to Build Hydrogen Fuelling Station for EPA, DaimlerChrysler,and UPS Fuel Cell Delivery Vehicle Initiative. www.h2cars.biz, 19 May 2003. Available atwww.h2cars.biz/artman/publish/article_158.shtml
[132] Bak, Poul Erik. DaimlerChrysler Hands Over the First Fuel Cell Bus to the City of Madrid.6 May, 2003. Available at www.h2cars.biz/artman/publish/article_152.shtml
[133] Becker, Laura. Hydrogen Storage. Cambridge Scientific Abstracts, June 2001. Available atwww.csa.com/hottopics/hydrogen/oview.html
[134] Bennett, Jeff. The Gas-and-Go Puzzle: Tanks Slow Advance of Hydrogen Cars. Detroit FreePress, 6 March 2003. Available at www.freep.com/money/autonews/hstore6_20030306.htm
[135] Bernard, Bush. Hydrogen Fuel Cells Powering Ozburn-Hessey Pal-let Jacks. The Tennessean, 23 September 2004. Available at ten-nessean.com/business/archives/04/09/58206025.shtml?Element_ID=58206025
[136] Bjarnason, Helgi and Jon Bjorn Skulason. Hydrogen Developments. Case of Iceland. Pre-sentation. Global Climate and Energy Project Hydrogen Workshop. Palo Alto, 14-15 April2003.
Bibliography 272
[137] Blackburn, Bill. Email message. 19 November 2004.
[138] Blackburn, Bill. Email message. 3 November 2004.
[139] Clean Urban Transport for Europe General Introduction Brochure. 2002. Available atwww.miljobilar.stockholm.se/upload/3529/cutebrochure1.pdf
[140] Cole, Beth. Chicagos Fuel Cell Buses Mobilized. NHA Hydrogen Newsletter, Winter 1998.Available at www.hydrogenus.com/newsletter/ad31cta.htm
[141] Cromwell III, Richard, John Williams, and Frank Lynch. SunLine Tran-sit Agency Tests Hythane r© in Closed Loop CNG Engine. 2002. Available atwww.iangv.org/jaytech/files/ngv2002/Pol_Com/Cromwell_Richard.doc
[142] Davidson, Steve. Perths Hydrogen Bus Trial. ECOS, July-September 2003: 6.
[143] Dodson, Sean. All Aboard the Hydrogen Bus. The Guardian, 30 October 2003. Accessibleat www.guardian.co.uk/life/feature/story/0„1073317,00.htm
[144] Energy Information Administration. Annual Energy Outlook 2004 with Pro-jection to 2025. United States Department of Energy, 2004. Available atwww.eia.doe.gov/oiaf/aeo/demand.html
[145] Eudy, Leslie, Richard Parish, and Jonathan Leonard. Hydrogen Fuel Cell BusEvaluation. Proceedings of the 2001 DOE Hydrogen Program Review. Available atwww.eere.energy.gov/hydrogenandfuelcells/tech_validation/pdfs/h2_fuel_cell_bus_eval2.pdf
[146] Eudy, Leslie. Overview of Advanced Technology Transportation, 2004 Update. AdvancedVehicle Testing Activity, July 2004. Available at avt.nrel.gov/pdfs/102004.pdf
[147] Farrell, Alexander E, David W. Keith, and James J. Corbett. A strategy for introducinghydrogen into transportation. Energy Policy 31 (2003): 1357-1367.
[148] Future Wheels II: A Survey of Expert Opinion on the Future of Transportation Fuel Cellsand Fuel Cell Infrastructure. Northeast Advanced Vehicle Consortium, Boston. September,2003. Available at www.navc.org/Future_Wheels_II.pd
[149] Gordon, Deborah. Steering a New Course: Transportation, Energy and the Environment.Washington: Island Press, 1991.
[150] Gross, Karl J., Weifang Luo, Eric Majzoub, Greg Roberts, Scott Spangles, DanielDedrick, Terry Johnson, and Jennifer Chan. "Hydride Development for Hydrogen Storage"Progress Report, Hydrogen, Fuel Cells, and Infrastructure Technologies, 2003. Available atwww.eere.energy.gov/hydrogenandfuelcells/pdfs/iiib2_gross.pdf
[151] Heller, Chelsea. The Dire Need for a New Energy Infrastructure. Commentary. The Environ-mental Analysis Letter Pomona College Program in Environmental Analysis. 2004. Availableat www.ea.pomona.edu/2hydrogeneconomy.html
[152] Hoffmann, Peter. Tomorrows Energy: Hydrogen, Fuel Cells, and the Prospects for a CleanerPlanet. Cambridge: MIT Press, 2002.
Bibliography 273
[153] Howes, Daniel. Iceland Warms Up to Hydrogen Fuel. The Detroit News, 10 September 2000.Available at www.detnews.com/2000/autos/0009/10/b01-117373.htm
[154] Hubert, Marc. Email message. 29 November 2004.
[155] Hutchison, Geoff. Iceland Hydrogen Energy. ABC. 10 January 2003. Available atwww.abc.net.au/foreign/stories/s957834.htm
[156] Hydrogen Fuel Cell and Infrastructure Technologies Program. SunLine Test Drives HydrogenBus. U.S. Department of Energy, August 2003. Available at www.avt.nrel.gov/pdfs/33639.pdf
[157] Industrial Diesel, Inc. Internet price quote, accessed 4 January, 2005. Available atwww.industrialdiesel.net/industrial%20engines/indust_eng.htm
[158] Italian Embassy in Oslo, Norway. Hydrogen in Traffic in Iceland. Hydrogen Fuel StationInaugurated 24th of April, 2003. 2003. Available at www.ambitalia.no/science/publications_norway/pdf/Hydrogen_Iceland.pdf
[159] Jollie, David. The CUTE Project and the US Fuel CellBus Initiative. Fuel Cell Today, 23 June 2004. Available atwww.fuelcelltoday.com/FuelCellToday/FCTFiles/FCTArticleFiles/Article_793_USFCB-CUTE0604.pdf
[160] Ko, Jui, and Ken Newell. Low-Cost, High-Efficiency, High-Pressure Hydro-gen Storage. Progress report, DOE Hydrogen Program, 2004. Available atwww.eere.energy.gov/hydrogenandfuelcells/pdfs/annual04/iiia1_ko.pdf
[161] Kumar, Ravi V., George N. Kastanas, Shawn Barge, Vladimir Zamansky, andRandy Seeker. "Hydrogen Refueling Station Based on Autothermal Cyclic Re-forming. Proceedings of the 2002 DOE Hydrogen Program Review. Available atwww.eere.energy.gov/hydrogenandfuelcells/pdfs/32405a37.pdf
[162] Lang, Craig M. The Chicago Fuel Cell Experience. Presentation. Workshop on Commercial-ization of Fuel Cell Buses: Potential Roles for the GEF. New York City, 27 April 2000.
[163] Larson, Eric D. Commercialization Prospects for Fuel Cell Buses. Presentation. Workshopon Commercialization of Fuel Cell Buses: Potential Roles for the GEF. New York City, 27April 2000.
[164] Lesch, David A., Gregory J. Lewis, John J. Low, and J.W. Adriaan Sachtler. Discov-ery of Novel Complex Metal Hydrides for Hydrogen Storage through Molecular Modelingand Combinatorial Methods. Progress report, DOE Hydrogen Program, 2004. Available atwww.eere.energy.gov/hydrogenandfuelcells/pdfs/annual04/iiic4_lesch.pdf
[165] Levin, J, M. Miler, and L. Eudy. Fuel Cells for the Transportation In-dustry: Developing a Credible Demonstration Program on the Path to Com-mercialization. Paper, National Renewable Energy Laboratory. Available atwww.nrel.gov/vehiclesandfuels/fleettest/pdfs/fuelcell_whec_paper.pdf
[166] Levin, Jaimie. Email message. 29 November 2004.

Bibliography 274
[167] Low, John. Email message. 3 December 2004.
[168] Lynch, Frank. Under Environmental Pressure, Mining Industry Takes a Serious Look ata Fuel Cell Alternative to Diesel. NHA Hydrogen Newsletter, Spring 1998. Available atwww.hydrogenus.org/advocate/ad32mine.htm
[169] Maack, Maria Hildur and Jon Bjorn Skulason. Hydrogen reality in Iceland, Renewable Energy2002. Available at www.newenergy.is/subjects/73/original/video_cover/Subj73-0001.pdf
[170] Maack, Maria Hildur and Jon Bjorn Skulason. On the Practi-cal Sides of Implementing Hydrogen as a Fuel, 2003. Available atwww.newenergy.is/subjects/219/original/video_cover/doc004814.pdf
[171] McCormick, John. Probing the Hydrogen Versus Gasoline Debate. The Detroit News, 28June 2004. Available at www.detnews.com/2004/insiders/0406/28/insiders-196445.htm
[172] Nguyen, Terence. UPSs Brown Turns Green, Thanks to Fuel Cells. fleetowner.com, 27 August2004. Available at fleetowner.com/news/0827045
[173] Ogden, Joan. Global Overview of Fuel Cell Vehicle Developments. Presentation. Workshopon Commercialization of Fuel Cell Buses: Potential Roles for the GEF. New York City, 27April 2000.
[174] Panik, Ferdinand. With pure power. XCELLSiS. Presentation. Workshop on Commercial-ization of Fuel Cell Buses: Potential Roles for the GEF. New York City, 27 April 2000.
[175] Raman, Venki. Industrial Gas Industry Perspective on Hydrogen Infrastructure for Fuel CellBuses. Presentation. Workshop on Commercialization of Fuel Cell Buses: Potential Roles forthe GEF. New York City, 27 April 2000.
[176] Richey, Cooper. Methodology for Tax Rebate Analysis. Paper. Lawrence Berkeley NationalLaboratory, 10 February 1998. Available at enduse.lbl.gov/SharedData/taxmethod.rtf
[177] Sachtler, J.W. Discovery of Novel Complex Metal Hydrides for Hydrogen Storage throughMolecular Modeling and Combinatorial Methods. Presentation, 2004 H2 Storage Peer ReviewMeeting. Manoa, Hawaii, 26 May 2004.
[178] Saks, Jonathan. Student-Run ITS Tests Hydrogen/CNG Bus in Davis, California. NHAHydrogen Newsletter, Summer 2003. Available at www.hydrogenus.org/advocate/ad82its.asp
[179] Service, Robert F. The Carbon Conundrum. Science, 13 August 2004: 962-963.
[180] Service, Robert F. The Hydrogen Backlash. Science, 13 August 2004: 958-961.
[181] Sigfusson, Thorstein I. Hydrogen in Iceland: Some Lessons from a University Spin-OffProject. Presentation. Global Climate and Energy Project Hydrogen Workshop. Palo Alto,14-15 April 2003.
[182] Sirosh, Neel, Ray Corbin, and Alan Niedzwiecki. Hydrogen CompositeTank Project. Progress report, DOE Hydrogen Program, 2003. Available atwww.eere.energy.gov/hydrogenandfuelcells/pdfs/iiia1_sirosh.pdf
Bibliography 275
[183] Sirosh, Neel. Hydrogen Composite Tank Program. Proceedingsof the 2002 DOE Hydrogen Program Review. 2002. Available atwww.eere.energy.gov/hydrogenandfuelcells/pdfs/32405b27.pdf
[184] Sisson, Barbara. Hydrogen and Fuel Cell Bus Initiative. Paving the Way Nation-ally and Internationally. Presentation. United States Department of Transportation Fed-eral Transit Administration, 2003. Available at www.rspa.dot.gov/dra/hydrogen/docs/H2-FCBI%20STRATEGIC%20PLAN%20IPHE.pdf
[185] Stuart, Andrew. Hydrogen Fuel Infrastructure CarbonZERO and CarbonLITE HydrogenSupply for Fuel Cell Buses. Presentation. Workshop on Commercialization of Fuel Cell Buses:Potential Roles for the GEF. New York City, 27 April 2000.
[186] Transport for London. All Aboard the First Zero-Emission Fuel Cell Buses.Press release. 16 December 2003. Available at www.transportforlondon.gov.uk/tfl/press-releases/2003/december/press-875.shtml
[187] Turner, John A. Sustainable Hydrogen Production. Science, 13 August 2004: 972-974.
[188] Valenti, Michael. Filler up - with Hydrogen. Mechanical Engineering, February 2002. Avail-able at www.memagazine.org/backissues/feb02/features/fillerup.html
[189] Van der Veer, Jeroen. Speech commemorating opening of first Hydrogen fueling station.Reykjavik, April 2003.
[190] Vanek, Francis M. Class Lecture. September 2004.
[191] Vogel, Gretchen. Will the Future Dawn in the North? Science, 13 August 2004: 966-967.
[192] Wheeler, Shirin. Hydrogen Economy BBC Newsnight. 21 August 2002. Available atnews.bbc.co.uk/1/hi/programmes/newsnight/archive/2208013.stm
[193] Wilder, Robert J. Five Types of Fuel Cells. Commentary. The Hydrogen Fuel Cell Institute,2001. Available at www.h2fuelcells.org/commentary1_3.html
[194] Wilder, Robert J. The Promise of Hydrogen. Commentary. The Hydrogen Fuel Cell Institute,2001. Available at www.h2fuelcells.org/commentary1_1.html
[195] Wurster, R., H. Knorr, and W. Prumm. Bavarian Liquid Hydrogen Bus DemonstrationProject Safety, Licensing and Acceptability Aspects. Paper, 9th Canadian Hydrogen Confer-ence, February 1999. Available at www.hyweb.de/Wissen/cha99lh2.html
[196] Keith, David W. and Farrell, Alexander E. Rethinking Hydrogen Cars. Science, 18 July,2003: 315.
References for the Washington D.C. Rollout
[197] Zoning Office of DC website (http://dcoz.dc.gov)
[198] Sierra Club Website (http://www.sierraclub.com)
Bibliography 276
[199] Sperling, D. and Kurani, K.S. “Refueling and the Vehicle Purchase Decision: The Diesel CarCase” Society of Automotive Engineers, Inc. 870644, 1987
[200] Dingemans, D., Sperling, D., and Kitamura, R. “Mental Maps and the Refueling Behaviorof Vehicle Drivers” Transportation Research Record 1092 (Transportation Research Board,National Research Council)
[201] Diffusion, 2004
[202] Kitamura, R. and Sperling, D. “Refueling Behavior of Automobile Drivers” TransportationResearch-A Vol. 21A, No. 3, pp. 235-245, 1987.
[203] The Ministry of Internal Affairs and Communications Statistics Bureau in Japan(http://www.stat.go.jp/data/kokusei)
[204] Directed Technologies, Inc., Cost and Performance Comparison of Stationary Hydrogen Fu-eling Appliances Task 2 Report (April 2002)
[205] HONDA FCX website (http://www.honda.co.jp/FCX/grade-data/index.html)
[206] US Department of Energy, Transportation Energy Data Book: Edition 22 (September 2002)
[207] The New Energy and Industrial Technology Development Organization (NEDO), The studyof systems analysis in WE-NET in Phase 2 (Japan March 2004)
[208] Melaina, M Initiating Hydrogen Infrastructures: Preliminary Analysis of a Sufficient Numberof Initial Hydrogen Stations in the US, International Journal of Hydrogen Energy 28 (2003)p743-755
[209] U.S. Census Bureau website (http://www.census.gov)
[210] Papacostas,C.S, Transportation Engineering & Planning, 2001
[211] Reschovsky, C. “Journey to Work: 2000”, Census 2000 Brief. Issued March 2004
[212] Kuby, M. and Lim, S. “The flow-refueling location problem for alternative-fuel vehicles”,Socio-Economic Planning Sciences 39. 2005, pg. 125-145
[213] Farina, D. and Goodwin, G. “Round 6.4A Cooperative Forecasting: Population andHousehold Forecasts to 2030 by Traffic Analysis Zone” Information Center, MWCOG,(http://www.mwcog.org) November 2004.
[214] Energy Information Administration, The National Energy Modeling System: An OverviewDOE / EIA-0581 (96) (Washington DC, March 1996)
[215] International, Economic, and Integrated Forecasting Branch Energy Demand and IntegrationDivision Office of Integrated Analysis and Forecasting Energy Information Administration,NEMS International Energy Module Model Documentation Report (April 4, 1994)
[216] Office of Integrated Analysis and Forecasting Energy Information Administration, ModelDocumentation Report: Residential Sector Demand Module of the National Energy ModelingSystem DOE / EIA-M067 (2000) (Washington DC, December 1999)
Bibliography 277
[217] Flora, A TIGER Operations Branch Geography Division, ZIP Code Tabulation Areas ForCensus 2000, (July 19, 2001)
[218] Office of Integrated Analysis and Forecasting Energy Information Administration, ModelDocumentation Report: Macroeconomic Activity Module (MAM) of the National Energy Mod-eling System DOE / EIA-M065 (2000) (Washington DC, December 1999)
[219] Office of Integrated Analysis and Forecasting Energy Information Administration, ModelDocumentation Report: Commercial Sector Demand of the National Energy Modeling SystemDOE / EIA-M066 (98) (Washington DC, January 1998)
[220] Nicholas, M et al, Siting and Network Analysis Methods for Hydrogen Stations Using Geo-graphical Information Systems, TRB 2004 Annual Meeting CD- ROM
[221] The WE-NET project website, (http://www.enaa.or.jp/WE-NET/suiso/suiso1_e.html)
[222] The Japan Hydrogen & Fuel Cell Demonstration Project (JHFC) website,(http://www.jhfc.jp/e/index.html)
[223] The Ministry of Economy, Trade and Industry (METI) in Japan website(http://www.meti.go.jp/english/index.html)
[224] The Ministry of Internal Affairs and Communications Statistics Bureau in Japan(http://www.stat.go.jp/data/kokusei)
[225] Decicco, J “The ’chicken or egg’ problem writ large: why a hydrogen fuel cell focus is prema-ture.” Chapter 15 in Sperling, D and Cannon, J, eds., The Hydrogen Energy Transition: MovingToward the Post Petroleum Age in Transportation, Elsevier, Amsterdam. (2004) p213-225
[226] The National Capital Planning Commission Designing for Security in the Nations Capital(October 2001)
[227] Transportation Research Board National Research Council, Energy Demand Analysis andAlternative Fuels, Transportation Research Record 1092 (Washington DC, 1986)
[228] U.S. Census Bureau website (http://www.census.gov)
[229] Verizon Super Page (http://verizon.superpages.com)
[230] Yahoo Maps (http://maps.yahoo.com)
[231] BP website (http://www.bp.com)
[232] Shell website (http://www.shell.com)
[233] Exxon Mobil website (http://www.exxonmobil.com)
[234] Chevron Texaco website (http://www.chevrontexaco.com)
[235] DC Office of Planning (http://planning.dc.gov), DConCD CD-ROM, Vol.1 & Vol.2
[236] Arlington County (http://www.co.arlington.va.us)
Bibliography 278
[237] Virginia Government (http://www.virginia.gov)
[238] City of Alexandria (http://www.ci.alexandria.va.us)
[239] The Pentagon (http://www.defenselink.mil/pubs/pentagon)
[240] AAA website DC Version (http://www.aaamidatlantic.com)
References for the Gen H Power Park Design
[241] Website: http://www.dcwasa.com/about/facilities.cfm.
[242] Website: http://www.dcwasa.com/about/facilities.cfm.
[243] Personal Communication. Dr. Sadhir Murthy, Dr. Ersin Kasirga. DC Water and Sewer Au-thority.
[244] Jeffrey V. Wetzel, Applied Filter Technologies, Snohomish, WA. Personal Communications.
[245] Personal Communication. Sean Mezei, QuestAir Technologies Inc. Burnaby, BC V5J 4R8,Canada.
[246] Phone Conversation, Eric Massinon, GrimmerSchmidt Compressors, 1015 N. Hurricane Rd.,Franklin, IN 46131
[247] Cost and Performance Comparison of Stationary Hydrogen Fueling Appliance, Myers, D, etal. Proceedings of the 2002 U.S. DOE Hydrogen Program Review, NREL/CP-610-32405.
[248] Personal Communication. Dave Warren, Harvest Energy Technology, Inc. Sun Valley, CA91352
[249] Thomas, C.E., Reardon, J.P., Lomax, Jr. F.D., Pinyan, J., Kuhn Jr., I.F., Distributed Hydro-gen Refueling Systems, Proceedings of the 2001 DOE Hydrogen Program Review, NREL/CP-570-30535, pp. 55
[250] Liss, Czachorski, Kountz , Sizing and Operating Considerations for Natural Gas and Hydro-gen Refueling Systems, Gas Technology Institute.
[251] CASCADE V3.0. Gas Technologies Inc. Des Plaines, IL 60018
[252] Hydro-Pac Proposal E05-0008, Hydro-Pac Inc. Fairview, PA.
[253] Liss, et al.
[254] Thomas, Reardon, et al., pp.39
[255] Thomas, Reardon, et al., pp. 40
[256] Phone conversation, Jim Cielenski, CP Industries, 2214 Walnut St., McKeesport, PA 15132
[257] Phone conversation, Fueling Technologies, 23-131 Citation Drive, Concord, Ontario
Bibliography 279
[258] Papacostas, C.S., Prevedouros, P.D. Transportation Engineering and Planning, 3rd Edition.2001. Prentice Hall. pp.352
[259] Palady, Paul. FMEA Authors Edition. 2nd Ed. 1997. Practical Applications.
[260] Bosch, Robert. Automotive Handbook (Bosch). 5th Ed. 2000. Bentley Publishers
[261] Roberts, N.H. Fault Tree Handbook. 1st Ed. 1987. United States Government Printing.
[262] Shipley, A.M., Elliott, R.N. “Stationary Fuel Cells: Future Promise, Current Hype”, Ameri-can Council for an Energy-Efficient Economy, Report #1E041. March 2004.
[263] Website: http://www.powerchoice.com/residential/EnvLabelDesc.cfm?EnvLabelID=8&ProductID=1367
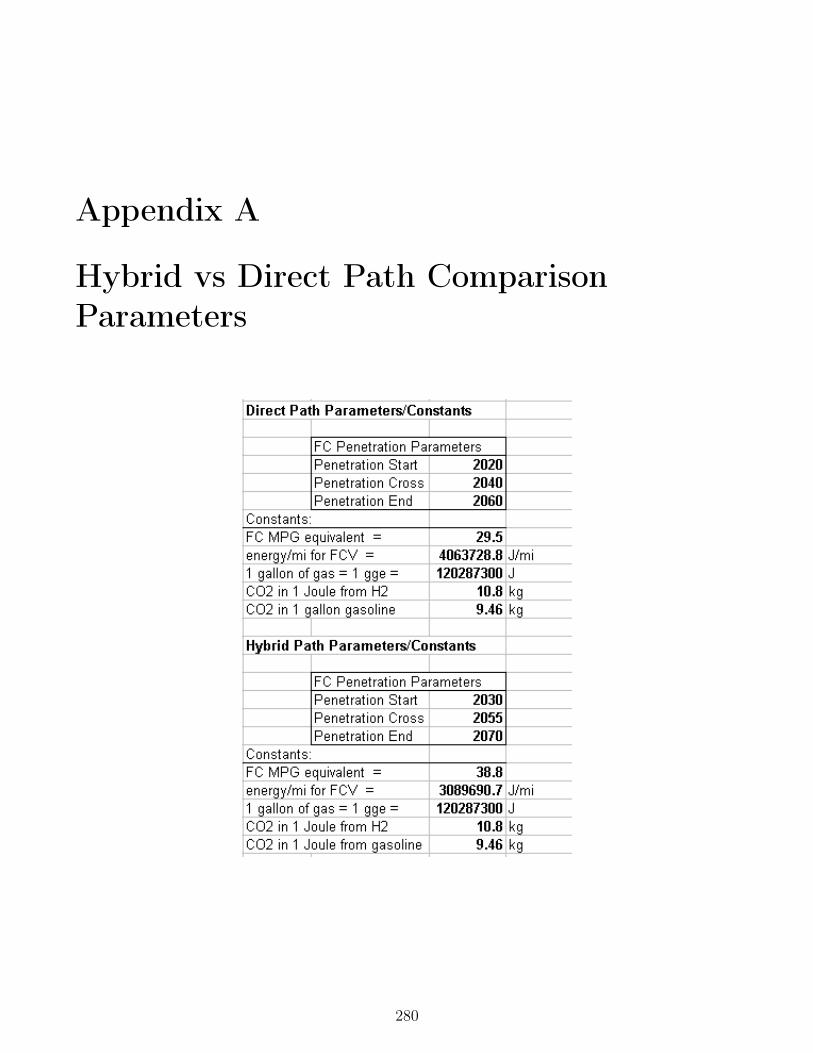
Appendix A
Hybrid vs Direct Path ComparisonParameters
280
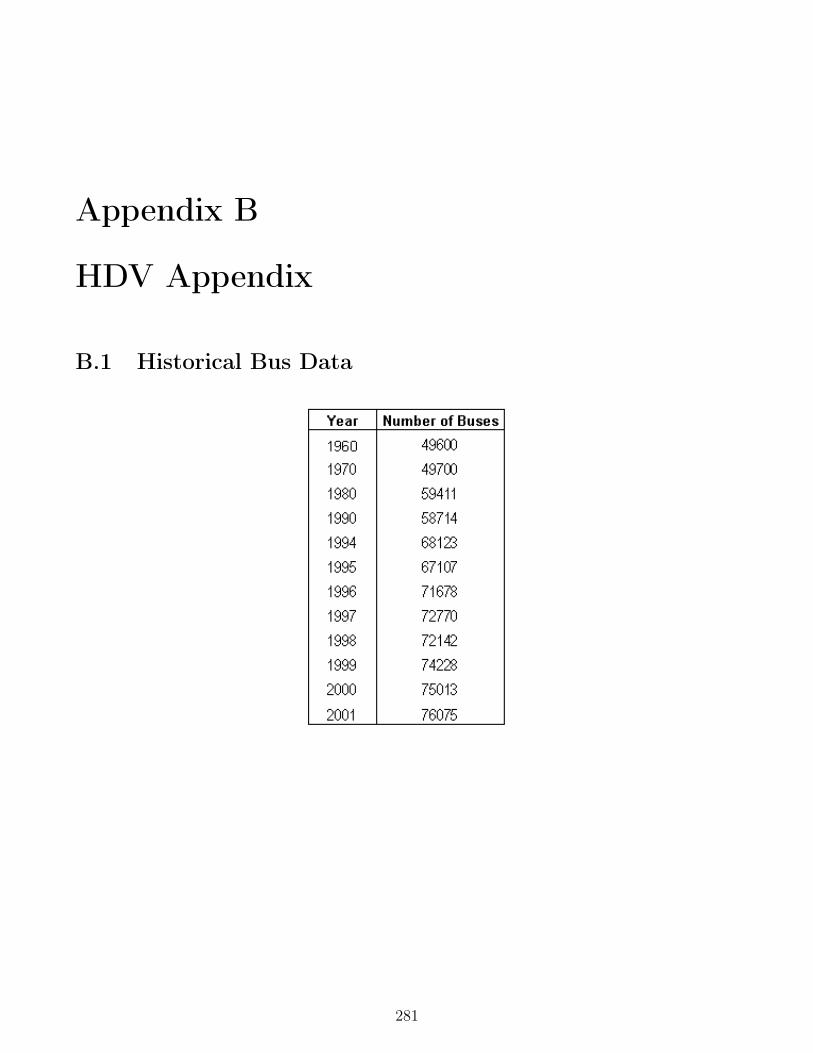
Appendix B
HDV Appendix
B.1 Historical Bus Data
281
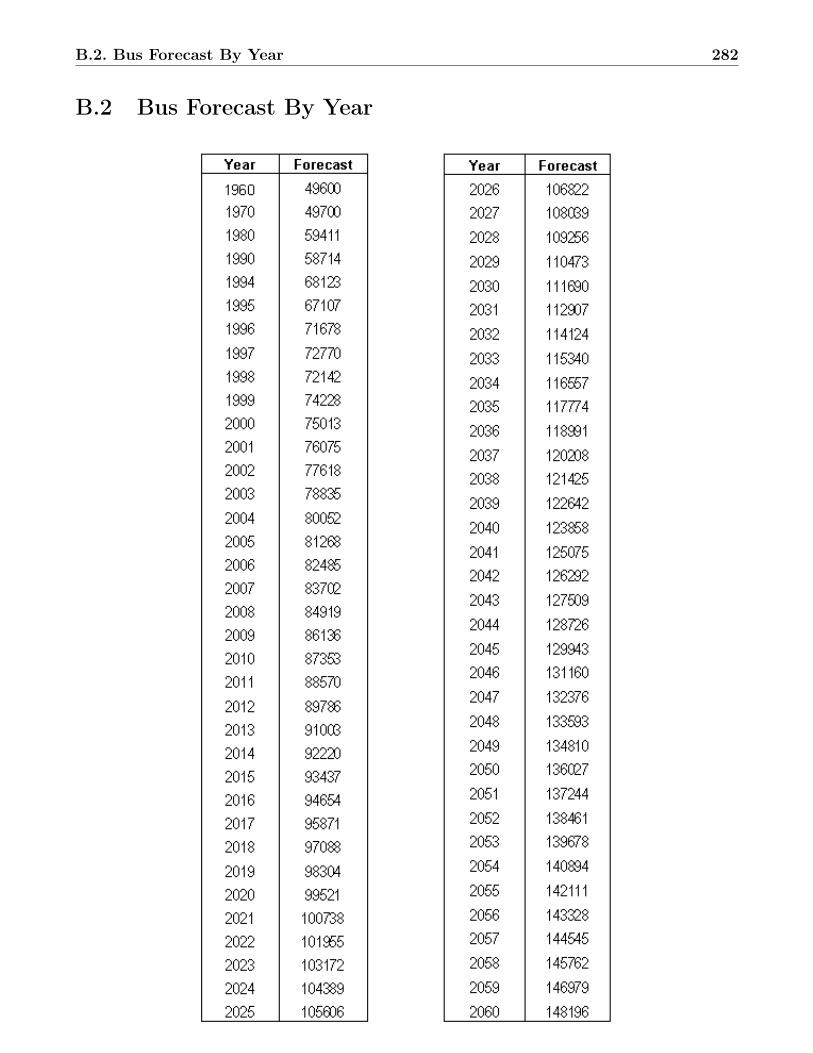
B.2. Bus Forecast By Year 282
B.2 Bus Forecast By Year
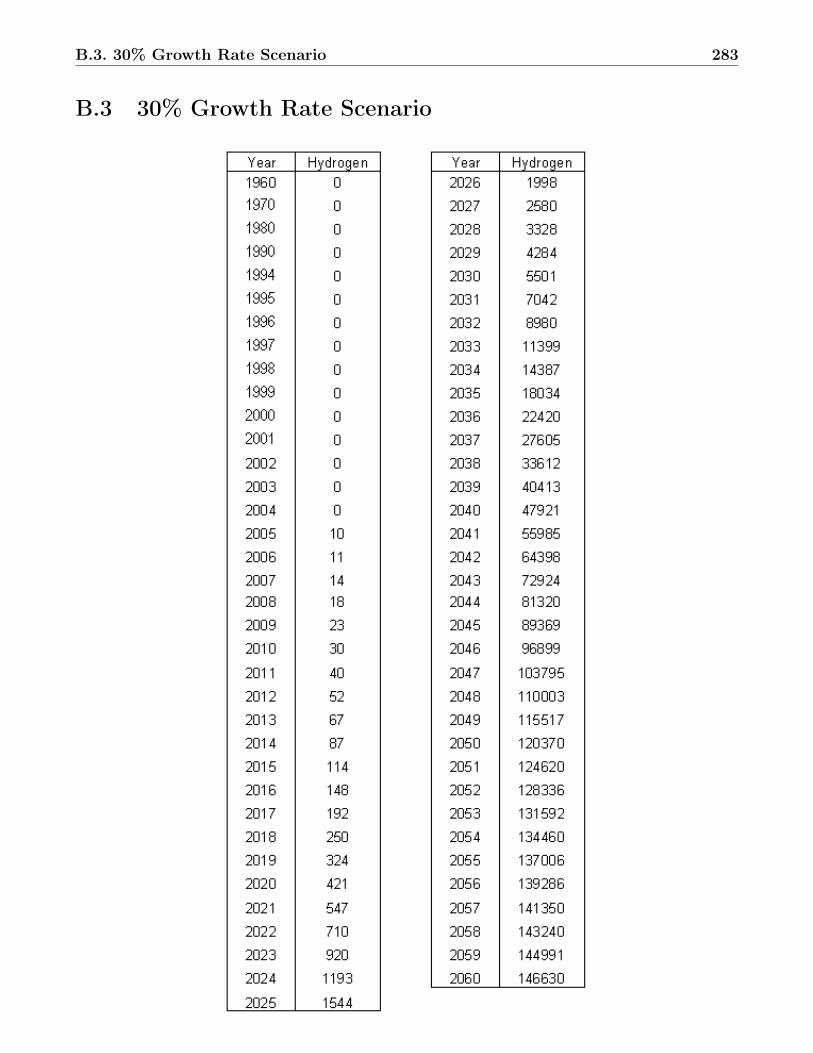
B.3. 30% Growth Rate Scenario 283
B.3 30% Growth Rate Scenario
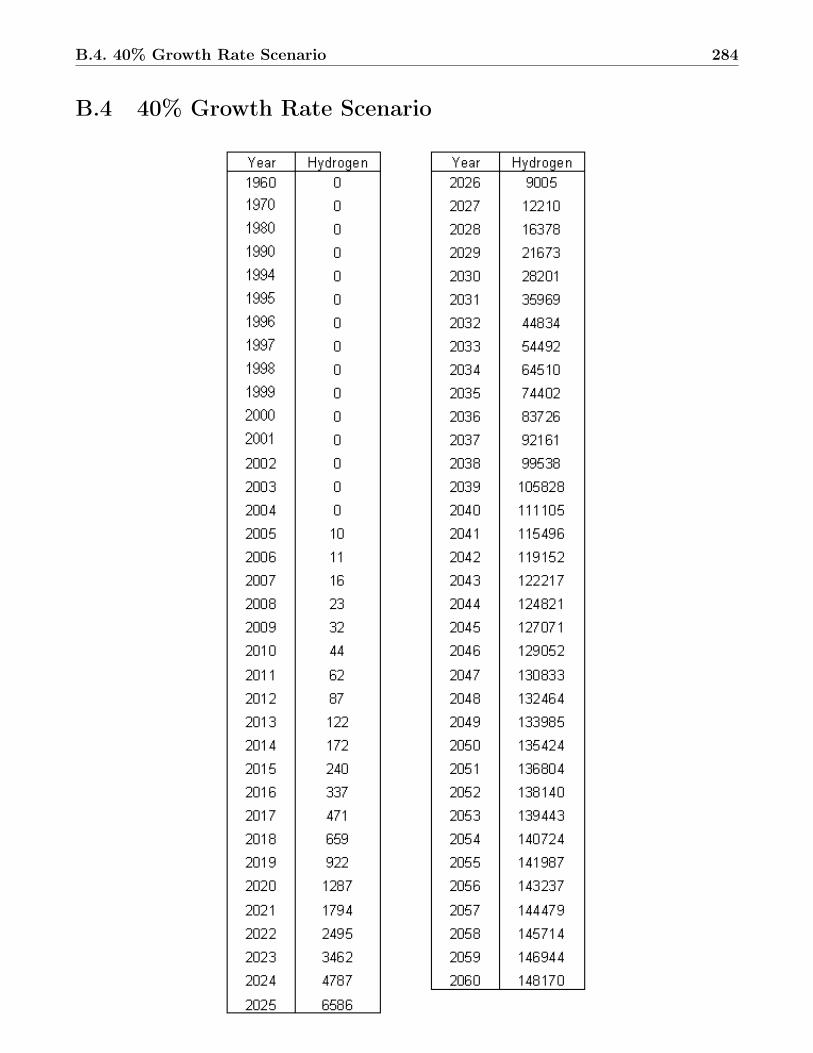
B.4. 40% Growth Rate Scenario 284
B.4 40% Growth Rate Scenario
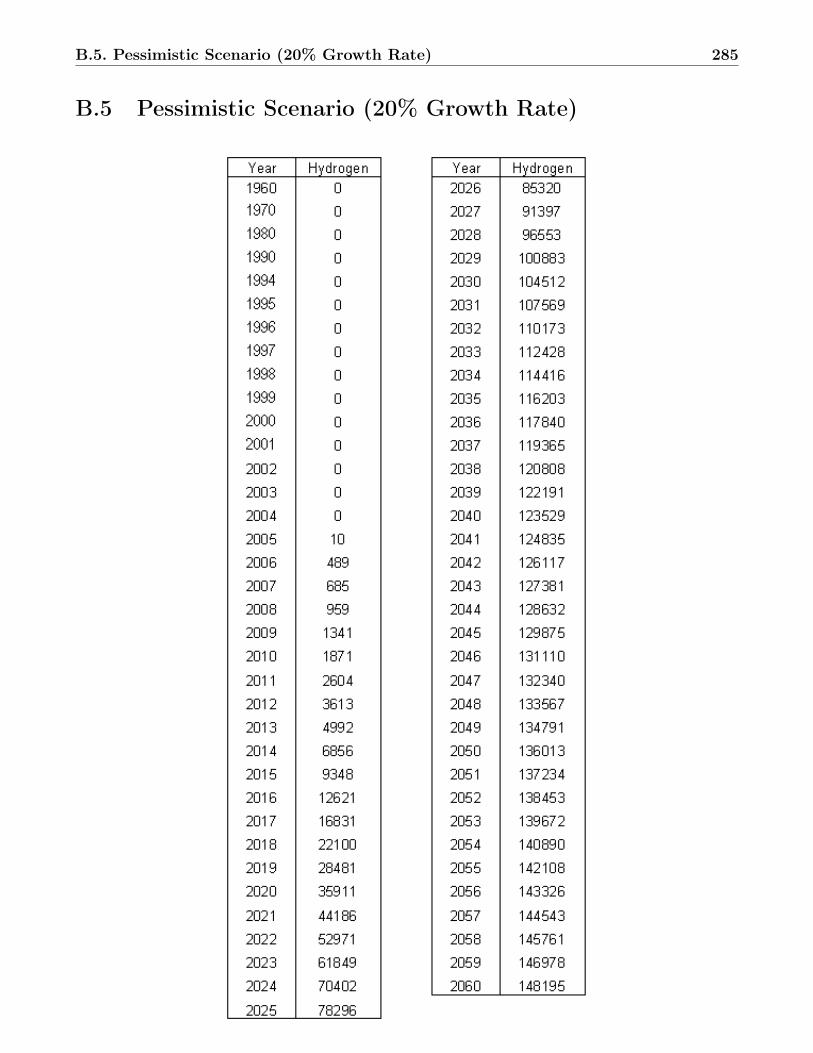
B.5. Pessimistic Scenario (20% Growth Rate) 285
B.5 Pessimistic Scenario (20% Growth Rate)
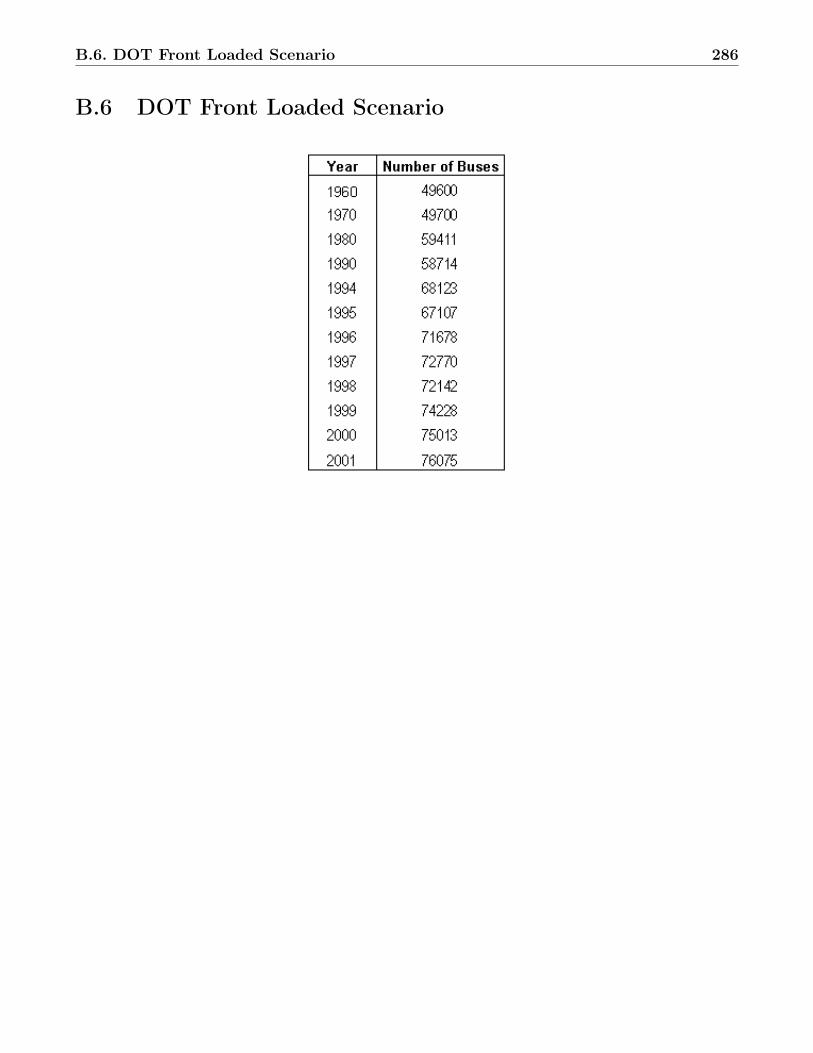
B.6. DOT Front Loaded Scenario 286
B.6 DOT Front Loaded Scenario
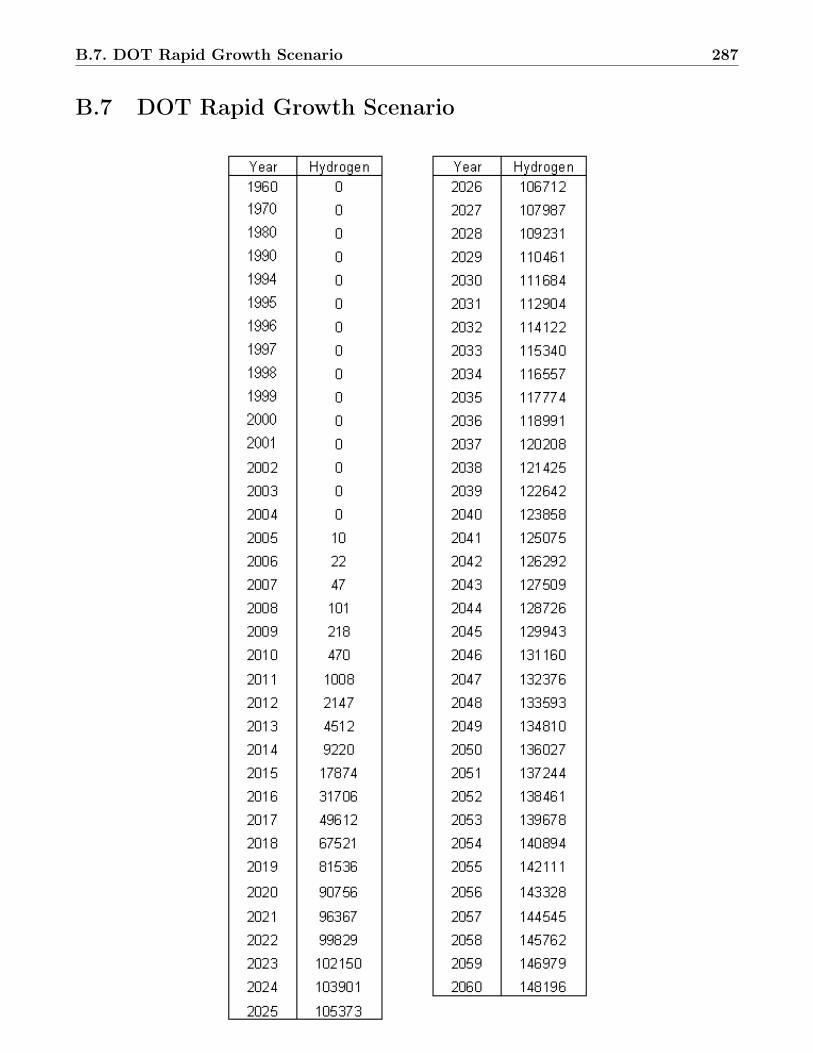
B.7. DOT Rapid Growth Scenario 287
B.7 DOT Rapid Growth Scenario
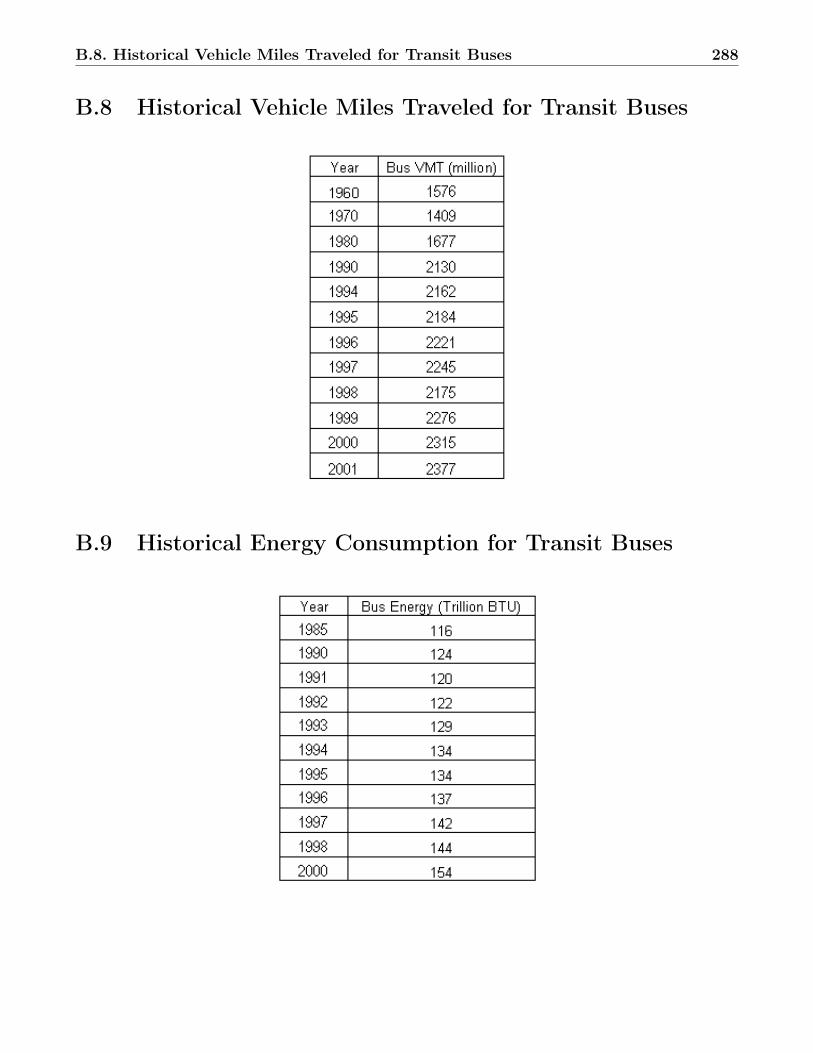
B.8. Historical Vehicle Miles Traveled for Transit Buses 288
B.8 Historical Vehicle Miles Traveled for Transit Buses
B.9 Historical Energy Consumption for Transit Buses
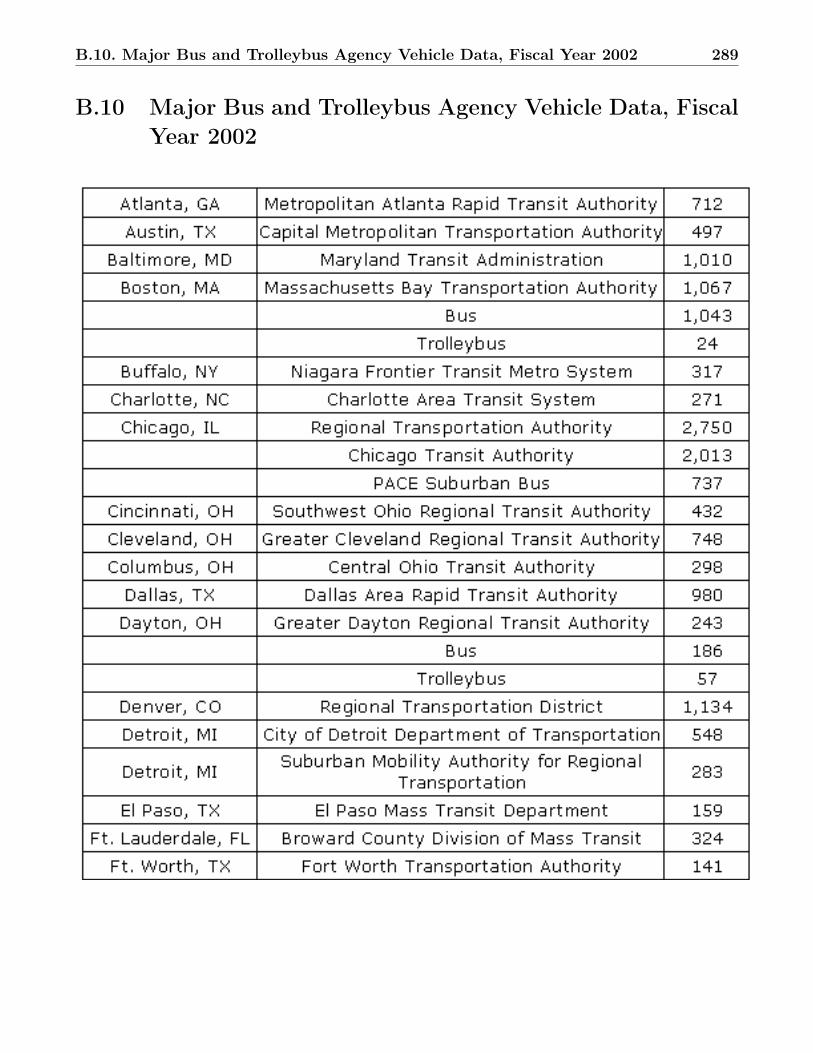
B.10. Major Bus and Trolleybus Agency Vehicle Data, Fiscal Year 2002 289
B.10 Major Bus and Trolleybus Agency Vehicle Data, FiscalYear 2002
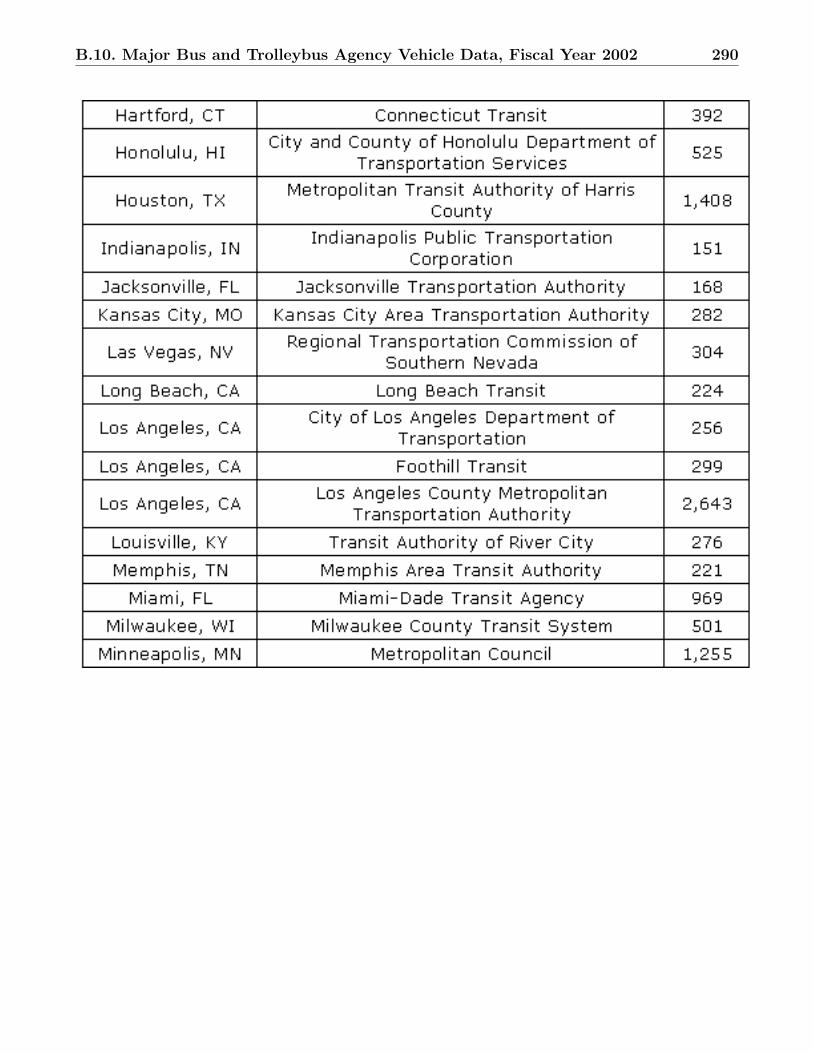
B.10. Major Bus and Trolleybus Agency Vehicle Data, Fiscal Year 2002 290
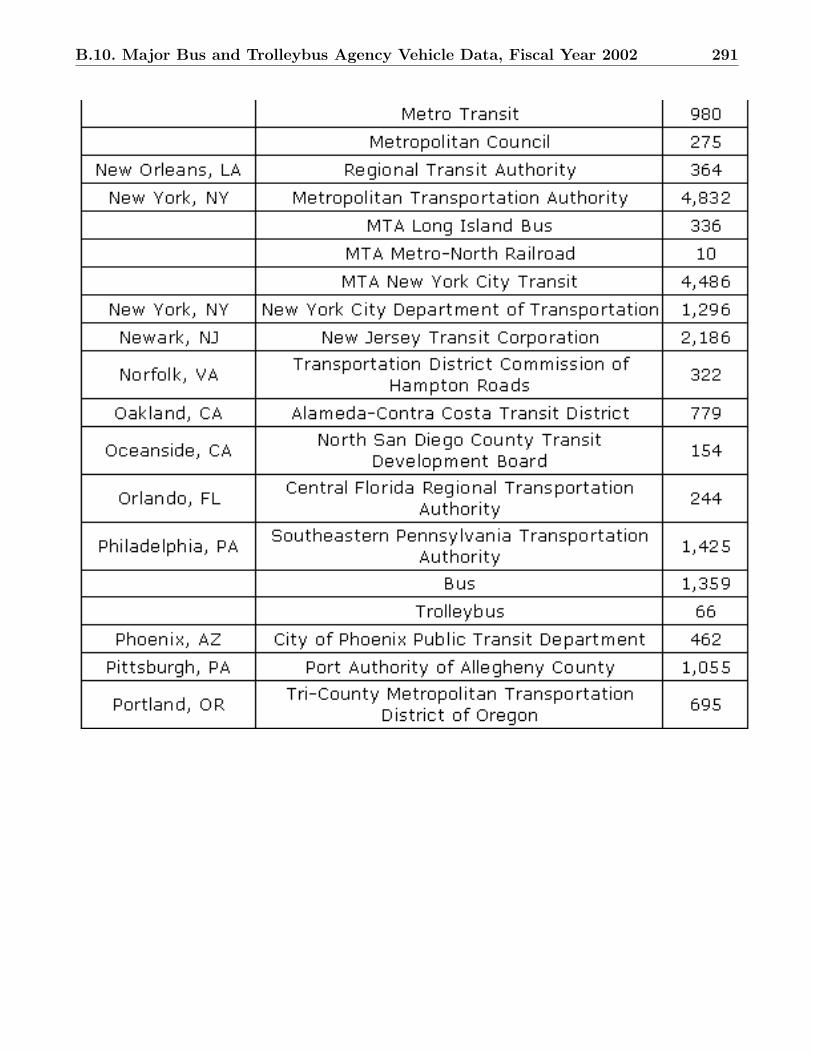
B.10. Major Bus and Trolleybus Agency Vehicle Data, Fiscal Year 2002 291
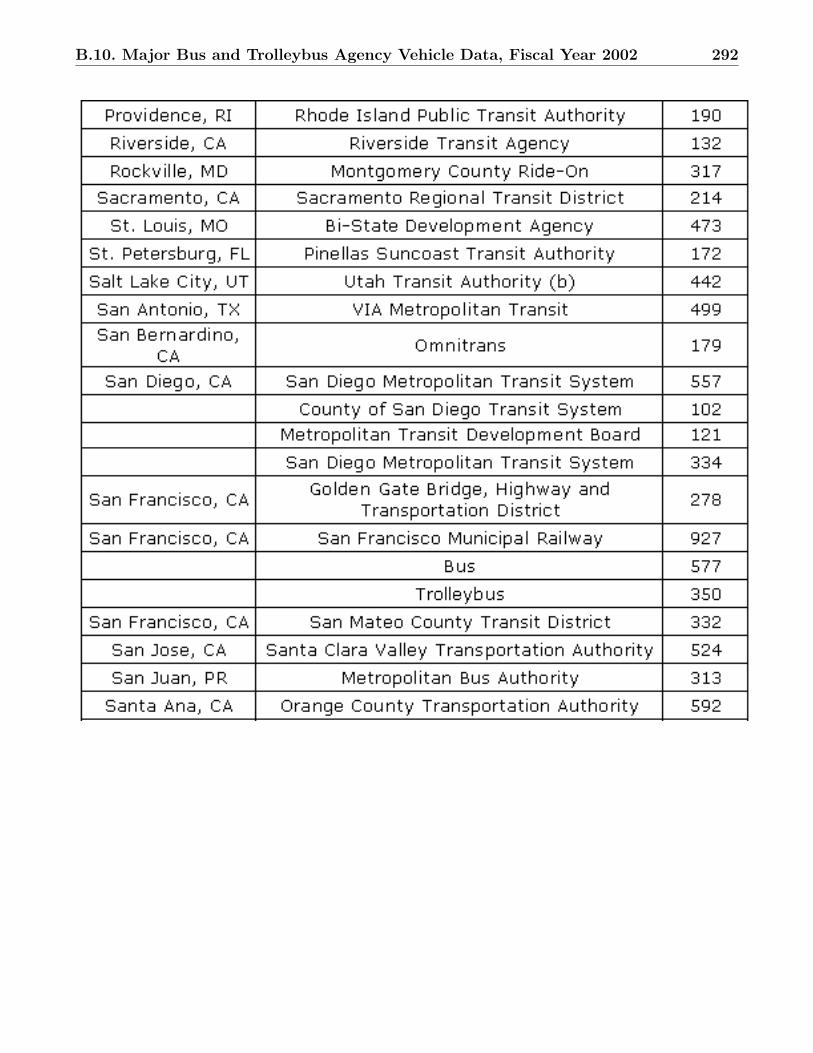
B.10. Major Bus and Trolleybus Agency Vehicle Data, Fiscal Year 2002 292
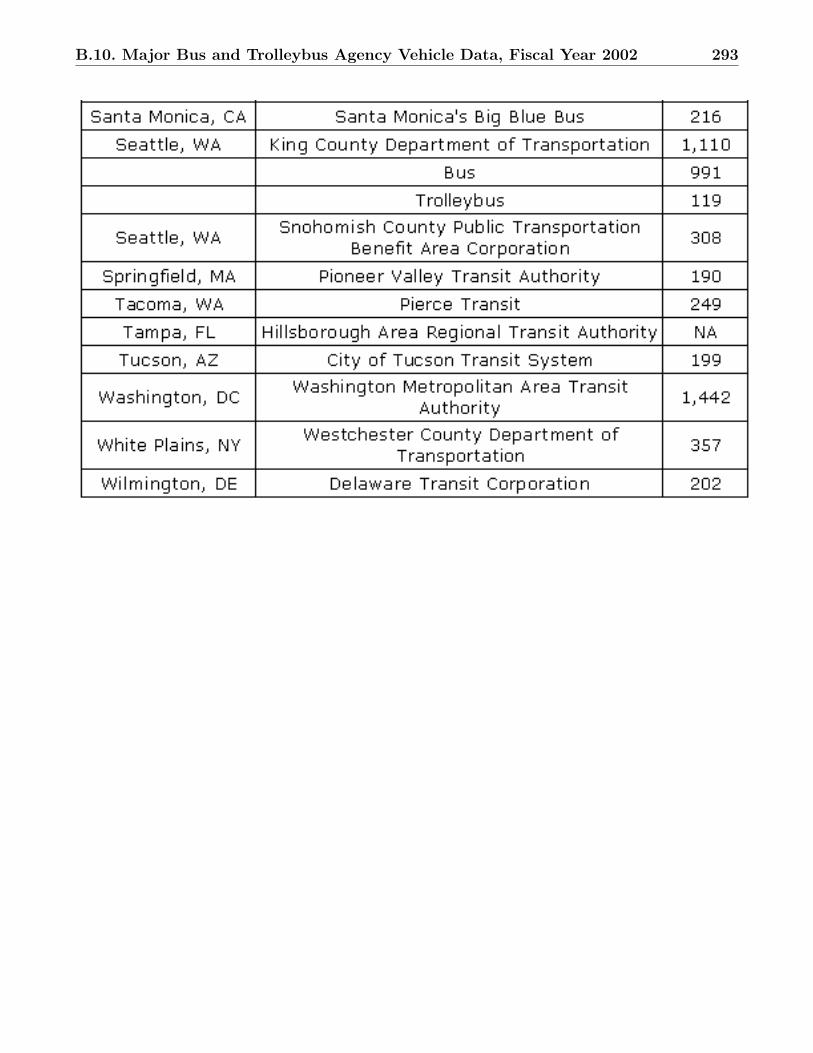
B.10. Major Bus and Trolleybus Agency Vehicle Data, Fiscal Year 2002 293
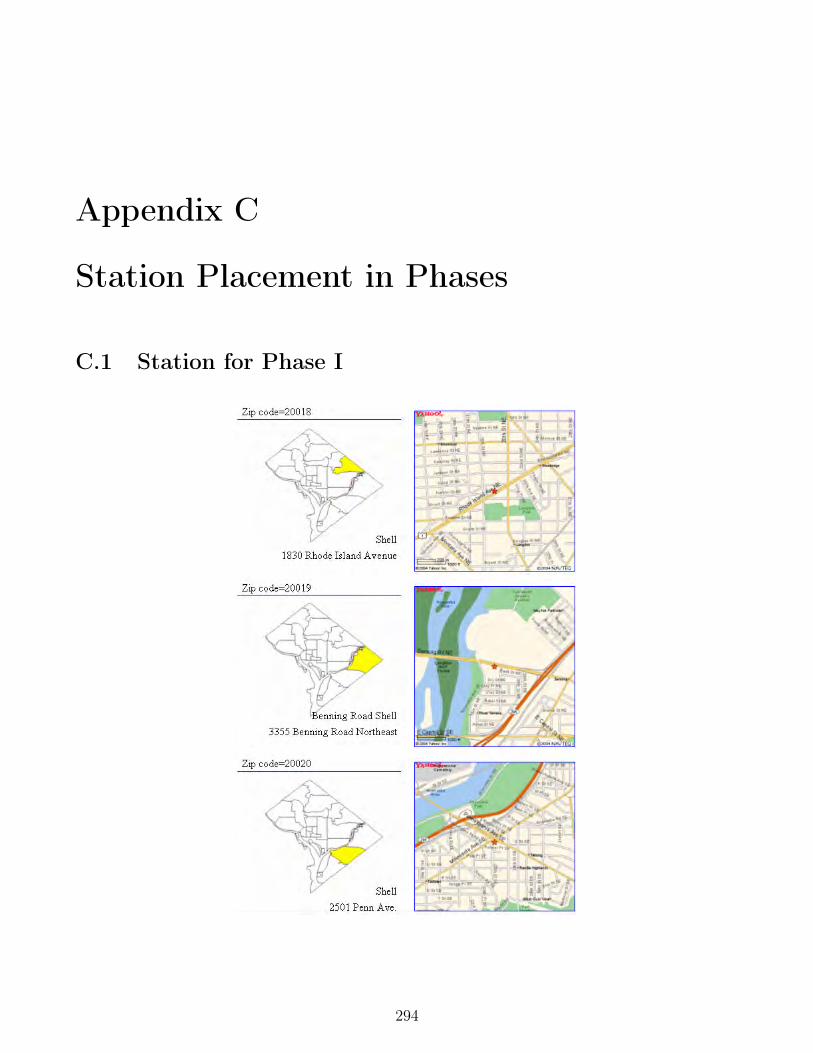
Appendix C
Station Placement in Phases
C.1 Station for Phase I
294

C.1. Station for Phase I 295

C.1. Station for Phase I 296
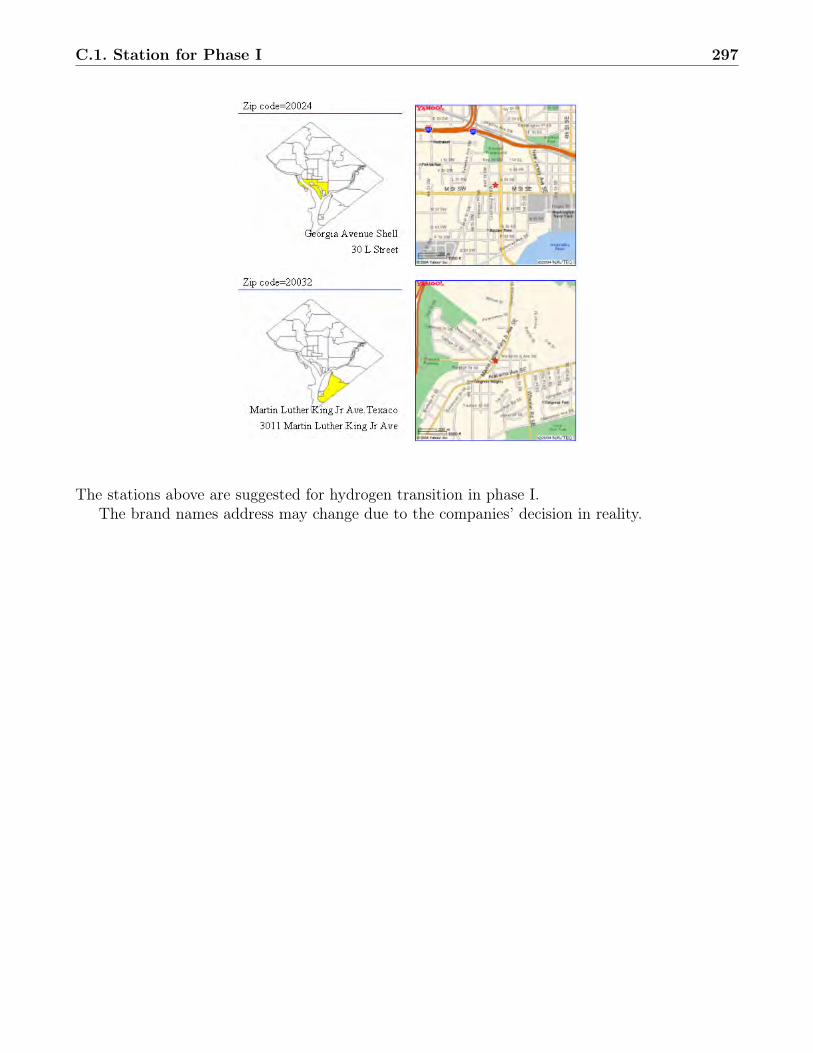
C.1. Station for Phase I 297
The stations above are suggested for hydrogen transition in phase I.The brand names address may change due to the companies’ decision in reality.
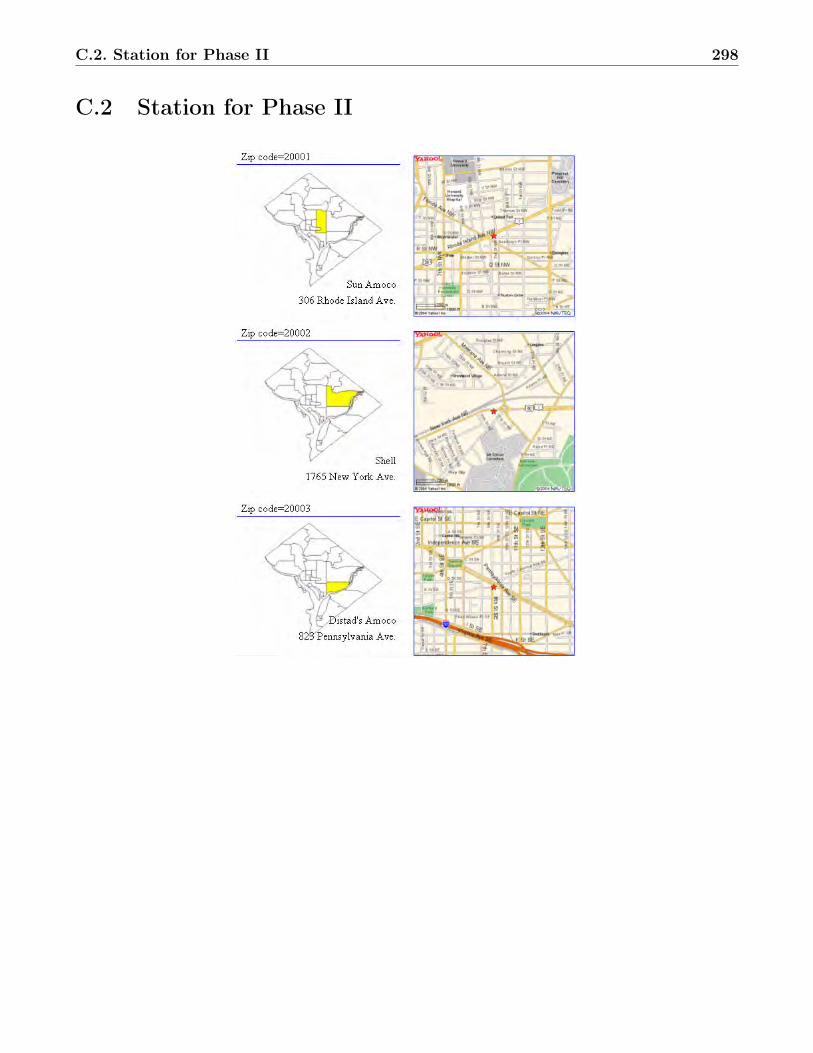
C.2. Station for Phase II 298
C.2 Station for Phase II

C.2. Station for Phase II 299
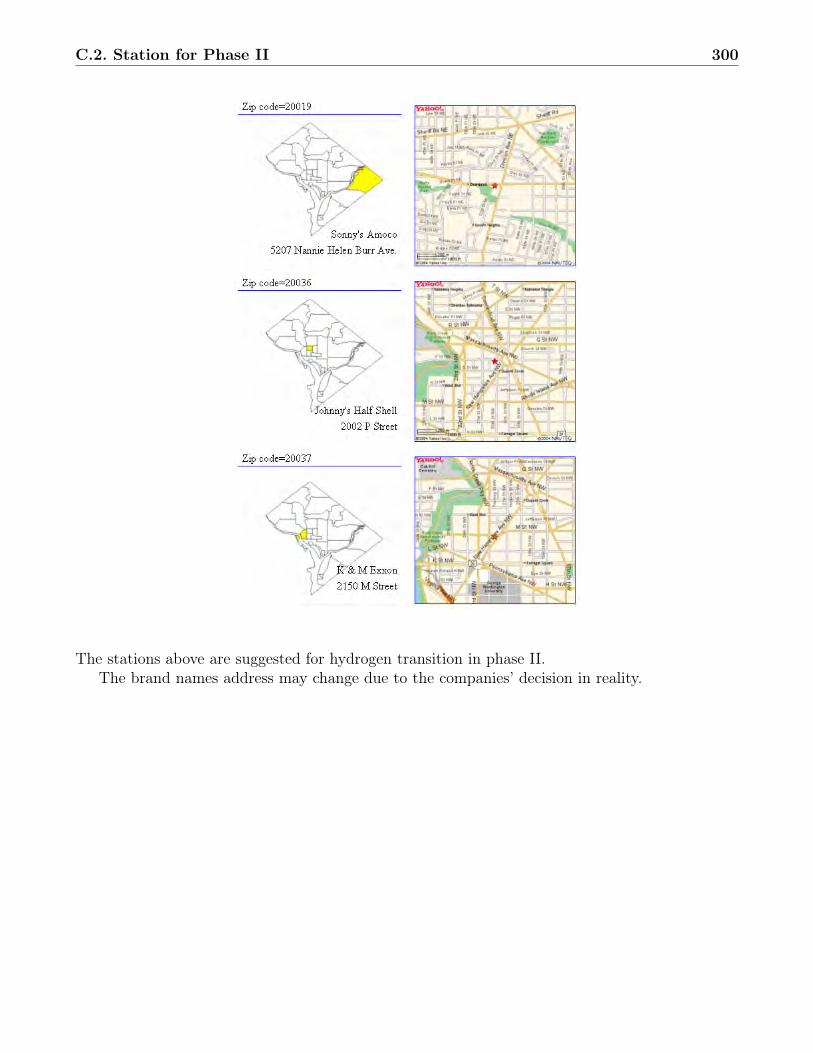
C.2. Station for Phase II 300
The stations above are suggested for hydrogen transition in phase II.The brand names address may change due to the companies’ decision in reality.
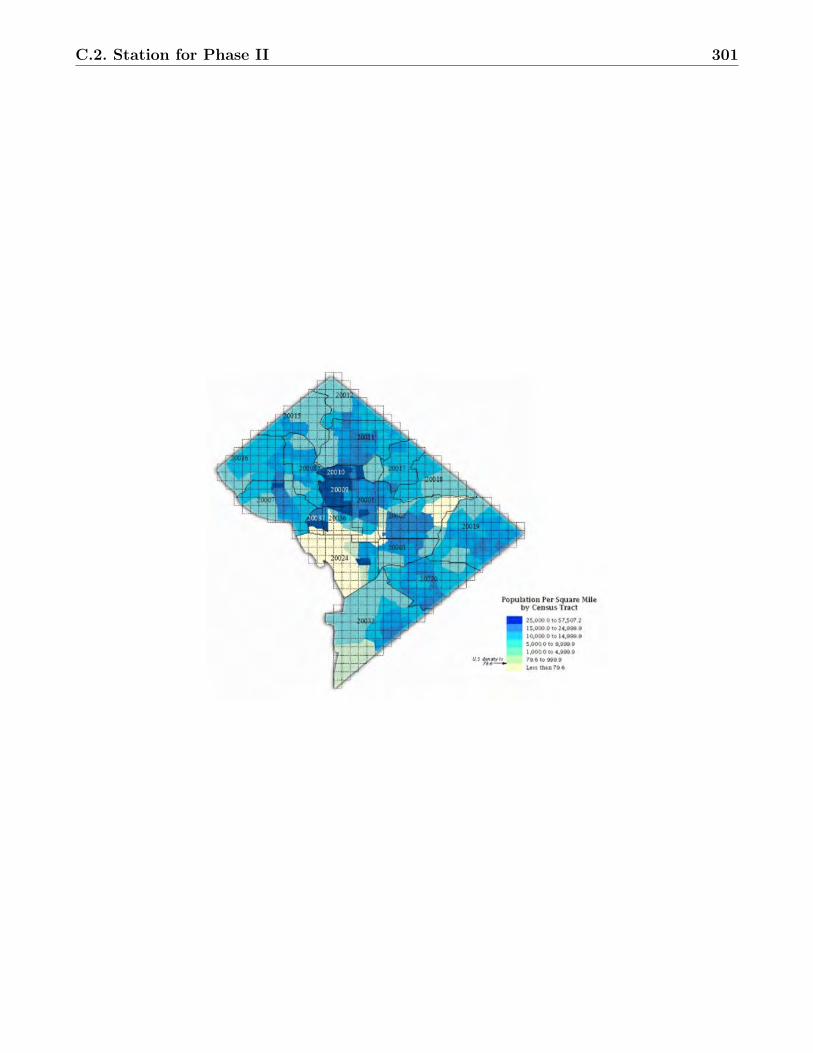
C.2. Station for Phase II 301

Appendix D
Contest Appendix
D.1 CASCADE v3.0 SoftwareThe CASCADE software helps in assessing the performance of a cascade-type ground storagesystem. It effectively determines the ability of the power park to meet the daily required amountof hydrogen needed for dispensing. By setting the fleet size parameters at a constant value,the compressor and storage vessels can be sized to meet the required performance by running aCASCADE simulation against a daily demand profile.
There are five required inputs: fleet/vehicle, vehicle storage/refueling, ground storage, and fleetrefueling characteristics. These four characteristics can be seen in figure D.1. The fifth input isthe compressor characteristics and can be seen in figure D.4.
The fleet characteristics inputs require the user to input the fleet size, the vehicle fuel efficiency,and the daily vehicle route. Each refuel is to be considered a complete fill, so the fuel efficiencyand vehicle route are set so that each vehicle is essentially empty at the start of the refuelingprocess. The fleet characteristics used in the analysis are a vehicle fuel efficiency of 50 mpg anda daily vehicle route of 182 miles1. These input values yield an end of day vehicle with 600 scf ofhydrogen, or 1.42 kg, at 1194 psig. These values can be seen in figure D.4.
The cascading refueling system refuels the cars to 5 kg, so each fill is 3.58 kg. The hydrogentemperature rises in the vehicle storage vessel to a temperature of 151◦F, so each vehicle must befilled to an overpressure of 5805 psig. These calculations can also be seen in figure D.4.
The fleet size, along with the fleet refueling characteristics, was modified on an hourly basisto reflect the number of refuels per hour according to the daily load profile. The output of onehour serves as the input to the next hour. Therefore, the only ground storage characteristicthat was changed from period to period was the ground storage pressure. However, the inputvalue is the maximum storage pressure, not starting storage pressure. The software does notallow the user to input a starting bank storage pressure and a maximum storage pressure. Thisyields a conservative approach when analyzing the cascading storage system because it limits eachbank’s maximum pressure. The total mass entering the storage remains the same, but the amountavailable is actually higher than what the software calculates.
The vehicle storage/refueling characteristics are set so a complete fill equals 5 kg at 5000 psig.The value needed is a vehicle tank volume of 7.72 ft3, with the tank rated pressure of 5000 psig
1These numbers were based on Toyotas FCHV, taken from their website.
302

D.1. CASCADE v3.0 Software 303
Figure D.1: CASCADE Main Screen
Figure D.2: CASCADE Calculation Results
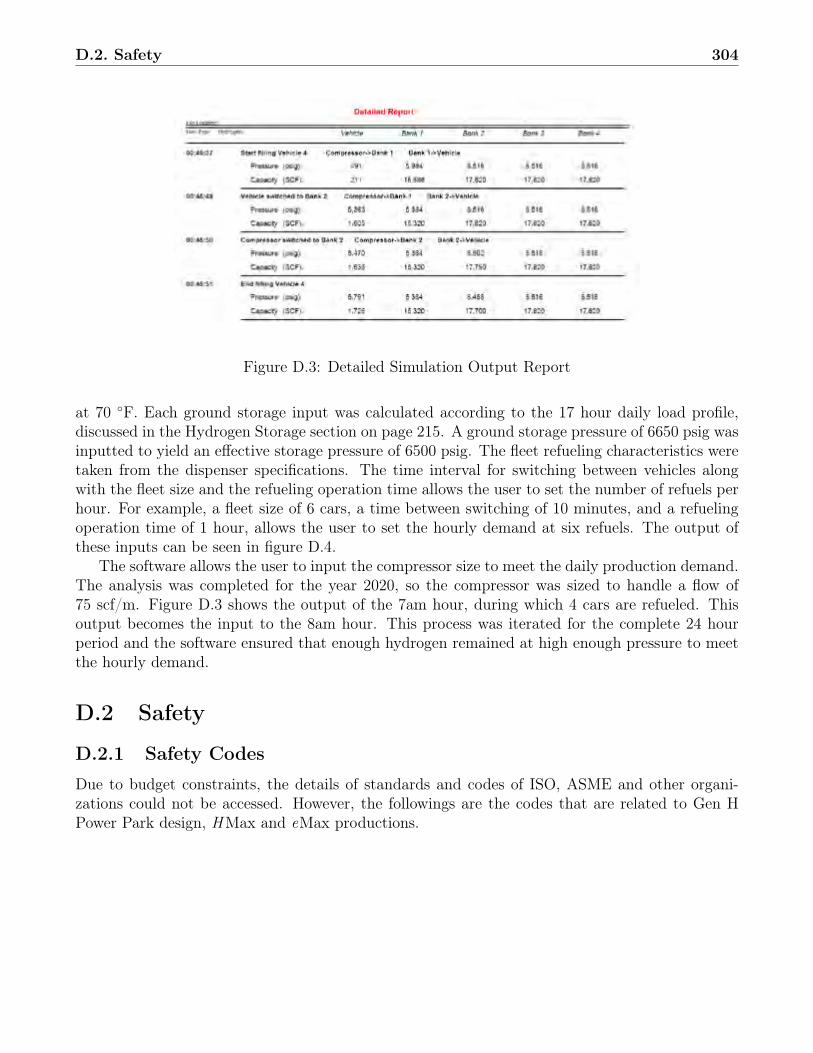
D.2. Safety 304
Figure D.3: Detailed Simulation Output Report
at 70 ◦F. Each ground storage input was calculated according to the 17 hour daily load profile,discussed in the Hydrogen Storage section on page 215. A ground storage pressure of 6650 psig wasinputted to yield an effective storage pressure of 6500 psig. The fleet refueling characteristics weretaken from the dispenser specifications. The time interval for switching between vehicles alongwith the fleet size and the refueling operation time allows the user to set the number of refuels perhour. For example, a fleet size of 6 cars, a time between switching of 10 minutes, and a refuelingoperation time of 1 hour, allows the user to set the hourly demand at six refuels. The output ofthese inputs can be seen in figure D.4.
The software allows the user to input the compressor size to meet the daily production demand.The analysis was completed for the year 2020, so the compressor was sized to handle a flow of75 scf/m. Figure D.3 shows the output of the 7am hour, during which 4 cars are refueled. Thisoutput becomes the input to the 8am hour. This process was iterated for the complete 24 hourperiod and the software ensured that enough hydrogen remained at high enough pressure to meetthe hourly demand.
D.2 Safety
D.2.1 Safety Codes
Due to budget constraints, the details of standards and codes of ISO, ASME and other organi-zations could not be accessed. However, the followings are the codes that are related to Gen HPower Park design, HMax and eMax productions.
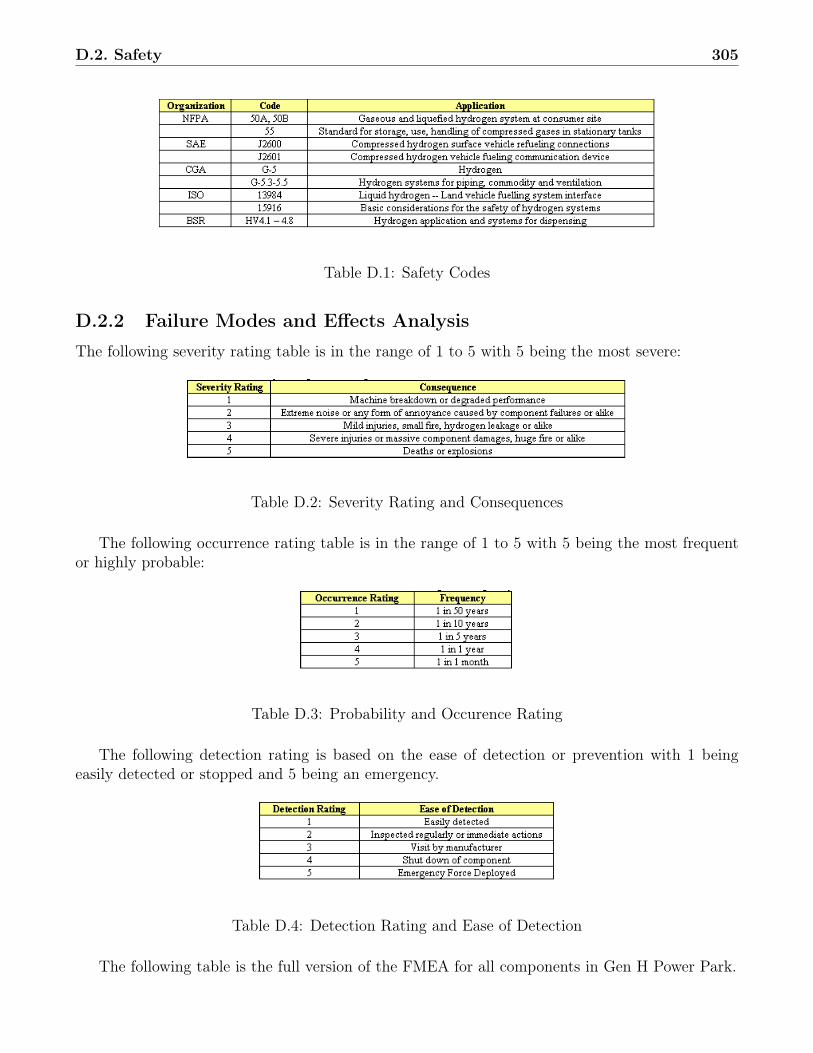
D.2. Safety 305
Table D.1: Safety Codes
D.2.2 Failure Modes and Effects Analysis
The following severity rating table is in the range of 1 to 5 with 5 being the most severe:
Table D.2: Severity Rating and Consequences
The following occurrence rating table is in the range of 1 to 5 with 5 being the most frequentor highly probable:
Table D.3: Probability and Occurence Rating
The following detection rating is based on the ease of detection or prevention with 1 beingeasily detected or stopped and 5 being an emergency.
Table D.4: Detection Rating and Ease of Detection
The following table is the full version of the FMEA for all components in Gen H Power Park.
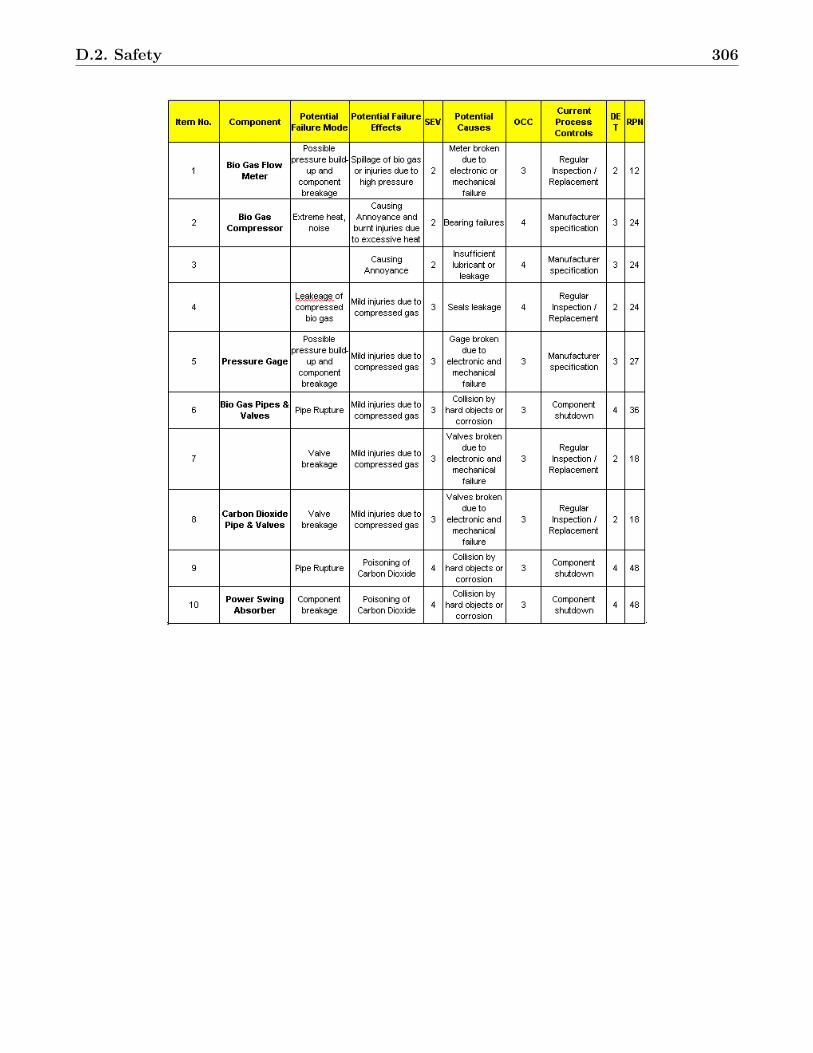
D.2. Safety 306
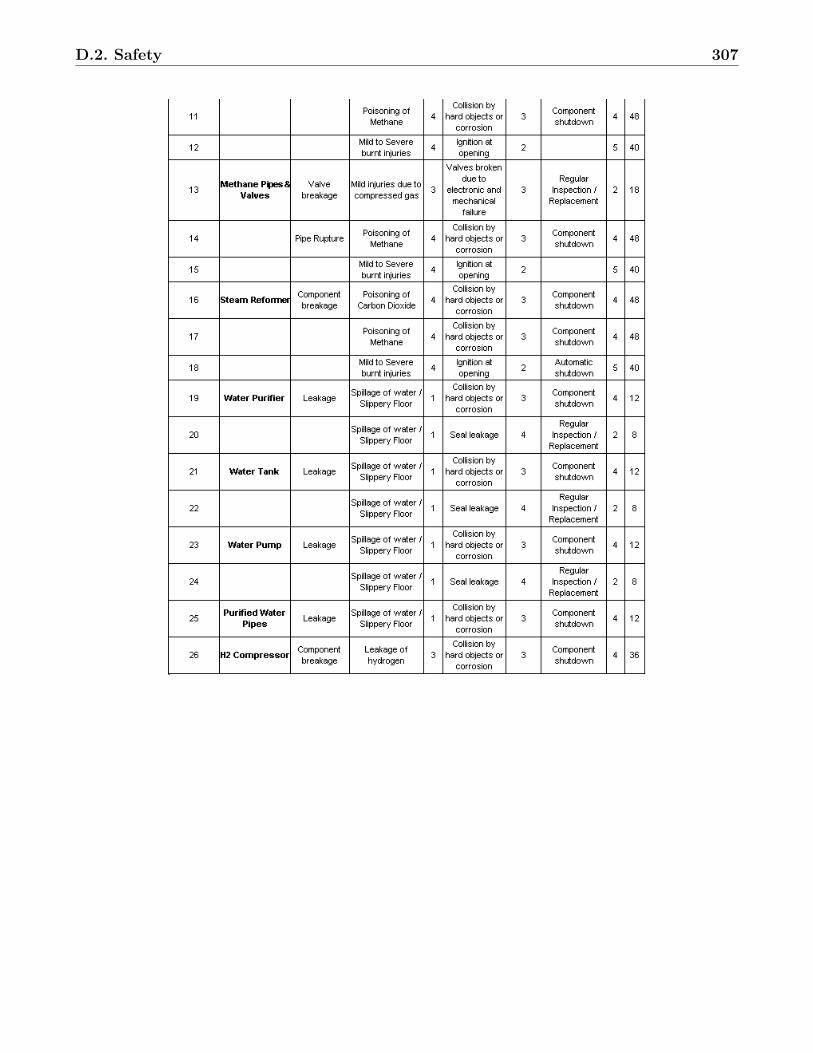
D.2. Safety 307
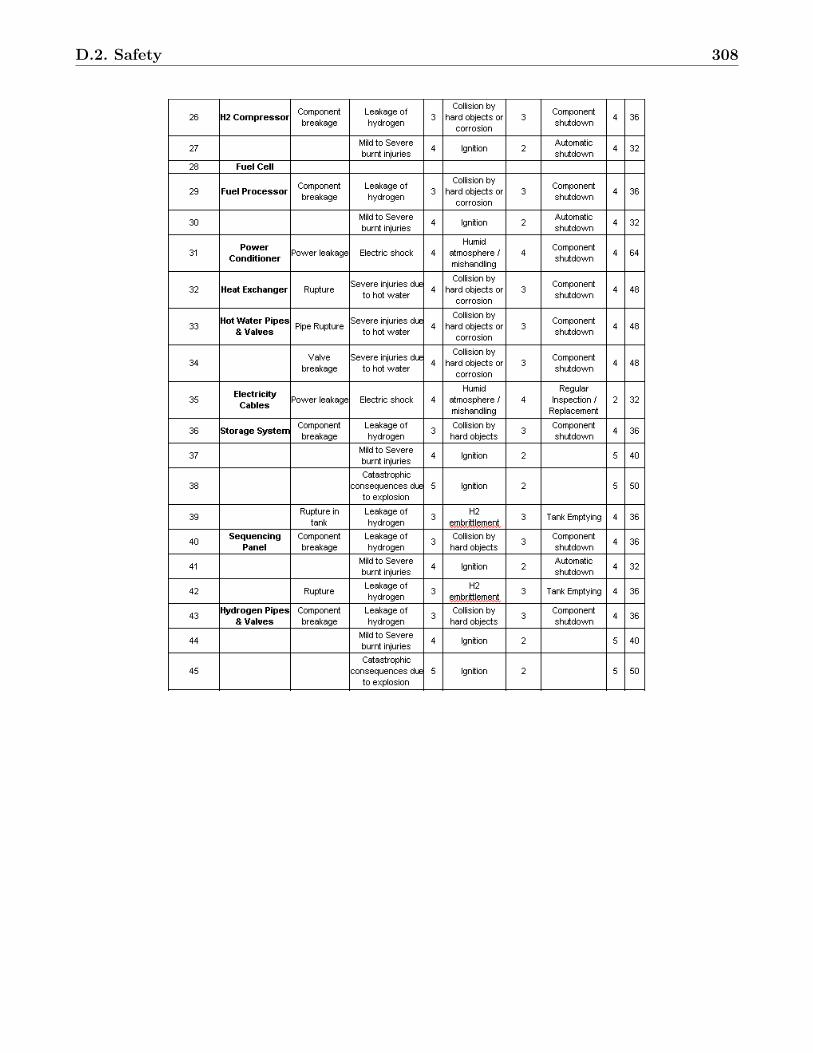
D.2. Safety 308
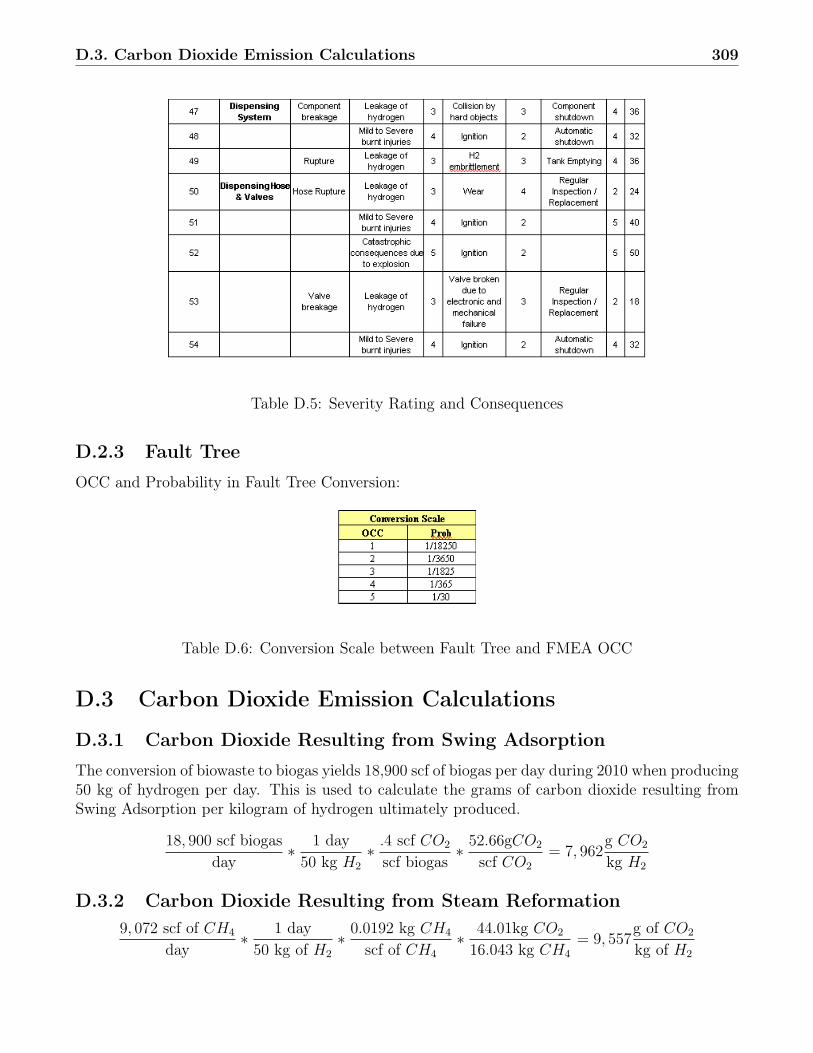
D.3. Carbon Dioxide Emission Calculations 309
Table D.5: Severity Rating and Consequences
D.2.3 Fault Tree
OCC and Probability in Fault Tree Conversion:
Table D.6: Conversion Scale between Fault Tree and FMEA OCC
D.3 Carbon Dioxide Emission Calculations
D.3.1 Carbon Dioxide Resulting from Swing Adsorption
The conversion of biowaste to biogas yields 18,900 scf of biogas per day during 2010 when producing50 kg of hydrogen per day. This is used to calculate the grams of carbon dioxide resulting fromSwing Adsorption per kilogram of hydrogen ultimately produced.
18, 900 scf biogasday
∗ 1 day50 kg H2
∗ .4 scf CO2
scf biogas∗ 52.66gCO2
scf CO2
= 7, 962g CO2
kg H2
D.3.2 Carbon Dioxide Resulting from Steam Reformation9, 072 scf of CH4
day∗ 1 day
50 kg of H2
∗ 0.0192 kg CH4
scf of CH4
∗ 44.01kg CO2
16.043 kg CH4
= 9, 557g of CO2
kg of H2
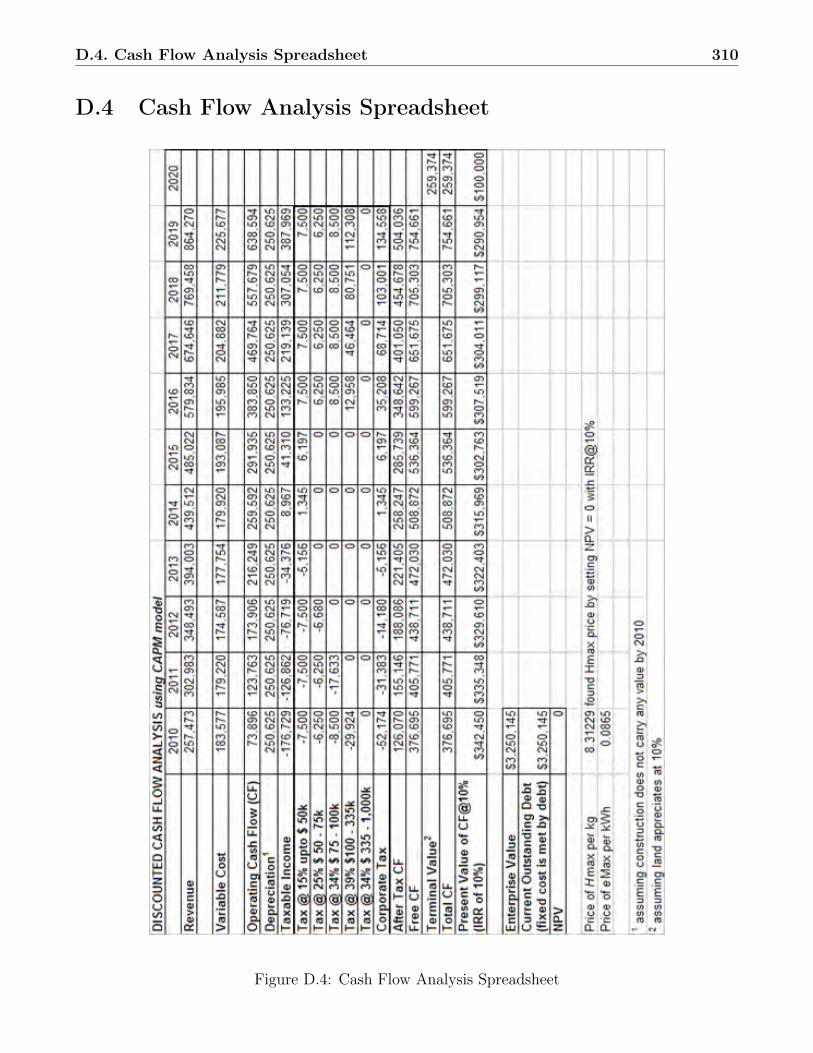
D.4. Cash Flow Analysis Spreadsheet 310
D.4 Cash Flow Analysis Spreadsheet
Figure D.4: Cash Flow Analysis Spreadsheet
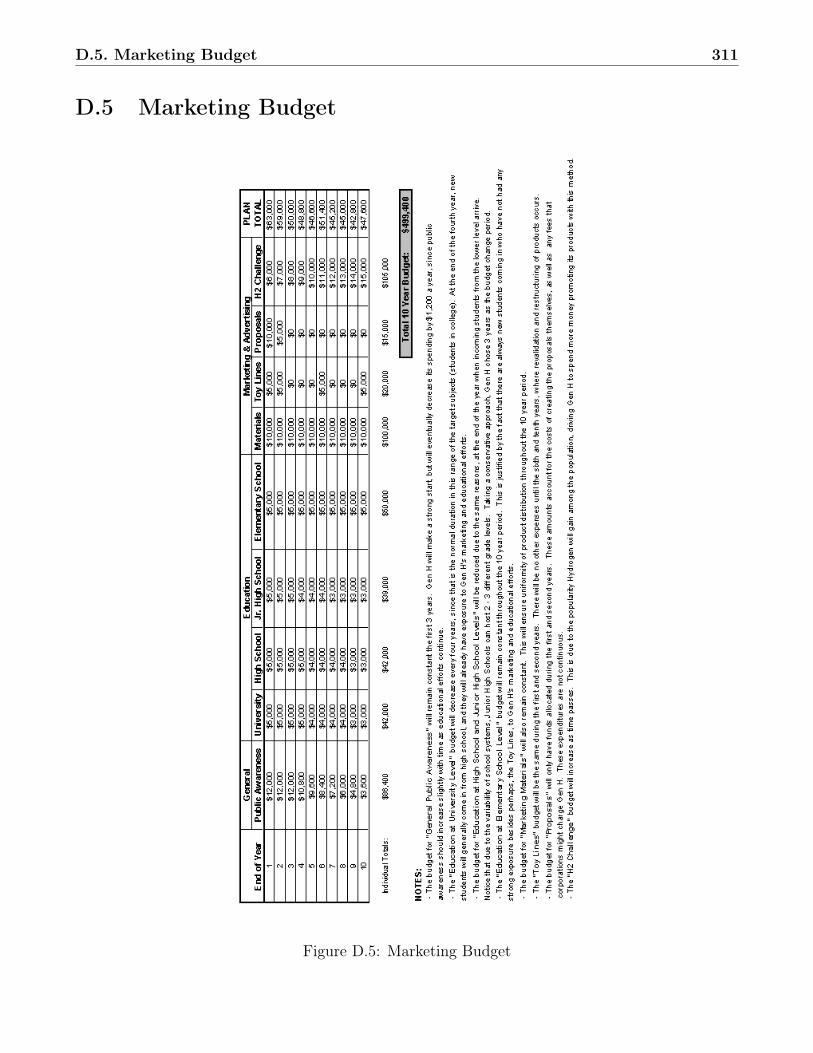
D.5. Marketing Budget 311
D.5 Marketing Budget
Figure D.5: Marketing Budget