
Hydrogen Delivery Infrastructure Analysis · Hydrogen Delivery Infrastructure Analysis Amgad...
24
Hydrogen Delivery Infrastructure Analysis Amgad Elgowainy and Marianne Mintz- Argonne National Laboratory Daryl Brown- Pacific Northwest National Laboratory May 10, 2011 PD 14 This presentation does not contain any proprietary, confidential, or otherwise restricted information 2011 DOE Hydrogen Program Review
Transcript of Hydrogen Delivery Infrastructure Analysis · Hydrogen Delivery Infrastructure Analysis Amgad...
Hydrogen Delivery Infrastructure Analysis
Amgad Elgowainy and Marianne Mintz- Argonne National Laboratory
Daryl Brown- Pacific Northwest National Laboratory
May 10, 2011
PD 14
This presentation does not contain any proprietary, confidential, or otherwise restricted information
2011 DOE Hydrogen Program Review

Start: FY 2007 End: Continuous
Lack of analysis of H2/carrier infrastructure options and tradeoffs
Cost and efficiency of delivery components
Lack of appropriate models and tools/stove-piped analytical capability
100% DOE funding FY10: $200 k FY11: $350 k
Timeline
Budget
Barriers/Challenges
Argonne National Lab Pacific Northwest National Lab National Renewable Energy Lab
Partners
Overview
2

Relevance Provide platform for comparing alternative component,
subsystem and system options to reduce cost of hydrogen delivery Expand Hydrogen Delivery Scenario Analysis Model (HDSAM) to include new
technology options (advanced station compression and storage, composite tube-trailers, FRP pipes, magnetic liquefaction)
Update capital investment for delivery components (current vs. future)
Update cost and price indices to be consistent across all H2A models suite
Investigate impact of delivery and dispensing options/strategies
Assist in program planning Investigate potential delivery pathways to achieve cost goals
Help with defining future funding priorities to achieve targeted performance
and cost goals
Develop new tools that build off existing DOE-sponsored tools (e.g., H2A production, Fuel Cell Power Model, GREET) Collaborate with model developers and lab partners
Collaborate with industry for input and review3
Create transparent, flexible, user-friendly, spreadsheet-based tool (HDSAM) to examine new technology and options for hydrogen delivery
Provide modeling structure to automatically link and size components into optimized pathways to satisfy requirements of market scenarios, and compute component and system costs, energy and GHG emissions
Collaborate to acquire/review input assumptions, analyze delivery and dispensing options, and review results
Provide thorough QA Internally via partners Externally, via briefings to Tech Teams, early releases to DOE
researchers, industry interaction
Approach
4

FY2011 Accomplishments
Month/Year Milestone
December 2010 Pipeline cost updates
February 2011 Cost/price index updates
March 2011Refueling station and delivery cost target
analysis
June 2011Investigate viability of geologic storage (cost and availability)
Continuous IEA Task 28 support (November 2010 startup)
September 2011 HDSAM 2.3
5

UPDATING PIPELINE COST FUNCTIONS
6
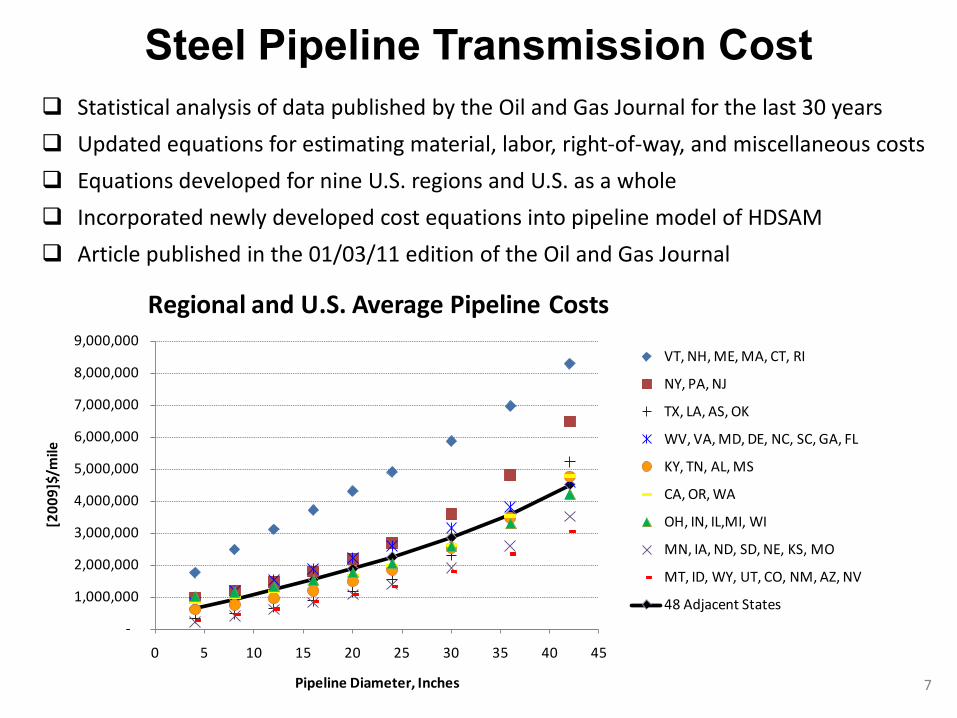
Steel Pipeline Transmission Cost Statistical analysis of data published by the Oil and Gas Journal for the last 30 years
Updated equations for estimating material, labor, right-of-way, and miscellaneous costs
Equations developed for nine U.S. regions and U.S. as a whole
Incorporated newly developed cost equations into pipeline model of HDSAM
Article published in the 01/03/11 edition of the Oil and Gas Journal
7
-
1,000,000
2,000,000
3,000,000
4,000,000
5,000,000
6,000,000
7,000,000
8,000,000
9,000,000
0 5 10 15 20 25 30 35 40 45
[200
9]$/
mile
Pipeline Diameter, Inches
Regional and U.S. Average Pipeline Costs
VT, NH, ME, MA, CT, RI
NY, PA, NJ
TX, LA, AS, OK
WV, VA, MD, DE, NC, SC, GA, FL
KY, TN, AL, MS
CA, OR, WA
OH, IN, IL,MI, WI
MN, IA, ND, SD, NE, KS, MO
MT, ID, WY, UT, CO, NM, AZ, NV
48 Adjacent States

Pipeline Cost Function Updates
Non-ROW costs have increased by up to a factor of two
ROW costs have increased the most on a percentage basis
0
500,000
1,000,000
1,500,000
2,000,000
2,500,000
3,000,000
0 2 4 6 8 10
[200
9]$/
mile
Pipe Diameter, Inches
Distribution non-ROW Pipeline Costs
HDSAM Large DowntownHDSAM Urban HDSAM Small Downtown Means Steel Dist.P&GJ "High" Steel
0
500,000
1,000,000
1,500,000
2,000,000
0 5 10 15 20 25
[200
9]$/
mile
Pipe Diameter, Inches
Transmission non-ROW Pipeline Costs
New U.S. OGJ > 1 mile Trans.
HDSAM Trans.
0
50000
100000
150000
200000
250000
300000
0 5 10 15 20 25
[200
9]$/
mile
Pipe Diameter, Inches
Pipeline ROW Costs
New U.S. OGJ > 1 mile Trans. ROW HDSAM Right of Way, All
8

Fiber-Reinforced Polymer (FRP) Piping Flexible, hence spoolable, high-pressure piping. Maximum spoolable
diameter about 6 inches
Material cost greater than steel, but labor cost less and labor dominates steel piping installed costs
Used in natural gas gathering; being tested at ORNL for use with hydrogen
Wide-ranging estimates of relative cost in literature; article co-authored by industrial customer (EnCana) most compelling
Ecana: 20% increase in material; 25% less labor; 15% overall reduction
Long-run: competition and installation learning should result in improved cost advantage relative to steel
9

COST/PRICE INDEX UPDATES
10

Chemical Engineering Plant Cost Index
11
Cost and Price Indices
2005 2006 2007 2008 2009 2010Overall Index 1.0 1.067 1.122 1.229 1.115 1.182
Equipment 1.0 1.081 1.148 1.282 1.132 1.221
Heat Exchanges and Tanks 1.0 1.066 1.152 1.338 1.086 1.206
Process Machinery 1.0 1.058 1.151 1.238 1.152 1.210
Pipe, valves and fittings 1.0 1.135 1.176 1.327 1.220 1.315
Process Instruments 1.0 1.100 1.114 1.138 1.041 1.095
Pumps and Compressions 1.0 1.044 1.105 1.158 1.192 1.197
Electrical equipment 1.0 1.083 1.157 1.232 1.240 1.295
Structural supports 1.0 1.069 1.133 1.280 1.076 1.177
Construction Labor 1.0 1.012 1.031 1.053 1.071 1.072
Buildings 1.0 1.053 1.071 1.139 1.105 1.141
Engineering Supervision 1.0 1.012 1.029 1.018 1.000 0.977
Bureau of Labor StatisticsYear Labor Cost Index2000 0.872001 0.892002 0.912003 0.942004 0.972005 1.002006 1.002007 0.992008 0.992009 1.03
AEO 2009 and GDP Implicit Deflator Price Index
0.80
0.90
1.00
1.10
1.20
1.30
2000 2002 2004 2006 2008 2010
REFUELING STATION ANALYSIS
12

Factors Impacting Station’s Capital Investment and Levelized Cost
FCV market penetration
1st plant vs. nth plant
Station size
Station utilization
Investment risk and rate of return
FCV onboard storage option
Station design configuration
13
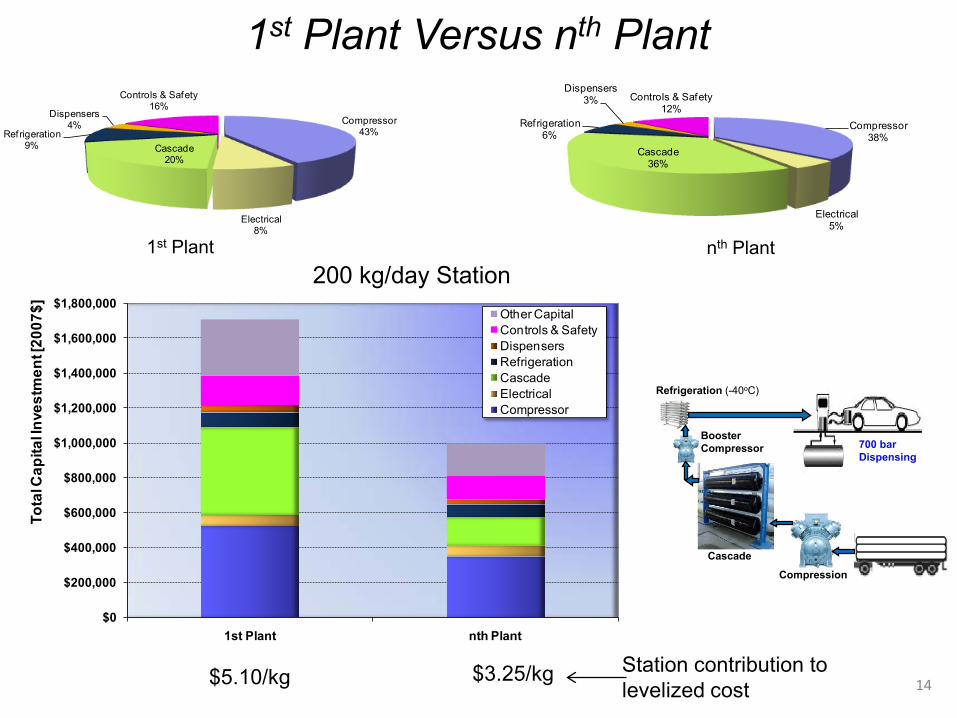
1st Plant Versus nth Plant
14
Compression
Cascade
700 bar Dispensing
Refrigeration (-40oC)
Booster Compressor
200 kg/day Station
$5.10/kg $3.25/kg Station contribution tolevelized cost
1st Plant
$0
$200,000
$400,000
$600,000
$800,000
$1,000,000
$1,200,000
$1,400,000
$1,600,000
$1,800,000
1st Plant nth Plant
Tota
l Cap
ital In
vest
men
t [20
07$] Other Capital
Controls & SafetyDispensersRefrigerationCascadeElectricalCompressor
Compressor38%
Electrical5%
Cascade36%
Refrigeration6%
Dispensers3% Controls & Safety
12%
nth Plant
Compressor43%
Electrical8%
Cascade20%
Refrigeration9%
Dispensers4%
Controls & Safety16%

$0
$500,000
$1,000,000
$1,500,000
$2,000,000
$2,500,000
100 kg/day 200 kg/day 400 kg/day 1000 kg/day
Tota
l Cap
ital In
vest
men
t [20
07$] Other Capital
Controls & SafetyDispensersRefrigerationCascadeElectricalCompressor
Station Size
15
$3/kg
$5/kg
$4/kg
$2/kg
Stat
ion
Con
trib
utio
n to
H2
Leve
lized
Cos
t [$/
kg]

Station Utilization*200 kg/day Station
16
*utilization = actual daily amount dispensed / projected daily demand for the stationFor example: 30% utilization of a 200 kg/day station means that the station is dispensing only 30% of 200, i.e., 60 kg/day
$-
$2.00
$4.00
$6.00
$8.00
$10.00
$12.00
Full Utilization 70% Utilization 50% Utilization 30% Utilization
Sta
tion
Leve
lized
Cos
t [20
07$]
/kg Energy
O&M
Installed Capital
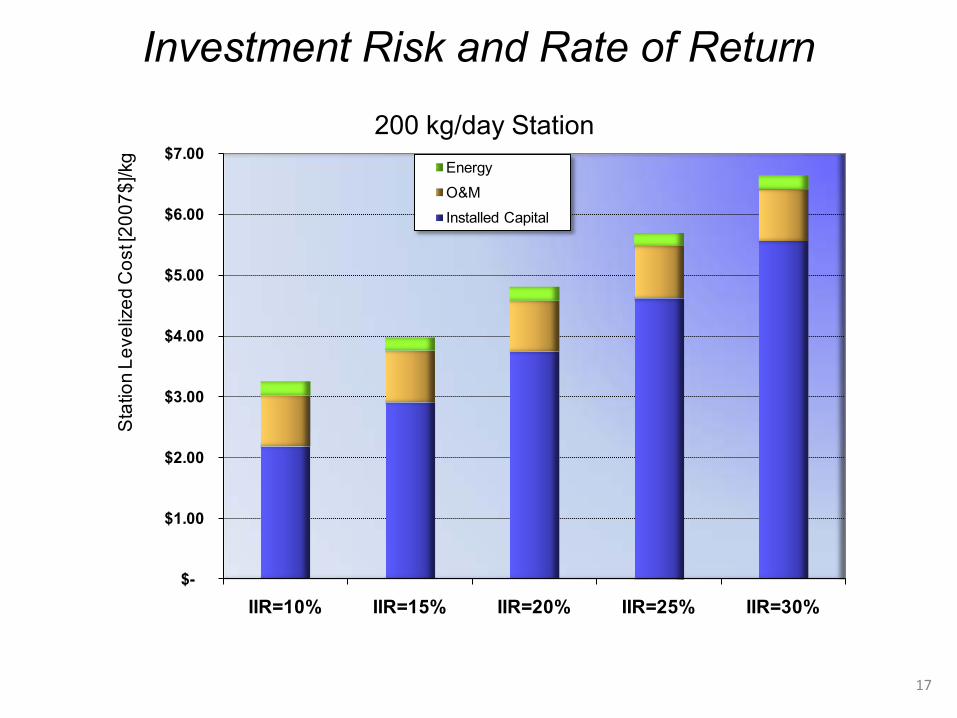
Investment Risk and Rate of Return
200 kg/day Station
17
$-
$1.00
$2.00
$3.00
$4.00
$5.00
$6.00
$7.00
IIR=10% IIR=15% IIR=20% IIR=25% IIR=30%
Sta
tion
Leve
lized
Cos
t [20
07$]
/kg Energy
O&M
Installed Capital

FCV Onboard Storage Option
200 kg/day Station
$1.85/kg$3.25/kg $2.60/kg18
Station contribution tolevelized cost
$0
$200,000
$400,000
$600,000
$800,000
$1,000,000
$1,200,000
700 bar 350 bar CcH2
Tota
l Cap
ital In
vest
men
t [20
07$] Other Capital
Controls & SafetyDispensersRefrigerationCascade/StorageElectricalCompressor/Pump
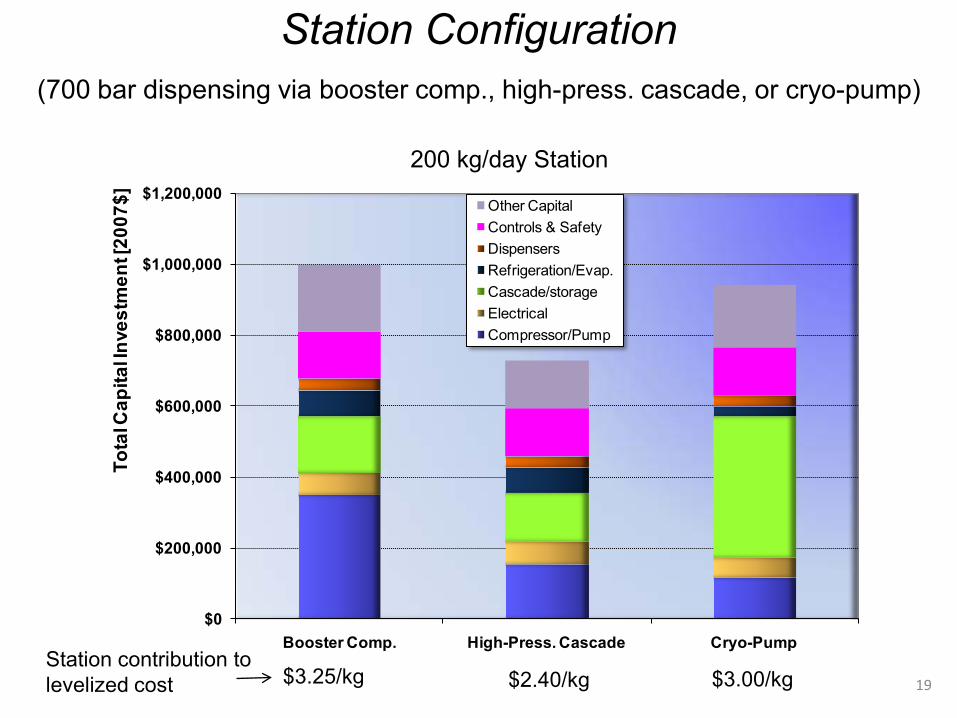
Station Configuration(700 bar dispensing via booster comp., high-press. cascade, or cryo-pump)
200 kg/day Station
$2.40/kg$3.25/kg $3.00/kg 19
Station contribution tolevelized cost
$0
$200,000
$400,000
$600,000
$800,000
$1,000,000
$1,200,000
Booster Comp. High-Press. Cascade Cryo-Pump
Tota
l Cap
ital In
vest
men
t [20
07$] Other Capital
Controls & SafetyDispensersRefrigeration/Evap.Cascade/storageElectricalCompressor/Pump

DELIVERY COST TARGET ANALYSIS
20
21
Objectives of Delivery Cost Target Analysis
Understand the impact of delivery technology options and economies of scale on hydrogen delivery cost
Examine the cost of various delivery options with respect to a delivery cost target of $2/kg
Identify components with the greatest impact on delivery cost for future research and development

$-
$2.00
$4.00
$6.00
$8.00
$10.00
Leve
lized
H2
Deliv
ery
Cost
(200
7$/k
g)
Infrastructure Storage
Tube-Trailer
LH2 Truck
Pipeline
Terminal
Liquefier
Refueling Station
22
Levelized Hydrogen Delivery Cost Reduction Path
5,000 FCVs200 kg/day Station
100,000 FCVS600 kg/day Station 1,000,000 FCVS, 1000 kg/day Station

Future Work
Month/Year Milestone
June 2011 Complete delivery cost target analysis
June 2011 Investigate viability of geologic storage (cost and availability)
December 2011 Post HDSAM 2.3
September 2012 Examine technology and pathway options to reduce refueling station cost
23

Relevance: Provide platform to evaluate hydrogen delivery (in $, energy and GHG emissions), estimate impact of alternative conditioning, distribution and storage options; incorporate advanced options as data become available; assist Hydrogen Program in target setting.
Approach: Develop models of hydrogen delivery components and systems to quantify costs and analyze alternative technologies and operating strategies.
Collaborations: Active partnership among ANL, PNNL and NREL, plus regular interaction with Fuel Pathways and Delivery Tech Teams, DOE researchers and industry analysts.
Technical accomplishments and progress:
– Pipeline cost updates and alternative technologies evaluated
– Delivery pathway options for cost target analysis begun
– Fuel station cost re-evaluated
– Analysis of geologic storage cost and availability begun
Future Research: Expand models to include new technology options for refueling stations (advanced compression, storage), revise/update data, and respond to Tech Team recommendations.
Project Summary
Amgad [email protected] PD14
24