
Hydrocarbons in Marine Organisms and Sediments off West...
27
Hydrocarbons in Marine Organisms and Sediments off West Greenland Poul Johansen Greenland Fisheries Investigation, Charlottenlund Denmark Vibeke B. Jensen Water Quality Jnstitute, Horsholm, Denmark Arne Biichert National Food Institute, Soborg, Denmark Issued by: Fisheries and Marine Service T echnology Branch Halifax, Nova Scotia Edited by: R. G. Ackman July 1977 Fisheries and Marine Service Technical Report No. 729
Transcript of Hydrocarbons in Marine Organisms and Sediments off West...

Hydrocarbons in Marine Organisms and Sediments off West Greenland
Poul Johansen Greenland Fisheries Investigation, Charlottenlund Denmark
Vibeke B. Jensen Water Quality Jnstitute, Horsholm, Denmark
Arne Biichert National Food Institute, Soborg, Denmark
Issued by:
Fisheries and Marine Service T echnology Branch Halifax, Nova Scotia
Edited by: R. G. Ackman
July 1977
Fisheries and Marine Service T echnical Report No. 729

Fisheries and Marine Service
Technica l Reports
These reports contain scientific and technical information that represents an important contribution to existing knowledge but which for some reason may not be appropriate for primary scientific (i .e. Journal) publication. Technical Reports are directed primarily towards a world wide audience and have an international distribution. No restrietion is placed on subject matter and the series reflects the broad interests and policies of the Fisheries and Marine Service, namely , fisheries management, technology and development, ocean sciences and aquatic environments relevant to Canada.
Technical Reports may be cited as full publications. The correct citation appears above the abstract of each repart. Each rcport wilJ be abstracted in Aquatic Sciences and Fisheries Abs/mos and will be indexed annually in the Service's index to scien ti fic and technical p ubl ications.
Numbers 1-456 in thi s series were issued as Technical Reports of the Fishcries Research Board of Canada. Numbers 457-714 were issued as Department of the Environment, Fisheries and Marine Service, Research and Development Directorate Technical Rcports. The series name was changed with report number 715 .
Details on the availability of Technical Reports in hard copy may be obtained from the issuing establishment indicated on the front cover .
Service des peches et des sciences de la mer
Rapports techniques
Ces rapports contiennent des renseignements scientifiques et techniques qui constituent une contribution importante aux connaissances actuelles mais qui, pour une raison ou pour une autre, ne semblent pas appropries POUl' la publication dans un journal scientifique. II n 'y aaucune restrietion quant au sujet, de fait, la serie reflete la vaste gamme des interets et des politiques du Service des peches el de la mer, notamment gestiol1 des peches, techniques et developpement, sciences oceaniques et environnements aquatiques, au Canada.
Les Rapports techniques peuvent etre consideres comme des publications completes, Le titre exact paraitra au haut du resume de chaque rapport, qui sera public dans la revue Aqua/ic Sciences and Fishedes Abs/mcts et qui figurera dans l 'index annueJ des publications scientifiques et techniques du Service.
Les numeros 1-456 de cette serie ont ete publies a titre de Rapports techniques de l 'Office des recherches sur les pecheries du Canada. Les numeros 457-700, a titre de Rapports techniques de la Direction generale de la recherche et du developpement, Service des peches et de la mer, ministere de l'Environnement. Le 110m de la serie a ete modi Fie a parti r du numero 70 l .
La page couverture porte le nom de )'etablissement auteur ou l'on peut se procurer les rapports sous couverture cartonnee .
• Cover deSign by Chr istine Rusk

Fisheries and Marine Service
Technical Report No. 729
July 1977
HYDROCARBONS IN MARINE ORGANISMS
AND SEDIMENTS OFF WEST GREENLAND
by
Poul Johansen Greenland Fisheries Investigation
l B, Jaegersborg Alle DK-2920 ' Charlottenlund, Denmark
Vibeke B. Jensen Wate~ Quality Institute
11, Agern Alle DK-2920 HØrsholm, Denmark
and
Arne Buchert National Food Institute
19, MØrkhøj Bygade DK-2B60 Søborg, Denmark
Edited by:
R. G. Ackman
Fisheries and Marine Service Technology Branch
1707 Lower Water Street P.O. Box 429
Halifax, N.S., B3J 2R3, Canada

TABLE OF CONTENTS
Preface ------------------------------------------------------ v
AbstractjResurne ---------------------------------------------- vii
Introduetion ------------------------------------------------- l
Materials and Methods ---------------------------------------- l
Sampling and preservation ------------------------------- l
Lipid analysis ------------------------------------------ l
Dry-weight analysis ------------------------------------- l
Hydrocarbon analyses ------------------------------------ l
Clean-up procedures -------------------------------- l
Gas chrornatography (GC) ---------------------------- 2
Gas chrornatographyjmass spectrometry analysis ----------- 2
Results ------------------------------------------------------ 2
Gas chrornatographyjmass spectrometry analysis ----------- 2
Sediments and invertebrates ----------------------------- 3
Fish ---------------------------------------------------- 3
Discussion --------------------------------------------------- 3
Hydrocarbon sources ------------------------------------- 3
Biogenic hydrocarbons ----------------------------------- 3
Petroleum hydrocarbons ---------------------------------- 3
Uptake and fate of hydrocarbons in marine organisrns ----- 4
Hydrocarbons in sediments ------------------------------- 4
Evaluation of the analyticai results -------------------- 4
Evaluation of the sample material ----------------------- 4
Evaluation of the analyticai method --------------------- 5
Acknowledgements --------------------------------------------- 5
References --------------------------------------------------- 5
Figures ------------------------------------------------------ 9
Tables ------------------------------------------------------- 15
iii

PREFACE
Canada shares her northern waters with several
neighbors. There is a common concern in this comrnunity
of interests that undue haste in development and in
exploiting natural resources may adversely affect vital
renewable resources such as fisheries. Many of these
fishery resources are shared geographically between
Canada and Greenland. The Halifax Laboratory is therefore
pleased to sponsor this record of research executed by our
Danish cOlleagues as a contribution to the successful future
development of fishery and other resources of mutual interest.
E. Graharn Bligh
v

ABSTRAC':T
Johansen, Poul. vibeke B. Jensen, and Arne B~chert_ 1977. Hydrocarbons in Marine Organisms and SedimLnts off
West Greenland- (Edited by R. G. Ackman). Fish. Mar. Serv. Tech. Rep. 729: 33 p.
Examination of the hydrocarbons in invertebrates, fish, and sediments from the West Greenland marin~
are a has been performeq by mean~ of gas chromatography and gas chromatography/mass spectrometry.
As the area off West Greenland must be considered almost unpolluted until now, ·,..e have tak"n lhe
opportunity to establish the natural levels of biogenic hydrocarbons.
Isolation and identification of the hydrocarbons showed that pristan.:.: (2,<>,lO,14-tctramethylp',nta
decane) and/o r squalene (a non-cyclic dihydrotriterpenc, CJOHSO
) wcre the main coml'0nent~ in thc analytic'll
material. Three other hydrocarbons were isolated in smaller quantiti(~s, onc of which wa :' identified as a
n-alkene with the formula C19
H38
- The position of the double bond is probably between C4
and eS
- Another
hydrocarbon had the formula C20
H38
and a branche d and unsaturated structure. Presumably, the component could
be phytadiene (2,6,lO,14-tetramethylhexadecadiene), which has previously been found in zooplankton. The last
component isolated had a branched and highly unsaturated structure, which probably caused an unstablG characler
as in the case with squalene- The incidence and the levelof biogenic hydrocarbons an' discuss~d.
Johansen, Poul, Vibeke B_ Jcns(,'O alld Arnc Uu-.:Il(~-l"l'_
West Greenland. (Edited by R. G_ Ackman). \"ish_ Mar. Serv. Tcch. RC'p. n~l: 33 p-
L'analyse chimiquc des hydroci1.rbl1rc~ pH~sent-:; ddns les invertcbn~~;, J<.':~ ['oi:,sons et lc's f;t5\iim(~ rrl.s
mari.ns de l' OU8St du Groenland s' est fai te par chromatographie en phase ga2'.'usC et par spectrometriE' de mas,~e
couplee a la chromatographie en phase gazeuse.
Comme, jusqu'a ce jour, cette partie du globe peut encore etre consideree comme presque non polluec,
il a f te possible de determiner les concentrations naturelles des hydrocarbures synthetises par la matiere
vivante_
ApreS avoir isole et identifie les hydrocarbures contenus dans les echantillons preleves, nous avons
etabli que les deux eomposes suivants etaient: les plus repandus: le pristane (tetramethyl-2,6,lO,14 pcntadecan<.:
et le squalenc (un dihydrotriterpene acyclique, C30
HSO
)' Trois autrc~ hydrocarbures ont ete isoles en petit~s
quantites. L'un deux etait un alcene lineaire de formule Cl9
H38
avec la double liaison probablement situr.e
entre les carbones 4 et 5. L'autre (C 20H38
) presentait une structure ramifiee et non satureei on pr,:slln\:': 'JI~' il
s'agit du phytadiene (tetramethyl-2,6,lO,l4 hexadecadiene) dont la presence a deja ete decelee dan~ lo ~oo
planeton. Le dernier possede une structure ram~fiee et fortement insaturee, ce qui . .'xplique sans doute son
caractere instable apparent«~ a cclui du squalcnc. Le- rapport tralte des conc.:.:ntrati.ol\~ d'hydrocarbun'l:) che:~
les organismes vivants et de ll_'ur incirlenc(~ slIr cC'IlX-C\_
vij
INTRODUCTION
The occurrence of hydrocarbons in marine organisms and sediments off West Greenland is being investigated in order to obtain basel ine data for the area. The investigations on the background \'Iere started in 1975, the same year that petroleum exploration licences were issued for an area between 63° and 68° N lat. (Fig. l).
The studies were initiated principally because of the extreme vulnerability of the arctic environment to petroleum pollution. This is aresult of the effect of the low temperature on both the physical nature of petroleum and on bio logi cal processes. For example biodegradation is known to be a slow-acting process in the arctic compared to biodegradation in temperate areas. Also more petroleum may be dissolved/dispersed at higher than at lower temperatures, and evaporation is less at lower than at higher temperatures. Further, are tic marine organisms grow slower than the same species in more southern latitudes. Finally the biological productioo, especiaily the plankton produetion, is concentrated in a short period of the year, compared to temperate areas. All facts mentioned here indicate that pollution by petroleum will affect the marine environment more severely in arctic than in temperate areas, as more petroleum will remain in the environment for longer periods, and as the biomass will regenerate more slowly, once affcctcd.
In addition to the concern expressed abovc, which is general for the arctic, a specific concern exists for the concession area off West Grocnlancl, narnely that an important commercial fishery takes place within the concession area. A largo oi l spi11 would probably affect the fishery. Finally thc concession area hosts important populations of sea birds (guillemots and others), which may be affected by a spil!.
The general and the specific concern expressed here points to the need for thorough control of the effect of oil spills, and the study rC'ported bere aims at obtaining information on existillg hydrocarbon concentrations and to develop methods that will delineate the impact on the environment of ~ spill, should it occur.
MATERlALS AND METHODS
SAMPLING AND PRESERVATION
Samples of invertebrates, fish and sediments were obtained during a cruise with the Danish research vessel DANA in the period 28 July to 13 August 1975_ Sampling was done over a considerable depth range, from approx. 20 ro to approx. 600 m, and in a relatively large area (Fig. 2). Variaus gear was used: dredges, grabs, trawls, plankton-nets, and handlines.
Contamination of samples by fuel oil, lubricants etc. on board a ship involves considerable difficulties_ Attempts were made to avoid contamination , for example by solvent-rinsing equipment sueh as grabs
l
and knives before use, and by shutting off the discharge af water from the engine room (caoling water and bilge {-.rater) during sampling, as this discharge obviously was the source of an oil film spreading around the vessel.
Most samples were stored in glass jars, and aluminium foil was put between the edge of the jar and the plastic lid, to avoid contamination from the lid. Some samples, i.e. whole fish, were stored in plastic bags. Contamination was not expected to arise from the bags, sinee the tissue actually used for analysis had not been in contact with the bag. Samples were frozen within few hours of collection and kept frozen until analyses were made.
LIPID ANALYSIS
Total lipid of the samples was deterrnined by Soxhlet extraction overnight of dried material with pentane. The pentane phase was dried (Na2S04)'
evaporated to dryness, and the residue was estimated by weighing.
DRY-WEIGHT ANALYSIS
Dry-weight of the samples was determined by drying the material at 105°C to constant weight.
HYDROCARBON ANALYS!S
In general thc procedures of Farrinqton and Tripp (1975) and Farrington Cllld Mederias (1975) werc applied for extraction and isolation af. t.hc C lCC
36 hydrocil.t:"bons. Al.! -;olvents were d1.stillcd
before use. Soli ,i rCLiqenLo, wcre pre-extr;)r.ted with distilled solvents, and ~ll qlasswarc was solventrinsed_ Blanks wcre routincly run through the entire procedure to check for contamination from reagents or handling.
Clean-up Procedure
Approximately 20 g (ineluding liquids) af biological material (liver tissue only 2.5 g) or 50 g of a sediment sample was used for analysis. Af ter homogenization in a blender, the sample was refluxed for two hours with 80\ methanol containing 67 g KOH/Q. There must be at least 25% of water in the saponification mixture. Af ter cooling, the mixture was filtered with suction, if solid materials were found (e.g. sediments and shells). The residue was washed on the filter with a small volume of pentane. The saponification mixture, if filtration was unnecessary, or the whole filtrate, was extracted three times with pentane. The extract was evaporated on a rotary evaporator until reduced to 1-2 ml. Column chromatography of the extract was performed by using a column af equal amounts of aluminia (Al?03) packed on top of silica (SiO? ). Tlw AJ ;:>0 j und S~02 wcr~ rlctivated overnight at 250°C and lSaoC respcctively, and then both werc dC-iH:tivated with 5% of water. TI1e ratio nf column material to non-saponifiable lipid had to be 100:1 or more. The extract was eluted with 1.5 column volumes (from 15 to 75 ml) of pentane + benzene (80 + 20). The eluate was
evaporated nearly to dryness on a rotary evaporator and then redissolved in a small volume of CC14' A few rnicrolitres were injected into the gas chromatographic column.
Gas Chromatography (GC)
The equipment used was a Hewlett-Packard Model 5830 A with a flame ionization detector (FID). The oven was programmed from esoc to 27SoC at 4°C/min. One glass column of 1.8 m in length packed with 3% OV-l was used. Nitrogen (N2) was used as carriergas at a flow rate of about JO ml/min.
A standard n-alkane mixture of known concentration was used to-measure detector response per unit weight of alkane. C22 was used as an internal standard.
GAS CHROMATOGRAPHY/MASS SPECTROMETRY (GC/MS)
The GC/MS analyses were made by using glass columns packed with either 3% Dexsil 300 or 3\ OV-17. The oven was programmed from 1S0°C to 320°C at 10°C or lSoC/min. The column was coupled to a Varian MAT 311 mass spectrometer through a BiemannWatson separator kept at 250°C. with the ion source temperature at 200°C, mass spectra of the eluted components were recorded at an accelerating voltage of 3 KV and an electron energy of 70eV.
RESULTS
Results from the analytieal estimation of the hydrocarbons, lipid analyses and dry weight analyses are presented in Tables 1-16. "position" in the tables refers to the number position shown in Fig. 2. The hydrocarbons estimated in each cas~ are indicated by the retention time relative to C22, obtained on an OV-l column. The mean values and the sum (total) of the identifiable hydrocarbons are calculated and mentioned in the tables. A list ' of the relative retention times for n-alkane standards (C14-C36' C33 is lacking) are given in Table 17. The figures are mean values of several determinations. Normaily the reten tion times alone werl' used to deterrnine unknown hydrocarbons. In il few cases, hydrocarbons were identified by gas chro~atography/mass spectrometry (see below).
At the beginning of the analyticai work attention was focussed an the range of concentration of hydrocarbons higher than 0.05 ~g/g in sample~ of low lipid content and higher than 0.5 ~g/g in . samples of high lipid content. Later an attempt was made to reduce the detection limits by a factor af five. This has been taken into account in the tables under "deteetion limit".
Squalene is very unstable and the quantitative estimat ions are therefore doubtful because of degradation of the hydrocarbon during the analytical procedure. Presumably, this is also the case for other hydrocarbon~ af 'an unsaturated structure. This faet reduces the accuracy af the analytical results ef same of the hydrocarbons. Also analytical estimations of concentrations near the deteetion limits are sUbjeet to a relatively high degree of uncertainty. Several of the un-
2
identified hydrocarbons found in the sample mat~rial are probably the same components (i.e., have the same or nearly the same retention time). Through gas chromatography it is only possible to distinguish between hydrocarbons that have a difference in the relative retention time of more than 0.03.
GAS CHROMATOGRAPHY/MASS SPECTROMETRY ANALYSIS
A list of results from the GC/MS aoalysis is given in Table 18. Isolation and identification of the hydrocarbons showed that pristane (2, 6, 10,14-tetramethylpentadecane) and/or squalene (a noocyclic dihydrotriterpene, C30HSO) were the major components in the analyticai material. Identification of pristane and squalene was based on spectra of standard solutions. Therefore, the detection of those two hydrocarbons is unequivocal.
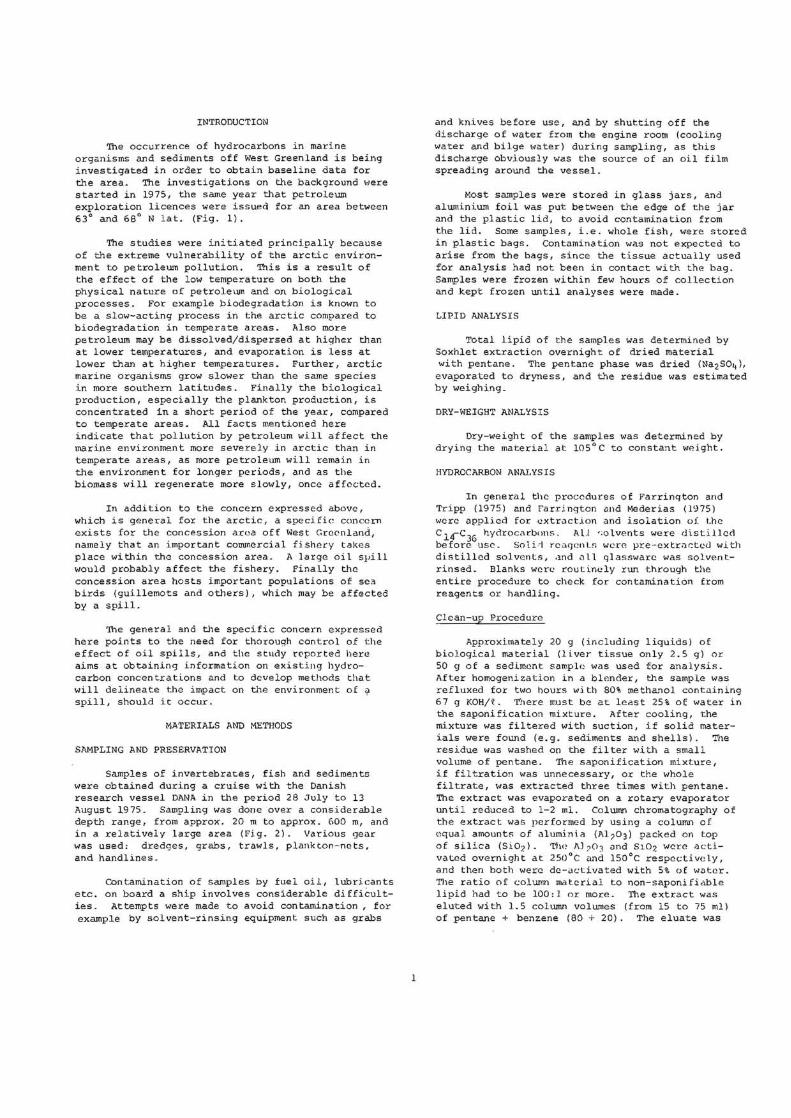
Three more hydrocarbons were isolated in small quantities. One of those hydrocarbons was found in rcdfish (Sebastes marinus). Fig. 3 shows thc mass spectrum of the component (retention time relative to C22:0.76). The peak mie = 278 a.m.w. (probably the m01ecular peak) gives the molecular weight corresponding to the formula C20H3B' The pattern of the spectrum indicates that the component is a branched unsaturated hydrocarbon, presumably with wo double bonds instead of one triple bond. The spectrum suggests the foliowing formula:
The C7Hll-part contains the two double bonds and is possibly of a branched structure. The C2H4-part may have a methyl-substitute, and the C1IH23 -part has at least two branching points.
The peaks of the mass spectrum at m/e = 179 and 193 a.m.w. indicate the fo110wing possibilities for the CIIH23-part:
CH2-CHZ-CH2-CH-C6HI3
\ CIi:~
The isolated componcnts might be phytadicnc (2, 6, IO, 14-tetramethyl hexadecadienc), which has previously been detected in zooplankton by Blumer et al. (1969).
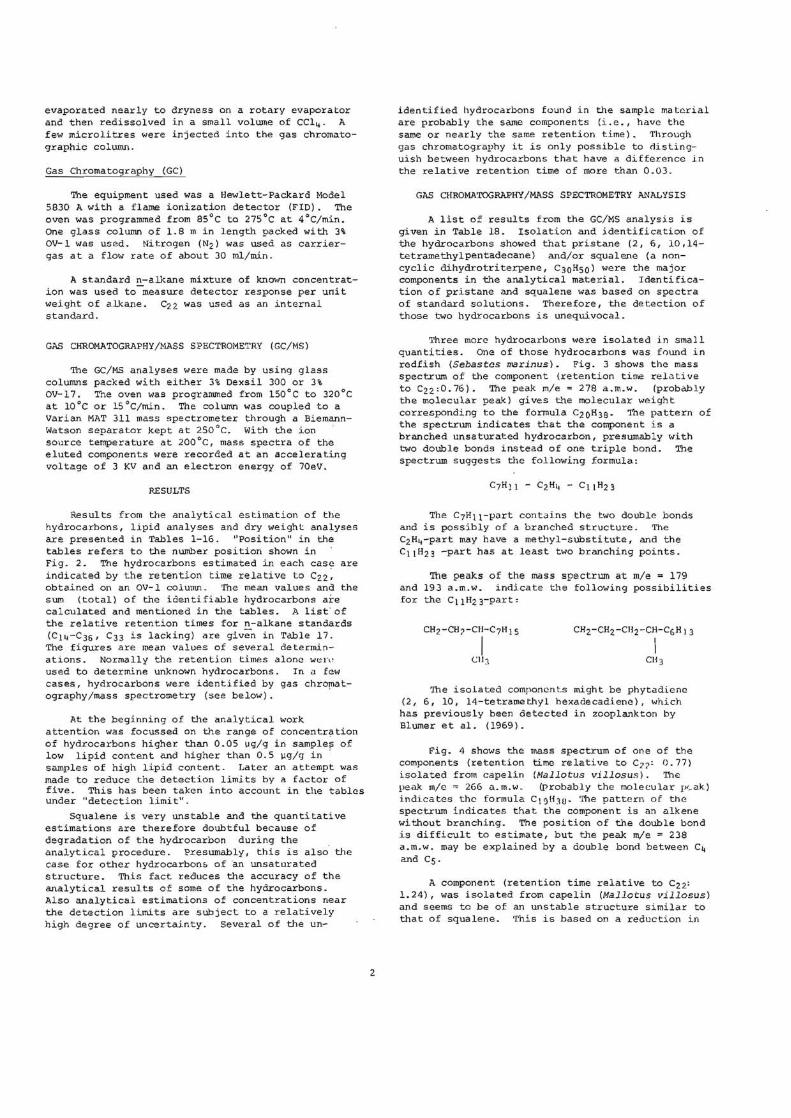
Fig. 4 shows the mass spectrum of one of the components (retention time relative to en: O.77) isolated from capelin (Mallotus villesus). The peak mie ~ 266 u. m.w. (Probably the molecular pr_ak) indicates thc formula C19H:\U' The pattern of the spectrum indicates that the component is an alkene without branching. The position of the double bond is difficult to estimate, but the peak m/e = 238 a.m.w. may be explained by a double bond between C4 and Cs.
A component (retention time relative to C22: 1.24), was isolated from capelin (Mallotus villosus) and seems to be of an unstab1e structure similar to that of squalene. This is based on a reduction in

thø concentration of the components from that ini tially obaarved in the GC analysis to the time whon the GC/MS analysis was made. The mass spectrum shows 00 molecular peak, for which reason it is impossible to give a formula of the component. The spe ctrum geems to indicate a polyunsaturated structure with conjugated double bonds. Presumably, the molecule is branched.
SEDIMENTS AND INVERTEBRATES
A eummary of the content of pristane, squalene and the total amount of hydrocarbons in sediments and lnvartebratos is presentad in Table 19.
On a wet weight basis the hydrocarbon levele are low in all sediments and invertebrates, except in shrimp (Pandalus borealis) and zooplankton. Pristane is found in a considerable amount in ehrimp. It is notable that the pristane concentration in shrimp varies considerably, depending on the position of srumple collection (Table 6). The variation of the pristane concentration in shrimp collected at the same position indicates a considerable difference between the concentration of pristane in the individual shrimp. In zooplankton pristane is found in a re1atively high concentration in one sample from position 42 (Table 3). The total concentrations of hydrocarbons in all other invertebrates analysed are be10w 1.5 ~g/g wet weight. As dry weight and lipid content of most invertebrates are very low, the total amount af hydrocarbons on dry \.,.eight and lipid basis ean be considerable , in spite of the low levelon wet weight basis. The mean value of the total amount of hydrocarbons in sediments is 0.40 (range 0.06-1.30) ~g/g dry weight. Pristane and squa1ene are frequently found in both invertebrates and sediments.
FISH
A summary of the content of pristane, squalene and the total arnount of hydrocarbons in liver and muscle samples from fish is presented in Table 20.
In most cases squalene is the dominating hydrocarbon, especiaily in Greenland halibut (Reinhardtius hippoglossoides) (Table 12). Pristane is also frequently found in fish. In redfish (Sebastes marinus) and capelin (Mallotus villosus) pristane is the most prominent hydrocarbon (Tables 15 and 16). The bulk of the pristane and squalene is found in the liver tissue, but muscle tissue of high lipid content may also contain a considerable amount. It has only been possible to detect hydrocarbons other than pristane and squaIene in smalle r quantities. Therefore practi~ally the total amount of hydrocarboTls in many of the samples is the sum of the squalene and the pristane concentration. AB is the case with shrimp, the concentrations of the single hydrocarbons var y considerably from fish to fish of the same species.
DISCUSSION
HYDROCARBON SOURCES
Hydrocarbons in the marine environment are derived from different sources such as biosynthesis (by 1iving organisms in the water, on th~ sea floor and in sediments), advection (through land run-off), precipitation (from the atmosphere, and accidental or intentional release of fossil
3
fuels during produetion, transportation and use (Anon, 1975; Farrington et al. I 1975; MCAuliffe, 1976) .
BIOGENIC HYDROCARBONS
Marine organisms make their own hydrocarbons (Blumer et al., 1971; Youngblood et al., 1971; Ehrhardtand Blumer, 1972, Farrington et al., 1973; HacJde et al. I 1974 i Whittle et al. I 1974; Anon, 19751 Yen, 1975).
The organismB synthesize n-alkanes, predominan tly wi th odd-numbered carbOlL chains. In many instances, o~e or two odd-numbered, ~-alkanes are predom1nant. Branched a1kanes, including pristane, have been found in several organisms. In some species of fish pristane is the IOOst abundant hydrocarbon. Alkenes often make up a major proportion of the hydrocarbons found in marine organismB. An exarnple is squalene, which is found in livers of some species of fish. Isoprenoid C19 and C20, mono, di, and tri-olefins are present in copepods and some species of fish. Straight-chain mono- to hexa-olefins have been found in considerable quantities in many organisms. It has been suggested that polynuclear, aromatic hydrocarbons may be synthesized by marine microorganisrns. Until now aroma ti c hydrocarbons have been found in extremely low concentrations, generally less than l per cent of the total hydrocarbons of marine organisms.
Only a limited number of marine species from a few geographic locations have been analysed for their native hydrocarbons, and many investigators have limited their analyticaI techniques to searching for only one or two classes of hydrocarbons, usually alkanes and alkenes. Thus other cl asses of hydrocarbons might be more prevalent in nature than the limited analyses suggest.
PETROLEUM HYDROCARBONS
Petroleum and biogenic hydrocarbons may be distinguished in several ways: (Ehrhardt and Blumer, 1972; Farrington et al., 1973; Anon, 1975; Farrington et al., 1975)
Petroleum contains a much more complex mixture of hydrocarbons with much greater ranges of molecular structure and weight.
Petroleum contains several homologous series of hydrocarbons.
Petroleum contains more kinds of cycloalkanes and aromatic hydrocarbonsj a1so alky1substituted aroroatic and naphthenoaromatic hydrocarbons. The last-mentioned compounds have not been reported as biogenic.
A criterion of gas chromatographic screening for identifying petroleum contamination in marine samples is the presence or absence of signal for an unresolved complex mixture of a "distillation envelope", due to overlapping series of homologous and isomeric hydrocarbons. Petroleum normaily shows little or no predomLnance of n-alkanes with an odd number of carbon atoms.

G~TAKE kND FATE OF HYDROCARBONS IN MARINE ORGAN15MS
Marine organisms receive hydrocarbons from their food source and the water, or convert precursor compounds obtained with their food or the water (Lee et al . , 1972a, 1972b; Farrington and Quinn , 1975; Stegeman and Teal, 1973; Mackie et al., 1974, Whittle and Mackie, 1974; Anderson, 1975, Anon/ 1975, Clark and Finley, 1975; Corne r, 1975' DiSalvo et al., 1975, Ehrhardt and He inemann, 1975, Lee, 1975, Neff and Anderson, 1975, Boehm and Quinn, 1976, Burns, 1976; Corner et al, 1976; Fossato and Canzonier, 1976, Gian1 et al., 1976, Lee et al., 1976; Thompson and Bglinton, 1976; Vandermeulen and Gordon, 1976, 'Nong et al., 1976). Much attention has been given to the concentrations of petroleum hydrocarbons in marine organisms, especiaily filter-feeding marine bivalves. Uptake of petroleum hydrocarbons in molluses has been identified as aresult of acute and chronic inputs into natural waters. Experimental studies on the uptake of petroleum hydrocarbons have also been undertaken.
~nong other factors that influence the uptake of hydrocarbons from seawater ie the lipid content of thn organism, as well as the concentration of hydrocarbons in the water (Stegeman and Teal, 1973). The effect of diesolved organic matter in seawater on ~)e uptake of mixed individua1 hydrocarbons is discussed in a paper by 80ehm and Quinn (1976). Feeding experiments show that the dietary route of entry is quantitatively more important than direct uptake from solution (Corner et al., 1976).
Recent reports have discussed the fate of hydrocarbons in a variety of marine animals (Lee et a l. , 1972a, 1972bi Stegeman and Teal, 1973; An derson, 1975; Clark and Finley, 1975; Ehrhardt and Heinemann, 1975; Lee, 1975; Neff and Anderson, 1975; Burns, 1976; Fossato and Canzonier, 1976; Lee et al., 1976) _ Several studies demonstrate that fish and SOITlC crustaceans (crabs and shrimps) may metabo1ize hydrocarbons. The evidence to date suggests that mussels are unable to metabolize hydrocarbons (Lee et al_, 1975). Although some bivalves store hydrocarbons, most of those taken up o.re excreted during depuration experiments.
HYDROCARBONS IN SEDIMENTS
Aquatic sediments receive small amounts of organic matter originating from a variety of sources, e.g. hydrocarbons can be released during metabolism and decomposition of the organisms (Farrington and Quinn, 1973; Sackett and Brooks, 1975; Walker et a l ., 1975; Palacas et al., 1976; 5tarnes and Brown 1 1976; Vandermeu1en and Gordon, 1976 j Walker et al., 1976; Wakeham, 1976; Wakeham and Carpenter, 1976; Wong et al., 1976). Field studies have shown Chat petroleum hydrocarbons from oil epills are able to persist in sediments for a long period af time due to a very slow biodegradation (Vandermeulen and Gordon, 1976)_ The most readily degraded compounds, and hence those lost first from the sediments, are the n-alkanes, while the cyclic, branched and aromatic compounds are left behind. Hydrocarbons incorporated in the sediment can snter the food web through deposit-feeding organisme.
. 4
EVALUATION OF THE ANALYTlCAL RESULTS
The absence of a homologous series of resolved peaks of ~-al.kanes above an unresolved cornplex mixture signal in the gas chromatograrns indicates the absence of petroleum contamination in all the analyse d samples collected offshore Greenland 1975. Isolation and identification of some of the total hydrocarbons from the sample material in all cases show typical biogenic hydrocarbons.
Total hydrocarbon concentration, including biogenic compounds in surface sediment samples determined by a variety of techniques, covers the range 100-1200 ~g/g in highly polluted coastal areas, usually 70 ~g/g in unpolluted coastal areas and deep marginal seas Or basins and 1-4 ~g/g (including about 90 per cent biogenic) in deep sea areas (Farrington and Mederias, 1975). Compared with other data, the level af hydracarbons in sediment samples from West Greenland marine areas seems to be extremely low. This supports the assumption that the area is at present uncontaminated by petroleum hydrocarbons, and thus that all the existing hydrocarbons in the sediments are af biogenic origin.
As mentioned earlier, all marine organisms are in a state of continuous interchange of hydrocarbons with their environment. Hydrocarbons fOW"ld in organisms may originate from their food sources_ The supply of hydrocarbons rnay vary considerably if the majority is deri ved from the food. In "selective" predators the intake is based on the actual hydrocarbon level in a single species, whereas in omnivores (e.g. some shrimp and starfish) the hydrocarbons derive from several species. Hydrocarbon synthesis by the organism may be influenced by several conditions (season, sexual stage, and age of the organism among others)_ The actual hydrocarbon level in the individual organisms seems very much to depend on the ability to metabotize hydrocarbons.
These factors may explain the considerable variations in the concentration of single hydrocarbone which are found in the organisms.
EVALUATION OF THE SAMPLE MATERlAL
The most important objective of the analytical work on the sample material from West Greenl~nd is to control the inputs (and fate) of petroleum in this area.
Certain investigations indicate that some marine organisms are well suited as indicator organisms for evaluation of pollution by petroleum hydrocarbons (DiSalvo et al., 1975; Ehrhardt and Heinemann, 1975). The b1ue mussel [Mytilus edulis), because of its widespread distribution and easy accessibility, has been used as an indicator organism in several investigations. Among the criteria which must be fulfilled by organisms used as indicators of petroleum pollution are that they are abundant in the area and that the organisms retain hydrocarbons due to a very slow, or complete absence,
of hydrocarbon metabolism and excretion. At present, however, our knowl~dge is insufficient as rcgards the occurrence and abundance of species in the marine cnvironment of West Greenland, and incomplete as regards mctabolisms and excretions of hydrocarbon!] in marine organisms. It thus seems reil~Ollil.blc that, for the time being, interest be focusscd Oll sediment analyses, in spite of the difficulty in obtaining a homogeneous mixture af the wet sediment and reproducable subsampling. An ilnalytical cstimatian of the most volatile and most soluble hydrocarbons in water samples, might, hawcver, give valuable supplementary information about petroleum contamination, especiaily in arctic ilrea" (Sackett and Brooks, 1975).
~ study of the natural level and distribution of hydrocarbons in the marine environment is a neccssary prerequisite to the identification of 10w level contumination by petroleum hydrocarbons.
EVALUATION OF THE ANALYTICAL METHOD
A number af analyticai techniquc5 are available for meusuring low and high molecular weight and total hydrocarbons in samples of sediments and marine organisms. Gas chromatography seems to be superior to other analytical techniques in differentiating hydrocarbons.
In all probability the gas chrornatographic method could advantageously be supplemented with a simple routine method to estimate the toxic aromatic hydrocarbons (e.g. fluorescence spectroscopy) when the concern is pollution control, and the number~ af samples can then be considerable. Generally, when designing an ~nalytical method for hydrocarbon base-line study requiring determinations of single components at the ~g/kg(ppb) level, it is af prime importance to develop a contarnination-free procedure.
E~timation af pollution can be effected by chemical analysis of the campounds concerned, or by measuring some specific biologi cal effects of the compounds. However, it is not possible to identify and measure specific biologi cal effects af pollutants dispersed in the environment at low concentrations, and possibly associated with oth~r pollutants, unless ~)e effect af the substance is extremely specific. Therefore cherr~cal analytical techniques seem to be preferable \vhen controlling petroleum pollution. The analytica1 results obtained give information on the Qxposure af the marine enviranrnent which rnay then bc campared with experim~ntally determined dose/response factors.
So far the number af estimations of ~ose/ response relationships are limited. Dur knowledge is too incomplete to give a detailed interpretation of analytical results abtained on sample material collected with the view af contrailing petroleum pollution in the marine environmenL
5
~CKNOWLEIJGMEN'1'S
Chrornatographic analyses were perforrned by Arne Ryge Petersen, Water Quality Institute.
Advice was received from John \'i. Farrington , Woods Hole Oceanographic Institution, Woods Hole, Massachusetts 02543, USA.
REFERENCES
Anderson, R.D. 1975. Petroleum hydrocarbons and oyster resources of Galveston Bay, Texas. Conference an Prevention and Control of Oil Pollution. 541-548.
Anon. 1975. Petroleum in the marine cnvironment. Workshop on Inputs, Fates, and the Effects of Petroleum in the Marine Environment. National Academy af Science. Washington D.C.
Blumer, M., R.R.L. Guillard, and T. Chase. 1971. Hydrocarbons of marine phytoplankton. Mar. Biol. 8, 183-189.
Bl urne r , M., I.C. Robertsan, I.E. Gordon, and I. Sass. 1969. Phytol-derived Cl9di-and triolefinic hydrocarbons in marine zooplankton and fishes. Biochemistry 8: 4067-4074.
Boehrn, P.D., and J.G. Quinn. 1976. The effect of dissolved organic matter in sea \-Jater an the uptake of mixed individual hydrocarbons and Number 2 fuel oil by a marine filter-feeding bivalve (Mereenaria mercenaria). Estuarine and Coastal Mar. Sci. 4: 93-105.
Eurns, K.A. 1976. Hydrocarbon metabolism in the intertidal fiddler crab Uea pugnax. Mar. Biol. 36: S-ll.
Clark, R.C. Jr., and J.S. Finley. 1975. Uptake and 1055 of petroleum hydrocarbons by the mussel, Mytilus edulis in laboratory experiments. Fishery Bulletin 73: 508-515.
Corner, E.D.S. 1975. The fate af fossil fuel hydrocarbons in marine animals. Proc. R. Sac. Lond. B. 189: 391-413.
Corner, E.D.S., R.P. Harris, C.C. Kilvington, and S.C.M. O'Hara. 1976. Petroleum compounds in the marine foad web. Shortterm experiments an the fate of napthalene in Calanus. J. Mar. Biol. Ass. U.K. 56; 121-133.
Di Salvo, L.H., H.E. Guard, and L. Hunter. 1975. Tissue hydrocarbon burden of mussels as potential monitor of cnvironmental hydrocarbon. Environ. Sci. Technol. 9; 247-251.

Ehrhardt, M., and M. Blumer. 1972. The sourca identification of marine hydrocarbons by gas chromatography. Environ. Pollut. 3; 179-194.
Ehrhardt, M. and J. Heinemann. 1975. Hydrocarbons in blue mussels from the Kiel Bight. Environ. Pollut. 9: 263-282.
Farrington, J.W., hydrocarbons hydrocarbons mercenaria) . 71-79.
and I. J. Quinn. 1973. Petroleum in Narragansett Bay. I. Survey of in sediments and clams (Mercenaria Estuarine and Coastal Mar. Sei. l:
Pdrrington, J.W., and G.C. Mederias. 1975. Evaluation of some methods of analysis for petroleum hydrocarbons in marine organisms. Conference on Prevention and Control of Oil Pollution. 115-121.
Farrington, J.W., and B.W. Tripp. 1975. A comparison of analysis methods for hydrocarbons in surfaee sediments. ACS Symposium Series, No. 18. Marine Chemistry in the Coastal Environment. 267-2B4.
Farrington, J.W., J.M. Teal, and P.L. Parker. 1975. In 5trategies for Marine Pollution Monitoring. Goldbarg, E.D., Editor. Chapter l.
Farrington, J.W., J.M. Teal, I.G. Quinn, T. Wade, and K. Burns. 1973. Intercalibration of analyses of recently biosynthesized hydrocarbons and petroleum hydrocarbons in marine lipids. Bull. of Environ. Contam. Toxicol. 10: 129-136.
Fossato, v.U., and W.J. Canzonier. 1976. Hydrocarbon uptake and 1055 by the mussel Mytilus edulis. Mar. 8i01. 36: 243-250.
Glam, C.S., H.S. Chan, and S.N. Grace. 1976. Distribution of ~-paraffins in selected marine benthic organisms. Bull. of Environ. Contam. and Toxicol. 16: 37-43.
Lee, R.F. 1975. Fate of petroleum hydrocarbons in marine zooplankton. Conference on Prevention and Control of Oil Pollution. 449-553.
Lee, R.F., C. Ryan, and M.L. Neuhauser. 1976. Fate of pctrolewn hydrocarbons taken up from food and water by blue crab Callineetes sapidus. Mar. 8iol. 37: 363-370.
Lee, R.F., R. Sauerheber, ~nd A.A. Benson. 1972. Petroleum hydrocarbons. Uptake and discharge by the marine mussel Mytilus edulis. Science. 177; 344-346.
6
Lee, R.F., R. Sauerheber, and G.H. Dobbs. 1972. Uptake, metabolism and discharge of polycyclic aromatic hydrocarbons by marine fish. Mar. Biol. 17: 201-208.
Mackie, P.R., K.J. Whittle, and R. Hardy. 1974. Hydrocarbons in the marine environment. Estuarine and Coastal Mar. Sci. 2: 359-374.
MCAuliffe, C.D. 1976. Surveillance of marine marine environment for hydrocarbons. Mar. Sci. 2(No. l): 13-42.
Neff, J.M.,ann J.W. Anderson. 1975. Accumulation, release, and distribution of benzo-(A)-pyrene - C14 in the C1am Rangia cuneata. Conference on Prevention and Control of Oil Pollution. 469-471.
Pa1acas I.G., P.M. Gerrild, H.L. Alonza, and A.A. Roberts. 1976. Baseline concentrations oE hydrocarbons in barrier-island quartz sand, northeastern Gulf of Mexico. Geo10gy 4: 81-84.
Sackett, W.A./and J.M. Broaks. 1975. Origin and distribution of law molecular weight hydrocarbons in Gulf of Mexico coastal waters ACS
Symposium. Series 18. Marine Chemistry in the Coastal Environment, 211-230.
Starnes, P.K.,and R.A. Brown. 1976. Hydrocarbons in a wilderness lake. Mar. Pollut. Bull. 7: 131-132.
Stegeman, I.J., and J.M. Teal. 1973. Accumulation, release and retention of petroleum hydrocarbons by oY$ter Crassatrea virginica. Mar. Biol. 22: 37-44.
Thompson, S., and G. Eglinton. 1976. The presence of pollutant hydrocarbons in estuarine epipelic diatom populations. Estuarine and Coastal Mar. 5ci. 4: 417-425.
Vandermeulen, J.H., and D.C. Gordon Jr. 1976. Reentry of 5-year-old stranded bunker-C fuel oil from a low-energy beach into the water, sediments and biota of Chedabueto 8ay, Nova Scotia. J. Fish. Res. Bd. Can. 33: 2002-2010.
Wakeham, S.G. 1976. A Comparative Survey of petroleum hydrocarbons in lake sediments. Mar. Pollut. Bull. 7: 206-211.
Wakeham, S.G., and R. Carpenter. 1976. Aliphatic hydrocarbons in sediments of Lake washington. Limnol. and Oceanog. 21; 711-723.

Willk~ ~ r, J.D., R.R. Colwoll, H.C. H arnrni n g , and lI.R. Ford. 1975. Petroleum hydrocarbons in Baltimore Harbour of Chesapeake Bay. Distribution in sediment cores. Environ. Pollut. 9: 231-238.
Wa1ker J.D., P.A . Seesman, T.L. Herbert and R.R. Colwell. 1976. Petroleum hydrocarbons. Degradation and growth potential of deep-sea sediment bacteria. Environ. 1'011 ut. 10: 89-99.
WhiltlL', K.J., P.R. Mackl!.' , and R.Hardy. 1974. HydroG.:irbo{\s in the marine ec:o-system. S')ulh AmerlccUl Journal of Science, 70: l H-144.
Wony, C-S., W.J. Cretney, P. Christensen, and R.W. MacDonald. 1976. Hydrocarbon levels ill thc marine environment of the southern A(~aufort. Sea. Beaufort Sea Technical t-<"i->0rt No. 38.
Y( ~ I\, '1'.l". 1915. G( ! nLsi~l and degradation af
pi! I:ru!eum hydrocarbons in marine environments. ACS Symposium Series 18. Marine Chemistry in tl.e Coasta1 Environment. 231-266.
Y~\lngblood, W.W., M. Blumer, R.L. Guillard, and F. Fiore. 1971. Saturated and unsaturated hydrocarbons in marine benthie a1gae. Mar. Biol. 8: 190-201.
7

&S-
E . \
o \, 67
c II. ! ", B 1 \
,: \ A I
\ ! l I
o I 66 I c
i s i
I A
J 66' -i--
I I I
D ! 65 I
c i i
s i A
j
65'
F I I
E •
O
64 C
S
A
IW'
D
63 c
S
THE MINISTRY FOR GREENLAND-
\ I I / ,-
:> 1:-t'
------... - ,)
~ (\
-100 -. %
'- ~
r
i -1' I
I I I
\. 1
f (
I \ ~ . i :5\ i '" I 1../ I
I· \
! I
Dividing tine in the area batween Greenland and theo Canadian Arctic Islands J r • ,
ExsmpJe of block designation I
I
MAPSHOWING
. PETROLEUM CONCESSIONS
IN THE MARINE AREAS
OFF WEST GREEN LAND
O 50 100 160 km
Depths in metres
27-29 ~ Chevron - BP- Saga - NIOC
30-31_ § Disko Group : Arco - Cities Service-Hispanoil- Hudbåy
';i~ 32 []llJll] Mobil- Amoco - Deminex -PanCanadian
33-36 ~ TG,\- .Grepco Group: Total- Gulf-. . AqUltame -Grepco
<_o , .... ;.( 37-38 _ Ultramar - M urphy - Go Id Fieids -
:;. .... 'o'~n 6; r Bomm
( ',,1
(
') ',' I
./ /,,(
A
83' The designation is based on four elements: '-a 11j z~me reference IN_S (62)' .... . _ .. . _------62F58B 2 zone subdivlsion (F)
. 3 zone reference E-W (68) , 4 zone subdlvision (B)
D
62 ~~~~---'-~~.~8~~A'-5~~~B'---A'-~~.~8~-'A~~~.~8~~--~~~~~~~~~~~==~~~
56 55 54 53 52 61
Fig~ l. Greenland offshore concessions.

83 • 6Bo 7L.
-------
65
~ 69 • 61. 63 • •
58 • ~
lr 1.8 46 • L.5·
1.,1., 42 .j~1
1.,1 • • 29 2827 8
1.0 81 8 •• . i • 2~· 100
37 .. 6 8 23
• 21 19
W 11 8
7 6 • • 101 102 -.
Fig. 2. Positions at which samples for chemical analyses were taken during the cruise with the DANA in 1975.
Il
4 :C/:'-
• 50
43
')7
I 68 ~l
II ,!
5
100
x10
278 123
179
Fig. 3. Mass spectrum of a hydrocarbon (Retention time relative to C
22:0.76) isolated from redfish (Sebastes marinus).
';'!1.I
lOO i 57
I l 43 69 l
I,
83 ., 7
JO j 266
I I l!
1 I
j I
i i
238
100 200
Fig. 4. Mass spectrum of a hydrocarbon (Retention time relative to C
22:0.77) iso1ated from capelin (Mallotus vil1osus).
13
e/e

TABLE 1: ~OCAABON CO'f'OSITJ~ (DRY WEIGHT BASIS) Cf SEDII"fNTS
POSITJOO 3 3 6 6 15 31 32 )7 )7 40 41 51 58 6LI 71 7LI 76 MEAN
SAI'f'LE No. Fl jF2 Bl B2 B2 Q Al Al A2 Al Al Al Bl Bl Bl Al Al ~v WEIGHT mq/q 4Bl S3B 8'7 B12 79) 43 5 762 730 603 (,0 867 846 B37 611 7( 5 805 C: 7 7)3
REroo-I ~ TI ME ",,/g
RELATI VE TO Cz2 ).!g/ ; DRY WEIGHT DRV WEIGHT
0.64 PRISTANE - - - - - - 0 . 04 O.l'ij 0 . 08 - 0.02 - - 0. (2 - - 0 . 014
0.73 0.08 0 . 11 - - - - - - - - - - - - - - - 0.012
0.88 0.18 (l. ]S - - - - (l.Ol 0.99 0 . B6 - - 0.20 - 0.05 - - _ .155
0.91 0 . 06 0.21 - - - - - - - - - - - - O. ' 16
0.94 0.04 (l.n - - - - 0.04 - - - - - - - - - - (l.D1S
1.14 - - - - 0.05 - - - - - 0 . 10 - - - - - - 0.( ) 9
1. 24 - - - - - 0 . 05 O.OS - - - - 0.03 O. H - O. ,O',
1.30 - - - - - - - - - - 0 .01 - 0.001
1.35 SQUALENE 0.10 - 0 . 30 0 . 12 0.04 1.13 (l. 04 0.10 0 . 10 (l.14 O~ I '-) - 0 . 19 0.07 O. Cl) 0 . 12 .. 10 0.10"''')
l. 44 - - - - - - - 0.08 0 . 08 - - 0.05 - - - - - 0 . 012
1. 53 - - - - - - - - - - - - - - - 0.01 - -TOTAL 0.46 0.84 0.30 0.12 0.09 1.13 0.13 1.30 1.17 0.14 0 . 20 0.25 0 . 19 0.14 0.06 O. IS 0.10 0.40
Dmcr'loo LIMIT 0 . 01 0.01 O. OS O.OS 0.01 0.05 0 .01 0 . 01 0.01 0 . 05 0 . 01 0 . 01 0.01 0.01 0 . 01 0 . 01 O.OS
TABLE 2: HvnRc:x:AABQIl CO'IPOSITION (WET WEIGHT /oND DRV WEIGHT BAS I S) OF BRYOZOAN (ACYCt-JIDIU.., GELATlNOSLl'\)
POS!TICl-I 2 19 29 MEAN
DRY WEIGfT mg/g - 95 91
LIPID mg/q < l - -
REToolctl TIM:: )19/g ~/g ll9/g jJ.g/g wet wet dJ:y -..et dry wet
RELATIVE TO C22 weight weight weiqht we.J.ght welght weight
0 . 64 PRIST,dJIIE - 0.05 O. S - - 0 . 017
1.35 SQUALfNE 0 . 50") 0.16 1.7 0.1~ 1.2 0 . 213
TOTAL 0 . 50 0.21 2 .2 O. U 1.2 0.23
DmcrJoo LIMIT 0.05 0 . 01 0.01
II) HENTI F I ED BV M6.SS SPEClRO'IElRY
TABLE 3: HVDROCAAIla'-I CCMPOSITIOO (WET I-ÆIGIff AND DRY WE1GHT BASIS) Of ZOO-PLANKTON
PoSITION il 13 42 42 MEAN
SAMPLE No, Dl Cl Q f2 DRY WEIGHT llI9/q 4l 56 56 56 56
LIPID U>9/q - < l < l -fJg/g )19/g 1-19/9 ll9/g !JI?/g
RErENTioo TIME wet dry \oIe ~ dry ",et dry wet dry \oIe~ dr"-
RELATl VE TO en weight ~eiQht weiCjht we iCjht we1ght weight. welght welghc w .. igllt wl.ight.
0.64 PR I STAAE 0.90 22 L OOA) 17 .• 11 9.aSA) 175 0 . 6~ 12.1 3.11 56 . 7
o.ee - - - - - - o.oe 1.4 0.02 0 . 35
1. 35 SQUALENE 0 . 01 0 .24 0.19 3.4 0.06 1.1 0.02 0 . 35 0 . 07 1.26
TOTAL 0.91 22.2 1.19 21.2 9.91 176 Cl ,7 B 13.9 3 . 2 s ;
DmcT!(1\/ L1MrT 0 . 01 0.05 O.OS 0 . 01
a) .1 DENT I F lED BY M6.SS SPEClRMTRV
15

T ABLE 4: ft(æocAAOO'l ca1'OS / T I <li
(~ WEIG1T, OOY 'riE/GiT /iMJ LlP!D BAS l S)
CF ~ INl (CUd..i'\ARl A FRCNOOSA)
POSJTlOO 45
æv WEIGHT mQ/q ')6
LlPID rrq/q 9.9
.-
_._------------ - ~--~._-_.----' ~" 4o - ___ _
IJCJ/g
RETENTION TIM: wel ~ry
RELATIVE TOCzl waJt;)ht welqht 111',,1
.. -_._----,----- f------. --l. )C, SQlJALENE 0 . 00 0 . !l2 11.0
-' __ o ,- f-----.-
TOTAL 0 . 08 0 . 82 1l . 0 -- .--
DETECTlON LIMIT 0.01
TABLE 5: HYDROCARBOO ~SITION (WET WEIGHT AND UPID BASIS) DF BIVALVES
SPECIE AST ARTE CRENA lA MYT I LUS EDUL! S
POSlTION l 69 /IEftN 67
UPlD mg/q B.3 8.3 8.3 12. '5
~/g l-I'J!g I-I'J/g lJg/g
RErulTI 00 T I t-E wet \<let \<let W€t
RELATIVE TO Cz2 weiqht l1~id welqht l1pid welght ltpi6 weiqht lipld
0.92 0 . 07 B_ 4 - - 0.035 4 . 2 - -0.94 0.23 28 - - O, l1S 14 . 0 - -l.07 - - 0.02 2.4 0.010 1.2 0.04 3.2
1.14 - - 0 . 02 2 . 4 0.010 1.2 0.04 ) . 2
1.18 0.04 4.8 - - 0.020 2.4 - -L 35 SQUAJ..ENE 0.06 7.0 - - 0.030 J.S 0.02 1.6
TOTAL 0.40 48.2 0 . 04 4.8 0 . 22 27 O. lO 8.0
DErECTION LIMIT ,0.01 0.01 0.01
-
TABLE 6: HYæOCARBOO awOSITlON (WET 'r'ÆIGiL æv 'n'EIGHT AND UPID BASIS) OF SHRItv'P (PANDALUS BOREALIS)
POSITION 8l 83 !"EAN
MY WEIGHT mq/q 238
UPID mg/g 16 25 22
)Jq/q lJg/g J.lC3/g
RETENTlOO TIME wet dt'Y wet. wet
RELATflÆ TO en wolght wClight l1pid weiqht Upid welqht 119jd
0.56 0.04 0.15 2 . 0 - - 0.02 1.0
0.64 PRISTANE 0,9) ).9 52 )7 a ) 1480 25.5 76f.
0.72 0.02 0.07 0.9 - - 0.01 0 . 5
l.lB 0 . 38 1. 59 2l - - 0 . 19 10.5
1.)5 SQUALfNE 0.23 0.9B 12.9 0.68 27 0 . 46 20.1)
1. 39 0.03 0 . 12 1. 56 - - - -TOTAL 1. 6S 6.B 91.7 37.7 1507 27 798
DE-rEcr (00 LI M IT ' O. Ol 0.01
al SEIÆRAL MALYSES ARE f.'ADE. M RESULTS ARE 24.36 .oND 50 JJlJ/9 WET \'lE I GHT, THE I'i:NV VAllIE
I S ENTERED I N lÆ T~LE, J OCNTJ F / ED BY OOS SPECTRO'>'CTRY,
17
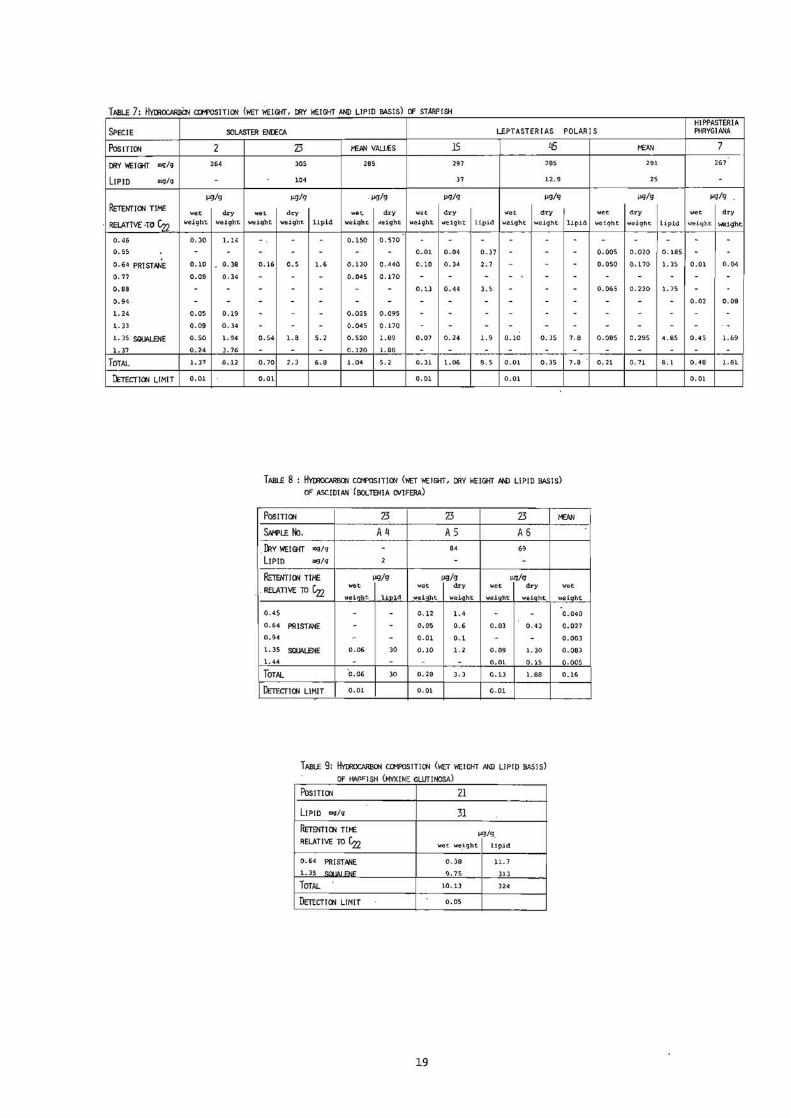
TABLE 7: HvæOCAABi:tl/ awoSlTIOO (\'ÆT WEIGfI", æv WEIGHT AND LIPID BASIS) OF STARFISH
SPECIE
PosITI~
æy WEIGfI" mq/g
LIPID mg/g
RErENTIOO TIME
RELATlVE" ·TO Cz2 0.46
O. SS
0.64 PRISTANE 0.77
0.89
0.94
1.24
1.33
1. 35 SQUt>J.EN E
1.37
TOTAl...
InECTlOO LIMIT
SOlASTER ENIECA LE?TASTER I AS POLARIS
2 264
l-19/g
",er. dry weighc we1ghr.
0.30 1.14
0.10 0.38
0.09 0.34
0.05 0.19
0.09 O. ]4
0.50 1.94
0.24 3.76
1. 37 8.12
0.01
Z3 l'9N VAUÆS 15 45 305 28S 297 285
104 37 12.9
ll'J/g -IJ'J/g IJ'J/g ll9/g
.. et dry .. et. dry ",et dry wet dry
weight we1ght: lipid weighr. ~eight we1ght welght Lipid weight weight
0.150 0.570
0.01 0.04 0.37
0.16 0.5 1.6 0.130 0.440 0.10 0.34 2.7
0.045 0.170
0.13 0.44 3.5
0.025 0.095
0.045 0.170
0.54 1.8 5.2 0.520 1.89 0.07 0.24 1.9 0.10 0.35
0.120 1.88
0.70 2.3 6.8 1.04 5 . .2 0.3l 1.06 B.5 O.Ol 0.35
0.01 0.01 0.01
TABLE 8 HYmoc:AABoo C<WOSITlOO (WET WElGIfT, æy WEIGHT ,6J'{) LlPID BASIS)
OF ASCIDI AN -( BOLTENIA CWIFERA)
lipid
7.8
7.8
Pos 1TI 00 23 23 23 /"€AN
SN-P/..E ttl. A4 AS AS fuy WEIGIfT mg/g - 84 69
LIPID IJY}/g 2 - -REl"ENTlOO TIME 1'9/9 l'9/g "q/g
. RELATIVE TO Czz wet "'et dry wet dry
wei~ht U.pid wei'lht weight wsight weight
0.45 - - 0.12 1.4 - -0.64 PRISTA'lE - - 0.05 0.6 0.03 0.43
0.94 - - 0.01 0.1 - -1.35 SQLLt\LENE 0.06 30 0.10 1.2 0.09 1.30
1. 44 - - - - 0.01 0.15
TOTAL '0.06 30 0.29 3.3 0.13 1.88
DETECnOO LIMIT 0.01 O.Ol 0.01
TABLE 9: HvooocARsæ CG1POSlTIctl (\\'ET WEIGHT AND UPID BASIS)
OF W\r.I=ISH (MYXINE GWTINOSA)
PosITlOO 2l
LIPID rnq/g 31
RETENTI 00 TI M: J.1tJ/g. RELATIVE TO Czz wet weight l1pid
0.64 PR I ST.ANE 0.38 11.7
1.]5 ~lAl~1= 9.75 Hl
TOTAL 10.13 324
DETECTI~ LIMIT O.OS
19
"et
weighc
0.040
0.027
0.003
0.083
O.OOS
0.16
we1ght
O.OOS
0.050
0.06S
0.085
0.21
HlPPASTERlA PHRYGlMA
t-EPN 7
291 267
25
IJ'J/g IJ'J/g
dry wet dry
"'e1gh\: lipld weight welght
0.020 0.18S
0.170 1.35 O.Ol 0.04
0.220 1. 75
0.02 0.09
0.295 4.85 0.45 1.69
0.71 B.l 0.48 l.Bl
O. Ol
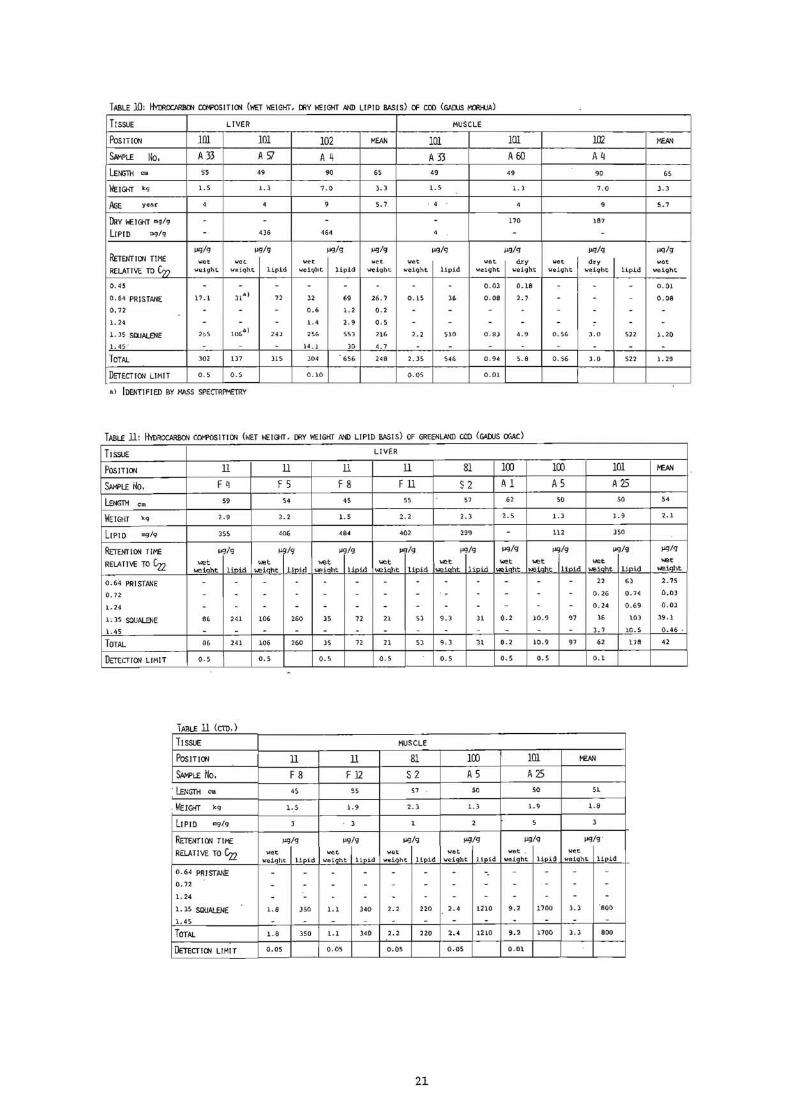
TABLE 10: ~ ca-FOSITI~ (WET WEIGI-IT, æv W!:JGHT AND LlPID BASiS) OF COO (GAIl.JS ~A)
TISSUE LIVER MUSCLE
POSITlOO 101 101 102 MEAN 101 101 102 MEAN
SWPLE Ih A33 Ars! A 4 ATI A60 AlJ
LE~ cm 55 49 90 65 49 49 90 65
WEIGH'T kg 1.5 1.3 7.0 3.3 1.5 1.3 7.0 J.)
.AGE year 4 4 9 5.7 4 4 9 5.7
!Æv \\fIGHT mg/g - - - - 170 187
LJPID fDg/g - 436 464 4 - -RETENT 100 TIME
IJCJ/g J.l9/g I-19/g )J.9/g J.l9/g I>9/g IJg/g I-19/g
"'et wet we~ wet: wet "let dry wet d~y "let
RElATIVE ro en weight we;ght lipid weight lipid weight. weight lipid weiqht weight welqht w~ight lipid weight
0.45 - - - - - - - - 0.03 0.18 - - - 0.01
0.64 PRISTANE 17.1 3ia ) 72 32 69 26 . 7 0.15 36 0 . 08 2.7 - - - 0.08
0.72 - - - 0.6 1.2 0.2 - - - - - - -1.24 - - - 1.4 2 . 9 0 . 5 - - - - - ~ - -L 3S SOOAt..elE 2,,5 106a ) 243 2~6 553 HG 2.2 510 0.8J 4.9 0.% 3.0 522 1.20
1. 45- - - - 14.1 30 4.7 - - - - - -TOTAL 302 137 315 304 656 248 2.35 546 0.94 S. e 0.56 3.0 522 1. 29
DETECTlOO LIMIT 0 . 5 0.5 0.10 0 .05 0.01
1\.) IDENTIFIED BY MASS SPEC!"RPMETRV
TABLE 11: HvoROCARBOO CQI"POSlTloo (WET W!:IGHT, ))RV WEIGI-IT AND LIPID BASIS) OF GREENLAND COD (G./IOOS OOAC)
TISSUE LIVER
POSITION li li il il 81 100 100 101 /oEAN
S#PLE i~o, F ~ F 5 F 8 Fil S 2 Al A 5 A25
lENCffiI Cm 59 S4 45 55 57 62 50 SO 54
WEIGHT kg 2.9 2.2 1.5 2.2 2.3 2.5 1.3 1.9 2.1
LIPIO mg/g 355 406 484 402 299 - H2 lSD
RErOOlON TIME I-19/g IJCJ/g )Jq/g Mig jlg/9 JlCl/g I-19/g 1-19/9 )Jg/q
RELATIVE TO en ~t ~t ~t wet ~t wet -.et -.et ~t
I!.eiqht Hpid weiqht lioid weiqht Lioid Ioeiaht lioid lIleiaht lioid lIleiqht ~1aht lioid weioht lioid leiqht
0.64 PRISTANE - - - - - - - - - - - 22 (,) 2.75
0.72 - - - - - - - - ' - - - - - 0.26 0.74 0.03
1.24 - - - - - - - - - - - - - 0.24 0.69 0.03
1; 35 SQUALENE 86 241 106 260 35 n 21 53 9.3 3l 8.2 10.9 97 16 103 39 . 1
1.45 - - - - - - - - - - - - 3. J 10.5 0.46 .
TOTAL 06 241 106 260 15 72 21 53 "l.J "31 B.2 10.9 97 62 l.7B 42
DETECT100 LIMIT 0.5 0.5 0 .5 0.5 0.5 0.5 O. S 0 . 1
TABLE 11 (cm )
TISSUE MUSCLE
POSITION li il 81 100 101 MEAN
SAw>LE No. F8 FU S2 A 5 A25
: lENGTH cm 4S 55 57 SO 50 51
. WEIGHT kg 1..5 1.9 2.3 1.3 1.9 1.6
LIPID mgl.g 3 3 l 2 5 J
RErENTI~ TIME I'9/g Jlg/g 1-191'0 1'9/9 Il'j/g 1-19/9 '
RELATIVE TO en wet wet wet "let wet , wet.
wei9ht lipid welqht lipid weight Hpid wei'Jht lipid weiqht lipid weiqht lipid
0.64 PR1STANE - - - - - - - -. - - - -0 . 72 - - - - - - - - - - -1. 24 - - - - - - - - - - - -1. 35 SQUALENE l.8 lSO 1.1 340 2.2 220 2.4 1210 9.2 1'00 3.3 ' BOO
1.45 - - - - - - - - - - - -
TOTAL l.8 350 l.1 340 2.2 220 2.4 l2l0 9.2 1100 3.3 800
DmCTT~ LIMIT 0.05 0.05 0.05 0. -05 0 . 01
21

TABLE 12: HYDROCARBON COMPOSITION (WET WEIGHT AND LIPID BASIS) OF GREENLAND HALIBUT (REINHARDTlUS HIP~~IDES)
TISSUE LIVER
POSITION 81 81 83 83 83 MEAN
SAMPLE No, Kll K 12 A 4 A 5 A l
lENGTH c:m 40 51 48 48 43 46
DRY WEIGHT mg/ ..
lIPID mg/ .. 93 317 163 236 -
RETENTION TIME: I1g/g I1g/g IJ.g/g 1-19/9 ).!g/g lJ,g/g
RELATI VE' TO C22 "et ",et ",et wet "'et W'et
weight lipid welght lipld weight lipid ",eight lipid "eight . weight
0.64 PRISTPNE 0.62 8.B 0.15 0.46 3.2 19.6 203 660 SOa) 51.4
0.77 - - - - - - 3.2 13.5 - 0.64
1.09 - - - - - - - - - -1.19 - - - - - - 2.9 12.3 - 0.58
1.24 - - - - - - 0.7 3.0 - 0.14
1. 3S SQUAlENE 156 1670 696 n90 167 1120 1170 4930 327") 503
1.44 - - - - - - 1.4 6.1 - 0.28
1. 50 - - 0.2S O. B - - 0.49 2.1 - 0.14
1. 60 - - 0.33 1.0 - - - - - 0.06
TOTAL 157 1679 69B 2190 170 1140 U80 5630 377 556
Dmcnoo Ul'11T 0.1 0.1 0.1 0.1 0.5
e) IDENTlFIED BY t-\o\SS SPECTRPMETRY
T ABLE 12 (CTD , )
TISSUE MJSCLE
POSITION Bl 8l 83 83 ME.bJIj
SAI-f'LE No, Kil K12 A 4 Al l.ENGTI-I cm 40 51 48 43 46
DRY WEIGHT mq/9 208 231 - - -
lIPID mg/g 62 ae 70 133 BB
RErENTI CN TIME f.JI;/g )J.g/g- )Jt3/g )Jt3/g JU'J/g
RELATlVE TO en wet dry ",et dry wet wet ",et welght weight lipid weight weight lipid weignt lipid we~ght lipid weight l1pid
0.64 PRISTANE 3.4 16.2 54 3.3 14. S 30 5.6 81 6.5 49 4.7 5b
0.77 - - - - - - - - - - -l.09 O. Ol O. OS 0.16 - - - 0.01 0.14 - - 0:005 0.07
1.19 - - - - - - - - - - - -1.24 0.01 0.06 0.19 - - - 0.03 0.43 - - 0.010 0.15
1.35 SQJALelE B.2 39 132 15.9 69 182 9.5 136 20. S 154 13.5 151
1.44 - - - - - - 0.01 0.1 - - 0.003 0.03
L50 - - - - - - - - - - - -1.60 - - - - - - - - - - - -TOTAL 11.6 55 la6 19.2 8.4 220 lS.2 na 27 203 18.) 207
DErECTICN LIMIT 0.01 0.01 0.01 0.05
23

TAB lE 13 (CTD,)
TJSSUE
POS IT ION
SAMPLE No. LENGTH cm
WE1GHT kg
DRY WEIGHT rsq/g
LIPlD rrIJ/g
RETENTION TIME
RELAT rVE TO C22 0.39
0.%
0.64 PRISTANE 0.72
0.99
0.<)4
1.18
1. 24
1. 35 SQUALENE
1.45
~.
TOTAL
DETECT [ON LIMIT:
TABlf 13: HYDROCARBOO ro-tPOSiTlOO (\-ÆT ~1E[Gn, DAY WE[GHT N'ID L1PIO BASIS) OF
Al"ERIC.AN PLA[CE (HIPPOGlOSSOIDES PLATESSC)lDES)
TISSUE LIVER
PoSITION 2 53 81 MEAN
S/lMPLE No. Q C 7 03
lENGTH cm 40 - 40
WEIGHT kg 0 . 7 - -
DRy WEIGIfT mg/g
LIPID mg/g 136 134 27 77
RErENTION TIME /.19/g )J.g/g lJ.g/g /.19/g
RELATIVE TO Czz wet wet wet wet weight lipid weight lipid weight lipid weiqht
0.39 - - 0.05 0.34 - - 0.017
0.56 - - 0.12 0.91 - - 0.040
0.64 PRISTANE 2l 154 0.30 2.24 - - 7.10
0.72 - - 0.14 l.02 - - 0.047
0.89 - - 0.04 O. 2~ - - 0.013
0.94 - - 0.01 O.OB - - 0.03
L IB - - 0.44 3.3 - - 0.147
1. 24 - - - - 0.32 IL 7 0.107
1. 35 SQUALENE 20 143 41 307 1. 43 53 20.8
1.45 0.50 J.7 0.04 0.24 0.180
l. SD 0.20 L3 - - 0.067
TOTAL 42 302 42 315 1. 75 65 29
DETECTION LIMIT 0.01 0.01 0.01
MUSCLE
2 53 81 Q C 7 D3
40 - 40
0 . 7 - -
196 179 IS)
a 6 2
lJ.g/g 1l9/9 JJ.9/g wet dry wet dry wet dry
weight weight lipid weight weight lipid weight weight lipid
- - - 0.01 0.03 1.0 - - -- - - 0.04 0.22 6.7 - - -
0.45 2.] 55 - - - - - -- - - 0.02 O. H 3.] - - -- - - - - - - - -- - - - - - - - -- - - - - - - - -- - - - - - - - -
1.6 8.2 193 0.10 0.56 16.7 0.98 6.3 444
- - - - - - - - -- - - - - - - - -
2.05 10.5 248 0.17 0.92 27.7 0.98 6. ) 444
0.01 0.01 0.01
2S
lipid
0.113
0.303
52
0.340
0.097
0.027
1.10
3.90
168
1 . 31
0.43
228
MEAN
176
s
lJ.g/g wet dry
weight weight lipid
0.003 0.010 0.3]
0.013 0.073 2.23
0.15 0.77 18.3
0.007 0.0]7 1.10
- - -- - -- - -- - -
0.89 5.02 2lS
- - -- - -
1.06 5.9 239

TABLE 14: :"k)P.OCARBOtl COMPOSITICN (',.jET WEIGHT AND Li?ID BASIS) OF WOLFFISH (ANARHICHAS LUPUS AND ANARHICHAS ~\INOR)
j
;TISSUE i
LIVER !
I POS, nON 101 i læ 103
SAI~PLE No! A62 A 2 A2
LENGTH cm 62 63 76
WEIGHT kg - 2 .. 2 8 .. 1
DRY WEIGHT mg/g - - -LIPID mg/g 54 66 176
RETENTION TIME 1-19/9 1-19/9 1-19/9
e22 wet wet: wet
RELATIVE TO we1ght l1pid weight lipid weight lipid
0 .. 64 PR l STANE 3.1 S8 1.49 23 0 . 98 5. 6
0 .. 11 - - - - 0.03 0 .. 17
Q .. 76 - - O.2Q 3. O 0 . 80 ,I. 5
0 .. /7 - - 0.10 1.5 - -1.13 0.35 6.5 - - - -1.18 - - 0.03 0 .. 5 - -1.. 24 0 . 83 15 .. 5 - - O.OS 0 .. 28
1. 35 SQUALENE 41 770 51 780 56 316
1. 40 - - - - 0.51 2.9
TOTAL 45 850 53 B08 58 329
DErECTION LIMIT 0.01 0.01 Q.Ol
TABLE l~ (cm!)
TISSUE MUSCLE
POSrTION il 23 102 SAf'JPLE No. r e A 2
lENGTH cm - 72 63
WEIGHT kg - 3.7 2.2
DRY WEIGHT mg/g 133 - 143
LIPID mg/g 5.3 9.7 3.2
RErENT I 00 T J ti: ).19/g 1-19/9 ).19/g
RELATIVE TO en wet dry wet wet dry wet weight weight lipid weight lipid waight weight lip1d weight
0.64 PRISTfiNE Q.09 0 .. 068 17.1 - - 0 .. 05 0.33 14.7 0.14
0.71 - - - - - - - - 0.40
0.76 - - - - - - - - -0.77 - - - - - - - - -1.13 - - - - - - - - -1.18 - - - - - - - - -1. 24 - - - - - - - - -l.15 SQUALENE L. 22 9.2 230 2.0 206 0 .. 16 1.1 49 3.0
1.40 - - - - - - - - -TOTAL 1.. 31 9 .. 9 247 2 .. 0 206 0.21 1.. 43 64- 3.5
DETECTION LIMIT 0.01 0.05 0.01 0 .. 01
27
---
-MEAN
67
99
).19/9 wet
weight lipid
1..86 28.9
0 . 01 0 .. 06
Q. )) 2 .. 5
0.03 0.50
0 . 12 2.2
0.01 Q.lI
0.29 5.3
49 622
0.17 0.97
52 663
103 MEAN
A 2 76
8.1
189
3l
lJfJ/g ).19/g dry "let
weight lipid weight lipid
0.74 4 .. 5 0.070 9.08
2.1 13 0.100 3 . 25
- ~ - -- - - -- - - -- - - -- - - -
15.8 97 1. 60 146
- - - -18 .. 6 l1S 1.B 158

TABU 15: ~ Ca-'POSITIOO ('ÆT WEIGIfT AND LlPlD BASIS) Of REIHSH (SEBASTES MARINUS)
TISSLE LIVER MUSCLE
POSlTlOO 83 83 83
SAM'LE i'b. A 16 AlS A 15 IlRv WEIGlT rng/g - - 217
LIPID mg/g 201 43 34
RETENT l (XII TIME )19/9 fJ.9/g fJ.9/9
RELAT l VE TO Cz2 .. et wet wet dry wcight lipid weight lipid weight weight lipid
0.64 PRISTANE 99 494 36aJ 830 5.0 23 145
0.76 - - O.OlaJ 0.32 - - -0.78 0.09 0.44 - - - - -0.69 2.9 14.8 0.06 1.4 0.03 0.14 0.92
1.24 0.11 0.56 - - - - -1.35 SQUALENE 3D 150 1. 6aJ 37 0.86 4.0 25
1. 44 0 . 06 0 . 27 - - - - -L48 0.06 0.31 - - 0.13 0.61 3.8
TOTAL 132 660 38 870 6.0 28 175
DETECTION LlMlT O.OS 0.01 0.01
alloENTIFIED BY MASS SPECTROMETRY
TABU 16: HVOROCARBON awOSITION (WET WEIGHT BASIS) OF
CAPELIN (MALLOTUS VILLOSUS) (\1-l0LE FISHES)
POSITION 81
RrrENT ION T 1t1E 1).9/9 RELATIVE TO Cz2 wet weight
0.64 PR I STANE B.9al
0.17 l.Sa)
1. 24 l.. 3 al
1. 35 SQlJAI FNF S.2a )
TOTAL 16.9
DETECTION LIM! T 0.05
allDENTlFIED BY MASS SPECTROMETRY
29
MEAN
39
~9/9 wet weight: lipid
20.5 488
0.005 0.1.6
- -0.0451 1.16
- -1. 23 31. O
- -0.065 1.90
22 522

T ABLE 1J: RE1HfT (()Ij T !IB OF n - Al...1WIES AND Sc:M:: BRANCHED
t-f'YæOCAR"BæS RELA T I VE TO Cz2
RErENrlOO TlI"E RELATIVE TG en 0.38
0.47
0.55
Cl1
lo Pristll.ne 0.64
0.72
0.79
0.86
0.93
~'-------------------------------r--------------------------------I (;22 1.00
1 . 0(, C 2 J ~--------~--------------~--------------------------I
1.13 (;24 .. - .- ··---·---·-------------+------------------------�
1 . 1B .. _., ----.. - .. -_._---------1--------------------_. -
l .24 --,,-_.-- - -------------1--------------------------1
.C20_.~ Squl'lRne
C2 1)
1 . 29
1. 35
1.40
1. 45
1. 50 ~.----._------_.----------------+-------------------------------I
(; 32 1.55
-
1. 70
1. 80
1.9)
TABLE 18: MAAINE ORGAN1SMS INCWDED IN THE
GAS CHRO'1ATOGRAPHIc/MASS SPECTR<N.TRIC ANALYSES
- ._. ~ . --- .. _--------. ORGAN I SMS , rOSJTJONS, AND SPMPLE NO. (a.jPONENTS lDENTlFIED
Alcyooldi\Jlll gelat:!nosum 2 Squd1ene
:~f\( ' f11;'jnkt ( .JfI 13 Cl, l12 Cl Pr1stane
.. - . - -- ------1"'I\'}1\1 'JO hor<'<lJlEl 8S Pr istane
- ... ~ _ .. ~ --_ ... .. . ,----{;rul\lu 111",-1'\1/\ 101 A5l Pristane & Squalene
' .- -- - .. _--. .. ,~-_._ .-
I{I' lnhd rd t luS hipp0<jlo9soidss 83 Al Pristane &. Squalene
Set"stes marinus 83Al5 PristanC' & Squalene lo urucnown cor,r:" (5E:.1 text) i
Mallot.us villo9US 81 Prlstane lo Squaleoe & two unknown camp _ (see tmct)
31

TABLE 19: PR I STAN E J SQUALENE AND TOTAL HYOOOCARBON LEVEL IN SEDIMENTS PND lNVERTEBRATES
BIVALVES STARFISH SEDI- BRY- ZOQ- HOLO- ASTAATE I1fTIWS SHRJ~1P SOLAS- LEP- ! .. HPPA- ASCI-I'ENTS OlOM PLAN K- THU- TER TASTE- STERIA DIAN
TON RIAN RIAS
PR I STAN E ---l-19/g wet weight - 0.02 3 .. 1 - - - 26 0.13 O.OS 0.01 0.03
l-19/g dry weight 0.014 - 57 - - - - 0.44 0.17 0 .. 04 -jlg/g lipid - - - - - - 766 - 1. 35 - -
SQUALENE ---1-19/9 wet weight - 0.21 0.07 0 .. 03 0.03 0.02 0.46 0.52 0.09 O .. 45 0.08
lJ.9/g dry weight 0.16 - 1. 26 0.82 - - - 1..89 0.30 1.69 -Jl9/g lipid - - - 8.0 3.5 1.6 20 - 4.9 - -
TOTAL --)..lg/g wet weight - 0.2) J.2 0 . 06 0.22 0.10 27 1.04 0.21 0.48 0.16
jlg/g dry weight 0 .. 40 - 58 0.82 - - - 5.2 0 . 7-l 1. Bl -lJ.9/g lipid - - - B.O 27 8 . 0 798 - 8.1 - -
TABLE 20: PFHSTANE, SQUAUNE AND TOTAL HYæOCARBOO LEVEL IN LIVER AND MJSCLE aF FlSH
COD GREENLAND COD GREEN LAND AMERlCAN \'()LF-FISH REDFlSH CAPELIN
Hl\LIBlJT PLAICE WHOLE HAGFISH
liVER MJSCLE LIVER !'VSCLE LIVER MUSCLE LIVER I'1.ISCLE LIVER MJSCLE LIVER f'lUSCLE FlSH
PRISlANE I ---J.I.9/g wet weight 27 0.08 2.6 - 51 4.7 7.1 0.15 1. 96 0.07 99 21 8.9 0.38
Jlg/g dry weight - - - - - - - 0.77 - - - - - -
li'J/g lipid - - - - - 56 52 1..83 29 9.1 494 488 - 11. 7
SQUALENE ---J,J-g/g wet weight 216 1.20 39 J.3 503 13.5 21 0.89 49 1.60 )0 1. 23 5.2 9 . 75
jltJ/g dry weight. - - - - - - - 5.0 - - - - - -
J.l.g/g lipid - - - BOO - 151 168 nB 622 146 150 )l - 313
TOTAL --li'J/g wet weight 248 1.3 42 J.3 556 18.3 29 1.1 52 1.8 132 22 16.9 10. l
j.l.g/g dry weight - - - - - - - 5.9 - - - - - -
ll9/g l1pid - - - 800 - 207 228 239 663 158 660 52.2 - 324
33


![Bioremediation in Mangrove Sediments Impacted by Oil Using ... in... · D. F. LIMA . ET AL. 121 (1983) [13]. 3) Determination of Total Petroleum Hydro- carbons (TPH). Saturated hydrocarbons](https://static.fdocuments.in/doc/165x107/5dd0b022d6be591ccb62353e/bioremediation-in-mangrove-sediments-impacted-by-oil-using-in-d-f-lima.jpg)


