Hydrocarbon and Deposit Morphology Effects on EGR Cooler ...
14
1 Managed by UT-Battelle for the Department of Energy Hydrocarbon and Deposit Morphology Effects on EGR Cooler Deposit Stability and Removal C. Scott Sluder, John M.E. Storey, Michael J. Lance Oak Ridge National Laboratory 2011 Directions In Engine Efficiency and Emissions Research Conference October 3-6, 2011 DOE Sponsors Kevin Stork, Steve Przesmitzki
Transcript of Hydrocarbon and Deposit Morphology Effects on EGR Cooler ...

1 Managed by UT-Battelle for the Department of Energy
Hydrocarbon and Deposit Morphology Effects on EGR Cooler Deposit Stability and Removal C. Scott Sluder, John M.E. Storey, Michael J. Lance Oak Ridge National Laboratory
2011 Directions In Engine Efficiency and Emissions Research Conference
October 3-6, 2011
DOE Sponsors Kevin Stork, Steve Przesmitzki

2 Managed by UT-Battelle for the Department of Energy
Gas In Gas Out
Coolant Out Coolant In
Surrogate EGR cooler tubes are employed to enable multiple analyses of deposits.
• Ford 6.4-L V-8 used as exhaust generator.
• Surrogate tubes provide more accessible samples for study than full-size coolers.
• Exhaust passed through surrogate EGR cooler tubes at constant flow rate and coolant temperature.
– Tubes were ¼ inch square cross-section stainless tubes.
– 12.5 inch length. – Thermal effectiveness of tubes is assessed
during exposure.
• Subsequent analyses of tube deposits: – Total mass of deposits – Volatile / non-volatile deposit mass – GC/MS characterization of the deposit HCs – Deposit layer thermal and physical properties

3 Managed by UT-Battelle for the Department of Energy
Previous studies have shown fouling to rapidly compromise the thermal effectiveness of EGR coolers.
Effectiveness loss significant within hours.
• Curvature of effectiveness-time profile means deposit properties are changing.
• Thermal conductivity similar to engineered insulation.
Hydrocarbon Deposition • Initially high, decreases rapidly. • Formation of high-temperature gradient
fouling layer. • HCs most located near the cold wall;
lessens their ability to be significant in terms of deposit properties.
Takes ~6.8g of liquid HCs (SG 0.75) to fill the voids formed by 1g soot.
• Most deposits have more soot than HCs.

4 Managed by UT-Battelle for the Department of Energy
Fouling usually leads to one of two potential failure modes:
Stabilized Effectiveness Loss • Deposits reduce cooling
effectiveness, but do not typically restrict gas flow.
• Often described as fluffy, powder-like consistency.
Loss of Flow (plugging) • Deposits form plugs
strong enough to occlude gas passages.
• Usually evidence of large HC influence.
• Tar-like consistency.

5 Managed by UT-Battelle for the Department of Energy
How can deposits high in HC content form?
Length of Heat Exchanger in Direction of Flow
Dep
osit
Thic
knes
s “High” gas temperature and flow rate.
“Low” gas temperature and flow rate.
“Low” gas temperature and flow rate.
“High” gas temperature and flow rate.
Use of a “large” heat exchanger at “low” heat transfer conditions may result in deposit layer temperatures conducive to HC deposition.
Conditions such as drop-to-idle or cold start may result in thermally and physically significant deposit HC levels and may be impacted by fuel chemistry.
Loca
l Hea
t Tra
nsfe
r
Incr
easi
ng T
emp
6 Managed by UT-Battelle for the Department of Energy
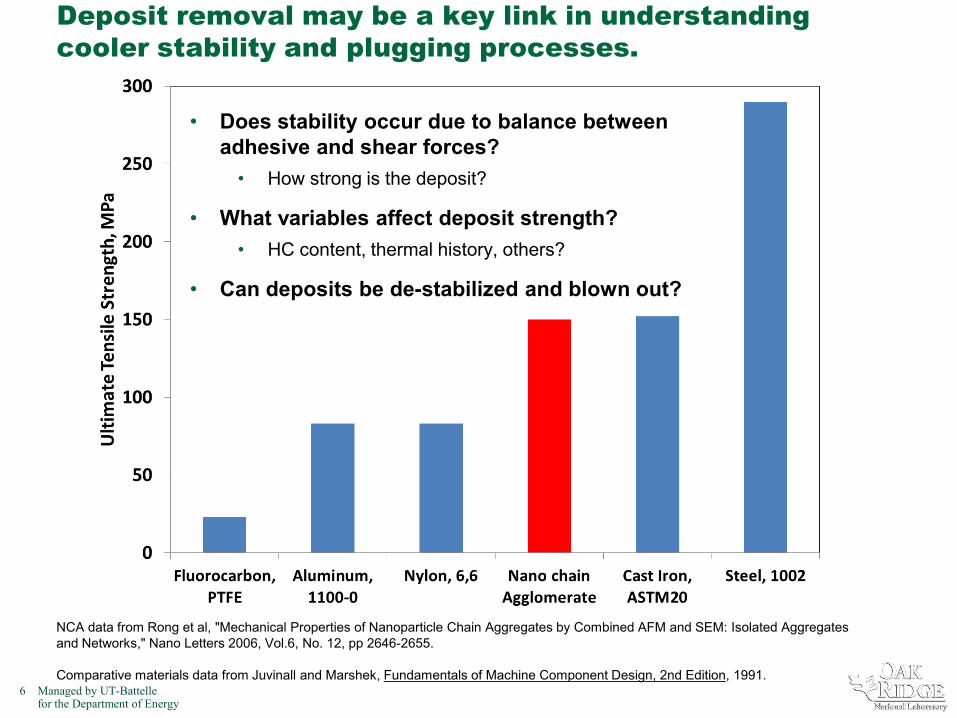
Deposit removal may be a key link in understanding cooler stability and plugging processes.
NCA data from Rong et al, "Mechanical Properties of Nanoparticle Chain Aggregates by Combined AFM and SEM: Isolated Aggregates and Networks," Nano Letters 2006, Vol.6, No. 12, pp 2646-2655. Comparative materials data from Juvinall and Marshek, Fundamentals of Machine Component Design, 2nd Edition, 1991.
• Does stability occur due to balance between adhesive and shear forces? • How strong is the deposit?
• What variables affect deposit strength? • HC content, thermal history, others?
• Can deposits be de-stabilized and blown out?

7 Managed by UT-Battelle for the Department of Energy
0
10
20
30
40
50
60
70
80
90
100
0 30 60 90 120 150 180 210 240Exposure Time (Minutes)
Hea
t Tra
nsfe
r Effe
ctiv
enes
s (%
)Doubling the gas velocity periodically during fouling to increase shear forces at deposit interface resulted in increased deposition, rather than removal of deposits.
Prior to effectiveness stabilization, shear force is not sufficient to offset deposit growth except at very high velocities that result in excessive pressure loss.
Red curve shown for steady-flow condition is offset +2% for visual clarity.
0
5
10
15
20
25
30
35
40
1 2 3 4
Tota
l Mas
s G
ain
(mg)
Transient Steady-State
316
Stai
nles
s St
eel
Nic
kel-T
eflo
n
Alu
min
a - B
oron
Nitr
ide
Elec
trop
olis
hed
316S
S
0
10
20
30
40
50
60
70
80
90
100
120 122 124 126 128 130Exposure Time (Minutes)
Hea
t Tra
nsfe
r Effe
ctiv
enes
s (%
)
8 Managed by UT-Battelle for the Department of Energy
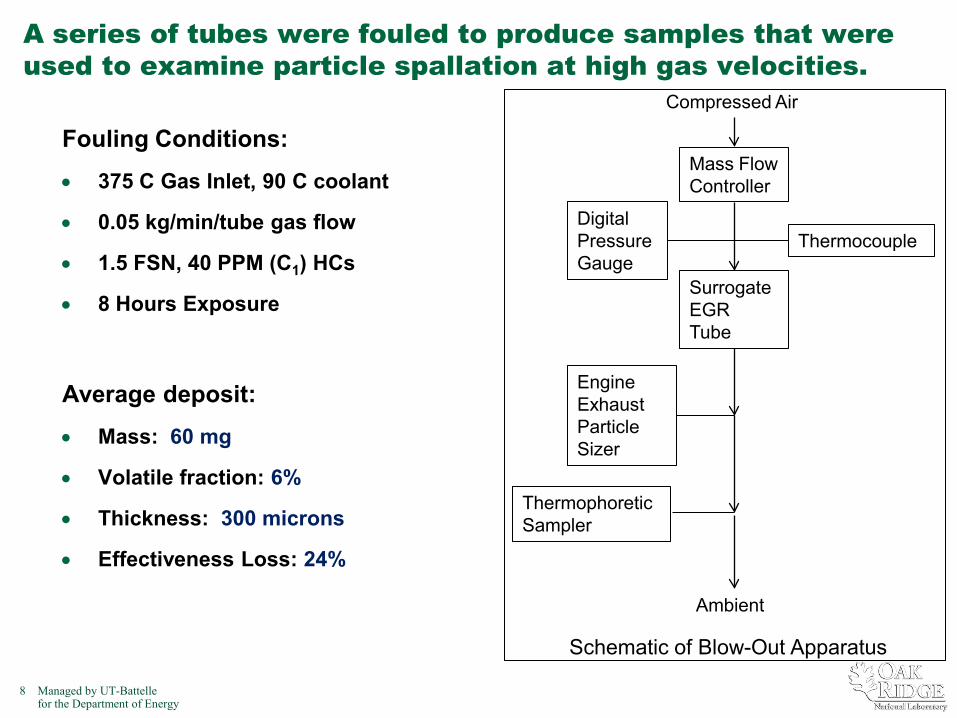
A series of tubes were fouled to produce samples that were used to examine particle spallation at high gas velocities.
Fouling Conditions:
• 375 C Gas Inlet, 90 C coolant
• 0.05 kg/min/tube gas flow
• 1.5 FSN, 40 PPM (C1) HCs
• 8 Hours Exposure
Average deposit:
• Mass: 60 mg
• Volatile fraction: 6%
• Thickness: 300 microns
• Effectiveness Loss: 24%
Compressed Air
Mass Flow Controller
Surrogate EGR Tube
Digital Pressure Gauge
Engine Exhaust Particle Sizer
Ambient
Thermophoretic Sampler
Thermocouple
Schematic of Blow-Out Apparatus
9 Managed by UT-Battelle for the Department of Energy
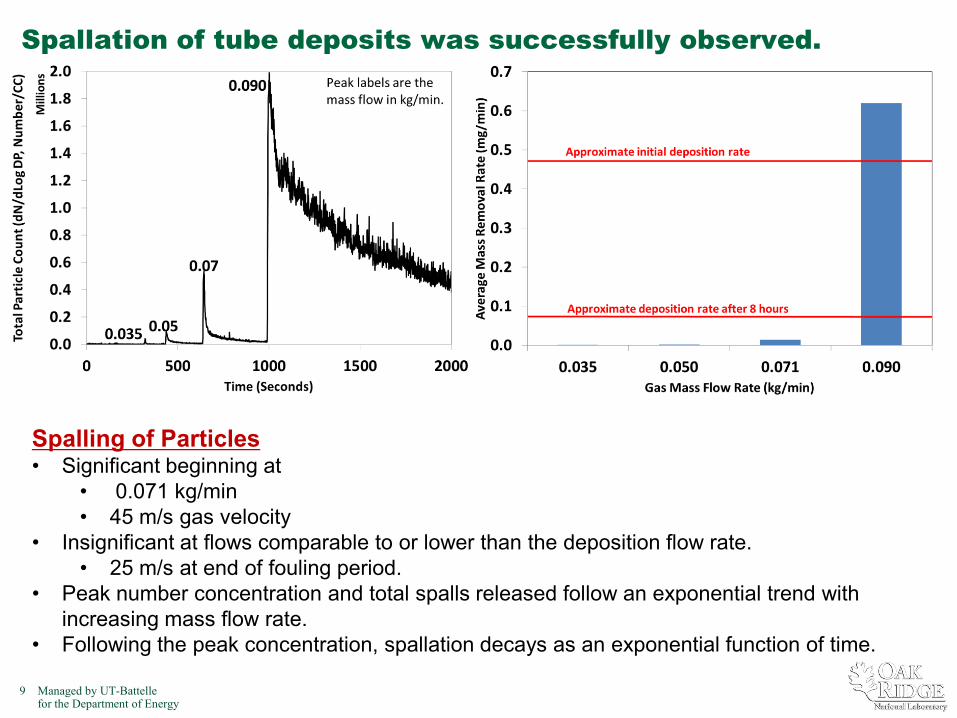
Spallation of tube deposits was successfully observed.
Spalling of Particles • Significant beginning at
• 0.071 kg/min • 45 m/s gas velocity
• Insignificant at flows comparable to or lower than the deposition flow rate. • 25 m/s at end of fouling period.
• Peak number concentration and total spalls released follow an exponential trend with increasing mass flow rate.
• Following the peak concentration, spallation decays as an exponential function of time.
10 Managed by UT-Battelle for the Department of Energy
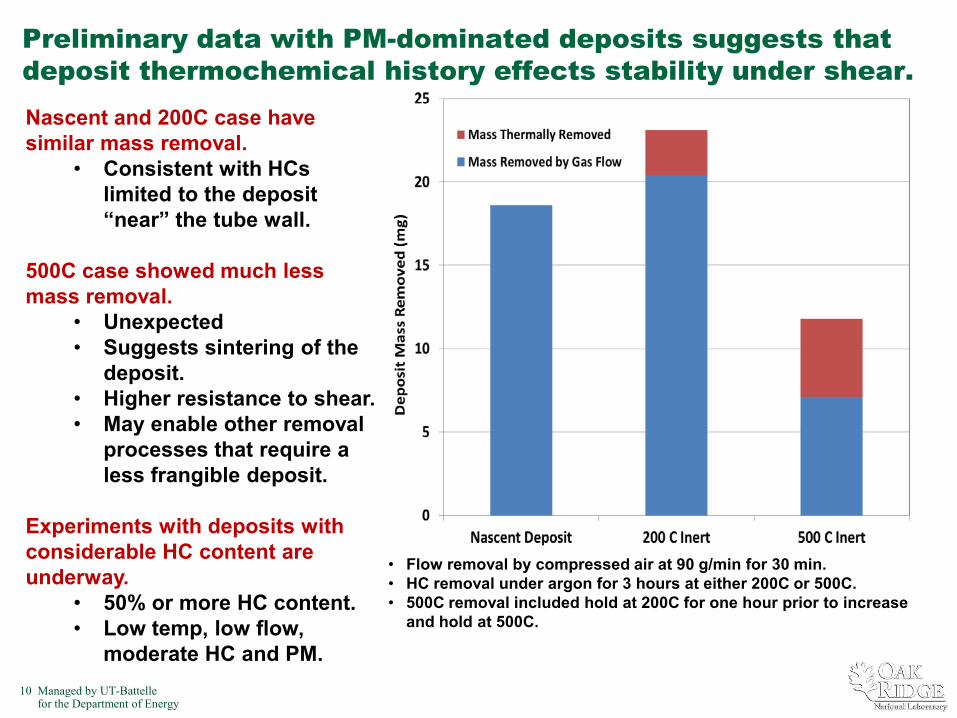
Preliminary data with PM-dominated deposits suggests that deposit thermochemical history effects stability under shear. Nascent and 200C case have similar mass removal.
• Consistent with HCs limited to the deposit “near” the tube wall.
500C case showed much less mass removal.
• Unexpected • Suggests sintering of the
deposit. • Higher resistance to shear. • May enable other removal
processes that require a less frangible deposit.
Experiments with deposits with considerable HC content are underway.
• 50% or more HC content. • Low temp, low flow,
moderate HC and PM.
• Flow removal by compressed air at 90 g/min for 30 min. • HC removal under argon for 3 hours at either 200C or 500C. • 500C removal included hold at 200C for one hour prior to increase
and hold at 500C.

11 Managed by UT-Battelle for the U.S. Department of Energy
Spalls from the deposit are not simply re-entrained diesel particulate.
• Spalls are much larger than typical diesel particulates.
• Areas experiencing spallation become rougher than the parent deposit. – Less pronounced in the sample treated
at 500 C after fouling. • Observations point to the formation of a
cohesive deposit even during short time periods.
1 µm
Deposit before spallation Deposit after spallation Image of a spall
220nm
100nm
450nm

12 Managed by UT-Battelle for the Department of Energy
Several studies have suggested that particle trapping in the deposit is a balance between deposition and removal during the fouling process.
• Many studies have shown that particle retention or trapping efficiency declines as gas velocity increases.
• Several studies point to a “critical rolling velocity”.
• Suggest that flow-induced shear can roll particles away and re-entrain them in the flow.
• Studies to date have measured the
change in fouling with velocity, but have not measured particle removal from deposit layers.
Redrawn from M.S. Abd-Elhady et al, “Influence of gas velocity on particulate fouling of exhaust gas recirculation coolers,” International Journal of Heat and Mass Transfer 54 (2011) 838-846.
• Glass and metal spheres (D > 5 µm), not carbon particulate.
• “Analysis limited to spherical, non-charged particles”.
M.S. Abd-Elhady et al, “Minimum gas speed in heat exchangers to avoid particulate fouling,” International Journal of Heat and Mass Transfer 47 (2004) 3943-3955.

13 Managed by UT-Battelle for the Department of Energy
No proven linkage yet that low fouling at high gas velocities results from deposit re-entrainment/removal.
Positive: Velocity shown for spallation is lower than predicted velocity for lack of fouling.
• 55 m/s for spallation • 80 m/s critical rolling velocity for 100nm spherical particle
Negative: 55 m/s gas velocity hasn’t been shown to avoid fouling, and still has significant pressure loss.
• Sensitivity of spallation velocity to deposit thickness? • Malayeri et al. (2010) observed fouling at 120 m/s with CAST soot
So: Does spallation occur during fouling?
• Not observed to date. • Likely requires higher flow rates.
Take-away: Need to exercise caution in applying the critical rolling velocity model to carbon particulate.
• Electrostatic charges. • Potentially chemically reactive. • Not spheres, but interlocking chains. • Spalls are not typical particulate and are also not spheres.

14 Managed by UT-Battelle for the Department of Energy
Conclusions and Future Plans
• Spallation can occur at velocities > 45 m/s.
• Amount of removal increases exponentially with the velocity.
• Spalls are not typical diesel particulates.
• Mass removal is not simply re-entrainment of incident particles.
• Thermochemical history of the deposit is important.
• Relationship between spallation and observations of lack of fouling are not clear.
• Future plans • Low-temperature conditions (plugging) • HC content, including different fuels • More flow rates • More deposit layer thicknesses