HYDERABAD RESIDENTIAL TRACTION@GLANCE -...
7
RESIDENTIAL TRACTION@GLANCE HYDERABAD RESIDENTIAL TRACTION@GLANCE February 2014 MARKET OVERVIEW NEW LAUNCHES ABSORPTION
-
Upload
nguyenduong -
Category
Documents
-
view
214 -
download
0
Transcript of HYDERABAD RESIDENTIAL TRACTION@GLANCE -...

RESIDENTIAL TRACTION@GLANCE
HYDERABAD RESIDENTIALTRACTION@GLANCEFebruary 2014
MARKET OVERVIEW NEW LAUNCHES ABSORPTION

Hyderabad mapHyderabad map

4
Market overview Hyderabad has witnessed weakened
consumer sentiments that have
affected the market deeply with no
signs of recovery since the past two
years. Developers on the other hand
have taken cues from buyer
expectations and have refrained from
increasing the prices.
Like other residential markets in the
country, Hyderabad witnessed a further
slowdown in the year 2013. Factors
such as slow economic growth, rising
interest rates by banks, high inflation
and political instability among other
factors have added to the uncertainties.
Nevertheless, Hyderabad fared slightly
better compared to other IT/ITeS
dominated cities of Chennai and Pune
with only a 4% drop in sales volume
during this time last year. A greater dip
in project launches helped the unsold
inventory levels to stabilise. New
launches in Hyderabad have come
down from 19,000 in 2012 to 16,200
units in 2013 resulting in a fall of 15%.
The fact that Hyderabad is an end user
market having a latent housing demand
is substantiated by evaluating a trend
of the past two years. A long term
analysis (8 quarters) of the moving
average of launches and absorption
clearly shows that the absorption levels
have been more or less stable, whereas
launches peaked in Q3 12 and have
been trending downwards since then.
Even the short term moving average
(4 quarters) confirms the trend.
Recognising the fact that buyers in the
Hyderabad market prefer completed
projects over under construction ones,
developers are concentrating on
project execution.
yderabad is undoubtedly the
Hmost affordable residential
markets out of the country's
top seven cities of NCR, Mumbai,
Bengaluru, Chennai, Pune and Kolkata.
The city has been known as the second
silicon valley of India after Bengaluru
and has emerged as an IT/ITeS and
biotech destination. Not only is it the
administrative, financial and economic
capital of the state but also the largest
contributor to the state's GDP.
A number of proposed infrastructure
initiatives are expected to further fuel
the growth of the real estate sector in
Hyderabad city. Outer Ring Road (ORR),
an eight lane expressway is being built
in the city and work is in progress on
the last stretch between Shamirpet and
Pedda Amberpet. A large part of the
ORR is already operational providing
good connectivity with Shamshabad
airport. The ORR provides a circular
connectivity with the city and helps in
decongesting the Inner Ring Road and
major arterial roads. Hyderabad Metro
is also under construction, Phase I of
the project will connect Miyapur and
LB.Nagar, Nagole and Shilparamanam,
JBS and Falaknuma. Unlike the ORR, the
Metro cuts through the city connecting
north with south and east with west in
a linear manner. Besides, the proposed
Hyderabad Metro Rail Information
Technology Investment Region (ITIR) is
also expected to boost the real estate
development in the city. The ITIR would
include special economic zones for the
IT/ITeS sector, industrial parks, free
trade zones, warehousing zones and
export oriented units.
Despite having all the constituents in
place for a successful real estate
market, the city has still not got its due.
Hyderabad has been reeling under
abundant uncertainties most of which
emerged due to political upheaval. As a
result of this, the state of the market
has remained the same since the past
five years. Largely an end user market,
Hyderabad witnessed a
further slowdown in the
year 2013. Factors such as
slow economic growth,
rising interest rates by
banks, high inflation and
political instability among
other factors have added to
the uncertainties.
Nevertheless, Hyderabad
fared slightly better
compared to other IT/ITeS
dominated cities of
Chennai and Pune with
only a 4% drop in sales
volume during this time
last year.
RESIDENTIAL TRACTION@GLANCE FEB 2014
YoY Change in Launches andAbsorption
Source: Knight Frank Research
FIGURE 1
Launches Absorption
Chennai -35% -33%
Pune -34% -33%
Hyderabad -15% -4%

During 2010-2012, nearly 54,000
residential units were launched in
the Hyderabad market. New project
launches peaked in the year 2011
and despite an improvement in
demand the unsold inventory levels
inched up.
Hence, by the end of year 2011 the QTS
(Quarters to Sell) ratio for the
Hyderabad market peaked at 9
indicating that unsold inventory will
take more than two years to get
absorbed. QTS refers to the number of
quarters required to exhaust the
existing unsold inventory in the city.
Taking a cue from the piling unsold
inventory, developers sliced the
number of new project launches by
one-third in Q1 2012. This coupled with
a 20% increase in absorption brought
down the QTS to eight in Q1 2012.
Post this the QTS remained stagnant at
eight till the end of Q3 2012. A flurry of
launches in Q4 2012 pushed the QTS
back to the Q4 2011 level of nine. This
has remained as is since the past five
quarters, primarily due to a slowdown
in absorption.
As of December2013 about 24% of the
total available units in the primary
market remain unsold in the Hyderabad
market. Although it is not quite high
compared to other IT/ITeS driven
markets, a healthy absorption rate is
required to bring it down and sustain
the prices.
In order to understand the market
dynamics further it is important to
study the city in parts. The Hyderabad
residential market can be broadly
classified into five micro-markets,each
of which has different characteristics,
price points and buyer profile.
The western zone comprising locations
like Kukatpally, Madhapur, Kondapur,
Gachibowli, Miyapur, HITEC City,
Gopannapalli, is the largest contributor
to residential supply in Hyderabad. Of
the total units under construction, the
western zone accounts for a significant
share of around 60%. Demand in this
region is end user driven, majority
catering to the employees of IT firms in
and around HITEC city and Gachibowli.
Supply in this micro-market has seen
a boost due to its proximity to
workplaces, upcoming retail
development and supporting
infrastructure in the form of connecting
railway stations, the National Highway
and Express Highway that connect to
the airport. Development in this region
is moving southwards with developers
showing interest in locations like
Narsingi and Appa Junction. These
locations are now perceived as the next
growth corridors and are expected to
gain traction in the coming years.
The northern zone is the second most
preferred residential micro-market and
is driven due to good infrastructure
facilities and proximity to the
cantonment area. This region
constitutes nearly 14% of the total
under construction units in the
Hyderabad market. Most of the supply
in the north zone has come up in
Kompally, Qutubullapur, Nagpur
Highway, Yarpal and Shamirpet.
The eastern zone comprises locations
such as Uppal, Nacharam, Mallapur,
Kapra, Cherlapalle, Pocharam, Kuntloor,
Rampally and Ghatkesar. Nearly 10% of
the total units under construction fall in
this zone. Uppal remains one of the
favoured destinations in this
micro-market. Phase II of the ORR, that
is under construction will improve the
traffic situation and connectivity in the
eastern zone.
Malakpet, Attapur, Upparpally,
Saidabad, Santoshnagar, Rajendranagar
and Shamshabad fall under the
southern zone. With the development
of Shamshabad International Airport
and other developments like SEZs,
Hardware Park and Fab City, this zone
has been growing as a residential
location. However, its distance from the
city is still a deterrent to demand.
5
QTSQTS
Source: Knight Frank Research
FIGURE 3
10
9
8
7
6
5
Q4 1
1
Q1 1
2
Q2 1
2
Q3 1
2
Q4 1
2
Q1 1
3
Q2 1
3
Q3 1
3
Q4 1
3
Absorption
Index Of Real Estate Indicators
Source: Knight Frank Research
FIGURE 4
New Launches
PriceUnsold
Ind
ex
Valu
e (
Base
: 2010=
1) 160
140
120
100
80
602010 2011 2012 2013
Residential Micro-Marketsin Hyderabad
Source: Knight Frank Research*HMR refers to Hyderabad Metropolitan Region
FIGURE 5
HMR- Central Begumpet, Banjara Hills,
Jubilee Hills, Panjagutta,
Somajiguda
HMR- West Kukatpally, Madhapur,
Kondapur, Gachibowli,
Raidurgam
HMR- East Uppal, Malkajgiri, LB Nagar
HMR- North Kompally, Medchal, Alwal,
Qutubullapur
HMR- South Attapur, Rajendra Nagar,
Shamshabad
RESIDENTIAL TRACTION@GLANCE FEB 2014
AbsorptionLaunches
Long Term (8 Quarters) MovingAverage Trend Of Launches & Absorption
Source: Knight Frank Research
FIGURE 2
5,500
5,000
4,500
4,000
3,500
3,000
2,500
2,000
Q4 1
1
Q1 1
2
Q2 1
2
Q3 1
2
Q4 1
2
Q1 1
3
Q2 1
3
Q3 1
3
Q4 1
3
No
. of
Un
its
6
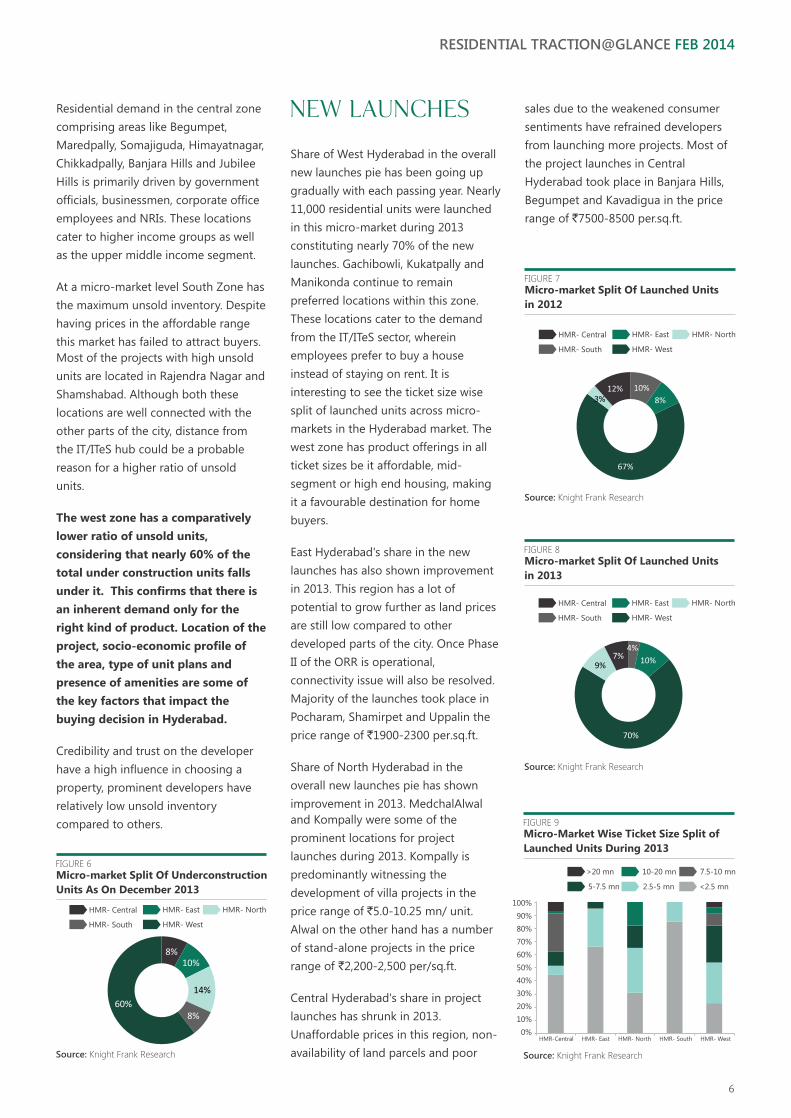
Residential demand in the central zone
comprising areas like Begumpet,
Maredpally, Somajiguda, Himayatnagar,
Chikkadpally, Banjara Hills and Jubilee
Hills is primarily driven by government
officials, businessmen, corporate office
employees and NRIs. These locations
cater to higher income groups as well
as the upper middle income segment.
At a micro-market level South Zone has
the maximum unsold inventory. Despite
having prices in the affordable range
this market has failed to attract buyers.
Most of the projects with high unsold
units are located in Rajendra Nagar and
Shamshabad. Although both these
locations are well connected with the
other parts of the city, distance from
the IT/ITeS hub could be a probable
reason for a higher ratio of unsold
units.
The west zone has a comparatively
lower ratio of unsold units,
considering that nearly 60% of the
total under construction units falls
under it. This confirms that there is
an inherent demand only for the
right kind of product. Location of the
project, socio-economic profile of
the area, type of unit plans and
presence of amenities are some of
the key factors that impact the
buying decision in Hyderabad.
Credibility and trust on the developer
have a high influence in choosing a
property, prominent developers have
relatively low unsold inventory
compared to others.
Share of West Hyderabad in the overall
new launches pie has been going up
gradually with each passing year. Nearly
11,000 residential units were launched
in this micro-market during 2013
constituting nearly 70% of the new
launches. Gachibowli, Kukatpally and
Manikonda continue to remain
preferred locations within this zone.
These locations cater to the demand
from the IT/ITeS sector, wherein
employees prefer to buy a house
instead of staying on rent. It is
interesting to see the ticket size wise
split of launched units across micro-
markets in the Hyderabad market. The
west zone has product offerings in all
ticket sizes be it affordable, mid-
segment or high end housing, making
it a favourable destination for home
buyers.
East Hyderabad's share in the new
launches has also shown improvement
in 2013. This region has a lot of
potential to grow further as land prices
are still low compared to other
developed parts of the city. Once Phase
II of the ORR is operational,
connectivity issue will also be resolved.
Majority of the launches took place in
Pocharam, Shamirpet and Uppalin the
price range of `1900-2300 per.sq.ft.
Share of North Hyderabad in the
overall new launches pie has shown
improvement in 2013. MedchalAlwal
and Kompally were some of the
prominent locations for project
launches during 2013. Kompally is
predominantly witnessing the
development of villa projects in the
price range of `5.0-10.25 mn/ unit.
Alwal on the other hand has a number
of stand-alone projects in the price
range of ̀ 2,200-2,500 per/sq.ft.
Central Hyderabad's share in project
launches has shrunk in 2013.
Unaffordable prices in this region, non-
availability of land parcels and poor
sales due to the weakened consumer
sentiments have refrained developers
from launching more projects. Most of
the project launches in Central
Hyderabad took place in Banjara Hills,
Begumpet and Kavadigua in the price
range of `7500-8500 per.sq.ft.
Source: Knight Frank Research
8%10%
14%
8%60%
FIGURE 6
Micro-market Split Of Underconstruction
Units As On December 2013
HMR- Central HMR- East
HMR- South HMR- West
HMR- North
FIGURE 7
Micro-market Split Of Launched Units
in 2012
Source: Knight Frank Research
10%
8%
67%
3%12%
FIGURE 8
Micro-market Split Of Launched Units
in 2013
Source: Knight Frank Research
4%
10%
70%
9%7%
FIGURE 9
Micro-Market Wise Ticket Size Split of
Launched Units During 2013
HMR-Central HMR- East HMR- South HMR- WestHMR- North
>20 mn 10-20 mn
5-7.5 mn 2.5-5 mn
7.5-10 mn
<2.5 mn
100%
90%
80%
70%
60%
50%
40%
30%
20%
10%
0%
Source: Knight Frank Research
RESIDENTIAL TRACTION@GLANCE FEB 2014
New Launches
HMR- Central HMR- East
HMR- South HMR- West
HMR- North
HMR- Central HMR- East
HMR- South HMR- West
HMR- North

Despite steady absorption levels in the
past two years the Hyderabad
residential market has seen hardly any
movement in prices. With only a 13%
increase in weighted average prices
since 2009 the Hyderabad market has
been the worst performer among the
IT/ITeS driven markets. Bengaluru, Pune
and Chennai have witnessed a
minimum of 38% increase since the
year 2009.
However, select markets closer to the
business districts such as Madhapur,
Kondapur and Gachibowli have seen
price appreciation to the tune of 9%
during 2013. Despite this the capital
values still fall short of the 2007-08
levels. Weighted average capital values
in the western zone are in the range of
`3000-3200 per.sq.ft. Prime residential
locations of Jubilee Hills and Banjara
Hills have seen an increase of about
7-10 % during 2013 due to limited
supply. Jubilee Hills and Banjara Hills
command high capital values ranging
between `7000-7500 per.sq.ft.
which is quite high, compared to other
micro-markets. Property prices in East
and South Hyderabad have been
steady. Locations such as Uppal, LB
Nagar and Bowenpally recorded a price
appreciation to the tune of 3-5% during
2013.
The residential sales volume has dipped
by 4% in the year 2013 compared to
2012. Approximately 16,500 residential
units were absorbed in 2013.
Hyderabad is an end user market, with
a stable sales appetite which is not
highly influenced by the number of
launches. Developers confirm that the
number of enquiries has not gone
down but buyers are taking time in
closing deals.
Plummeting launches during the year
2013 had little impact on the sales
volume, as home buyers prefer not to
book in a recently launched property
but wait for the delivery of the project.
The western micro-market has shown
the highest absorption in terms of
volume which can be attributed to the
type and volume of inventory available
in this market. Nearly 11,000 residential
units were absorbed in this micro-
market during 2013.
East and north micro-markets have
witnessed a drop in sales volume
during 2013 when compared to 2012.
Despite the prices being in the
affordable range these markets have
failed to attract enough buyers.
However, smaller projects with less than
50 units with minimum amenities have
seen good traction as they were offered
at an even lower price.
7
The Hyderabad residential
market has remained
stagnant during 2013, with
a slight drop in absorption.
Considering the recent
decision on the formation
of a separate state
Telangana the prevailing
uncertainties will fade
away. Clarity on this issue
is expected to boost the
absorption by the end of
the year or early 2015.
Prices
Index of Weighted AveragePrice Movement
Source: Knight Frank Research
FIGURE 11
0
20
40
60
80
100
120
140
160
Q1 1
1
Q4 1
2
Q1 1
3
Q2 1
3
Q3 1
3
Q4 1
3
Q2 1
1
Q3 1
1
Q4 1
1
Q1 1
2
Q2 1
2
Q3 1
2
Hyderabad
Bengaluru Chennai
Pune
RESIDENTIAL TRACTION@GLANCE FEB 2014
Absorption During 2010-2012, nearly
54,000 residential units
were launched in the
Hyderabad market. New
project launches peaked in
the year 2011 and despite
an improvement in
demand the unsold
inventory levels inched up.
FIGURE 10
Micro-Market Level Absorption in
2012 & 2013
Source: Knight Frank Research
2012 2013
HMR -SOUTH HMR -EAST HMR -WEST HMR-NORTH HMR-CENTRAL
12000
10000
8000
6000
4000
2000
0
No
. of
Un
its

Knight Frank India research provides development and strategic advisory
to a wide range of clients worldwide. We regularly produce detailed and
informative research reports which provide valuable insights on the real
estate market. Our strength lies in analyzing existing trends and predicting
future trends in the real estate sector from the data collected through
market surveys and interactions with real estate agents, developers, funds
and other stakeholders.
This report is published for general information only and not to be relied
upon in any way. Although high standards have been used in the
preparation of the information, analysis, views and projections presented in
this report, no responsibility or liability whatsoever can be accepted by
Knight Frank for any loss or damage resultant from any use of, reliance on
or reference to the contents of this document. As a general report, this
material does not necessarily represent the view of Knight Frank in relation
to particular properties or projects. Reproduction of this report in whole or
in part is not allowed without prior written approval of Knight Frank to the
form and content within which it appears.
Research
Dr. Samantak Das
Consultancy & Valuation
Saurabh Mehrotra
Office Agency
Mudassir Zaidi
Cities
Mumbai
Naushad Panjwani
NCR
Rajeev Bairathi
Bengaluru & Hyderabad
Satish BN
Pune
Shantanu Mazumder
Chennai
Kanchana Krishnan
Report Author
Ankita Nimbekar, Research Consultant
Chennai OfficeTraction@Glance January 2014
Chennai ResidentialTraction@GlanceJanuary 2014
www.VelocitaBrand.comRecent market leading research publications.
Knight Frank Research Reports available atwww.KnightFrank.com/research
RESIDENTIAL TRACTION@GLANCE
The Hyderabad residential market has remained stagnant during
2013, with a slight drop in absorption. Considering the recent
decision on the formation of separate state Telangana the
prevailing uncertainties will fade away. Clarity on this issue is
expected to boost the absorption by the end of the year or early
2015. Considering the city's potential as an IT/ITeS hub it is only a
matter of time before companies start making some investments.
However, there will be a lull until the elections, post which we
expect the demand to pick up. and see prices moving upwards.
West Hyderabad, where majority of the new jobs are being
created, will continue to witness the maximum traction in the
residential space going forward, followed by East Hyderabad.
Development of the ORR is also facilitating developers to launch
projects in far flung locations at lower prices, without
compromising on connectivity. Narsinghi and Appa Junction in
West Hyderabad are the next growth corridors with ample land
availability and good connectivity to the HITEC City.
Outlook
Economic &Realty@GlanceJanuary 2014