Hybrid and Electric Buses - Repic · Real World Performance of Hybrid and Electric Buses...
41
S:\Stefan Nowak\Projekte\REPIC\REPIC III\Projekte\9_Projekt abgeschlossen\2015\2014_01_grütter_EnergieEffizienz\B-Bericht\SB\TB_REPIC_FinalReport_e.docx Final Report: Real World Performance of Hybrid and Electric Buses Environmental and Financial Performance of Hybrid and Battery Electric Transit Buses Based on Real World Performance of Large Operational Fleets Author(s): Jürg Grütter, Grütter Consulting AG
Transcript of Hybrid and Electric Buses - Repic · Real World Performance of Hybrid and Electric Buses...

S:\Stefan Nowak\Projekte\REPIC\REPIC III\Projekte\9_Projekt abgeschlossen\2015\2014_01_grütter_EnergieEffizienz\B-Bericht\SB\TB_REPIC_FinalReport_e.docx
Final Report:
Real World Performance of Hybrid and Electric Buses
Environmental and Financial Performance of Hybrid and Battery Electric Transit Buses Based on Real World Performance of Large Operational Fleets
Author(s): Jürg Grütter, Grütter Consulting AG
2/2
S:\Stefan Nowak\Projekte\REPIC\REPIC III\Projekte\9_Projekt abgeschlossen\2015\2014_01_grütter_EnergieEffizienz\B-Bericht\SB\TB_REPIC_FinalReport_e.docx
Date of the Report: 22/02/2015 Contract Number: 2014.01
Institution: Grütter Consulting AG Country: international
Prepared by: Institution XY Grütter Consulting AG Thiersteinerstr.22, 4153 Reinach, Schweiz Tel: ++44 208 5637 463; [email protected]; www.transport-ghg.com With the Support of: REPIC Platform c/o NET Nowak Energy & Technology AG Waldweg 8, CH-1717 St. Ursen Tel: +41(0)26 494 00 30, Fax: +41(0)26 494 00 34, [email protected] / www.repic.ch The REPIC Platform is a mandate issued by the: Swiss State Secretariat for Economic Affairs SECO
Swiss Agency for Development and Cooperation SDC
Swiss Federal Office of Energy SFOE The author(s) are solely responsible for the content and conclusions of this report.
Real World Performance of Hybrid and
Electric Buses
Environmental and Financial Performance of Hybrid and Battery Electric Transit Buses
Based on Real World Performance of Large Operational Fleets
Jürg M. Grütter Grütter Consulting
December 2014 [email protected]
www.transport-ghg.com
Hybrid and Electric Buses
Grütter Consulting page 2
Contents
Abbreviations .....................................................................................................................................4
1. Introduction ....................................................................................................................................5
1.1. Background ..............................................................................................................................5
1.2. Objective ..................................................................................................................................5
1.3. Contents ..................................................................................................................................6
1.4. Repic and Grütter Consulting ....................................................................................................6
2. Comparison Cities ...........................................................................................................................7
2.1. Introduction .............................................................................................................................7
2.2. Overview Cities ........................................................................................................................7
3. Engine/Fuel Technologies for Transit Buses .....................................................................................9
3.1. Introduction .............................................................................................................................9
3.2. Hybrid Buses .......................................................................................................................... 10
3.3. Electric Buses ......................................................................................................................... 11
3.4. Market Penetration of Hybrid and Electric Transit Buses ........................................................ 12
4. Hybrid Bus Performance ............................................................................................................... 14
4.1. Introduction ........................................................................................................................... 14
4.2. Environmental Performance of Hybrids .................................................................................. 16
4.2.1. Literature Review ............................................................................................................ 16
4.2.2. Environmental Performance of Hybrids in Bogota ............................................................ 18
4.2.3. Environmental Performance of Hybrids in Zhengzhou ...................................................... 20
4.3. Economic Performance of Hybrid Buses ................................................................................. 24
4.3.1. Introduction .................................................................................................................... 24
4.3.2. Bus Availability ................................................................................................................ 25
4.3.3. Investment and Operational Cost .................................................................................... 25
4.3.4. Profitability ...................................................................................................................... 26
4.4. Conclusions Hybrid Buses ....................................................................................................... 29
5. Electric Bus Performance .............................................................................................................. 29
5.1. Introduction ........................................................................................................................... 29
5.2. Environmental Performance of Electric Buses ......................................................................... 32
5.2.1. Environmental Performance of Electric Buses in Zhengzhou ............................................ 32
Hybrid and Electric Buses
Grütter Consulting page 3
5.2.2. Environmental Performance of Electric Buses in Shenzhen .............................................. 33
5.2.3. Conclusion Environmental Performance of Electric Buses ................................................ 34
5.3. Economic Performance of Electric Buses ................................................................................ 35
5.3.1. Introduction .................................................................................................................... 35
5.3.2. Bus Availability ................................................................................................................ 35
5.3.3. Investment and Operational Cost .................................................................................... 36
5.3.4. Profitability ...................................................................................................................... 36
5.4. Conclusions Electric Buses ...................................................................................................... 37
6. Climate Finance Opportunities .................................................................................................. 37
7. Conclusions ............................................................................................................................... 38
Literature .......................................................................................................................................... 39

Hybrid and Electric Buses
Grütter Consulting page 4
Abbreviations AC Air Conditioning ADB Asian Development Bank AFD French Agency for Development BM Build Margin BRT Bus Rapid Transit CAF Andean Development Corporation CDM Clean Development Mechanism CM Combined Margin CNG Compressed Natural Gas CTF Climate Technology Fund EEV Enhanced Environmentally Friendly Vehicles FOEN Swiss Federal Office of Energy GEF Global Environment Facility GHG Greenhouse Gases GPS Global Positioning Satellite ICCT International Council on Clean Transportation ICE Internal Combustion Engine IDB Inter-American Development Bank IEA International Energy Agency IPCC Intergovernmental Panel on Climate Change IRR Internal Rate of Return LNG Liquefied Natural Gas NAMA Nationally Appropriate Mitigation Actions NCV Net Calorific Value NBFL New Bus for London OM Operating Margin PM Particle Matter RFID Radio Frequency Identification SDC Swiss Agency for Development and Cooperation SECO Swiss State Secretariat for Economic Affair SFOE Swiss Federal Office of Energy TDL Transmission and Distribution Losses TfL Transport for London TOD Transit Oriented Development TTW Tank-to-Wheel UITP International Association of Public Transport UNFCCC United Nations Framework Convention for Climate Change WTW Well-to-Wheel

Hybrid and Electric Buses
Grütter Consulting page 5
1. Introduction
1.1. Background Transport is the 2nd source of global energy-related CO2, and accounted 2012 for around 10 GtCO2e
emissions, around half of global oil consumption and ¼ of global Greenhouse Gas (GHG) emissions
from fossil fuels; moreover, transportation-driven CO2 emissions have increased more rapidly than
global emissions in the past two decades1. Annual GHG emissions from buses are expected to be
2015 in the order of 700 MtCO2 with a 50% growth rate expected until 2030 due to an increasing
vehicle stock2. GHG emissions in the order of 200 MtCO2 could be avoided by using hybrid buses
instead of conventional fossil fuel powered units. This represents roughly the annual total GHG
emissions of the Netherlands. Using electric buses could increase the GHG reduction even more3.
The number of buses, especially in Developing Countries, is growing rapidly. It is expected that latter
will account for more than 80% of buses acquired by 20204 i.e. the major market and the major
emission reductions potential with new technologies is clearly the Developing World. The focus of
this report is therefore on the usage of hybrid and electric buses in Developing Countries.
1.2. Objective The objective of the report and the “Hybrid and E-Bus Tool” is to compare hybrid and electric buses
with that of conventional fossil fuel units. The report shows real-world fuel savings, emissions and
economics of electric and hybrid buses especially in the context of Developing Countries.
Performance data of hybrid and electric buses has been reported in numerous documents. However
information is either based on data provided by bus producers or on sample measurements made
with pilot fleets or trials i.e. during a limited time with a small sample of vehicles. Conclusions based
on small samples of buses tend to be unreliable and non-robust. This is due to the fact that fuel
consumption, even of identical conventional buses, will vary significantly depending on the driving
situation, the route characteristics, ambient conditions, the driver, bus maintenance, bus make and
type, the usage of AC, type of tires used etc. Reliable and robust results can only be delivered if
precise monitoring of fuel usage is made over a significant time span, with a large fleet of buses in
the same city compromised of conventional as well as alternative traction units. In this manner units
are compared in similar settings filtering out external effects. The same is true of financial data
where small samples of alternative buses tend to lead to skewed results not least due to lack of
experience of mechanics and drivers and lack of a stock of spare parts.
The innovative part of this report is that all data is based on large fleets of alternative buses
operating in the same city parallel with conventional units. Data reported is of very high quality with
1 ICCT, Global Transportation Energy and Climate Roadmap, 2012 2 Calculation by Grütter Consulting based on vehicle-km reported by ICCT, Global Transportation Energy and
Climate Roadmap, 2012 3 Actual reductions depend on the electricity production mix in the country electric buses are deployed 4 Frost & Sullivan, Strategic Analysis of Global Hybrid and Electric Heavy-Duty Transit Bus Market, 08/2013; unit shipment forecast
Hybrid and Electric Buses
Grütter Consulting page 6
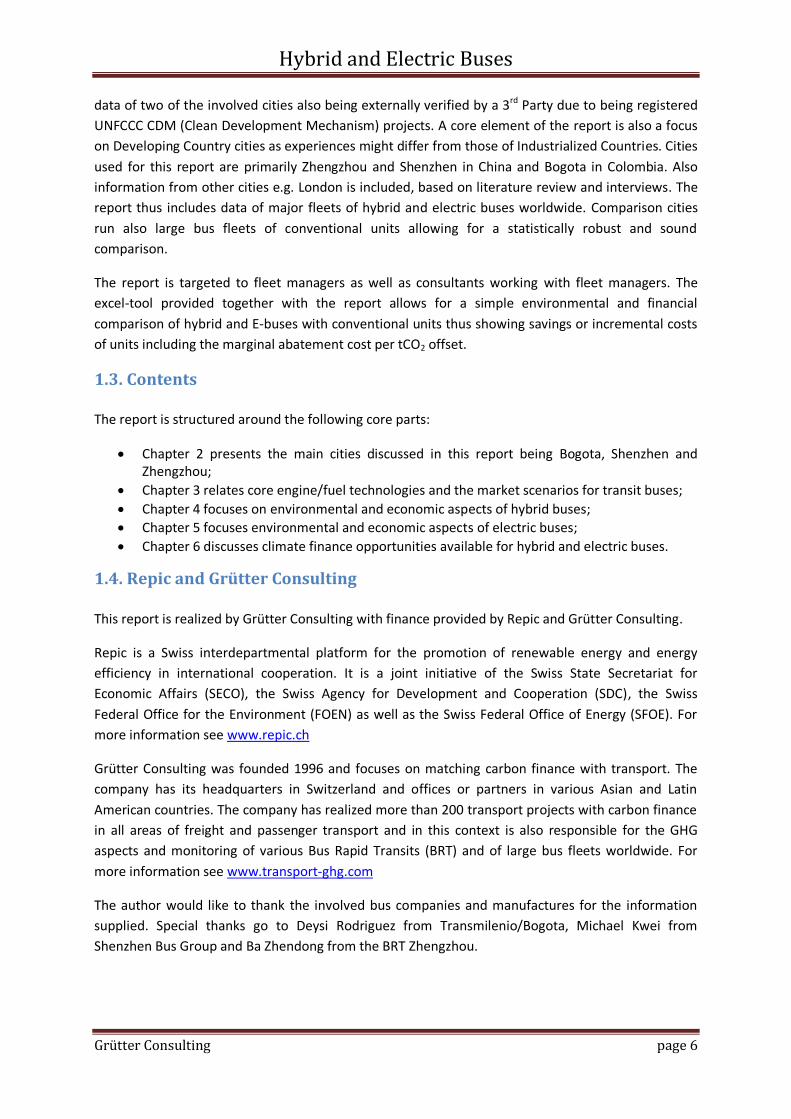
data of two of the involved cities also being externally verified by a 3rd Party due to being registered
UNFCCC CDM (Clean Development Mechanism) projects. A core element of the report is also a focus
on Developing Country cities as experiences might differ from those of Industrialized Countries. Cities
used for this report are primarily Zhengzhou and Shenzhen in China and Bogota in Colombia. Also
information from other cities e.g. London is included, based on literature review and interviews. The
report thus includes data of major fleets of hybrid and electric buses worldwide. Comparison cities
run also large bus fleets of conventional units allowing for a statistically robust and sound
comparison.
The report is targeted to fleet managers as well as consultants working with fleet managers. The
excel-tool provided together with the report allows for a simple environmental and financial
comparison of hybrid and E-buses with conventional units thus showing savings or incremental costs
of units including the marginal abatement cost per tCO2 offset.
1.3. Contents The report is structured around the following core parts:
Chapter 2 presents the main cities discussed in this report being Bogota, Shenzhen and Zhengzhou;
Chapter 3 relates core engine/fuel technologies and the market scenarios for transit buses;
Chapter 4 focuses on environmental and economic aspects of hybrid buses;
Chapter 5 focuses environmental and economic aspects of electric buses;
Chapter 6 discusses climate finance opportunities available for hybrid and electric buses.
1.4. Repic and Grütter Consulting This report is realized by Grütter Consulting with finance provided by Repic and Grütter Consulting.
Repic is a Swiss interdepartmental platform for the promotion of renewable energy and energy
efficiency in international cooperation. It is a joint initiative of the Swiss State Secretariat for
Economic Affairs (SECO), the Swiss Agency for Development and Cooperation (SDC), the Swiss
Federal Office for the Environment (FOEN) as well as the Swiss Federal Office of Energy (SFOE). For
more information see www.repic.ch
Grütter Consulting was founded 1996 and focuses on matching carbon finance with transport. The
company has its headquarters in Switzerland and offices or partners in various Asian and Latin
American countries. The company has realized more than 200 transport projects with carbon finance
in all areas of freight and passenger transport and in this context is also responsible for the GHG
aspects and monitoring of various Bus Rapid Transits (BRT) and of large bus fleets worldwide. For
more information see www.transport-ghg.com
The author would like to thank the involved bus companies and manufactures for the information
supplied. Special thanks go to Deysi Rodriguez from Transmilenio/Bogota, Michael Kwei from
Shenzhen Bus Group and Ba Zhendong from the BRT Zhengzhou.

Hybrid and Electric Buses
Grütter Consulting page 7
2. Comparison Cities
2.1. Introduction The dataset of the selected cities is unique and offers insights not available from other reports due to
three core reasons:
Hybrid and/or electric vehicles are deployed in the selected cities on a large scale. Hybrid and/or electric units have been operated, at least partially, since years. Therefore environmental as well as financial data are statistically reliable and robust. Pilot trials with a small amount of buses can lead to results which are strongly influenced by singular cases and can thus lead to questionable conclusions.
The cities selected manage very large bus fleets. They have therefore next to a large hybrid or electric bus fleet also a large conventional diesel and/or Compressed Natural Gas (CNG) fleet operating under comparable conditions.
The cities considered have an excellent data management system tracking environmental performance and costs, most notably fuel efficiency. In the case of Zhengzhou and Bogota the data is also being verified externally through a UN designated international entity as both manage CDM projects. Fuel efficiency data is reported per bus and per month. The high quality of data makes results reliable.
The uniqueness of the report therefore relies on comparing real world performance data of
hybrid/electric and conventional vehicles based on large fleets operating under standard conditions.
Cities included in the report are basically Bogota, Shenzhen and Zhengzhou.
2.2. Overview Cities Bogota is the capital and largest city of Colombia. It has an urban population of around 9 million
inhabitants5 in its metropolitan area and is situated at 2,625 meters.
Figure 1: Location Bogotá and BRT TransMilenio
Photo: Grütter
5 Population numbers depend on source and definition. It can be based on administrative boundaries or on concepts like city, urban area, metropolitan or larger economic zone etc. The population numbers cited in this report are based on Demographia which defines an urban area as a continuously built up land mass of urban development that is within a labor market, without regard for administrative boundaries. Demographia uses maps and satellite photographs to estimate continuous urbanization. See Demographia, World Urban Areas 10th Edition, 2014

Hybrid and Electric Buses
Grütter Consulting page 8
TransMilenio S.A. is a municipal company of Bogota and coordinates all bus operators of the BRT
system. The Bogota BRT TransMilenio was the first registered CDM transport project worldwide and
is monitoring and verifying GHG emissions of its bus system with assistance of Grütter Consulting
since 2006.
Shenzhen is a major city in the south of Southern China's Guangdong Province, situated immediately
north of Hong Kong. Its urban population is around 13 million inhabitants.
Figure 2: Location Shenzhen and Shenzhen Bus Group
Photo: Grütter The public bus system in Shenzhen is currently operated by 3 large city bus companies: Shenzhen Bus
Group Co., the City West Bus Company, and the City East Bus Company.
Zhengzhou is the capital and largest city of Henan province in North-Central China. The urban
population is around 4 million inhabitants.
Figure 3: Zhengzhou Map and BRT
Photo: Grütter The Zhengzhou Bus Communication Company which is part of the Municipal Government of
Zhengzhou is the parent company of all bus companies. The Zhengzhou BRT is a registered CDM
project and is monitoring and verifying GHG emissions of its bus system with assistance of Grütter
Consulting since 2010.
The following table shows some core comparison figures of the bus fleets used in each involved city.

Hybrid and Electric Buses
Grütter Consulting page 9
Table 1: Key Figures Bus Systems
Bogota6 Shenzhen Zhengzhou
Daily passengers 2.3 million > 6 million 3.2 million
Number of buses 4,500 > 10,000 > 5,000
Major bus sizes 50% medium buses 20% standard
25% articulated 3% bi-articulated
Majority standard buses; some medium
and some double-deckers
7% medium sized 67% standard
26% articulated
Fuel type used by conventional buses
100% diesel CNG and diesel basically
Around 50% CNG and 50% diesel; some electric
trolleybuses
Euro standards of buses 55% Euro II 20% Euro III 3% Euro IV 22% Euro V
Euro III, IV, V and 0-emission units (electric buses)
Euro III, IV, V and 0-emission units (electric buses)
Major bus manufacturers Chevrolet, MB and Volvo
7
BYD, Wuzhoulong Yutong
Alternative traction buses as of mid 2014
200 diesel-hybrids (12m, no plug-in hybrids)
1,800 plug-in hybrids (12m)
1,300 electric buses (12m)
600 diesel-hybrids 2,000 CNG-hybrids 200 LNG-hybrids
Around 1,300 of gas hybrids are plug-in
12m, 14m and 18m hybrids 110 electric buses (12m)
Medium sized bus: 8-11m; 30-60 passenger capacity Standard bus: 12-14m; 60-100 passenger capacity Articulated bus: 16-18m; 140-180 passenger capacity Bi-articulated bus: 24m, 240-280 passenger capacity
3. Engine/Fuel Technologies for Transit Buses
3.1. Introduction The focus of the study is on comparing the real-world performance of alternative powertrain of
hybrids and E-buses (electric buses) with conventional diesel, CNG and LNG (Liquefied Natural Gas)
buses8. Hybrids include serial, parallel and plug-in hybrids but not so-called “mild hybrids” with no
independent electric powertrain. E-buses include battery charged buses. The report does not include
electric trolleybuses as this technology is already used in many cities since decades. The report also
does not include opportunity charged electric buses as this technology is still in the trial stage. The
report also does not include hydrogen fuel cell buses this technology is also still in the trial stage with
no experience with a large fleet of buses.
The report is about bus technologies and not fuels used. Therefore no discussion concerning the
merits of gaseous or bio-fuels is made.
6 Includes only BRT system and the integrated public transport operators 7 Together around 80% of total fleet 8 LPG buses are not includes as these only circulate in very small numbers.
Hybrid and Electric Buses
Grütter Consulting page 10
The study focuses on the standard 12m transit9 or city bus with an average passenger capacity of
around 80 passengers (unseated). This is the major transit bus type circulating worldwide. The report
however also includes information on larger buses (18m, articulated units).
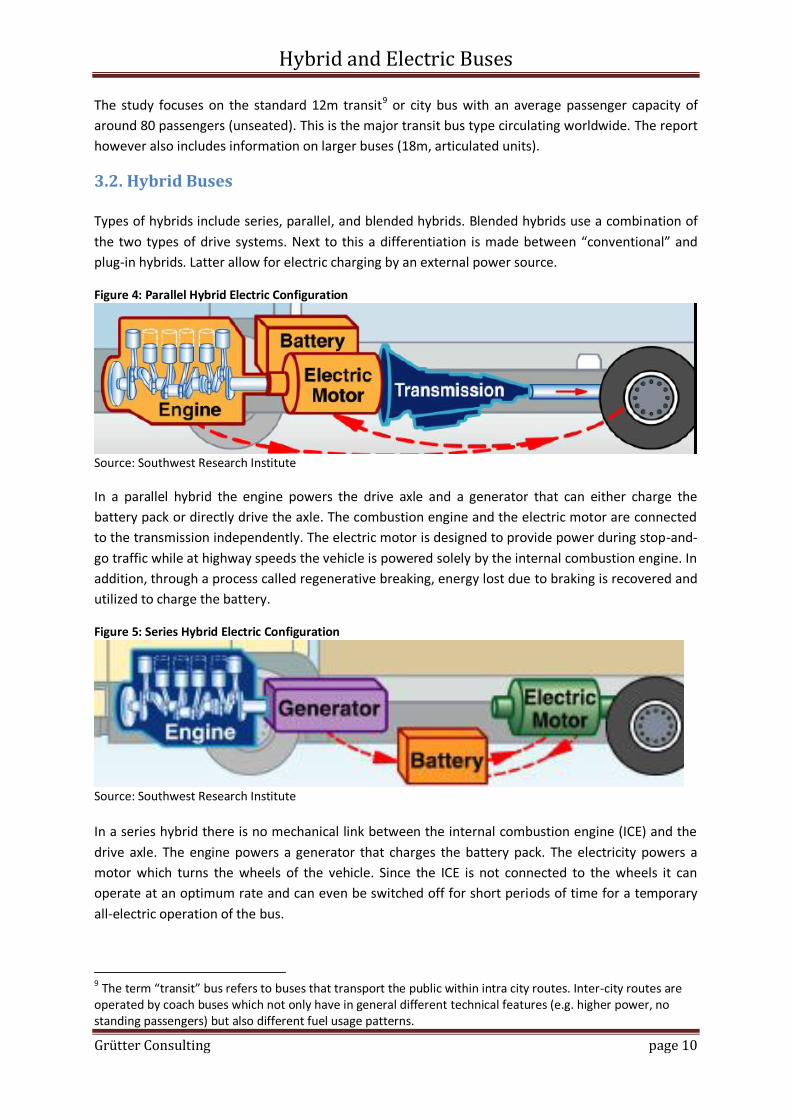
3.2. Hybrid Buses Types of hybrids include series, parallel, and blended hybrids. Blended hybrids use a combination of
the two types of drive systems. Next to this a differentiation is made between “conventional” and
plug-in hybrids. Latter allow for electric charging by an external power source.
Figure 4: Parallel Hybrid Electric Configuration
Source: Southwest Research Institute
In a parallel hybrid the engine powers the drive axle and a generator that can either charge the
battery pack or directly drive the axle. The combustion engine and the electric motor are connected
to the transmission independently. The electric motor is designed to provide power during stop-and-
go traffic while at highway speeds the vehicle is powered solely by the internal combustion engine. In
addition, through a process called regenerative breaking, energy lost due to braking is recovered and
utilized to charge the battery.
Figure 5: Series Hybrid Electric Configuration
Source: Southwest Research Institute
In a series hybrid there is no mechanical link between the internal combustion engine (ICE) and the
drive axle. The engine powers a generator that charges the battery pack. The electricity powers a
motor which turns the wheels of the vehicle. Since the ICE is not connected to the wheels it can
operate at an optimum rate and can even be switched off for short periods of time for a temporary
all-electric operation of the bus.
9 The term “transit” bus refers to buses that transport the public within intra city routes. Inter-city routes are operated by coach buses which not only have in general different technical features (e.g. higher power, no standing passengers) but also different fuel usage patterns.

Hybrid and Electric Buses
Grütter Consulting page 11
Diesel-electric hybrids are commercially available since more than 15 years. New models are being
developed by a range of manufacturers. CNG or LNG hybrid buses operate in a similar way to diesel-
electric hybrids and are used basically in China.
Plug-in hybrids are powered by a battery which can be charged from an external power source. Plug-
in hybrids have an on-board engine which can also recharge this battery. The key application of this is
the ability to run in all electric mode part of the time. The amount the bus will run on electric mode
will be highly dependent upon route characteristics, charging frequency and vehicle and energy
systems configuration. Plug-in hybrids are a relatively new technology but cities like Zhengzhou or
Shenzhen already operate large fleets of plug-in hybrids since around 2 years.
Standard hybrids run mostly with super-capacitors whilst plug-in hybrids run with batteries10.
3.3. Electric Buses Electric buses included in this report are battery electric vehicles powered solely by a rechargeable
battery. Battery electric buses in general have a large amount of batteries on-board to achieve a
sufficient driving range resulting in a considerable additional weight and space requirement. To
resolve the trade-off between on-board battery requirement and driving range some electric battery
manufacturers produce E-buses with rapid-change battery racks.
“Opportunity” electric buses are charged on route either at charging points throughout the bus
circuit or at first and final stops (see Figure below for such a system). In Geneva an ultra-rapid
charging system called flash charging is being tested with articulated buses (see Picture below).
However such systems, albeit promising for the future, are still in their trail stage with no large fleets
operating. They are therefore not included in the report.
Figure 6: Fast Charging of Electric Buses
Source: http://hybricon.se/word/projects/service-modules/; a 13km route requires 3 min. ultrafast charging at one site
10 Capacitors act as an energy store, like batteries. Because classic capacitors are electrostatic, they can release charge very quickly. Batteries rely on a chemical processes, which evolve more slowly i.e. batteries have a higher energy density and capacitors can have a higher power density.

Hybrid and Electric Buses
Grütter Consulting page 12
Photo 1: Flash Charging of Electric Buses (TOSA11)
Source: Grütter
UITP (International Association of Public Transport) coordinates a consortium of 40 partners to work
on the 4 year demonstration project ZeEUS (Zero Emission urban Bus System) aiming at extending
the fully-electric solution to a wider part of the urban bus network. The project was launched January
2014 and covers innovative electric bus solutions with different electric powertrain systems to be
demonstrated in 8 European cities with 35 electric 12m buses (including next to battery electric
vehicles also plug-in hybrids and electric trolleys with batteries).
3.4. Market Penetration of Hybrid and Electric Transit Buses The total bus stock 2010 is some 16 million units and is expected to rise to around 18 million units by
2020 and 20 million units by 2030. 2010 around 17% of all buses were operating in China, 12% in
Korea, 6% in the US, 6% in Russia and 4% in India being the 5 largest bus operator countries. 2030 it
is expected that China, India and Korea are the 3 countries with the largest bus stock12. The figures of
ICCT (International Council on Clean Transportation) include not only transit buses but also inter-
urban and other buses. In the following the focus is on transit buses. By 2020 it is expected that
nearly 300,000 units of large transit buses are delivered. The following Figure shows which countries
and regions will be the major buyers of buses.
Figure 7: Snapshot Projected Global Transit Bus Market 2020
Source: Frost & Sullivan, Strategic Analysis of Global Hybrid and Electric Heavy-Duty Transit Bus Market, 08/2013; unit shipment forecast
11 Trolleybus Optimisation System Alimentation 12 ICCT, Global Transportation Energy and Climate Roadmap, 2012, Appendix E
North America
2%
Europe 5%
Russia 9%
South America
21%
RoW 22%
India 15%
China 26%

Hybrid and Electric Buses
Grütter Consulting page 13
China alone will have a global market share of more than 25% of transit buses with more than 70,000
units being acquired. North America for example is only projected to buy in the same year around
6,000 units. India and Russia also have large market shares. Europe and North America will have
together a market share of less than 8% and also far lower growth rates than other regions
worldwide meaning that their relative importance in the bus market will further decline. The figure
shows clearly that the virtues of electric and hybrid technology will have to be demonstrated in
countries like China and India and regions like South America, ASEAN and African countries with the
largest compound growth rate of all regions. Not surprisingly it is also expected that Chinese
manufacturers such as Yutong, Wuzhoulong, Foton, Kinglong and BYD are expected to top the global
hybrid and electric transit bus market with Volvo, ADL and Daimler featuring as non-Chinese
members of leading manufacturers13.
Globally more than 250 BRT systems are operational or under planning- This creates an enormous
market potential for new vehicle purchase of electric and hybrid buses. Frost & Sullivan expect also
for this reason that hybrid and electric buses will have a market share of new sold transit buses of
around 15% by the year 2020 which means a compound annual growth rate of nearly 20% compared
to 2012 – this growth rate is far higher than the overall transit bus growth rate of around 6%. It is
expected that 2020 some 27,000 hybrid and electric units will be sold compared to some 8,000 units
in the year 2012.
The following table gives a comparison of investment costs of standard 12m transit buses in different
world regions comparing diesel, hybrids and electric units.
Table 2: Region Wise Price Comparison for Transit Buses (USD)
Market Conventional
diesel Hybrid Electric Mark-up Hybrid
Mark-up Electric
China $60,000-$90,000 $125,000-$200,000 $280,000-$350,000 115% 420%
India $75,000-$110,000 $175,000-$255,000 $325,000-$410,000 130% 300%
Russia $130,000-$180,000 $245,000-$325,000 $400,000-$500,000 85% 190%
Latin America $200,000-$225,000 $280,000-$340,000 $410,000-$500,000 45% 115%
Rest of World $100,000-$350,000 $195,000-$500,000 $300,000-$700,000 55% 120%
Europe $250,000-$350,000 $420,000-$510,000 $575,000-$680,000 55% 110%
North America $300,000-$400,000 $485,000-$540,000 $595,000-$690,000 45% 85%
Average $200,000 $330,000 $480,000 65% 140%
Source: Frost & Sullivan, Strategic Analysis of Global Hybrid and Electric Heavy-Duty Transit Bus Market, 08/2013; based on regional market price in USD 2012
Following elements are thereby noteworthy:
The investment cost per bus varies widely between regions;
An electric bus acquired in China is in the price range of a conventional diesel unit in North America or Europe.
Mark-ups in percentage of hybrid and electric buses are far higher in low-price markets like China,
India and Russia and far lower in high-priced markets such as Europe or North America. On average
the absolute mark-up price tag for a hybrid bus is in the order of $100,000-$150,000 and for an
electric unit $250,000 to $300,000. However price differences between conventional and hybrids as
well as electric buses have reduced since 2012 as the results of the following chapters will show. 13 Frost & Sullivan, Strategic Analysis of Global Hybrid and Electric Heavy-Duty Transit Bus Market, 08/2013

Hybrid and Electric Buses
Grütter Consulting page 14
4. Hybrid Bus Performance
4.1. Introduction The comparison of hybrid and convention units was made using the following criteria:
Comparisons are made within the same city i.e. alternative energy buses of Bogota are compared with conventional buses of Bogota;
Conventional and alternative buses operate the same routes or the same type of routes;
Buses compared are of the same or comparable size and passenger capacity;
Buses compared are of the same or comparable Euro standard and age;
Bus performance is compared over the same time period.
Fuel consumption in Zhengzhou and Bogota is measured per bus either based on RFID (Radio
Frequency Identification) or based on reports from filling stations. Distance driven is monitored by
GPS records. Fuel consumption and distance driven is externally controlled and verified by auditing
companies.
Bogota has recently acquired a fleet of 500 hybrid units of which some 200 units are operating as of
October 2014. Bogota also operates a very large fleet of comparable modern diesel buses. The hybrid
buses of Bogota are conventional (not plug-in) Volvo 12m hybrid buses for 80 passengers.
Conventional as well hybrid buses have no AC.
Photo 2: Hybrid Buses in Bogota
Source: Grütter
Zhengzhou operates since end 2010 a growing number of hybrids totalling around 2,800 units. The
following table gives some information concerning hybrids used.
Table 3: Hybrid Bus Characteristics Zhengzhou
Parameter Diesel-Hybrid Buses CNG/LNG-Hybrid Buses
Number of hybrids in operation 2009: 20 units 2010: 20 units
2011: 460 units 2012: 590 units
2013/14: 600 units
2012: 960 units 2013/2014: 2,220 units
of which around 200 LNG
Plug-in hybrids (included in the 0 units 1,300 units (all units acquired

Hybrid and Electric Buses
Grütter Consulting page 15
number of hybrids listed above) since 2013)
Size and passenger capacity 12m buses for 80 passengers 14m bus for 110 passengers 18m bus for 150 passengers
12m buses for 80 passengers 14m bus for 110 passengers 18m bus for 130 passengers
Manufacturer Yutong Yutong
Euro Standard IV and V V
Source: Zhengzhou Bus Communication Company, 2014
Photos 3: 12m and 14m Hybrids of Zhengzhou
Source: Grütter
Photos 4: Plug-In 18m LNG and 12m CNG Hybrids of Zhengzhou
Source: Grütter Photos 5: Plug-In Hybrid Electricity Charging (Batteries, Charging Station)
Spurce: Grütter

Hybrid and Electric Buses
Grütter Consulting page 16
In total Zhengzhou operates some 2,800 hybrid units representing more than 50% of the total fleet.
All hybrid buses have AC and all are parallel hybrids. Around 50% of units are plug-in hybrids. The
plug-in hybrids allow for charging with an all-electric range of around 30 km and a charging time of
40 minutes. They are equipped with Lithium batteries whilst conventional hybrids have super-
capacitors.
4.2. Environmental Performance of Hybrids
4.2.1. Literature Review
Many trials have been realized and continue to be realized with hybrid buses by numerous transit
operators worldwide. Data on fuel savings and financial costs are often based on such trials – some
just for a short period and the majority based on a very small fleet operating not necessarily
comparable routes. The following table summarizes core findings of major studies with hybrid buses
where, with exception of the C40Cities studies, fleets considered were significant (more than 50 units
– albeit in Germany scattered over many cities) and operated over a longer time period.
Table 4: Fuel Savings Reported in Recent Hybrid Transit Bus Studies
Country Fuel Savings Comments Study
Germany, various cities
10-20% fuel savings
Comparison with diesel units; based on around 60 hybrid buses of which the majority were articulated units14; results are only partially comparable as often only 1-5 hybrid buses were operated per city which not necessarily operated similar routes as diesel units.
PE International, Abschlussbericht Plattform Innovative Antriebe Bus, realized for BMVBS, 2011
London, UK 35-45% fuel savings15
TfL (Transport for London) has 650 hybrids in operations and plans to have 1,700 units in operation by 2016 (20% of the bus fleet); basically double-decker buses.
TfL, 2013 and 2014 and EU Clean Fleets Program (www.clean-fleets.eu)
Latin America (3 cities)
15-35% fuel savings
12m buses; based on trials during 2 days in Sao Paulo, Rio de Janeiro, Santiago de Chile and Bogota - results are thus to be taken with care
C40Cities, Low Carbon Technologies Can Transform Latin America’s Bus Fleets, 2013
New York, USA
20-30% fuel savings;
New York has one of the world’s largest hybrid fleet with around 1,700 units, which are however now being replaced partially with diesel units thus reducing the number of hybrids to around 1,300 units (30% of all buses); Relatively old hybrids (program started 15 years ago); best fuel economy of hybrids in low-speed stop-and-go traffic; AC usage in summer months has a much larger fuel economy impact on hybrids compared to diesel and thus reduces fuel savings of former.
NREL, Performance Comparison of Hybrid Electric, CNG, and Diesel Buses and New York City Transit, 2008
As mentioned the German study has some useful insights – however no solid conclusions concerning
fuel savings or bus reliability can be drawn as the hybrid fleet was scattered over various cities with
14 Articulated units tend to have lower fuel savings potentially due to hybrids being relatively new in this segment 15 Lower rate conventional Hybrid and higher rate NBFL (New Bus for London); comparison based on Euro V hybrid and diesel.

Hybrid and Electric Buses
Grütter Consulting page 17
different operational conditions. Comparisons between diesel and hybrid buses on comparable
settings were thus limited to small samples with results not being statistically robust.
The study realized by C40Cities relied on a very small sample of new buses (less than 10 units spread
over 4 cities) operating only for some days per city. Data can thus at best be called indicative but no
valid conclusions concerning reliability or actual fuel savings of vehicles can be drawn from singular
test drives. Variations are therefore also in a very wide range.
The most trustworthy data is from London and New York as both cities operate a large number of
hybrids alongside comparable conventional diesel units operating on the same or similar routes over
a significant time period.
Whilst New York has the longest experience with a large fleet of hybrid buses, the relevance of the
data is as of today slightly diminished as hybrid bus technologies used in New York can be considered
as outdated with no new hybrid bus entering the fleet the last 3 years.
London operates a fleet of more than 600 hybrid buses (the first ones entering operations in the year
2006) and plans to acquire more units having a fleet of around 1,700 or 20% of all units by 2016.
London has also a large fleet of modern diesel buses operating in the same conditions which make
comparisons meaningful. London operates as per end 2013 nearly 9,000 buses of which 40% are Euro
3 with DPF (Diesel Particulate Filter), 20% Euro 4, 30% Euro 5 and 10% EEV (Enhanced
Environmentally Friendly Vehicles). Around 30% of buses are single deck and 70% double deck.
Basically two types of hybrid buses are operated: “traditional” hybrids and a newly designed bus
specifically for London, the New Bus for London or new Routemaster produced by Wrightbus.
Picture 6: New Bus for London
Source: Grütter
The following table and figure shows the fuel consumption of diesel buses, the common hybrid bus
used in London and the New Bus for London.

Hybrid and Electric Buses
Grütter Consulting page 18
Table 5: Fuel Efficiency Buses London 2013 (all Buses Double-Decker Euro V)
Bus Type Specific diesel consumption (l/100km)
% savings versus conventional diesel
Conventional diesel 49
“average” hybrid 33 33%
New Bus for London hybrid 26 46%
Source: TFL, 2014; “average” hybrid refers to hybrids which are not New Bus for London Figure 8: Comparison of Fuel Efficiency Levels (Double-Decker Euro V Buses London, 2013)
Source: TFL, 2014; “average” hybrid refers to hybrids which are not New Bus for London
4.2.2. Environmental Performance of Hybrids in Bogota
Fuel Efficiency
The comparison of fuel consumption is made between 12m diesel hybrids Euro V and 12m diesel
buses Euro V of the same characteristics, of the same operating enterprise and within the same time
period. Buses in Bogota (conventional as well as hybrids) have no AC and fuel consumption values
are fairly constant during the year. However significant differences between operating enterprises of
TransMilenio concerning specific fuel consumption have been monitored although companies
operate similar routes and buses. Therefore hybrids and conventional units have been compared
within the same operator. The following table shows monitored diesel consumption for conventional
Euro V and hybrid Euro V buses.
Table 6: Hybrid and Conventional Bus Fuel Efficiency Bogota for 12m Euro V Bus
Operator Diesel Bus Fuel Efficiency Hybrid Bus Fuel Efficiency % Savings Hybrid
A 39 l/100km 30 l/100km 25%
B 44 l/100km 33 l/100km 25%
Source: Data from TransMilenio (daily records per bus); Data review, control and calculations by Grütter Consulting
Fuel consumption between the two operators varies by around 10% - however this is true for hybrids
as well as for conventional diesel units. Fuel savings therefore are for both operators 25% for hybrid
units.
0
10
20
30
40
50
60
New Bus for London average Hybrid average Diesel
l/10
0km
-46% -33%

Hybrid and Electric Buses
Grütter Consulting page 19
GHG Emissions To determine GHG emissions standard emission factors and calculation methods based on IPCC are
used i.e. the amount of fuel used is multiplied with the Net Calorific Value (NCV) of the fuel and the
corresponding CO2 Emission Factor. The following table shows the parameters used and their values.
Table 7: Parameters and Values Used to Determine GHG Emissions
Parameter Value Source
NCV of diesel 43 MJ/kg IPCC Guidelines for National GHG Inventories, 2006, table 1.2,average
CO2 emission factor of diesel 74.1 gCO2/MJ IPCC Guidelines for National GHG Inventories, 2006, table 1.4,average
Density of diesel 0.844 kg/l IEA, Energy Statistics Manual, 2005
Well-to-tank emission factor diesel 22% JRC-Study study 22%, CEC 23%, GREET model 25%, GHGenius model 29%; lower end value was taken to
be conservative16
The following table shows the GHG Tank-to-Wheel (TTW) and the Well-to-Wheel (WTW) emissions of
hybrid versus fossil fuel units. TTW emissions are those caused by fuel combustion i.e. they are the
direct emissions caused by the vehicle. WTW emissions include the upstream emissions (extraction,
refinery, transport) caused by fossil fuels. WTW include the indirect emissions caused by using fossil
fuel and thus show a more comprehensive picture of total GHG emissions caused by different
technologies.
Table 8: GHG Emissions 12m Euro V Buses in Bogota in gCO2/km
Operator
Diesel Hybrid GHG Reduction
TTW WTT TTW WTW
A 1,060 1,290 800 970 25%
B 1,200 1,460 890 1,090 25%
Source: calculation by Grütter Consulting based on data of Table 6 and 7
GHG emission reductions are thus, idem to fuel savings, 25% for hybrid buses.
On average 12m standard buses circulate per annum around 65,000 km in Bogota. Per bus GHG
savings are therefore around 22 tCO2/annum. With 500 hybrids operating Bogota thus avoids
annually more than 10,000 tCO2.
Local Environmental Impact The local environmental impact assessed is NOx and PM emissions. The local emissions are basically
determined per the Euro standard used. The Euro standards are set as g per kWh. Based on 1 l diesel
having 10 kWh a proportional reduction of local pollutants to fuel savings can be expected17.
16 JRC - Joint Research Centre-EUCAR-CONCAWE collaboration, Well-to-Wheels Analysis of Future Automotive Fuels and Powertrains in the European Context Version 3c, 2011 (used by EU RED); California Energy Commission, Full Fuel Cycle Assessment Well to Tank Energy Inputs, Emissions, and Water Impacts, 2007; LLC, Assessment of Direct and Indirect GHG Emissions Associated with Petroleum Fuels, 2009; Nylund et.al, Fuel and Technology Alternatives for Buses, VTT Technology 46, 2012; GHGenius was developed by Natural Resources Canada: NRC, GHGenius model version 4.02, 2013; http://www.ghgenius.ca/; GREET model was developed by the US Department of Energy: US DOE, GREET The Greenhouse Gases, Regulated Emissions, and Energy Use in Transportation Model Version GREET1 2012 rev2 http://greet.es.anl.gov/

Hybrid and Electric Buses
Grütter Consulting page 20
4.2.3. Environmental Performance of Hybrids in Zhengzhou
Fuel Efficiency
The comparison of fuel consumption is made between diesel hybrids and diesel buses of the same
size and CNG hybrids and CNG conventional buses also of the same size. Data included was bus fuel
consumption and distance driven per month per bus for the entire year 2013 thus allowing for a large
data base. The following table shows the specific fuel consumption based of different hybrid and
conventional buses in Zhengzhou.
Table 9: Hybrid and Conventional Bus Fuel Efficiency Zhengzhou (average for 2013)
Bus Type Fuel efficiency in l/100km or m
3/100km
% savings versus conventional
Standard (12m) Diesel Hybrid 29.5 26%
Standard (12m) Diesel conventional 40.0
Articulated (18m) Diesel Hybrid18
43.9 34%
Articulated (18m) Diesel conventional19
66.5
Standard (12-14m) CNG Hybrid 39.0 19%
Standard (10-11m) CNG conventional20 47.9
Source: Zhengzhou Bus Communication Company, 2014; data collection and calculations by Grütter Consulting;
based on monthly fuel consumption per bus
Hybrid buses were between 20% and 35% more efficient than their conventional counterpart. The
improvement of CNG hybrid buses versus conventional CNG buses might thereby be slightly
understated as CNG hybrid buses are all between 11.7 m and 13.7 m long with a passenger capacity
of between 86 and 112 passengers whilst conventional CNG units are 10.2-10.6 m long with a
capacity of around 60 passengers. Whilst the conventional CNG consumption was adjusted for the
size difference this might only capture partially the load difference of on average 40% thus
understating the fuel savings of CNG hybrids. Also conventional CNG buses in Zhengzhou are without
AC whilst hybrid units have AC. Overall however fuel savings of 20-30% with hybrids can be
confirmed from the experience of Zhengzhou.
All buses experienced significantly higher fuel consumption during hot summer months. The
following figures contrast the average monthly temperatures in Zhengzhou with the specific fuel
consumption of buses showing a clear correlation.
17 See e.g. VBZ, Elektrobusse bei den Verkehrsbetrieben Zürich or A.M. Hallquist et.al., Particle and gaseous emissions from individual diesel and CNG buses, Atmos. Chem. Phys., 13, 5337-5350, 2013 or R. Pütz, Quo vadis Linienbusbetrieb?, VDV Jahrestagung 2014, 05/2014 18 on BRT trunk routes 19 on BRT trunk routes 20 Fuel consumption adjusted to larger CNG hybrid buses
Hybrid and Electric Buses
Grütter Consulting page 21
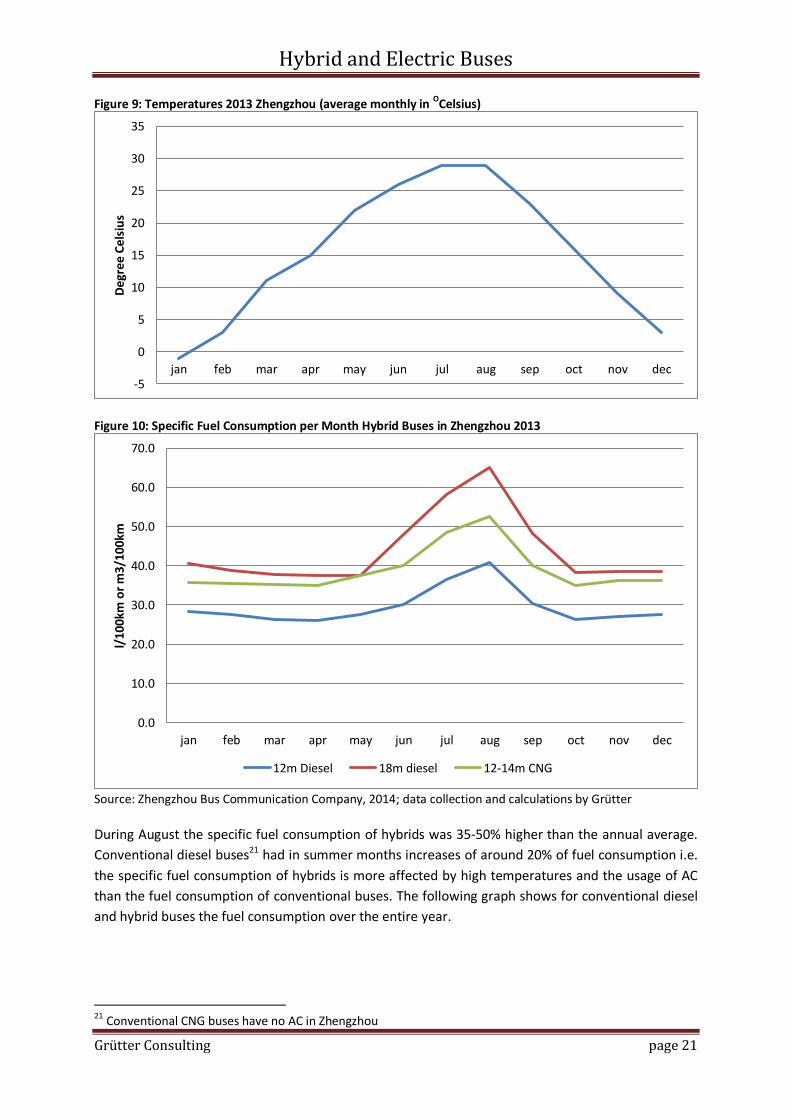
Figure 9: Temperatures 2013 Zhengzhou (average monthly in OCelsius)
Figure 10: Specific Fuel Consumption per Month Hybrid Buses in Zhengzhou 2013
Source: Zhengzhou Bus Communication Company, 2014; data collection and calculations by Grütter
During August the specific fuel consumption of hybrids was 35-50% higher than the annual average.
Conventional diesel buses21 had in summer months increases of around 20% of fuel consumption i.e.
the specific fuel consumption of hybrids is more affected by high temperatures and the usage of AC
than the fuel consumption of conventional buses. The following graph shows for conventional diesel
and hybrid buses the fuel consumption over the entire year.
21 Conventional CNG buses have no AC in Zhengzhou
-5
0
5
10
15
20
25
30
35
jan feb mar apr may jun jul aug sep oct nov dec
Deg
ree
Cel
siu
s
0.0
10.0
20.0
30.0
40.0
50.0
60.0
70.0
jan feb mar apr may jun jul aug sep oct nov dec
l/10
0km
or
m3/
100k
m
12m Diesel 18m diesel 12-14m CNG

Hybrid and Electric Buses
Grütter Consulting page 22
Figure 11: Specific Fuel Consumption per Month Diesel Buses in Zhengzhou 2013
Source: Zhengzhou Bus Communication Company, 2014; data collection and calculations by Grütter Whilst overall hybrid diesel buses were 25-35% more efficient than conventional diesel units in the
summer months of July and August the difference was only 10-25%. In the cold winter months
December and January with temperatures near the freezing point and thus usage of heating in buses
no such impact on fuel consumption could be observed. Two conclusions can be reached:
In countries with year-round high temperatures which require heavy-duty AC service the fuel savings of hybrids will be lower than in countries in more moderate climate zones or with cooler summers.
The investment in a good insulation of buses including e.g. double glazed windows is in countries with hot summer months important, especially for hybrid buses.
Plug-in hybrids, in service in Zhengzhou since early 2014, can reduce fuel consumption by another
10-15% if charged daily thus having fuel savings compared to conventional diesel buses of 30-45%.
GHG Emissions The same approach is used as for Bogota. The following table shows the parameters used and their
values22.
Table 10: Parameters and Values Used to Determine GHG Emission Factors
Parameter Value Source
NCV of CNG 48 MJ/kg IPCC Guidelines for National GHG Inventories, 2006, table 1.2,average
CO2 Emission factor of CNG 56.1 gCO2/MJ IPCC Guidelines for National GHG Inventories, 2006, table 1.4,average
CH4 emission factor of CNG buses23 25 gCO2e/km IPCC Guidelines for National GHG Inventories, 2006,
22 Parameters already included in Table 7 are not repeated. 23 The CH4 emission factor of diesel buses is marginal and is therefore not included; The N2O emission factor of diesel and CNG buses are not included as these are also marginal.
0.0
10.0
20.0
30.0
40.0
50.0
60.0
70.0
80.0
90.0
jan feb mar apr may jun jul aug sep oct nov dec
l/10
0km
12m hybrid 18m hybrid 18m conventional 12m conventional

Hybrid and Electric Buses
Grütter Consulting page 23
table 3.2.5 based on EU Copert IV model for Euro IV and later for CH4 factor and GWP from IPCC AR5, 2013
24
Density of CNG 0.714 kg/m3 Based on molar mass
Well-to-tank emission factor CNG 11% IPCC 1996 default Rest of the World 11%25
, CEC 17-37% depending on pipeline length, GHGenius model 18%, JEC-Study 15-40% depending on pipeline length, GREET model 45%; lower end value was taken to be conservative26
CO2 emission factor of electricity based on Combined Margin
0.72 kgCO2/kWh
NDRC China for Central China Power Grid, 2013
The following graph shows the GHG Tank-to-Wheel (TTW) emissions of hybrid versus fossil fuel units
i.e. the emissions caused only by the fossil fuel burning process in the engine.
Figure 11: GHG TTW Emissions Bus Types (gCO2/km)
Source: Grütter Consulting based on fuel consumption data 2013 provided by Zhengzhou Bus Communication Company
The following table shows the Well-to-Tank (WTW) emissions i.e. this includes the upstream
emissions caused by fossil fuels. The table also includes CNG plug-in hybrids as used in Zhengzhou
since early 2014.
24 900 mg CH4/km with a Global Warming Potential (GWP) of 28 based on 2013 IPCC AR5 p. 714 excluding climate-carbon feedbacks 25 296 tCH4 /PJ Table 1-63 and 1-64; EFCO2 for fuel combustion is according to IPCC 56.1 gCO2/MJ; GWP based on UNFCCC is 21 for CH4 26 Conservative in the context that baseline emissions are potentially more underestimated than project emissions as more fossil fuel is used in the baseline than in the project situation;
769 794
946 1,075
1,180
1,788
Hybrid CNG 12m Hybrid Diesel12m
CNG 12 m Diesel 12m Hybrid Diesel18m
Diesel 18m

Hybrid and Electric Buses
Grütter Consulting page 24
Table 11: GHG Emissions WTW Buses
Buy Type and Technology Emissions in gCO2/km GHG Reduction Compared to Conventional
12 m conventional diesel 1,310
12 m hybrid diesel (no plug-in) 970 26%
12 m conventional CNG 1,050
12 m hybrid CNG 850 19%
12m hybrid CNG plug-in 720 31%
Articulated 18m conventional diesel 2,181
Articulated 18m hybrid diesel (no plug-in) 1,440 34%
Source: Calculation by Grütter Consulting based on tables 9 and 10
GHG emission reductions are on average between 20% and 35% for hybrid buses.
On average 12m buss circulate in Zhengzhou annually 55,000 km whilst articulated buses circulate
around 65,000 km. Each 12m bus reduces therefore GHG emissions by 11-13 tCO2/annum (CNG
hybrids), 19 tCO2/annum (diesel hybrids) and 48 tCO2/annum for articulated diesel hybrids. Based on
the number of hybrid units in operations Zhengzhou avoided GHG emissions of more than 40,000
tCO2 in the year 2013.
Local Environmental Impact As already mentioned the local pollutants of hybrid buses have a proportional reduction to fuel
savings i.e. a reduction of around 25% compared to the same Euro standard of a conventional bus
can be expected. Plug-in hybrids can have a more significant reduction as they can operate in pure
electric mode over a longer distance, e.g. in polluted downtown areas. The plug-in hybrids used in
Zhengzhou have an electric drive range of around 30 km when fully charged and are thus 0-emission
vehicles in this area.
4.3. Economic Performance of Hybrid Buses
4.3.1. Introduction
Following cost components are used to compare the financial performance of hybrids versus
conventional units:
Bus availability rate: This criteria is based on how much time the bus spends at the workshop or in non-productive usage. A lower availability rate is transformed financially in additional bus investment e.g. if a hybrid bus is only available 50% of the time a conventional bus is available the bus operator needs to buy 2 hybrid units per conventional unit for the same service level;
Investment cost;
Maintenance cost;
Fuel price cost. Driver cost and bus management cost is not included as this cost is independent of the bus type
used. To realize a financial comparison costs are annualized based on standard interest rates and the
life-span used for buses in the respective country.
Hybrid and Electric Buses
Grütter Consulting page 25
4.3.2. Bus Availability
International reports on hybrids do not offer much information on bus availability. The study realized
in Germany27 indicates a 10% lower availability rate of hybrids versus diesel buses. This is not
surprising as only 2-5 hybrid buses were deployed per city thus making maintenance and repairs
more time-consuming due to lack of know-how and spare parts. In London, with a much larger hybrid
bus fleet (600 units) bus availability of hybrids is identical to conventional units. Zhengzhou with a
hybrid bus fleet of nearly 3,000 units also reports the same bus availability for hybrid as for
conventional units. Bogota is only operating hybrids since ½ a year. During this time no difference in
availability rates could be recorded.
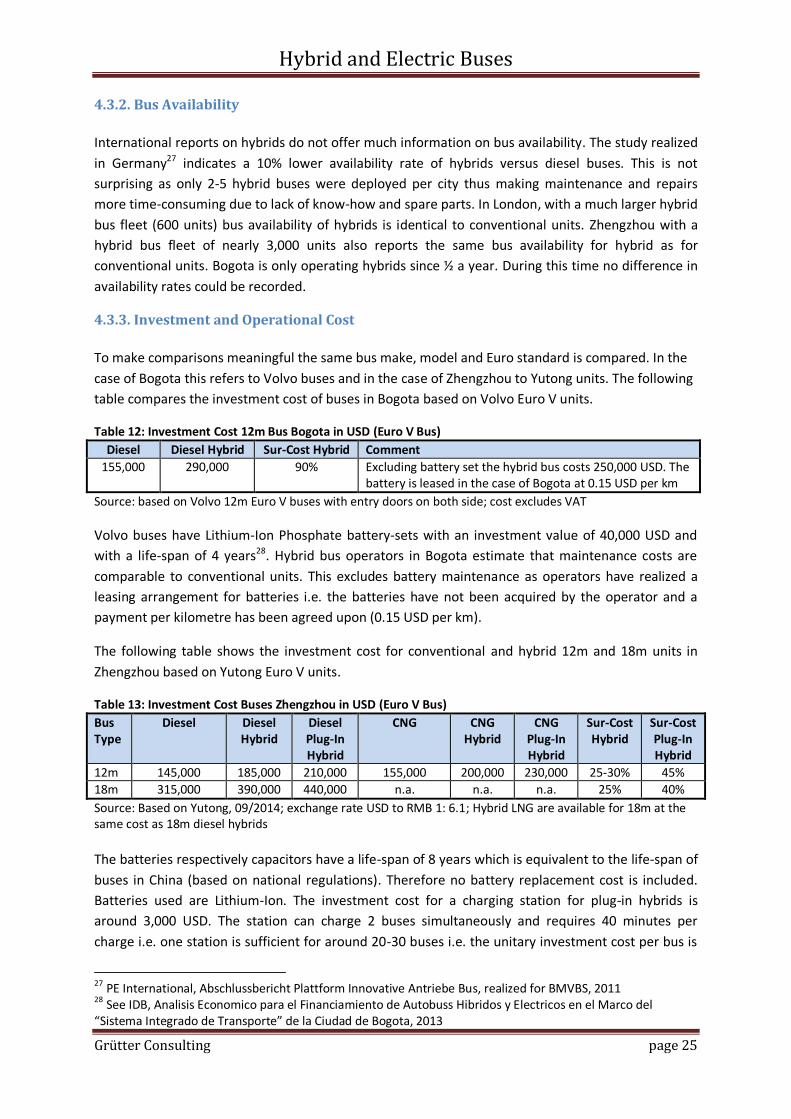
4.3.3. Investment and Operational Cost
To make comparisons meaningful the same bus make, model and Euro standard is compared. In the
case of Bogota this refers to Volvo buses and in the case of Zhengzhou to Yutong units. The following
table compares the investment cost of buses in Bogota based on Volvo Euro V units.
Table 12: Investment Cost 12m Bus Bogota in USD (Euro V Bus)
Diesel Diesel Hybrid Sur-Cost Hybrid Comment
155,000 290,000 90% Excluding battery set the hybrid bus costs 250,000 USD. The battery is leased in the case of Bogota at 0.15 USD per km
Source: based on Volvo 12m Euro V buses with entry doors on both side; cost excludes VAT
Volvo buses have Lithium-Ion Phosphate battery-sets with an investment value of 40,000 USD and
with a life-span of 4 years28. Hybrid bus operators in Bogota estimate that maintenance costs are
comparable to conventional units. This excludes battery maintenance as operators have realized a
leasing arrangement for batteries i.e. the batteries have not been acquired by the operator and a
payment per kilometre has been agreed upon (0.15 USD per km).
The following table shows the investment cost for conventional and hybrid 12m and 18m units in
Zhengzhou based on Yutong Euro V units.
Table 13: Investment Cost Buses Zhengzhou in USD (Euro V Bus)
Bus Type
Diesel Diesel Hybrid
Diesel Plug-In Hybrid
CNG CNG Hybrid
CNG Plug-In Hybrid
Sur-Cost Hybrid
Sur-Cost Plug-In Hybrid
12m 145,000 185,000 210,000 155,000 200,000 230,000 25-30% 45%
18m 315,000 390,000 440,000 n.a. n.a. n.a. 25% 40%
Source: Based on Yutong, 09/2014; exchange rate USD to RMB 1: 6.1; Hybrid LNG are available for 18m at the same cost as 18m diesel hybrids
The batteries respectively capacitors have a life-span of 8 years which is equivalent to the life-span of
buses in China (based on national regulations). Therefore no battery replacement cost is included.
Batteries used are Lithium-Ion. The investment cost for a charging station for plug-in hybrids is
around 3,000 USD. The station can charge 2 buses simultaneously and requires 40 minutes per
charge i.e. one station is sufficient for around 20-30 buses i.e. the unitary investment cost per bus is
27 PE International, Abschlussbericht Plattform Innovative Antriebe Bus, realized for BMVBS, 2011 28 See IDB, Analisis Economico para el Financiamiento de Autobuss Hibridos y Electricos en el Marco del “Sistema Integrado de Transporte” de la Ciudad de Bogota, 2013

Hybrid and Electric Buses
Grütter Consulting page 26
less than 150 USD and therefore not further considered29. According to the bus operator in
Zhengzhou the maintenance cost of hybrids and conventional units are comparable. This includes
also spare parts and repairs as well as time required for maintenance.
4.3.4. Profitability
The following table shows main parameters taken into consideration for the determination of the
profitability of hybrid versus conventional units.
Table 14: Parameters Used to Determine Profitability (Status June 2014)
ID Parameter Value Zhengzhou Value Bogota
1 Investment cost See table 13 See table 12
2 Maintenance cost per annum Identical hybrid and conventional and thus not considered
Cost of battery 0.15 USD/km30
3 Fuel cost Diesel: 1.16 USD/l CNG: 0.52 USD/m
3
Electricity: 0.08 USD/kWh
Diesel: 1.12 USD/l
4 Fuel savings See table 9 See table 6
5 Annual distance driven 12m: 55,000 km 18m: 65,000 km
65,000 km
6 Electricity usage plug-ins per operational day
12m: 40 kWh 18m: 60 kWh
n.a.
7 Electric distance driven plug-ins per operational day
30 km n.a.
8 Operational days per bus 300 Not required
9 Life-span of bus (usage years) 831 12-1532
10 Real interest rate33 3.4% 9%
Source: data collected by Grütter Consulting from operators
The following table shows the profitability of hybrid buses versus their conventional units in Bogota.
Table 15: Profitability of 12m Diesel-Hybrids in Bogota in USD
Parameter Diesel Hybrid-Diesel Comment
Additional investment 95,000 Excludes battery investment
Annualized cost per km 0.80 0.98-1.03 Lower value with a life-span of 15 years34
Source: Grütter Consulting based on above data
Fuel plus maintenance cost for hybrids including the battery leasing costs lead to slightly higher
annual costs than for a conventional diesel unit. The investment surplus cost can thus not be repaid
with the current cost structure, mileage and fuel consumption of buses in Bogota.
The following table shows the profitability of different types of hybrids in Zhengzhou.
29 Additionally the charging station in Zhengzhou is provided for by the electricity company. 30 Based on a service contract with Volvo 31 Fixed by the government 32
Conventional diesel buses are allowed to operate for 12 years and hybrid units for 15 years 33 Based on the nominal interest rate minus inflation of 2013: see as data source for the lending rate: http://data.worldbank.org/indicator/FR.INR.LEND/countries and for the inflation rate: http://data.worldbank.org/indicator/FP.CPI.TOTL.ZG 34 Bogota allows conventional units to be used for 12 years and hybrids for 15 years

Hybrid and Electric Buses
Grütter Consulting page 27
Table 16: Profitability of Hybrids Zhengzhou in USD
Parameter35
12m diesel
12m diesel-hybrid
12m diesel plug-in hybrid
12m CNG
12m CNG
hybrid
12m CNG plug-in hybrid
18m diesel
18m diesel hybrid
18m diesel plug-in hybrid
Additional investment
40,000 65,000 45,000 70,000 75,000 120,000
Annualized cost per km
0.85 0.83 0.86 0.66 0.73 0.79 1.47 1.38 1.44
Payback time (years)
36
6 7 18 22 4 6
Source: Grütter Consulting based on above data
In the case of Zhengzhou diesel hybrids are profitable with a payback time of between 4 and 7 years
– the most profitable being 18m diesel hybrids. CNG hybrids are not profitable due to CNG prices
being far lower than diesel prices thus resulting in lower financial savings due to fuel savings whilst
the investment differential is comparable to diesel units. The Internal Rate of Return IRR for diesel
hybrids is between 0% and 10% for a 12m diesel hybrid and between and 7%-23% for 18m hybrids.
Plug-in hybrids have a lower profitability rate than non-plug-ins. However if plug-ins are charged
twice daily i.e. after the morning tour and again in the evening, the profitability would be in the
range of normal hybrids.
Overall it can be said that diesel hybrids are profitable with a payback time of around 5 years if
distances driven are 55,000 km/year or more, if fuel prices of diesel are 1.2 USD or higher and if the
differential price between hybrids and conventional units is around 50,000 USD for standard 12m
units or 80,000 USD for 18m articulated units (for plug-ins 40% more). If operators circulate more or
fuel prices are higher the investment differential can be higher and a hybrid would still remain
profitable.
Main criteria which will affect the profitability of hybrids are:
1. Investment differential in absolute terms between hybrids and non-hybrids: A reduction of the investment differential between a hybrid and a conventional unit of 20% reduces the payback time by around 1 year.
2. Distance driven annually: An increase of the distance driven by 20% reduces the payback time by around 1 year.
3. Fuel price increase: An increase of fuel prices by 20% reduces the payback time by around 1.5 years.
4. For plug-in hybrids charging electricity twice per day instead of only once reduces the payback time by around 1 year.
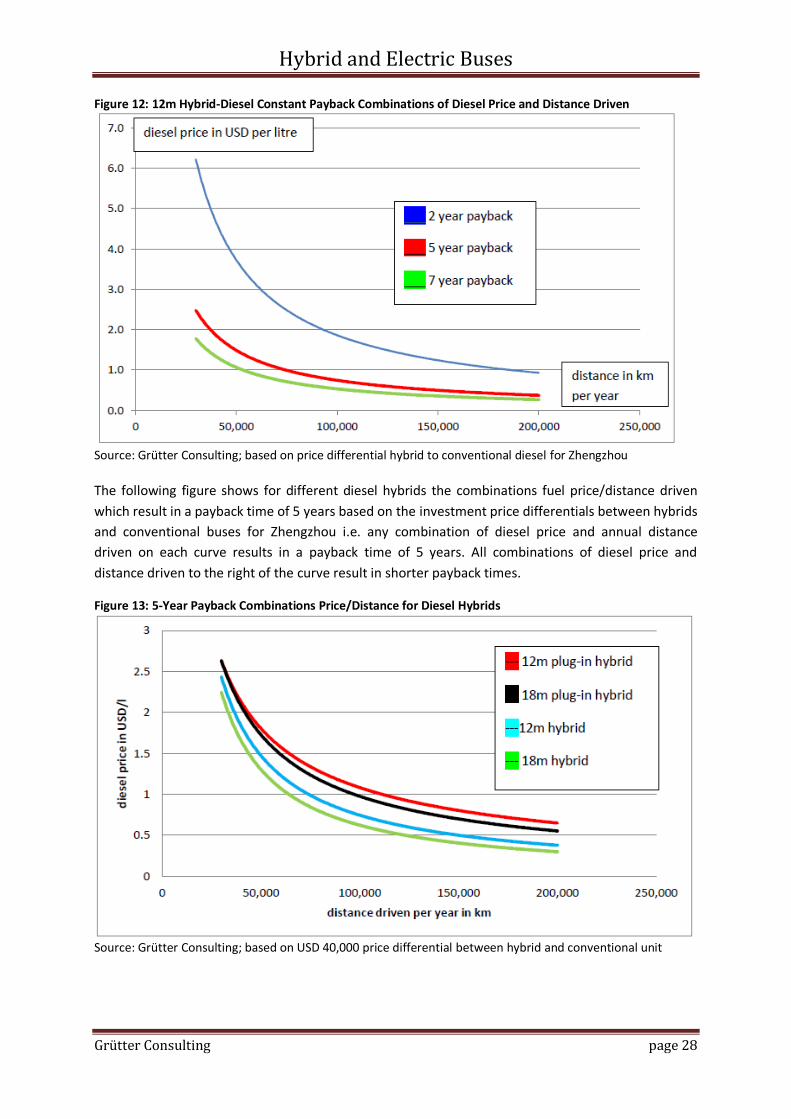
The following figure shows for 12m diesel hybrids the constant payback curves for variations of diesel
fuel prices and annual distance driven of buses.
35 Compared with their same fuel conventional units same size 36 Payback of additional investment compared to conventional unit same fuel and same size
Hybrid and Electric Buses
Grütter Consulting page 28
Figure 12: 12m Hybrid-Diesel Constant Payback Combinations of Diesel Price and Distance Driven
Source: Grütter Consulting; based on price differential hybrid to conventional diesel for Zhengzhou
The following figure shows for different diesel hybrids the combinations fuel price/distance driven
which result in a payback time of 5 years based on the investment price differentials between hybrids
and conventional buses for Zhengzhou i.e. any combination of diesel price and annual distance
driven on each curve results in a payback time of 5 years. All combinations of diesel price and
distance driven to the right of the curve result in shorter payback times.
Figure 13: 5-Year Payback Combinations Price/Distance for Diesel Hybrids
Source: Grütter Consulting; based on USD 40,000 price differential between hybrid and conventional unit

Hybrid and Electric Buses
Grütter Consulting page 29
The excel tool37 provides a calculation base for bus operators to insert location specific data (country
specific fuel prices, bus investment costs, electricity prices and average distance driven of units) to
determine the profitability of hybrids.
4.4. Conclusions Hybrid Buses Hybrid buses clearly have significant fuel savings. This is true for different bus sizes (12m, 18m),
different fuels (diesel, CNG and LNG) as well as for different manufactures. Real world performance
of hybrids shows fuel and corresponding GHG savings of on average 25-35%. Plug-in hybrids can
further reduce fuel consumption and lead to fuel savings of 40-50% compared to conventional units.
The fuel savings of plug-ins depend basically on the frequency of charging the battery units (once or
twice daily).
In economic terms modern hybrid buses show the same availability rate as conventional units.
Maintenance costs are reported to be comparable. Battery replacement costs or battery leasing costs
are a significant cost component and can offset fossil fuel savings. The differential investment
between hybrids and diesel units is, next to the fossil fuel price, the core factor determining the
profitability of hybrid buses. Price differences between manufactures of hybrid buses are significant
and influence greatly the profitability. Overall it can be said that the additional investment in hybrids
can be paid back in 5-6 years if the diesel price is at least USD 1.10/litre and the annual distance
driven is 60,000 km or more.
5. Electric Bus Performance
5.1. Introduction Standard 12m electric buses are still only used on a singular base. Also no study exists which has
compared operational performance of a fleet of large electric buses with conventional units. Such
units have only become commercially available recently but it is expected that this will be a mature
technology soon38. The largest producer of 12m fully electric buses is BYD and the largest fleet is
located in Shenzhen which started using electric buses January 2011 and now runs around 1,300 full
electric buses produced by BYD and Wuzhoulong basically. Electric fleets considered in this report are
those from Shenzhen and Zhengzhou. As mentioned Shenzhen operates by far the largest fleet of
electric buses worldwide while Zhengzhou operates since 2011 a fleet of 10 electric buses which was
expanded to 110 units end 2013.
Zhengzhou operates since 2011 10 electric Yutong buses with a length of 12m and a passenger
capacity of 80 persons. These buses have no AC, which resulted in limited usage of units during
summer months. End 2013 100 new units were acquired with AC. Under standard traffic conditions
the electric buses have a range of 120 km with an overnight charging time of 8 hours. The new buses
and charging stations allow for fast-charging with a duration of 2.5 hours. The system used by Yutong
is based on battery racks with Lithium Ion batteries which can be changed within max. 10 minutes i.e.
37 Grütter Consulting, Tool to Determine Profitability of Hybrid and Electric Buses, 2014 38 See EU clean fleets program
Hybrid and Electric Buses
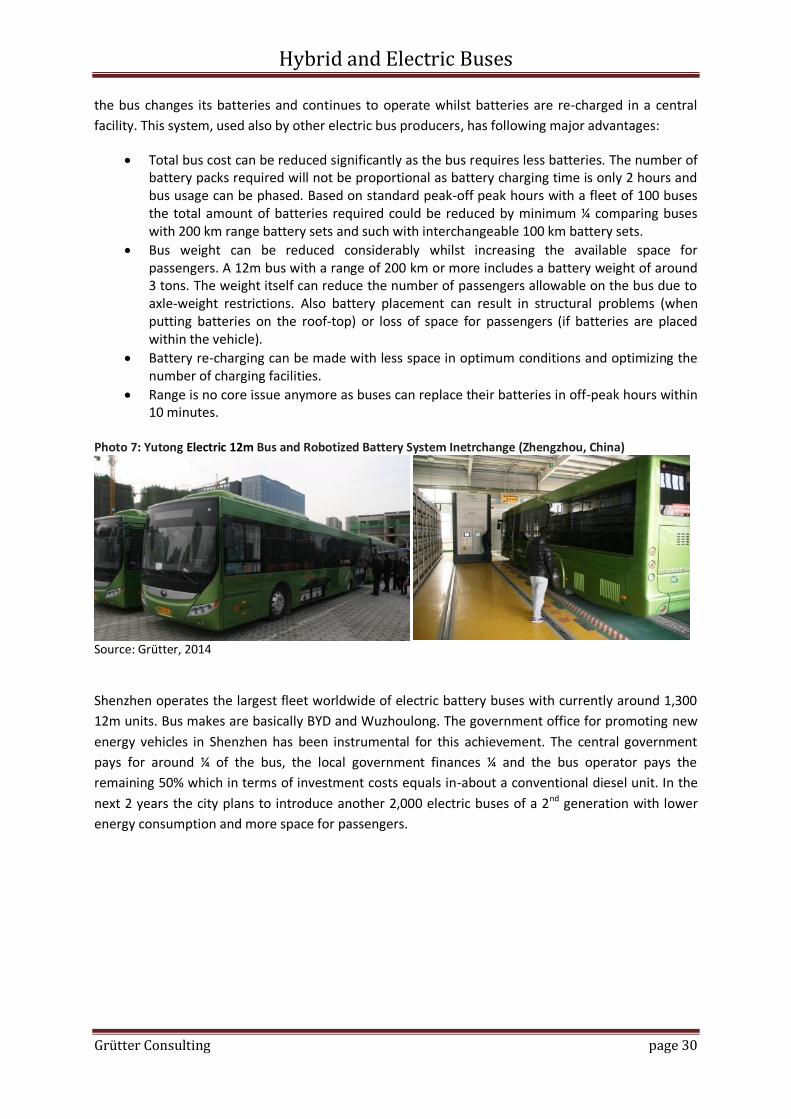
Grütter Consulting page 30
the bus changes its batteries and continues to operate whilst batteries are re-charged in a central
facility. This system, used also by other electric bus producers, has following major advantages:
Total bus cost can be reduced significantly as the bus requires less batteries. The number of battery packs required will not be proportional as battery charging time is only 2 hours and bus usage can be phased. Based on standard peak-off peak hours with a fleet of 100 buses the total amount of batteries required could be reduced by minimum ¼ comparing buses with 200 km range battery sets and such with interchangeable 100 km battery sets.
Bus weight can be reduced considerably whilst increasing the available space for passengers. A 12m bus with a range of 200 km or more includes a battery weight of around 3 tons. The weight itself can reduce the number of passengers allowable on the bus due to axle-weight restrictions. Also battery placement can result in structural problems (when putting batteries on the roof-top) or loss of space for passengers (if batteries are placed within the vehicle).
Battery re-charging can be made with less space in optimum conditions and optimizing the number of charging facilities.
Range is no core issue anymore as buses can replace their batteries in off-peak hours within 10 minutes.
Photo 7: Yutong Electric 12m Bus and Robotized Battery System Inetrchange (Zhengzhou, China)
Source: Grütter, 2014
Shenzhen operates the largest fleet worldwide of electric battery buses with currently around 1,300
12m units. Bus makes are basically BYD and Wuzhoulong. The government office for promoting new
energy vehicles in Shenzhen has been instrumental for this achievement. The central government
pays for around ¼ of the bus, the local government finances ¼ and the bus operator pays the
remaining 50% which in terms of investment costs equals in-about a conventional diesel unit. In the
next 2 years the city plans to introduce another 2,000 electric buses of a 2nd generation with lower
energy consumption and more space for passengers.

Hybrid and Electric Buses
Grütter Consulting page 31
Photo 8: BYD Electric Buses Operated by Shenzhen Bus Group
Source: Grütter
Photo 9: BYD Electric Buses Operated by Shenzhen Bus Group: Charging Facility and Bus Interior Space
Source: Grütter
The photo above shows the significantly decreased interior space of the 1st generation BYD full
electric buses, which have their battery compartment within the bus thus reducing the passenger
carrying capacity to around 50 passengers compared to 80 of a conventional diesel unit. The new
generation of BYD electric buses have batteries primarily on the roof thus reducing this problem. The
weight of batteries in the bus is around 3.5 tons. Batteries are Lithium-ion Iron-Phosphate FE
batteries with a charging time between 2 and 4 hours and a driving range of around 180-200 km with
AC. This driving range is based on the experience of Shenzhen Bus Group whilst the producer states a
driving range of 250-280 km. Batteries cannot be removed quickly from the bus i.e. the entire bus
must be re-charged. Based on the manufacturer batteries should with 3 years still have a capacity of

Hybrid and Electric Buses
Grütter Consulting page 32
minimum 90% and after 10 years still 80%39. The experience of the operator has however been that
after 3 years batteries only retain 80% of their original capacity thus limiting also effectively the
vehicle range.
5.2. Environmental Performance of Electric Buses
5.2.1. Environmental Performance of Electric Buses in Zhengzhou
The following table compares the electricity consumption of electric 12m buses with the fossil fuel
consumption of comparable conventional diesel buses used by Zhengzhou.
Table 17: Comparison Average Energy Consumption Standard 12m Electric and Diesel Bus
Bus Type Electric Bus Conventional diesel
Energy consumption 100 kWh/100km 40 l/100km
Source: Zhengzhou Bus Communication Company, 2014; data collection and calculations by Grütter Consulting; based on monthly fuel consumption per bus; data for electric buses based on an average for 3 years; the larger time period is taken due to the lower number of buses
The consumption is based on the older electric bus model. The new models which also have AC have
recently entered service during 2014 and therefore no performance data is yet available.
To determine GHG emissions calculation methods based on IPCC are used. For electric buses the
upstream emissions of electricity generation are included. The correct figure to compare the carbon
emission factor of electricity would be with the weighted average emission factor plus Transmission
and Distribution Losses (TDL)40. The weighted average emission factor describes the average CO2
emitted per unit of electricity generated in the grid. This factor is in general significantly lower than
the Combined Margin (CM) used frequently for CDM projects, due to the fact that the CM is based on
the average of the Operating Margin (OM) and the Build Margin (BM) whereby the Operating Margin
does not include so-called “low-cost must-run” power plants which are basically hydropower and
nuclear power plants. In other words the OM reflects the weighted average emissions rate of the
thermal power plants. As example in India for 2011-2012 the weighted average emission factor of
the grid was 0.78 kgCO2/kWh, whilst the Operating Margin was 0.97, the Build Margin 0.90 and the
Combined Margin 0.93 for the same period i.e. the CM was around 20% above the weighted
average41. TDL is on average 5-10% in most grids, higher values reflecting basically a problem of theft.
As CM data is fairly widely published it is used as a first approximation per country for upstream GHG
emissions associated with the usage of electricity. However the weighted average emission factor is
significantly lower than the CM in the case of countries relying basically on renewables i.e. actual
GHG emissions of electric buses in such countries should be based on the weighted factor and not on
the CM. The CM used for Zhengzhou is 0.72 kgCO2/kWh42. The following figure compares the GHG
Well-to-Wheel (WTW) emissions of standard 12m buses in Zhengzhou for the year 2013.
39 Minimum 1,000 charging cycles with 90% and 3,000 cycles with 80% of capacity. 40
This is the approached used by the CDM for consumers of electricity see e.g. approved CDM methodology ACM0016 for Mass rapid Transit systems 41 GOI, Ministry of Power, Central Electricity Authority, CO2 Baseline Database for the Indian Power Sector, Version 8.0, 2013 42 NDRC China for Central China Power Grid, 2013

Hybrid and Electric Buses
Grütter Consulting page 33
Figure 14: GHG WTW Emissions 12m Buses Zhengzhou Year 2013 (gCO2/km)
Source: Grütter Consulting
GHG well-to-tank emission reductions for electric buses in Zhengzhou are between 0% and 25%
compared to hybrid units, and between 30% and 45% compared to conventional fossil units. This
reduction is achieved although electricity generation relies heavily on coal.
Local emissions of electric buses are 0. They therefore have significant advantages compared to fossil
units in terms of particle matter, NOx emissions as well as other local pollutants and also significant
advantages concerning noise levels. However plug-in hybrids also have the possibility, albeit within a
reduced range, of running as 0-emission vehicles.
The electric buses currently used in Zhengzhou cover basically shorter routes and are also used
basically in peak hours and not as frequently as conventional buses. This is reflected in their average
annual mileage which is 4,500 km/month for diesel, 4,000 km/month for CNG and only 2,000
km/month for electric buses. With the new electric buses available the mileage of electric buses is
expected to increase. Based on the current annual mileage of electric buses in Zhengzhou and the
usage of 110 units these have resulted in emission reductions of around 1,000 tCO2 (around 10 tCO2
per bus43), 10 t of NOx and 0.1 t PM44.
5.2.2. Environmental Performance of Electric Buses in Shenzhen
Data is used from the Shenzhen Bus Group which operates around 500 of the currently 1,300 electric
buses in the city, all of which have AC. Electricity consumption of buses is around 1.2 kWh/km.
Compared with the average diesel fuel consumption of 40 l/100km for 12m comparable buses and
the Southern China power grid which has a CM of 0.66 kgCO2/kWh this results in GHG emissions of
around 790 gCO2/km i.e. around 10% more than in the case of Zhengzhou due to the higher
electricity consumption of the buses used in Shenzhen. Compared to the WTW emissions of diesel
unit this still results in emission reductions of around 40%. However taking into account the reduced
43 Compared with a conventional fleet of 50% diesel and 50% CNG units; based on WTW; the relatively low reduction per bus is due to the low mileage of electric buses 44 Compared with Euro V units
720 724
852
969 1,048
1,311
electric CNG plug-inhybrid
CNG hybrid Diesel hybrid CNGconventional
Dieselconventional
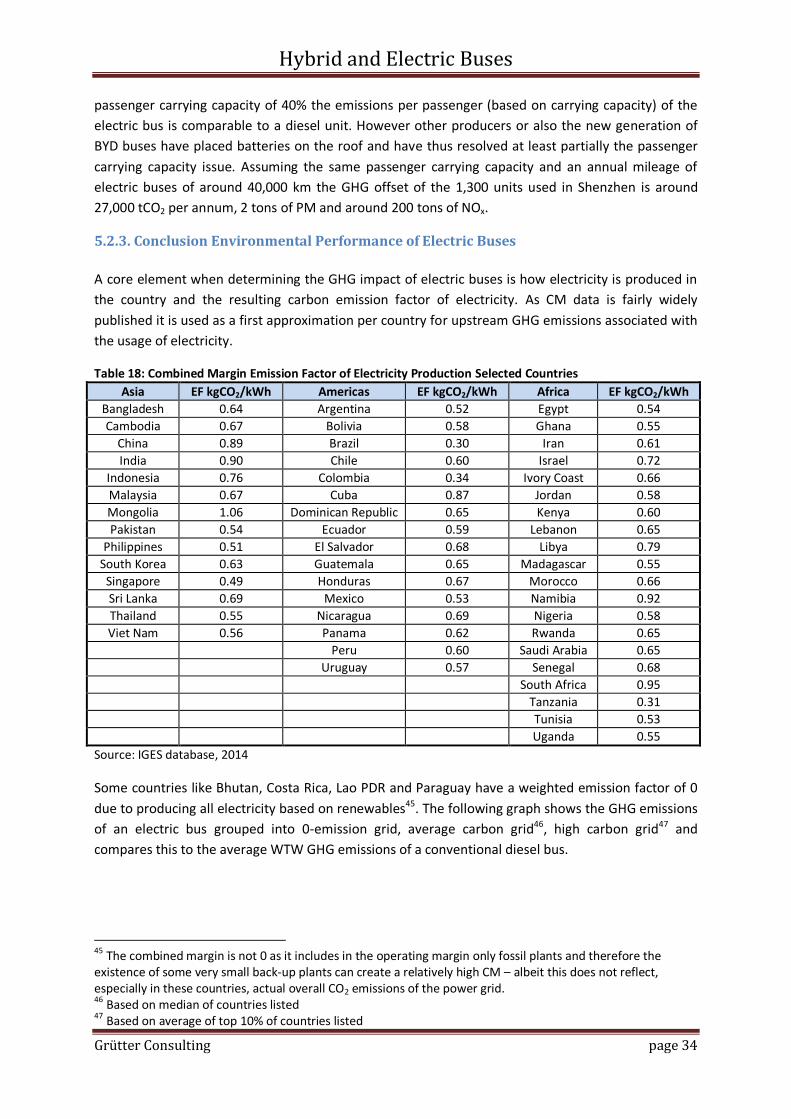
Hybrid and Electric Buses
Grütter Consulting page 34
passenger carrying capacity of 40% the emissions per passenger (based on carrying capacity) of the
electric bus is comparable to a diesel unit. However other producers or also the new generation of
BYD buses have placed batteries on the roof and have thus resolved at least partially the passenger
carrying capacity issue. Assuming the same passenger carrying capacity and an annual mileage of
electric buses of around 40,000 km the GHG offset of the 1,300 units used in Shenzhen is around
27,000 tCO2 per annum, 2 tons of PM and around 200 tons of NOx.
5.2.3. Conclusion Environmental Performance of Electric Buses
A core element when determining the GHG impact of electric buses is how electricity is produced in
the country and the resulting carbon emission factor of electricity. As CM data is fairly widely
published it is used as a first approximation per country for upstream GHG emissions associated with
the usage of electricity.
Table 18: Combined Margin Emission Factor of Electricity Production Selected Countries
Asia EF kgCO2/kWh Americas EF kgCO2/kWh Africa EF kgCO2/kWh
Bangladesh 0.64 Argentina 0.52 Egypt 0.54
Cambodia 0.67 Bolivia 0.58 Ghana 0.55
China 0.89 Brazil 0.30 Iran 0.61
India 0.90 Chile 0.60 Israel 0.72
Indonesia 0.76 Colombia 0.34 Ivory Coast 0.66
Malaysia 0.67 Cuba 0.87 Jordan 0.58
Mongolia 1.06 Dominican Republic 0.65 Kenya 0.60
Pakistan 0.54 Ecuador 0.59 Lebanon 0.65
Philippines 0.51 El Salvador 0.68 Libya 0.79
South Korea 0.63 Guatemala 0.65 Madagascar 0.55
Singapore 0.49 Honduras 0.67 Morocco 0.66
Sri Lanka 0.69 Mexico 0.53 Namibia 0.92
Thailand 0.55 Nicaragua 0.69 Nigeria 0.58
Viet Nam 0.56 Panama 0.62 Rwanda 0.65
Peru 0.60 Saudi Arabia 0.65
Uruguay 0.57 Senegal 0.68
South Africa 0.95
Tanzania 0.31
Tunisia 0.53
Uganda 0.55
Source: IGES database, 2014
Some countries like Bhutan, Costa Rica, Lao PDR and Paraguay have a weighted emission factor of 0
due to producing all electricity based on renewables45. The following graph shows the GHG emissions
of an electric bus grouped into 0-emission grid, average carbon grid46, high carbon grid47 and
compares this to the average WTW GHG emissions of a conventional diesel bus.
45
The combined margin is not 0 as it includes in the operating margin only fossil plants and therefore the existence of some very small back-up plants can create a relatively high CM – albeit this does not reflect, especially in these countries, actual overall CO2 emissions of the power grid. 46 Based on median of countries listed 47 Based on average of top 10% of countries listed

Hybrid and Electric Buses
Grütter Consulting page 35
Figure 15: GHG WTW Emissions 12m Electric versus Diesel Bus (gCO2/km)
GHG emission reductions are highly dependent on the electricity source of the country. Average
emission reductions of 50% and more can however be expected against conventional diesel buses. It
is noteworthy that even with a grid based primarily on coal power electric buses are still distinctively
better than diesel units.
An important aspect to consider is the actual carrying capacity of electric buses. Some bus producers
use significant interior space for batteries thus reducing the passenger carrying capacity significantly.
This in effect means that a 12m electric bus must be compared with a smaller conventional bus with
the same passenger capacity. However the trend of producers has been to put batteries basically on
the roof and thus maintain a comparable passenger carrying capacity for electric versus conventional
fuel buses of the same size.
5.3. Economic Performance of Electric Buses
5.3.1. Introduction
The same cost components are used to compare the financial performance of electric versus
conventional units as for hybrid buses.
5.3.2. Bus Availability
Zhengzhou as well as Shenzhen show a significantly lower availability rate of electric versus
conventional fuel buses. On average electric buses are only 70% as much available as diesel units.
Reasons are more breakdowns of the bus and longer standstill time for maintenance and repair due
to lack of spare parts. Electric buses are still an “exotic” product resulting in more technical
difficulties, less trained maintenance staff and not readily available spare parts due also to the
limited amount of units. As a result operators currently require for each diesel bus 1.4 electric buses
to ensure the same level of operations.
0
630
930
1,311
o-emission grid average grid high carbon grid diesel bus
- 100% - 52% - 29%
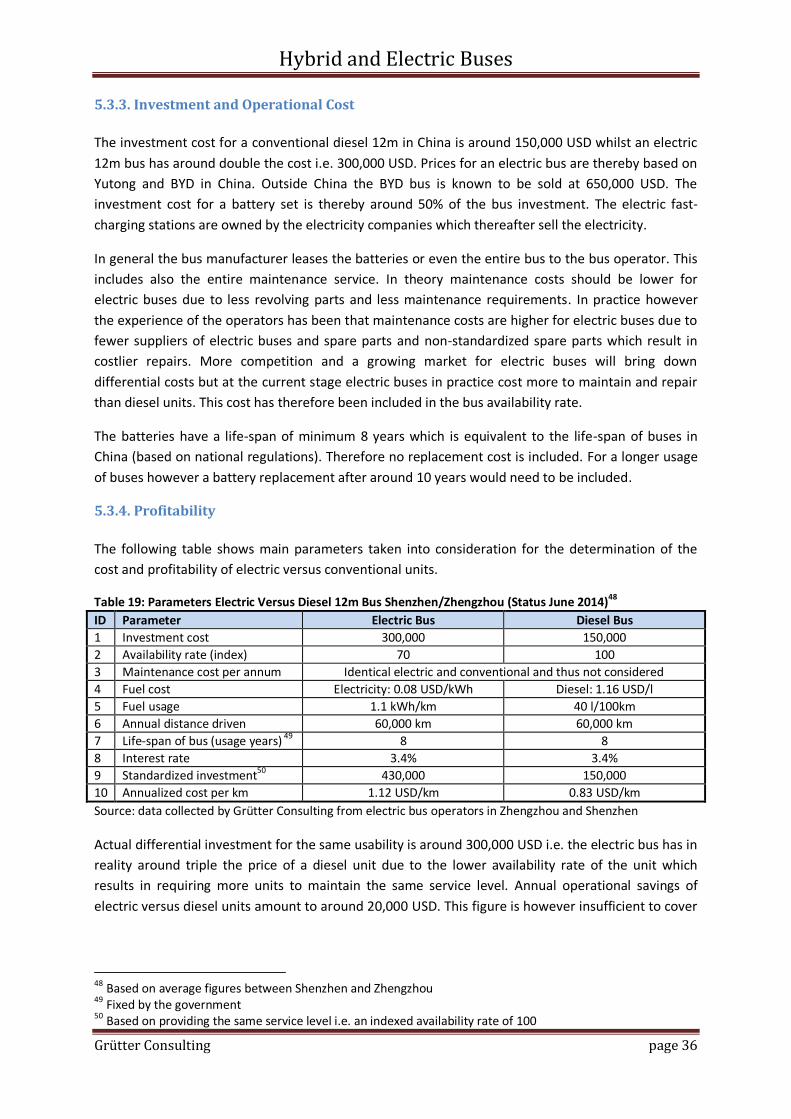
Hybrid and Electric Buses
Grütter Consulting page 36
5.3.3. Investment and Operational Cost
The investment cost for a conventional diesel 12m in China is around 150,000 USD whilst an electric
12m bus has around double the cost i.e. 300,000 USD. Prices for an electric bus are thereby based on
Yutong and BYD in China. Outside China the BYD bus is known to be sold at 650,000 USD. The
investment cost for a battery set is thereby around 50% of the bus investment. The electric fast-
charging stations are owned by the electricity companies which thereafter sell the electricity.
In general the bus manufacturer leases the batteries or even the entire bus to the bus operator. This
includes also the entire maintenance service. In theory maintenance costs should be lower for
electric buses due to less revolving parts and less maintenance requirements. In practice however
the experience of the operators has been that maintenance costs are higher for electric buses due to
fewer suppliers of electric buses and spare parts and non-standardized spare parts which result in
costlier repairs. More competition and a growing market for electric buses will bring down
differential costs but at the current stage electric buses in practice cost more to maintain and repair
than diesel units. This cost has therefore been included in the bus availability rate.
The batteries have a life-span of minimum 8 years which is equivalent to the life-span of buses in
China (based on national regulations). Therefore no replacement cost is included. For a longer usage
of buses however a battery replacement after around 10 years would need to be included.
5.3.4. Profitability
The following table shows main parameters taken into consideration for the determination of the
cost and profitability of electric versus conventional units.
Table 19: Parameters Electric Versus Diesel 12m Bus Shenzhen/Zhengzhou (Status June 2014)48
ID Parameter Electric Bus Diesel Bus
1 Investment cost 300,000 150,000
2 Availability rate (index) 70 100
3 Maintenance cost per annum Identical electric and conventional and thus not considered
4 Fuel cost Electricity: 0.08 USD/kWh Diesel: 1.16 USD/l
5 Fuel usage 1.1 kWh/km 40 l/100km
6 Annual distance driven 60,000 km 60,000 km
7 Life-span of bus (usage years) 49 8 8
8 Interest rate 3.4% 3.4%
9 Standardized investment50 430,000 150,000
10 Annualized cost per km 1.12 USD/km 0.83 USD/km
Source: data collected by Grütter Consulting from electric bus operators in Zhengzhou and Shenzhen
Actual differential investment for the same usability is around 300,000 USD i.e. the electric bus has in
reality around triple the price of a diesel unit due to the lower availability rate of the unit which
results in requiring more units to maintain the same service level. Annual operational savings of
electric versus diesel units amount to around 20,000 USD. This figure is however insufficient to cover
48 Based on average figures between Shenzhen and Zhengzhou 49 Fixed by the government 50 Based on providing the same service level i.e. an indexed availability rate of 100
Hybrid and Electric Buses
Grütter Consulting page 37
the differential investment for the electric bus. Annualized costs51 per km including investment cost
and fuel cost but excluding cost components which are identical between the two vehicles like driver
cost are around 35% higher for the electric bus compared to a conventional diesel Euro V unit.
5.4. Conclusions Electric Buses The main advantage of electric buses is there 0-emission of local pollutants in cities. Upstream air
pollution will occur if electricity is produced by fossil means – however power plants can control such
emissions more effectively than small engines and also pollution of power plants occurs in less
critical pollution zones than where buses operate. The advantage of 0-GHG emissions is only
available in countries with a non-fossil grid. In most countries electric buses will reduce GHG
emissions – however also modern hybrid buses, especially plug-ins, come in the range of electric
buses concerning GHG emissions, especially in average and higher carbon grids.
Concerning finance electric buses require a significant surplus investment. Buses cost around double
of conventional units and clearly have a lower availability rate due to more breakdowns and more
time required for servicing and repairs. This is typical of new technologies and was also observed
with first generations of CNG buses. Due to the battery load – directly related to the vehicle range –
the vehicle weight increases considerably, which - depending on the manufacturer solution chosen -
can result in a significantly reduced passenger capacity (either due to weight allowance restrictions
or due to space being taken up by batteries thus reducing space for passengers). Reduced availability
of buses and reduced passenger capacity result in equivalent investment costs being not only double
but triple of a conventional diesel bus, if the same level of service is compared. Annual operational
costs due to fuel cost savings will be lower for electric buses than for diesel units. How much lower
depends on the relative diesel versus electricity costs per country and the annual distance driven.
However electric buses, due to range limitations, will be used more on shorter downtown routes and
thus will in general have a below-average annual mileage. The annualized investment and fuel cost
per km of an electric bus is therefore around 30-40% higher than that of a conventional diesel bus.
6. Climate Finance Opportunities Hybrid and electric buses receive currently in various countries additional finance either climate
related (e.g. UK, Switzerland52), driven by environmental considerations (e.g. Bogota) or in relation to
industrial policies (e.g. China). In the international scenario the CDM (Clean Development
Mechanism) used to be a good instrument to attract climate finance with payment being made per
tCO2 reduced. 4 electric vehicle projects, albeit not for buses, have been registered under this
mechanism in India. However the drastic fall of prices has made this market since 2013 unattractive.
New market mechanisms like NAMAs (Nationally Appropriate Mitigation Actions) are posed to be
more promising and already various NAMA proposals have been made for electric vehicles and
recently also for hybrid ones. However the instrument is still new and no proposal has yet succeeded
in ensuring finance. The following table gives an overview of some interesting climate finance
available potentially for hybrid and electric buses.
51 Annualized costs include the cost of capital and, based on the interest rate, calculate the annual discounted investment value together with the annual operational costs 52 A program was registered by Myclimate and Grütter Consulting where payment is made per tCO2 reduced for each hybrid and electric bus within the domestic emission reduction program.

Hybrid and Electric Buses
Grütter Consulting page 38
Table 20: Climate Finance Opportunities
ID Name Description Link
1 NAMA facility An initial €120 million of funding to support developing countries for implementing NAMAs. In the 1st round 2 transport NAMAs received approval (TOD Colombia and sustainable urban transport in Indonesia)
http://www.nama-facility.org/news.html
2 Regional development banks e.g. IDB, ADB, AFD, CAF
Example: Within Latin America IDB is supporting the formulation of various transport NAMAs and is also involved directly in the promotion of alternate technology buses in Bogota as well as in Quito
www.iadb.org
3 Clean Technology Fund
The CTF through IDB financed for example hybrid and electric buses in Bogota
https://www.climateinvestmentfunds.org/cif/node/2
4 Global Environment Facility
The GEF has specifically identified hybrid and electric buses in its program for sustainable transport; It has approved e.g. in Philippines a program which includes investment for a limited number of electric/hybrid buses
http://www.thegef.org/gef/home
5 General links to climate finance opportunities: http://www.climatefinanceoptions.org/cfo/cfo_search/type%3Afunding_sources%20category%3A219 http://www3.unfccc.int/pls/apex/f?p=116:1:2895636133177913
7. Conclusions The real-world performance of operators with large fleets of hybrids show clearly that fuel savings of
25-35% with conventional hybrids and 40% or more with plug-in hybrids can be expected. The
reliability of hybrids is comparable to conventional fossil fuel buses and also maintenance costs, with
exception of battery costs, are comparable. The differential investment, depending on make and
model, can however be significant. Under normal annual operating conditions and fuel prices of USD
1.20 or more per litre, hybrids can be profitable recovering the initial differential investment within
5-6 years. Carbon finance can play an important role in reducing the differential investment cost of
hybrids and thus making latter more popular.
Electric battery buses are still less well established. Various options are being tried to resolve the
problem of range, battery weight and battery cost such as buses carrying along large battery racks
(e.g. BYD), buses with fast-change battery racks (e.g. Yutong) or opportunity charge bus systems like
TOSA. Such systems have a good potential of replacing electric trolley buses. Currently reliability of
electric buses is still significantly below conventional diesel units therefore leading to additional
investment costs (more buses are required to fulfil the same peak service level). Also maintenance
costs, which theoretically should be lower compared to diesel units, is in practice higher due to less
availability of spare parts, spare parts art higher costs and more stand-still time with repairs. These
problems are typical of new technologies. Energy usage of electric buses is low and fuel savings can
be significant. However battery costs are still very high and life-span of batteries is limited thus
resulting in significant additional costs of electric buses which cannot be recovered currently with
energy savings. Therefore electric buses, even with carbon finance, are not yet financially considered
as viable compared to conventional units. However electric buses compared to conventional
trolleybuses can be an interesting option. At the same time it is previewed that the cost of electric
buses will come down and that battery capacity will increase whilst costs decrease. With larger fleets
reliability should also improve and maintenance costs should decrease.
Hybrid and Electric Buses
Grütter Consulting page 39
Literature
C40-CCI, Low carbon technologies can transform Latin America’s bus fleets, 2013
Cambridge econometrics and Ricardo-AEA, an Economic Assessment of Low Carbon Vehicles, 2013
Embarq, Exhaust Emissions of Transit Buses, 2012
Frost & Sullivan, Strategic Analysis of Global Hybrids and Electric Heavy-Duty Transit Bus market,
2013
Fuel Cells and Hydrogen JU, urban buses: alternative powertrains for Europe, 2012
ICCT, Global Transportation Energy and Climate Roadmap, 2012
Landshut University of Applied Sciences, Report on Electrified Public Transprot Bus Systems, EU
project Ref. D.4.3.6, 2012
PE International, Abschlussbericht Plattform Innovative Antriebe Bus, gefördert durch BMVBS, 2011
Ricardo plc, Air Quality Emissions of Low CO2 Technology for Buses, 2013