HWC remains an integral component of pine plantation establishment in the South Any new product...
29
-
Upload
myron-webster -
Category
Documents
-
view
214 -
download
0
Transcript of HWC remains an integral component of pine plantation establishment in the South Any new product...


• HWC remains an integral component of pine plantation establishment in the South
• Any new product requires extensive testing to ensure efficacy, crop tolerance, and/or crop growth response

• To compare the product now known as Sulfometuron Max to either Oust or Oust XP in operational field settings

• MS– Plum Creek Timber
– Oktibbeha Co.
– Falkner silt loam, pH = 4.8
– Previous stand = natural pine-hardwood
– Harvested 2001, chemical site prep 2001
– Planted January 2002
• TX– Nacogdoches Co.
– Deep moderately well drained sandy soil, pH = 5.0
– Previous stand - natural pine-hardwood
– Harvested 2001, chemical site prep 2001
– Sheared January, 2002
– Planted February 2002
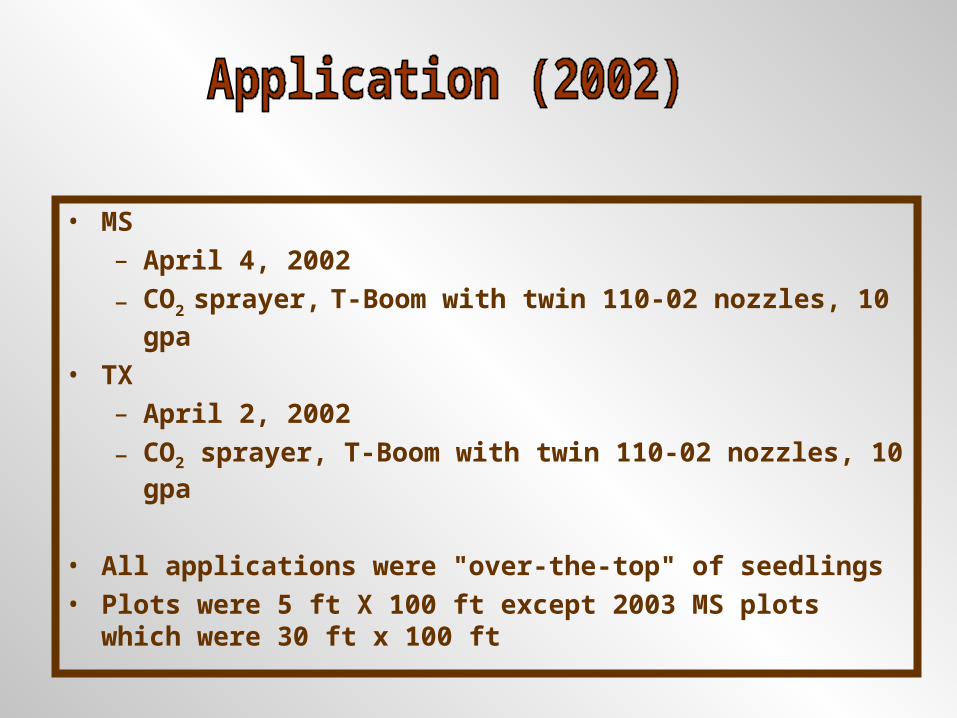
• MS– April 4, 2002
– CO2 sprayer, T-Boom with twin 110-02 nozzles, 10 gpa
• TX– April 2, 2002
– CO2 sprayer, T-Boom with twin 110-02 nozzles, 10 gpa
• All applications were "over-the-top" of seedlings• Plots were 5 ft X 100 ft except 2003 MS plots which were 30 ft x
100 ft

• MS– Plum Creek Timber
– Oktibbeha Co.
– Ruston fine sandy loam, pH =5.2
– Previous stand = natural pine-hardwood
– Harvested 2001, chemical site prep 2002
– Planted January 2003
• TX– Angelina Co.
– Shallow loam overlying clay loam, pH = 5.1
– Previous stand - pine plantation with hardwood component
– Harvested 2002, chemical site prep 2002
– Burned, plowed
– Planted November, 2002 (containerized)
– Replanted February, 2003 (bareroot)

• MS– April 13, 2003
– CO2, sprayer with pole extension and KLC-9 nozzle, 10 gpa
broadcast• TX
– April 17, 2003
– CO2 sprayer, T-Boom with 4, 110-1.5 nozzles, 10 gpa

Table 1. List of treatments in sulfometuron comparison study
Trmt. No. Product (Ounces/Acre)
______________________________________________________
1 Sulf. Max(2)
2 Oust/Oust XP(2)
3 Sulf. Max(8)
4 Oust/Oust XP(8)
5 Sulf. Max(2) + Velpar DF (10.67)
6 Oust/Oust XP (2) + Velpar DF (10.67)
7 Sulf. Max(2) + Arsenal AC(4)
8 Oust/Oust XP(2) + Arsenal AC(4)
9 Sulf. Max(2) + Arsenal AC(6)
10 Oust/Oust XP(2) + Arsenal AC(6)
11 Untreated Check

• 11 Treatments• 4 replications• RCB

• Ground cover by vegetation group at 30, 60, 90,120, and 150 DAT
• Crop tolerance at same timings
• Pine height and GLD - Initial &1 GSAT


• 2002 (MS & TX)– Panicium, Dicanthelium, Cyperus– No notable differences between comparison
treatments

Table 2. Average grass cover in 2002 Sulfometuron
comparison study
Days After TreatmentTrt. 30 60 90 120 150_____________________________________________________________________
Percent
Sm(2) 2/01 4/0 6/1 2/1 4/ -2
O(2) 1/0 2/2 7/2 4/3 4/ -
Sm(8) 1/0 1/1 6/0 4/1 5/ -O(8) 1/0 2/0 6/1 4/4 6/ -
Sm(2) + V(10.67) 1/0 2/0 6/0 6/1 7/ -O(2) + V(10.67) 1/0 3/0 7/0 9/1 9/ -
Sm(2) + A(4) 1/0 3/1 6/1 7/1 8/ -O(2) + A(4) 1/0 1/0 5/1 5/1 6/ -
Sm(2) + A(6) 1/0 1/0 8/0 6/1 7/ -O(2) +A(6) 1/0 1/1 8/0 3/1 6/ -
Check 10/10 18/14 34/18 21/20 20-
1 For all observations, MS/TX (avg. all reps)
2 No observations for TX at 150 DAT

• MS - horseweed, late boneset, common ragweed, horse nettle, blue vervain, Helianthus, goldenrod, dog fennel, and wooly croton
• TX - purple cudweed, American burnweed, wooly croton, tropic croton, three-seeded mercury, common ragweed
• No notable differences between comparison treatments

Table 3. Average broadleaf cover in 2002 sulfometuron comparison study
Days After TreatmentTrt. 30 60 90 120 150_____________________________________________________________________
Percent
Sm(2) 5/2 1 8/12 29/8 18/10 13/ - 2
O(2) 6/0 8/3 33/6 19/10 14/ -
Sm(8) 280 3/3 21/3 11/5 10/ -O(8) 3/0 582 23/3 15/5 11/ -
Sm(2) + V(10.67) 2/0 4/2 19/1 25/2 13/ -O(2) + V(10.67) 1/0 2/1 18/0 21/1 11/ -
Sm(2) + A(4) 3/0 5/3 11/4 10/5 11/ -O(2) + A(4) 1/1 1/10 13/7 11/12 11/ -
Sm(2) + A(6) 1/0 2/6 11/1 13/1 10/ -O(2) +A(6) 2/0 2/1 9/1 4/3 3/ -
Check 43/20 53/13 73/35 74/57 75/ -
1 For all observations, MS/TX (avg. all reps)
2 No TX observations

Field slides 1-9
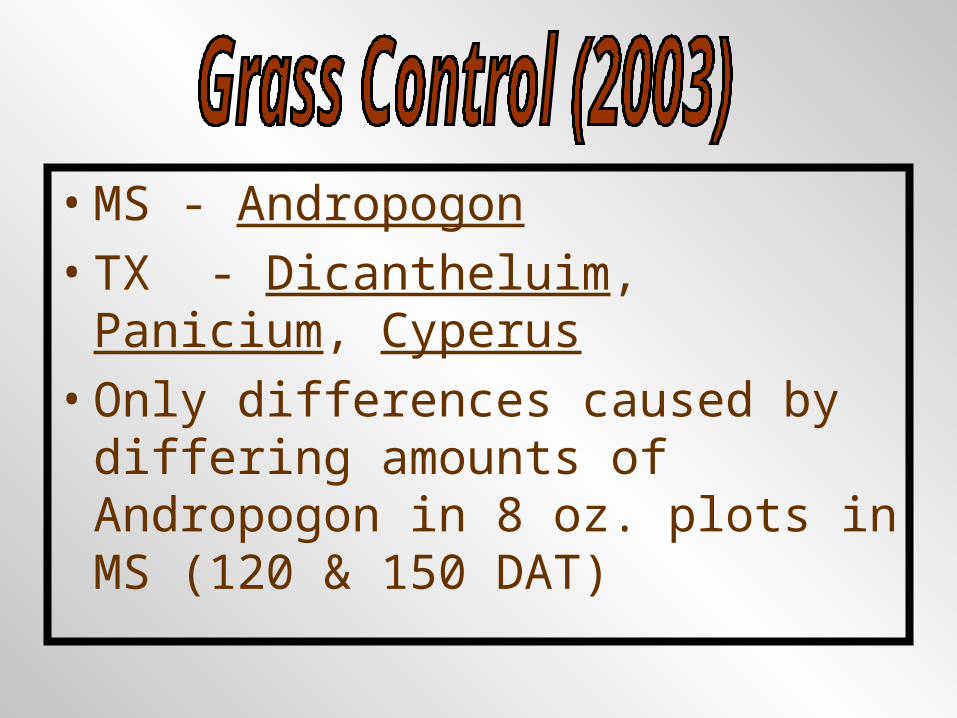
• MS - Andropogon
• TX - Dicantheluim, Panicium, Cyperus
• Only differences caused by differing amounts of Andropogon in 8 oz. plots in MS (120 & 150 DAT)
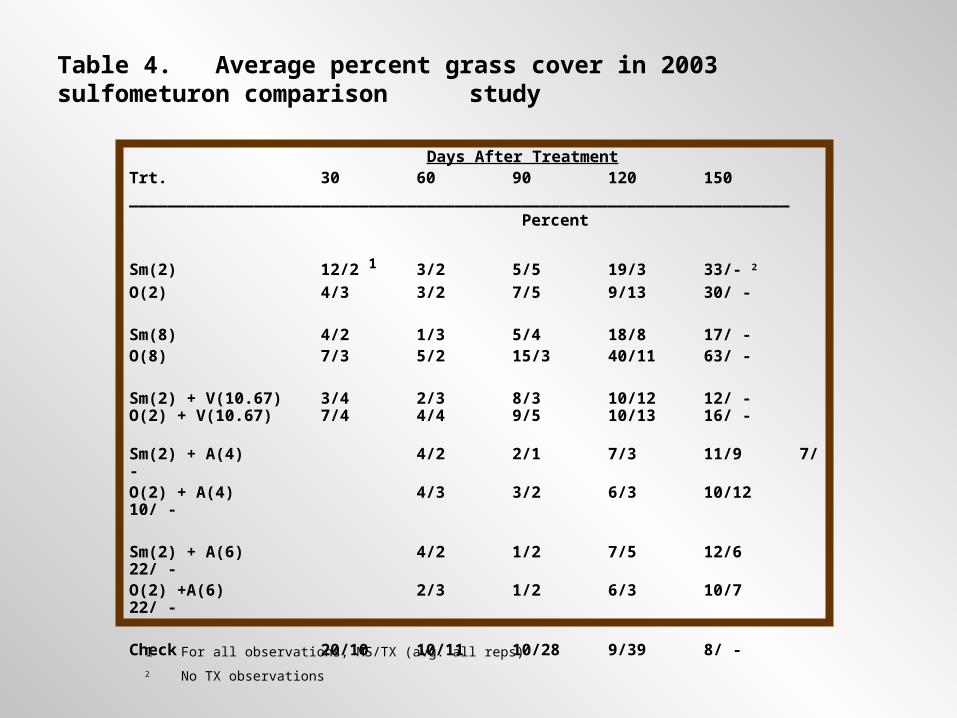
Table 4. Average percent grass cover in 2003 sulfometuron comparison study
Days After TreatmentTrt. 30 60 90 120 150_____________________________________________________________________
Percent
Sm(2) 12/2 1 3/2 5/5 19/3 33/- 2
O(2) 4/3 3/2 7/5 9/13 30/ -
Sm(8) 4/2 1/3 5/4 18/8 17/ -O(8) 7/3 5/2 15/3 40/11 63/ -
Sm(2) + V(10.67) 3/4 2/3 8/3 10/12 12/ - O(2) + V(10.67) 7/4 4/4 9/5 10/13 16/ -
Sm(2) + A(4) 4/2 2/1 7/3 11/9 7/ -O(2) + A(4) 4/3 3/2 6/3 10/12 10/ -
Sm(2) + A(6) 4/2 1/2 7/5 12/6 22/ -O(2) +A(6) 2/3 1/2 6/3 10/7 22/ -
Check 20/10 10/11 10/28 9/39 8/ -
1 For all observations, MS/TX (avg. all reps)
2 No TX observations

• MS - late boneset, horseweed, chickweed, Virginia buttonweed, common ragweed, Oxalis, lambsquarters, and wooly croton
• TX - purple cudweed, dog fennel, late boneset, horseweed
• No notable difference between comparison treatments

Table 5. Average percent broadleaf cover in 2003 sulfometuron comparison study
Days After TreatmentTrt. 30 60 90 120 150_____________________________________________________________________
Percent
Sm(2) 10/3 1 10/2 50/3 48/3 50/ - 2
O(2) 8/1 12/1 42/3 52/3 63/ -
Sm(8) 5/8 3/5 9/5 10/5 12/ -O(8) 5/1 7/3 12/3 6/3 9/ -
Sm(2) + V(10.67) 6/4 6/3 25/5 50/5 53/ -O(2) + V(10.67) 15/4 12/4 33/4 50/4 43/ -
Sm(2) + A(4) 7/6 5/3 18/4 37/4 43/ -O(2) + A(4) 7/3 10/2 27/2 50/2 63/ -
Sm(2) + A(6) 9/5 6/4 30/5 53/5 45/ -O(2) +A(6) 11/1 6/2 28/3 57/3 60/ -
Check 40/8 57/9 83/6 90/6 87/ -
1 For all observations, MS/TX (avg. all reps)
2 No TX observations

• Field slides 11-18

• No Problems in any treatments

• Survival - No consistent trends between comparison treatments. Some differences due to site drainage (MS) or planting (TX)

Table 6. Average pine survival IGSAT
2002 2003Trmt. MS TX MS TX Overall________________________________________________________________________
Percent
Sm(2) 63 85 80 88 79O(2) 72 90 80 90 83
Sm(8) 52 92 97 94 84O(8) 76 83 97 92 87
Sm(2) + V(10.67) 50 77 90 81 75O(2) + V(10.67) 79 88 83 75 81
Sm(2) + A(4) 70 92 93 94 87O(2) + A(4) 75 79 93 83 82
Sm(2) + A(6) 74 77 97 94 86O(2) +A(6) 65 85 87 92 82
Check 58 88 83 94 81
•No consistent trends between comparison treatments

Table 7. Average pine height IGSAT
2002 2003Trmt. MS TX MS TX Overall________________________________________________________________________
feet
Sm(2) 1.34 1.91 1.67 1.85 1.70O(2) 1.34 1.81 1.51 1.95 1.65
Sm(8) 1.31 1.73 1.80 1.91 1.69O(8) 1.43 1.99 1.74 1.82 1.75
Sm(2) + V(10.67) 1.31 1.51 1.71 2.20 1.68O(2) + V(10.67) 1.26 1.41 1.56 2.04 1.57
Sm(2) + A(4) 1.41 2.13 1.77 2.27 1.90O(2) + A(4) 1.47 1.71 1.78 2.21 1.79
Sm(2) + A(6) 1.35 1.76 1.79 1.82 1.68O(2) +A(6) 1.42 1.76 1.59 1.92 1.67
Check 1.24 1.61 1.52 2.00 1.59

• All treatments enhanced growth• No trends between comparison
treatments

Table 8. Average pine GLD IGSAT
2002 2003Trmt. MS TX MS TX Overall________________________________________________________________________
feet
Sm(2) 0.34 0.47 0.38 0.57 0.45O(2) 0.35 0.44 .034 0.59 0.43
Sm(8) 0.35 0.48 0.49 0.60 0.48O(8) 0.41 0.48 0.49 0.58 0.49
Sm(2) + V(10.67) 0.32 0.39 0.43 0.68 0.46O(2) + V(10.67) 0.34 0.36 0.38 0.66 0.44
Sm(2) + A(4) 0.37 0.48 0.42 0.73 0.50O(2) + A(4) 0.37 0.43 0.43 0.72 0.49
Sm(2) + A(6) 0.32 0.58 0.47 0.60 0.50O(2) +A(6) 0.40 0.42 0.40 0.58 0.45
Check 0.24 0.36 0.31 0.58 0.37

• Both products performed equally well in competition control, crop tolerance, and pine growth
• Either product should work well in operational applications