HVAC EQUIPMENT DEMOGRAPHICS AND CAPACITY ANALYSIS …€¦ · · 2016-10-21HVAC EQUIPMENT...
19
PROJECT REPORT HVAC EQUIPMENT DEMOGRAPHICS AND CAPACITY ANALYSIS TOOLS APPLICABLE TO MULTI-TENANT LIGHT COMMERCIAL BUILDINGS Western Cooling Efficiency Center-UC Davis December 28, 2012 (Revised November 5th, 2013) WESTERN COOLING EFFICIENCY CENTER
-
Upload
doankhuong -
Category
Documents
-
view
214 -
download
1
Transcript of HVAC EQUIPMENT DEMOGRAPHICS AND CAPACITY ANALYSIS …€¦ · · 2016-10-21HVAC EQUIPMENT...

PROJECT REPORT
HVAC EQUIPMENT DEMOGRAPHICS AND CAPACITY ANALYSIS TOOLS APPLICABLE TO MULTI-TENANT
LIGHT COMMERCIAL BUILDINGS
Western Cooling Efficiency Center-UC Davis
December 28, 2012 (Revised November 5th, 2013)
WESTERN COOLING EFFICIENCY CENTER

MULTI-TENANT LIGHT COMMERCIAL 2 PROJECT REPORT
PREPARED FOR:California Energy Commssion
PREPARED BY:John Markley
Associate Engineer
530.752.3008
Marco Pritoni
Graduate Student Researcher
Paul Fortunato
Outreach Coordinator
Western Cooling Efficiency Center
University of California, Davis
215 Sage Street #100
Davis, CA 95616
wcec.ucdavis.edu
ABOUT THE WESTERN COOLING EFFICIENCY CENTERThe Western Cooling Efficiency Center was established along side the UC Davis Energy Efficiency Center in 2007 through a grant from the California Clean
Energy Fund and in partnership with California Energy Commission Public Interest Energy Research Program. The Center partners with industry stakeholders
to advance cooling-technology innovation by applying technologies and programs that reduce energy, water consumption and peak electricity demand
associated with cooling in the Western United States.

MULTI-TENANT LIGHT COMMERCIAL 3 PROJECT REPORT
Section Title Page
1.0 Executive Summary 4
2.0 Overview 5
3.0 MTLC RTU Demographics 6
4.0 Light Commercial HVAC Design Process 12
5.0 Conclusion 18
6.0 References 19
TABLE OF CONTENTSSECTIONS

MULTI-TENANT LIGHT COMMERCIAL 4 PROJECT REPORT
1. EXECUTIVE SUMMARY
The UC Davis Multi-Tenant Light Commercial project intends to
establish a building level retrofit package that will substantially
improve energy performance by collectively improving the enve-
lope, lighting and HVAC systems. The primary goals of the UC
Davis Multi-Tenant Light Commercial project are to increase the
overall energy efficiency and permanently reduce the peak en-
ergy consumption of MTLC buildings. Simultaneously, the Multi-
Tenant Light Commercial project aims to make these packages
more economically feasible by leveraging the economy of scale
through maximizing purchase potential, and by minimizing the
cost through reducing the required contractor visits necessary to
perform the work.
One of the key preliminary proposals of this project was to perma-
nently reduce the connected capacity, with respect to the HVAC
system, by disconnecting compressors within RTUs that contain
multiple compressors. We reviewed existing literature and col-
lected primary data by conducting field surveys in order to estab-
lish how multiple compressor RTUs are typically administered and
to characterize the HVAC systems typically encountered in MTLC
buildings.
Packaged cooling equipment serves nearly 70% of the light
commercial building floor space in CA, making packaged HVAC
systems (or RTUs) ubiquitous in Multi-Tenant Light Commercial
buildings. The total cooling-related energy consumption associ-
ated with all the packaged Roof-Top Units in California is approxi-
mately 22.6 billion kWh per year1 and growing. Therefore, even a
small improvement in the efficiency of these systems will lead to
significant reductions in energy use and peak energy consump-
tion, particularly in Multi-Tenant Light Commercial buildings.
We collected primary data on 102 package units serving several
MTLC buildings in northern California. The RTUs with a capacity
of 5 tons or smaller account for 71% of this sample, and RTUs with
a capacity of 10 tons or smaller account for 95% of the sample.
Similarly, RTUs with a capacity of 5 tons or smaller account for
54% of the total surveyed capacity, and RTUs with a capacity of
10 tons or smaller account for 85% of the total surveyed capacity.
This data correlates well with several other studies conducted in
the western United States that were not focused specifically on
MTLC, but rather a more general commercial market.
The primary field data we collected also found that the average
age of the 102 RTUs surveyed was 10.2 years. Even though there
are requirements for minimum HVAC equipment efficiency, these
pieces of equipment were specified under less restrictive stan-
dards and have undoubtedly become less efficient with age. Fur-
thermore, based on the estimated expected life of a typical RTU,
it is unlikely that these units will be replaced in the next 5 years.
Further complicating the concept that the HVAC equipment will
be larger than necessary after the proposed efficiency measures
are implemented is the fact that the equipment is over-sized to
begin with. Aside from the obvious permanent peak reduction
benefits of downsizing, reducing oversized units may also in-
crease their efficiency as well as contribute to improved comfort.
Unfortunately, a commercially available tool for assessing the ex-
tent to which the capacity of a unit may be reduced in this context
has not been found. Fortunately, a methodology exists for such
an assessment; however, it is limited to specific conditions that are
relatively infrequent. Therefore, improving the applicability of the
existing methods by expanding the scope of useful conditions is
necessary.
Based on the primary data we collected, and the data available in
existing literature, the majority of the RTUs serving MTLC spaces
are relatively small in capacity and thus do not contain multiple
compressors. In addition it does not appear that replacement is
a viable option because these units have significant useful life re-
maining. Consequently, if the goal of permanent peak reduction is
to be achieved, a new approach for assessing the extent of over-
sizing and subsequently downsizing existing HVAC systems must
be developed. One such approach may be to reduce the size of
specific components of the RTU, such as compressors and evapo-
rator fans, but this concept must be investigated and developed
further.
1Based on CEUS 2006 data, assuming an EER of 10 and a 20% cooling load factor

MULTI-TENANT LIGHT COMMERCIAL 5 PROJECT REPORT
2. OVERVIEW
Roof Top Units (RTUs) serve 70% of commercial floor area in
CA, making them one of the most commonly encountered HVAC
systems in Multi-Tenant Light Commercial (MTLC) buildings. Ex-
isting literature and field research (Section 3) reveal that these
packaged systems are ubiquitous because they offer several
practical advantages: low initial cost, integration of heating and
cooling in a single unit, reliability, availability of trained installers
and service technicians, a well established distribution network,
etc. Unfortunately, however, improving the energy efficiency of
RTUs has not been heavily pursued because improvements to ef-
ficiency typically oppose the advantages listed above (i.e. higher
initial cost, increased complexity, increased maintenance etc.).
Constant volume RTUs comprise the vast majority of the RTUs in
MTLC buildings, and commercial space in general, and are par-
ticularly inefficient when over-sized because they are subjected
to part-load conditions during the vast majority of their oper-
ating time (Section 5.2). Indeed, when the cooling capacity of
the RTU is much higher than the actual thermal load required
to maintain an acceptable interior temperature, these constant
volume RTUs satisfy the thermal load by repeatedly cycling on
and off2. During each cycle the unit wastes energy during the
start-up period when the compressor and the heat exchangers
are not operating under steady state conditions. Further energy
is wasted by not extracting the full extent of the energy stored in
the refrigerant upon shut down.
An over sized cooling system has the added deficiency of poor
humidity control that may result in undesired indoor conditions.
Quick temperature and humidity swings reduce occupant com-
fort and can potentially contribute to health problems such as
asthma and mold. An example of poor humidity control is expe-
rienced during off cycles when the ventilation air is pushed into
the building and the condensation on the evaporator coil tends
to re-evaporate. Conversely, unnecessary dehumidification can
be experienced when the temperature difference between sup-
ply and return is relatively small and the RTU is moving a large
portion of the available air within the building (i.e. more than
necessary) across the evaporator coil.
There are also several economic penalties to larger than neces-
sary HVAC equipment. One of the most often cited downfalls of
over-sized RTUs, aside from the energy penalty associated with
operating relatively inefficient equipment, is that the frequent
cycling increases wear and tear on the RTU components, thereby
reducing the lifetime of the equipment. Larger capacity equip-
ment also has a higher initial cost and also has increased residual
costs associated with corresponding increase in duct size and
electrical service.
Lastly, when larger capacity RTUs are installed in a wide area, the
aggregate demand can have a significant impact on utility peak.
A list of disadvantages associated with over-sizing, according to
ACCA, is presented in Table 1.
2On-off cycling is the most common control strategy to manage part-load. Other control strategies will be explored in section 5.2.1
Oversizing ImpactsComfort Equipment Economic Health
Marginal part load temperature control
Larger ducts installed Higher installed costsPotential to contribute to mold growth
Larger temperature differences between rooms
Increased electrical circuit sizing Increased operating expensesPotential to contribute to asthma and other respiratory conditions
Degraded humidity controlExcessive part-load operation, frequent cycling, shorter equip-ment life
Increased installed load on the public utility system
Drafts and noise Nuisance service calls
Occupant discomfort/dissatis-faction
Table 1: Over-sizing impacts according to ACCA (Glenn Hourahan, 2003)

MULTI-TENANT LIGHT COMMERCIAL 6 PROJECT REPORT
3. MTLC RTU DEMOGRAPHICS
In order to better understand the demographics of RTUs installed
on MTLC buildings in California, existing literature was reviewed
and primary data was collected to characterize HVAC equipment
found in MTLC buildings. HVAC literature (Felts & Bailey, 2000;
Glenn Hourahan, 2003; Mowris & Jones, 2008; Proctor, Katsnel-
son, & Wilson, 1995; Woodcock, 1998) shows that RTUs are rou-
tinely over-sized.
Literature ReviewDescribing the demographics of heating and cooling systems
(HVAC) used in Multi-Tenant Light Commercial (MTLC) buildings
in California is a difficult task. Energy surveys such as the Com-
mercial Building Energy Consumption Survey (CBECS) and the
California Commercial End-Use Survey (CEUS) do not provide re-
liable detailed data on HVAC systems. On the other hand, HVAC
field research often relies on very small sample size (250 or fewer
RTUs) and does not necessarily focus on MTLC buildings in Cali-
fornia. Therefore these studies might not be representative of the
building segment we are interested in. Moreover, the HVAC in-
dustry does not disclose details such as the type of unit shipped,
destination of unit, and does not keep track of units once they
are installed (NEEA & Energy and Environmental Analysis, 2005).
AHRI lists the studies with useful information about RTUs demo-
graphics that we considered. Detailed information from these re-
ports is included in the results section. Overall available data is
sparse and hard to compare. Two reports had field data from Cali-
fornia, but they were written more than 10 years ago (Felts & Bai-
ley, 2000; New Buildings Institute, 2003), while four other reports
described data from the Pacific North West where some Utilities
have active RTU programs and research projects. However, useful
information can be identified using the partial data available. This
data was supplemented by primary research that WCEC conduct-
ed during summer and fall 2012, summarized in the next section.
Study/Source Location Year # RTU # Buildings Reference
WCEC Davis, CA 2012 112 8 Primary Research
CBECS US 2003 N/A N/A(Energy Information Administration (EIA), 2003)
CEUS CA 2006 N/A N/A(California Energy Commission (CEC), 2006)
CEC CA 2001-02 215 75 (CEC, 2003)
PGE RTU/PAT North CA 1998 250 - (Felts & Bailey, 2000)
EWEB OR 2001 30 19 (NEEA 2002)
NEEA ID, MT, OR, WA 2002 140 72 (NEEA 2002)
PSE WA 2003-04 118 15 (NEEA 2002)
UC Davis Davis, CA 2010 84 25 (UC Davis & Cooper, 2010)
WCEC/DEG CA 2012 115 98(Western Cooling Efficiency Center & Davis Energy Group, 2012)
Table 2: Studies about RTU demographics surveyed

MULTI-TENANT LIGHT COMMERCIAL 7 PROJECT REPORT
Primary data collectionDuring summer and fall 2012 WCEC visited several MTLC sites and
gathered RTU data to supplement and confirm secondary data
sources.
A total of 102 RTUs covering several buildings in Davis, California
were surveyed during this period and the summary of the infor-
mation gathered is presented in Table 3.
WCEC monitored some of these units for a longer period, and also
downloaded and analyzed the smart meter data corresponding
to the buildings they serve. A detailed analysis of this data will
be included in a following report. The demographic information
of HVAC systems from primary and secondary sources is com-
piled below. Additional information from upcoming visits to MTLC
buildings throughout California are planned for 2013 and will be
added to this database.
ResultsHVAC SYSTEM TYPES IN MTLC BUILDINGS
The Commercial Buildings Energy Consumption Survey (CBECS)
reveals that 46% of all floor area in the US is cooled with unitary
packaged Air Conditioners (Energy Information Administration
(EIA), 2003). Another source, the Non-Residential New Construc-
tion (NRNC) Baseline Study in California, estimates in more than
47% the floor space area cooled by DX Single Package AC/Heat
Pumps (New Buildings Institute, 2003; RLW Analytics, 1999). The
latest CEUS official report (California Energy Commission (CEC),
2006) does not breakdown data by type of HVAC systems. How-
ever an earlier version of CEUS for PG&E territory illustrates pack-
aged (unitary and split systems) units as cooling approximately
2/3 of all commercial space (Hydeman, Stein, & Zhou, 2007 ;
PG&E, 1999).
It is worth noting that MTLC buildings represent only a small por-
tion of the population gathered by these surveys and MTLC build-
ings might differ significantly from average data. Further, inside
the MTLC space there might be differences depending on the
main activity, also known as “end use” of the tenant (i.e office,
grocery store, restaurant, retail, etc.). For instance, it is likely for
multi-tenant office parks to be cooled mostly by packaged sys-
tems, while a medium grocery store might have central/built-up
systems for refrigeration and air-cooling. Regardless of these vari-
ations, it is easy to see that rooftop units (RTU) are by far the most
common HVAC system in MTLC buildings.
Avg. RTU Size: 5.3 tons
Avg. Compressors per unit: 1.1
Avg. Sq ft. per ton: 273.4
Avg. age of RTU: 10.2
Table 3: Summary of some pertinent information gathered through primary research by WCEC
Other0.3%
No Cooling 19.4%
Single Pkg DX AC 43.9%
Single Pkg Heat Pump 3.5%
Split DX AC 5.9%
Split DX Heat Pump 0.9%
Water Loop Heat Pump 0.9%
Evaporative System 5.7%
Built-up System 17.4%
Figure 1: Cooling Systems type distribution by floorspace in commercial buildings in California (NRNC database)

MULTI-TENANT LIGHT COMMERCIAL 8 PROJECT REPORT
CAPACITY OF RTUS IN MTLC SPACES
The Non-Residential New Construction database
also provides the size frequency of packaged units
in all commercial buildings, as shown in Figure 1.
The most popular packaged DX capacity is 5-tons
and units between 1- and 10-tons represent about
90% of the stock constituting 58% of the entire
RTU capacity installed. (New Buildings Institute,
2003).
Of the units in the PGE CEUS database, 70% are be-
low 7.5-ton Single Zone VAV Systems (Hydeman,
et al., 2007 ; PG&E, 1999). Similar results are found
in the Pacific North West by Northwest Energy Ef-
ficiency Alliance (NEEA) (Reichmuth & Cherniack,
2012) as shown in Figure 4. 64 % of the buildings
have RTUs with average size less than 6 ton, while
79% of the buildings have RTUs with average size
less than 10-tons.
Also data from AIR CARE Plus program in 25 uni-
versity buildings in Davis, California show similar
tonnage distribution of package systems; Units
below or equal to 5-tons represent 80% of the
stock quantity and 54% of capacity installed while
units below or equal to 10-tons represent 97% in
number and 89% of capacity. The high frequency
of 2-ton units is due to the inclusion of split sys-
tems in the statistics (UC Davis & Cooper, 2010).
Data from a field survey of RTU efficiency and
operation patterns carried out by WCEC and Da-
vis Energy Group for Southern California Edison
shows units binned into “ton” bins with the most
frequent bin being 5-tons and a population mean
of 7.94 tons (Western Cooling Efficiency Center &
Davis Energy Group, 2012)
Sites visited during WCEC’s primary data collec-
tion had no central chiller, therefore 100% of the
buildings floor area was serviced by RTUs or split
systems. Excluding split systems, units 5-tons or
smaller account for 71% of the RTU stock, which
corresponds to 54% of the total surveyed capacity.
Further, in the WCEC’s sample, units from 1- to 10-
Unit size (ton)
HVAC Unit Size Distribution by Quantity
0%
5%
10%
15%
20%
25%
30%
Estim
ated
NR
NC
Uni
tary
Sys
tem
M
arke
t Sha
re
0%
2%
4%
6%
8%
10%
12%
14%
16%
18%
20%
Estim
ated
NR
NC
Uni
tary
Sys
tem
M
arke
t Sha
re
Unit size (ton)
HVAC Unit Size Distribution by Capacity
Figure 2: Package HVAC Capacity Distribution by Unit Size (New Buildings Institute, 2003)
Unit size (ton)
HVAC Unit Size Distribution by Quantity
0%
5%
10%
15%
20%
25%
30%
Estim
ated
NR
NC
Uni
tary
Sys
tem
M
arke
t Sha
re
0%
2%
4%
6%
8%
10%
12%
14%
16%
18%
20%
Estim
ated
NR
NC
Uni
tary
Sys
tem
M
arke
t Sha
re
Unit size (ton)
HVAC Unit Size Distribution by Capacity
Figure 3: Package HVAC Capacity Distribution by Installed capacity (New Buildings Institute, 2003)
18%
14%
10%
6%
2%0%
Building Average Tons per Unit
Perc
ent o
f Bui
ldin
gs
Figure 4: CBSA data: building average cooling tons per package HVAC unit (systems below 50 tons). N=1041. (Reichmuth & Cherniack, 2012)
0%
10%
20%
30%
40%
50%
60%
70%
80%
90%
100%
0%
5%
10%
15%
20%
25%
30%
1.5 2.5 3 3.5 4 5 6 6.5 7.5 10 12.5 15 20
Cum
ulat
ive
% o
f tot
al n
umbe
r of R
TUs
Num
ber o
f RTU
s (%
of t
otal
)
Unit Size (Tons)
RTU Capacity vs. Number of RTUs
0%
10%
20%
30%
40%
50%
60%
70%
80%
90%
100%
0%
5%
10%
15%
20%
25%
1.5 2.5 3 3.5 4 5 6 6.5 7.5 10 12.5 15 20
Cum
ulat
ive
% o
f cap
acity
Perc
enta
ge o
f Tot
al c
apac
ity
Unit Size (Tons)
RTU Capacity vs. Total Capacity
Figure 5: Rated Tonnage for RTUs in (Western Cooling Efficiency Center & Davis Energy Group, 2012)

MULTI-TENANT LIGHT COMMERCIAL 9 PROJECT REPORT
tons account for 95% of the RTU stock, which
corresponds to 85% of the total surveyed ca-
pacity (see Figure 6 and Figure 7, the blue lines
represent the cumulative % of units and capac-
ity respectively).
In addition to presenting size distribution, The
NEEA report also provides a breakdown by
building sizes as shown in Figure 8. The aver-
age size of the packaged units increases with
the size of the buildings, up to a certain limit,
after which the units are replaced with central
chillers and the RTU average size starts de-
creasing again (Reichmuth & Cherniack, 2012).
0%
10%
20%
30%
40%
50%
60%
70%
80%
90%
100%
0%
5%
10%
15%
20%
25%
30%
1.5 2.5 3 3.5 4 5 6 6.5 7.5 10 12.5 15 20
Cum
ulat
ive
% o
f tot
al n
umbe
r of R
TUs
Num
ber o
f RTU
s (%
of t
otal
) Unit Size (Tons)
RTU Capacity vs. Number of RTUs
0%
10%
20%
30%
40%
50%
60%
70%
80%
90%
100%
0%
5%
10%
15%
20%
25%
1.5 2.5 3 3.5 4 5 6 6.5 7.5 10 12.5 15 20
Cum
ulat
ive
% o
f cap
acity
Perc
enta
ge o
f Tot
al c
apac
ity
Unit Size (Tons)
RTU Capacity vs. Total Capacity
0%
10%
20%
30%
40%
50%
60%
70%
80%
90%
100%
0%
5%
10%
15%
20%
25%
30%
1.5 2.5 3 3.5 4 5 6 6.5 7.5 10 12.5 15 20
Cum
ulat
ive
% o
f tot
al n
umbe
r of R
TUs
Num
ber o
f RTU
s (%
of t
otal
)
Unit Size (Tons)
RTU Capacity vs. Number of RTUs
0%
10%
20%
30%
40%
50%
60%
70%
80%
90%
100%
0%
5%
10%
15%
20%
25%
1.5 2.5 3 3.5 4 5 6 6.5 7.5 10 12.5 15 20
Cum
ulat
ive
% o
f cap
acity
Perc
enta
ge o
f Tot
al c
apac
ity
Unit Size (Tons)
RTU Capacity vs. Total Capacity
Figure 6: RTU capacity distribution by size
Figure 7: RTU capacity distribution by capacity
Floor AreaAverage of RTU Count
Average TonsFaction of PNW Floor Area
Building CountF r a c t i o n with RTU
RTU Count
<5,000 1.9 4.7 10% 89877 70% 118,000
5,000-20,000 4.3 5.5 23% 57,593 61% 151,000
20,000-50,000 8.8 9.0 19% 15,616 54% 74,000
50,000-100,000 16.1 27.5 15% 5,816 35% 33,000
100,000-500,000 19.7 14.1 28% 4,946 30% 30,000
>500,000 5.5 5.2 4% 175 5% 100
TOTAL 8.9 7.0 100% 174,023 406,100
Figure 8: Average size of RTU by Building Floor Area (Reichmuth and Cherniack 2012)

MULTI-TENANT LIGHT COMMERCIAL 10 PROJECT REPORT
Similar behavior is shown by the CEC small HVAC field sur-
vey and represented in Figure 9 (Jacobs, 2003).
Based on site visits and interviews performed during pri-
mary data collection it was found that most of the tenant-
spaces in MTLC buildings are cooled independently (i.e.
tenants do not share equipment). It is expected that MTLC
buildings split between multiple tenants to be serviced
by a large number of small units, as if they were indepen-
dent smaller buildings. The reasons for this widespread
use of small units include flexibility, zoning requirements,
economics, available space, unique load profiles and con-
tractor suggestions (Glenn Hourahan, 2003; Woodcock,
1998). One property manager also provided experience
that RTUs are installed on tenant space only when it is
occupied for the first time. Therefore, because most ten-
ants sign their respective leases at different times, it is not
convenient to build a shared HVAC system for the whole
MTLC complex.
HVAC SYSTEM AGE
The data presented in the CBECS and CEUS reports does
not include any relevant age information related to HVAC
equipment. However, a NEEA study for the Pacific North
West region shows that more than 50% of the units are
at least 10 years old. The age and capacity distribution
of the NEAA study (NEEA & Energy and Environmental
Analysis, 2005) is shown in Figure 12. In addition, the field
data collected by the WCEC found that the average age
of RTUs was 10.2 years (102 units surveyed). Therefore,
based on the estimated expected life of a typical RTU of
(15-30 years) (NEEA & Energy and Environmental Analy-
sis, 2005) it is unlikely that these units, which are less ef-
ficient due to age and lower required standards when they
were specified, will be replaced in the next 5 years.
REFRIGERANT TYPE
Our primary research, which is currently the only source
available for refrigerant type data, illustrates that 96% of
the RTU’s surveyed contained R-22 refrigerant. The preva-
lence of R-22 was not unexpected as the requirements
corresponding to the age of the units had not yet begun
to preclude R-22. However, the fact that very few RTUs
contained 410A suggests that few, if any, units have been
replaced over the course of the past decade.
5,000-9,999
<5,000 10,000-29,999
30,000-49,999
50,000-74,999
75,000-99,999
100,000-199,999
200,000+
7
6
5
4
3
2
1
0
Floor Area (Sq. Ft.) Average # of RTUs
Figure 9: Average number of units vs Building Floor area (Jacobs 2003)
44%Under 5 tons 5-10 tons Over 10 tons
Figure 11: Total percent of RTUs based on capacity (NEEA 2005)
A g e (years)
% of total RTUs
Under 5 tons 5-10 tonsOver 10 tons
0-4 17% 30,000 24,000 14,000
5-10 32% 56,000 46,000 26,000
10-19 35% 62,000 50,000 28,000
20+ 16% 28,000 23,000 13,000
Figure 10: RTU Age-Size breakdown (NEEA 2005)
36% 20%

MULTI-TENANT LIGHT COMMERCIAL 11 PROJECT REPORT
Problem areas Description Reference
Refrigerant Charge Improper charge (decreases efficiency and capacity) (Bob Davis, 2002; Cowan, 2004; Jacobs, 2003)
Economizers1 Economizer not present or not working. (Cowan, 2004; Felts & Bailey, 2000; Jacobs, 2003)
Air Entering Conditions Heat sources around inlet air (Jacobs, 2003)
Supply Fan PowerFan operating “auto” or continuously. Does not meet title 24.
(Jacobs, 2003)
Air FlowReduced air-flow (decreases efficiency, can cause icing and ineffective moisture removal)
(Cowan, 2004; Jacobs, 2003)
Thermostats/Fan ControlsPoor placement. Use of residential thermostats unable to control fan separately. Ne setback settings.
(Jacobs, 2003)
Sensors Failed sensors, broken wires. (Cowan, 2004)
System Sizing Systems are generally over-sized(Djunaedy, Van Den Wymelenberg, Acker, & Thim-mana, 2010; Felts & Bailey, 2000; Jacobs, 2003)
Distribution Systems Duct leakage or poor leak insulation. (Jacobs, 2003)
Access to RoofAccess to equipment can be difficult/impossible during au-dits.
(Jacobs, 2003)
POTENTIAL RTU PROBLEMS
Several studies describe numerous problems that have been en-
countered in RTUs. A list of the most common problems is pre-
sented in Table 4 and Figure 12 and it illustrates the frequency of
the problems in Jacobs, 2003. It is important to note that all of
these problems were encountered in RTUs that were still function-
ing and were not perceived as “broken”. We expect similar prob-
lems in the units installed in MTLC buildings.
Table 4: Common problems in RTUs
Economizers
Refrigerant charge
Low airflow
Cycling fans (occupied)
Fans run while unoccupied
Simultaneous heating and cooling
No outside air intake at unit
0 0.1 0.2 0.3 0.4 0.5 0.6 0.7Problem Frequency
Figure 12: Frequency of RTU problems in the field

MULTI-TENANT LIGHT COMMERCIAL 12 PROJECT REPORT
4. LIGHT COMMERCIAL HVAC DESIGN PROCESSWhen a new building is designed the HVAC engi-
neers and/or contractors perform the following tasks
(ASHRAE, 2009; Glenn Hourahan, 2003):» Load calculations» Unit sizing and selection » Air distribution system layout » Duct sizing
Figure 13 shows this process and the associated refer-
ence residential and commercial manuals developed by
ACCA.
A survey by Air Conditioning and Refrigeration Technol-
ogy Institute (ARTI) on design practices for small build-
ings (<20,000 sf) showed that the most popular sizing
system for HVAC systems in new constructions is manu-
facturers’ software, but a large fraction (17%) still use
rules of thumb (Jacobs & Henderson, 2002). Results are
shown in Figure 15. It is important to note that the data
obtained is self-reported and was provided only by the
small sample (N=198) that responded to the survey. The
reality could be quite different as pointed out by sev-
eral researchers for the residential sector where a higher
percentage of contractors use “rules of thumb”(Glenn
Hourahan, 2003; Proctor, et al., 1995; Vieira, Parker, Klon-
gerbo, Sonne, & Cummings, 1996).
System Design Process
Adjust, Test, Balance
ACCA Residential
Manuals
ACCA Commercial
Manuals
Residential Duct Diagnostic and Repair
J
T
S CS
Q
N
D Q
EquipmentSelection
Duct Size Calculation
AirDistribution
Load Calculation
Figure 13: HVAC design process and associated ACCA manuals
Manual J Worksheet
4%
Manufacturer’s sizing software
51%Previous experience,
rule of thumb 17%
Other 12%
3rd party sizing software
9%
Building energy simulation software
7%
Figure 14: Design practice sizing HVAC systems for
small buildings (Jacobs & Henderson, 2002)
Methods commonly used by HVAC designers to cal-culate the building load can be classified based on the degree of complexity and accuracy of results.
» Hand calculations/previous experience» Spreadsheets from standards» Manufacturing or third party load calculation tools» Building energy simulation tools

MULTI-TENANT LIGHT COMMERCIAL 13 PROJECT REPORT
Load Calculation Method (small commercial buildings) Tool Amount of inputs
neededT r a i n i n g needed
Time needed (order of magnitude)
Results
Manual Calculation/Rule of thumb
paper and calculator small 1 day a few hours rough?
ACCA Manual N Excel spreadsheet medium 1 week several hours average?
HVAC Manufacturer Software software medium months hours-days average?
Hourly Simulation Software software high years 1 week accurate*
Table 5: Load Calculation methods
MTLC building projects do not have a budget for extensive HVAC
design, therefore quick methods are usually preferred.
HVAC Equipment Over-SizingSeveral studies to survey existing RTUs and develop tools for
analyzing performance have been conducted, including the work
performed for PG&E in 1998 by Felts and Bailey (Felts & Bailey,
2000),. Based on the information Felts and Bailey collected on
the 250 units they surveyed, they found that only 40% of the units
were correctly sized (not exceeding the peak condition), 20%
were over-sized by 25% or less (limit in the ASHRAE manual). The
remaining 40% of the units they surveyed were more than 25%
over-sized with 10% of them being more than 50% over-sized.
A variety of situations lead designers and contractors to over-size
HVAC equipment. Some of these situations include poor applica-
tion of accepted load calculation methodologies, poor inputs and
assumptions, unknown future status (i.e. building expansions),
legal considerations, equipment availability and, of course, cost.
Many of these problems are well understood and several studies
have demonstrated their correlation to incorrect equipment spec-
ification. Unfortunately, there does not appear to be significant
motivation to change the current status quo and there are limited
strategies available to cost effectively down-size RTUs.
ERRONEOUS LOAD CALCULATIONS
One of the foremost challenges facing designers and contractors
is poor application of load calculation methodologies. Improper
use of these tools and methodologies can stem from several po-
tential deficiencies ranging from inadequate training to over sim-
plification. For example, both ACCA and ASHRAE specify detailed
procedures to calculate the cooling load for a commercial build-
ing (ASHRAE, 2009; G. Hourahan, Rutkowski, & America, 2008)
and several software packages and spreadsheets have been de-
veloped to help and guide contractors and engineers, however,
these procedures require a significant amount time and accurate
information to produce valuable results. Indeed, the HVAC indus-
try is aware of the fact that these procedures are frequently not
performed at all and, instead, rules of thumb, or previous experi-
ence, are used to determine equipment capacity (Glenn Houra-
han, 2003; Proctor, et al., 1995; Vieira, et al., 1996).
Incorrect interpretation and usage of guidelines and procedures
for determining the maximum thermal load the HVAC equipment
must satisfy often leads to flawed results. A common practice in
the HVAC field or “fix” used to deal with the uncertainty of these
results is to apply “safety factors”, often of 25% or more, that in-
crease the specified capacity. This practice seems to be so wide-
spread that an article in the ASHRAE journal dedicated to equip-
ment sizing included explicitly “Do Not Add Safety Factors” as one
step in the sizing procedure (Glenn Hourahan, 2004).
Indirect evaporative retrofit for RTUs
MULTI-TENANT LIGHT COMMERCIAL 14 PROJECT REPORT
3Usually expressed in terms of dry bulb temperature4Less than 5% of the year
Other sources report the use of “fudging” factors in the calcula-
tion process (Proctor, et al., 1995). For example, contractors were
found to increase the size of windows, change the internal or
external design temperature, and/or increase the internal loads
in order to obtain a higher load allowing them to recommend a
larger unit. In addition, the rounding-up to the next available ca-
pacity (RTUs are typically available only in 0.5-ton increments)
exacerbates the over-sizing problem.
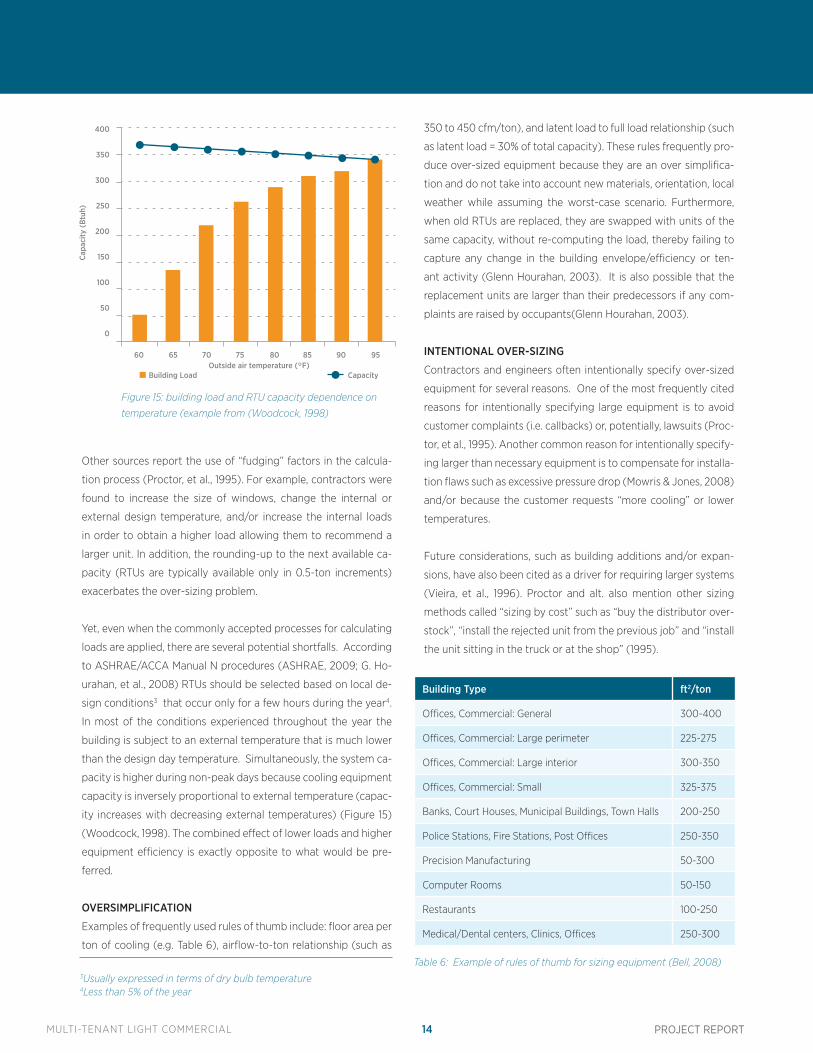
Yet, even when the commonly accepted processes for calculating
loads are applied, there are several potential shortfalls. According
to ASHRAE/ACCA Manual N procedures (ASHRAE, 2009; G. Ho-
urahan, et al., 2008) RTUs should be selected based on local de-
sign conditions3 that occur only for a few hours during the year4.
In most of the conditions experienced throughout the year the
building is subject to an external temperature that is much lower
than the design day temperature. Simultaneously, the system ca-
pacity is higher during non-peak days because cooling equipment
capacity is inversely proportional to external temperature (capac-
ity increases with decreasing external temperatures) (Figure 15)
(Woodcock, 1998). The combined effect of lower loads and higher
equipment efficiency is exactly opposite to what would be pre-
ferred.
OVERSIMPLIFICATION
Examples of frequently used rules of thumb include: floor area per
ton of cooling (e.g. Table 6), airflow-to-ton relationship (such as
350 to 450 cfm/ton), and latent load to full load relationship (such
as latent load = 30% of total capacity). These rules frequently pro-
duce over-sized equipment because they are an over simplifica-
tion and do not take into account new materials, orientation, local
weather while assuming the worst-case scenario. Furthermore,
when old RTUs are replaced, they are swapped with units of the
same capacity, without re-computing the load, thereby failing to
capture any change in the building envelope/efficiency or ten-
ant activity (Glenn Hourahan, 2003). It is also possible that the
replacement units are larger than their predecessors if any com-
plaints are raised by occupants(Glenn Hourahan, 2003).
INTENTIONAL OVER-SIZING
Contractors and engineers often intentionally specify over-sized
equipment for several reasons. One of the most frequently cited
reasons for intentionally specifying large equipment is to avoid
customer complaints (i.e. callbacks) or, potentially, lawsuits (Proc-
tor, et al., 1995). Another common reason for intentionally specify-
ing larger than necessary equipment is to compensate for installa-
tion flaws such as excessive pressure drop (Mowris & Jones, 2008)
and/or because the customer requests “more cooling” or lower
temperatures.
Future considerations, such as building additions and/or expan-
sions, have also been cited as a driver for requiring larger systems
(Vieira, et al., 1996). Proctor and alt. also mention other sizing
methods called “sizing by cost” such as “buy the distributor over-
stock”, “install the rejected unit from the previous job” and “install
the unit sitting in the truck or at the shop” (1995).
Outside air temperature (°F)60 65 70 75 80 85 90 95
400
350
300
250
200
150
100
50
0
Capa
city
(B
tuh)
Building Load Capacity
Figure 15: building load and RTU capacity dependence on
temperature (example from (Woodcock, 1998)
Building Type ft2/ton
Offices, Commercial: General 300-400
Offices, Commercial: Large perimeter 225-275
Offices, Commercial: Large interior 300-350
Offices, Commercial: Small 325-375
Banks, Court Houses, Municipal Buildings, Town Halls 200-250
Police Stations, Fire Stations, Post Offices 250-350
Precision Manufacturing 50-300
Computer Rooms 50-150
Restaurants 100-250
Medical/Dental centers, Clinics, Offices 250-300
Table 6: Example of rules of thumb for sizing equipment (Bell, 2008)

MULTI-TENANT LIGHT COMMERCIAL 15 PROJECT REPORT
In summary, it can be shown that several stakeholders have bene-
fits in choosing an over-sized system, whereas the parties that ex-
perience the negative consequences (mostly users, and utilities)
are not involved in the decision-making process. This concept is
analogous to the principal agent problem but whereby tenants
are loathe to, or are not empowered to, improve an asset they do
not own and the owners have no incentives, financial or otherwise,
to improve efficiency. Unfortunately, it is exceptionally unusual for
either the owner or the tenant to be consulted during the design
phase of these systems (see Table 7 for the details of the stake-
holder analysis).
Impacts of HVAC Equipment Over-SizingThere are several negative consequences that result from over-
sizing HVAC equipment. These consequences include undesir-
able increases in peak power consumption, increased energy use
(typically as a result of decreased part load performance), and
decreased comfort. Several strategies have been developed to
manage and improve part-load conditions; however, these solu-
tions are constrained by the degree of over-sizing and the type of
units that must be addressed. For example, a large unit with mul-
tiple compressors could be configured to reduce peak power con-
sumption by physically disconnecting a compressor, whereas a
small unit with single compressor cannot be effectively addressed
using the same approach.
PART-LOAD CONTROL STRATEGIES
Different RTUs respond differently to part-load conditions, de-
pending on their physical characteristics and control strategies
adopted. The simplest and most common RTU system configura-
tion is a single speed, constant-volume system. When these con-
stant volume units are on the supply volume of the RTU does not
change, which is to say that they are either operating at 100% or
are turned off.
Constant volume RTUs are generally controlled by a single ther-
mostat (Woodcock, 1998) in the most simplistic way possible. The
thermostat calls for cooling and switches the RTU on when the
room temperature is 1-2F (deadband) above the desired temper-
ature and switches it off when the temperature is below 1-2F of
the same desired temperature. Unfortunately, this strategy often
collides with controls within the RTU that are designed to pro-
tect some of the components of the RTU. Specifically, RTUs often
have minimum run times (typically >5minutes) in order to prevent
frequent compressor cycling (AKA short cycling) that often leads
to premature compressor failure. The combination of these two
simple control features results in large temperature swings due to
significantly more cooling being supplied than necessary and is
further exacerbated by over-sized units.
For RTUs that contain two or more compressors, the unit can have
at least two stages of cooling, which helps mitigate excessive on-
off cycling5. Staging can be accomplished by having two indepen-
dent refrigerant circuits within the rooftop unit or by using other
capacity controls such as suction pressure unloaders (Woodcock,
1998). Suction pressure unloaders, or simply unloaders for short,
prevent the flow of refrigerant from entering some of the com-
pressors, reducing the overall capacity of the RTUs. Figure 17
shows a simplified behavior of a 4-stage RTU (Timmons & Tozzi,
2000).
Stakeholder Benefits Drawbacks
DesignerReduced risk of callbacks Higher project cost (higher profit) Al-lows less detailed calculations (reduce time needed, therefore cost) and mask design flaws
Higher cost in case of bids
ContractorReduced risk of callbacks Higher project cost (higher profit) Al-lows for less detailed calculations (reduce time needed, therefore cost) and mask installation flaws
Higher cost in case of bids
OwnerAllows new tenants with higher internal loads without replacing the equipment
Higher maintenance, shorter equipment life (short cycling)
User/TenantEquipment meets the load even in extreme conditions (peak tem-perature and peak internal load)
Higher maintenance, shorter equipment life (short cycling) Poor temperature and hu-midity control
Bill Payer (Tenant/Owner) Higher operation cost
Utility Higher peak demand Higher energy use
Table 7: Stakeholder analysis of the impacts of over-sizing

MULTI-TENANT LIGHT COMMERCIAL 16 PROJECT REPORT
Another option to modulate the load delivered by an RTU is
termed hot-gas-bypass whereby some of the hot refrigerant is
short-circuited and sent directly to the evaporator coil increasing
suction temperatures and reducing the capacity. Unfortunately,
the thermal energy of the refrigerant is wasted during this process
making this method very energy inefficient. Therefore, hot-gas-
bypass is only used in extreme cases when the unit must remain
running for long periods of time at low load levels (Woodcock,
1998).
Modern techniques to regulate the RTU capacity include multiple-
speed and variable-speed motors mounted on compressors and
fans. These methods are very effective, but they require dedicated
controllers, advanced control strategies and variable frequency
motor drives. Even thought the energy savings can be substan-
tial, the associated increase in complexity, in addition to the nec-
essary hardware, increases the overall cost of these measures.
Many components of the cooling system, some of which are out-
side the realm of the RTU, can, and often do, affect the cooling ca-
pacity of an RTU. Problems such as improper refrigerant charge,
duct leaks and improper flow across the coils all reduce the deliv-
ered capacity (Proctor, et al., 1995) and represent opportunities
for improving energy efficiency. Unfortunately, addressing these
problems in a retrofit situation will result in delivering more cool-
ing capacity to the space and have the unintended consequence
of exaggerating the problems of over-sizing.
Assessing Over-sizing in Existing SystemsLiterature and industry practice did not reveal any known com-
mercial tool that could be used to identify the presence or sever-
ity of existing over-sized systems even though the problem of
over-sizing is a frequent problem that has yet to be effectively
addressed. This lack of any available tool likely stems from a lack
of incentives for contractors and designers to right-size the equip-
ment and, because the HVAC industry has no known commercial
tool to assess over-sizing, there are few options for down-sizing.
Fortunately, some researchers have studied these problems and
developed methods that may be used to quantify the extent
of over-sizing. Two studies in particular (Djunaedy, et al., 2010;
Handerson, Raustad, & Rengrarajan, 1991) developed a relatively
straightforward methodology to calculate the degree of over-siz-
ing as well as the performance degradation and penalties associ-
ated with over-sizing. This method requires only the measurement
of run-time data (tON and tOFF) during the peak hour of the day
in a day with dry-bulb outdoor temperature close to design condi-
tions. The idea is that if the unit does not run continuously during
the most extreme days of the year it means it is over-sized. To
identify over-sizing the methods calculate two parameters: maxi-
mum cycle rate (NMAX) and run-time fraction (RTF). The com-
bination of high NMAX and low RTF is a signature of over-sizing.
Using these two parameters allows two other parameters to be
calculated: the part-load ratio (PLR) and the part-load fraction
(PLF). Energy and Peak-load penalties can be calculated using
the following formulas (Djunaedy, et al., 2010):
5Multiple-stage units generally require specific thermostats to operate correctly
59 63 67 71 75 79 83 87 91 95
120
100
80
60
40
20
0
100%
75%
50%
25%
Ambient Temperature (°F)
4-Step CapacityLoad
Capa
city
(to
ns)
Figure 16: Building Load and Capacity in a 4-stage RTU
(Timmons & Tozzi, 2000)
𝑃𝑃𝑃𝑃𝑃𝑃 =𝑡𝑡𝑂𝑂𝑂𝑂𝑡𝑡𝑐𝑐𝑐𝑐𝑐𝑐𝑐𝑐𝑐𝑐
−𝜏𝜏
𝑡𝑡𝑐𝑐𝑐𝑐𝑐𝑐𝑐𝑐𝑐𝑐�1 − 𝑒𝑒
−𝑡𝑡𝑂𝑂𝑂𝑂𝜏𝜏 �
𝑃𝑃𝑃𝑃𝑃𝑃 = 1 −𝜏𝜏𝑡𝑡𝑂𝑂𝑂𝑂
�1 − 𝑒𝑒−𝑡𝑡𝑂𝑂𝑂𝑂𝜏𝜏 �
𝑃𝑃𝑒𝑒𝑃𝑃𝑃𝑃𝑃𝑃𝑒𝑒𝑃𝑃𝑃𝑃𝑃𝑃𝑃𝑃 𝑃𝑃𝑒𝑒𝑃𝑃𝑃𝑃𝑃𝑃𝑡𝑡𝑃𝑃 = 𝐸𝐸𝑃𝑃𝑒𝑒𝐸𝐸𝐸𝐸𝑃𝑃𝐼𝐼𝑂𝑂(1− 𝑃𝑃𝑃𝑃𝑃𝑃)
𝐸𝐸𝑃𝑃𝑒𝑒𝐸𝐸𝐸𝐸𝑃𝑃 𝑃𝑃𝑒𝑒𝑃𝑃𝑃𝑃𝑃𝑃𝑡𝑡𝑃𝑃 = �𝑡𝑡𝑂𝑂𝑂𝑂
𝑡𝑡𝑂𝑂𝑂𝑂 − 𝜏𝜏 �1 − 𝑒𝑒−𝑡𝑡𝑂𝑂𝑂𝑂𝜏𝜏 �
� − 1

MULTI-TENANT LIGHT COMMERCIAL 17 PROJECT REPORT
IDENTIFYING AND ASSESSING OVER-SIZING
If one can correctly evaluate the degree of over-sizing of an in-
stalled cooling system, one can then re-calculate the load of the
building. Using a simplified method such as ACCA manual N the
total load can be divided by the internal load, external load and
system load. To calculate the internal load it is necessary to know
all the thermal properties of the walls, windows and other bound-
ary surfaces and the air infiltration rate. The location-specific
design conditions must also be used. External loads are usually
dominant in small commercial buildings in California, but to ac-
curately evaluate the degree of over-sizing the internal loads con-
current with the maximum external loads must also be evaluated,
together with the system loads (e.g. duck leaks).
Depending on the principal activity of the building, the peak inter-
nal load might not coincide with the maximum external load (e.g.
retails during holidays or restaurants during the evening meals).
The relevant load calculation must check whether these internal
load peaks are higher than total peak during the hottest day of the
year. Finally, the latent load must be taken into account explicitly
and not as a percentage of the sensible load.
After the load is calculated it must be compared with the real ca-
pacity delivered by the current RTU. Calculating the real capac-
ity delivered is tricky because the flow rate from the air-side or
from the refrigerant-side must be measured. Unfortunately, there
is no easy way of measuring these air flows for a variety of rea-
sons including the internal velocity distribution within the duct,
unknown thermal zoning configurations, and difficulty of access-
ing a representative position within the system. In its entirety, this
process is expensive, time consuming and needs a large amount
of information (an energy audit and building drawings are most
likely needed).
Alternatively a measurement of the real performance of the units
can be done. The unit must be tested in a time period close to the
peak external load condition (high dry-bulb external temperature,
high insolation, high humidity) and internal load (# people, lights
and electrical equipment on). If in these extreme conditions the
units still cycles on and off it means it is oversized. The relationship
between time on and off determines the degree of over-sizing.
The problem with this method is that measurements must be tak-
en in peak-hour or close-to-peak hour conditions. Details of this
method will be explained in the following section.
Air Care Plus data (office buildings in Davis) shows on average 385
square feet area serviced by one ton of nominal equipment capac-
ity. This value is close to the rule of thumb of 350-400 sf/ton used
in the field (Figure 18). However, data collected in our primary re-
search in an office park in Davis is significantly lower (273 sf/ton),
most likely denoting over-sized systems.
Using a more simplified method a first-cut analysis could be done comparing square feet served by Square feet/ton method
Building Information
Average (mean) building sf. 6051
Median building sf. 3200
RTU Information
#RTU per building 3.54
Avg. ton per RTU 4.375
Avg sf. per ton 385.1
avg. sf. per RTU 1,665
% units w/ second stage 8%
%ton in second stage 11%
Figure 18: Summary of Air Care Plus data for UC Davis

MULTI-TENANT LIGHT COMMERCIAL 18 PROJECT REPORT
5. CONCLUSIONOne of the key concepts of the MTLC project lies in reassessing the
size of the HVAC systems. Common design practices frequently
lead to the problem of light commercial HVAC systems being
oversized. This problem will be accentuated after all of the
proposed MTLC project retrofits have been implemented. The
initial idea for reducing the size of the HVAC system was based on
the assumptions that most of the units had multiple compressors
(possibly 3-4). For example, disconnecting one compressor out
of four available stages would only in a 25% capacity reduction.
However, based on the primary data collected, and the data
available in existing literature, the majority of the RTUs serving
MTLC spaces are relatively small in capacity and, therefore, do not
contain multiple compressors.
Several control retrofit solutions are commercially available that
actively modulate the delivered cooling capacity of the RTU
through the use of variable frequency drives. These retrofit con-
trol kits effectively “right-size” the unit continuously to deliver
only the cooling necessary to satisfy the thermal load at any given
time. While these control kits can save a substantial amount of
energy they do not permanently reduce the capacity and are, at
present, prohibitively expensive for most units smaller than 10-
tons. Similarly, because these units have significant useful life re-
maining, it does not appear that replacement with a new, smaller,
more efficient RTU would be an economically viable option.
Developing an assessment protocol that has wider applicability
than the “catch a design day” method described in literature will
be directly tied to the potential adoption of the MTLC project’s
whole building approach. Future efforts will focus on adapting
existing assessment approaches and expanding the applicable
conditions that will produce meaningful results. Another subject
of future focus will be to determine the savings potential, risks,
and costs associated with replacing specific components of the
RTU, such as evaporator fans and compressors. Improving both
the assessment of existing systems and the retrofit approach will
contribute notably to the success of the MTLC project.
50
60
70
80
90
100
0
10
20
30
40
50
60
70
80
90
100
10:00 11:00 12:00 13:00 14:00 15:00 16:00 17:00 18:00 19:00 20:00 21:00 22:00 23:00
Tem
pera
ture
(°F
)
Perc
ent O
n tim
e
TimeAvg RTU 1 Avg RTU 2_2 Avg RTU 4Avg RTU 2_1
Average Temperature
Avg RTU 3
Figure 18: Runtime and outdoor dry bulb temperature for four RTUs in our data collection
RUNTIME METHOD
A deeper analysis was performed in Davis with 4 RTUs during 4 hot days of August 2012. The maximum external temperature was slightly
higher than the design day temperature making this data a good example of peak conditions. Figure 18 shows the percent on time of the
four units in one selected day in August and the external temperature. During the hottest hour of the day 3 out of 4 units were running
only a small fraction of time. From 1 pm to 5 pm units 2,3,4 where running 10-30% of the time. By definition, if the runtime of the unit during
peak day conditions is less than 100% the unit is over-sized. According to the methodology in Djunaedy et.al these units are anywhere from
120% to 300% over-sized. (Djunaedy, et al., 2010)

MULTI-TENANT LIGHT COMMERCIAL 19 PROJECT REPORT
ASHRAE. (2009). ASHRAE Handbook of Fundamentals.Bell, A. A. (2008). HVAC: Equations, Data, and Rules of Thumb (2nd ed.): McGraw-Hill.Bob Davis, D. B., Reid Hart (2002). Identifying Energy Savings Potential on Rooftop Commercial Units California Energy Commission (CEC). (2006). CALIFORNIA COMMERCIAL END-USE SURVEY.Cowan, A. (2004). Review of Recent Commercial Roof Top Unit Field Studies in the Pacific Northwest and California New Buildings Institute Djunaedy, E., Van Den Wymelenberg, K., Acker, B., & Thimmana, H. (2010). Oversizing of HVAC System: Signatures and Penalties. Energy and Buildings. Energy Information Administration (EIA). (2003). COMMERCIAL BUILDINGS ENERGY CONSUMPTION SURVEY (CBECS). Felts, D. R., & Bailey, P. (2000). State of Affairs - Packaged Cooling Equipment in California Handerson, H., Raustad, R., & Rengrarajan, K. (1991). Measuring Thermostat and Air Conditioner Performance in Florida Homes: Florida Solar Energy Center. Hourahan, G. (2003). Sizing and Selecting Equipment for Proper Humidity Control. ARI Supplement to Contracting Business magazine. Hourahan, G. (2004). How to properly size unitary equipment. ASHRAE Journal(February). Hourahan, G., Rutkowski, H., & America, A. C. C. o. (2008). Manual N: Commercial Load Calculations: ACCA. Hydeman, M., Stein, J., & Zhou, A. (2007 ). Workshop Report Single Zone VAV Systems. Jacobs, P. (2003). Small HVAC Field and Survey Information: California Energy Commission. Jacobs, P., & Henderson, H. (2002). State-of-the-Art Review: Whole Building, Building Envelope, and HVAC Component and System Simulation and Design Tools: ARTI-Air Conditioning and Refrigeration Technology Institute, Arlington, VA. Levins, W., Rice, C. K., & Baxter, V. D. (1996). Modeled and Measured Effects of Compressor Downsizing in an Existing Air Conditioner/Heat Pump in the Cooling Mode. ASHRAE TRANSACTIONS 102. Mowris, R., & Jones, E. (2008). Peak Demand and Energy Savings from properly Sized and Matched Air Conditioners. Paper presented at the ACEEE Summer Study on Energy Efficiency in Buildings. Retrieved from http://www.aceee.org/files/proceedings/2008/data/papers/1_692.pdf NEEA, & Energy and Environmental Analysis, I. (2005). Light Commerial HVAC Energy and Environmental Analysis, Inc. New Buildings Institute, I. N. (2003). INTEGRATED ENERGY SYSTEMS: PRODUCTIVITY & BUILDING SCIENCE. PG&E. (1999). Commercial Building Survey Report (1999). Proctor, J., Katsnelson, P. E. Z., & Wilson, B. (1995). Bigger Is Not Better: Sizing Air Conditioners Properly. Home Energy Magazine. Reichmuth, H., & Cherniack, M. (2012). Rooftop HVAC Field Monitoring Protocol & Annual Savings Estimation Methodology New Buildings Institute. RLW Analytics, I. (1999). Non-residential New Construction Baseline Study. Timmons, B., & Tozzi, M. (2000). Off-Peak Building Control Considerations Utilizing CO2 Based Demand-Controlled Ventilation (DCV) with Large Packaged Rooftop Units: Carrier Corporation. UC Davis, & Cooper, O. A. C. (2010). AirCare Plus UC Davis Data: UC Davis. Vieira, R. K., Parker, D. S., Klongerbo, J. F., Sonne, J. K., & Cummings, J. E. (1996). How Contractors Really Size Air Conditioning Systems. Paper presented at the ACEEE Summer Study on Energy Efficiency in Buildings. Retrieved from http://www.fsec.ucf.edu/en/publications/html/FSEC-PF-289-95/index.htm Western Cooling Efficiency Center, W., & Davis Energy Group, D. (2012). Field Survey of RTU fan efficiency and Operation Patterns: Southern California Edison (SCE). Woodcock, R. (1998). Part-Load Control Strategies for Packaged Rooftop Units: Carrier Corporation.
6. REFERENCES