
Hutt Valley Flood Vulnerability - Victoria University of ... · Vulnerability and adaptation to...
76
Vulnerability and adaptation to increased flood risk with climate change—Hutt Valley summary NZCCRI 2011 report 02 October 2011 The New Zealand Climate Change Research Institute Victoria University of Wellington Judy Lawrence Simon Tegg Andy Reisinger Dorothee Quade
Transcript of Hutt Valley Flood Vulnerability - Victoria University of ... · Vulnerability and adaptation to...

Vulnerability and adaptation to increased flood risk with
climate change—Hutt Valley summary
NZCCRI 2011 report 02
October 2011
The New Zealand Climate Change Research Institute
Victoria University of Wellington
Judy Lawrence Simon Tegg
Andy Reisinger Dorothee Quade

ii
The New Zealand Climate Change Research Institute
School of Geography, Environment and Earth Sciences
Victoria University of Wellington
PO Box 600
Wellington
New Zealand
Contact: Liz Thomas
Phone: (04) 463 5507
Email: [email protected]
Judy Lawrence, New Zealand Climate Change Research Institute, VUW; PSConsulting Ltd
Simon Tegg, New Zealand Climate Change Research Institute, VUW
Andy Reisinger, New Zealand Agricultural Greenhouse Gas Research Centre; New Zealand Climate
Change Research Institute, VUW
Dorothee Quade, New Zealand Climate Change Research Institute, VUW
Acknowledgements
This research was funded by the Foundation for Research, Science and Technology under contract
VICX0805 Community Vulnerability and Resilience. Modelling was undertaken by Andy Reisinger, and
by Bethanna Jackson and John Ballinger of the School of Geography, Environment and Earth Science
(SGEES) s at Victoria University of Wellington (VUW). GIS analysis was undertaken by Simon Tegg and
the survey data analysis by Dorothee Quade. This research could not have been completed without
the ongoing support and contribution from Greater Wellington Regional Council, Wellington City
Council, Hutt City Council, and Kapiti Coast District Council officers. The researchers would like to
thank the participating households who shared their views and experiences in the survey conducted
for this study. We are grateful for review comments from Ann Magee and Andy Reisinger.
Contract: E1307
Vulnerability, Resilience, and Adaptation Objective 2 reports, October 2011
NZCCRI-2011-01 Synthesis: Community vulnerability, resilience and adaptation to climate change in New Zealand
NZCCRI-2011-02 Vulnerability and adaptation to increased flood risk with climate change—Hutt Valley summary (Case study: Flooding)
NZCCRI-2011-03 The potential effects of climate change on flood frequency in the Hutt River (SGEES client report)
(Case study: Flooding)
NZCCRI-2011-04 Potential flooding and inundation on the Hutt River (SGEES client report) (Case study: Flooding)
NZCCRI-2011-05 RiskScape: Flood-fragility methodology (NIWA client report) (Case study: Flooding)
NZCCRI-2011-06 Vulnerability and adaptation to increased flood risk with climate change—Hutt Valley household survey (Case study: Flooding)
NZCCRI-2011-07 Perspectives on flood-risk management under climate change—implications for local government decision making (Case study: Flooding)
NZCCRI-2011-08 Vulnerability and adaptation to sea-level rise in Auckland, New Zealand (Case study: Sea-level rise)
NZCCRI-2011-09 Climate resilient water management in Wellington, New Zealand (Case study: Water security)
All reports available on the NZCCRI website: http://www.victoria.ac.nz/climate-change/reports

New Zealand Climate Change Research Institute
iii
Contents 1 Introduction .............................................................................................................................. 5
1.1 Research purpose............................................................................................................... 5
1.2 Research framework .......................................................................................................... 5
1.3 Case study background ...................................................................................................... 9
2 Study 1: Biophysical impacts of climate change ........................................................................ 13
2.1 Methodology ................................................................................................................... 13
2.2 Flood frequency results .................................................................................................... 15
2.3 Flooding and inundation on the Hutt River ....................................................................... 20
3 Study 2: Socio-economic impacts ............................................................................................. 23
3.1 Methodology ................................................................................................................... 23
3.2 RiskScape damage model ................................................................................................. 24
3.3 Social vulnerability ........................................................................................................... 26
3.4 Flood-impacts survey ....................................................................................................... 28
4 Study 3: Adaptation barriers and opportunities ....................................................................... 31
4.1 Local-government workshop and interviews .................................................................... 31
4.2 Hutt City residents’ perspectives of flood-risk management from the flood-impacts
survey ................................................................................................................................. 34
4.3 Flood-risk communication ................................................................................................ 36
5 Conclusion ............................................................................................................................... 39
6 References ............................................................................................................................... 43
7 Appendix 1 Methodological caveats ......................................................................................... 49
7.1 Flood frequency and inundation modelling ...................................................................... 49
7.2 RiskScape damage-cost model ......................................................................................... 49
7.3 Socio-economic factors .................................................................................................... 49
7.4 Flood impacts survey........................................................................................................ 50
8 Appendix 2 Workshop and interview questionnaire ................................................................. 53
9 Appendix 3 Household survey questionnaire ........................................................................... 55

iv
List of figures and tables Figure 1. Vulnerability and its components (Allen Consulting Group, 2005, p. ix)........................... 6
Figure 2. The Hutt River, Wellington Harbour, and beyond, from Manor Park
(WRC, 2001, p. 2, 2) ............................................................................................................ 10
Figure 3. Global CO2 emissions scenarios. Historical CO2 data from Boden, Marland et al. (2011)
and Houghton (2008). The 2°C stabilisation scenario has net negative emissions from
2100 due to large amounts of reforestation and is from Meinshausen (2005). The three
SRES scenarios are from IPCC (2000)............................................................................. 14
Figure 4. Changes in flood frequencies under different emissions scenarios. The black diamonds
and line show present-day flood volumes and their estimated return periods. The purple
dots show model average future flood volumes and return periods under two different
emissions scenarios (upper panel: rapid global emissions reductions—2°C scenario;
lower panel: continued global emissions increases—A2 scenario). The purple band
shows the 10 to 90percent range across different climate models, and the light pink
band shows the lowest and highest results across all models. ...................................... 17
Figure 5. Histogram of changes in the volume of a 100-year flood under the most optimistic (2°C
scenario) for the set of 12 different climate models. ..................................................... 18
Figure 6. Histogram of changes in the volume of a 100-year flood under the highest emissions
scenario (A2 scenario) for the set of 12 different climate models.................................. 19
Figure 7. Inundation of the Hutt Valley from the 2300 cumec flood. Areas flooded where the
depth was less than 0.01m are not shown (Ballinger, et al., 2010). ............................... 21
Figure 8. Inundation of the Hutt Valley from the 2800 cumec flood. Areas flooded where the
depth was less than 0.01m are not shown (Ballinger, et al., 2010). ............................... 22
Figure 9. Aggregated damage cost estimates. ............................................................................. 24
Figure 10. Spatial distribution of direct-damage costs of 2300 and 2800 cumec floods. Circles are
centred over meshblocks and proportionate to RiskScape cost estimates for that
meshblock. The largest circles are approximately $3 million dollars. ........................ 25
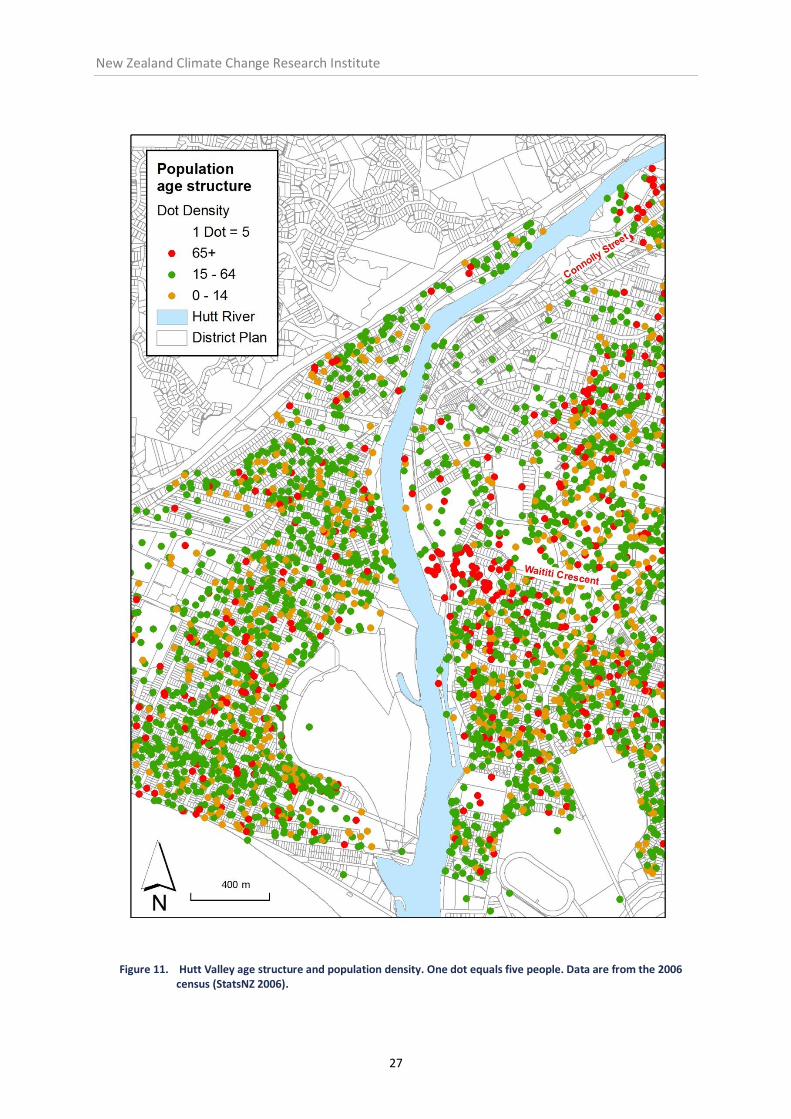
Figure 11. Hutt Valley age structure and population density. One dot equals five people. Data
are from the 2006 census (StatsNZ 2006). ................................................................ 27
Figure 12. Figure 12: The probability that zones in the Hutt Valley will be inundated above 0.6m,
assuming current stopbank specifications and low emissions (2°C GMT stabilisation /
B1 scenario). The above map is based on preliminary results and does not include
flooding associated with smaller tributaries and stormwater drainage. It is illustrative
only and should not be used for planning purposes (Tegg & Lawrence, in preparation-
b (b)). ....................................................................................................................... 38
Table 1. Key findings from the Hutt Valley case study ................................................................ 42

New Zealand Climate Change Research Institute
v
List of acronyms
HRFPMP Hutt River Flood Plain Management Plan
LIDAR Light detection and ranging
LTP Long-term plan
NES National environmental standards
NIWA National Institute of Water and Atmospheric Research
NPS National policy statement
NZCCRI / CCRI New Zealand Climate Change Research Institute
VUW Victoria University of Wellington


New Zealand Climate Change Research Institute
1
Executive summary
Research purpose
This report sets out the findings of the Hutt Valley case study on flooding, which is one of three case
studies that form Objective 2 of the collaborative, interdisciplinary research project on Community
Vulnerability, Resilience and Adaptation to the impacts of climate change. The project is led by
Victoria University and funded by Foundation for Research, Science and Technology (FRST)1.
The Hutt Valley case study concerns the impact of flooding in urban areas, and is based on research
in the Hutt Valley in the lower North Island of New Zealand. The purpose of the research is to gain a
better understanding of:
how a possible increase in heavy rainfall, and the associated increase in flood risk arising from climate change, could affect different parts of the community
how councils and their communities can respond to these increasing risks and reduce their vulnerability within considerable uncertainty about the exact magnitude of future changes in flood risk and socio-economic development.
The research is structured around four research questions.
Research questions
1. How will climate change affect the frequency and severity of flooding of the Hutt River over the
next century?
2. What are the impacts of a range of different flood events on the Hutt Valley community?
3. What socio-economic factors influence the community’s ability to adapt to flood risk; and to
cope with, and recover from, flooding?
4. What social and institutional barriers constrain adaptation and what opportunities are present
for improving adaptive capacity?
1 FRST was merged in February 2011 with the Ministry of Research, Science and Technology (MoRST) to form the Ministry of Science and Innovation (MSI), which is responsible for the policy and investment functions of both those agencies.

2
Research methods
The research focuses on the part of the Hutt Valley south of the Taita Gorge and comprises three
interlinked studies.
Study 1: Modelling biophysical changes and impacts
Biophysical changes were assessed with downscaled climate modelling and Hutt River catchment
runoff and inundation modelling. The researchers used the downscaled results of 12 climate models
under four emissions scenarios to establish a range of potential changes in rainfall over the Hutt
River catchment and changes in the frequency of flood flows. Subsequent inundation modelling of
flood flows established the potential extent, depth, and velocity of floodwaters for a 1500–3500
cubic metres per second (cumecs) range of flood scenarios (Ballinger et al. 2010).
Study 2: Investigating socio-economic sensitivities and impacts of flooding
To investigate the socio-economic impacts of flooding on the Hutt Valley, the researchers undertook
three lines of enquiry: RiskScape damage-cost modelling (combining the inundation modelling
results with a spatial-asset database and known relationships between flood depths and velocity to
project the financial costs of flooding), a survey of residents with a focus on the impacts of the 2004
flood, and an investigation into existing datasets and vulnerability literature relevant to the Hutt
Valley.
Study 3: Investigating the social and institutional factors that influence adaptation
Finally, to gain insight into adaptation barriers and opportunities, the researchers undertook a
workshop and in depth interviews with council advisers and decision makers across the Wellington
region.
Research findings
The frequency of Hutt River flooding is likely to significantly increase over the twenty-first century
The frequency of Hutt River flooding is likely to significantly increase over the twenty-first century.
What is currently considered a 1:440-year flood2 (a Hutt River flow of 2300 cumecs)—could become
a roughly 1:50-year event under a high-emissions scenario. Even under a low-emissions scenario, a
flood of this magnitude could still become a 1:100-year event. Damage-cost modelling indicates that
floods above 2100 cumecs begin to have direct, but relatively minor, damage costs. Above 2300
2 There are two main ways of expressing flood risk.
Annual exceedance probability (AEP) is the percentage chance that a flood of a certain volume will be exceeded in any given year. For example, a 1 percent annual exceedance probability flood is a flood volume that has a 1 percent chance of being exceeded in any one year.
Average return intervals (ARI) represent the chance that a flood of a certain volume will occur over a particular time frame, e.g. A 100-year flood is a flood which has 1 chance in 100 (1:100-year flood) of occurring in any one year.
These two expressions are related. A flood that occurs with 2 percent probability in any given year is equivalent to a 50-year flood. Planning for a 50-year flood does not guarantee protection for the next 50 years.

New Zealand Climate Change Research Institute
3
cumecs, flood damages increase sharply and have significant financial impacts on the Hutt
community.
Locally specific factors can influence vulnerability
The flood-impacts survey returned 190 responses and revealed that the 2004 flood impacts differed
by ethnicity and household composition, highlighting how locally specific factors can influence
vulnerability. Despite council efforts to improve how they communicate risk, many residents have a
low understanding of flood risks.
New Zealand local government currently relies on structural flood controls
In New Zealand, local government manages flood risk and generally favour hard structural flood
controls (such as stopbanks) over softer measures (such as land-use restrictions). Relying on
structural protection can be problematic in contexts when the risk is changing and uncertain, as the
potential future risk cannot be determined definitively. Non-structural measures are designed to
reduce impacts from high-impact events which will occur at some time in the future. This means that
they are less sensitive to changing risk. Both interviewees and, importantly, surveyed residents
recognised the importance of non-structural measures for managing risk. However, interviewees
highlighted the difficulties of overcoming institutional inertia and the current practice of using
largely structural protection in areas of existing development.
Floods can be an opportunity for institutional learning and changes to current practice
Regimes for managing flood risk that are dependent on structural measures can continue without
review due to long durations between damaging floods, the timeframes over which flood risk is
projected to increase, and a mismatch with local government political and planning cycles.
Conversely, when floods do occur they can often be an opportunity for institutional learning and
changes to current practice (B. Glavovic, W. Saunders, & J. Becker, 2010).
New Zealand needs a more comprehensive approach to changes in flood risk associated with
climate change
Findings highlight a need for a more comprehensive approach across New Zealand to changes in
flood risk associated with climate change. Suggested changes include financial and technical support
for better-quality risk assessments across regions, sharing experiences and approaches across
councils to build capacity, and better communication of the risks associated with climate change
impacts and the options for addressing them.


New Zealand Climate Change Research Institute
5
1 Introduction
1.1 Research purpose
This report sets out the findings of the Hutt Valley case study on flooding, which is one of three case
studies that form Objective 2 of the collaborative, interdisciplinary research project on Community
Vulnerability, Resilience and Adaptation to the impacts of climate change. The project is led by
Victoria University and funded by Foundation for Research, Science and Technology (FRST).
The Hutt Valley case study concerns the impact of flooding in urban areas, and is based on research
in the Hutt Valley in the lower North Island of New Zealand. The purpose of the research is to gain a
better understanding of:
how a possible increase in heavy rainfall, and the associated increase in flood risk arising from climate change, could affect different parts of the community
how councils and their communities can respond to these increasing risks and reduce their vulnerability within considerable uncertainty about the exact magnitude of future changes in flood risk and socio-economic development.
The research is structured around four research questions.
1. How will climate change affect the frequency and severity of flooding of the Hutt River over the
next century?
2. What are the impacts of a range of different flood events on the Hutt Valley community?
3. What socio-economic factors influence the community’s ability to adapt to flood risk; and to
cope with, and recover from, flooding?
4. What social and institutional barriers constrain adaptation and what opportunities are present
for improving adaptive capacity?
1.2 Research framework
1.2.1 Vulnerability
In this study, vulnerability is understood as a function of exposure, sensitivity, and adaptive
capacity—a framework that reflects the vulnerability-assessment literature (Cutter, 1996; Metzger,
Leemans, & Schröter, 2005; Metzger & Schröter, 2006; Preston, et al., 2008; Preston & Stafford-
Smith, 2009; Schröter & ATEAM consortium, 2004; Smit & Wandel, 2006; Turner II, et al., 2003) and
as used in the IPCC Fourth Assessment Report 2007, which defines vulnerability as ‘the degree to
which a system is susceptible to, and unable to cope with, adverse effects of climate change’
(Intergovernmental Panel on Climate Change, 2007, p. 883). Vulnerability and its components are
shown in Error! Reference source not found..

6
Figure 1. Vulnerability and its components (Allen Consulting Group, 2005, p. ix)
1.2.2 Exposure
Exposure generally refers to the state and change in external stresses that a system is exposed to. In
the context of climate change, these are normally specific climate and other biophysical variables
(including their variability and frequency of extremes). The location of people and assets can also be
regarded as exposure (Intergovernmental Panel on Climate Change, 2007; Preston & Stafford-Smith,
2009).
1.2.3 Sensitivity
Sensitivity is the degree to which a system is affected, adversely or beneficially, by a given exposure
(Intergovernmental Panel on Climate Change, 2007). A system can be sensitive to direct (physical)
impacts (e.g. a given change in rainfall affects the water supply of a city) as well as indirect
(socioeconomic) impacts (e.g. age structure of a population influences the degree to which mortality
increases during a heatwave).
1.2.4 Adaptation
Adaptation is ‘the adjustment in natural or human systems in response to actual or expected climatic
stimuli or their effects, which moderates harm or exploits beneficial opportunities’
(Intergovernmental Panel on Climate Change, 2007, p. 869). Adaptation can be autonomous or
spontaneous (it is not necessarily a conscious response to observed climate changes and / or their
effects), or anticipatory or proactive (anticipating future changes and effects). The phrase ‘planned
adaptation’ is used when adaptation is the result of deliberate policy decisions to respond to climate
change (Intergovernmental Panel on Climate Change, 2007).
1.2.5 Adaptive capacity
Adaptive capacity describes the ability of a system to adapt to climate change—to moderate
potential damages, take opportunities, or cope with adverse impacts (Intergovernmental Panel on
Climate Change, 2007; Smit & Pilifosova, 2003).
Adaptive capacity includes
coping capacity (the ability to accept the impacts and recover back to the system state before the impact, but does not change the system’s exposure or sensitivity to reduce future impacts)

New Zealand Climate Change Research Institute
7
the ability to adapt (the change in a system’s exposure or sensitivity to reduce future impacts).
Both coping capacity and ability to adapt can change over time (because of socio-economic and
institutional change). However, coping capacity usually implies a return to a state before a
temporary shock. The ability to adapt does not assume that an original state should or can be
maintained, but that response to climate change leads to lasting changes somewhere within the
system (Adger, 2006; Eriksen & Kelly, 2007, p. 506; Turner II, et al., 2003; Yohe & Tol, 2002).
By showing the ‘ingredients’ of vulnerability, the model shown in Figure 1 represents a static
snapshot in time. It does not show interactions between components, nor the steps that can
increase or reduce vulnerability over time. Risks and their consequences are unlikely to increase
linearly with frequency and severity of extreme events, so a dynamic time component also matters.
The adaptive capacity of a household is also, at least in part, determined by the wider community’s
adaptive capacity. Correspondingly, the community relies somewhat on its regional or district
authority to enhance its adaptive capacity (Fankhauser, Smith, & Tol, 1999; Smit & Pilifosova, 2003).
Context matters.
1.2.6 Resilience
Resilience is defined as the ability of a system to absorb disturbances while retaining the same basic
structure, ways of functioning, and self-organisation (Intergovernmental Panel on Climate Change
2007). Successful adaptive capacity—through both autonomous and planned adaptation measures—
minimises vulnerability and creates resilient systems. Resilience is similar to coping capacity, but
differs in the important respect that coping capacity tends to refer to the ability to recover from
specific shocks to a state before this shock, whereas resilience is a more dynamic concept that
applies not only to recovery from specific shocks but to the ability to accommodate a broad range of
ongoing pressures.
Like vulnerability, it is useful be specific about who is resilient, over what time horizon, to which
effect of climate change, about which attribute of concern. The concept of resilience generally
implies a commitment to preserve society’s basic needs, rights, values, and essential functions in the
face of a changing climate and changing socio-economic pressures.
Vulnerability and resilience can combine in the following way. Concrete adaptation measures can
reduce vulnerability over time by reducing exposure (e.g. by installing flood defences or retreating
from the coastline), reducing sensitivity (e.g. by raising minimum floor levels, or installing air
conditioning), or enhancing adaptive capacity (e.g. by increasing people's income levels or social
networks). Vulnerability can only be described for a specific point in time, whereas adaptation aims
to reduce vulnerability over time and to increase resilience.
Therefore, resilience can be understood as the end-goal of adaptation measures, whereas
vulnerability assessments provide time-bound information regarding the most effective options for
interventions to reduce vulnerability and increase resilience.

8
1.2.7 Flood-risk management
The legacy of past decisions affects today’s choice of approaches
When managing flood risk, generally the legacy of past decisions (e.g. location of existing
settlements and protection measures) affects today’s choice of approaches and these will in turn
affect the pathways taken by future generations. The Intergovernmental Panel on Climate Change’s
(IPCC) Fourth Assessment Report noted that, as well as the magnitude of biophysical changes, socio-
economic development pathways contribute to a community’s vulnerability to climate change
(Intergovernmental Panel on Climate Change, 2007).
The mutual interdependencies of social and technological systems can create development path
dependencies that lock in and constrain policy options
The mutual interdependencies of social and technological systems often create a development path
dependency that may eventually lock-in and constrain policy options (Arthur, 1989; David, 1985;
Gregory C. Unruh, 2000; G. C. Unruh & Carrillo-Hermosilla, 2006). Present decisions will partly
determine future generations’ choices and could widen or narrow their options. For example, if the
chosen flood-risk approach entails an institutional commitment to capital-intensive, large-scale and
long-lived infrastructural development, there is a danger that this will limit future choices, reducing
the portfolio of future adaptation options (O'Neill & Barnett, 2010). Thus, the temporal and spatial
scales are important when assessing adaptation options. Adaptation may be ineffective or even act
to increase vulnerability (maladaptation) (Burton, 1997; Intergovernmental Panel on Climate
Change, 2001; Scheraga & Grambsch, 1998; Smit, 1993). Substantial commitment from governments
and businesses may be required to break path dependency and to invoke transitions to new
approaches to address climate change for the future (Berkhout, 2002).
Much more attention needs to be given to maintaining reversibility and adaptability in
infrastructural development
In some countries, climate change is already putting pressure on infrastructure sectors and
triggering changes in how climate change is considered in technical assessments and public policies
(Geels, 2004, p. 914). Substantial, and potentially sudden, changes (including climatic changes and
extreme weather events that affect societies’ built environments and infrastructure) may create
windows of opportunity for new approaches to be considered (Geels, 2004). Such gradual or sudden
changes may be used to overcome the lock-in and structural inertia that allowed inferior
development paths to persist long after they should have been abandoned (Gregory C. Unruh, 2000;
Walker, 2000). The lesson for public policy is that ‘much more attention needs to be given to the
maintenance of reversibility and adaptability in infrastructural development’ (Walker, 2000, p. 833)
when addressing the future impacts of climate change in today’s decisions.
Applying these insights to flood-risk management may prove challenging in existing hard flood-
protection measures if there are sunk costs leading to pathways that lock in vulnerability and
exacerbate flood risk. In the worst case, the selected adaptation options may increase, rather than
decrease, future vulnerability.

New Zealand Climate Change Research Institute
9
Adaptive capacity can only be identified through research specific to place and culture
Adger (2003) demonstrated that adaptive capacity can only be identified through research specific
to place and culture. Moser and Ekstrom (2010) highlight the interconnected structural elements
that provide the wider context within which adaptation decision making takes place. Recognising
these structural elements—the actors, the governance regime in which they operate, and the
system exposed to climate change—can help identify barriers to adaptation. These structural
elements provide the backdrop for the present New Zealand case study. This case study adds to the
growing number of place-based adaptation studies in developed countries, and within the specific
institutional arrangements and professional practices that operate in New Zealand.
1.3 Case study background
The Hutt River flows in the southern North Island of New Zealand over a course of 54km with a
catchment area of 655km2 (Wellington Regional Council, 2001). The Valley is 4.5km at its widest
point at Petone Harbour (Adams, Berrill, Davis, & Taber, 2000; Boon, Perrin, Dellow, Dissen, &
Lukovic, 2011) and land use changes markedly from the upper to the lower reaches of the river.
While regenerating native forests and some exotic plantations cover the upper valley; urbanised
areas of residential, industrial, and commercial development dominate the lower floodplain.
More than 150 years of European settlement in this area led to urbanisation with the associated
intense modification of the valley floor and hill-slope environment. Controlling flooding has been,
and continues to be, essential for developing the Hutt River floodplain (Wellington Regional Council,
1991). Today, about 130,000 people live in the Valley, mostly on its floodplain (Wellington Regional
Council, 2001) , protected by one of the largest flood-protection schemes in New Zealand (Greater
Wellington Regional Council, 2009).

10
Figure 2. The Hutt River, Wellington Harbour, and beyond, from Manor Park (WRC, 2001, p. 2, 2)

New Zealand Climate Change Research Institute
11
1.3.1 Institutional context
In New Zealand, flood-risk management is devolved to the local government level represented by a
two-tier structure of regional councils and territorial authorities (city and district councils) within
their borders. Central government provides technical guidance documents on flood risk and has the
statutory ability to create national policy statements (NPS) and set national environmental standards
(NES) although there are currently none pertaining to flood risk. Civil defence and emergency
management is administered by central government with local roles designated as part of a national
emergency management strategy. There is no one statute that sets out the objectives and functions
associated with flood-risk management in New Zealand. The key statutes setting out the roles and
responsibilities for flood-risk management are the Land Drainage Act 1908, the Soil Conservation
and Rivers Control Act 1941, the Resource Management Act 1991 (RMA), the Local Government Act
2002, the Local Government (Rating) Act 2002, the Civil Defence and Emergency Management Act
2002 and the Building Act 2004 (Ministry for the Environment, 2008). These statutes have evolved
over time in response to different community and political drivers and operate in parallel, not always
well-aligned in practice (Lawrence & Allan, 2009).
Local government has a range of instruments within these statutes that can be used for flood-risk
management. For example, long-term plans (LTP) 3 can set out long-term investment targets based
on detailed asset-management plans for infrastructure and flood-management plans.
Responsibilities under the emergency-management legislation enable councils to develop lifelines
plans and to instigate flood warning and evacuation plans. The Hutt area has developed
sophisticated digital warning systems for emergency management, which coordinate action across
the region. The regional and district plans can instigate rules for land-use activities in areas subject
to hazards and can provide information to property owners that identifies hazard exposure and
sensitivity. The extent to which the full range of measures in these statutes are used is explored as
part of this research
This case study is located within the Greater Wellington Region, which comprises four cities and four
district councils. The study focuses on the Hutt City Council area. The Hutt River Floodplain
Management Plan (HRFPMP), issued by the Regional Council in 2001, was developed after wide
community consultation and is a non-statutory blueprint for the next 40 years with review intervals
scheduled every 10 years, or earlier ‘if the flood hazard is significantly altered by flooding,
earthquakes or new information’ (Wellington Regional Council, 2001, p. 161). The HRFPMP outlines
plans to upgrade the Hutt River stopbank system from a 1900 cumec standard (a 1:100-year flood),
to a 2300 cumec standard (an historical 1:440-year flood) over the following 40 years. The 2300
cumec standard is considered to provide a buffer that accounts for future increases in flood
frequency associated with climate change at a reasonable cost.
3 Long-term plans are the key strategic documents for local government in New Zealand.

12
1.3.2 Decision outcomes to date
Having historically experienced recurrent flooding (Wellington Regional Council, 1991), the response
so far has been in the form of hard measures; such as building stopbanks, straightening the river
channel, and excavating substantial quantities of gravel to improve the river’s flood capacity. These
combined measures led to progressively building a flood-defence system intended to keep flood
waters away from people, rather than keeping people away from flood waters (Wellington Regional
Council, 2001). The plan has been progressively updated based on flood experience in the valley
over time following flood events. It is regarded as a living document and updates are made only
after significant changes in assumptions. The extent to which climate change assumptions have
changed is still an open question, largely determined by the available information on changing
climate risk. This research is the first time that this question has been explored.
The prevalence of structural measures to alleviate flood risk reflects the legacy of rivers’ control
legislation in New Zealand and the supporting institutions and funding arrangements4. Structural
measures are also easier to quantify and cost compared with soft or non-structural measures
(behavioural and planning measures) (Agrawala & Fankhauser, 2008). As decision makers are
concerned about the economic impacts and costs of their adaptation decisions (Callaway, 2004),
they may be inclined to favour structural over non-structural measures. Such an emphasis can result
in inappropriate and costly adaptation actions that disregard the vital role of non-structural
measures in facilitating adaptation (Agrawala & Fankhauser, 2008). Among the non-structural
measures, land-use planning in particular has been identified as having much unused potential for
reducing the from natural hazards risk to communities in New Zealand (B. C. Glavovic, W. S. A.
Saunders, & J. S. Becker, 2010). However, there are barriers to implementing land-use planning
related to the institutional inertia brought about by the historical legacy of existing settlement
location, the pressures from those arguing protection of property rights, and the long-term potential
inflexibility of existing adaptation approaches.
4 The Soil Conservation and Rivers’ Control Act of 1941 has a heavy emphasis on engineering works and was
supported by government subsidies for their construction up until the early 1990s.

New Zealand Climate Change Research Institute
13
2 Study 1: Biophysical impacts of climate change
2.1 Methodology
To investigate the first two research questions (see page 11), the researchers modelled changes in
the frequency of Hutt River floods and the potential impacts of a range of flood events. The analysis
methodology used for modelling changes in flood frequency is detailed further in Ballinger, Jackson
et al. (2011) ‘The potential effects of climate change on flood frequency in the Hutt River’.
Inundation modelling is explained fully in Ballinger, Jackson et al. (2010) ‘Potential flooding and
inundation on the Hutt River’. (These reports are both available on the CCRI website.)
The modelling was undertaken to illustrate a risk-based approach to decision making under climate
change. It is not intended to serve specific planning purposes; rather, the study is used to show how
decision makers can use such an approach to look at future adaptation options at a strategic level,
taking multiple sources of uncertainty into account. A risk framework and the use of multiple
downscaled climate models, emissions scenarios, and inundation scenarios are the key elements of
this approach. Within a risk framework, researchers assess both the impacts and the probabilities of
the full range of potential flood events. In the context of significant uncertainties, such information
has much greater potential utility for decision-makers than a single or small number of scenarios
that do not consider likelihood or the full range of potential changes and events.
Caveats to the methodology adopted for this study are set out in Appendix 1. In summary, the study
lacks specific modelling of stopbank overtopping; uses limited velocity assumptions, and 1-hour
design floods5, to model impacts, which could result in overestimates in particular of flood velocities;
and did not consider flood risks associated with the Hutt River above Stokes Valley, stormwater, or
minor streams.
Assessing potential changes in flood frequency through to the 2090s required:
selecting four emissions scenarios and 12 climate models used by the National Institute of Water and Atmospheric Research of New Zealand (NIWA), to establish a range of 48 future climates
downscaling these climate models to derive rainfall changes in the Hutt river catchment
running adjusted rainfall data through the TopNet hydrological model, calibrated to the Hutt River (Hoffman 2011).
5 Design floods are hypothetical floods used for planning and floodplain management. The ‘design flood standard’ refers to the flood magnitude that a structural measure has been constructed to withstand. The HRFPMP sets a design flood standard of 2300 cumecs for the majority of stop banks along the urban extent of the Hutt River (Wellington Regional Council, 2001). Design floods are also defined by their probability of occurrence expressed either as annual exceedance probability (AEP; e.g. 2 percent AEP) or annual return interval (ARI; e.g. 1:50-year flood), although these definitions can be problematic in practice (see §4.3 Flood risk communication).
In this instance, the hydrological modelling used 1-hour flood peaks. In reality, flood peaks are typically sustained for less than an hour. This could result in modelling overestimates, particularly of flood velocity.

14
2.1.1 Selecting emissions scenarios and climate models
Incomplete knowledge of the global climate system and an unknown quantity of future greenhouse
gas emissions are the two main sources of climate change forecasting uncertainty (Hayward 2008).
Global climate models can simulate changes in the historical observed climate reasonably accurately
(IPCC 2007), but differences in model construction mean that they give different results when run
under the same emissions scenario. In addition, the amount of future GHG emissions is not
knowable. Depending on time constraints, resources, and project objectives; some studies use only a
single climate model and / or single emissions scenario to project future climate state(s). While this
kind of information is of value to researchers wishing to investigate the interactions of particular
factors, knowledge of a single or small number of possible future climates may have less utility for
decision makers than knowledge of the full range of possible futures expressed in a probabilistic risk
framework (Jones 2001).
For this reason, the researchers used results from the 12 global climate models selected by NIWA as
having demonstrated sufficient skill in reproducing observed climate patterns in the south-west
Pacific region (MfE 2008). The researchers selected three Special Report of Emissions Scenarios
(SRES) emissions scenarios (A2, A1B, and B1) and scaled the results for the B1 emissions scenario to
2 degrees global average warming to infer local climate changes based on the B1 pattern) (Error!
eference source not found.) to reflect the full range of uncertainties for illustrative purposes.
Figure 3. Global CO2 emissions scenarios. Historical CO2 data from Boden, Marland et al. (2011) and Houghton (2008). The 2°C stabilisation scenario has net negative emissions from 2100 due to large amounts of reforestation and is from Meinshausen (2005)
6. The three SRES scenarios are from IPCC (2000).
6 Meinhausen (2005.) uses a probabilistic framework for analysing emissions scenarios and considers this scenario to have a 75 percent probability of stabilising global mean temperature below 2°C above pre-industrial.
-5
0
5
10
15
20
25
30
1850 1900 1950 2000 2050 2100
PgC
/ye
ar
Historical
A2
A1B
B1
2°C

New Zealand Climate Change Research Institute
15
2.1.2 Downscaling the models to the Hutt River rainfall distributions
The future climate scenarios were used to perturb historical Hutt Valley rainfall data and generate a
range of future rainfall intensity and frequency scenarios consistent with the climate models and the
observed local climate. Details on this procedure can be found in MfE (2010, p71) and Ballinger,
Jackson et al. (2011, p22).
2.1.3 Running adjusted rainfall data through the TopNet hydrological model
The researchers used the hydrological model TopNet, supplied by NIWA and calibrated to the Hutt
River catchment (Ibbitt and Woods, pers. comm.). Two TopNet calibrations were attempted with the
first calibration becoming the basis for estimating flood frequency changes. A revised TopNet
calibration was attempted that gave slightly better representation of observed flows at some key
stations, but the derived changes in flood frequency using this revised calibration were almost
identical to those derived using the original calibration. Hence, one can conclude that the modelled
relative changes in flood volumes and flood frequencies are reasonably robust despite TopNet’s
limitations in reproducing specific observed flows at some locations.
The TopNet hydrological model simulates river flows based on observed historical rainfall data. This
model was run with current climate conditions to ensure that the hydrological model could
sufficiently reproduce observed river flows and flood statistics. TopNet was then re-run with the 48
perturbed rainfall scenarios to produce future flood frequencies and intensities under the range of
different emissions scenarios and climate models.
Inundation was modelled with two scenarios, one with current stopbank specifications, and one with
all stopbanks improved to contain floods of 2300 cumecs, using prescribed 1-hour flood volumes.
River flows and associated flood frequencies were calculated from these results and are shown in
the next section. For more details, including corrections applied to account for imperfect modelling
of historical flood volumes and frequencies, see Ballinger, Jackson et al. (2011).
2.2 Flood frequency results
Flooding is generally projected to become more frequent in the Hutt Valley and degrade the flood-
protection standards of existing and planned stopbanks, with a large range of uncertainty
Based on river flow data from 1972 to 2008, the 100-year flood for this period is estimated to be
about 2000 cumecs at the Taita Gorge. While the HRFPMP considers a 1900 cumec flood to
represent the ‘current’ flood risk, this figure has been calculated from 1840–1998 river-flow data
(Pearson & McKerchar, 1999) and should more accurately be considered the historical 100-year
flood for this period. The ‘current’ (2011) 100-year flood risk is unknown, but is presumably slightly
higher than 2000 cumecs due to ongoing climate change as the following results demonstrate. Error!
eference source not found. (next page) shows the changes in flood frequencies for two different
emissions scenarios. The upper panel shows a highly optimistic scenario where global emissions are
reduced rapidly so that the increase in global average temperatures is limited to 2°C relative to pre-
industrial levels by 2100. The lower panel shows a scenario where emissions continue to increase
throughout the twenty-first century, resulting in global warming of about 4°C by 2100 relative to
pre-industrial conditions (A2 scenario in Figure 3). Under these future climate scenarios, the peak
volume of the flow of the 100-year flood would increase to between 2300 cumecs (2°C scenario) and

16
2600 cumecs (A2 scenario) by the end of the twenty-first century as a best estimate across 12
different climate models.
These changes in flood volume can also be expressed as changes in the return period for a given
volume flood. Based on the average of the models, for the highest emissions scenario, a 100-year
flood would become roughly a 20-year flood by 2100, while the most optimistic emissions scenario
would see the 100-year flood to roughly double in frequency to become a 40–50-year flood.
Considering the entire range of all 12 models, the potential changes for the optimistic-emissions
scenario (based on currently available climate models) could be negligible, but even a 5-fold increase
in flood frequencies cannot be ruled out, based on the climate model that simulates the greatest
amount of warming and associated increase in heavy rainfall events. For the high-emissions
scenario, the minimum change based on current models would be roughly a doubling of flood
frequencies.

New Zealand Climate Change Research Institute
17
Figure 4. Changes in flood frequencies under different emissions scenarios. The black diamonds and line show present-day flood volumes and their estimated return periods. The purple dots show model average future flood volumes and return periods under two different emissions scenarios (upper panel: rapid global emissions reductions—2°C scenario; lower panel: continued global emissions increases—A2 scenario). The purple band shows the 10 to 90percent range across different climate models, and the light pink band shows the lowest and highest results across all models.
1 10 100 1000Return period (years)
1000
1500
2000
2500
3000
3500
4000
Mo
de
lled
pea
kflo
wbased
on
Top
Net
calib
ration
(cu
mecs)
highest to lowest model results
90 to 10%ile range
1 10 100 1000Return period (years)
1000
1500
2000
2500
3000
3500
4000
Mo
de
lled
pea
kflo
wbased
on
Top
Net
calib
ration
(cu
mecs)
highest to lowest model results
90 to 10%ile range

18
Error! Reference source not found. summarises the raw modelling results by showing a histogram of
he range of modelled future flood flow for the 100-year flood under current (1840–1998) and future
(2100) conditions for two different emissions scenarios, and for the full range of 12 different climate
models. All climate models and emission scenarios indicate an increase in flood frequencies, but the
range of possible changes is wide. For the low-emission scenario (upper panel), the volume of the
estimated future 100-year flood at the end of the twenty-first century could range from virtually no
change up to more than 2600 cumecs. For the high-emissions scenario (lower panel), the potential
range of changes runs from 2300 cumecs (currently estimated to be about a 440-year flood) to more
than 3000 cumecs. Error! Reference source not found. also shows the estimated 1972–2008 100-
year flood volume (black), and the mean future 100-year flood volume for the emissions scenario
(red).
Figure 5. Histogram of changes in the volume of a 100-year flood under the most optimistic (2°C scenario) for the set of 12 different climate models.
2000 2200 2400 2600 2800 3000 3200 3400 3600 3800Estimated 100-year return period flood volumes (cumecs)
0
0.1
0.2
0.3
Rela
tive
fre
qu
ency
Current estimated 100-year flood
Modelled future 100-year flood (average of 12 models, low emissions)
Modelled future 100-year flood(frequency distribution based on different models)

New Zealand Climate Change Research Institute
19
Figure 6. Histogram of changes in the volume of a 100-year flood under the highest emissions scenario (A2 scenario) for the set of 12 different climate models.
Using the ‘best-estimate’ scenario underestimates the real risk of more extreme events
Relying on a single model average or ‘best estimate’ figure can be highly misleading, as it covers up
the large range of uncertainty in both the emissions scenario and climate model range. Councils
need to consider the implications of not only the best estimate of projected climate change but also
the potential damages from catastrophic events because they could affect decisions being taken
now for assets and people at risk over the longer term. A decision-making process based on risk
would need to take the full range of potential future changes into account, rather than relying on a
single best estimate, even though such a single ‘line in the sand’ may be seen to be more robust.
Otherwise the extreme events, when most damages occur, would be significantly underestimated.
The HRFPMP does not give much regard to the potential for large future changes in flood
frequencies. Based on the results presented in this study, floods may have already become more
frequent in 30 years time when the plan is due to be completed.
2000 2200 2400 2600 2800 3000 3200 3400 3600 3800Estimated 100-year return period flood volumes (cumecs)
0
0.1
0.2
0.3R
ela
tive
fre
qu
ency
Current estimated 100-year flood
Modelled future 100-year flood (average of 12 models, high emissions)
Modelled future 100-year flood(frequency distribution based on different models)

20
2.3 Flooding and inundation on the Hutt River
Once river flow frequencies were projected, the next stage of the research attempted to determine
how a range of different river flow volumes would impact the lower Hutt Valley. Ballinger, Jackson et
al. (2010) modelled floodwater depths and velocities under two landform scenarios for a range of
flood volumes between 1500 and 3500 cumecs (measured at the Taita Gorge gauge), one scenario
with current stopbank specifications, and another scenario with all stopbanks improved to contain
floods of 2300 cumecs. For flood-volume scenarios with significant stopbank overtopping, the water
spilled into the flood plain from the Hutt River will more than fill all available depressions. Therefore,
the researchers also modelled the additional effects of inundation and increases in flow velocity
from large flood events that significantly exceed stopbank specifications (Ballinger, et al., 2010).
Figures 6 and 7 show modelled inundation under current stopbank specifications for 2300 and 2800
cumec floods respectively. Importantly, the stopbank upgrades set out in the HRFPMP cannot be
considered to provide a 1:440-year, or even a 1:100-year, level of protection over the long-term
(until 2100), because flood volumes above 2300 cumecs are projected to become significantly more
frequent even under low-emissions assumptions (previous section). However, the Hutt Valley
floodplain is notably flat and drains to the sea across its lower reaches, meaning that the blue areas
at a higher risk from flooding are essentially topographical depressions where floodwater pools.
These areas may be some distance from the Hutt River itself, but, in the event of an upstream
stopbank overtopping or breaching, can still suffer significant flood damage from floodwater
pooling. Such floodplain features limit inundation depth and resulting flood damage in other areas.

New Zealand Climate Change Research Institute
21
Figure 7. Inundation of the Hutt Valley from the 2300 cumec flood. Areas flooded where the depth was less than 0.01m are not shown (Ballinger, et al., 2010).
FOR ILLUSTRATIVE PURPOSES ONLY

22
Figure 8. Inundation of the Hutt Valley from the 2800 cumec flood. Areas flooded where the depth was less than 0.01m are not shown (Ballinger, et al., 2010).
FOR ILLUSTRATIVE PURPOSES ONLY

New Zealand Climate Change Research Institute
23
3 Study 2: Socio-economic impacts
3.1 Methodology
Three methods were used to assess the potential socio-economic impacts of floods:
a flood-damage model, RiskScape
an investigation into the socio-economic and demographic composition of the Hutt Valley
a flood-impacts survey of households, focusing on the recent 2004 flood.
All of these methods used current available data and the researchers did not attempted to project
socio-economic changes into the future. Unlike biophysical changes, where using multiple models
and emissions scenarios can at least partially manage uncertainties, it was not possible within the
scope of this research and the available data to demarcate future socio-economic uncertainty in a
similar fashion.
In addition, an understanding of current socio-economic sensitivities may have greater relevance to
operational policy-making and its implementation. However, this introduces a degree of
inconsistency, as the conceptual model of vulnerability uses a combination of exposure, sensitivity,
and adaptive capacity at comparable points in time. The lack of robust quantitative information
about future socio-economic development limits the use of the vulnerability model for
understanding future socio-economic vulnerability. The conceptual approach in this study is
generally more relevant to understanding current socio-economic vulnerability and possible
adaptation pathways that take the present socio-economic conditions as their starting point, rather
than a focus on a specific future point in time.
Caveats to the study’s methodology are set out in Appendix 1 but are summarised briefly here. The
RiskScape damage-cost model uses 1-hour design floods and assumes floods occur in the daytime
(which results in greater damage to vehicles in car parks along the river). These assumptions could
result in damage overestimates. The flood impacts survey has comparability and representativeness
issues for income and between those who had experienced flooding and those who had not, sample-
size issues for previous flood experience, missing responses for some questions, and some
respondents’ knowledge of adaptation options could have influenced their responses. Despite these
limitations, the research results can be used to give an indicative illustration of the types of socio-
economic impacts in the Hutt Valley.

24
3.2 RiskScape damage model
Flood impacts increase more sharply beyond 2300 cumecs as increasing flood volumes damage
more properties at greater depths
RiskScape is a flood-damage model developed by GNS Science and NIWA (Schmidt, et al., 2011).
RiskScape contains an asset database of all known buildings and their construction type (e.g. type of
cladding, floor level, etc.) The researchers ran RiskScape with the inundation model outputs to
generate damage-cost estimates based on a given flood depth, velocity, and duration; and the
fragility of construction type of affected buildings. RiskScape also generates estimates of damage to
vehicles, building contents, clean-up costs, and indirect costs of economic disruption. These
damages can then be expressed in aggregate form for the entire modelled area, and also spatially on
a meshblock basis. Necessary generalisations mean that aggregate results are more robust than
results for individual meshblocks or assets, and estimated damages should only be used for
conceptual purposes to understand the range of potential changes possible under various climate
change scenarios, rather than predictions of specific damages for specific flood events.
Error! Reference source not found. presents the aggregated damage-cost estimates from the
iskScape model for the range of flood volumes (1900–3500 cumecs). These estimates are presented
only to illustrate how damages can increase sharply beyond certain thresholds (e.g. 2300 cumecs)
and specific figures should not be used for technical or planning purposes. While the probability of
extreme scenarios may be low, in a risk-based approach planners will need to take the potentially
significant impacts of extreme scenarios into account, especially for decisions that have lasting
effects such as intensifying infrastructure and development in floodplain areas.
Figure 9. Aggregated damage cost estimates.

New Zealand Climate Change Research Institute
25
Error! Reference source not found. shows the spatial distribution of damage-cost estimates by
eshblocks for the 2300 and 2800 cumec scenarios. In the 2300 scenario, most of the damage is
concentrated near the eastern bank between the White Line East area and the Ewen Bridge (yellow
circles). Damages reach approximately $500,000 dollars in the Hutt Valley High School meshblock.
Petone CBD is flooded (see Error! Reference source not found.), but inundation is not deep enough
o cause significant direct damage. In the 2800 scenario, an increase in inundation depth intensifies
damage on the eastern bank and expands the damaged areas to include large parts of Petone CBD
(pink circles).
Figure 10. Spatial distribution of direct-damage costs of 2300 and 2800 cumec floods. Circles are centred over meshblocks and proportionate to RiskScape cost estimates for that meshblock. The largest circles are approximately $3 million dollars.

26
3.3 Social vulnerability
Flood impacts can have a disproportional impact on different societal groups
Flood impacts can have a disproportionate impact on some households or individuals depending on
socio-economic or demographic vulnerability. For example, disabled and elderly people may have
difficulty evacuating. New immigrants may have no previous experience with floods, limiting their
perception of risks, emergency preparation, and possible responses. The researchers examined the
spatial distribution of potentially relevant socio-economic factors such as the proportion of elderly,
children, and median-income households in the Hutt Valley floodplain.
Socio-economic factors can influence a community’s capacity to anticipate risk and adapt to
increased flood risk; and to cope with, and recover from, floods when they occur (Adger & Vincent,
2005; Fekete, 2009; Posey, 2009). While a relationship between socio-economic factors and flood
vulnerability is well established in principle, it is much more difficult to establish a quantitative
relationship between a given factor (e.g. the proportion of the population with a disability) and a
proportionate increase in vulnerability in a particular location (Hinkel, 2011). Specific measures of
adaptive capacity are difficult to determine from socio-economic data, since adaptive capacity is
more often associated with qualitative institutional arrangements rather than socio-economic
characteristics (Pahl-Wostl, 2009). Nevertheless, some flood-impact studies have found that a
number of socio-economic and demographic factors are correlated with an increased likelihood of
evacuation, injury, and mortality (Fekete, 2009) and with proxy measures of adaptive capacity
(Posey, 2009).
The four most noted vulnerability factors in the literature can be associated with coping capacity
rather than adaptive capacity: elderly population, low income, overcrowding, and living in rental
accommodation (Khan 2011). Physically frail elderly may have difficulty evacuating unassisted. The
latter three factors are associated with less emergency preparation and poorer-quality housing.
Flood survey results did not indicate significant relationships between these factors and impacts
from the 2004 flood (discussed below). However, this does not mean that these and other factors
are unimportant to future floods of potentially larger magnitude (Khan, 2010).
Error! Reference source not found. depicts the age structure and population density of the study
rea and provides a visual guide to the ratio between those who may require physical assistance to
evacuate and able-bodied adults. Groups of five people above 65 years or older are depicted as red
dots, 15–64 years of age as green dots, and 0–14 years as orange dots. Note the concentration of
elderly people near the Waititi Crescent area in the middle of the map and of both the elderly and
children in the Connolly Street area in the north-eastern corner. Both areas are close to the Hutt
River and have retirement homes (as well as an early childcare centre on Connolly Street). Such
information is perhaps more useful to emergency-response planning, but as an area’s socio-
economic and demographic characteristics can persist over the medium-term it is likely to have
broader relevance to flood risk reduction measures (Khan 2010).
New Zealand Climate Change Research Institute
27
Figure 11. Hutt Valley age structure and population density. One dot equals five people. Data are from the 2006 census (StatsNZ 2006).

28
3.4 Flood-impacts survey
A July 2010 postal survey of households investigated whether the 2004 Hutt Valley floods (or any
other floods experienced since then) have had any long-lasting effects on individuals or the
community, how residents have responded to flood risk, and how views on how future flood risk
associated with climate change should be managed. Nine hundred and ninety-six questionnaires
were sent out and 189 returned (19 percent return rate). 28.3 percent of respondents (52 people)
had experienced flooding in the Hutt Valley or elsewhere and 71.7 percent had not (132 people).
Figure 1: Flooded houses on Riverside Drive in the 2004 flood (Civil Defense NZ, 2011).
Past experience of floods affects residents’ behaviour and willingness for flood protection
Flood impacts from the2004 flood were associated with flooding of the Waiwhetu stream7 (Figure
11). The flood-impacts survey found weak relationships between impacts of the 2004 flood and
respondent ethnicity and household composition. Māori and Pacific Islanders were proportionally
more likely to have experienced a flood than other ethnicities. Ten out of 17 Māori (59 percent), five
out of seven Pacific Islanders (71 percent), and four out of seven responding single-parent
households (57 percent) were affected by floods, compared to 55 out of 190 (29 percent)
households in the entire sample, although in these cases the sample size is not large enough to draw
strong conclusions. Nine households suffered permanent damage or lost items. Twelve households
reported that their insurance premiums had increased since the 2004 flood. Thirteen households
7 The Hutt river flow peaked at 1067 cumecs at Taita Gorge on the Hutt River—a 1:5-year flood, based on the
historical climate.

New Zealand Climate Change Research Institute
29
considered themselves financially worse off since the flood (only three of whom reported increased
premiums), mainly because they had to rebuild or replace items and / or because council rates went
up after the flood event to cover increased flood-mitigation expenses. One respondent was still
suffering from a past flooding experience and recorded an ongoing injury of psychological nature
(undiagnosed depression). Flood-affected residents were somewhat more likely to take preparatory
measures. While statistical significance is reached, the practical significance of these differences is
rather low. That is, there is a significant but not strong association as only a small to moderate
amount of the variance in preparedness can be explained by flooding experience (see details in
Quade and Lawrence 2011, available on the CCRI website). Affected residents were more likely to
seek out flood hazard information, communicate with their local council about how to reduce flood
risk in their area, raise the floor levels of their houses, and keep ditches and drains clear of debris.
Flood impacts can include difficult-to-quantify psychological aspects such as depression and
ongoing anxiety
Subsequent interviews with flood-affected-residents revealed ongoing anxiety in some individuals
whenever it rains heavily. Affected residents had, in some instances, gone to considerable lengths to
protect properties—such as purchasing sandbags, planting trees, and reducing impervious surfaces.
There was also evidence that the ownership patterns in flood-prone areas had changed since the
flood. Some permanent residents had moved out, changing the area to predominantly rental
accommodation. Renters have less incentive to take property-protecting measures and this
potentially counteracts the behaviour changes made by the flood-affected residents who remained.
Residents’ perceptions of flood-risk management and communication are discussed in section 4.2
below.


New Zealand Climate Change Research Institute
31
4 Study 3: Adaptation barriers and opportunities
The researchers wished to determine the extent to which the current regulatory framework, as well
as decision-making practice, is able to address current flood risk and future increases in flood risk
associated with climate change in the Hutt Valley; and to identify the barriers and opportunities for
improving institutional adaptive capacity. The researchers conducted individual interviews and
hosted a workshop with local-government advisers. Participants came from a range of councils in the
Wellington region: Greater Wellington Regional Council, Hutt City Council, Wellington City Council,
and Kapiti Coast District Council. The workshop included managers, staff, and consultants from rivers
control, planning, asset management, hazards management, civil defence, and strategy roles within
these councils. Findings were also complemented by the flood-impacts survey of households and
respondents’ perceptions of future risk from climate change impacts, actions taken as a result of
flooding, and perceptions of institutional responsibility for risk management.
4.1 Local-government workshop and interviews
Leadership on risk issues often emerges only after significantly damaging events. Future flood
events will present opportunities to review current practices, learn from mistakes, and institute
more adaptive and resilient practices.
4.1.1 Overview
In general, adaptation approaches varied across councils. Some were making significant strategic
headway having mapped inundation and developed strategies to address climate change impacts,
(e.g. building design, and retreat from sea-level rise). However, current approaches for managing
flood risk (including for stormwater management) do not satisfactorily address current levels of
flood risk. Participants reported tensions between district, regional, and central government
responsibilities. For example, councils commented that a NPS on flood risk that took climate change
into account, and / or other statutory support would strengthen decision-making at a local level by
providing a consistent direction that could stand up to pressures when they are challenged in the
courts by those wishing to develop land. District councils also wanted clearer rules in the regional
planning documents to strengthen their own rule making; while regional councils saw rule making
that affects residents as largely a district council responsibility.
Structural protection in the form of stopbanks and pumping is the dominant adaptation response
used in the Hutt Valley and involves a combination of community input, a focus on costs, and
support by emergency management to address residual risk as it occurs. Non-structural measures
are weakly developed.

32
Current planning does not account for increased frequency and intensity of future floods
More importantly, the current approach to flood-risk planning does not take projected increased
frequency and intensity of floods into account. This is in the context that a flood greater than 2300
cumecs is more likely than not to occur before 2100 under a low-emissions scenario, and virtually
certain to occur under a high-emissions scenario.
The Hutt Valley is a narrow, well-developed floodplain. This does not give local government much
scope for adaptation through land-use restrictions such as limiting infill development where it could
increase future flood damages, phasing out activities in flood-prone areas, designing flood levels
with climate change effects on flooding taken into account, or relocating some buildings.
Historically, extreme events have driven change in regimes managing flood risk. The floods of 1976
and 2004 triggered shifts in the Hutt’s flood-risk management to a more comprehensive catchment
approach. Such responses to flood events may also provide a window of opportunity for considering
a wider range of adaptation options for vulnerable communities and to have these reflected in
regional and district plans, asset management plans, and emergency management in an integrated
way.
4.1.2 Council adaptation decisions
One district council is currently upgrading stormwater capacity from 1:5-year to a 1:20–1:50-year
standard over an at least 20-year period—well behind what will be required even to keep up with
current flood risk.
The current stopbank standard of 2300 cumecs, as set by the HRFPMP for the central Lower Hutt
area, is described as a 1:440-year level of flood protection. Some council respondents thought that
the 1:440-year flood standard left the protected developed area ‘risk free’ based on development
and population scenarios at the time of the revised flood plan but without considering climate
change impacts over the life of the scheme. Residual risks in these areas were considered to be an
emergency-management issue, rather than planning issues. A 1:440-year flood standard was locally
considered to be an advanced level of protection, but does not compare so well internationally. For
example, the Netherlands has a series of standards up to 1:10,000 years (Jonkman, Brinkhuis-Jak, &
Kok, 2004).
The HRFPMP triggered a Hutt City Council district plan change which prohibits buildings in which
people are likely to congregate (clubrooms etc.) within the 1:100-year flood extent, and requires
proposed buildings with a gross floor area ≥20m2 in these areas to have floor levels above 1:100-
year flood level (Hutt City Council, 2006). However, it was confirmed that climate change had not yet
been factored into these provisions and that structural works were still relied upon to mitigate risk
and emergency management to deal with residual risk during and after a flood event.

New Zealand Climate Change Research Institute
33
4.1.3 Where alternatives have been considered
A number of practices can improve adaptive capacity. Pooling resources, improving access to
LIDAR, using aerial photos of past floods, and the LTP process are examples of opportunities for
improved assessment and communication of climate change and flood risks.
Participants noted how the LTP process has provided a regular opportunity for increasing their
understanding of climate change and its impacts and their awareness of the future consequences of
not addressing climate change risks now. Council advisers reported that using aerial photographs of
past floods was an effective and visceral way of communicating flood risk, particularly to new
residents with no experience of flooding. Council advisers also recommended improving councils’
access to LIDAR8.
Councils can provide a strategic framework—such as a sustainability approach—to inform
understanding of long-term issues and the nature of dynamic change in climate. However, this
requires strong leadership over time, as demonstrated by the Kapiti Coast District Council where at
least 10 years of community conversations on sustainable futures has enabled managed retreat from
coastal hazards to be at least discussed with the community.
To accelerate the consideration of climate change, councils could reframe climate change risks by
integrating the risks across council functions. This could be done by using approaches such as
integrated catchment management planning, asset management plans, and by taking consistent
approaches that consider long-term dynamic climate changes in benefit-cost assessments, scenarios,
and extremes. However, there is an in-built bias in the benefit-cost approach as lower-value areas
have lower benefit to cost ratios. This indicates that vulnerability assessments to complement
benefit-cost assessments are needed.
4.1.4 Barriers to decision making
The uncertainty of climate change projections collides with councils’ expressed need for ‘robust’
or definitive planning guidance
Another tension that emerged was between an expressed need for more definitive information to
inform (and defend) flood protection design standards and the inherently uncertain nature of long-
term climate projections. This tension may require changes in the handling of future, uncertain,
dynamic risk manifest in increased flood frequency, through the analytical frameworks used, and the
nature of rules developed to address such risk through the governance system. These rules could
use triggers based on time, event, or damage level to review and apply a range of new adaptation
measures. These measures could include further restrictions on building and other land uses, retreat
from harm’s way, and restrictions on land-use activities in the upper catchment.
8 LIDAR (Light Detection and Ranging) is a highly accurate method of mapping topographic features using airborne laser scanning. It is an optical remote-sensing technology and has a wide-range of applications as diverse as archaeology, geology, seismology, forestry, meteorology, and atmospheric physics. LIDAR instruments can operate from the ground, from aircraft, or from space (satellite based) (Campbell, 2007; Cracknell & Hayes, 2008; Weitkamp, 2005).

34
A lack of integration and strategic oversight within and between the different levels of
government can act as a barrier to adaptation
Participants noted several barriers to improved adaptation decision making; a lack of decision-
relevant information on risk and adaptation options, resource constraints, a lack of central
government leadership on climate change risks, the siloed organisational structure of larger councils,
and the under-resourcing of smaller councils. To date, it has been difficult for councils to integrate
climate change considerations into council decision making, largely because of the uncertainty in the
information and strong local pressures for development to intensify and expand into new areas. In
this context, applying non-structural planning measures that restrict land-use activities and their
intensification on the floodplain have been slow to develop. Information on the impacts of climate
change, if it exists at all, does not usually come in formats relevant to operational-level decisions for
local government. Often impacts information needs to be downscaled and expressed in long
timescales.
The consequence of these difficulties has been a perception that the HRFPMP is more than adequate
to protect the community from whatever the climate deals up. Long term, this means that
considering changing risk may be quite difficult to discuss across the community and the costs of
future damage will be borne by future generations and be more costly than if attention was given to
future risks now.
4.2 Hutt City residents’ perspectives of flood-risk management from the flood-impacts survey
In general, survey respondents perceived the Hutt City Council and regional councils, along with the
Earthquake Commission (EQC), as having high levels of preparedness for managing a damaging
flood, relative to their own communities or households. Flood-affected residents ranked their own
and central government preparedness slightly higher and the local councils’ and service providers’
preparedness slightly lower than unaffected residents. Respondents preferred measures to mitigate
the risk of floods to be managed and paid for collectively at the regional and local levels rather than
privately through insurance companies or individual households. Respondents would like to see
developments of flood-prone areas restricted, or at least a requirement for raised floor levels in new
houses, although some indicated that it was a personal responsibility to avoid the flood hazard in the
first place by not building in high-risk areas. However, the personal-responsibility view relies on
effective public understanding of flood risk and an effective flood risk communication strategy
(discussed below).
4.2.1 Preferred levels of flood risk and planning time horizons
Most respondents were not willing to accept more than a minimal (<0.5 percent annual) probability
of flooding in residential areas in any given year and preferred all houses to be protected to the
same level of risk. About one third would like to see protection levels to be differentiated by suburb
and 10 percent thought that flood protection should be up to each individual household. Forty
percent of respondents considered a planning time horizon of 50 years sufficient, while 29 percent
deemed a 100-year horizon more appropriate, and 11 percent favoured more than 100 years. No
significant differences were found between flood-affected and unaffected groups regarding
acceptable levels of flood risk and preferred planning time horizons in flood-risk management.

New Zealand Climate Change Research Institute
35
4.2.2 Knowledge of flood-risk exposure
More than half of the respondents had not seen a flood-hazard map for their community. More than
a third had, while 9 percent were unsure. Some respondents noted that flood-hazard maps and
information on the flood risk of particular properties were difficult to access and not routinely
supplied by councils.
More than half of participants did not know the level of risk they were exposed to. About a quarter
and a fifth of participants had ‘some idea’ or ‘reasonable knowledge’ of their risk exposure
respectively. Past flooding experience contributed to increased knowledge about one’s flood risk.
However, whether that knowledge is meaningful to people and translates into action may be
questionable, as shown by the following quote:
‘1:10yr level flood according to HCC [Hutt City Council] & GWRC [Greater Wellington Regional
Council] 2010. I don't know what exactly this means for my property and neither does HCC.’
This quote illustrates that providing factual information is necessary, but not sufficient in
circumstances where the ultimate aim is to enhance people’s ability to gauge the implications of
floods of various sizes and adjust their behaviour accordingly. It also raises the issue of whether the
information provided about flood risk is in a form that is meaningful to communities. There is also
evidence to suggest that using annual percentage or annual return interval (i.e. 1 in 100 year) flood
probability formats is fundamentally flawed for risk communication, as these formats predispose
people to cognitive biases and subsequent discounting of risk (discussed below) (Tegg & Lawrence,
in preparation-a).
4.2.3 Preferred flood risk mitigation measures
The majority of survey respondents preferred land-use planning approaches over structural
measures
Flood-affected and unaffected respondents ranked their preferred flood-risk mitigation measures in
a largely similar order. Improvements to the stormwater network were the most salient issue and
both groups were unequivocal that alleviating this problem would contribute a great deal to
reducing flood risks. This was followed by restrictions on new buildings and renovations in high-risk
areas; various structural measures, emergency response options, and modify and shift existing
buildings away from high-risk areas. The lowest ranked mitigation measure was ‘inaction on flood
risk and its increase due to climate change’. While flood-affected and unaffected groups showed
little differences in their relative preferences for the suggested measures for mitigating flood risk,
there were some significant differences in the strength of preference attached to the measures.
Flood-affected respondents had higher preference levels for restricting new buildings or renovations
in high-risk areas, modifying or shifting existing buildings away from high-risk areas, deepening river
channels, and improving the stormwater network than respondents who had not been affected by
flooding.

36
4.2.4 Preferred management responsibilities
The majority of survey respondents preferred flood risk to be managed and paid for at collective
local and regional levels.
Both flood-affected and unaffected groups ranked the suggested institutions in the same order,
assigning regional and city councils the highest responsibility, followed by central government,
individual households, and community groups. The ranking is indicative of a pattern from the
collective to the individual level. Only after public institutions (various levels of government) were
mentioned, was the private level (individual households and community groups) considered.
The flood-affected group expressed statistically significantly higher preferences for regional and city
councils to have responsibility compared with the unaffected group for both present and future
flood-risk management. The flood-affected also showed stronger preferences for central
government and community groups to take on greater responsibility in the future compared to
present levels.
4.3 Flood-risk communication
There are potentially fundamental problems with the way flood maps and average return interval
floods are used in practice
Both council respondents and surveyed residents had difficulties in understanding the magnitude of
potential risks, suggesting that there are fundamental issues with current risk-communication
media. Flood-risk professionals have criticised the annual exceedance probability and average return
interval concepts and derivative maps for many years (Pielke, 1999; US Department of the Army,
1992). One criticism is that design floods are calculated from historical data, which could be a highly
misleading practice for future planning in areas where climate change will affect flood frequencies
(Milly, et al., 2008). Another criticism is that the design flood concepts are frequently
misinterpreted. However, a lack of practical alternatives that account for both of these issues may
be constraining the improvement of flood-risk communication.
The experience of some flood-risk professionals suggests that using cumulative probabilities over
longer time periods (i.e. an equivalent 26percent chance over 30 years, the typical span of a
mortgage) to communicate risks is more effective (Ericksen, 2005), but by itself implies a level of
preciseness about which the public may be justifiably suspicious (Bell, 2004). Psychological research
into the framing effects of different probability formats confirms that subjects tend to discount the
risk of hazards when probabilities are expressed with a small relative numerator over short
timeframes (such as in the case of a ‘1:100-year flood’ or 1 percent annual flood’) compared to an
equivalent probability with a larger relative numerator over a longer timeframe (such as a
26 percent chance over 30 years) (Reyna, 2004; Stone, Yates, & Parker, 1994; Tegg & Lawrence, in
preparation-a).
Drawing on these insights and the risk-analysis methodology of Jones (2001), the New Zealand
Climate Change Research Institute has developed an alternative method for analysing and mapping
flood that avoids these framing effects. This method incorporates climate change modelling and
presents flood-risk information in a way that may be more meaningful to the public. Resulting flood
maps depict the broad likelihood of above-floor-level inundation in the floodplain for a particular

New Zealand Climate Change Research Institute
37
emissions scenario over long time periods. Figure 2 provides a preliminary example of this type of
map. Figure 12 depicts the likelihood of flooding over 0.6 metres (a typical floor height) between
2011 and 2100.
Maps of this type may be useful for decision makers tasked with evaluating the risk-reduction
benefits of different adaptation options and for communicating to the public. These issues, and
more detailed discussion of the method, is presented in Tegg and Lawrence (in preparation-b (a))
and Tegg and Lawrence (in preparation-b (b)) (these reports will be available on the CCRI website).

38
Figure 12. Figure 2: The probability that zones in the Hutt Valley will be inundated above 0.6m, assuming current stopbank specifications and low emissions (2°C GMT stabilisation / B1 scenario). The above map is based on preliminary results and does not include flooding associated with smaller tributaries and stormwater drainage. It is illustrative only and should not be used for planning purposes (Tegg & Lawrence, in preparation-b (b)).

New Zealand Climate Change Research Institute
39
5 Conclusion
This case study presents findings that can inform local government perceptions of:
the largely structural protection offered by current strategies managing flood risk
the adequacy of current structural-protection standards.
As a result of climate change, flood frequency and intensity are projected to increase over the
remainder of the century in the Hutt Valley and degrade the flood-protection standards of existing
and planned stopbanks. These changes highlight the need for a review of available risk-reduction
measures and their implementation, and the importance of national policy guidance integrated with
flood protection and planning policies and rules at the three levels of government. Error! Reference
ource not found. summarises the study’s key findings and relates them to the research questions.
The reported reassessments of flood-risk management in the Hutt Valley following major flood
events suggest that there may be windows of opportunity to review current flood-risk management
and develop new approaches to reduce long-term and changing risk.
A stronger connection between central and local government would provide stronger leadership and
a clear strategic framework. This would enable ongoing community conversations to support a
broader and more integrated approach to general hazard risks and climate change adaptation. These
factors appear to be necessary conditions for changing the way that future flood risks associated
with climate impacts are addressed, and hold potential for greater sharing of learning across councils
to quickly spread new approaches elsewhere in the region.
The case study identified how residual risks, especially at the extremes, could affect property and
people in the Hutt Valley. If planning for risk mitigation is based on ‘best estimates‘, it is likely to
significantly underestimate the potential damages in the future. The significance of this for decisions
taken today has been highlighted, especially for long-lived assets and settlements.
Socio-economic factors have implications for both spatial land-use planning, emergency
management, and for the egress of more vulnerable groups from flood-affected areas. Importantly,
those who have experienced risks have a heightened awareness of future flood risk. Some
respondents expressed ongoing frustration at delays in the implementation of the Waiwhetu stream
mitigation measures, due their perceived lack of political voice.
Councils have prioritised flood-risk management across the region. The Hutt Valley community
generally looks to councils to keep them safe. Survey respondents in the Hutt have a low tolerance
for flooding generally and are prepared to take individual actions in the face of changing flood risk,
but ultimately want councils to act responsibly and to spread the costs across the whole community
in an equitable manner.
The general understanding of flood-risk levels was low in the Hutt Valley and few people had seen
flood hazard maps. This raises issues of the best form of communication with communities about
flood risk and how it will increase over time. Respondents wanted councils to take greater
responsibility to inform communities about anticipated flood risks, with stronger guidance and
direction through a central government NPS. This NPS would ensure a consistent approach across

40
New Zealand and would act as the backstop that councils need to support their planning action in
event of legal challenge.
Several barriers related to information about flood risk were raised by respondents. There is
inconsistency in information bases and in some cases simply a lack of data. Each council is
attempting to address similar issues from its own resources, which are insufficient to get an
adequate assessment done across the region. It was suggested that councils pool funding to get
better cost efficiencies in collecting information about flood risk and that this could speed up the
assessment of climate change risks, e.g. future damage assessments would be more robust with
better access to LIDAR9. Cross-council resource pooling, with some assistance from central
government on a needs basis, was seen as a way of addressing these resourcing issues.
The predominant focus on the costs of flood-management investments, rather than benefits (i.e.
avoided damage) was another highlighted barrier to addressing long-term flood risk changes
associated with climate change. Some of the smaller councils lacked the resources to conduct
analyses and benefit-cost assessments that take account of the uncertainty of future impacts.
Council advisors also considered it crucial that councillors have confidence in the robustness of the
information on which they base their decisions, and that this confidence was often lacking. In part,
this may be due to the nature of climate change information. There is a lack of information on
climate change effects on flood risk, a lack of knowledge and experience with alternative options,
and a lack of experience with stakeholder and community-based evaluation of such options.
These barriers highlight the need for a more comprehensive approach to changes in flood risk across
New Zealand associated with climate change. Suggested requirements included financial and
technical support for better-quality risk assessments across regions, sharing experiences and
approaches across councils to build capacity, better communication of the risks associated with
climate change impacts and the options for addressing them, and further statutory support from
central government through instruments at its disposal e.g. NPS and NES.
9 Light Detection and Ranging—a highly accurate method of mapping topographic features using airborne laser
scanning.

New Zealand Climate Change Research Institute
41
Research questions
How will climate change affect the frequency and severity of flooding over the next century?
What are the impacts of a range of different flood events on the Hutt Valley community?
What socio-economic factors influence the community’s ability to adapt to flood risk; and to cope with, and recover from, flooding?
What social and institutional barriers constrain adaptation and what opportunities are present for improving adaptive capacity?
Key findings and themes
Flooding is generally projected to become more frequent in the Hutt Valley and degrade the flood-protection standards of existing and planned stopbanks, with a large range of uncertainty. §2.2
The uncertainty of climate change projections collides with councils’ expressed need for ‘robust’ or definitive planning guidance. Using the ‘best-estimate’ scenario underestimates the real risk of more extreme events. §2.2; §4.1
Flood impacts increase more sharply beyond 2300 cumecs as increasing flood volumes damage more properties at greater depths §0
Flood impacts can have a disproportional impact on different societal groups.§3.3; §3.4
Past experience of floods affects residents’ behaviour and willingness for flood protection. §3.4
Current planning does not account for increased frequency and intensity of future floods. §4.1
When councils do not communicate the nature of the flood risk this can reinforce maladaptive responses, especially when those people with the means and experience to cope with flooding move away and are replaced by new arrivals. §3.4; §4.2
Flood impacts can include difficult-to-quantify psychological aspects such as depression and ongoing anxiety. §3.4
There are potentially fundamental problems with the way flood maps and average return interval floods are used in practice. §4.3

42
Table 1. Key findings from the Hutt Valley case study
The majority of survey respondents preferred flood risk to be managed and paid for at collective local and regional levels, and preferred land use planning approaches over structural measures. §4.2
A lack of integration and strategic oversight within and between the different levels of government can act as a barrier to adaptation. §4.1
Leadership (or lack thereof) at both the central and local government levels can strongly influence the integration of climate change and long-term risk issues into council planning. §4.1
Leadership on risk issues often emerges only after significantly damaging events. Future flood events will present opportunities to review current practices, learn from mistakes, and institute more adaptive and resilient practices. §4.1
A number of practices can improve adaptive capacity. Pooling resources, improving access to LIDAR, using aerial photos of past floods, and the LTP process are examples of opportunities for improved assessment and communication of climate change and flood risks. §4.1

New Zealand Climate Change Research Institute
43
6 References
Adams, B. M., Berrill, J. B., Davis, R. O., & Taber, J. J. (2000). Modeling site effects in the Lower Hutt Valley, New Zeland. Paper presented at the 12th World Conference on Earthquake Engineering, Auckland, New Zealand.
Adger, W. N. (2006). Vulnerability. Global Environmental Change, 16(3), 268-281.
Adger, W. N., & Vincent, K. (2005). Uncertainty in adaptive capacity. Comptes Rendus Geosciences, 337(4), 399-410.
Agrawala, S., & Fankhauser, S. (2008). Economic aspects of adaptation to climate change: costs, benefits and policy instruments. Paris: OECD.
Allen Consulting Group. (2005). Climate change risk and vulnerability: Promoting an efficient adaptation response in Australia. Final report. Report to the Australian Greenhouse Office. Melbourne: Allen Consulting Group.
Arthur, W. B. (1989). Competing technologies, increasing returns, and lock-in by historical events. The Economic Journal, 99(394), 116-131.
Ballinger, J., Jackson, B., Pechlivanidis, I., & Ries, W. (2010). Potential flooding and inundation on the Hutt River. Wellington, NZ: School of Geography, the Environment, and Earth Sciences, Victoria University of Wellington.
Ballinger, J., Jackson, B., Stokes, K., & Reisinger, A. (2011). The potential effects of climate change on flood frequency in the Hutt River. Wellington, NZ: School of Geography, the Environment, and Earth Sciences, Victoria University of Wellington.
Bell, H. (2004). Efficient and Effective?: the hundred year flood in the communication and perception of flood risk. University of South Florida.
Berkhout, F. (2002). Technological regimes, path dependency and the environment. Global Environmental Change, 12(1), 1-4.
Boden, T. A., Marland, G., & Andres, R. J. (2011). Global, Regional, and National Fossil-Fuel CO2 Emissions (Publication no. doi 10.3334/CDIAC/00001_V2011 ). from Carbon Dioxide Information Analysis Center, Oak Ridge National Laboratory, U.S. Department of Energy, Oak Ridge, Tenn., U.S.A. :
Boon, D., Perrin, N. D., Dellow, G. D., Dissen, R. V., & Lukovic, B. (2011, 14-16 April). NZS1170.5:2004 Site Subsoil Classification of Lower Hutt. Paper presented at the Ninth Pacific Conference on Earthquake Engineering: Building an Earthquake-Resilient Society, Auckland, New Zealand.
Burton, I. (1997). Vulnerability and adaptive response in the context of climate and climate change. Climatic Change, 36(1), 185-196.
Callaway, J. M. (2004). Adaptation benefits and costs: are they important in the global policy picture and how can we estimate them? Global Environmental Change Part A, 14(3), 273-282.
Campbell, J. B. (2007). Introduction to remote sensing. New York: Guildford Press.
Civil Defense NZ. (2011). Photo Library, . Retrieved 1st June 2011, 2011, from http://www.civildefence.govt.nz/memwebsite.nsf/wpg_url/for-the-cdem-sector-photo-library-floods-2004-continued?opendocument
Cracknell, A. P., & Hayes, L. (2008). Introduction to remote sensing (2nd ed.). London: Taylor & Francis.

44
Cutter, S. L. (1996). Vulnerability to environmental hazards. Progress in Human Geography, 20(4), 529-539.
David, P. A. (1985). Clio and the Economics of QWERTY. The American Economic Review, 75(2), 332-337.
Ericksen, N. (2005, September 2005). Hang-ups in flood hazard planning (part 1). Planning Quarterly, 24-28.
Eriksen, S., & Kelly, P. M. (2007). Developing credible vulnerability indicators for climate adaptation policy assessment. Mitigation and Adaptation Strategies for Global Change, 12(4), 495-524.
Fankhauser, S., Smith, J. B., & Tol, R. S. J. (1999). Weathering climate change: some simple rules to guide adaptation decisions. Ecological Economics, 30(1), 67-78.
Fekete, A. (2009). Validation of a social vulnerability index in context to river-floods in Germany. Nat. Hazards Earth Syst. Sci., 9(2), 393-403.
Geels, F. W. (2004). From sectoral systems of innovation to socio-technical systems: Insights about dynamics and change from sociology and institutional theory. Research Policy, 33(6-7), 897-920.
Glavovic, B., Saunders, W., & Becker, J. (2010). Land-use planning for natural hazards in New Zealand: the setting, barriers, ‘burning issues’ and priority actions. Natural Hazards, 54(3), 679-706.
Glavovic, B. C., Saunders, W. S. A., & Becker, J. S. (2010). Realising the potential of land-use planning to reduce hazard risks in New Zealand. The Australasian Journal of Disaster and Trauma Studies, 2010-1.
Greater Wellington Regional Council. (2009, 06/10/2009). About GW & the Region: Our role: Some facts about the region. Retrieved 17 December, 2010, from http://www.gw.govt.nz/Some-facts-about-the-region/
Hinkel, J. (2011). "Indicators of vulnerability and adaptive capacity": Towards a clarification of the science-policy interface. [doi: DOI: 10.1016/j.gloenvcha.2010.08.002]. Global Environmental Change, 21(1), 198-208.
Houghton, R. A. (2008). Carbon Flux to the Atmosphere from Land-Use Changes: 1850-2005. from Carbon Dioxide Information Analysis Center, Oak Ridge National Laboratory, U.S. Department of Energy, Oak Ridge, Tenn., U.S.A.:
Hutt City Council. (2006). District Plan - City of Lower Hutt.
Intergovernmental Panel on Climate Change. (2001). Climate Change 2001: Synthesis Report. A Contribution of Working Groups I, II, and III to the Third Assessment Report of the Integovernmental Panel on Climate Change. Cambridge, United Kingdom, and New York, NY, USA.
Intergovernmental Panel on Climate Change. (2007). Climate Change 2007: Contribution of Working Group II to the Fourth Assessment Report. Cambridge, UK: Cambridge University Press.
IPCC (Ed.). (2000). Special Report on Emissions Scenarios. Cambridge, UK: Cambridge University Press.
IPCC (Ed.). (2007). Climate Change 2007: The Physical Science Basis. Contribution of Working Group I to the Fourth Assessment Report of the Intergovernmental Panel on Climate Change. Cambridge, UK: Cambridge University Press.
Jones, R. N. (2001). An Environmental Risk Assessment/Management Framework for Climate Change Impact Assessments. Natural Hazards, 23(2), 197-230.

New Zealand Climate Change Research Institute
45
Jonkman, S. N., Brinkhuis-Jak, M., & Kok, M. (2004). Cost benfit analysis and flood damage mitigation in the Netherlands. Heron, 49(1), 95-111.
Kay, A., Davies, H., Bell, V., & Jones, R. (2009). Comparison of uncertainty sources for climate change impacts: flood frequency in England. Climatic Change, 92(1), 41-63.
Khan, S. (2010). A Geographical Assessment of Hazardscape of Wellington Region: Influences on Intra-regional Response., Victoria University of Wellington, Wellington.
Lawrence, J., & Allan, S. (2009). A strategic framework and practical options for integrating flood risk management-to reduce flood risk and the effects of climate change. Report prepared for the Ministry for the Environment. Wellington.
Meinshausen, M. (2005). EQW pathway set 1: Emission data for CO2 equivalence stabilization & peaking pathways (EQW). Retrieved 19th September, 2011, from Potsdam Institute for Climate Impact Research: http://www.pik-potsdam.de/~mmalte/simcap/data.html
Metzger, M. J., Leemans, R., & Schröter, D. (2005). A multidisciplinary multi-scale framework for assessing vulnerabilities to global change. International Journal of Applied Earth Observation and Geoinformation, 7(4), 253-267.
Metzger, M. J., & Schröter, D. (2006). Towards a spatially explicit and quantitative vulnerability assessment of environmental change in Europe. Regional Environmental Change, 6, 201-216.
MfE. (2008). Climate Change Effects and Impacts Assessment: A Guidance Manual for Local Government in New Zealand (2nd edition).
Milly, P. C. D., Betancourt, J., Falkenmark, M., Hirsch, R. M., Kundzewicz, Z. W., Lettenmaier, D. P., et al. (2008). CLIMATE CHANGE: Stationarity Is Dead: Whither Water Management? Science, 319(5863), 573-574.
Ministry for the Environment. (2008). Meeting the challenges of future flooding in New Zealand. Wellington: Ministry for the Environment.
O'Neill, S., & Barnett, J. (2010, 29 June - 1 July). Defining and assessing maladaptation. Paper presented at the National Climate Change Adaptation Research Facility (NCCARF) Conference: International Climate Change Adaptation Conference: Climate Adaptation Futures: Preparing for the unavoidable impacts of climate change, Gold Coast, Australia.
Pahl-Wostl, C. (2009). A conceptual framework for analysing adaptive capacity and multi-level learning processes in resource governance regimes. Global Environmental Change, 19(3), 354-365.
Pearson, C., & McKerchar, A. (1999). An update of Hutt river flood frequency (No. NIWA Client Report CHC99/11). Wellington: Greater Wellington Regional Council.
Pielke, R. A. (1999). Nine Fallacies of Floods. Climatic Change, 42(2), 413-438.
Posey, J. (2009). The determinants of vulnerability and adaptive capacity at the municipal level: Evidence from floodplain management programs in the United States. Global Environmental Change, 19(4), 482-493.
Preston, B. L., Smith, T., Brooke, C., Gorddard, R., Measham, T., Withycombe, G., et al. (2008). Mapping Climate Change Vulnerability in the Sydney Coastal Councils Region. Canberra: Prepared for the Sydney Coastal Councils Group by the CSIRO Climate Adaptation Flagship.
Preston, B. L., & Stafford-Smith, M. (2009). Framing vulnerability and adaptive capacity assessment: Discussion paper. Aspendale, VIC: CSIRO Climate Adaptation Flagship.

46
Reyna, V. F. (2004). How People Make Decisions That Involve Risk. Current Directions in Psychological Science, 13(2), 60-66.
Scheraga, J. D., & Grambsch, A. E. (1998). Risks, opportunities, and adaptation to climate change. Climate Research, 10, 85-95.
Schmidt, J., Matcham, I., Reese, S., King, A., Bell, R., Henderson, R., et al. (2011). Quantitative multi-risk analysis for natural hazards: a framework for multi-risk modelling. Natural Hazards, 58(3), 1169-1192.
Schröter, D., & ATEAM consortium. (2004). Global change vulnerability: assessing the European human-environment system. Potsdam, Germany: Potsdam Institute for Climate Impact Research.
Smit, B. (1993). Adaptation to Climatic Variability and Change: Report of the Task Force on Climate Adaptation. Prepared for the Canadian Climate Program, Department of Geography Occasional Paper No. 19. Guelph, Ontario, Canada: University of Guelph.
Smit, B., & Pilifosova, O. (2003). From adaptation to adaptive capacity and vulnerability reduction. In J. B. Smith, R. J. T. Klein & S. Huq (Eds.), Climate change, adaptive capacity and development (pp. 9-28). Loondon: Imperial College Press.
Smit, B., & Wandel, J. (2006). Adaptation, adaptive capacity and vulnerability. Global Environmental Change, 16(3), 282-292.
Stone, E. R., Yates, J. F., & Parker, A. M. (1994). Risk Communication: Absolute versus Relative Expressions of Low-Probability Risks. [doi: 10.1006/obhd.1994.1091]. Organizational Behavior and Human Decision Processes, 60(3), 387-408.
Tegg, S., & Lawrence, J. (in preparation-a). Cognitive Biases and Climate Risk Communication: Implications for assessment format design and adaptation decision-making?
Tegg, S., & Lawrence, J. (in preparation-b). A Method for Incoporating Climate Change Projections and ‘Residual Risk’ into Flood Risk Assessment and Communication
Turner II, B. L., Kasperson, R. E., Matson, P. A., McCarthy, J. J., Corell, R. W., Christensen, L., et al. (2003). A Framework for Vulnerability Analysis in Sustainability Science. Proceedings of the National Academy of Sciences of the United States of America, 100(14), 8074-8079.
Unruh, G. C. (2000). Understanding carbon lock-in. Energy Policy, 28(12), 817-830.
Unruh, G. C., & Carrillo-Hermosilla, J. (2006). Globalizing carbon lock-in. Energy Policy, 34(10), 1185-1197.
US Department of the Army. (1992). Explaining Flood Risk. Washington, DC: US Army Corps of Engineers.
Walker, W. (2000). Entrapment in large technology systems: institutional commitment and power relations. Research Policy, 29(7-8), 833-846.
Weitkamp, C. (2005). Lidar: range-resolved optical remote sensing of the atmosphere New York: Springer.
Wellington Regional Council. (1991). The Hutt River: A modern history 1840-1990. Wellington: Wellington Regional Council.
Wellington Regional Council. (2001). Hutt River Floodplain Management Plan: For the Hutt River and its Environment. Wellington: Wellington Regional Council.
WRC. (2001). Hutt River Floodplain Management Plan (Vol. (Report WRC/FPSA-G-01/32), pp. 256). Wellington: Greater Wellington Regional Council.

New Zealand Climate Change Research Institute
47
Yohe, G., & Tol, R. S. J. (2002). Indicators for social and economic coping capacity - moving toward a working definition of adaptive capacity. Global Environmental Change, 12(1), 25-40.


New Zealand Climate Change Research Institute
49
7 Appendix 1 Methodological caveats
7.1 Flood frequency and inundation modelling
This modelling was undertaken to illustrate a risk-based approach to decision making under
climate change—it is not intended to serve specific planning purposes
There is no current information on the relationship between flood volume and the actual amount of
water that would be spilled over various stopbanks once their design level has been exceeded. We
assumed that for smaller floods only some of the excess water would spill over the stopbanks,
whereas for very large floods all excess water spills over stopbanks. More detailed observations and
modelling of stage-discharge relationships would be necessary to produce more robust results.
Our modelling approach is robust in determining the area that could be flooded under a given design
flood event and the static depth of inundation. Our approach is limited when it comes to
determining flood velocities especially for very large floods, and the resulting changes in local depths
associated with currents that form along flow paths. Therefore, both the flood velocities and
inundation depths—and the estimated damages—for floods in excess of 2300 cumecs should be
treated with caution.
We only modelled the consequences of stopbank breaches and resulting flooding from the Hutt
River. We did not attempt to model flooding of minor streams, e.g. the Waiwhetu stream; nor did
we attempt to model in detail flooding of the stormwater system, or the interaction of flood waters
from the Hutt River with the stormwater system. To fully understand flood risk in the Hutt Valley, all
those points would need to be considered and would require research that is outside the scope of
this study.
Due to limited high-resolution topographical coverage, we did not model inundation upstream of the
entrance of the Stokes stream into the Hutt River, or any downstream inundation that could be due
to breaches of stopbanks upstream of this point.
We considered the effects of sea-level rise only in a static fashion, that is, with rising sea level
representing an increasing boundary level for the floodplain. We did not model dynamic impacts
such as implications for the flow at the Hutt River mouth, or structural implications such as rising
water tables.
7.2 RiskScape damage-cost model
We used 1-hour design floods to model impacts. In reality, flood peaks are not sustained for 1 hour
but typically less, which could result in overestimates in particular of flood velocities.
Floods were assumed to occur during the daytime when car parks are in use. The cost estimates of
damage to vehicles in areas with large car parks are sensitive to this assumption.
7.3 Socio-economic factors
Natural disaster case studies make it clear that socio-economic factors play a significant role in a
community’s vulnerability and recovery. However, while this role is well established it is difficult to

50
derive and apply general principles from case studies for quantitative modelling purposes. The
relative importance of a particular factor or the importance of socio-economic versus biophysical
factors will vary depending on context.
7.4 Flood impacts survey
7.4.1 Comparability
There was limited comparability of survey data with census data for income. Census and survey used
the same income brackets, but census asked for personal income while survey asked for total
household income. As a result, survey mean, median, and mode income are all at the high end of the
income bracket range. An additional number of higher-income brackets would have been needed to
gather more detailed data.
7.4.2 Representativeness and generalisation
A larger sample (or higher response rate) of people who experienced flooding in the past would have
provided a robust basis from which to draw more generalisable conclusions. Less than a third of the
sample was affected by flooding. Hence, comparative analyses between flood-affected and
unaffected people may be limited in their potential to fully assess the interplay between socio-
economic attributes and vulnerability to flooding. Phenomena observed in the sample may be due to
a sampling error, arising from the fact that only part of the population was surveyed. Additionally,
self-selection may have biased the composition of the sample. For example, the age distribution of
respondents may reflect a self-selection bias towards those who have relatively more time available
to answer the questionnaire.
7.4.3 Sample size
When trying to test various subgroups for specific variables, some of the groups were too small to
conduct meaningful statistical analyses. For example, there was only one person with long-term
health impacts due to previous flooding and too few people who lived in single-parent families AND
were affected by flooding.
7.4.4 Statistical techniques used
Some socio-economic data was gathered in categorical rather than continuous form (e.g. age,
income). This limits the range of statistical techniques available for data analysis. For example,
mean, median, and mode may be less meaningful and informative when they refer to a range of
values rather than pinpointing a specific value. Some statistical techniques could not be used
because the sample population did not consist of the minimum required number to perform the
particular test.
7.4.5 Missing responses
There is a relatively large number of missing responses for some questions. This suggests that the
response rate could have been increased by matching the wording of the specified response options
better with the wording of the question.

New Zealand Climate Change Research Institute
51
7.4.6 Knowledge of individual respondents
Areas of expertise or general knowledge differ between individuals. For example, when asked to
indicate preferences for various flood-risk mitigation measures, some respondents may have been
knowledgeable about the pros and cons of these measures, whereas for others evaluating such
options may have rather been guesswork.


New Zealand Climate Change Research Institute
53
8 Appendix 2 Workshop and interview
questionnaire
1. Do participants view the current approach to flood risk management as adequate for the
current climate?
a. Are there any remaining key vulnerabilities under the current climate that the
Hutt Valley Flood Management Plan will not address in its current form?
b. What were the key factors that determined the balance between investment in
flood-risk reduction and the benefits of this risk reduction in the current plan?
2. To what extent can the current approach to flood-risk management be up-scaled as and
when information from this and further research becomes available about increases in flood risk as
a consequence of climate change?
c. Over what time frames?
d. What are the technical, economic, social, and environmental implications and
potential limits to up-scaling the current flood-risk management approach?
e. Could such up-scaling maintain the balance between investment in flood-risk
reduction and the benefits of this risk reduction as in the current plan?
3. What do you think are the thresholds that could require a fundamental change in the current
approach to flood-risk management? How can they be defined?
a. At what point in time would a fundamental change in approach have to be
decided to be effective?
b. What would the actual trigger points for such decisions likely be?
4. How do flood-risk management decisions in the near term affect the ability of communities to
manage a possible increase in flood risk in future?
a. Given the uncertainty in flood-risk projections, and the near-term cost of
increasing flood protection, communities may wish to withhold additional
actions to reduce flood risk until the range of uncertainties has narrowed
(including decisions not to increase protection now, or not to limit further
development in areas at future risk).
5. What frameworks, tools, and regulatory options are currently used by councils to manage
uncertainty in flood-risk estimates for the present and future?
6. Can those frameworks deal adequately with the range of potential future changes under climate
change and balance near-term and long-term benefits, costs, and risks?

54
7. To what extent are different parts of a community differently vulnerable to flood risk? To what
extent are such differential vulnerabilities taken into account in flood risk management?
a. Are differential vulnerabilities likely to increase or decrease in future?
b. Are the tools and regulatory environment in which councils operate able to deal
with those differences to ensure sustainable outcomes across different parts of
affected communities?
8. Who would benefit most, and who would be most negatively affected, by different approaches
to manage the range of potential future increases in flood risk?
9. What are the opportunities and barriers that councils have to implement long-term flood risk
management that considers climate change?
a. What part does uncertainty play?

New Zealand Climate Change Research Institute
55
9 Appendix 3 Household survey questionnaire
QUESTIONNAIRE ON FLOOD AND STORM IMPACTS
ON HOUSEHOLDS in LOWER HUTT
This survey should take about 30 minutes to complete All answers will be kept confidential
The main purpose of this survey is to learn more about whether and how past floods have a long term impact on residents and their views about flood risk reduction. To help with this, please tell us if you:
1 Lived at this address during the February 2004 floods and were affected.
2 Lived at this address during the February 2004 floods but were NOT affected
3 Did not live at this address during the February 2004 floods, but have been affected
by flooding during other occasions (here or elsewhere)
4 Did not live at this address during the February 2004 floods, and have not been
affected by flooding during other occasions (here or elsewhere)
Even if you have never been affected by a flood, here or elsewhere, we still would like you to answer all questions in this survey
If you have filled in the previous survey in 2004, it would be helpful (but not absolutely necessary) if the same person could also complete this survey.
SECTION A: Overall impacts
This section asks about flood events that have occurred in Lower Hutt from February 2004 onwards,
and the impacts those events have (or haven’t) had on you.
1. Has anyone in your household suffered an on-going injury or illness due to past flood events?
1 No
2 Yes - If yes, please describe in detail, including which flood:
__________________________________________________________________________
__________________________________________________________________________
__________________________________________________________________________
__________________________________________________________________________
__________________________________________________________________________

56
2. Are any parts of your property still affected by impacts from past floods? (Tick all where structural damage remains, or a permanent loss of function occurred)
1 No recent flood affected this property directly
2 Recent floods affected this property but there are no on-going damages
3 Section (land)
4 Out-buildings
5 Garage
6 House
7 Other – please give details:
__________________________________________________________________________
__________________________________________________________________________
3. Please list any individual possessions that suffered permanent damage or loss, and give the reasons for this (e.g. because insurance did not pay for it and you were unable to afford a replacement, or because they were items of special value (such as photographs, documents etc)
1 Item: _________________________________________________________
Reason for permanent damage: _______________________________________
2 Item: _________________________________________________________
Reason for permanent damage: _______________________________________
3 Item: _________________________________________________________
Reason for permanent damage: _______________________________________
4 Item: _________________________________________________________
Reason for permanent damage: _______________________________________
(add more items on separate sheet of paper if necessary)
4. Which was the biggest past flood event that you are aware of that
directly affected your property? (Please give details.)
1 Approximate date: ______________________________
2 I do not know of any events that have affected my property

New Zealand Climate Change Research Institute
57
SECTION B: Insurance and costs
5. With regard to insurance, which of the following statements are correct in your case? Please answer this question regardless of whether you may have answered this already in previous surveys.
Does not
apply Yes No
My insurance didn’t cover the losses I expected it to 1 2 3
EQC1 has settled my claim in a fair way 1 2 3
My insurance company has settled my claim in a fair
way 1 2 3
My insurance premium has gone up since the event
because of increased flood risk 1 2 3
My insurance excess has gone up since the event
because of increased flood risk 1 2 3
I have found it difficult to get insurance cover since
the event 1 2 3
I can’t afford insurance cover now 1 2 3
1 EQC: Earthquake Commission
6. Is your household financially worse off today than it would have been without the February 2004 or other past floods? Please consider only the consequences of and council or community responses to past flood events, not other changes such as the global economic recession.
1 No
2 Yes - If yes, please give details:
__________________________________________________________________________
__________________________________________________________________________
__________________________________________________________________________

58
SECTION C: Community effects of flood events and flood risk management measures
7. Have past flood events had any on-going positive or negative effects on your community (e.g. social networks, parks and reserves, amenities)?
1 No effects I can think of
2 Don’t know
3 Positive – please give details
__________________________________________________________________________
__________________________________________________________________________
__________________________________________________________________________
4 Negative – please give details
__________________________________________________________________________
__________________________________________________________________________
__________________________________________________________________________
8. Have flood risk management measures (such as works to strengthen
stopbanks) had any on-going positive or negative effects on your community (e.g. social networks, parks and reserves, amenities)?
1 No effects I can think of
2 Don’t know
3 Positive – please give details
__________________________________________________________________________
__________________________________________________________________________
__________________________________________________________________________
4 Negative – please give details
__________________________________________________________________________
__________________________________________________________________________
__________________________________________________________________________

New Zealand Climate Change Research Institute
59
SECTION D: Knowledge about flood risk and concrete actions to reduce flood risk
9. Do you know what level of flood risk your property is exposed to? (Tick only one)
1 Yes
2 Only a little
3 No
If “yes” or “only a little”, please tell us the level of risk (as far as you know) where you obtained the information from:
____________________________________________________________________
____________________________________________________________________
10. Have you seen any flood hazard maps for your community? (Tick only one)
1 Yes
2 Not sure
3 No
11. If you have seen flood hazard maps, how useful do you think they are to
inform residents about their flood risk? (Tick only one)
1 Very useful
2 Somewhat useful
3 Not useful
Details: _____________________________________________________________
____________________________________________________________________
12. Since the February 2004 flood, have you: (Tick one in each line)
No A little A lot
Sought information on flood risk to your
community 1 2 3
Sought information on what to do to prepare
for a possible flood 1 2 3
Become involved with a local community
group related to flooding 1 2 3
Communicated with the council about how to
reduce flood risk in your area 1 2 3
Participated in meetings related to flooding
and flood risk management measures 1 2 3

60
13. Since the February 2004 flood, has your household undertaken any of these measures, and if so how much has been spent? (Fill in all that apply in each line)
If yes, approximately how
much has been spent?
Increased your level of insurance Yes / No $ ________ on additional
insurance per year
Raised the floor level of your house Yes / No $
Kept ditches and drains around the
property clean Yes / No $
Protected your septic tank
Yes / No /
Does not apply $
Avoided keeping irreplaceable items or
goods of sentimental value on the
ground floor of your home?
Yes / No /
My house has
only one floor
comments
Talked to a council about flood risk
management measures Yes / No about ______ hours
Made a plan about what you will do if a
flood is threatening (e.g. lift items off
ground, evacuation, check drains)
Yes / No
comments
Collected emergency survival items or
compiled a preparedness kit Yes / No
comments
14. Please list any other actions you have undertaken as a result of
previous floods:
___________________________________________________________________ ___________________________________________________________________ ___________________________________________________________________ ___________________________________________________________________

New Zealand Climate Change Research Institute
61
SECTION E: Roles and responsibilities to manage flood risk
15. What chance of flooding above floor level do you find acceptable for an average residential property in any given year? (Tick only one)
1 In any given year, there should be a less than a 0.5percent chance of flooding
2 In any given year, there should be a less than 1percent chance of flooding
3 In any given year, there should be a less than 2percent chance of flooding
4 In any given year, there should be a less than 5percent chance of flooding
5 Don’t know
Other: 5 ___________________________________________________________
16. Over the course of the next 50 years, how often do you feel it would be acceptable for the average residential property to be flooded above floor level? (Tick only one)
1 Never
2 Once
3 Twice
4 Three times
5 Don’t know
Other: 6 ___________________________________________________________
17. Do you feel that all houses should be protected to the same level of risk? (Tick all that you support)
1 Yes
2 No, it should be up to each individual household
3 No, the most valuable properties should be protected more
4 No, those with low incomes should be protected more
5 No, those with high incomes should be protected more
6 No, some suburbs should be protected more than others
Additional comments:
___________________________________________________________________
___________________________________________________________________
___________________________________________________________________

62
18. Do you feel that current flood risk should be reduced by: (Tick one in each line)
Other:
____________________________________________________________________
____________________________________________________________________
19. Please indicate on the scale whose responsibility you believe it is to manage the risk from floods. (Tick one in each line)
Not at all (Scale) A great deal
Central Government 1 2 3 4 5
Regional Council 1 2 3 4 5
Hutt City Council 1 2 3 4 5
Community groups 1 2 3 4 5
Individual households 1 2 3 4 5
Nobody; if a flood wants
to come then it will come 1 2 3 4 5
Least (Scale) Most
Raising stopbanks 1 2 3 4 5
Deepening river channels 1 2 3 4 5
Improving the stormwater network 1 2 3 4 5
Shifting houses away from high-risk
areas 1 2 3 4 5
Increasing buffers like natural areas
and ponds 1 2 3 4 5
Give earlier warnings and improve
evacuation plans for floods 1 2 3 4 5
Modify buildings (e.g. raise floor
levels and utility services) 1 2 3 4 5
Restrict new buildings or
renovations in areas with high flood
risk 1 2 3 4 5
Nothing needs to be done - I’m
happy with the flood risk level in
my community 1 2 3 4 5

New Zealand Climate Change Research Institute
63
20. How big are the following barriers to flood risk management measures: (Tick one in each line)
Suggestions for reducing barriers to managing flood risk:
____________________________________________________________________
____________________________________________________________________
21. Who do you feel should pay for measures to reduce flood risk? (Tick
one in each line)
No barrier (Scale) Major barrier
Cost are too high 1 2 3 4 5
Skills are required to prepare 1 2 3 4 5
Information is required to prepare 1 2 3 4 5
Other priorities to think about instead 1 2 3 4 5
Need for co-operation with others 1 2 3 4 5
Floods don’t happen often enough to
make preparation a high priority 1 2 3 4 5
I don’t trust information about flood
risk 1 2 3 4 5
I agree flood risk is a problem but the
way it’s dealt with is wrong 1 2 3 4 5
pay least (Scale) pay most
People who own affected properties
(property owners) 1 2 3 4 5
People living in affected properties
(tenants) 1 2 3 4 5
Costs should be apportioned based on the
value of the property affected 1 2 3 4 5
Costs should be apportioned based on the
income of those owning the property 1 2 3 4 5
Costs should be apportioned based on the
income of those living in the property 1 2 3 4 5
The local community as a whole 1 2 3 4 5
The district as a whole 1 2 3 4 5
The region as a whole 1 2 3 4 5
The country as a whole 1 2 3 4 5
Insurance companies 1 2 3 4 5

64
22. How prepared do you believe the following groups are for future floods affecting your community? (Tick one in each line)
Very
prepared
Somewhat
prepared
Not very
prepared
Not at all
prepared
Don’t
know
Your household 1 2 3 4 5
Your community 1 2 3 4 5
Central government Ministries
(such as Ministries of Civil
Defence and Emergency
Management, the Environment,
Health, or Social Development)
1 2 3 4 5
Regional Council, including
regional Civil Defence 1 2 3 4 5
Hutt City Council, including
district Civil Defence 1 2 3 4 5
Service providers (such as roads,
electricity, telephone
companies, water suppliers,
garbage collectors, energy
supplies, sewage treatment
companies)
1 2 3 4 5
Earthquake Commission (EQC) 1 2 3 4 5
Commercial insurance
companies 1 2 3 4 5

New Zealand Climate Change Research Institute
65
SECTION F: Dealing with future changes in flood risk
Climate change is generally expected to increase the occurrence of heavy rainfall, which could result in more frequent river floods and flood damages unless additional measures are taken to reduce the impacts of floods. Sea level rise will further increase flood risk in low-lying areas. Please answer the next 3 questions with this likely future increase in flood risk in mind.
23. By which measures do you think any increase in future flood risk should be dealt with? (Tick one in each line)
Raising stopbanks 1 2 3 4 5
Deepening river channels 1 2 3 4 5
Improving the stormwater network 1 2 3 4 5
Shifting houses away from high-risk areas 1 2 3 4 5
Increasing buffers like natural areas and
ponds 1 2 3 4 5
Give earlier warnings and improve
evacuation plans for floods 1 2 3 4 5
Modify buildings (e.g. raise floor levels and
utility services) 1 2 3 4 5
Restrict new buildings or renovations in
areas with high flood risk 1 2 3 4 5
Nothing needs to be done; I don’t believe
that flood risk will increase sufficiently to
present any cause for concern
1 2 3 4 5
24. How far into the future should one look when planning for future
changes in flood risk in residential areas?
1 10 years
2 50 years
3 100 years
4 more than 100 years
5 Unsure
25. Please indicate on the scale whose responsibility you believe it is to reduce any increase in future flood risk. (Tick one in each line)
Not at all (Scale) A great deal
Central Government 1 2 3 4 5
Regional Council 1 2 3 4 5
Hutt City Council 1 2 3 4 5
Community groups 1 2 3 4 5
Individual households 1 2 3 4 5
Nobody; I don’t believe that
flood risk will increase 1 2 3 4 5
Least (Scale) Most

66
SECTION G: Community participation, trust and leadership
26. Thinking about how you normally deal with any problem in your life, please describe the extent to which you agree or disagree with each of the following statements: (Tick one in each line)
Strongly
agree
Agree Neither agree
nor disagree
Disagree Strongly
disagree
I try to come up with a strategy
about what to do 5 4 3 2 1
I make a plan of action 5 4 3 2 1
I think hard about what steps
to take 5 4 3 2 1
I think about how I might best
handle the problem 5 4 3 2 1
27. Please describe the extent to which you agree or disagree with each of the following statements: (Tick one in each line)
Strongly
agree Agree
Neither agree
nor disagree Disagree
Strongly
disagree
Floods are too destructive to
bother preparing for 5 4 3 2 1
A serious flood is unlikely to
occur during my lifetime 5 4 3 2 1
Preparing for floods is
inconvenient 5 4 3 2 1
It is difficult to prepare for floods 5 4 3 2 1
28. Please describe the extent to which you agree or disagree with each of the following statements: (Tick one in each line)
Strongly
agree
Agree Neither agree
nor disagree
Disagree Strongly
disagree
Preparing for floods will significantly reduce damage to my home should a floods occur
5 4 3 2 1
Preparing for floods will improve
my everyday living conditions 5 4 3 2 1
Preparing for floods will improve
the value of my house/property 5 4 3 2 1
Preparing for floods will improve
my ability to deal with
disruptions to family/community
life following a flood
5 4 3 2 1

New Zealand Climate Change Research Institute
67
29. Thinking about how you participate in life in your community, please describe how often you undertake each of the following: (Tick one in each line)
Often Sometimes Rarely Never
I have worked with others on something to improve
community life 4 3 2 1
I participate in local activities or events (e.g.,
festivals, fetes, fairs) 4 3 2 1
I have contributed money, food or clothing to local
causes, charities, or to others in my community 4 3 2 1
I have attended a public meeting on a community
issue 4 3 2 1
I have been involved in volunteer activities intended
to benefit my community (e.g., fundraising, clean-
up days, local groups, Scouts/Brownies).
4 3 2 1
30. Given your general feelings about living in your wider community, please describe the extent to which you agree or disagree with each statement. (Tick one in each line)
Strongly
agree
Agree Neither
agree
nor disagree
Disagree Strongly
disagree
I trust my Local Council to
respond to meet the needs of
its residents
5 4 3 2 1
I trust the community leaders
in my community 5 4 3 2 1
I trust scientists and engineers
to give me a fair idea of the
actual risk of flooding
5 4 3 2 1
I trust the media (newspapers,
TV, radio) to report fairly 5 4 3 2 1
I trust my Local Council to do
what is right for the people
they represent.
5 4 3 2 1
I have confidence in the law to
protect and maintain order in
my community
5 4 3 2 1

68
SECTION H: Demographic and household information
Note: The information you provide us will be kept confidential. We will only look at correlations between demographic information and people’s views on flood risk issues. Information about individual households will not be released to anybody outside this research project.
31. What is your gender? (Tick only one)
1 Male 2 Female 32. Into which age bracket do you fall? (Tick only one)
1 18-19 yrs 2 20-24 yrs 3 25-29 yrs
4 30-34 yrs 5 35-39 yrs 6 40-44 yrs
7 45-49 yrs 8 50-54 yrs 9 55-59 yrs
10 60-64 yrs 11 65-69 yrs 12 70-74 yrs
13 75-79 yrs 14 80-84 yrs 15 85 years +
33. Which ethnic group do you belong to? (Tick the box or boxes that apply to you)
1 New Zealand European 2 Māori
3 Samoan 4 Cook Island Maori
5 Tongan 6 Niuean
7 Chinese 8 Indian
9 Other (e.g., Dutch, Japanese) (Please specify):
34. What is your main occupation? (Tick only one)
1 Employed: What is your job?
2 Unemployed
3 Retired
4 House person
5 Student: What are you studying?
6 Other (Please specify):
35. What is your highest educational qualification? (Tick only one)
1 No school qualifications
2 Secondary school qualifications
3 Trade certificate or professional certificate or diploma
4 University undergraduate degree (e.g., diploma or bachelor’s degree)
5 University postgraduate degree (e.g., Master’s, Ph.D.)
6 Other (Please specify): _________________________________________

New Zealand Climate Change Research Institute
69
36. How long have you lived in your current house? __________ year/s
37. Which of the following best describes your household now? (Tick only one)
1 A couple without children
2 One person household
3 Two parent family with one dependent child or more
4 One parent family with one dependent child or more
5 Non family household (e.g. flatting)
6 Other. Please state:
How many people currently live in your household in total? ______________________
How many bedrooms does your household have? _____________________________
38. How well does your household speak English? (Tick only one)
1 English is the native language of the entire household
2 English is the native language of some members of the household
3 English is a second language but fluent for all household members
4 English is a second language and fluent for some household members
5 English is a second language that we are still learning to speak
39. Do you, or someone in your house, own or rent the home you live in? (Tick only one)
1 Own or buying, to live in it
2 Own or buying, but only for use as a holiday home
3 Rent, to live in it
4 Rent as a holiday home
5 Other (Please specify):
40. What was your household’s total income (before tax) for the 2007 financial year (April 1 2007-March 2008)? (Tick only one)
1 Loss 2 Zero Income
3 $1 – $5,000 4 $5,001 – $10,000
5 $10,001 – $15,000 6 $15,001 – $20,000
7 $20,001 – $25,000 8 $25,001 – $30,000
9 $30,001 – $35,000 10 $35,001 – $40,000
11 $40,001 – $50,000 12 $50,001 – $70,000

70
13 $70,001 – $100, 000 14 $100,001 or more
41. Does anybody in your household live on a sickness benefit or have a special medical need? (Tick only one)
1 No
2 Yes
42. Does your household have internet access? (Tick only one)
1 No
2 Yes
43. Does your household have access to a telephone? (Tick only one)
1 No
2 Yes
44. Does your household regularly read newspapers? (Tick only one)
1 No
2 Yes
45. Does your household regularly listen to the radio? (Tick only one)
1 No
2 Yes
46. Does your household have a car? (Tick only one)
1 No
2 Yes, one
3 Yes, more than one


