
Hurricanes ATS 351 Lecture 12 November 30, 2009. Outline Formation Stages of development Structure...
26
Hurricanes Hurricanes ATS 351 Lecture 12 November 30, 2009
-
date post
22-Dec-2015 -
Category
Documents
-
view
214 -
download
0
Transcript of Hurricanes ATS 351 Lecture 12 November 30, 2009. Outline Formation Stages of development Structure...

HurricanesHurricanes
ATS 351Lecture 12
November 30, 2009

OutlineOutline
• Formation• Stages of development• Structure of hurricanes• Saffir-Simpson scale• Movement • Dissipation• Damage• Historical hurricanes

Formation: What is required?Formation: What is required?• Warm & moist air
– Reason why formation is in tropics: a lot of latent heat!– SSTs generally > 26.5C
• Rotation– Comes from Coriolis force – Formation not on equator, but near
• Continued fuel– A tropical storm or hurricane can strengthen if it continues to
move over warm water but will weaken once it hits dry land
• No (or very weak) vertical wind shear– Unlike storms in the mid-latitudes which need shear to
organize, tropical storms will be sheared apart and prevented from organizing
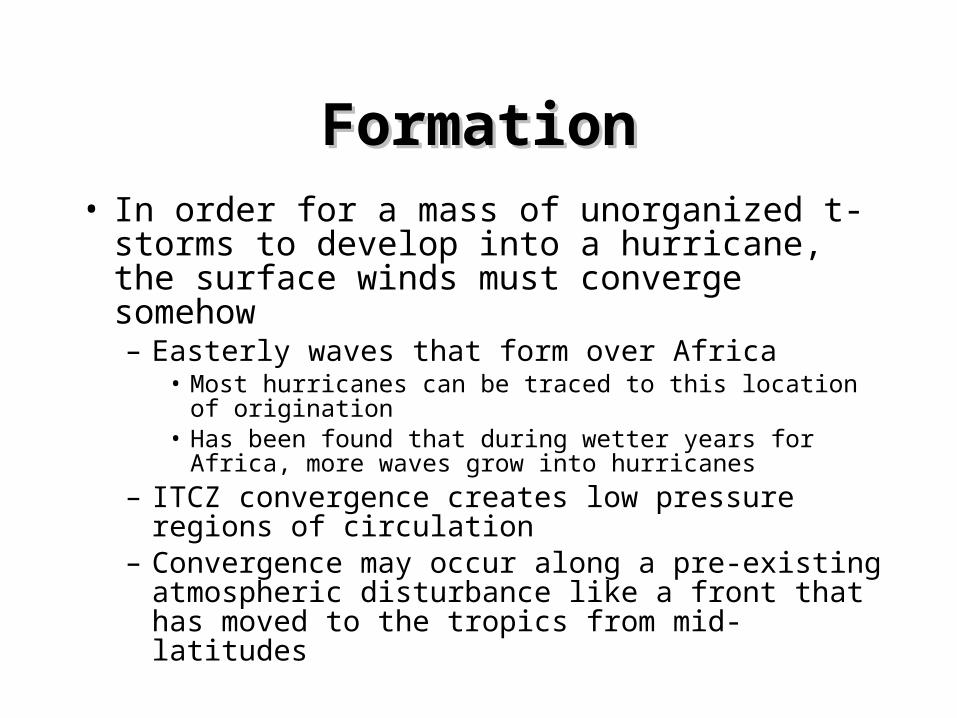
FormationFormation• In order for a mass of unorganized t-storms to
develop into a hurricane, the surface winds must converge somehow– Easterly waves that form over Africa
• Most hurricanes can be traced to this location of origination
• Has been found that during wetter years for Africa, more waves grow into hurricanes
– ITCZ convergence creates low pressure regions of circulation
– Convergence may occur along a pre-existing atmospheric disturbance like a front that has moved to the tropics from mid-latitudes

Formation TheoriesFormation Theories
• Energy for hurricanes is the direct transfer of sensible and latent heat from warm ocean water into the atmosphere
• Organized Convection Theory– Storm will strengthen as long as
divergence aloft is quicker than convergence towards the center at the surface
– Main fuel is temperature of water and release of latent heat
• Heat Engine Theory– Heat is taken in at a higher temp,
converted to work, and is then released at a lower temperature

Stages of DevelopmentStages of Development• Tropical Disturbance (tropical
wave)– Formation of a group of
thunderstorms with slight wind circulation, typically in association with a group of waves
• Tropical Depression– When winds exceed 20 knots– Beginning of formation of a closed
low pressure center– Appear on satellite as a cluster of
thunderstorms– Will be assigned a number (“Tropical
Depression One”)
Disturbance
Depression

Stages of DevelopmentStages of Development• Tropical Storm
– Winds exceed 35 knots – Central pressure drops– On satellite imagery, more
organized, circular shape– Storm gets a name
• Hurricane– Winds exceed 64 knots (74
mph)– Surface pressure continues to
drop– On satellite imagery, well-
defined cyclonic rotation around center, with observation of an eye
Tropical Storm
Hurricane

Stages of DevelopmentStages of Development

Structure of HurricanesStructure of Hurricanes
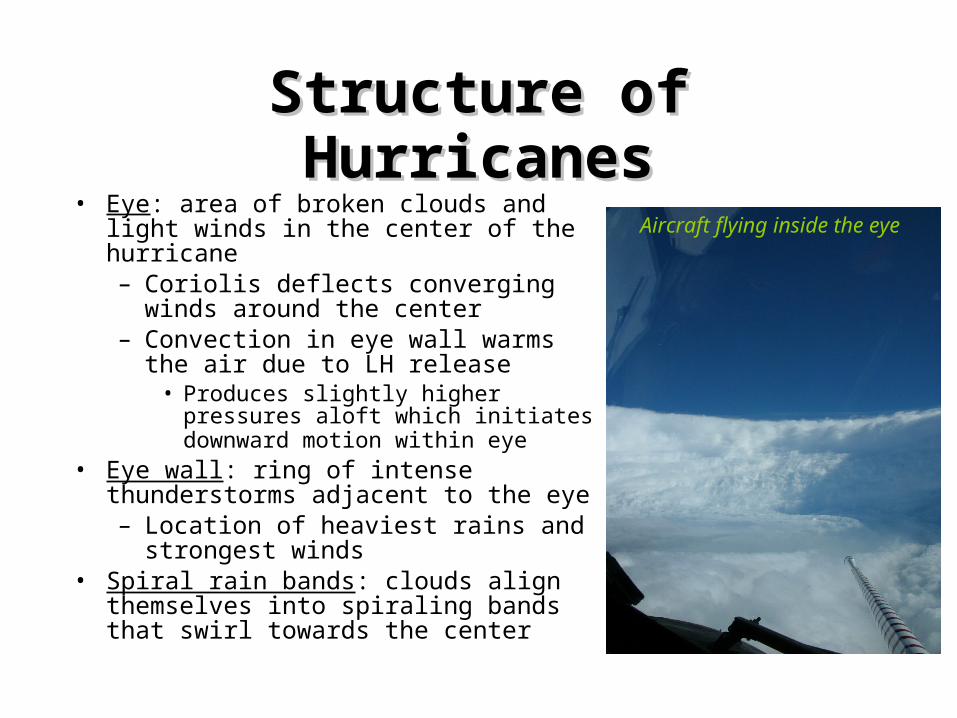
Structure of HurricanesStructure of Hurricanes• Eye: area of broken clouds and light
winds in the center of the hurricane– Coriolis deflects converging winds
around the center– Convection in eye wall warms the air
due to LH release• Produces slightly higher pressures
aloft which initiates downward motion within eye
• Eye wall: ring of intense thunderstorms adjacent to the eye– Location of heaviest rains and
strongest winds• Spiral rain bands: clouds align
themselves into spiraling bands that swirl towards the center
Aircraft flying inside the eye

Structure of HurricanesStructure of Hurricanes• Surface
– Inflow of moist, tropical air rises, condenses, releases LH
– Rising motion creates center of low pressure
– Produces cyclonic rotation
• Aloft– Air diverges, producing
anti-cyclonic rotation– As outflow reaches edges
of storm, it sinks and warms creating clear skies

Structure of HurricanesStructure of Hurricanes

Saffir-Simpson ScaleSaffir-Simpson Scale
19+Less than 920156+5
13-18944-920131-1554
9-12964-945111-1303
6-8979-96596-1102
3-5Greater than 98074-951
Storm surge (ft)Minimum
surface pressure (mb)
Max sustained wind speed
(mph)
Saffir-Simpson Category

Number of hurricanes (by category) that made landfall Number of hurricanes (by category) that made landfall along the US coastline from 1900-2007along the US coastline from 1900-2007

MovementMovement• Easterly winds steer N. Pacific
and N. Atlantic hurricanes– Gradually they swing poleward
around the subtropical high and become caught in westerly flow
• This drives them to the north or northeast
• However, the actual path of a hurricane varies
• A hurricane moving northward over Atlantic will survive longer than its counterpart (a typhoon) in the eastern pacific – Atlantic water is warmer

WindsWinds
• When a hurricane is approaching from the east, its highest winds are usually on its north
• Why?– Winds that push the storm
along add to the winds on the north side and subtract from the winds on the south side
• These high winds also generate large waves - storm surge

Storm SurgeStorm Surge
• Storm surge has historically brought 90% of the death and destruction during hurricanes, and is the primary reason that coastal areas are evacuated as storms approach
• Winds push water onshore - can add to normal tides and create waves over 10 feet
• Strongest where storm motion and winds are in the same direction (on the right side)
• Gradually sloped coastlines are inundated by surge waters moving onshore, though steeper coastlines will cause breaking waves

DissipationDissipation
• Since the main driver of hurricanes is warm ocean water, if the hurricane moves over colder water, then the storm will dissipate
• Therefore, a hurricane that makes landfall will begin to dissipate – May cause flooding once they move over
land

DamageDamage
• Storm surge• Wind damage• Tornadoes• Flooding• Power outages• Destroy houses• Injuries & deaths

BeforeBefore

AfterAfter

DamageDamage

Top 20 Costliest Hurricanes (US)Top 20 Costliest Hurricanes (US)Rank: Name: Year: Category: Damage (U.S.)*:
1 2005 3 $81,000,000,000.002 1992 5 $34,954,825,000.003 2005 3 $20,600,000,000.004 2008 2 $18,000,000,000.005 2004 4 $14,000,000,000.006 2004 3 $13,000,000,000.007 2005 3 $10,000,000,000.008 1989 4 $9,739,820,675.009 2004 2 $8,860,000,000.00
10 1972 1 $8,602,500,000.0011 1965 3 $8,516,866,023.0012 2004 3 $6,500,000,000.0013 1969 5 $6,992,441,549.0014 1998 5 $6,300,000,000.0015 2001 T.S. $5,000,000,000.0016 1955 1 $5,540,676,187.0017 1979 3 $4,965,327,332.0018 1938 3 $4,748,580,000.0019 1999 4 $4,666,817,360.0020 2008 2 $3,800,000,000.00
Katrina (LA/MS/AL/SE FL)Andrew (SE FL/SE LA)
Wilma (FL)Ike (TX/LA/MS)
Charley (FL)Ivan (FL/AL)Rita (LA/TX)
Hugo (SC)Frances (FL)
Agnes (NE U.S.)Betsy (FL/LA)
Jeanne (FL)Camille (MS/AL)Georges (PR/MS)Allison (TX/LA)Diane (NE U.S.)
Frederic (AL/MS)New EnglandFloyd (NC)Gustav (LA)

Most Intense Hurricanes to Strike US Most Intense Hurricanes to Strike US from 1900-2007from 1900-2007

Naming HurricanesNaming Hurricanes
• Starting in 1979, hurricane names began alternating between female and male names– Use English, Spanish, and French names
too• Once a storm has caused great damage
and it becomes infamous as a Category 3 or higher, its name is retired for at least 10 years


![The 2005 North Atlantic Hurricane Season A Climate Perspective · 2006-06-07 · major hurricanes [MH, defined as catego-ries 3-5 on the Saffir-Simpson scale, Simpson (1974)], a record](https://static.fdocuments.in/doc/165x107/5f9391fc61adec01d17a0296/the-2005-north-atlantic-hurricane-season-a-climate-perspective-2006-06-07-major.jpg)