Hurricane Spawned Tornadoes€¦ · HURRICANE SPAWNED TORNADOES Hurricane spawned tornadoes are...
65
Hurricane Spawned Tornadoes By David J. Novlan Project Leader Wm.M. Gray Department of Atmospheric Science Colorado State University Fort Collins, Colorado
Transcript of Hurricane Spawned Tornadoes€¦ · HURRICANE SPAWNED TORNADOES Hurricane spawned tornadoes are...
Hurricane Spawned Tornadoes
By
David J. Novlan
Project Leader Wm.M. Gray
Department of Atmospheric Science Colorado State University
Fort Collins, Colorado
HURRICANE SPAWNED TORNADOES
by
David J. Novlan
Preparation of this report has been partially supported by
NOAA Grant N22-65-73 (G) NSF Grant GA-32589 xl
Principal Investigator: William M. Gray
Department of Atmospheric Science
Colorado State University
Fort Collins, Colorado
May, 1973
Atmospheric Science Paper No. 200

ABSTRACT
HURRICANE SPAWNED TORNADOES
Hurricane spawned tornadoes are most frequent at the time when
hurricanes initially cross land and undergo rapid filling. This paper
presents data composite information on all available rawinsonde and
pibal reports surrounding this type of tornado genesis in the United
States and Japan. Information has also been gathered on tropical
storms entering land which did not produce torandoes.
The most important difference between storms which produce tor
nadoes and those which do not is a very large increase of the vertical
shear of the horizontal wind between the surface and 4-5 thousand feet.
This averages about 40 knots for the tornado cases, but is much less
in the cases which do not produce tornadoes. Differences in vertical
stability are observed to be small.
An overland hurricane dissipation model is proposed whereby the
boundary layer frictional inflow towards the hurricane center occurs
without the usual ocean sensible heat gain and is not, as over the ocean,
isothermal. Over land the inward spiraling air parcels cool. This
reverses the usual hurricane boundary layer baroclinicity and allows
for large observed low level positive vertical wind shear during the
short period of rapid filling. This large magnitude vertical wind shear
is required for tornado formation. It should be used as a forecast tool
in hurricane tornado prediction.
i
TABLE OF CONTENTS
ABSTRACT ..... .
TABLE OF CONTENTS · . . . . I. INTRODUCTION
II. CLIMA T OLOO Y
Tornadoes Relative to Hurricane Direction .. Preferred Sector of the Hurricane . . . . . . Sea Level Pressure. • • . • • Time of Day, Hurricane Speed, and Distance
from Shore . . . • . . • . . . . . . Cyclone Intensity . . • . . • Tornado Location Inland • • • . Summary ......•..
III. ENVIRONMENTAL WIND AND STABILITY
Page
i
ii
1
5
5 11 13
15 17 18 19
CONDITIONS . • . . . • • . . . . . 21
Vertical Wind Shear. • . • • • . . • • . . . • . 22 Filling Rates . . . . . . . • . 26 Directional Shear • • • . . • • • . . • .. 26 Instability. . • • . • • • • • • . . • • . 32 Comparison Between Great Plains and Hurricane
Tornadoes. . . . • • . 35 C onc Ius ion • . .
IV. TORNADO GENESIS
Hurricane Dissipation Dynamics. • ••. Role of Vertical Wind Shear. . . . • . . . • . Right Front Quadrant • Conclusion . . . . . •
V. OTHER CHARACTERISTICS • . . · . . Dry Air Intrusions Hurricane Donna (1960)
. . . . , , ,
. . . . . .. .. .. " " " , , . " . . . . . .
VI. FORECASTING APPLICATIONS. · . . . . " . . .
On Duty Forecasting Aids
ii
37
38
38 40 44 44
46
46 47
49
49
TABLE OF CONTENTS (cont'd)
Practical Rule of Thumb . . • • . . . . Hurricane-Tornado Forecast Work Sheet
VII. CONCLUSION . . .
ACKNOWLEDGEMENTS
REFERENCES
APPENDIX I . . . . .
iii
Page
50 51
53
54
55
57

I. INTRODUCTION
The literature on hurricane tornadoes consists of about ten articles
which deal with individual case studies or the climatology of a number
of cases. Table I is a summary of these earlier studies. Although
very informative, these previous studies (with the exception of Wills,
1969) appear not to have come to grips with the crucial environmental
process operating to explain this type of vortex genesis.
In this study, an updated climatology of hurricane tornadoes is pre
sented from information gathered for U. S. cases from 1948-72 and
typhoon induced tornadoes over Japan from 1950-71. This paper pre
sents a qualitative tornado genesis model which attempts to demon
strate the crucial importance of large low level vertical wind shear in
the genesis mechanism. A forecasting guide is also given.
Although hurricane spawned tornadoes are typically less intense
then the classical Great Plains type, they cannot be overlooked for they
contribute up to 10% of the overall fatalities and up to a half percent
of the overall damage caused by the hurricanes that spawn them (see
Appendix 1).
Smith (1965) proposed a climatological hurricane spawned tornado
model which emphasized the hurricane's directional heading (north
east--favorable for tornadoes) and a so-called "significant tornado
sector" of the hurricane (right front quadrant). Smith's model, how
ever. would not have predicted the tornadoes of hurricane Beulah
1
2
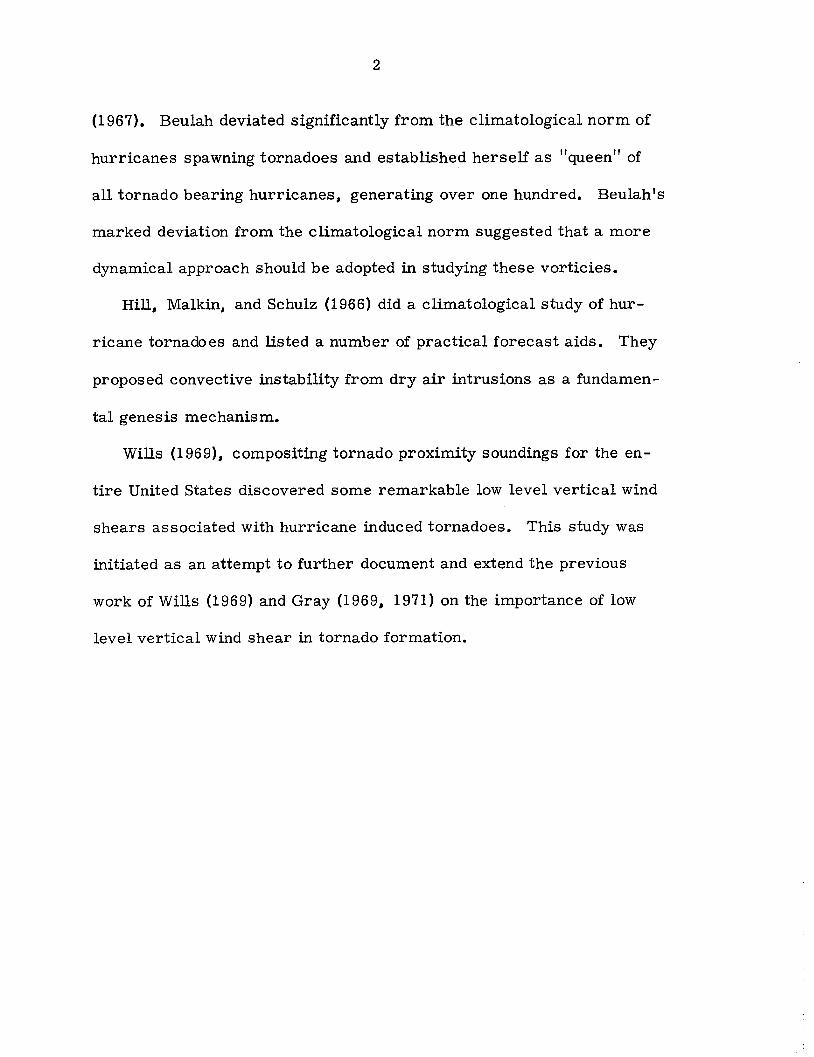
(1967). Beulah deviated significantly from the climatological norm of
hurricanes spawning tornadoes and established herself as "queen" of
all tornado bearing hurricanes, generating over one hundred. Beulah's
marked deviation from the climatological norm suggested that a more
dynamical approach should be adopted in studying these vorticies.
Hill, Malkin, and Schulz (1966) did a climatological study of hur
ricane tornadoes and listed a number of practical forecast aids. They
proposed convective instability from dry air intrusions as a fundamen
tal genesis mechanism.
Wills (1969), compositing tornado proximity soundings for the en
tire United States discovered some remarkable low level vertical wind
shears associated with hurricane induced tornadoes. This study was
initiated as an attempt to further document and extend the previous
work of Wills (1969) and Gray (1969, 1971) on the importance of low
level vertical wind shear in tornado formation.

3
Table 1
1. Malkin, W., and J. G. Galway, (1953): Tornadoes associated with hurricanes. Mon. Wea. Rev., 81, 299-303.
A case study of a tornado spawned by Hurricane Able (1952). This paper was one of the first to show some of the characteristic environmental feature differences between hurricane tornadoes and the Great Plains ones.
2. Kellerstrass, E. J., (1962): Hurricane spawned tornadoes: A case study of Carla, September 11-13, 1961. Thesis (M. S.), St. Louis University.
A case study of tornadoes associated with Carla. This work attempts to demonstrate the futility of applying mid-latitude tornado forecast techniques to hurricane tornadoes.
3. Pearson, A. D., and A. F. Sadowski, (1965): Hurricane induced tornadoes and their distribution. Mon. Wea. Rev., 93, 461-464.
A ten-year study of hurricane spawned tornadoes which shows the preferred distribution of hurricane tornadoes in the storm's right front quadrant.
4. Smith, J. S., (1965): The hurricane-tornado. Mon. Wea. Rev., 93, 453-459.
A data synthesis is developed for hurricane spawned tornadoes which shows the preference for genesis in the right front quadrant and for hurricane recurvature to the northeast.
5. Hill, E. L., W. Malkin, and W. A. Schulz, (1966): Tornadoes Associated with Cyclones of Tropical Origin--Practical Features • .!. of Appl. Meteor., 5, 745-763.
A review of the climatology of hurricane tornadoes is given. The article emphasizes the importance of convective instability. Some practical forecasting guides for hurricane tornadoes are summarized.
6. Grice, G. K., J. R. Scoggins, and R. A. Clark, (1967): An Investigation of the Tornadoes Associated with Hurricane Beulah. 26 pp.
4
Table 1 (cont'd)
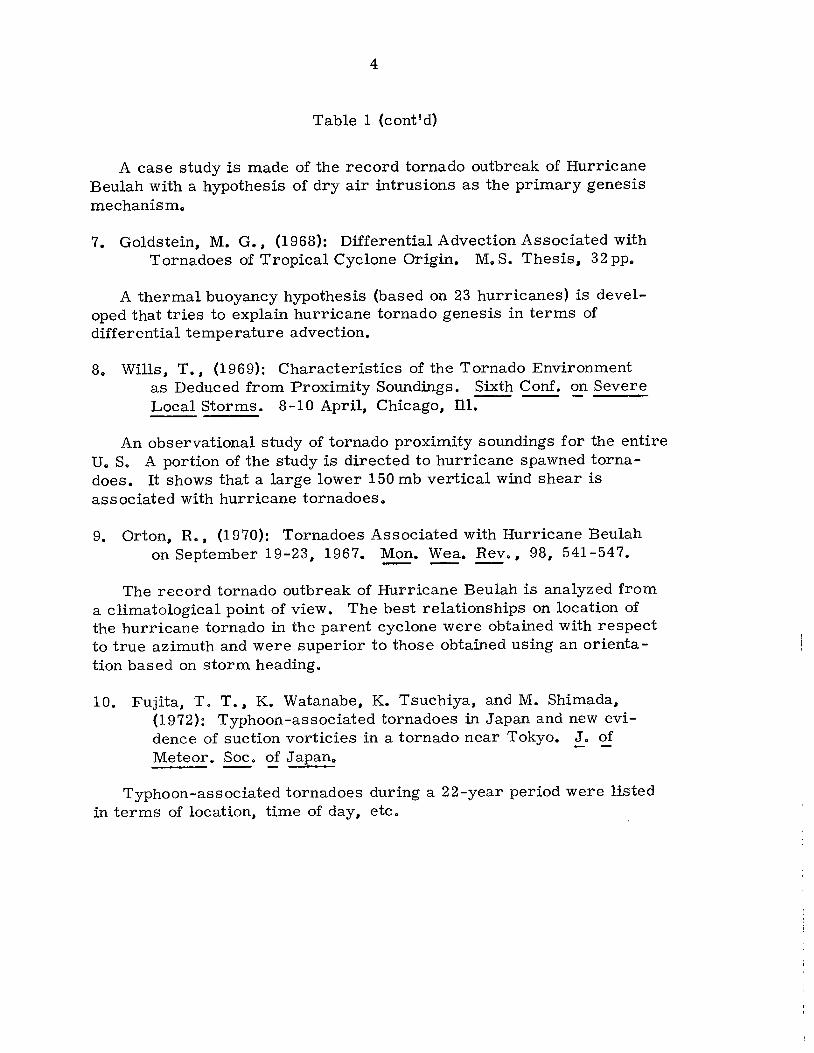
A case study is made of the record tornado outbreak of Hurricane Beulah with a hypothesis of dry air intrusions as the primary genesis mechanism.
7. Goldstein, M. G., (1968): Differential Advection Associated with Tornadoes of Tropical Cyclone Origin. M. S. Thesis, 32 pp.
A thermal buoyancy hypothesis (based on 23 hurricanes) is developed that tries to explain hurricane tornado genesis in terms of differential temperature advection.
8. Wills, T., (1969): Characteristics of the Tornado Environment as Deduced from Proximity Soundings. Sixth Conf. on Severe Local Storms. 8-10 April, Chicago, Ill.-- -- -
An observational study of tornado proximity soundings for the entire D. S. A portion of the study is directed to hurricane spawned tornadoes. It shows that a large lower 150 mb vertical wind shear is associated with hurricane tornadoes.
9. Orton, R., (1970): Tornadoes Associated with Hurricane Beulah on September 19-23, 1967. Mon. Wea. Rev., 98, 541-547.
The record tornado outbreak of Hurricane Beulah is analyzed from a climatological point of view. The best relationships on location of the hurricane tornado in the parent cyclone were obtained with respect to true azimuth and were superior to those obtained using an orientation based on storm heading.
10. Fujita, T. T., K. Watanabe, K. Tsuchiya, and M. Shimada, (1972): Typhoon-associated tornadoes in Japan and new evidence of suction vorticies in a tornado near Tokyo. J. of Meteor. Soc. ~ Japan.
Typhoon-associated tornadoes during a 22-year period were listed in terms of location, time of day, etc.
II. CLIMATOLOGY
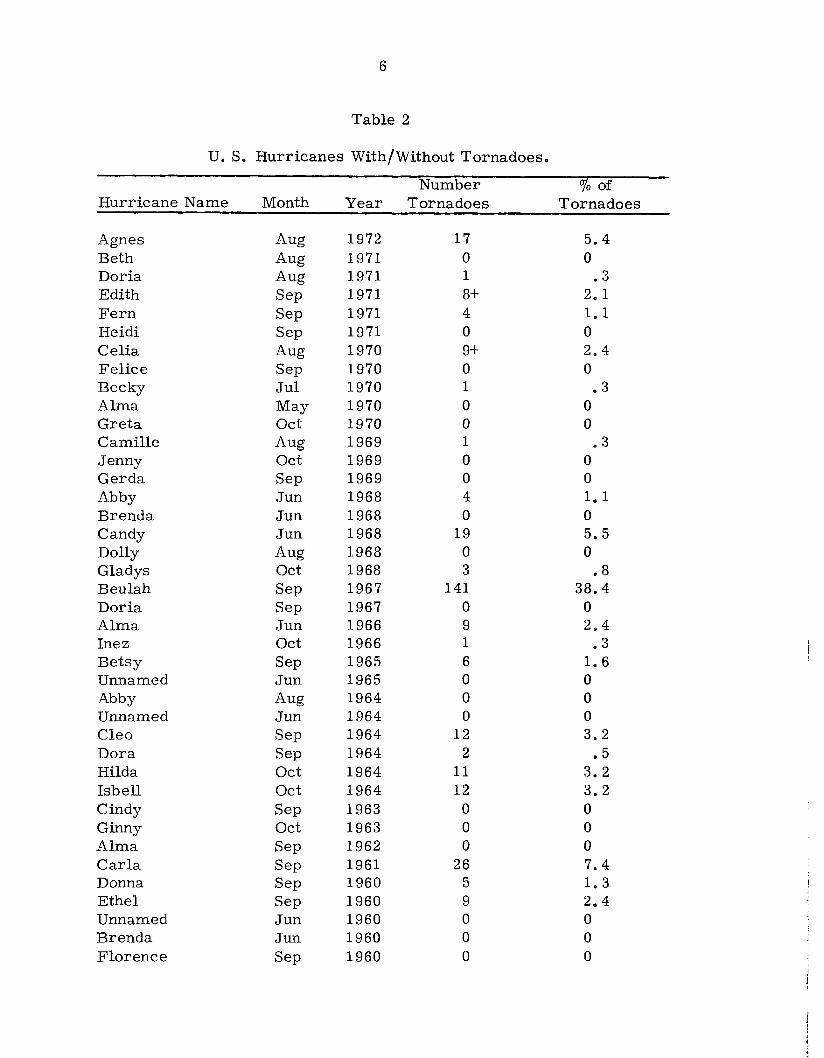
Table 2 lists all the hurricanes and tropical storms during the
period from 1948 to 1972 that have come on shore in the United States.
Of these 83 U. S. hurricanes and tropical storms. 25% spawned torna
does (a total of 373). Hurricane Beulah (1967) had 141 tornadoes (all
time record). accounting for 38% of all hurricane tornadoes. Exclud
ing Beulah. the average hurricane which spawned tornadoes had ten.
These tornadoes have occurred from May through October but most
frequently in September. Note that very few hurricane tornadoes were
reported until the middle 50's.
Table 3 (Fujita. 1972) is a similar tabulation for Japanese typhoons
which spawned tornadoes in the period from 1950 to 1971. The average
number of tornadoes per typhoon is only 2.3. and the largest number
of tornadoes per single typhoon is 8. These values are much smaller
than the U. S. ones.
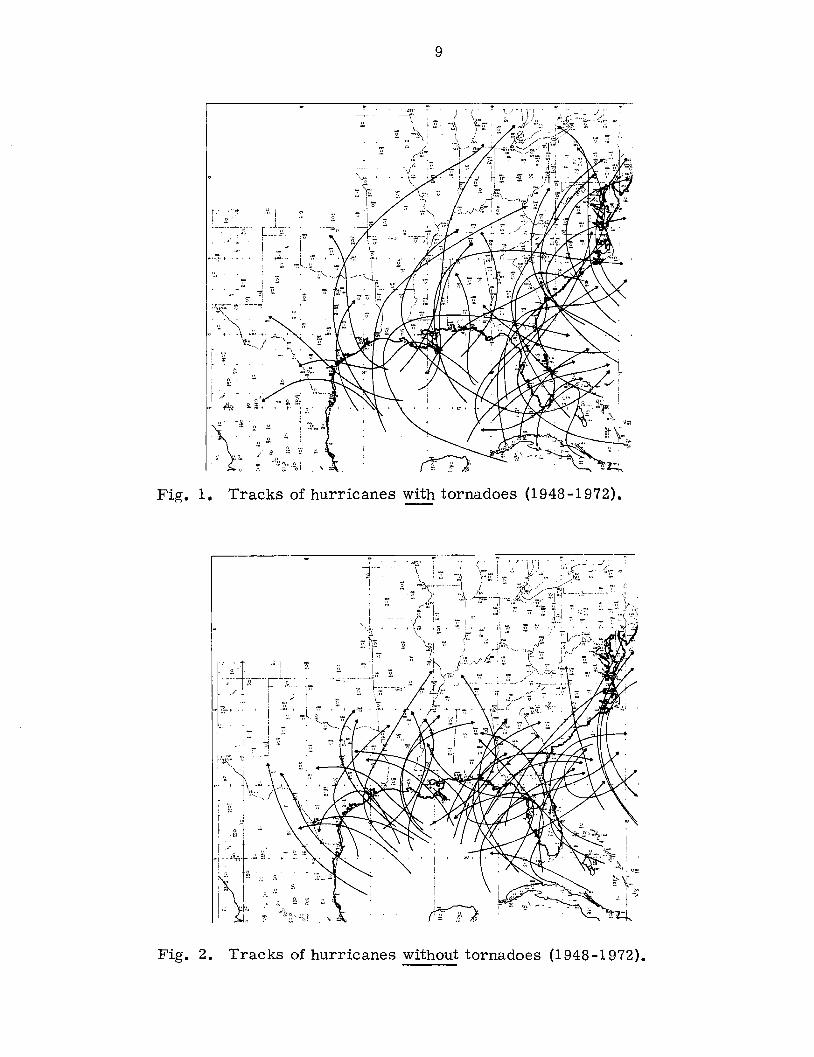
Figures 1 and 2 show the tracks of U. S. hurricanes which had and
did not have tornadoes. respectively. Note that hurricanes which
spawned tornadoes showed a preference to recurve to the northeast
while those storms which did not have tornadoes did not show this pre
ferred directional heading. Figure 3 shows the tracks of the Japanese
typhoons which had tornadoes. Nearly all recurved to the northeast.
Tornadoes Relative to Hurricane Direction. Most hurricane
typhoon tornadoes occur close to the time the storms cross land. Fig
ure 4 is a histogram of hurricane and typhoon direction frequency at
5
6
Table 2
U. S. Hurricanes With/Without Tornadoes.
Number 0/0 of Hurricane Name Month Year Tornadoes Tornadoes
Agnes Aug 1972 17 5.4 Beth Aug 1971 0 0 Doria Aug 1971 1 • 3 Edith Sep 1971 8+ 2.1
Fern Sep 1971 4 1. 1 Heidi Sep 1971 0 0 Celia Aug 1970 9+ 2.4 Felice Sep 1970 0 0 Becky Jul 1970 1 .3 Alma May 1970 0 0 Greta Oct 1970 0 0 Camille Aug 1969 1 • 3 Jenny Oct 1969 0 0 Gerda Sep 1969 0 0 Abby Jun 1968 4 1.1 Brenda Jun 1968 0 0 Candy Jun 1968 19 5.5 Dolly Aug 1968 0 0 Gladys Oct 1968 3 .8 Beulah Sep 1967 141 38.4 Doria Sep 1967 0 0 Alma Jun 1966 9 2.4 Inez Oct 1966 1 • 3 Betsy Sep 1965 6 1.6 Unnamed Jun 1965 0 0 Abby Aug 1964 0 0 Unnamed Jun 1964 0 0 Cleo Sep 1964 12 3.2 Dora Sep 1964 2 • 5 Hilda Oct 1964 11 3. 2 Isbell Oct 1964 12 3.2 Cindy Sep 1963 0 0 Ginny Oct 1963 0 0 Alma Sep 1962 0 0 Carla Sep 1961 26 7.4 Donna Sep 1960 5 1.3 Ethel Sep 1960 9 2.4 Unnamed Jun 1960 0 0 Brenda Jun 1960 0 0 Florence Sep 1960 0 0

7
Table 2 (cont'd)
Number 0/0 of Hurricane Name Month Year Tornadoes Tornadoes
Unnamed Jul 1959 0 0 Debra Jul 1959 5 1.3 Arlene Jun 1959 0 0 Irene Oct 1959 0 0 Unnamed Jun 1959 0 0 Gracie Oct 1959 5 1.3 Judith Oct 1959 1 • 3 Cindy Jul 1959 11 3.2 Helene Oct 1958 0 0 Alma Jun 1958 0 0 Ella Sep 1958 0 0 Audrey Jun 1957 23 6.6 Ester Sep 1957 0 0 Bertha Aug 1957 0 0 Unnamed Jun 1957 0 0 Debbie Sep 1957 0 0 Flossy Sep 1956 5 1.3 Unnamed Jun 1956 0 0 Connie Aug 1955 6 1.6 Diane Aug 1955 1 • 3 Brenda Aug 1955 0 0 Unnamed Aug 1955 0 0 lone Sep 1955 0 0 Alice Jun 1954 0 0 Barbara Jul 1954 0 0 Hazel Oct 1954 0 0 Carol Aug 1954 0 0 Hazel Oct 1953 1 .3 Alice Jun 1953 0 0 Florence Sep 1953 0 0 Barbara Aug 1953 0 0 Able Sep 1952 3 • 8 How Oct 1951 0 0 Baker Aug 1950 2 • 5 Love Oct 1950 0 0 King Oct 1950 0 0 Unnamed Aug 1949 4 1. 1 Unnamed Scp 1949 0 0 Unnamed Oct 1949 0 0 Unnamed Sep 1948 2 • 5 Unnamed Sep 1948 1 • 3 Unnamed Oct 1948 2 • 5

8
Table 3
Japanese Typhoons With Tornadoes.
Typhoon Number 0/0 of Name Month Year Tornadoes Tornadoes
Jane Sep 1950 1 2 Ruth Oct 1951 2 3 Mamie Aug 1953 1 2 Grace Aug 1954 2 3 Lorna Sep 1954 5 6 Louise Sep 1955 2 3 Babs Aug 1956 1 2 Emma Sep 1956 3 4 Agnes Aug 1957 1 2 Helen Sep 1958 1 2 Vera Sep 1959 2 3 Bess Aug 1960 1 2 Nancy Sep 1961 2 3 Violet Oct 1961 1 2 Thelma Aug 1962 5 6 Della Aug 1963 2 3 Helen Aug 1964 1 2 Marie Aug 1964 1 2 Lucy Aug 1965 3 4 Unnamed Jul 1967 1 2 Dinah Oct 1967 3 4 Trix Aug 1968 1 2 Della Sep 1968 5 6 Cora Aug 1969 7 9 Olga Jul 1970 1 2 Anita Aug 1970 1 2 Ivy Jul 1971 1 2 Trix Aug 1971 8 12 Virginia Sep 1971 2 3
9
Fig. 1. Tracks of hurricanes with tornadoes (1948-1972).
7-1 ...
".t :~~
I •• '0
Fig. 2. Tracks of hurricanes without tornadoes (1948-1972).

10
Fig. 3. Tracks of typhoons with tornadoes (1950-1971).
landfall. Direction at landfall of hurricanes which did not spawn
tornadoes is also shown. These results agree with the findings of Hill
et ale (1966), and Smith (1965). They showed that hurricanes recurv
ing to the northeast have a higher probability of having tornadoes than
those hurricanes which continued to move westward. The already
noted exception to this average was Beulah (1967) which traveled in a
300 0 direction and later moved toward 2400
• Typhoons in the period
from 1950 to 1971 that moved inland over Japan and spawned tornadoes
were moving with an average direction of 200
at landfall. This is in
very good agreement with the U. S. cases. There were, however,

- 20 S CJ o 15
30
'iii 25 • UI CJ
0 20
! >- 15 0 z UJ :l 10 0 UJ cr Lr.. 5
0
U.S. HURRICANES WITH
TORNADOES 1948-1972
mean 30°
240 300 0 60 120
DEGREES
11
JAPANESE TYPHOONS WITH
TORNADOES 1950-1971
mean 200 I I
d 240 300 0 60 120
DEGREES
U.S. HURRICANES WITHOUT TORNADOES 1948-1972
mean 3000
180 240 300 0 60 120
DEGREES
Fig. 4. Frequency diagrams of storm direction (in degrees) at landfall for U. S. hurricanes with and without tornadoes (194tl-1972) and Japanese typhoOOs with tornadoes (1950-1971).
many other storms crossing land and moving in a north to northeaster-
ly direction which did not produce tornadoes. In a statistical sense,
there is little difference in storm direction for hurricanes with and
without tornadoes.
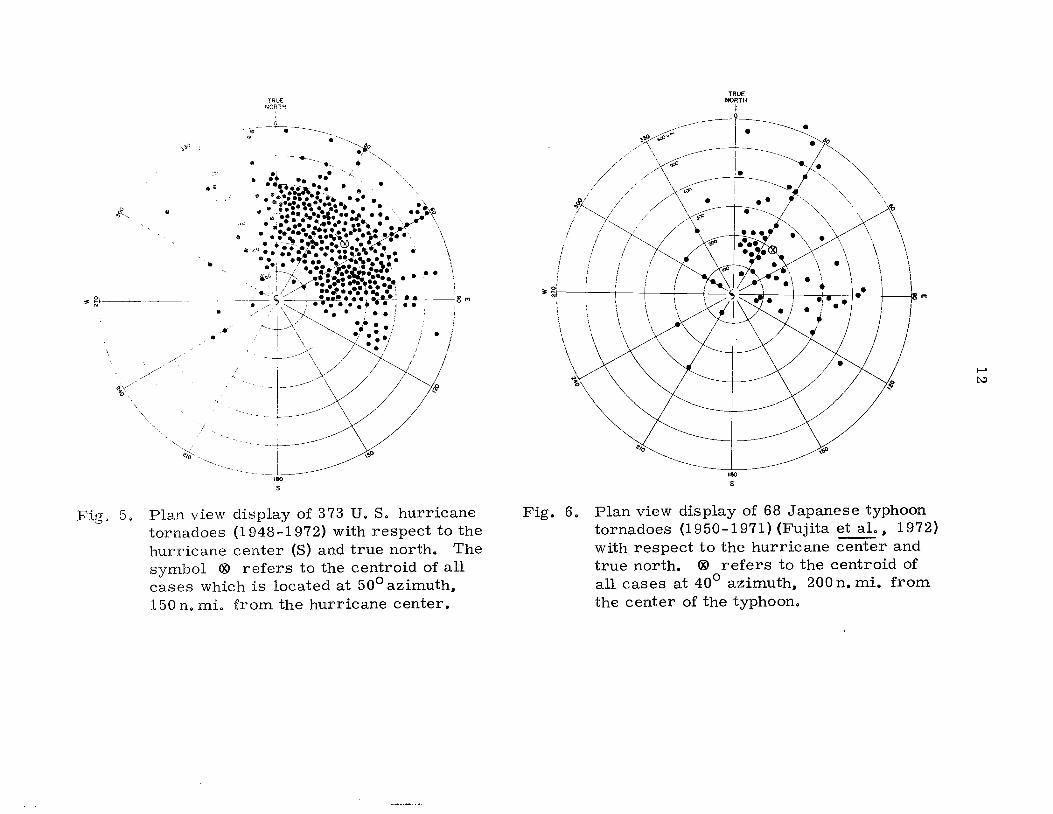
Preferred Sector of the Hurricane. Figure 5 composites al1 the
U. S. tornadoes in a plan view display with respect to true north and
distance from the center of the hurricane in nautical miles (n. mi.)
Orton (1967) has shown that a frame of reference with respect to true
.'
•
•
TR0E NORTI-I
, I
--I~1'Tl
; i . /
F:i.g, 5. Plan view display of 373 U. S. hurricane tornadoes (1948-1972) with respect to the hurricane center (S) and true north. The symbol ® refers to the centroid of all cases which is located at 500 azimuth6 150 n. mi. from the hurricane center.
,
! 01
~ ~ir----'--,---j--+---+-----':: I
:
180
5
,fP
Fig. 6. Plan view display of 68 Japanese typhoon tornadoes (1950-1971) (Fujita et al. 6 1972) with respect to the hurricane center and true north. ® refers to the centroid of all cases at 400 azimuth6 200 n. mi. from the center of the typhoon.

13
north was superior to one with respect to the directional heading of
the hurricane. It can clearly be seen that there is indeed a preferred
sector for hurricane tornadoes from 00 to 1200
azimuth and 60-250
n. mi. out from the storm center (centroid point of 50°, 150 n. mi.).
Figure 6 which was constructed from the data of Fujita et al., (1972)
shows how the Japanese cases closely agree with the above results
(with a centroid point of 400
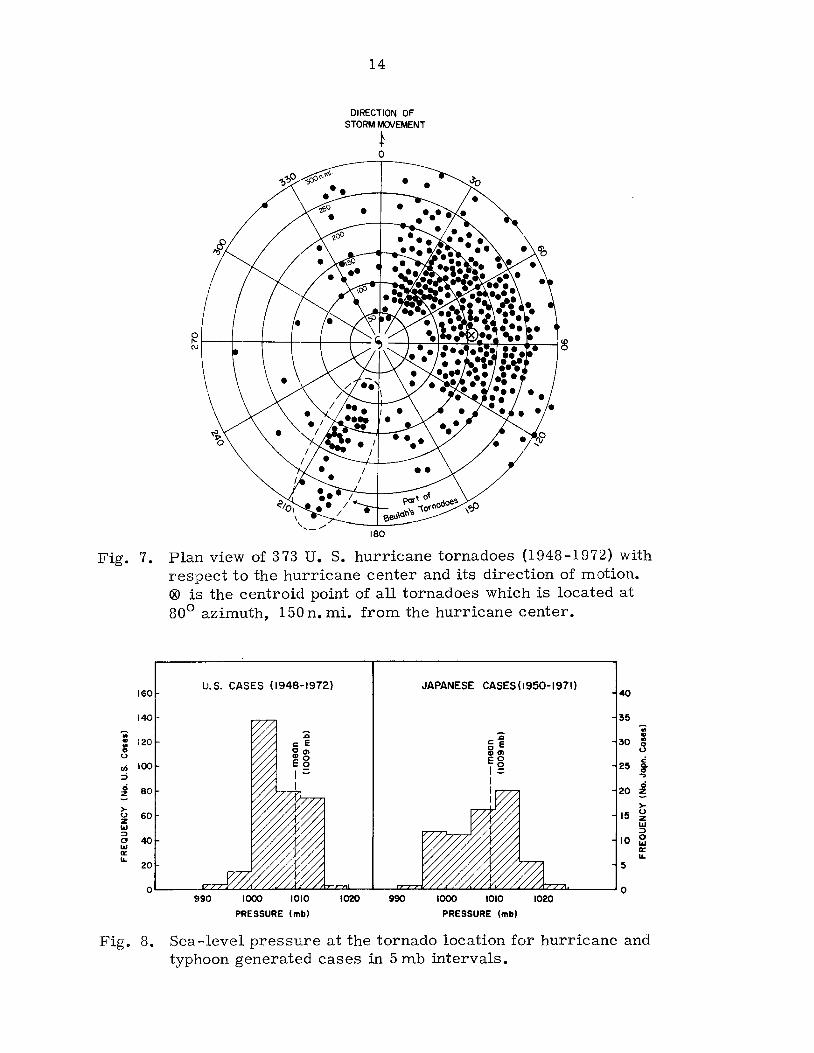
, 200 n. mi.). Figure 7 is a composite of
the U. S. tornadoes with respect to the direction of the storm's move
ment. The centroid now becomes 800
, 150 n. mi.). Note that part of
Beulah's tornadoes were located in her right rear quadrant.
It should also be noted that overall, a greater percentage of hur
ricane induced tornadoes occurred from hurricanes that moved inland
from the Gulf of Mexico than from hurricanes entering the United
States from the Atlantic. This undoubtedly is due to the geometry of
recurving hurricanes which places the right front quadrant on shore
for Gulf hurricanes and typically out to sea for the Atlantic storms
which more nearly parallel the coastline.
Sea Level Pressure. Figure 8 shows a histogram of tornado fre
quency compared to sea level pressure at the location where the
tornado occurred. These results agree with Hill et al. (1966) who
showed that most tornadoes occurred at sea level pressures from
1000 mb to 1014 mb (with an average of 1009 mb). In further analysis
of pressure, Hill et ale found that tornadoes occurring in the hurricane
stage of the tropical cyclone were located on or very near the 1004
14
DIRECTION OF STORM MOIIEMENT
} o
~~--t---t---+---+---+-~ (\l
\ ' ... _/ 180
Fig. 7. Plan view of 373 U. S. hurricane tornadoes (1948-1972) with respect to the hurricane center and its direction of motion. ® is the centroid point of all tornadoes which is located at 800 azimuth, 150 n. mi. from the hurricane center.
160 u.s. CASES (1948-1972) JAPANESE CASES (1950-1971)
40
140 35
.. :c -;; :c .. .. 120 c: e c: e 30 .. .. 0
0 Ccn :ilcn (.) (.) Cl>o EO .: en 100 Eo Ig 25 Q.
::; 1= 0
I ..,
.. I .. ~
80 I 20 ~ I >- >-(.) 60 15 (.)
z Z iii iii ~
~
a 40 10 a iii iii a:: a:: IL IL
20 5
0 0 990 1000 1010 1020 990 1000 1010 1020
PRESSURE 1mb) PRESSURE 1mb)
Fig. 8. Sea-level pressure at the tornado location for hurricane and typhoon generated cases in 5 mb intervals.
15
U.S. CASES (1948-1972)
~~
- Smoothed Frequency 50 per 3 hour period
45
40
35
30
2~
20
I~
10
LOCAL STANOARD TIt,lE
JAPANESE CASES (1951-1970)
/I - Smoothed Frequ.ncy
plr 3 hour period 10
LOCAL STANDARD Tlt,lE
9
8 i u
[ 6 .!l
.; ~ )u
4 Ci :> o
3 ~
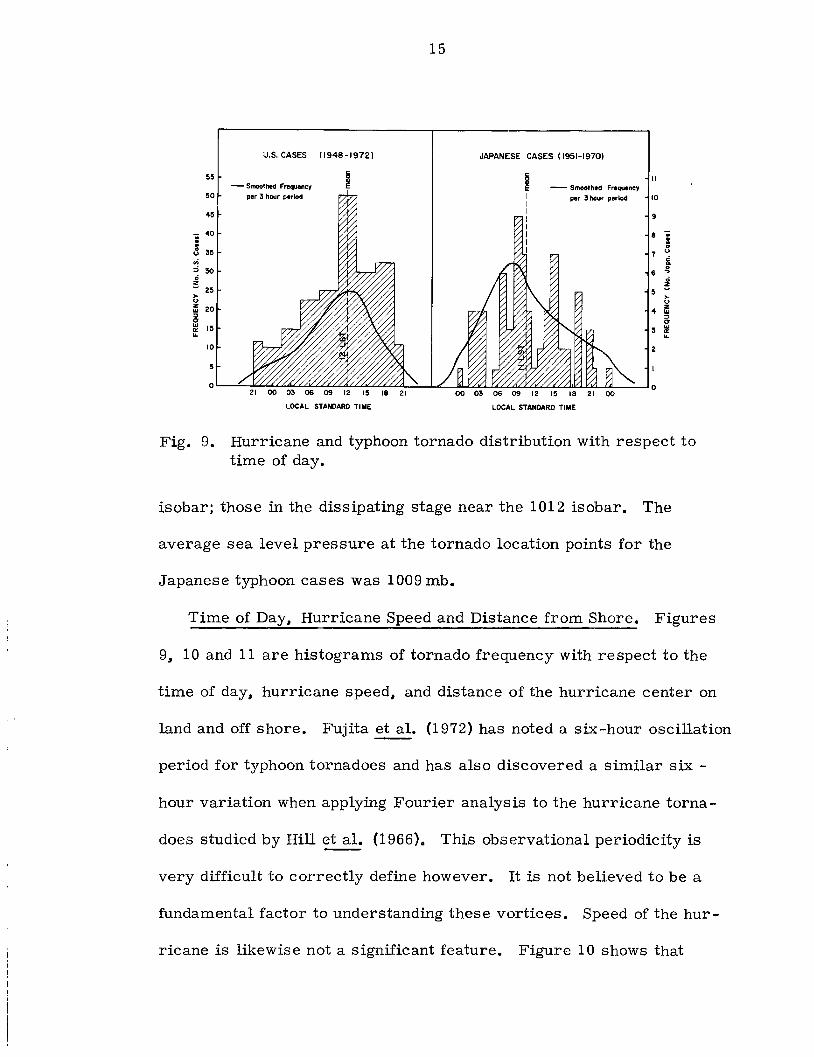
Fig. 9. Hurricane and typhoon tornado distribution with respect to time of day.
isobar; those in the dissipating stage near the 1012 isobar. The
average sea level pressure at the tornado location points for the
Japanese typhoon cases was 1009 mb.
Time of Day~ Hurricane Speed and Distance from Shore. Figures
9~ 10 and 11 are histograms of tornado frequency with respect to the
time of day, hurricane speed, and distance of the hurricane center on
land and off shore. Fujita et al. (1972) has noted a six-hour oscillation
period for typhoon tornadoes and has also discovered a similar six -
hour variation when applying Fourier analysis to the hurricane torna-
does studied by Hill et ale (1966). This observational periodicity is
very difficult to correctly define however. It is not believed to be a
fundamental factor to understanding these vortices. Speed of the hur-
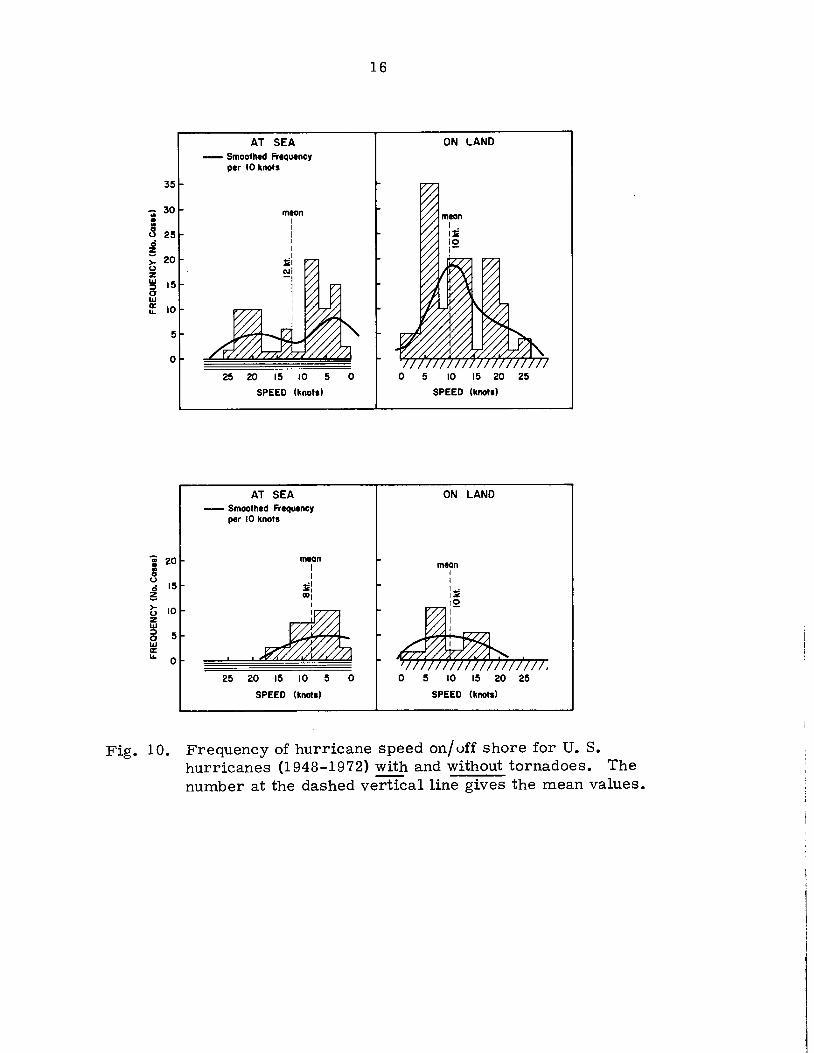
ricane is likewise not a significant feature. Figure 10 shows that
35
-;; 30 .. .. 8 25 0 ~
t 20
z 1&1 15 ::J 0 1&1 a: 10 ....
5
0
-;; 20 : 0 0 0 15 ~ >- 10 0 Z 1&1 ::J 5 0 1&1 a: ....
0
AT SEA - Smoothed Frequency
per 10 knots
25 20 15 10 5 0
SPEED (knot,)
AT SEA - Smoothed Frequency
per 10 knots
mean I 1
lii CDI
1
,A 25 20 15 10 5 0
SPEED (knot,)
16
ON LAND
o 5 10 15 20 25
SPEED (knot,)
ON LAND
mean 1
1
I"" I""
~//// o 5 10 15 20 25
SPEED (knots)
Fig. 10. Frequency of hurricane speed on/off shore for U. S. hurricanes (1948-1972) with and without tornadoes. The number at the dashed vertical line gives the mean values.
55
50
45
Ii 40
~ u 35 .; z - 30 >-u 15 25 ::;)
o Il1 20 \&.
15
10
5
OCEAN
-400 -300 -200
17
-100 ahore 100
NAUTICAL MILES
- Smoothed Frequency per 100 n. mi.
LAND
200 300 400
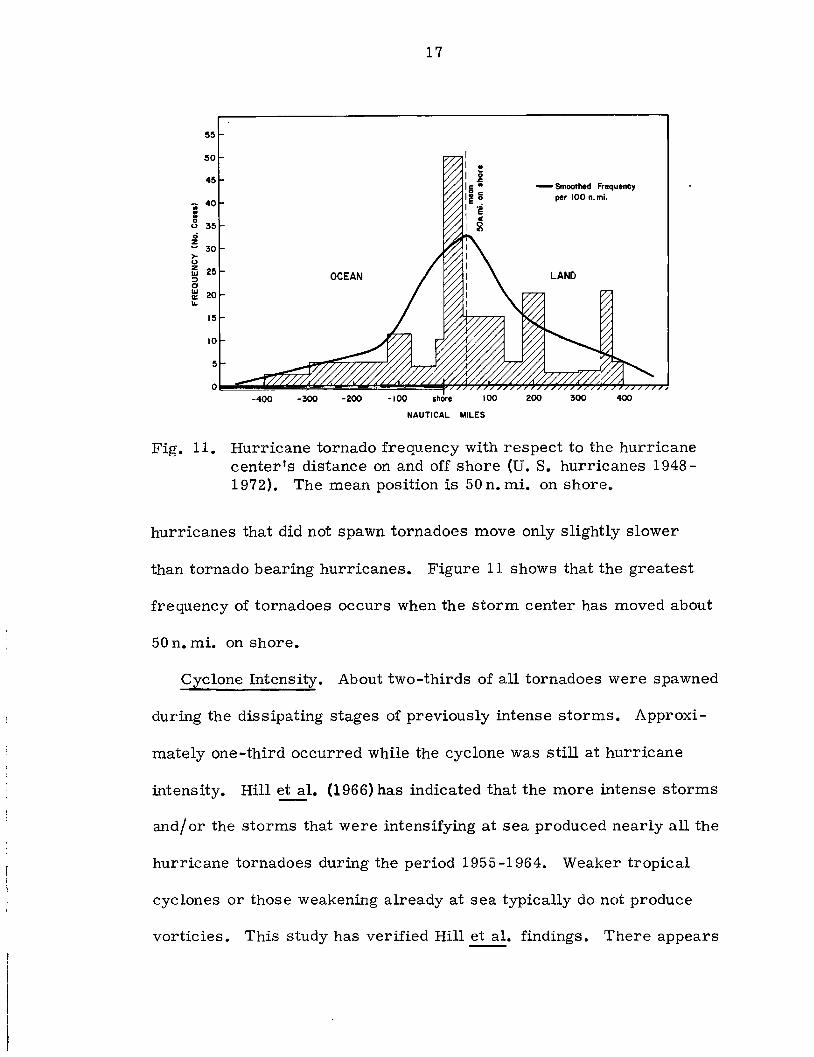
Fig. 11. Hurricane tornado frequency with respect to the hurricane center's distance on and off shore (U. S. hurricanes 1948-1972). The mean position is 50 n. mi. on shore.
hurricanes that did not spawn tornadoes move only slightly slower
than tornado bearing hurricanes. Figure 11 shows that the greatest
frequency of tornadoes occurs when the storm center has moved about
50 n. mi. on shore.
Cyclone Intensity. About two-thirds of all tornadoes were spawned
during the dissipating stages of previously intense storms. Approxi-
mately one-third occurred while the cyclone was still at hurricane
intensity. Hill et ale (1966) has indicated that the more intense storms
and/ or the storms that were intensifying at sea produced nearly all the
hurricane tornadoes during the period 1955 -1964. Weaker tropical
cyclones or those weakening already at sea typically do not produce
vorticies. This study has verified Hill et ale findings. There appears
24
.. 20 :: o u 16
~ >- 12 ~ ~ S a: ...
8
4
U.S. HURRICANES WITHOUT
TORNADOES 1948-1972
mean 975mb
18
U.S. HURRICANES WITHOUT
TORNADOES 1948-1972
mean 65 IIts
0r----9~DO~~~~5~9~~=97~5~1~~~-------r------~LW~~~LL~L---~
24
OJ 20 :: o u 16 ci ~ >- 12 u z ~ 8 o II! ... 4
LOWEST PRESSURE (mb)
U.S. HURRICANES WITH
TORNADOES 1948-1972
mean 955mb
MAX SFC WIND (knol.)
U. S. HURRICANES WITH
TORNADOES 1948-1972
meon 102 kl. ,
0~--~900~~~~5~~~~97~5~1~~~------~--------~L--5~0~ro~~~~LIILO----~
LOWEST PRESSURE (mb) MAX SFC WIND (knol.)
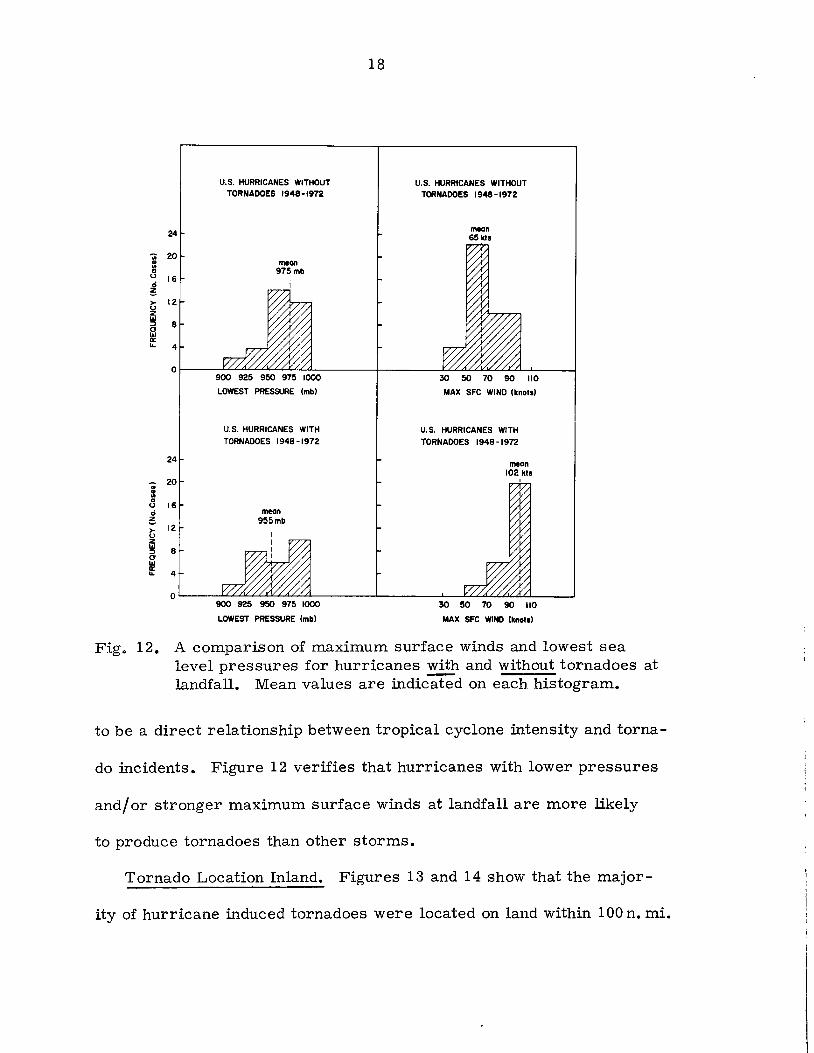
Fig. 12. A comparison of maximum surface winds and lowest sea level pressures for hurricanes with and without tornadoes at landfall. Mean values are indicated on each histogram.
to be a direct relationship between tropical cyclone intensity and torna-
do incidents. Figure 12 verifies that hurricanes with lower pressures
and/ or stronger maximum surface winds at landfall are more likely
to produc e tornadoes than other storms.
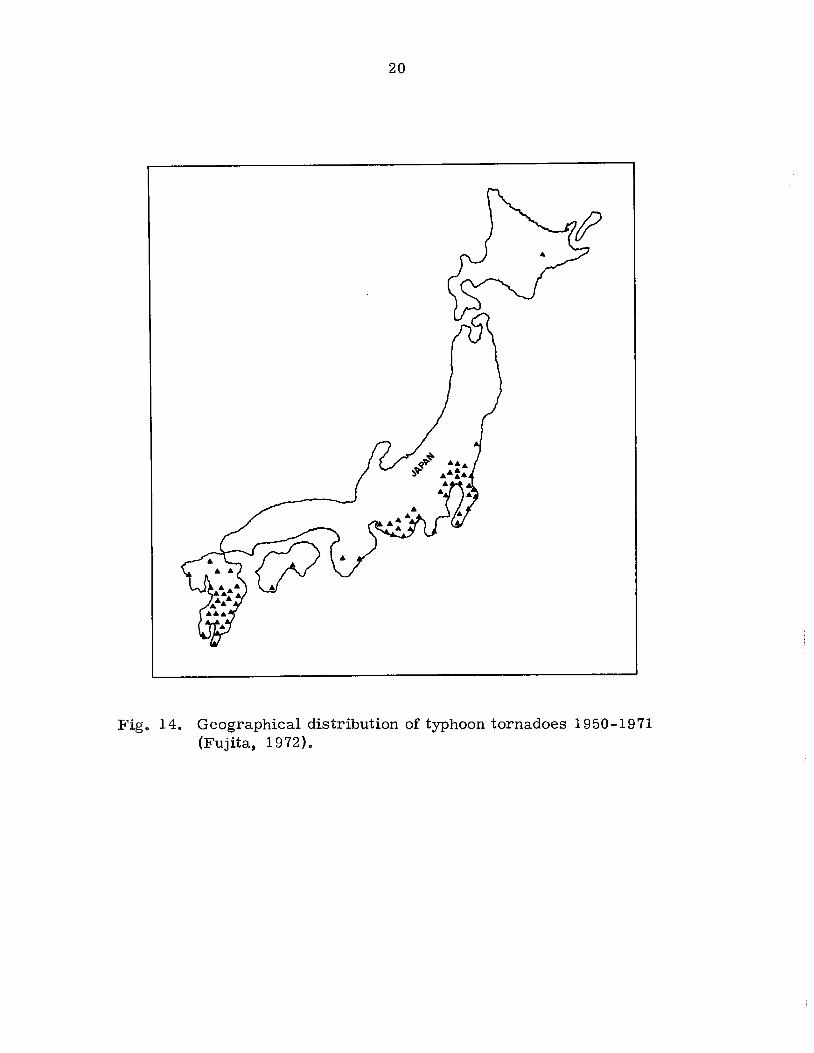
Tornado Location Inland. Figures 13 and 14 show that the major-
ity of hurricane induced tornadoes were located on land within 100 n. mi.

"'_BEULAH 1967
19
Fig. 13. Geographical distribution of hurricane tornadoes 1948-1972.
of shore. This demonstrates, as will be shown later, that tornadoes
occur when the hurricane undergoes rapid dissipation as it first comes
on shore.
Summary. Hurricane tornadoes occur in the right front quadrant
of the cyclone. They are directly related to the storm intensity as it
strikes land. The majority of tornadoes occur inland within 100 n. mi.
of shore. There appears to be very little correlation of tornado
occurrence with storm velocity, direction or time of day. Most torna-
does are spawned at an environmental pressure of 1009 mb and at the
time when the hurricane's center is 50 n. mi. inland.
20
Fig. 14. Geographical distribution of typhoon tornadoes 1950-1971 (Fujita, 1972).
III. ENVIRONMENTAL WIND AND STABILITY CONDITIONS
Hurricanes have been divided into two classes: (1) those producing
tornadoes and (2) those not producing tornadoes. Rawinsonde and
pibal reports were constructed for both classes of storms. Seventy
five proximity soundings were gathered for the tornado cases. These
are all the soundings which were available. A proximity sounding was
defined as one within 100 n. mi. and three hours of the tornado occur
rence. Seventy-five soundings were also compiled for non-tornado
storms. These latter soundings were selectively paired with the tor
nado ones. matching, as close as possible the same storm track,
storm trajectory, distance from the storm center, and azimuth angle.
Very few hurricane spawned tornadoes were reported in the 1940 's
and 50 'so This was partly due to a sparser observational network and
lack of knowledge that such vortices existed. Some of the tornado
damage may have been confused with that of the hurricane damage.
Hurricane tornadoes often occur over uninhabited swamplandS or in
areas where people have been evacuated for the hurricane. More
attention was focused on these types of tornadoes after Audrey (1957)
spawned 23 of them. The WSR-57 weather radar does not have the
same success in picking up the weaker hurricane tornadoes as it does
in detecting the more intense Great Plains ones. The radar scope
generally sees only the strong convective elements of the hurricane.
If the tornadoes happen to be very close to the radar site however,
then the WSR-57 can monitor them (Rudd. 1964).
21
22
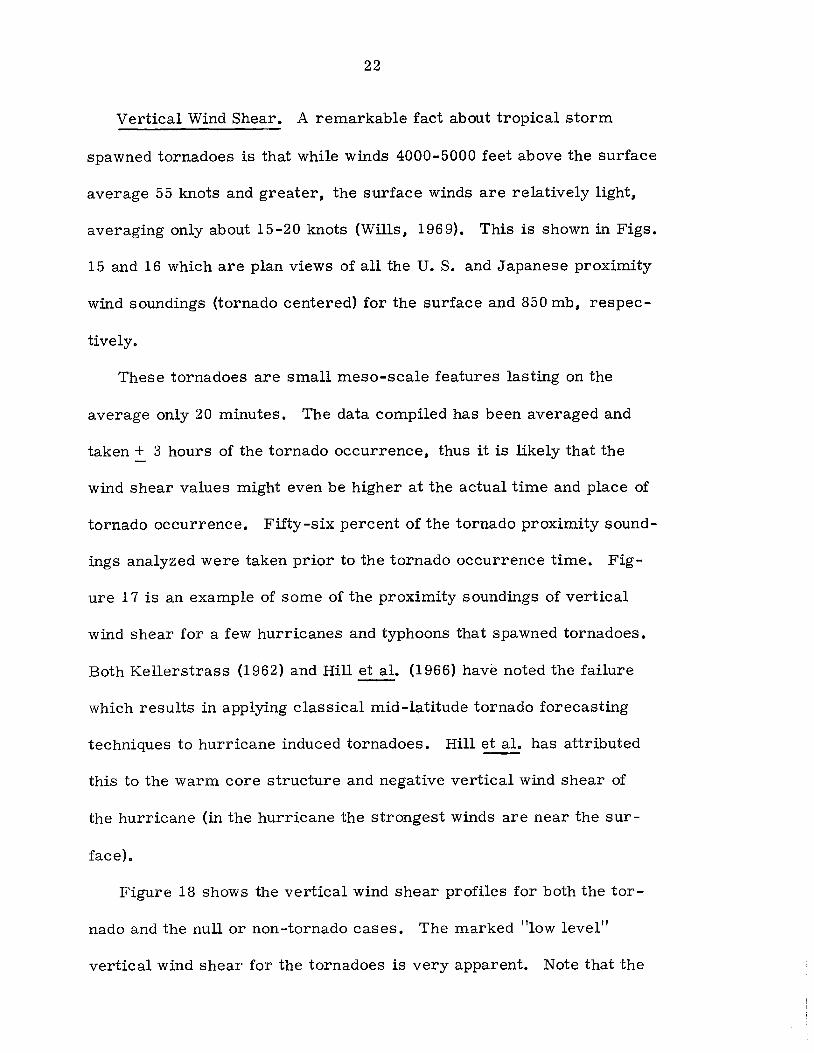
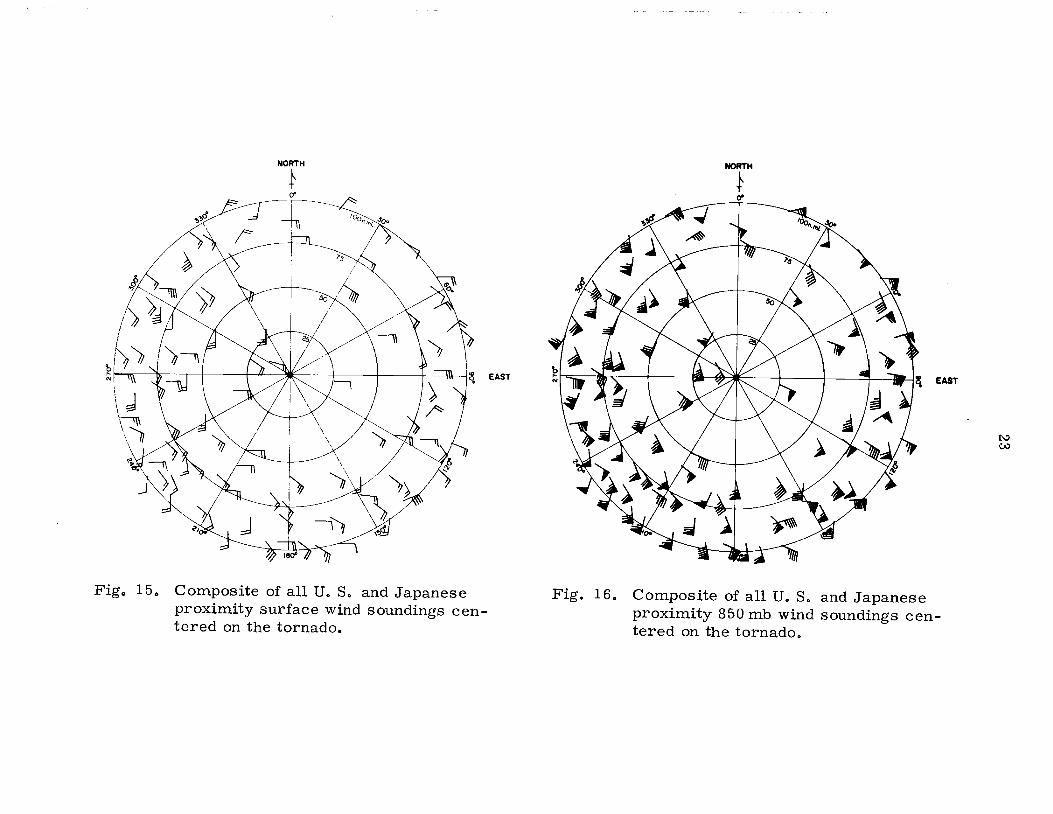
Vertical Wind Shear. A remarkable fact about tropical storm
spawned tornadoes is that while winds 4000-5000 feet above the surface
average 55 knots and greater, the surface winds are relatively light,
averaging only about 15-20 knots (Wills, 1969). This is shown in Figs.
15 and 16 which are plan views of all the U. S. and Japanese proximity
wind soundings (tornado centered) for the surface and 850 mb, respec
tively.
These tornadoes are small meso-scale features lasting on the
average only 20 minutes. The data compiled has been averaged and
taken + 3 hours of the tornado occurrence, thus it is likely that the
wind shear values might even be higher at the actual time and place of
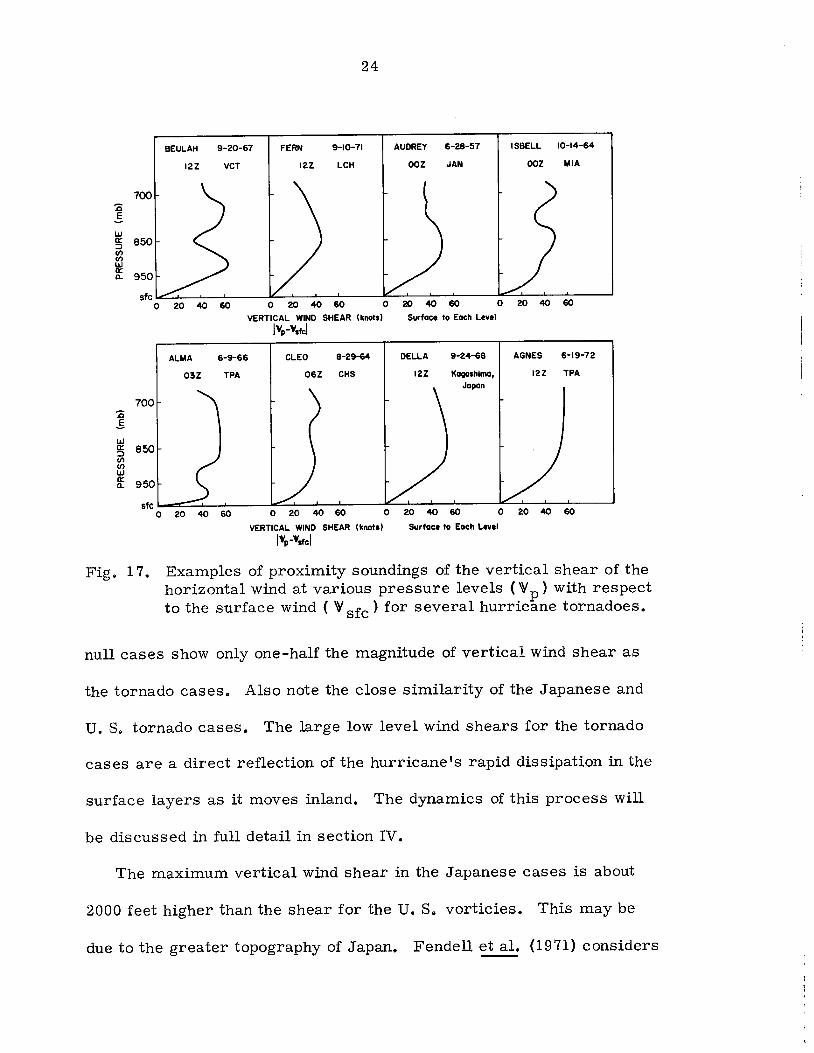
tornado occurrence. Fifty-six percent of the tornado proximity sound
ings analyzed were taken prior to the tornado occurrence time. Fig
ure 17 is an example of some of the proximity soundings of vertical
wind shear for a few hurricanes and typhoons that spawned tornadoes.
Both Kellerstrass (1962) and Hill et ale (1966) have noted the failure
which results in applying classical mid-latitude tornado forecasting
techniques to hurricane induced tornadoes. Hill et al. has attributed
this to the warm core structure and negative vertical wind shear of
the hurricane (in the hurricane the strongest winds are near the sur
face).
Figure 18 shows the vertical wind shear profiles for both the tor
nado and the null or non-tornado cases. The marked "low level"
vertical wind shear for the tornadoes is very apparent. Note that the
NORTH
} Cf'
EAST
Figo 15 0 Composite of all U. S. and Japanese proximity surface wind soundings centered on the tornado.
NORTH
} Cf'
Fig. 16. Composite of all U. S. and Japanese proximity 850 mb wind soundings centered on the tornado.
t..:l CAl
700
w ~ 850 rn rn ~ 0.. 950
BEULAH 9-20-67
12Z VCT
24
FERN 9-10-71 AUDREY 6-28-57 ISBELL 10-14-64
12Z LCH OOZ JAN OOZ MIA
sfc~~~ __ ~ ____ ~-L __ ~-L ____ ~~ __ ~~ ____ ~~~-L~ ____ ~
0204060 0204060
VERTICAL WIND SHEAR (knots)
IVp-Vsfcl
ALMA 6-9-66 CLEO 8-29-64
700
w ~ 850 rn rn w g: 950
03Z TPA 06Z CHS
0204060 0204060
Surface to Each Level
DELLA 9-24-68 AGNES 6-19-72
12Z KaQOShima, 12Z TPA Japan
sfc~~~--~----~~--~~----~~--~-L----~~~~~----~
0204060 0204060
VERTICAL WIND SHEAR (knotl)
I'P-'flfel
0204060 o 20 40 60
Surface to Each Ltvel
Fig. 17. Examples of proximity soundings of the vertical shear of the horizontal wind at various pressure levels (W p ) with respect to the surface wind ( W sfc ) for several hurricane tornadoes.
null cases show only one-half the magnitude of vertical wind shear as
the tornado cases. Also note the close similarity of the Japanese and
u. s. tornado cases. The large low level wind shears for the tornado
cases are a direct reflection of the hurricane's rapid dissipation in the
surface layers as it moves inland. The dynamics of this process will
be discussed in full detail in section IV.
The maximum vertical wind shear in the Japanese cases is about
2000 feet higher than the shear for the U. S. vorticies. This may be
due to the greater topography of Japan. Fendell et ale (1971) considers

:0 .§ UJ 0:: :::> II) II) UJ a:: a..
200
300
400
500
600
700
800
900
, , \ . \ '.
/.. ....-!:
\ " \ \ \ \~
\~ \~
(II \::; en
\~ 1~ 1~ I iii ::j , J
I / /....-.
25
sfc .... ~----"I--_----"I--_----" __ ----" __ ----"_----J o 10 20 30 40 50
VERTICAL WIND SHEAR IVp- ~sfcl (knots) Sfc to Each Level
Fig. 18. Proximity vertical wind shear profiles for hurricane and typhoon tornadoes and right front quadrant wind shears for U. S. hurricanes without tornadoes. I W - W sfc I gives the magnitude of the vertical wind shearPbetween any pressure level wind ( W p) and the surface wind ( W sfc ).
the lifting of the dying hurricane over raised topography to be an im-
portant genesis mechanism. This certainly could not be the case for
the Florida and the Gulf States tornadoes. however.
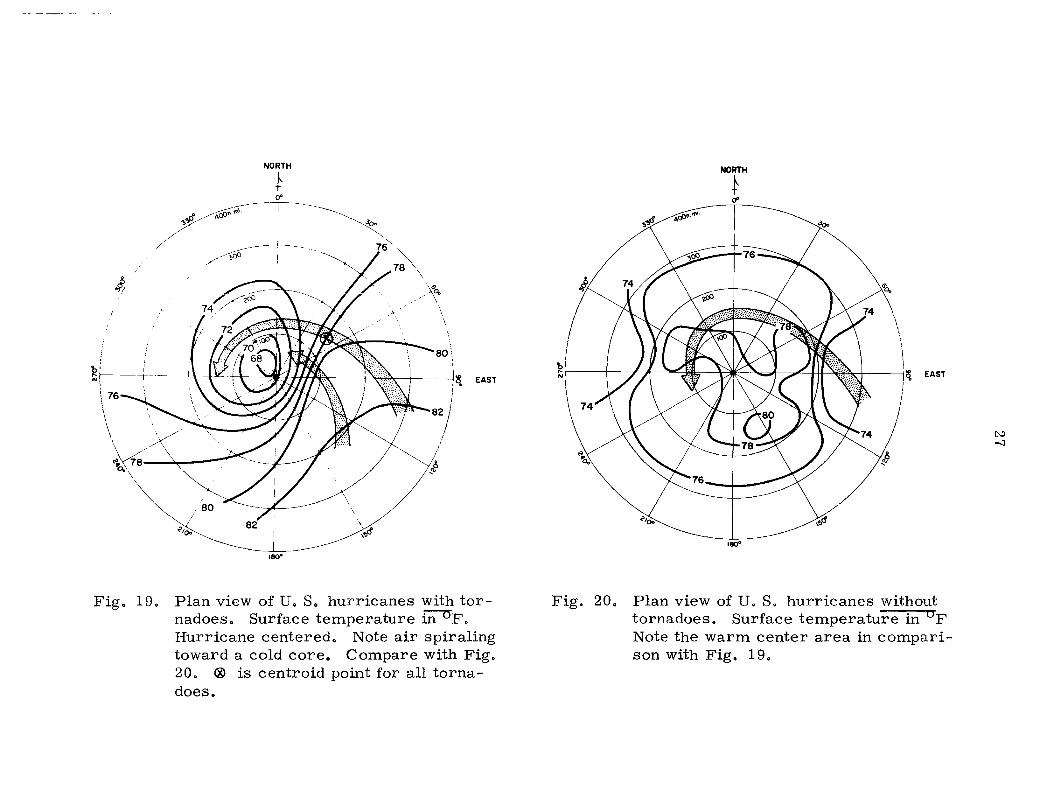
Figures 19 - 28 result from compositing data in all the hurricane
quadrants for both tornado and non-tornado hurricanes separately
(D. S. cases 1948-1972). Note in Figs. 19 and 27 that the tornado hur-
ricanes show a definite cold core structure at the surface while at
850 mb a semi-warm core is observed. This supports the idea that
26
tornado bearing hurricanes dissipate and lose their warm core
structure in the boundary layer first.
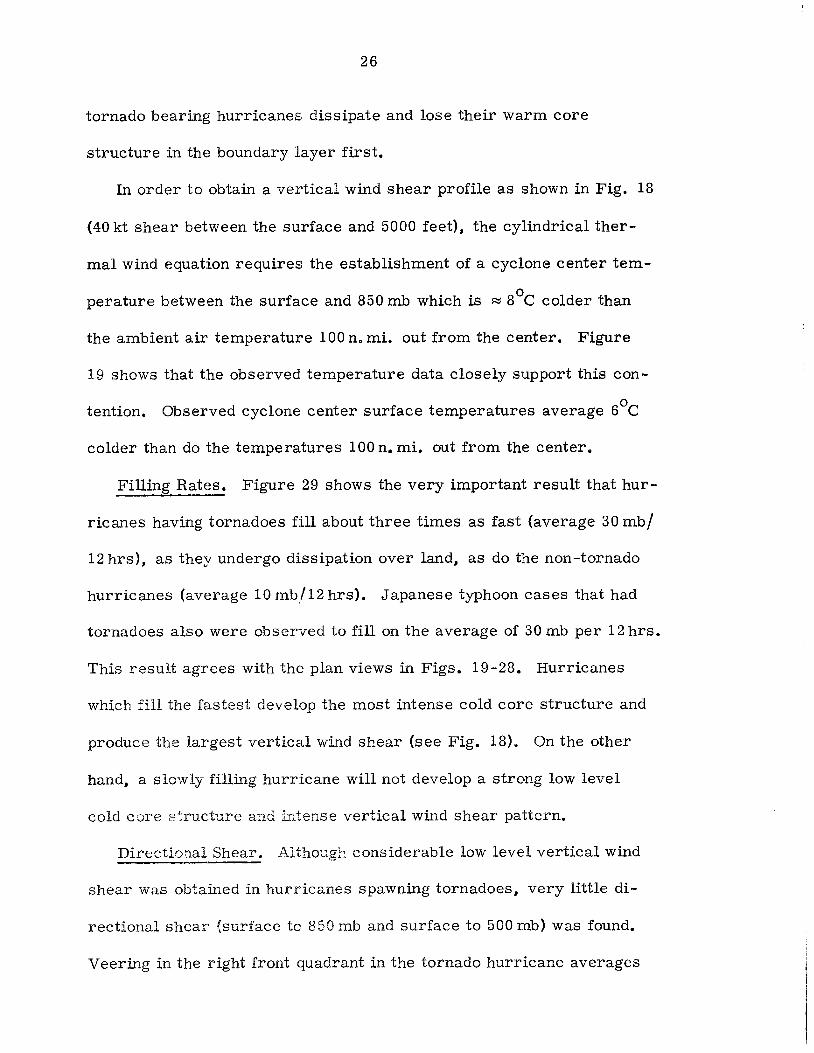
In order to obtain a vertical wind shear profile as shown in Fig. 18
(40 kt shear between the surface and 5000 feet), the cylindrical ther-
mal wind equation requires the establishment of a cyclone center tem
perature between the surface and 850 mb which is ~ 80C colder than
the ambient air temperature 100 n. mi. out from the center. Figure
19 shows that the observed temperature data closely support this con-
tention. o
Observed cyclone center surface temperatures average 6 C
colder than do the temperatures 100 n. mi. out from the center.
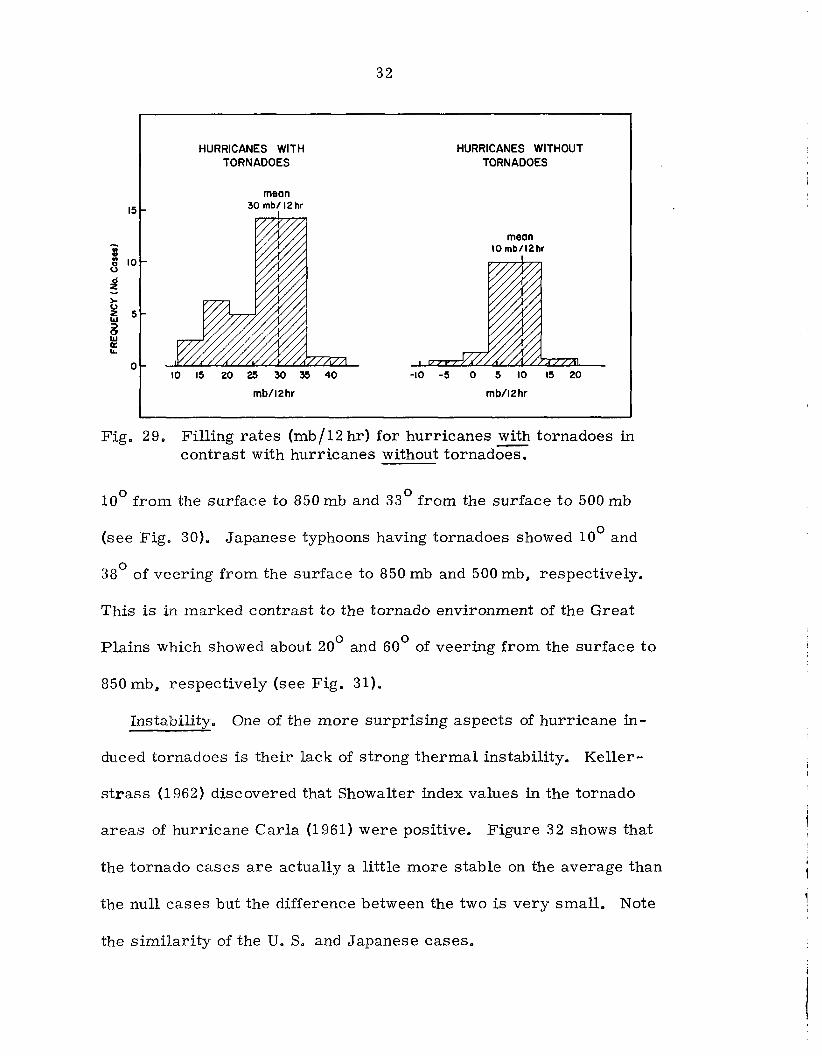
Filling Rates. Figure 29 shows the very important result that hur
ricanes having tornadoes fill about three times as fast (average 30 mb/
12 hrs), as they undergo dissipation over land, as do the non-tornado
hurricanes (average 10 mb/12 hrs). Japanese typhoon cases that had
tornadoes also were observed to fill on the average of 30 mb per 12 hrs.
This result agrees with the plan views in Figs. 19-28. Hurricanes
which fill the fastest develop the most intense cold core structure and
produce the largest vertical wind shear (see Fig. 18). On the other
hand, a slowly filling hurricane will not develop a strong low level
cold core ::=:-i;ructure and intense vertical wind shear pattern.
Directional Shear. Although considerable low level vertical wind
shear was obtained in hurricanes spawning tornadoes, very little di-
rectional shear (surface to 850 mb and surface to 500 mb) was found.
Veering in the right front quadrant in the tornado hurricane averages
hi i ~t--;--~
\ 76 : \
Fig. 19.
82 \
\
80'\
----i~ EAST
82) I
/ /j
Plan view of U. S. hurricanes with tornadoes. Surface temperature ~F. Hurricane centered. Note air spiraling toward a cold core. Compare with Fig. 20. ® is centroid point for all tornadoes.
NORTH
} (f'
EAST
,80"
Fig. 20. Plan view of U 0 So hurricanes without tornadoes. Surface temperature in of Note the warm center area in comparison with Fig. 19.

Fig. 21.
NORTH
t (f'
,;;1
180"
U. S. hurricanes with tornadoes. Surface pressure in (mb). Hurricane centered. ® is the centroid for all tornadoes.
NORTH
} (f'
.(p .....
~r---+---++--N EAST
_~,;;1 180"
Fig. 22. U. S. hurricanes without tornadoes. Surface pressure in (mb). Hurricane centered.

NORTH
} if
,41
.80"
Fig. 23. Hurricanes with tornadoes. Averaged surface winds (knots). Hurricane centered. Note how weak the winds are around the centroid point for all tornadoes ( ® ).
NORTH
} if
.80"
Fig. 24. U. S. hurricanes without tornadoes. Averaged surface wind (knots). Hurricane centered. Note in the right front quadrant 150 n. mi. out from the center that the winds are twice as high as the winds in Fig. 23.
NORTH
t r:I'
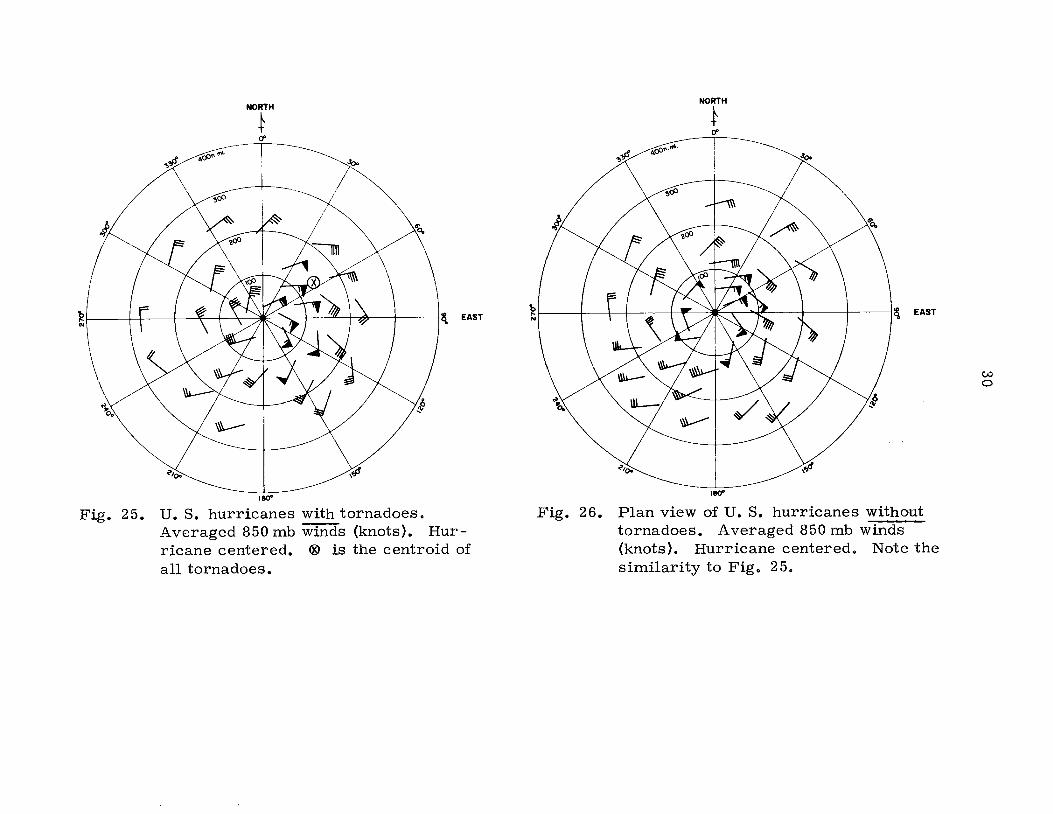
Fig. 25. U. S. hurricanes with tornadoes. Averaged 850 mb winds (knots). Hurricane centered. ® is the centroid of all tornadoes.
NORTH
t r:I'
180"
Fig. 26. Plan view of U. S. hurricanes without tornadoes. Averaged 850 mb winds (knots). Hurricane centered. Note the similarity to Fig. 25.
w o

NORTH
}
..,,~ 'cP·""
J, /
I ,/' I I
~I I /1 I \ '* \ I I~ EAST
Fig. 27.
'yd' ,':J
180"
Plan view of U. S. hurricanes with tor-- ()':::; nadoes. 850 mb temperature in C. Hurricane centered. ® is the centroid of all tornadoes.
NORTH
} 0"
..,,~ 'rf:J •. "" . :!Do
~I II )I( II \1 Iq EAST
180"
Fig. 28. Plan view of U. S. hurricanes without tornadoes. 850 mb temperature in °C. Hurricane centered.
w ......
15
-= 8 10
o
HURRICANES WITH TORNADOES
mean 30 mb/12hr
10 15 20 25 30 35 40
mb/12hr
32
HURRICANES WITHOUT TORNADOES
mean 10 mbll2hr
-10 -5 0 5 10 15 20
mb/12hr
Fig. 29. Filling rates (mb/12 hr) for hurricanes with tornadoes in contrast with hurricanes without tornadO"e'8."
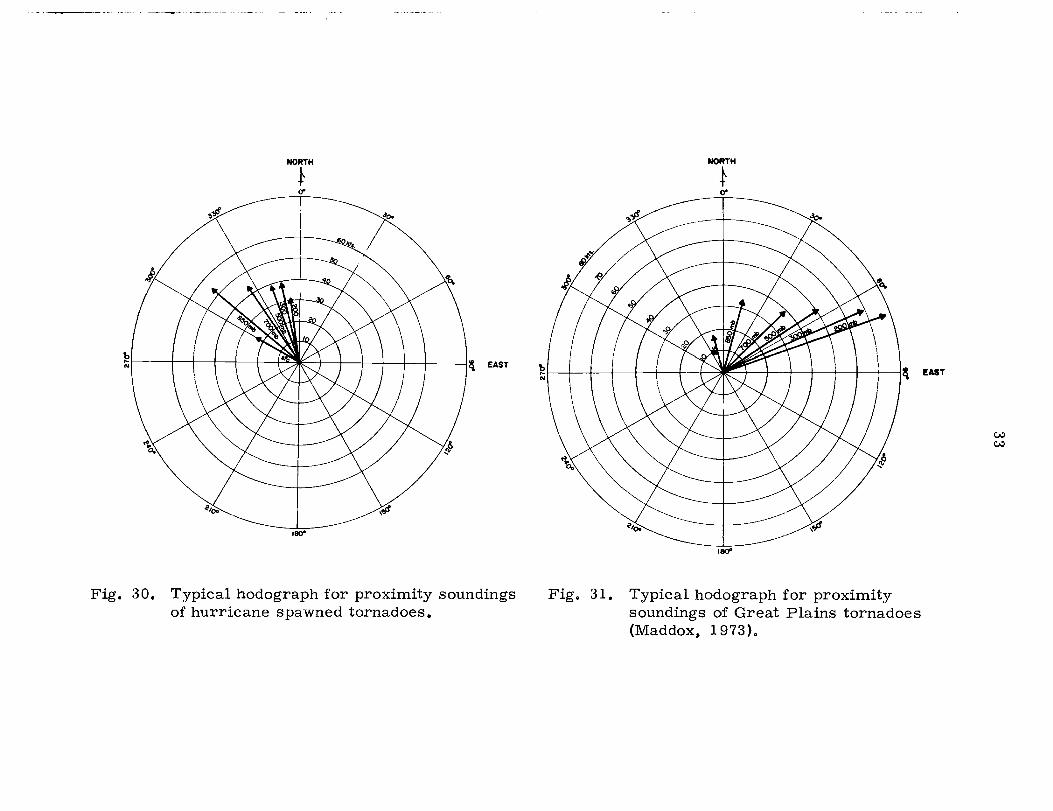
o 0 10 from the surface to 850 mb and 33 from the surface to 500 mb
(see Fig. 30). Japanese typhoons having tornadoes showed 100 and
380 of veering from the surface to 850 mb and 500 mb. respectively.
This is in marked contrast to the tornado environment of the Great
Plains which showed about 200 and 600
of veering from the surface to
850 mb. respectively (see Fig. 31).
Instability. One of the more surprising aspects of hurricane in-
duced tornadoes is their lack of strong thermal instability. Keller-
strass (1962) discovered that Showalter index values in the tornado
areas of hurricane Carla (1961) were positive. Figure 32 shows that
the tornado cases are actually a little more stable on the average than
the null cases but the difference between the two is very small. Note
the similarity of the U. S. and Japanese cases.
NORTH
} (f'
~Nt-----r-~-+--r--r-+~~~-+--~4--+--~--~ ~ EAST
180"
Fig. 30. Typical hodograph for proximity soundings of hurricane spawned tornadoes.
NORTH
} (f'
Fig. 31. Typical hodograph for proximity soundings of Great Plains tornadoes (Maddox. 1973).

34
5 10 15 20 "C 25 30 35 40 ["TT rrp ',,]TTT""rITT""T ',--rTT I I Iii iii·""" rTTT"'T'TTTT'T'TT>I' I I 'I I I"
40 50 60 70 OF 80 90 100
TEMPERATURE
Fig. 32. Averaged proximity soundings for hurricane and typhoon tornadoes and right front quadrant soundings for U. S. hurricanes without tornadoes.
Goldstein (1968) concluded that hurricane tornadoes occur where
the air is nearly unstable and differential advection at 850-700 mb and
700-500 mb of .50C/hr or more adds further instability to the low
level environment. Tornadoes did not occur where there was no dif-
ferential advection or where it occurred at a rate less than the above.
He notes that in the tornado cases the lifted index changed from 0 to
35
-2 in 12 hours while in the non-tornado cases, the lifted index remained
close to O. Thus, there appeared to be only very small stability dif
ferences between hurricanes with and without tornadoes. It is hard to
explain why previous authors have stressed instability as a primary
genesis mechanism.
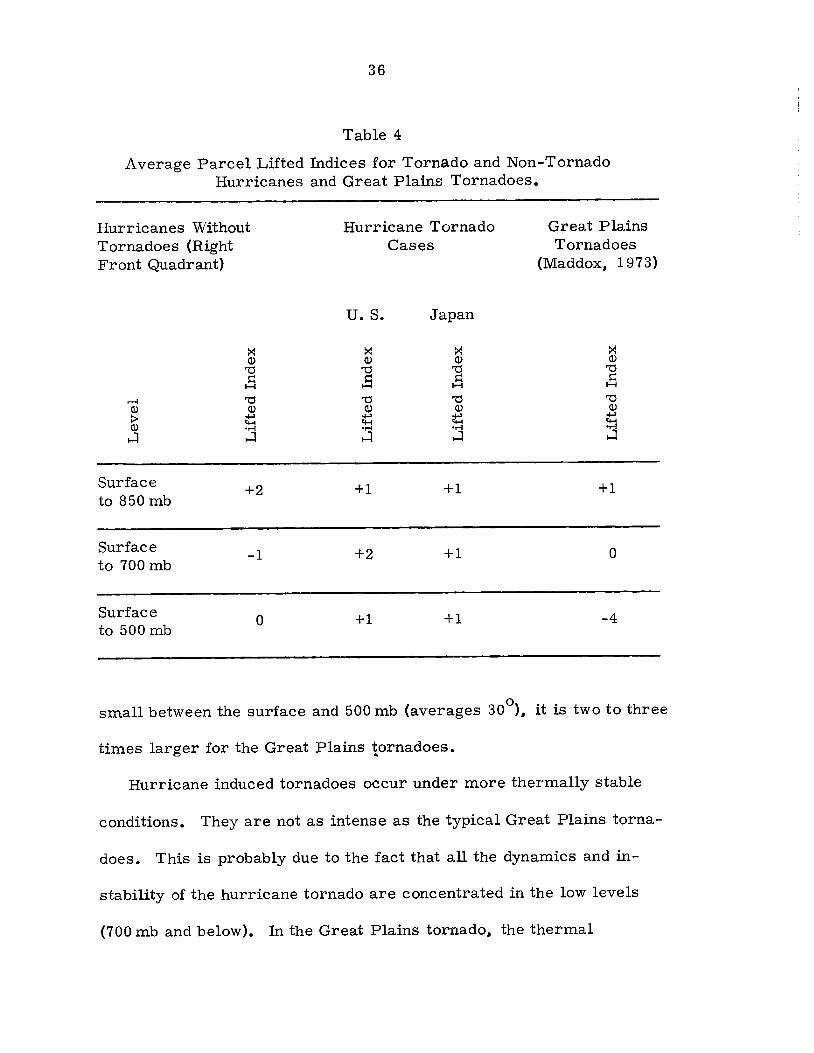
Table 4 compares the average parcel lifted index values for U. s.
hurricanes without tornadoes, U. S. and Japanese storms with torna
does, and the Great Plains tornadoes. Note the significant instability
for the Great Plains cases. Again note the agreement between the
U. S. and Japanese tornado cases. The null cases were slightly more
unstable than the tornado cases on the average, but not significantly.
One might suspect that thermal instability would not have to play
a dominant role in hurricane spawned tornadoes since strong rainband
convection is greatly enhanced by the boundary layer frictional con
vergence over land associated with the large cyclone vorticity pattern.
The low level frictional convergence would be much less without the
hurricane.
Comparison Between Great Plains and Hurricane Tornadoes. As
shown in Figs. 30 and 31 both the Great Plains and hurricane torna
does exhibit large lower tropospheric wind shears averaging 40 knots.
In the hurricane cases, this shear is concentrated between the surface
and 850 mb, however. In Great Plains tornadoes, the shear is distri
buted through the entire surface to 500 mb layer with no lower level
concentration. While directional shear in the hurricane cases is
36
Table 4
Average Parcel Lifted Indices for Tornado and Non-Tornado Hurricanes and Great Plains Tornadoes.
Hurricanes Without Tornadoes (Right Front Quadrant)
Surface to 850 mb
Surface to 700 mb
Surface to 500 mb
x Q)
'0 I=l
H
'0 Q)
oj..>
'+-t • ..-1
~
+2
-1
o
Hurricane Tornado Cases
u. S. Japan
x x Q) Q)
'0 '0 I=l I=l
H H
'0 '0 Q) Q)
~ ~ • ..-1 • ..-1
~ ~
+1 +1
+2 +1
+1 +1
Great Plains Tornadoes
(Maddox, 1 973)
x Q)
'0 I=l
H
'0 Q)
oj..>
~ ~
+1
o
-4
small between the surface and 500 mb (averages 300
), it is two to three
times larger for the Great Plains tornadoes.
Hurricane induced tornadoes occur under more thermally stable
conditions. They are not as intense as the typical Great Plains torna-
does. This is probably due to the fact that all the dynamics and in-
stability of the hurricane tornado are concentrated in the low levels
(700 mb and below). In the Great Plains tornado, the thermal
37
instability is much larger and there are also upper tropospheric
dynamic influences.
Conclusion. The most significant observational fact concerning
the hurricane tornado is the presence of very strong low level wind
shears from the surface to 850 mb (averaging 40 kts). There is little
directional wind shear from either the surface to 850 mb (10 0 veering)
or from the surface to 500 mb(30o veering). Those hurricanes as
sociated with tornadoes dissipate rapidly over land and fill (> 30mb /
12 hr) three times as fast as hurricanes without tornadoes.
Instability does not playa dominant role in these tornadoes. Dif
ferences in stability between hurricanes with and without tornadoes is
slight. The hurricane tornado is typically less intense than its Great
Plains counterpart.

IV. TORNADO GENESIS
Hurricane Dissipation Dynamics. While the hurricane is at full
intensity at sea, the boundary layer air, dur to friction, spirals in-
ward. As the air moves towards lower pressure, it loses sensible
heat through expansion. This expansion cooling is compensated by
sensible heat transport from the ocean. The typical formula for sen-
sible heat gains (H) over the ocean as quoted from a number of sources
by Priestly (1960) is:
where
p
H = p c KTu (T - T ) P 0 a
= density of air
= specific heat of air -3
= coefficient of eddy heat exchange -2 x 10
= surface wind
(1)
T -T o a
= temperature of the ocean (T ) minus the temperature of the air (T ) 0
a
As an example of this powerful heat source: for T - T o a
u = 10 m/sec, a boundary layer depth of 500 m can be warmed as much
Thus, the greater the wind and the difference between the sea sur-
face temperature and air temperature, the greater the heat flux. The
constant turbulent mixing of the ocean surface by the hurricane force
winds allows for a continuous and rapid heat exchange from the ocean
38
39
to the air. Over the ocean the air temperature is typically never more
than 20
C cooler than the ocean temperature. In the typical hurricane
over the ocean the boundary layer air spirals isothermally to the cen-
tral core region. A typical vertical wind profile for a weak hurricane
at sea is shown in Fig. 33.
Conditions for the hurricane over land are very different. Air
spiraling inward over land is denied the heat source typicaly of the
ocean. The specific heat content of the land is less than that of the
ocean. The land surface cannot be turbulently mixed as the ocean can.
The inward spiraling air over land receives only a small energy input
from the surface. Under these conditions the boundary layer air can
no longer move towards lower pressure and maintain its temperature.
As it moves inward it cools. The inner region lapse rates become
stable and convection is suppressed. The storm begins to weaken. It
is for this reason that hurricanes only form over water and quickly
weaken when they move inland.
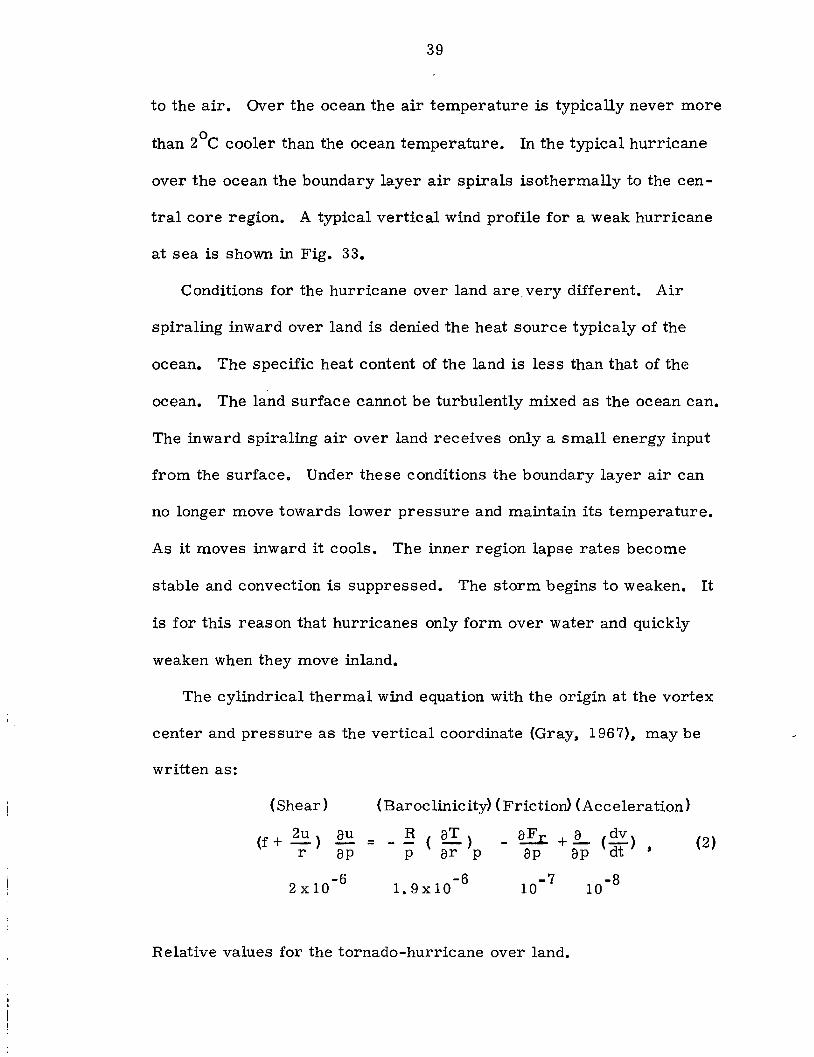
The cylindrical thermal wind equation with the origin at the vortex
center and pressure as the vertical coordinate (Gray, 1967), may be
written as:
(Shear)
(f + 2u) ~ r ap
2x10⁻⁶
(Baroclinicity) (Friction> (Acceleration)
= _ R ( aT ) p ar p
-6 1.9x10
Relative values for the tornado-hurricane over land.
(2)
40
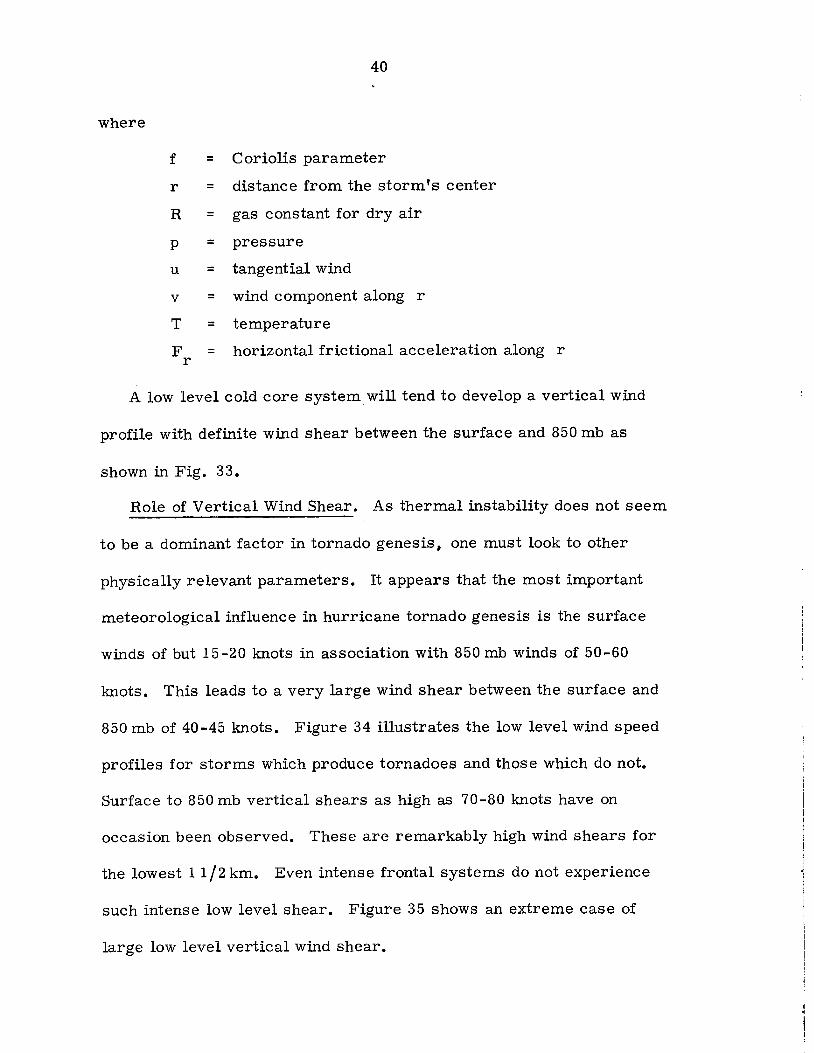
where
f = C oriolis parameter
r = distance from the storm's center
R = gas constant for dry air
p = pressure
u = tangential wind
v = wind component along r
T = temperature
F = horizontal frictional acceleration along r r
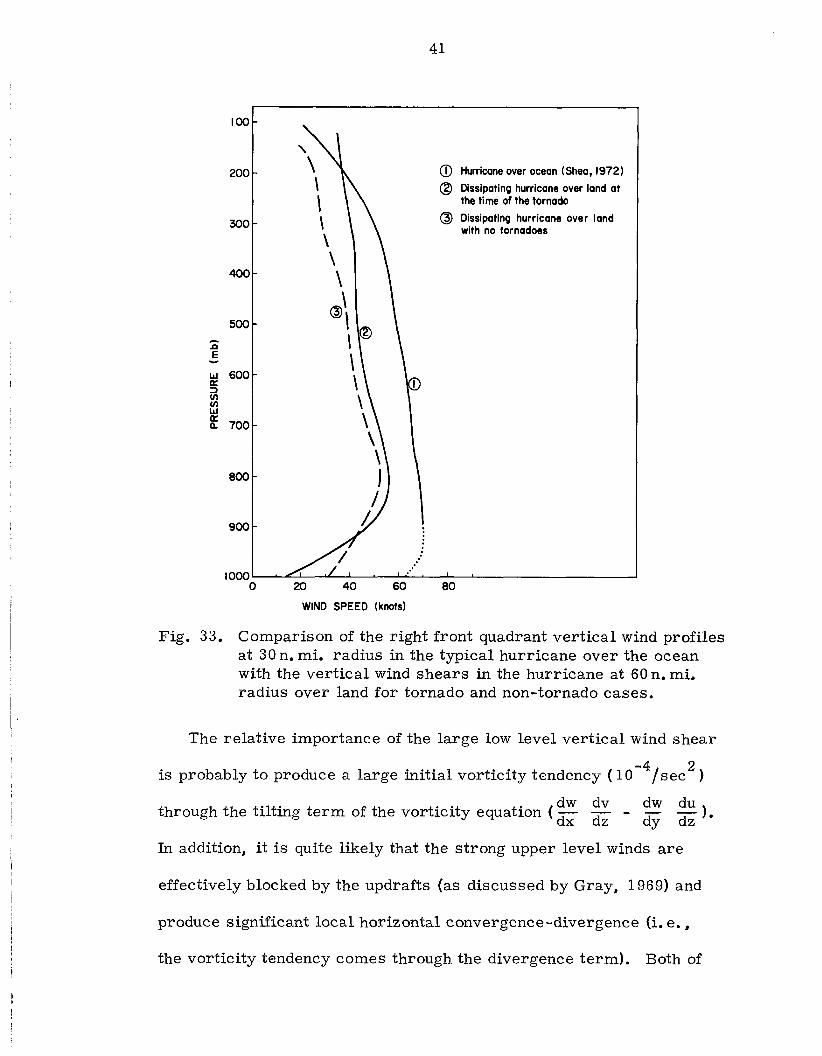
A low level cold core system will tend to develop a vertical wind
profile with definite wind shear between the surface and 850 mb as
shown in Fig. 33.
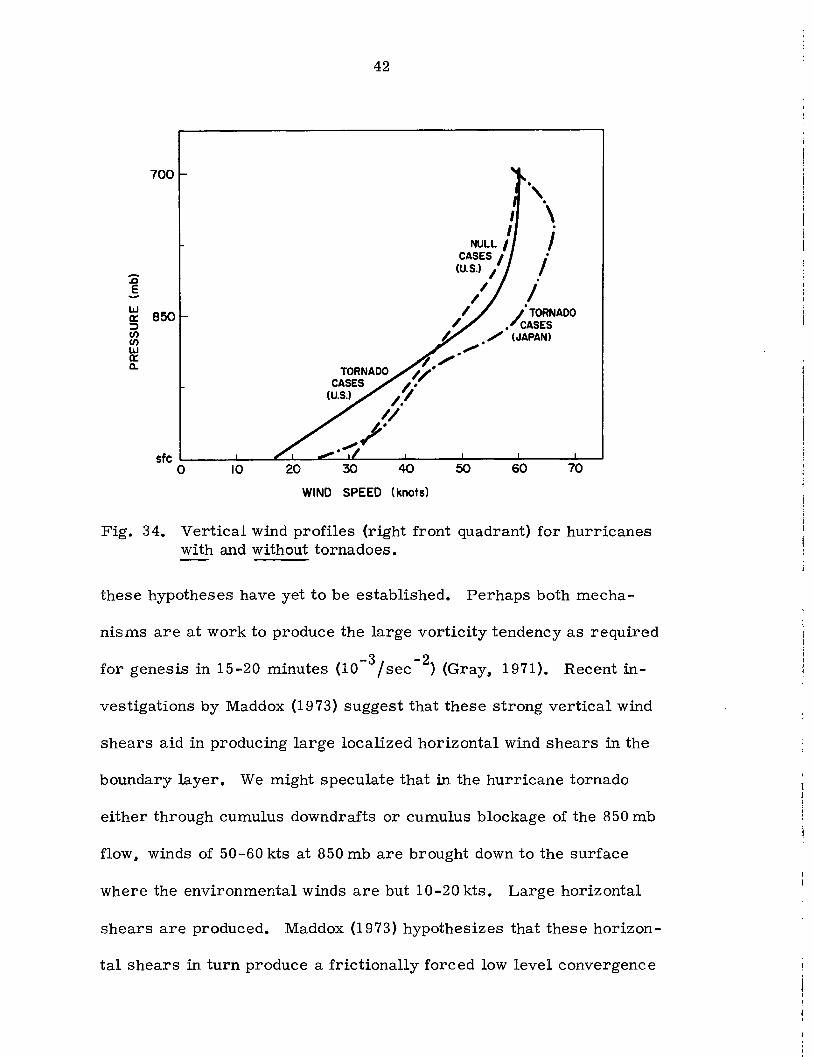
Role of Vertical Wind Shear. As thermal instability does not seem
to be a dominant factor in tornado genesis, one must look to other
physically relevant parameters. It appears that the most important
meteorological influence in hurricane tornado genesis is the surface
winds of but 15-20 knots in association with 850 mb winds of 50-60
knots. This leads to a very large wind shear between the surface and
850 mb of 40-45 knots. Figure 34 illustrates the low level wind speed
profiles for storms which produce tornadoes and those which do not.
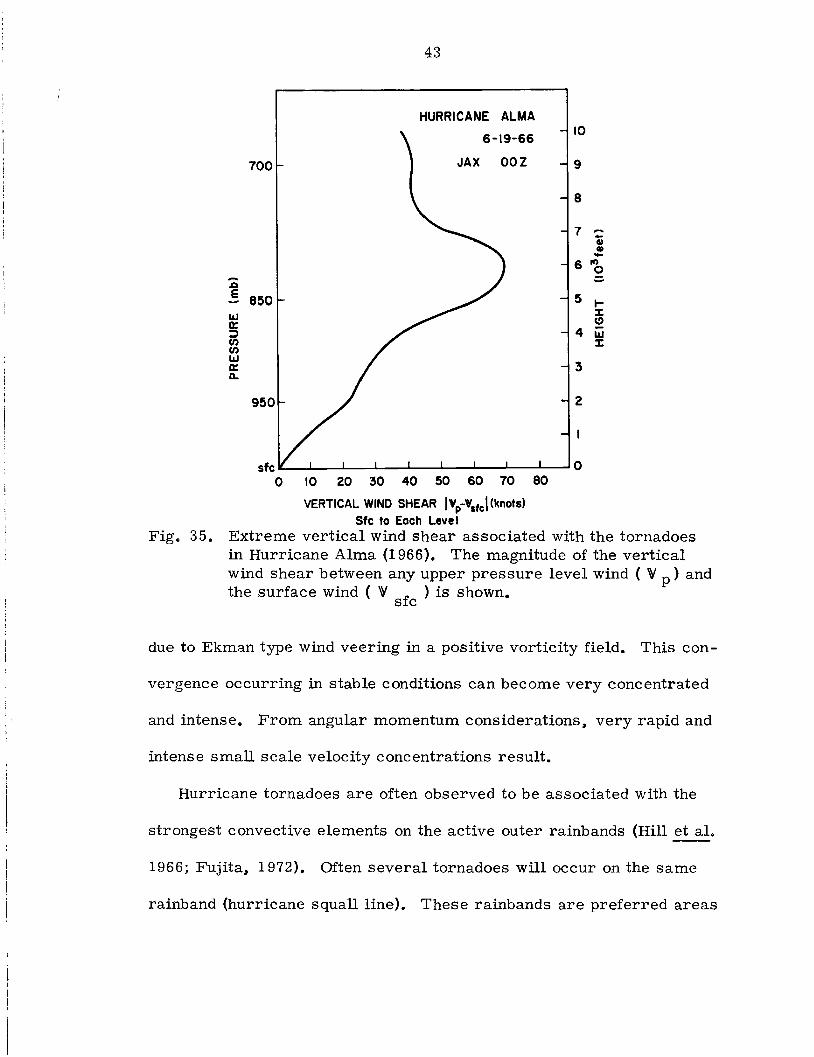
Surface to 850 mb vertical shears as high as 70-80 knots have on
occasion been observed. These are remarkably high wind shears for
the lowest 11/2 km. Even intense frontal systems do not experience
such intense low level shear. Figure 35 shows an extreme case of
large low level vertical wind shear.
~ E ....
kJ a:: :::l <I) <I) kJ a:: Il.
100
200
300
400
500
600
700
800
900
41
CD Hurricane over ocean (Shea, 1972)
@ Dissipating hurricane over land at the time of the tornado
@ Dissipating hurricane over land with no tornadoes
1000~~~--~~--~-w~~~~------------------~
o 20 40 60 80
WIND SPEED (knots)
Fig. 33. Comparison of the right front quadrant vertical wind profiles at 30 n. mi. radius in the typical hurricane over the ocean with the vertical wind shears in the hurricane at 60 n. mi. radius over land for tornado and non-tornado cases.
The relative importance of the large low level vertical wind shear
is probably to produce a large initial vorticity tendency ( 10 -4/ sec 2
)
through the tilting term of the vorticity equation (~; ~: - ~; ~~).
In addition, it is quite likely that the strong upper level winds are
effectively blocked by the updrafts (as discussed by Gray, 1969) and
produce significant local horizontal convergence-divergence (i. e. ,
the vorticity tendency comes through the divergence term). Both of
:c .§
700
~ 850 ~ Cf) Cf) w a::: a..
42
7/ TORNADO //"
.""
/, //
// ?'
.",.
"
\ I
/ /
/TORNADO /CASES
,;' (JAPAN)
sfc L...-__ .l...-_..L......L...----III~_1L __ _l... __ ___L ___ L:_ _ __:~--'
o 10 20 30 40 50 60 70
WIND SPEED (knots)
Fig. 34. Vertical wind profiles (right front quadrant) for hurricanes with and without tornadoes.
these hypotheses have yet to be established. Perhaps both mecha-
nisms are at work to produce the large vorticity tendency as required
for genesis in 15-20 minutes (10-3 /sec -2) (Gray, 1971). Recent in-
vestigations by Maddox (1973) suggest that these strong vertical wind
shears aid in producing large localized horizontal wind shears in the
boundary layer. We might speculate that in the hurricane tornado
either through cumulus downdrafts or cumulus blockage of the 850 mb
flow, winds of 50-60 kts at 850 mb are brought down to the surface
where the environmental winds are but 10-20 kts. Large horizontal
shears are produced. Maddox (1973) hypothesizes that these horizon-
tal shears in turn produce a frictionally forced low level convergence
700
.a e 850 w It: :::I CI) CI) w It: ~
950
43
HURRICANE ALMA
6-19-66
JAX OOZ
10 20 30 40 50 60 70 80
VERTICAL WIND SHEAR I Vp-vsfcl (knots) Sfc to Each Leve I
10
9
8
7 ..... Gi u -6 If')
0 ..... 5 r
J: (!)
4 w J:
3
2
Fig. 35. Extreme vertical wind shear associated with the tornadoes in Hurricane Alma (1966). The magnitude of the vertical wind shear between any upper pressure level wind ( V p) and the surface wind (V f ) is shown. s c
due to Ekman type wind veering in a positive vorticity field. This con-
vergence occurring in stable conditions can become very concentrated
and intense. From angular momentum considerations. very rapid and
intense small scale velocity concentrations result.
Hurricane tornadoes are often observed to be associated with the
strongest convective elements on the active outer rainbands (Hill et ale
1966; Fujita. 1972). Often several tornadoes will occur on the same
rainband (hurricane squall line). These rainbands are preferred areas
44
for tornado development as the environmental values of convergence
and vorticity gradients are typically strongest in their vicinity.
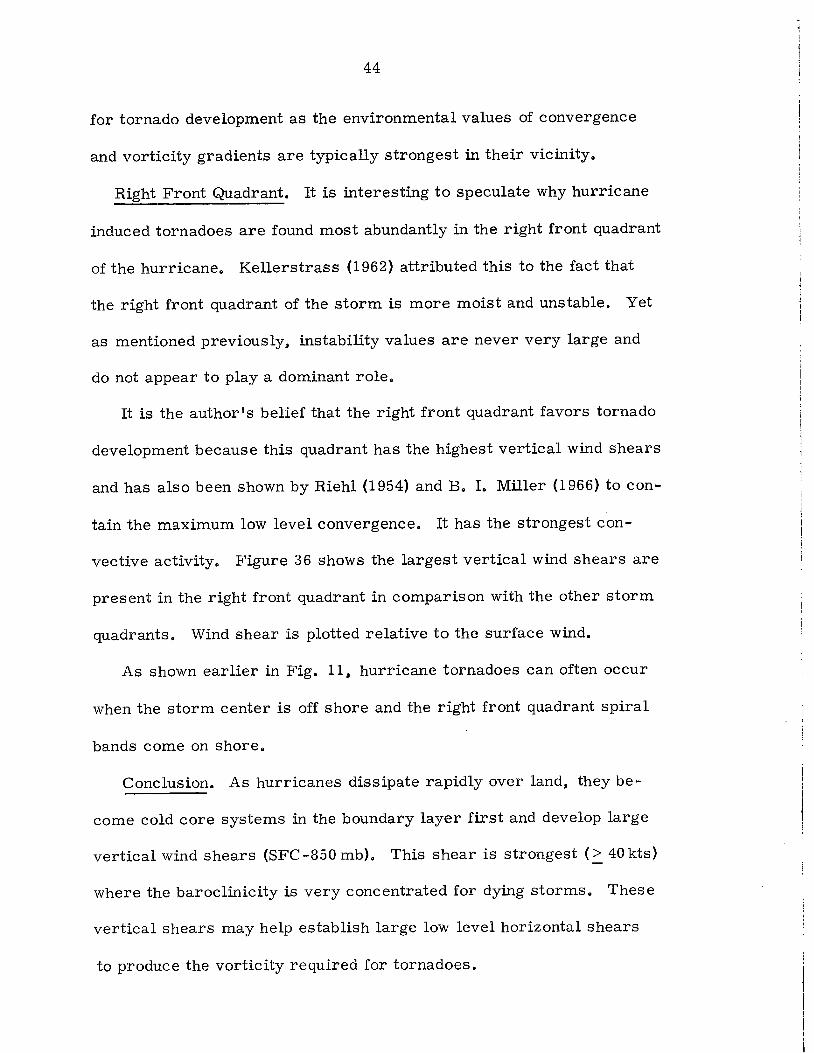
Right Front Quadrant. It is interesting to speculate why hurricane
induced tornadoes are found most abundantly in the right front quadrant
of the hurricane. Kellerstrass (1962) attributed this to the fact that
the right front quadrant of the storm is more moist and unstable. Yet
as mentioned previouslYI instability values are never very large and
do not appear to playa dominant role.
It is the author's belief that the right front quadrant favors tornado
development because this quadrant has the highest vertical wind shears
and has also been shown by Riehl (1954) and B. I. Miller (1966) to con
tain the maximum low level convergence. It has the strongest con
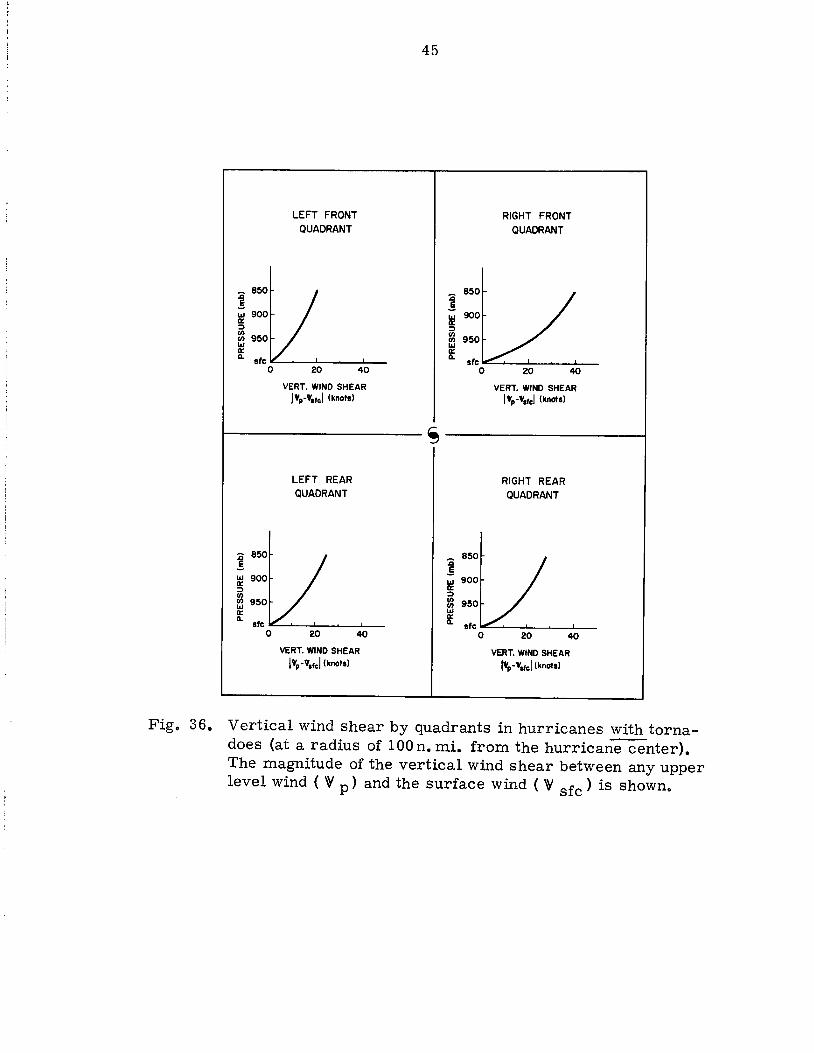
vective activity. Figure 36 shows the largest vertical wind shears are
present in the right front quadrant in comparison with the other storm
quadrants. Wind shear is plotted relative to the surface wind.
As shown earlier in Fig. 111 hurricane tornadoes can often occur
when the storm center is off shore and the right front quadrant spiral
bands come on shore.
Conclusion. As hurricanes dissipate rapidly over land l they be
come cold core systems in the boundary layer first and develop large
vertical wind shears (SFC -850 mb). This shear is strongest (.:::. 40 kts)
where the baroclinicity is very concentrated for dying storms. These
vertical shears may help establish large low level horizontal shears
to produce the vorticity required for tornadoes.
_ 850
~ ;:;; 900 0: ~
::l 950 Ii!
LEFT FRONT QUADRANT
Q. sfe I£-.......... _.L..---'"_--'-:-_ o 20 40
! 850
Ii! 900 ~ VI ::l 950 0:
VERT. WIND SHEAR
IVp·"afcl (knots)
LEFT REAR QUADRANT
Q. 8fe I£. ......... _..J....~_....I-_ o 20 40
VERT. WIND SHEAR
l"p·"lfCI (knots)
45
! 850
Ii! 900 ~
::l 950 III g:
_ 850 ... oS Ii! 900 ~
::l 950 III g:
RIGHT FRONT QUADRANT
20 40
VERT. WIND SHEAR IVp.Vafcl (knots)
RIGHT REAR QUADRANT
20 40
VERT. WIND SHEAR
IVp.Vafcl (knots)
Fig. 36. Vertical wind shear by quadrants in hurricanes with tornadoes (at a radius of 100 n. mi. from the hurricanecenter). The magnitude of the vertical wind shear between any upper level wind ( ~ p) and the surface wind ( ~ sfc) is shown.

V. OTHER CHARACTERISTICS
Dry Air Intrusions. A notable thermodynamic feature associated
with large family outbreaks of tornadoes (Audrey, 1957; Carla, 1961;
Hilda, 1964; Beulah, 1967) has been the presence of pronounced dry
air in the storm's right rear quadrant between 850 mb to 700 mb. Hill
et ale (1966) and Grice (1967) have also made special mention of this
middle level dry air. Grice's study of Beulah (1967) attributes the
record tornado outbreak as primarily due to the presence of dry air
between 850 mb to 700 mb and its advection into the right front quadrant.
Figure 37 shows the Lake Charles, Louisiana sounding 200 miles from
the storm center in the right rear quadrant during the time Beulah
spawned some of her tornadoes over Texas. Both the actual moisture
values for LCH along with a normal September LCH moisture sounding
are shown. Note the pronounced middle level drying. The question
of whether this middle level dry air is actually advected into the right
front quadrant and is a major contributing feature to the tornado
family outbreaks is open to further investigation. The mean sound
ings of the right front quadrant indicate that dry air advection is not
a common characteristics of most hurricane tornado storms.
This pronounced drying was probably a result of the periphery sub
stance from the hurricane itself and, as SUCh, was not an independent
environmental feature. It could, nevertheless, have had a feed-back
influence.
46

420
400 1--1---+-7"
_ 380
f: UJ a: ;: 3601-+--+<t a: UJ 0.. ::;; UJ f- 340 -' <t i= z UJ
b 320 0..
47
TEMPERATURE (·C)
HURRICANE BEULAH
20 SEPT 67
LCH 12Z
-t-----T'--t---:t"'----- ",\00
<000
"" (~.o0 00
,p
30 40
Fig. 37. Lake Charles sounding of 20 Sept 67 - right rear quadrant of Beulah.
Hurricane Donna (1960). One very notable exception to the condi-
tions for hurricane spawned tornadoes was Hurricane Donna when she
crossed over Southwest Florida. Despite the fact that she filled at the
rate of about 20 mb per day and had 70 knots of vertical wind shear be-
tween the surface and 850 mb over Miami on September 9 (see Fig.
38), there were no tornado reports. The only Donna tornadoes report-
ed were in North and South Carolina.
Donna was an extremely intense hurricane and caused a large
population evacuation along with severe damage to communication fa-
cilities. This may explain that even if Donna did spawn tornadoes in
Florida, they were not observed or not reported. There were, how-
ever. unusual small scale damage effects on the vegetation of the
Everglades, (Dunn, 1961). Also, the possiblity remains that Donna

48
spawned waterspouts at sea. Waterspouts may have occurred due to
Donna's trajectory inland over southern Florida causing a large por-
tion of the right front quadrant to be over the ocean. Nevertheless,
despite the fact that Donna had filled rapidly while crossing Florida
and had developed a cold core at the surface with large vertical wind
shear. she remained quite unique in that her overall organization
remained intact over Florida.
HURRICANE DONNA
9-9-60 10
700 MIA 18 EST 9
8
7 -.. " 6 ..
If)
~ g ! 850 5 ~
'" ~
0:: ~ :::J 4 '" t/) ~ t/)
'" 0:: 3 0-
950 2
Ifc 0 o 10 20 30 40 50 60 70 80 90
VERTICAL WIND SHEAR I¥p-¥.fcl (knots)
Sfc to Each LIVII
Fig. 38. Vertical wind shear profile over Miami in Donna (1960). The magnitude of the vertical wind shear between any upper level wind ( 'W p) and the surface wind ( 'W sfc ) is shown.

VI. FORECASTING APPLICATIONS
On Duty Forecasting Aids. Better forecasting of hurricane
tornadoes might help reduce the 10% total hurricane fatality figure.
Several methods are evident which can aid the operational forecaster:
(1) The rate of hurricane filling should be determined from
monitoring the teletype reports of sea level pressure from in
land stations (particularly those stations close to the center)
or by observing the sharpness and apparent intensity of the eye
wall clouds on radar. Stations near the center should be re
quired to report their sea level pressure, temperature, and
wind every 30 minutes rather than every hour.
(2) Particular attention should be paid to the radar echoes of
active squall lines (particularly the outer rainbands) which
have strong convective cells. Several tornadoes may occur
along one band.
(3) Special pibals could be taken as the hurricane moves in
land or if the station is not equipped for pibals, the observer
should be required to give an estimate of the wind velocity at
cloud base height in his hourly Service A observation, parti
cularly in areas showing surface winds of only 15-20 knots.
Areas of strong convection with weak surface winds and fast
low level cloud motion are very likely regions for tornado
genesis.
(4) Significant dry air intrusions located in the right rear
quadrant of the hurricane at 850-700 mb may serve as indica
tors for potential tornado "family" outbreaks.
49

50
(5) A tornado bearing hurricane will rapidly develop a cold
core at the surface while still maintaining a warm core at the
850 mb level. A surface temperature map could be plotted
from the teletype observations on an hourly or half hourly
basis. Tornadoes should be forecast when the inner storm
surface temperatures show significant cooling. In the average
case of reported tornadoes the storm center temperature was
60 C colder than the temperature at 100 no mi. from the center.
Practical Rule of Thumb. The theory presented in this paper might
lend itself to applications on the layman's level. A practical rule of
thumb for the public might be stated as follows: When a hurricane
moves inland and starts to decay, persons located particularly in the
right front section of the storm should be observant for surface winds
of 15 -20 mph while overhead the low level clouds appear to be moving
with much greater velocities. These conditions signify tornado po-
tential in the regions where cumulus convection is occurringo
Table 5 sums up these findings in a forecast work sheet.

51
Table 5
Hurricane-Tornado Forecast Work Sheet.
Tornadoes Likely
1. Intense hurricanes or those tropical cyclones increasing in intensity just before landfall.
2. After hitting land hurricanes fill at the rate of greater than 30mb /1 2 hr.
3. Once on shore the center rapidly cools and becomes 60 C colder than temperatures 100 n. mi. out from the storm center.
4. Vertical wind shear profiles surface to 5000 feet of 40 kts or more. Surface winds of only 15 -20 knots.
Tornadoes Not Likely
Weak hurricanes or filling tendency just before landfall.
After hitting land, hurricanes fill at the rate of less than 10 mb/ 12 hrs.
Only small central storm cooling.
Surface to 850 mb wind shears are less than 40 knots.
Recommended Tornado Watch Area
General area: Surface pressure is between 1004 to 1012 mb.
Specific area: Areas of vertical wind shear greater than 40 kts from the surface to 850 mb. Surface winds 15-20 kts.
Specific area: Within the "preferred sector": 60-250 n. mi. from the center of the hurricane and at an azimuthal range of 00 to 1200 WITH RESPECT TO TRUE NORTH.
Specific area: Along strong radar observed rainbands. particularly the outer rainbands.
Begin Tornado Watch: When the center is 100-150 n. mi. off shore and the first rainbands start to come on shore.
52
Table 5 (cont'd)
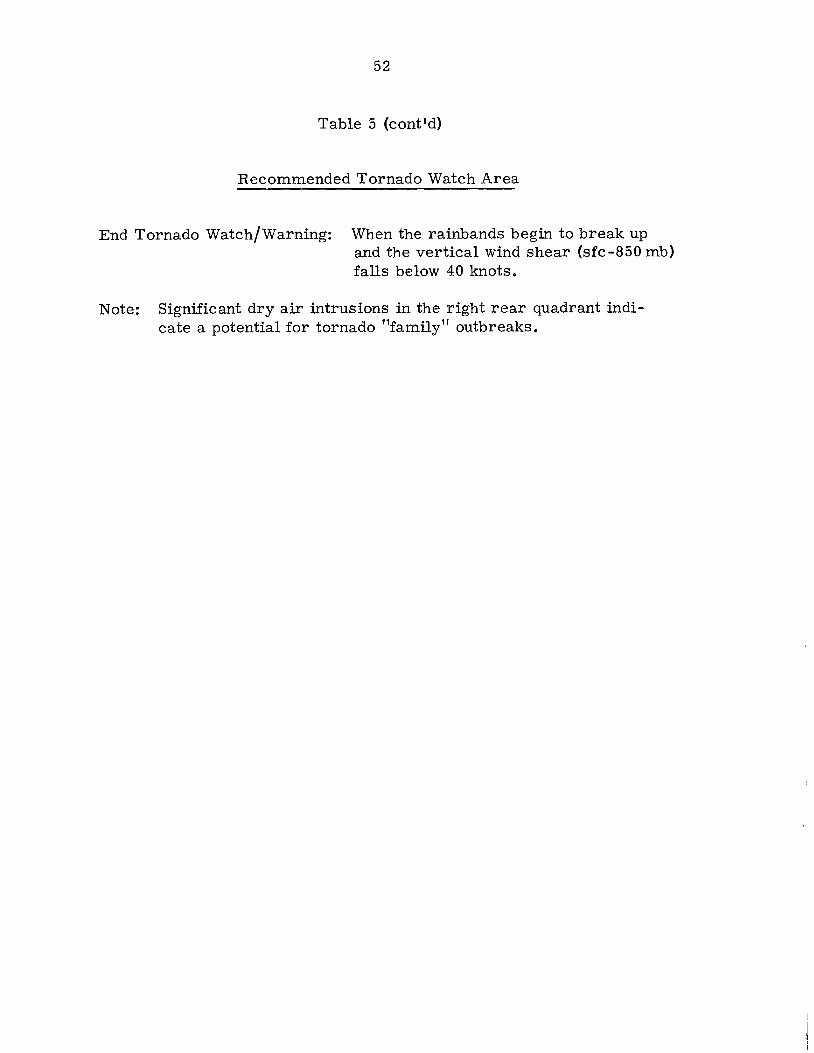
Recommended Tornado Watch Area
End Tornado Watch/Warning: When the rainbands begin to break up and the vertical wind shear (sfc-850 mb) falls below 40 knots.
Note: Significant dry air intrusions in the right rear quadrant indicate a potential for tornado ttfamily" outbreaks.
VII. C ONC LUSION
Hurricane spawned tornadoes are closely related to the presence
of very strong low level vertical wind shear. In general~ buoyant in
stability does not appear to playa major role in their formation. Thus
the dynamic components appear to dominate over the thermodynamic
ones. Hurricanes that come on shore and fill rapidly develop a sur
face cold core which establishes large low level vertical wind shear.
This vertical wind shear is indespensible to the genesis mechanism.
Cumulus downdrafts which occur with it help develop local areas of
strong low level horizontal wind shear ~ which~ from boundary layer
frictional convergence arguments leads to intense small scale conver
gence~ spin~ and velocity concentration.
This study has offered a new observational look at hurricane
spawned tornadoes that will hopefully prove useful in understanding
and forecasting these storms.
53
54
ACKNOWLEDGEMENTS
The author wishes to express his sincere gratitude to Professor
William M. Gray for proposing and directing this research and giving
countless hours of guidance, encouragement, and patience. Additional
appreciation is extended to Mrs. Barbara Brumit, Mrs. Bobbi Ogan,
Mrs. Beryl Younkin and Mr. Larry Kovacic who offered invaluable as
sistance in the manuscript typing and drafting. This research has been
partially supported by NOAA and NSF grants.

55
REFERENCES
Dunn, G. E., (1961): Hurricane season of 1960. Mon. Wea. Rev., 3, 89, 99-108.
Fendell, F. E. and G. F. Carrier, (1971): The decay of a tropical cyclone at sea and over land, tornado and hurricane thermohydrodynamics. Report prepared for U. S. Dept. of Commerce NOAA Environmental Research Laboratory, 48 pp.
Fujita, T. T., K. Watanabe, K. Tsuchiya, and M. Shimada, (1972): Typhoon-associated tornadoes in Japan and new evidence of suction vorticies in a tornado near Tokyo. J. of Meteor. Soc. of Japan.
Goldstein, M. G., (1968): Differential advection associated with tornadoes of tropical cyclone origin. M. S. Thesis, New York Univ., 32 pp.
Gray, W. M., (1967): Global view of the origin of tropical distrubances and storms. Mon. Wea. Rev., 10, 96, 669-700.
, (1969): Hypothesized importance of vertical wind shear ----:-:----~
in tornado genesis. ~ Conference ~ Severe Local Storms, Chicago, Illinois.
, (1971): Research methodology, observations and ideas ------...,.... on tornado genesis. Seventh Conference on Severe Local Storms, Kansas City, Mo. -
Grice, G. K., J. R. Scoggins, and R. A. Clark, (l967): An investigation of the tornadoes associated with hurricane Beulah. 26 pp.
Hill, E. L •• W. Malkin, and W. A. Schulz, (1966): Tornadoes associated with cyclones of tropical origin--practical features. J. of Appl. Meteor., 5, 745-763.
Kellerstrass, E. J., (1962): Hurricane spawned tornadoes: A case study of Carla, September 11-13, 1961. M, S. Thesis, st. Louis UniverSity.
Maddox, R. A., and W. M. Gray, (1973): A frictionally driven model for tornado genesis with similarities to hurricane genesis. To be presented at the Eighth Conference on Severe Local Storms, Oct. 1973. -
56
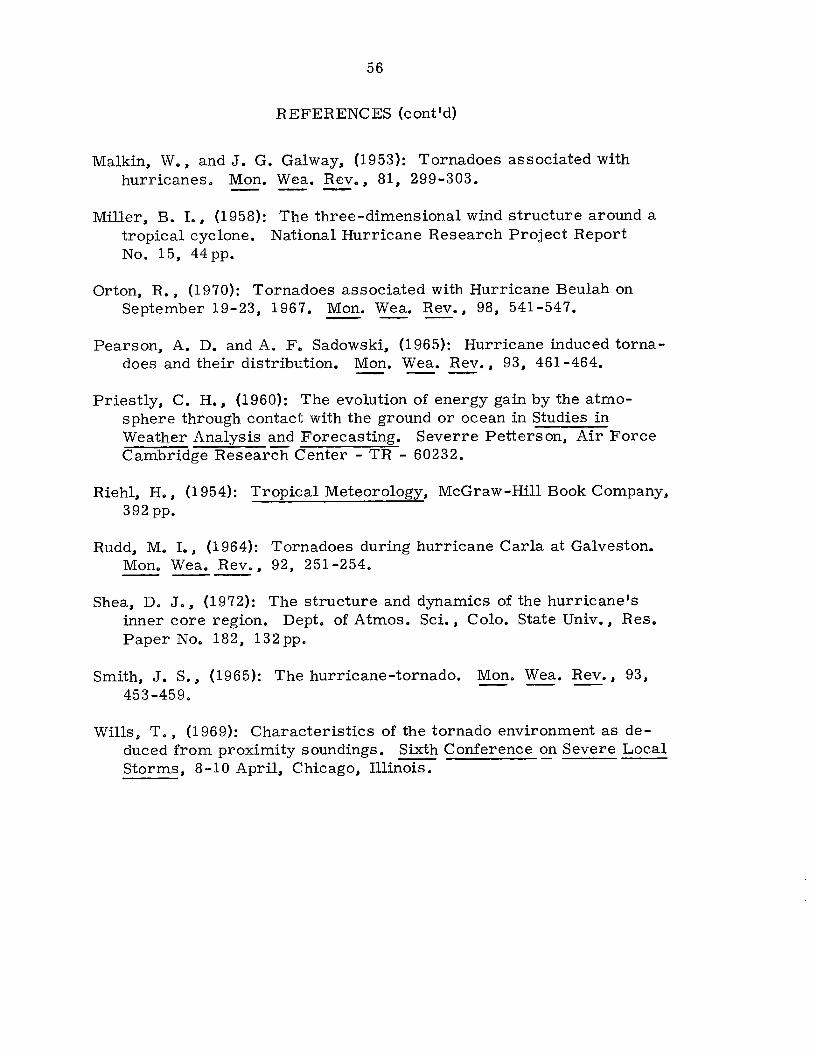
REFERENCES (cont'd)
Malkin, W., and J. G. Galway, (1953): Tornadoes associated with hurricanes. Mon. Wea. Rev., 81 1 299-303.
Miller I B. I. I (1958): The three-dimensional wind structure around a tropical cyclone. National Hurricane Research Project Report No. 15 1 44pp.
Ortonl R., (1970): Tornadoes associated with Hurricane Beulah on September 19-23, 1967. Mon. Wea. Rev"l 98, 541-547.
Pearsonl A. D. and A. F. Sadowskil (1965): Hurricane induced tornadoes and their distribution. Mon. Wea. Rev. I 93, 461-464.
Priestly, C. H. I (1960): The evolution of energy gain by the atmosphere through contact with the ground or ocean in Studies in Weather Analysis and Forecasting. Severre Petterson, Air Force Cambridge Research Center - TR - 60232.
Riehll H., (1954): Tropical Meteorology, McGraw-Hill Book CompanYI 392 pp.
Ruddl M. I. I (1964): Tornadoes during hurricane Carla at Galveston. Mon. Wea. Rev. I 92 1 251-254.
Sheal D. J. I (1972): The structure and dynamics of the hurricane's inner core region. Dept. of Atmos. Sci. I Colo. State Univ., Res. Paper No. 182 1 132 pp.
Smithl J. S.I (1965): The hurricane-tornado. Mon. Wea. Rev. 1 93, 453-459.
Wills, T., (1969): Characteristics of the tornado environment as deduced from proximity soundings. Sixth Conference on Severe Local Storms l 8-10 Aprill Chicagol Illinois.
57
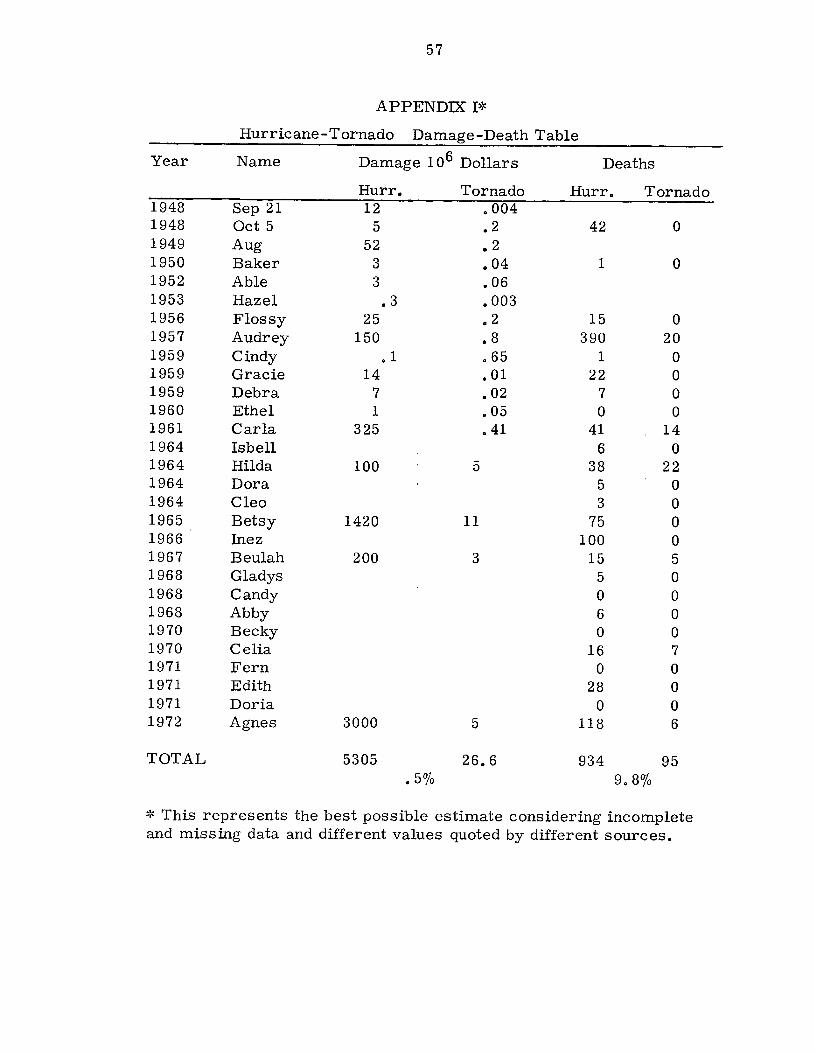
APPENDIX 1*
Hurricane-Tornado Damage-Death Table
Year Name Damage 106 Dollars Deaths
Hurr. Tornado Hurr. Tornado 1948 Sep 21 12 .004 1948 Oct 5 5 .2 42 0 1949 Aug 52 .2 1950 Baker 3 .04 1 0 1952 Able 3 .06 1953 Hazel .3 .003 1956 Flossy 25 .2 15 0 1957 Audrey 150 .8 390 20 1959 Cindy • 1 .65 1 0 1959 Gracie 14 .01 22 0 1959 Debra 7 .02 7 0 1960 Ethel 1 .05 0 0 1961 Carla 325 .41 41 14 1964 Isbell 6 0 1964 Hilda 100 5 38 22 1964 Dora 5 0 1964 Cleo 3 0 1965 Betsy 1420 11 75 0 1966 Inez 100 0 1967 Beulah 200 3 15 5 1968 Gladys 5 0 1968 Candy 0 0 1968 Abby 6 0 1970 Becky 0 0 1970 Celia 16 7 1971 Fern 0 0 1971 Edith 28 0 1971 Doria 0 0 1972 Agnes 3000 5 118 6
TOTAL 5305 26.6 934 95 • 50/0 9. 80/0
* This represents the best possible estimate considering incomplete and missing data and different values quoted by different sources.
BIBLIIOGRAPHIC DATA SHEET
4. T ide and Subtitle 1
1. Report No.
(,C:TT-ATSP-200
HURRICANE SPAWNED TORNADOES
7. A uthor(s)
David J. Novlan 9. Performing Organization Name and Address
Department of Atmospheric Science Colorado State University Fort Collins, Colorado 80521
3. Recipient's Accession r\o.
s. Report Date
Hav 1973 6.
8. Performing Organization Re pt.
No. CSU-ATSP-200 10. Project/Task/Work Unit No.
11. Contract/Gram No.,
NOAA GA N22-65-73 (G) NSF GA-32589'x 1
12. SPs·nsorifg Organization N.arpe and Address h . Natl.ona Oceanograph~c and Atmosp er~c Administration
13. Type of Report & Period Covered
Boulder, Colorado
National Science Foundation Washington, D. C.
1 S. Supplementary Notes
Project Report 14.
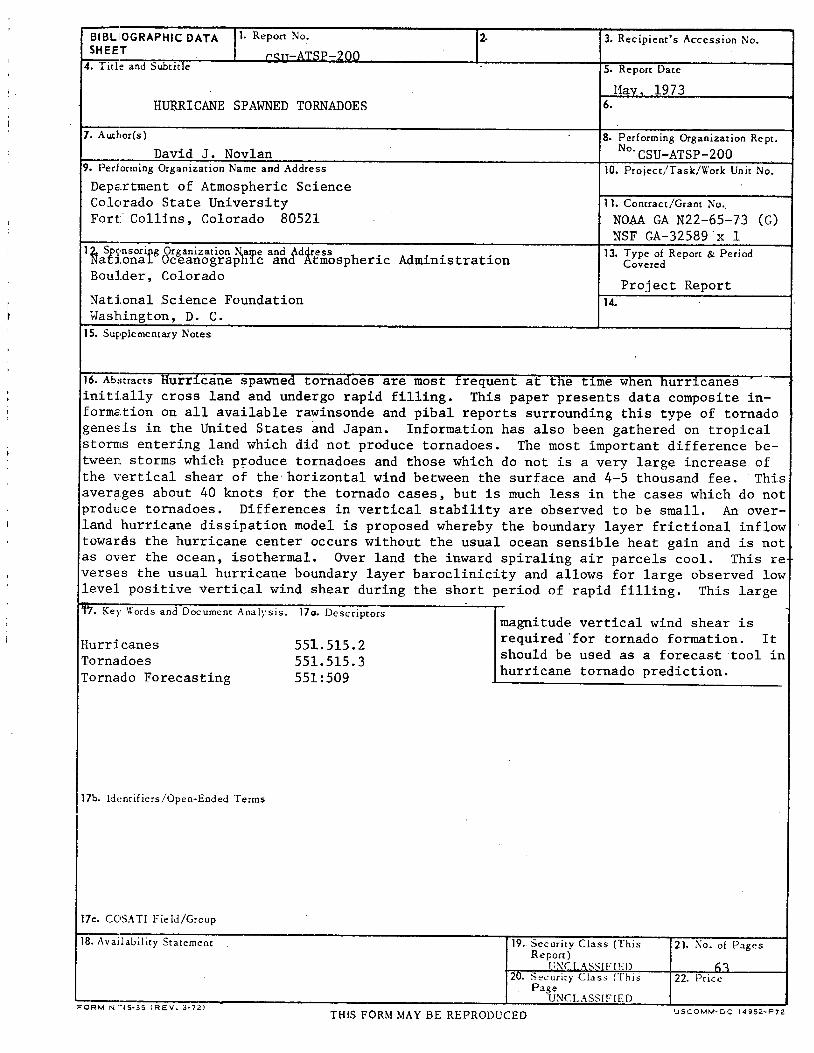
~~----~~~~~~~~~~~~~~~~~~~~~~~~~~~~~~~~~~~~-~ 16. Abstracts Hurricane spawned tornadoes are most trequent at the t~me when hurr~canes initially cross land and undergo rapid filling. This paper presents data composite information on all available rawinsonde and pibal reports surrounding this type of tornado genesis in the United States and Japan. Information has also been gathered on tropical storrrlS entering land which did not produce tornadoes. The most important difference between storms which p~oduce tornadoes and those which do not is a very large increase of the vertical shear of the'horizontal wind between the surface and 4-5 thousand fee. 'This avera.ges about 40 knots for the tornado cases, but is much less in the cases which do not produce tornadoes. Differences in vertical stability are observed to be small. An overland hurricane dissipation model is proposed whereby the boundary layer frictional inflow towards the hurricane center occurs without the usual ocean sensible heat gain and is not as over the ocean, isothermal. Over land the inward spiraling air parcels cool. This re verses the usual hurricane boundary layer baroclinicity and allows for large observed low level positive vertical wind shear during the short period of rapid filling. This large
!'f7. Key Words and Document Analysis.
Hurricanes Tornadoes Tornado Forecasting
17b. Identifiers/Open-Ended Terms
17c. COSATI Field/Group
18. Availability Statement
170. Descriptors
551.515.2 551. 515.3 551:509
magnitude vertical wind shear is required 'for tornado formation. It should be used as a forecast tool in hurricane tornado prediction.
19. Security Class (This Report)
ti:-':\'I.A~SIFIED 20. Security Clas~ (Tbis
Page U:-JG.ASSIFIED
21. :\0. 01 Pages
22. Price
THIS FORM MAY BE REPRODUCED '.JSCOMM-DC 14952-P72

Author: David J. Novlan
HURRICANE SPAWNED TORNADOES
Colorado State University, Department of Atmospheric Science
National Oceanic and Atmospheric Administration N22-65-73 (G)
551.515.2 551.515.3 551:509
Subj ect Headings: Hurricanes Tornadoes Tornado Forecasting
Hurricane spawned tornadoes are most frequent at the time when hurricanes initially cross land and undergo rapid filling. This paper presents data composite information on all available rawinsonde and pibal reports surrounding this type of tornado genesis in the United States and Japan. Information has also been gathered on tropical storms entering land which did not produce tornadoes. The most important difference between storms which produce tornadoes and those which do not is a very large increase of the vertical shear of the horizontal wind between the surface and 4-5 thousand feet. This averages about 40 knots for the tornado cases, but is much less in the cases which do not produce tornadoes. Differences in vertical stability are observed to be small. An overland hurricane dissipation model is proposed whereby the boundary layer frictional inflow towards the hurricane center occurs without the usual ocean sensible heat gain and is not, as over the ocean, isothermal. Over land the inward spiraling air parcels cool. This reverses the usual hurricane boundary layer baroclinicity and allows for large observed low level positive vertical wind shear during the short period of rapid filling. This large magnitude vertical wind shear is required for tornado formation. It should be used as a forecast tool in hurricane tornado prediction.
Author: David J. Novlan
HURRICANE SPAWNED TORNADOES
Colorado State University, Department of Atmospheric Science
National Oceanic and Atmospheric Administration N22-65-73 (G)
551.515.2 551. 515. 3 551:509
Subject Headings: Hurricanes Tornadoes Tornado Forecasting
Hurricane spawned tornadoes are most frequent at the time when hurricanes initially cross land and undergo rapid filling. This paper presents data composite information on all available rawinsonde and pibal reports surrounding this type of tornado genesis in the United States and Japan. Information has also been gathered on tropical storms entering land which did not produce tornadoes. The most important difference between storms which produce tornadoes and those which do not is a very large increase of the vertical shear of the horizontal wind between the surface and 4-5 thousand feet. This averages about 40 knots for the tornado cases, but is much less in the cases which do not produce tornadoes. Differences in vertical stability are observed to be small. An overland hurricane dissipation model is proposed whereby the boundary layer frictional inflow towards the hurricane center occurs without the usual ocean sensible heat gain and is not, as over the ocean, isothermal. Over land the inward spiraling air parcels cool. This reverses the usual hurricane boundary layer baroclinicity and allows for large observed low level positive vertical wind shear during the short period of rapid filling. This large magnitude vertical wind shear is required for tornado formation. It should be used as a forecast tool in hurricane tornado prediction.
I I j
I I I I -, I
Author: David J. Nov Ian
HURRICANE SPAWNED TORNADOES
Colorado State University, Department of Atmospheric Science
National Oceanic and Atmospheric Administration N22-65-73 (G)
551.515.2 551.515.3 551:509
Subject Headings: Hurricanes Tornadoes Tornado Forecasting
Hurricane spawned tornadoes are most frequent at the time when hurricanes initially cross land and undergo rapid filling. This paper presents data composite information on all available rawinsonde and pibal reports surrounding this type of tornado genesis in the United States and Japan. Information· has also been gathered on tropical storms entering land which did not produce tornadoes. The most important difference between storms which produce tornadoes and those which do not is a very large increase of the vertical shear of the horizontal wind between the surface and 4-5 thousand feet. This averages about 40 knots for the tornado cases, but is much less in the cases which do not produce tornadoes. Differences in vertical stability are observed to be small. An overland hurricane dissipation model is proposed whereby the boundary layer frictional inflow towards the hurricane center occurs without the usual ocean sensible heat gain and is not. as over the ocean, isothermal. Over land the inward spiraling air parcels cool. This reverses the usual hurricane boundary layer baroclinicity and allows for large observed low level positive vertical wind shear during the short period of rapid filling. This large magnitude vertical wind shear is required for tornado formation. It should be used as a forecast tool in hurricane tornado prediction.
Author: David J. Novlan 551.515.2 551.515.3
HURRICANE SPAWNED TORNADOES 551:509
Colorado State University, Department of Subject Headings: Atmospheric Science Hurricanes
Tornadoes National Oceanic and Atmospheric Administration N22-65-73 (G) Tornado Forecasting
Hurricane spawned tornadoes are most frequent at the time when hurricanes initially cross land and undergo rapid filling. This paper presents data composite information on all available rawinsonde and pibal .reports surrounding this type of tornado genesis in the United States and Japan. Information has also been gathered on tropical storms entering land Which did not produce tornadoes. The most important difference between storms Which produce tornadoes and those which do not is a very large increase of the vertical shear of the horizontal wind between the surface and 4-5 thousand feet. This averages about 40 knots for the tornado cases, but is much less in the cases which do not produce tornadoes. Differences in vertical stability are observed to be small. An overland hurricane dissipation model is proposed whereby the boundary layer frictional inflow towards the hurricane center occurs without the usual ocean sensible heat gain and is not, as over the ocean, isothermal. Over land the inward spiraling air parcels cool. This reverses the usual hurricane boundary layer baroclinicity and allows for large observed low level positive vertical wind shear during the short period of rapid filling. This large magnitude vertical wind shear is required for tornado formation. It should be used as a forecast tool in hurricane tornado prediction.
'J