Hurricane Prediction with Python DRAFT - SciPy...
5
DRAFT PROC. OF THE 10th PYTHON IN SCIENCE CONF. (SCIPY 2011) 49 Hurricane Prediction with Python Minwoo Lee, Charles W. Anderson, Mark DeMaria ✦ Abstract—The National Centers for Environmental Prediction (NCEP) Global Forecast System (GFS) is a global spectral model used for aviation weather forecast. It produces forecasts of wind speed and direction, temperature, hu- midity and precipitation out to 192 hr every 6 hours over the entire globe. The horizontal resolution in operational version of the GFS is about 25 km. Much longer integration of similar global models are run for climate applications but with much lower horizontal resolution. Although not specifically designed for tropical cyclones, the model solutions contain smoothed representations of these storms. One of the challenges in using global atmospheric model for hurri- cane applications is objectively determining what is a tropical cyclone, given the three dimensional solutions of atmospheric variables. This is especially difficult in the lower resolution climate models. To address this issue, without manually selecting features of interests, the initial conditions from a low resolution version of the GFS (2 degree latitude-longitude grid) are examined at 6 hour periods and compared with the known positions of tropical cyclones. Several Python modules are used to build a prototype model quickly, and the prototype model shows fast and accurate prediction with the low resolution GFS data. Index Terms—hurricane, prediction, GFS, SVM Introduction The devastating effects from tropical storms, hurricanes 1 , and typhoons on life and property places great importance on forecasting and warning systems [CAM02]. To minimize the possible damages from hurricanes, we need fast and accurate forecasts as early as possible. Even with the significance of predicting a hurricane, the procedure for identifying the initial position and intensity of tropical cyclones is not fully automated. From direct measures from aircraft, ships and surface stations and remote sensing observations, including satellite imagery and Doppler radar that is collected over time, meteorologists identify a storm, and it is cumbersome process. Numerical models are used to forecast the future position, intensity and structure of hurricanes. For climate applications, the resolution of these models is marginal for representation of hurricanes. Different schemes are proposed to detect tropical cyclone-like vortices (TCLVs) in general circulation model (GCM) simulations, which rely on threshold values of ob- served characteristics of actual tropical cyclones. However, it is ad-hoc to use a different threshold for hurricane prediction [WAL04]. Although there is some research ongoing to improve Mark DeMaria is with NOAA/NESDIS/STAR. Minwoo Lee and Charles W. Anderson are with Colorado State University. E-mail: [email protected]. c ○2011 Minwoo Lee et al. This is an open-access article distributed under the terms of the Creative Commons Attribution License, which permits unrestricted use, distribution, and reproduction in any medium, provided the original author and source are credited. 1. In this paper, the term hurricane is used generically to represent tropical cyclones of all intensities, even though, technically speaking, a tropical cyclone must have winds greater than 63 kt to be classified as a hurricane. Fig. 1: Hurricane prediction procedure. the reanalysis approach that determines the threshold, currently there is no good representation of actual hurricane structure for reanalysis. Furthermore, considering potential changes of hurricane intensity [WAL04], faster and simple approaches are required for practical use. This paper examines a method to automate the objective identification of hurricanes in global model forecast fields by using a machine learning approach, support vector machines (SVM), based on Global Forecast System (GFS) analyses. The outputs from GFS [SAH06, EMC03] that produce forecasts of wind speed and direction, humidity, and temperature are used as source for hurricane prediction without any filtering based on previous knowledge. From these features at each grid point, SVMs can be trained to make an accurate prediction of hurricane occurrence. Figure 1 shows the sequential procedure for hurricane prediction from data conversion to final hurricane prediction. Python provides useful packages to reduce the time for pro- totyping this hurricane prediction procedure. Using Numpy, the basic data matrices for meteorological features in each grid are stored and manipulated. Matplotlib is used to analyze the patterns of the data features, and the data is trained and classified by using PyML SVM. PyGTK with Glade and Basemap generate the graphical user interface to connect the sequential process of preparing data, training a classifier, predicting hurricanes and presenting prediction results to users. Global Forecast System and Hurricane Tracks To predict hurricanes, the first step is to access the weather data. In this paper, we choose the output from the U.S. National Centers for Environmental Prediction (NCEP) Global Forecast System (GFS). For this initial prototype, low res- olution GFS analysis fields are used, rather than the GFS
-
Upload
truongtruc -
Category
Documents
-
view
232 -
download
0
Transcript of Hurricane Prediction with Python DRAFT - SciPy...
DRAFT
PROC. OF THE 10th PYTHON IN SCIENCE CONF. (SCIPY 2011) 49
Hurricane Prediction with PythonMinwoo Lee, Charles W. Anderson, Mark DeMaria
F
Abstract—The National Centers for Environmental Prediction (NCEP) GlobalForecast System (GFS) is a global spectral model used for aviation weatherforecast. It produces forecasts of wind speed and direction, temperature, hu-midity and precipitation out to 192 hr every 6 hours over the entire globe.The horizontal resolution in operational version of the GFS is about 25 km.Much longer integration of similar global models are run for climate applicationsbut with much lower horizontal resolution. Although not specifically designedfor tropical cyclones, the model solutions contain smoothed representations ofthese storms. One of the challenges in using global atmospheric model for hurri-cane applications is objectively determining what is a tropical cyclone, given thethree dimensional solutions of atmospheric variables. This is especially difficultin the lower resolution climate models. To address this issue, without manuallyselecting features of interests, the initial conditions from a low resolution versionof the GFS (2 degree latitude-longitude grid) are examined at 6 hour periodsand compared with the known positions of tropical cyclones. Several Pythonmodules are used to build a prototype model quickly, and the prototype modelshows fast and accurate prediction with the low resolution GFS data.
Index Terms—hurricane, prediction, GFS, SVM
Introduction
The devastating effects from tropical storms, hurricanes1 ,and typhoons on life and property places great importance onforecasting and warning systems [CAM02]. To minimize thepossible damages from hurricanes, we need fast and accurateforecasts as early as possible. Even with the significanceof predicting a hurricane, the procedure for identifying theinitial position and intensity of tropical cyclones is not fullyautomated. From direct measures from aircraft, ships andsurface stations and remote sensing observations, includingsatellite imagery and Doppler radar that is collected over time,meteorologists identify a storm, and it is cumbersome process.
Numerical models are used to forecast the future position,intensity and structure of hurricanes. For climate applications,the resolution of these models is marginal for representation ofhurricanes. Different schemes are proposed to detect tropicalcyclone-like vortices (TCLVs) in general circulation model(GCM) simulations, which rely on threshold values of ob-served characteristics of actual tropical cyclones. However, itis ad-hoc to use a different threshold for hurricane prediction[WAL04]. Although there is some research ongoing to improve
Mark DeMaria is with NOAA/NESDIS/STAR. Minwoo Lee and Charles W.Anderson are with Colorado State University. E-mail: [email protected]○2011 Minwoo Lee et al. This is an open-access article distributed under
the terms of the Creative Commons Attribution License, which permitsunrestricted use, distribution, and reproduction in any medium, provided theoriginal author and source are credited.
1. In this paper, the term hurricane is used generically to represent tropicalcyclones of all intensities, even though, technically speaking, a tropicalcyclone must have winds greater than 63 kt to be classified as a hurricane.
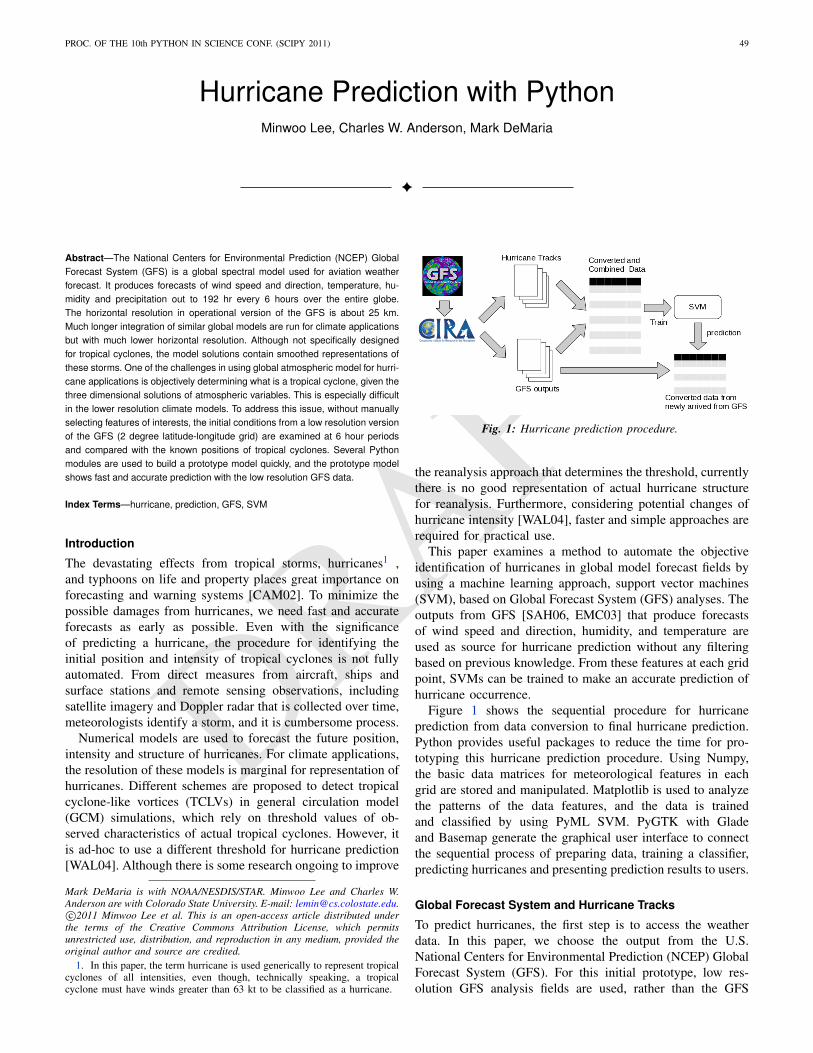
Fig. 1: Hurricane prediction procedure.
the reanalysis approach that determines the threshold, currentlythere is no good representation of actual hurricane structurefor reanalysis. Furthermore, considering potential changes ofhurricane intensity [WAL04], faster and simple approaches arerequired for practical use.
This paper examines a method to automate the objectiveidentification of hurricanes in global model forecast fields byusing a machine learning approach, support vector machines(SVM), based on Global Forecast System (GFS) analyses. Theoutputs from GFS [SAH06, EMC03] that produce forecastsof wind speed and direction, humidity, and temperature areused as source for hurricane prediction without any filteringbased on previous knowledge. From these features at each gridpoint, SVMs can be trained to make an accurate prediction ofhurricane occurrence.
Figure 1 shows the sequential procedure for hurricaneprediction from data conversion to final hurricane prediction.Python provides useful packages to reduce the time for pro-totyping this hurricane prediction procedure. Using Numpy,the basic data matrices for meteorological features in eachgrid are stored and manipulated. Matplotlib is used to analyzethe patterns of the data features, and the data is trainedand classified by using PyML SVM. PyGTK with Gladeand Basemap generate the graphical user interface to connectthe sequential process of preparing data, training a classifier,predicting hurricanes and presenting prediction results to users.
Global Forecast System and Hurricane Tracks
To predict hurricanes, the first step is to access the weatherdata. In this paper, we choose the output from the U.S.National Centers for Environmental Prediction (NCEP) GlobalForecast System (GFS). For this initial prototype, low res-olution GFS analysis fields are used, rather than the GFS

DRAFT
50 PROC. OF THE 10th PYTHON IN SCIENCE CONF. (SCIPY 2011)
Fig. 2: The wind component and humidity 2-D plot at a fixedvertical pressure level. (http://mag.ncep.noaa.gov/NCOMAGWEB/appcontroller)
model forecasts. Similar GFS analysis data are availablein real time from NCEP (http://www.nco.ncep.noaa.gov/pmb/products/gfs/) along with the forecast fields.
The GFS data set contains wind speed and direction, tem-perature, geopotential height deviation and relative humidityin a meteorological 3-D grid along with the year, month-day,time, longitude, and latitude. The vertical coordinate of the3-D grid represents pressure level, where 100 hPa is near thetop of the atmosphere and 1000 hPa is near the surface. Figure2 shows example wind vectors at fixed vertical level (850 hPaof pressure).
This paper uses a low resolution GFS data with the longi-tude and latitude intervals of 2 degrees and recording intervalof 6 hours (0, 6, 12 or 18 UTC). This is similar to what mightbe obtained from a long-term climate simulation. Along withGFS outputs, hurricane tracks are used as labels for hurricanelocations. Hurricane tracks contain storm number, year, month,day, time, and storm information such as latitude, longitude,maximum winds, minimum pressure at the storm center, stormtype, and basin. For this research, each storm location and timeinformation is extracted to use them as labels for hurricaneprediction training.
Data Preprocessing for Hurricane Detection
Raw GFS data and hurricane tracks cannot be used directly;data preprocessing is necessary for efficient hurricane predic-tion. Since the goal of the research is predicting the longi-tudinal and latitudinal location of hurricanes, all the verticalcoordinates can be combined at each grid point. Each locationon the earth, specified by its latitude and longitude, is coveredby a 3-D grid cell of GFS data. We chose to combine theGFS data from the four grid cell corners at all 11 heights byconcatenating them into one vector, as illustrated in Figure
Fig. 3: Converting GFS data and hurricane tracks for hurricaneprediction.
Fig. 4: Image map for the converted data. First 33 rows are the gridsthat have hurricanes, and the rest rows are randomly sampled grids.
3. The presence or absence of a hurricane at each locationis indicated by a 1 or -1, respectively, as the first element ofthe vector. Thus, each sample contains 1+ 11× 4× 8 = 353values.
From July 1st, 2008 through July 4th, 2008, there are194,400 sample grid cells, and only 33 of them containshurricanes. To examine the difference between hurricane cellsand the others, the preprocessed data representation can bevisualized by combining samples as the rows of a Numpyarray and displayed as an image using Matplotlib. In Figure4, the first 33 rows represent locations with hurricanes duringthe time period, and the other rows are randomly selectedlocations that do not have hurricanes. The image shows thatthe data patterns are significantly different between hurricanelocations and the other samples. There is less variation in somecolumns in the first 33 rows, the locations contain hurricanes,than in the last 66 rows, locations without hurricanes.
Numpy and Matplotlib for Data Preprocessing and Analysis
Numpy is the fundamental package that is used as a multi-dimensional container. In this research, Numpy provides thebasic data structure for converted data representations andoperations. It includes various tools for data handling suchas reading and storing files, linear algebra, and matrix ma-nipulation. Data conversion in Figure 3 is easily implementedby using Numpy functions and array object. The matshow()function in Matplotlib is used to generate the image in Figure4 and gives a first look at the data pattern. Although eyeobservation of data is not always successful for the generalmachine learning approaches, it is useful for the GFS data.

DRAFT
HURRICANE PREDICTION WITH PYTHON 51
Fig. 5: Support Vector Machine.
Support Vector Machine
Support Vector Machine (SVM) [ASA08,BIS06] is a popu-lar tool for classification, regression, and novelty detection.An important property of support vector machines is thatthe determination of the model parameters corresponds to aconvex optimization problem, thus a local solution is a globaloptimum [BIS06]. Figure 5 shows the binary SVM marginmaximizer for classification and is explained below.
Support vector machine is characterized by its margin: itlooks for the hyperplane that separates data into two classeswith maximum margin. Let the training data be (xi,yi) with minput vectors xi and target values yi ∈ −1,1. The hyperplanecan be defined
f (x) = wTΦ(x)+b (1)
where Φ(x) denotes a nonlinear function. The w is the weightvector, and scalar b is the bias. Thus, the margin separationinto two half spaces can be defined{
yi =−1 if wT Φ(xi)+b≤−1yi = 1 if wT Φ(xi)+b≥ 1
If the data is linearly separable, we can find a hyperplane suchthat
yi f (xi)≥ 1
If we scale the hyperplane in Equation 1, we get the marginthat is 2
‖w‖ . Since maximizing 2‖w‖ is equivalent to minimizing
‖w‖2 , the hard margin SVM that seeks a maximum margin can
be written as a linear program:
minimize ‖w‖2
subject to yi(wT Φ(x)+b)≥ 1
In practice, the data is not always linearly separable. In suchdata, by allowing some misclassified points, we can get largermargins. Some previous theoretical and experimental studyshows that larger margin will generally perform better thanhard margin SVM [ASA08]. We can define the slack variablesξi > 0 to allow errors.
yi(wTΦ(x)+b)≥ 1−ξi
Fig. 6: Glade-3 for creating the GUI for hurricane prediction.
Now, adding control parameter C, we can rewrite the previouslinear program:
minimize ‖w‖2 +C ∑
mi=1 ξi
subject to yi(wT Φ(x)+b)≥ 1−ξiξi > 0
where m is the number of points. C controls the conflictingobjectives, maximizing the margin and minimizing the sum oferrors. When C is large, a large penalty is given to errors, itreduces the margin that minimizes the error term. When C issmall, it allows more errors resulting in margin increase.
PyML
PyML is a machine learning library that focuses on SVMand kernel methods. As other python packages such as scikit-learn, shogun, orange, and mlpy, PyML efficiently wraps thestate of the art SVM library, libsvm. PyML provides severaldataset containers that hold class labels and a collection of datapatterns. The Numpy array object concatenating our hurricanedata can be easily converted to VectorDataSet in PyML. Sincewe have observed the significant difference between hurricaneand non-hurricane data patterns, we apply a simple linearkernel for classification. Based on the dataset and linear kernel,the SVM is trained for hurricane prediction.
PyGTK and Glade for User Interface
For converting the raw data, training SVM, and finally pre-dicting hurricanes, a simple interface prototype can be easilyconstructed by using PyGTK and Glade-3. Glade is a rapidapplication development tool to enable fast user interfacedesign. Glade-3 tool in Figure 6 makes it easy to create thebase UI for hurricane prediction. Instead of writing the codesfor the placement, color, or type of each widget, the UI createdin Glade-3 is stored in XML, and the XML file is loaded inthe python program with PyGTK. This saves a fair amountof time for creating the GUI. The user interface is composedof right side inputs and buttons for GFS data and tracks fileselection and converting with some options and for training

DRAFT
52 PROC. OF THE 10th PYTHON IN SCIENCE CONF. (SCIPY 2011)
a classifier and saving or loading the trained classifier. Whena trained classifier is ready, the bottom interface is used topredict hurricanes after selecting the GFS data to apply to theclassifier. The major part of the UI plots prediction results ona map by using Basemap. Check buttons on the bottom menuare for plotting options. The following code snippet shows thesimple usage to load the glade UI (the prototype codes will beavailable on http://www.cs.colostate.edu/~lemin/hurricane/):import gtk, gobject, cairoimport gtk.glade
gladefile = "HurricaneUI.glade"builder = gtk.Builder()builder.add_from_file(gladefile)self.window = builder.get_object("mainWindow")builder.connect_signals(self)
Basemap to locate hurricane and prediction
Basemap is an add-on toolkit for Matplotlib that enablesplotting data over map projections. Coastlines, political bound-aries, longitude and latitude grid lines are available in severaldifferent resolutions. Provided map projection coordinates andplotting functions make it easy to visualize predicted locationsand actual hurricanes on the globe. Figure 8 shows the GUIfor hurricane prediction. Orthogonal Basemap for the globeis projected in the middle of the interface and when thetrained SVM is applied to the test data, it can show thehurricane locations as well as the predicted hurricane locationsdepending on the display options. Basemap on the interfacecan be loaded as below:from mpl_toolkits.basemap import Basemap
self.map = Basemap(projection=’ortho’,lat_0 = lat, lon_0 = lon,resolution = ’l’,area_thresh = 1000., ax=ax)
self.map.drawcoastlines(ax=self.ax)self.map.drawcountries(ax=self.ax)self.map.drawlsmask(land_color=’yellowgreen’,
ocean_color=’#CCFFFF’,lakes=True, ax=self.ax)
Hurricane Prediction
Using 2008 GFS data and hurricane tracks, we ran a simpleexperiment for hurricane prediction. Running the codes belowfor 5-fold cross-validation achieves 0.9998 of success rate(0.8458 balanced success rate). The almost square ROC curve(Figure 7) shows the accuracy of the proposed framework. Thecomputed ROC/ROC_50 scores are 0.999808 and 0.916524respectively.import PyML as pyml
data = pyml.VectorDataSet(filen, labelsColumn=0)s = pyml.SVM()result = s.cv(data)
Now, we train SVM with four days of GFS data and hurricanetracks from July 1st to July 4th in 2008. The trained SVMpredicts hurricane locations of one and half months later.It is tested on the data for August 29th when HurricaneGustav neared the west side of Cuba, and it predict the actualhurricane or near hurricane locations successfully. Even with
Fig. 7: ROC curve for the support vector machine.
Fig. 8: Hurricane prediction and actual hurricanes. Blue circlesindicate predicted hurricane locations, and red circles indicate theactual hurricane locations.
a short period time for training samples, it found all hurricanelocations without an error in testing data: the prediction picks21 grid cells including all four hurricane locations. Figure 8shows that even with over estimation of hurricane locations, itpredicts all the hurricanes. Furthermore, the false positives areneighboring locations that can be the area that hurricanes affectthe atmospheric conditions close to the data pattern of truehurricane locations. Training and prediction is done simply byreading data files and calling train() and test() functions:import PyML as pyml
data = pyml.VectorDataSet(filen, labelsColumn=0)s = pyml.SVM()s.train(data) # trainingtest_data = pyml.VectorDataSet(testfn, labelsColumn=0)result = s.test(test_data) # prediction

DRAFT
HURRICANE PREDICTION WITH PYTHON 53
Conclusion
In summary, we presented the hurricane prediction problem,how it can be tackled objectively with a machine learningapproach, and how python packages are applied to prototypethe hurricane prediction. For the proposed approached, mete-orologists do not need to select features of interests anymore.To show this, various python packages are used for fastand efficient prototyping that solves the hurricane predictionproblem: Numpy for converting GFS data and hurricane tracks,Matplotlib for analyzing the data patterns, PyML for binaryclassification of hurricanes, and PyGTK, Glade, and Basemapfor the graphical user interface.
This machine learning approach will be able to contributedeveloping fast and objective adaptation model for hurricaneprediction without manual feature selection. Although the con-nection between global warming and hurricanes is not clear,some research such as [WAL04] points out that changes in thenumber of storms and the maximum intensities are likely tohappen as climate changes. Considering the hurricane changesover time, online adaptation models for hurricane predictionneeds to be investigated. The various python packages will bean excellent choice for use in future research as well.
REFERENCES
[SAH06] Saha S, Nadiga S, Thiaw C, Wang J, Wang W, Zhang Q, Vanden Dool HM, Pan H-L, Moorthi S, Behringer D, Stokes D,Pena M, Lord S, White G, Ebisuzaki W, Peng P, Xie P. TheNCEP climate forecast system, J Clim 19(15):3483–3517. doi:10.1175/JCLI3812.1, 2006.
[EMC03] Environmental Modeling Center. The GFS Atmospheric Model,NOAA/NCEP/Environmental Modeling Center Office Note 442,14 pp. 2003 [Available online at http://www.emc.ncep.noaa.gov/officenotes/FullTOC.html.].
[CAM02] Camargo SJ, Zebiak SE. Improving the detection and trackingof tropical cyclones in atmospheric general circulation models,Technical Report No. 02–02. International Research Institute forClimate Prediction, Palisades, NY, 2002.
[WAL04] K. Walsh. Tropical cyclones and climate change: Unresolvedissues, Climate Res., 27, 78–83, 2004.
[HOU01] J.T. Houghton, Y. Ding, D.J. Griggs, M. Noguer, P.J. van derLinden, X. Dai, K. Maskell, C.A. Johnson, Climate Change 2001:The Scientific Basis, Contribution of Working Group I to the ThirdAssessment Report of the Intergovernmental Panel on ClimateChange (IPCC). Cambridge University Press, Cambridge and NewYork, 2001.
[ASA08] A. Ben-Hur, C.S. Ong, S. Sonnenburg, B. Sch"{o}lkopf, and G.R"{a}tsch. Support vector machines and kernels for computationalbiology, PLoS Comput Biol, 4(10):e1000173, 2008.
[BIS06] C.M. Bishop. Pattern recognition and machine learning, volume 4.Springer New York, 2006.