Hurricane Isabel September 18-19, 2003 Isabel September 18-19, 2003 ... LSU Louisiana State...
63
Service Assessment Hurricane Isabel September 18-19, 2003 U.S. DEPARTMENT OF COMMERCE National Oceanic and Atmospheric Administration National Weather Service Silver Spring, Maryland
Transcript of Hurricane Isabel September 18-19, 2003 Isabel September 18-19, 2003 ... LSU Louisiana State...

Service Assessment
Hurricane IsabelSeptember 18-19, 2003
U.S. DEPARTMENT OF COMMERCENational Oceanic and Atmospheric AdministrationNational Weather ServiceSilver Spring, Maryland

Cover: Moderate Resolution Imaging Spectroradiometer (MODIS) Rapid Response Team imagery, NASA Goddard Space Flight Center, 1555 UTC September 18, 2003.

Service Assessment
Hurricane IsabelSeptember 18-19, 2003
May 2004
U.S. DEPARTMENT OF COMMERCEDonald L. Evans, Secretary
National Oceanic and Atmospheric AdministrationVice Admiral Conrad C. Lautenbacher, Jr., U.S. Navy (retired), Administrator
National Weather ServiceBrigadier General David L. Johnson, U.S. Air Force (Retired), Assistant Administrator

i i
PrefaceThe hurricane is one of the most potentially devastating natural forces. The potential for
disaster increases as more people move to coastlines and barrier islands. To meet the mission ofthe National Oceanic and Atmospheric Administration’s (NOAA) National Weather Service(NWS) - provide weather, hydrologic, and climatic forecasts and warnings for the protection oflife and property, enhancement of the national economy, and provide a national weatherinformation database - the NWS has implemented an aggressive hurricane preparedness program.
Hurricane Isabel made landfall in eastern North Carolina around midday Thursday,September 18, 2003, as a Category 2 hurricane on the Saffir-Simpson Hurricane Scale (AppendixA). Although damage estimates are still being tabulated as of this writing, Isabel is consideredone of the most significant tropical cyclones to affect northeast North Carolina, east centralVirginia, and the Chesapeake and Potomac regions since Hurricane Hazel in 1954 and theChesapeake-Potomac Hurricane of 1933.
Hurricane Isabel will be remembered not for its intensity, but for its size and the impact ithad on the residents of one of the most populated regions of the United States. Isabel is areminder that if the impact of a Category 2 hurricane can be so extensive, then the impact of amajor hurricane (Category 3 or higher) could be devastating.
Due to the impact on such a large number of people, a service assessment team wasformed to examine the warning and forecast services provided to emergency managers (EMs),government agencies and the public. Service assessments provide a valuable contribution toongoing efforts to improve the quality and timeliness of our products and services. Findings andrecommendations from this assessment will improve techniques, products, services, and theinformation provided to the American Public.
David L. JohnsonAssistant Administrator for Weather Services
May 2004

i i i
Table of ContentsPage
Preface............................................................................................................................................. ii
Service Assessment Team .............................................................................................................. iv
Acronyms........................................................................................................................................ v
Service Assessment Report ............................................................................................................. 1Executive Summary ............................................................................................................ 1Warning and Forecast Services ........................................................................................... 6
A. Tropical Prediction Center ..................................................................... 6B. Hydrometeorological Prediction Center .............................................. 11C. Ocean Prediction Center .................................................................... 12D. WFO Newport, North Carolina ........................................................... 13E. WFO Wakefield, Virginia .................................................................... 22F. WFO Baltimore-Washington ................................................................ 32G. River Forecast Centers .................................................................... 44H. NOAA Public Affairs .................................................................... 48I. Sea Lake and Overland Surges from Hurricanes (SLOSH) Model ...... 48
Best Practices ................................................................................................................................ 51
Appendix A Saffir-Simpson Hurricane Scale .......................................................................... A-1
Appendix B Summary of Fatalities ........................................................................................ B-1

iv
Service Assessment TeamThis Service Assessment Team was activated on September 25, 2003. The team
assembled at the Weather Forecast Office (WFO) in Raleigh, NC, on Sunday, September 28, tobegin their work. Team members visited WFOs Newport, NC, Wakefield, VA, Baltimore-Washington (Sterling), VA, the Tropical Prediction Center, Miami, FL, and various emergencymanagement, government, broadcast media and individuals directly affected by the storm. Manytelephone interviews were conducted with emergency management officials, local, state, andfederal government officials, broadcast media, and the public.
The team consisted of the following persons:
Russell (Rusty) Pfost Team Leader, Meteorologist in Charge (MIC),WFO Miami, FL
Darin Figurskey MIC, WFO Buffalo, NY
Alan Gerard MIC, WFO Jackson, MS
Roger Lamoni Warning Coordination Meteorologist, WFO Reno, NV
Joel Lanier Senior Service Hydrologist, WFO Tallahassee, FL
David R. Vallee Science and Operations Officer, WFO Taunton, MA
Other valuable contributors
Wayne Presnell Office of Climate, Water and Weather Services,NWS Headquarters, Silver Spring, MD
David Miller NOAA Public Affairs, Washington, D.C.

v
AcronymsASOS Automated Surface Observation SystemAVNN GFS operational forecast runs without synoptic surveillance dataAVNO GFS operational forecast runs synoptic surveillance dataAWC Aviation Weather Center, Kansas City, MOAWIPS Advanced Weather Interactive Processing SystemAWOS Automated Weather Observing SystemCDT Central Daylight TimeCPC Climate Prediction CenterCRS Console Replacement System (NOAA Weather Radio)CST Central Standard TimeCWA County Warning AreaCWF Coastal Marine ForecastEAS Emergency Alert SystemEDT Eastern Daylight TimeEM Emergency Management/ManagerEMC Environmental Modeling Center, Washington, D.C.EMWIN Emergency Managers’ Weather Information NetworkERH Eastern Region Headquarters, Bohemia, NYEST Eastern Standard TimeFEMA Federal Emergency Management AgencyFFMP Flash Flood Monitoring and PredictionFIC Forecaster-in-ChargeFSL Forecast Systems Laboratory, Boulder, COGFE Graphical Forecast EditorGFS Global Forecast SystemHAS Hydro-meteorological Analysis and SupportHLS Hurricane Local StatementHLT Hurricane Liaison TeamHMT Hydrometeorological TechnicianHPC Hydrometeorological Prediction Center, Camp Springs, MDHRD Hurricane Research Division, Miami, FLHSM Hurricane Support MeteorologistHURREVAC Computer program used for hurricane tracking and displayHWO Hazardous Weather OutlookIFLOWS Integrated Flood Observing and Warning SystemIFPS Interactive Forecast Preparation SystemIT Internet TechnologyLARC Limited Automated Remote CollectorLP1 Local Primary 1 (broadcast station)LP2 Local Primary 2 (broadcast station)
vi
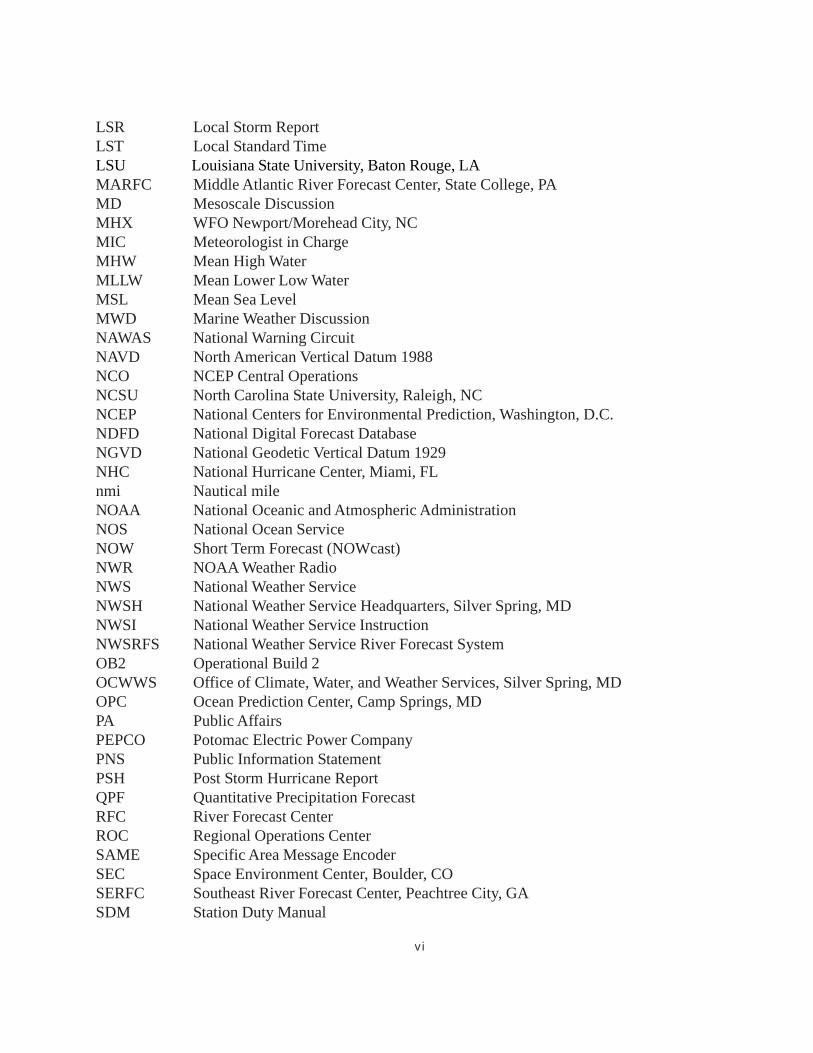
LSR Local Storm ReportLST Local Standard TimeLSU Louisiana State University, Baton Rouge, LAMARFC Middle Atlantic River Forecast Center, State College, PAMD Mesoscale DiscussionMHX WFO Newport/Morehead City, NCMIC Meteorologist in ChargeMHW Mean High WaterMLLW Mean Lower Low WaterMSL Mean Sea LevelMWD Marine Weather DiscussionNAWAS National Warning CircuitNAVD North American Vertical Datum 1988NCO NCEP Central OperationsNCSU North Carolina State University, Raleigh, NCNCEP National Centers for Environmental Prediction, Washington, D.C.NDFD National Digital Forecast DatabaseNGVD National Geodetic Vertical Datum 1929NHC National Hurricane Center, Miami, FLnmi Nautical mileNOAA National Oceanic and Atmospheric AdministrationNOS National Ocean ServiceNOW Short Term Forecast (NOWcast)NWR NOAA Weather RadioNWS National Weather ServiceNWSH National Weather Service Headquarters, Silver Spring, MDNWSI National Weather Service InstructionNWSRFS National Weather Service River Forecast SystemOB2 Operational Build 2OCWWS Office of Climate, Water, and Weather Services, Silver Spring, MDOPC Ocean Prediction Center, Camp Springs, MDPA Public AffairsPEPCO Potomac Electric Power CompanyPNS Public Information StatementPSH Post Storm Hurricane ReportQPF Quantitative Precipitation ForecastRFC River Forecast CenterROC Regional Operations CenterSAME Specific Area Message EncoderSEC Space Environment Center, Boulder, COSERFC Southeast River Forecast Center, Peachtree City, GASDM Station Duty Manual

vii
SLOSH Sea Lake and Overland Surges from HurricanesSOO Science and Operations OfficerSPC Storm Prediction Center, Norman, OKSPS Special Weather StatementSVS Severe Weather StatementUTC Coordinated Universal TimeT1 Fiber optic digital voice channel telecommunications lineTAFB Tropical Analysis and Forecast Branch, Miami, FLTPC Tropical Prediction Center, Miami, FLTSB Technical Support Branch, Miami, FLUCP Unit Control PositionUPS Uninterruptible Power SourceUSGS United States Geological SurveyVDEM Virginia Department of Emergency ManagementVIP Voice Improvement ProcessorVISIT Virtual Institute for Satellite Integration Training, Fort Collins, COWAN Wide Area NetworkWARNGEN Warning Generation software (part of AWIPS)WCM Warning Coordination MeteorologistWES Weather Event SimulatorWFO Weather Forecast OfficeWSR-88D Weather Surveillance Radar-1988 DopplerWWA Watch, Warning, and Advisory interface (part of AWIPS)ZFP Zone Forecast Product

1
Service Assessment Report
Executive Summary
Overall, the NWS service to the nation during Isabel was exemplary. Emergencymanagement from the local county and city level to the highest officials in the FederalEmergency Management Agency (FEMA), the media, and the citizens of the communitiesaffected by Isabel recognized and appreciated the outstanding work by the NWS. While Isabelwas a Category 2 hurricane and was decreasing in intensity as it crossed the North Carolina coaston September 18, it caused tremendous damage and disruption, felled thousands of treesresulting in massive power outages, and caused unusually high storm surge along the Mid-Atlantic coast.
Isabel became the ninth named storm of the 2003 Atlantic basin tropical cyclone seasonabout 625 miles west of the Cape Verde Islands on Saturday morning, September 6. Isabelbegan as a strong tropical wave off the West African Coast about three days before, and wasupgraded to a hurricane at 11 a.m. EDT Sunday, September 7. Isabel intensified rapidlyMonday, September 8, going through Categories 2 and 3 of the Saffir-Simpson Hurricane Scale(Appendix A) and reaching Category 4 intensity by 11 p.m. EDT that day.
Isabel remained a strong Category 4 hurricane until reaching the rare Category 5 status,the highest category of hurricane strength on the Saffir-Simpson Scale, Thursday, September 11at 5 p.m. EDT. Isabel was moving slowly west and had reached a location about 500 miles eastnortheast of the northern Leeward Islands. Isabel remained at or near Category 5 intensity untilSunday, September 14, when it weakened to a Category 4 storm. Isabel weakened to a Category3 late Monday, September 15. Weakening continued through Tuesday, decreasing to a Category2 at 11 a.m. EDT Tuesday, September 16.
Hurricane Watches were issued by the Tropical Prediction Center (TPC) for parts of theNorth Carolina, Virginia, Maryland, Delaware, and New Jersey coasts at 11 a.m. EDT Tuesday.Hurricane Warnings were issued by the TPC at 11 p.m. EDT Tuesday, and extended northward at5 a.m. EDT Wednesday, September 17. Isabel made landfall near Drum Inlet, Carteret County,North Carolina, around 1 p.m. EDT Thursday, September 18. Isabel moved northwest toRoanoke Rapids, NC, by 5 p.m. EDT Thursday, and accelerated to northeast West Virginia by 5a.m. Friday, September 19 as a tropical storm. By 11 a.m. EDT Friday, the center of the stormwas losing tropical characteristics and was near Cleveland, Ohio, moving northward into Canada.
Most of the effects of Isabel were experienced between Thursday morning, September 18and Friday evening, September 19. Isabel is directly responsible for 17 deaths (Appendix B),mainly through drowning, or persons or automobiles hit by falling trees or limbs. Thirty-fourfatalities were indirectly related to Isabel and several of these have been attributed to carbonmonoxide poisoning from generators running in closed spaces without proper ventilation.
2
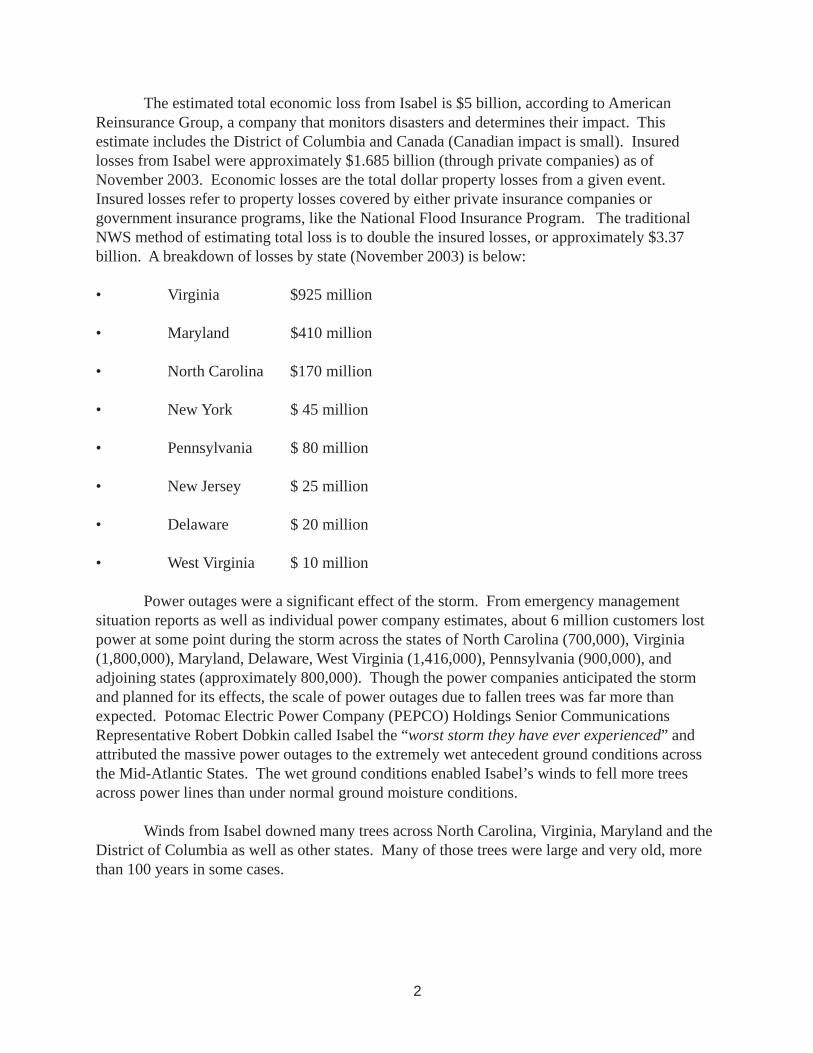
The estimated total economic loss from Isabel is $5 billion, according to AmericanReinsurance Group, a company that monitors disasters and determines their impact. Thisestimate includes the District of Columbia and Canada (Canadian impact is small). Insuredlosses from Isabel were approximately $1.685 billion (through private companies) as ofNovember 2003. Economic losses are the total dollar property losses from a given event.Insured losses refer to property losses covered by either private insurance companies orgovernment insurance programs, like the National Flood Insurance Program. The traditionalNWS method of estimating total loss is to double the insured losses, or approximately $3.37billion. A breakdown of losses by state (November 2003) is below:
• Virginia $925 million
• Maryland $410 million
• North Carolina $170 million
• New York $ 45 million
• Pennsylvania $ 80 million
• New Jersey $ 25 million
• Delaware $ 20 million
• West Virginia $ 10 million
Power outages were a significant effect of the storm. From emergency managementsituation reports as well as individual power company estimates, about 6 million customers lostpower at some point during the storm across the states of North Carolina (700,000), Virginia(1,800,000), Maryland, Delaware, West Virginia (1,416,000), Pennsylvania (900,000), andadjoining states (approximately 800,000). Though the power companies anticipated the stormand planned for its effects, the scale of power outages due to fallen trees was far more thanexpected. Potomac Electric Power Company (PEPCO) Holdings Senior CommunicationsRepresentative Robert Dobkin called Isabel the “worst storm they have ever experienced” andattributed the massive power outages to the extremely wet antecedent ground conditions acrossthe Mid-Atlantic States. The wet ground conditions enabled Isabel’s winds to fell more treesacross power lines than under normal ground moisture conditions.
Winds from Isabel downed many trees across North Carolina, Virginia, Maryland and theDistrict of Columbia as well as other states. Many of those trees were large and very old, morethan 100 years in some cases.

3
Isabel’s storm tide was 1 to 3 feet higher than was forecast, especially in the northernChesapeake Bay and Potomac Basins including Baltimore, Annapolis, and Washington. Fell’sPoint in Baltimore, the U.S. Naval Academy and downtown Annapolis, and the Belle Viewneighborhoods of northern Fairfax County, Virginia experienced severe storm surge flooding.Table 1 provides measured storm tide crests at several sites in North Carolina, Virginia, andMaryland. From observations of debris lines and data from tide gages, the storm tide was 5 to 11feet above National Geodetic Vertical Datum 1929 (NGVD) across North Carolina’s OuterBanks. The storm tide measured from 6 to 9 feet NGVD in the Chesapeake Bay area and thetidal Potomac River Basin. Many NWS customers expressed confusion over exactly what theNWS forecasts meant, whether it was on top of normal tides or mean lower low water, or meansea level and at what datum. The North American Vertical Datum (NAVD) of 1988 is analternative datum in use along the Atlantic Coast of the United States. Storm tide measurementsusing the NAVD can be obtained by subtracting approximately 1 foot from measurements usingNGVD.
Extensive storm tide surveys and measurements of high water marks were ongoing at thetime of this writing, not only in the Potomac and Chesapeake Bay areas but also along theAtlantic coast of North Carolina and Virginia. Storm tide measurements quoted in this serviceassessment were compiled and accurate through December 2003. Final analysis andmeasurement may result in information different from that contained in this report.
Max Mayfield, Director of TPC, noted in December 2003, that damage from HurricaneIsabel will exceed 2 billion dollars, in spite of a near-perfect forecast. He said that it would takea long term public-private partnership to effect change in the way people live near our coastlinesin order to mitigate damages from future storms like Isabel.

4
Location Storm Tide Time Date Remarks(ft. NGVD LST1929)
Wilmington, NC 3.22 1618 9/18
Beaufort, NC 5.03 1342 9/18
Cape Hatteras, NC 7.7 918 9/18 Fishing Pier (gage destroyed - partial record)
Oregon Inlet Marina, NC 5.84 2300 9/18
Duck, NC 7.0e 800e 9/18 wave action 10-15 ft. higher on top
Money Point, VA 7.76 1454 9/18
Chesapeake Bay 7.12 1318 9/18 highest sustained wind 73 mphBridge/Tunnel, VA highest gust 87 mph 1625 and 1710 9/18
Sewell’s Point, VA 7.53 1600 9/18
Scotland, VA 6.74 1518 9/18 Gage destroyed-partial record
King’s Mill, VA 6.29 1524 9/18 Gage destroyed-partial record
Gloucester Point, VA 5.78 1200 9/18 Gage destroyed-partial record
Colonial Beach, VA 5.45 1836 9/18 Gage destroyed-partial record
Kiptopeke, VA 6.07 1418 9/18
Wachapreague, VA 7.09 1500 9/18
Richmond, VA 9.0e Late 9/18 City Locks James River (estimated)eve
Washington, D.C. 7.5 342 9/19 Water St., Police and Fire Harbor Patrol,Potomac River
Baltimore, MD 8.34 706 9/19 Chesapeake Bay
Annapolis, MD 7.47 642 9/19 Chesapeake Bay
Tolchester Beach, MD 8.07 742 9/19 Chesapeake Bay
Cambridge, MD 6.15 542 9/19 Chesapeake Bay
Ocean City Inlet, MD 3.62 112 9/19
Philadelphia, PA 7.01 630 9/19 Delaware River
Reedy Point, DE 6.73 406 9/19 Delaware River
Lewes, DE 5.27 1424 9/18 Delaware Bay
Cape May, NJ 4.87 1354 9/18 Delaware Bay
Burlington, NJ 7.57 700 9/19 Delaware Bay
Table 1 - Storm Tide crest data table. Datum is NGVD 1929 (NAVD subtract 0.99 ft.)

5
Extreme rainfall from the storm occurred in the Shenandoah Valley and the Blue RidgeMountains of Northern Virginia. More than 20 inches of rain fell at Upper Sherando, just southof Waynesboro in Augusta County, Virginia. This rain caused flash floods over severaltributaries of the South River and a major flood on the South River at Waynesboro anddownstream on the Shenandoah River at Lynnwood, Front Royal, and Millville. Major floodingalso occurred in parts of the Potomac River Basin.
President George W. Bush declared disaster areas in all categories of hazard mitigation for77 counties and independent cities in Virginia and 36 counties in North Carolina on September18. He declared the entire state of Maryland a disaster area on September 19, the entire state ofDelaware and the District of Columbia on September 20, and 6 counties in the panhandle of WestVirginia on September 24.
In particular, the NWS TPC did an outstanding job forecasting Isabel. The storm was acomplete triumph for the new five day forecast as well. NWS Weather Forecast Offices (WFOs)did very well with their local services to their individual county warning areas (CWAs) accordingto comments and quotes from emergency management personnel and media. Bob Dobkin, seniorcommunications representative with PEPCO Holdings said, “We were prepared for it . . . youguys did a good job!” Charles McRorie, the Emergency Manager for Alexandria, said NWSforecasts were, “timely, accurate and reliable.”
An assessment team headed by W. Robert Herbert for the Commonwealth of Virginia’sresponse during Isabel concluded its work with a final report in December 2003. The surveyincluded several questions about the NWS. Virtually everyone expressed satisfaction with theNWS and the accuracy of its forecasts. Results from the survey show 96% of the respondentssaid the advance warning and notification system was adequate in indicating the level ofdamage that occurred. Only two respondents said that forecasts were not adequate, particularlywith regard to tidal surge notification. Even with the best forecasts and warnings, though, notedone respondent, “unless people have actually been in high sustained winds or high tide surges,they cannot appreciate the damage that can be done.”
6
Warning and Forecast ServicesA. Tropical Prediction Center
Overview
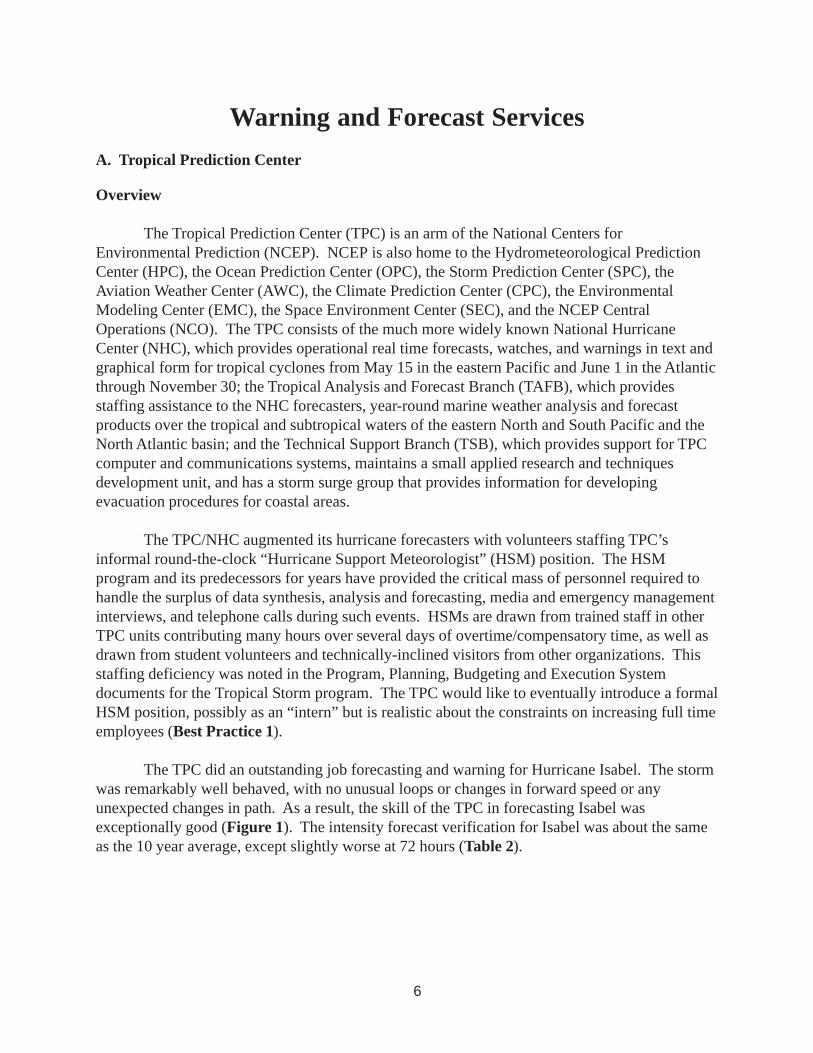
The Tropical Prediction Center (TPC) is an arm of the National Centers forEnvironmental Prediction (NCEP). NCEP is also home to the Hydrometeorological PredictionCenter (HPC), the Ocean Prediction Center (OPC), the Storm Prediction Center (SPC), theAviation Weather Center (AWC), the Climate Prediction Center (CPC), the EnvironmentalModeling Center (EMC), the Space Environment Center (SEC), and the NCEP CentralOperations (NCO). The TPC consists of the much more widely known National HurricaneCenter (NHC), which provides operational real time forecasts, watches, and warnings in text andgraphical form for tropical cyclones from May 15 in the eastern Pacific and June 1 in the Atlanticthrough November 30; the Tropical Analysis and Forecast Branch (TAFB), which providesstaffing assistance to the NHC forecasters, year-round marine weather analysis and forecastproducts over the tropical and subtropical waters of the eastern North and South Pacific and theNorth Atlantic basin; and the Technical Support Branch (TSB), which provides support for TPCcomputer and communications systems, maintains a small applied research and techniquesdevelopment unit, and has a storm surge group that provides information for developingevacuation procedures for coastal areas.
The TPC/NHC augmented its hurricane forecasters with volunteers staffing TPC’sinformal round-the-clock “Hurricane Support Meteorologist” (HSM) position. The HSMprogram and its predecessors for years have provided the critical mass of personnel required tohandle the surplus of data synthesis, analysis and forecasting, media and emergency managementinterviews, and telephone calls during such events. HSMs are drawn from trained staff in otherTPC units contributing many hours over several days of overtime/compensatory time, as well asdrawn from student volunteers and technically-inclined visitors from other organizations. Thisstaffing deficiency was noted in the Program, Planning, Budgeting and Execution Systemdocuments for the Tropical Storm program. The TPC would like to eventually introduce a formalHSM position, possibly as an “intern” but is realistic about the constraints on increasing full timeemployees (Best Practice 1).
The TPC did an outstanding job forecasting and warning for Hurricane Isabel. The stormwas remarkably well behaved, with no unusual loops or changes in forward speed or anyunexpected changes in path. As a result, the skill of the TPC in forecasting Isabel wasexceptionally good (Figure 1). The intensity forecast verification for Isabel was about the sameas the 10 year average, except slightly worse at 72 hours (Table 2).

7
Forecast period Isabel average 10 year average Isabel intensity 10 year averageofficial track official track forecast error intensityerror (nmi) error (nmi) (KTS) forecast error
(KTS) 24 hrs (1 day) 39 81 11 11 48 hrs (2 days) 60 150 17 17 72 hrs (3 days) 80 225 23 18 96 hrs (4 days) 104 282 (2 year avg.) 26 n/a 120 hrs (5 days) 146 374 (2 year avg.) 28 n/a
Table 2 - Hurricane Isabel track and intensity forecast verification data
Interviews with hurricane forecasters and TPC leadership showed a general satisfaction with,and optimism for, the new five day forecast as far as forecast track, but much less as far asforecast intensity. Hurricane Isabel was indeed a big success for the five day forecast track butwas not as strong as forecast at landfall. Skill for tropical cyclone intensity forecasts has beenroughly plus or minus 20 knots at 5 days, and for Isabel the 5 day intensity forecast erroraveraged 28 knots. A 20 knot error is equivalent to a little over 1 Saffir-Simpson Scale category,or the difference between a high end Category 1 and a low end Category 3 hurricane.
From a TPC Tropical Cyclone Report on Isabel by Beven and Cobb (2003), there appearsto be three primary reasons for the excellent track forecasts. First, Isabel was a large and stronghurricane, and this type of tropical cyclone is typically associated with relatively low errors.Second, Isabel moved slowly through the central and eastern Atlantic in a relatively predictablesteering pattern. And finally, when Isabel reached the western Atlantic, synoptic surveillancemissions began using both the NOAA Gulfstream-IV jet and Air Force Reserve aircraft to deploydropsondes in the hurricane’s environment. According to a preliminary assessment by theHurricane Research Division (HRD), this data, which helped resolve a complex steering flowpattern around Isabel, had an unusually strong positive impact (of roughly 30%-40% beyond 48hours) on the track forecast guidance from the NWS Global Forecast System model (AVNO inTable 3). However, total samples of verification data from 1999-2003 show only slightimprovement beyond 72 hours.

8
FORECAST ERRORS (KM) FOR ISABEL
12 h 24 h 36 h 48 h 60 h 72 h 84 h 96 h 108 h 120 hAVNN 30.9 45.6 69.5 128.7 198.6 281.0 359.7 382.2 429.6 463.0AVNO 33.1 40.6 52.0 93.9 121.6 159.1 193.9 202.5 228.0 275.2%IMP -7% 11% 25% 27% 39% 43% 44% 47% 47% 41%#CASES 16 16 16 16 14 12 10 7 6 4
Table 3. Forecast track errors (km) for Isabel from the operational GFS model (AVNO)using synoptic surveillance data including dropsondes from aircraft reconnaissancecompared to parallel runs without the synoptic surveillance data (AVNN).
The forecast discussion products issued by TPC were already mentioning the UnitedStates East Coast as potentially threatened by Isabel as early as Thursday, September 11, a fullweek before landfall in North Carolina. At 5 p.m. EDT, September 15, TPC issued the firstPublic Advisory mentioning areas from the Carolinas northward to New England as possiblelandfall targets for Hurricane Isabel. A Hurricane Watch, issued for a part of the coastline at riskof hurricane conditions within 36 hours, was issued at 11 a.m. EDT Tuesday, September 16, 50hours before landfall of the eye. A Hurricane Warning, issued for a part of the coastlineexpecting hurricane conditions within 24 hours, was issued at 11 p.m. EDT Tuesday, September16, 38 hours before landfall of the eye. Thus, TPC provided the impacted areas sufficient time toprepare for the arrival of Hurricane Isabel.
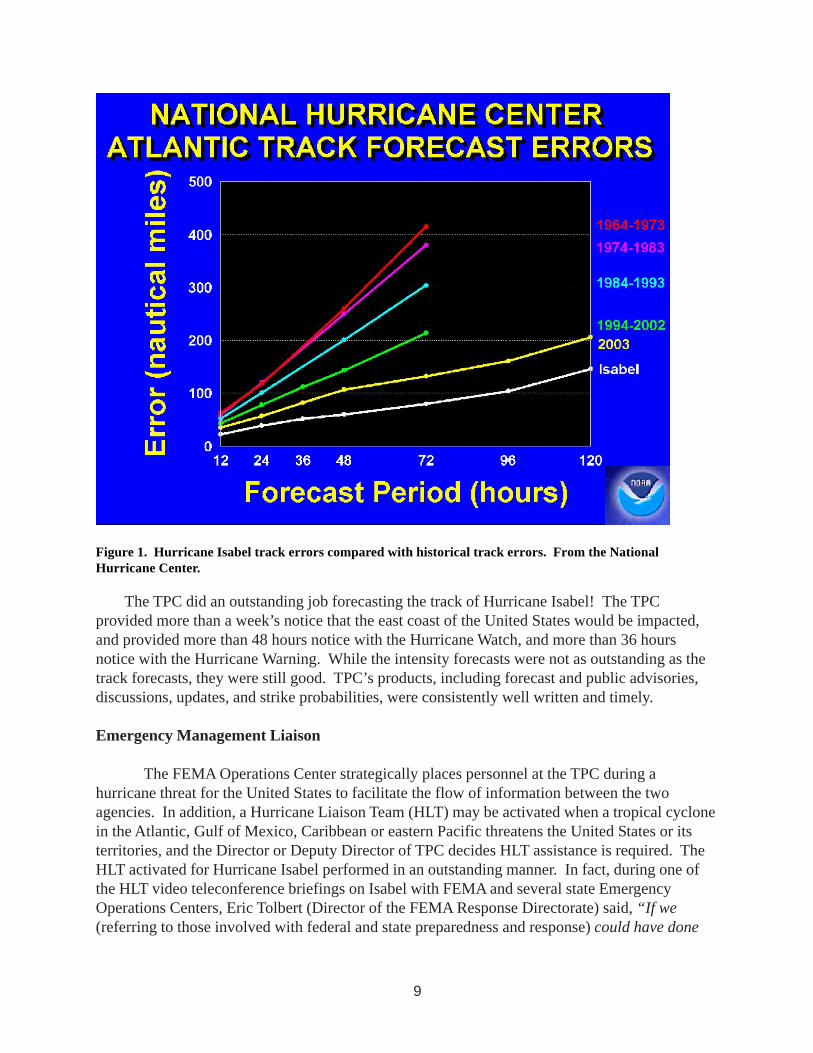
Figure 1 shows the Isabel track forecast error by NHC forecasters out to 5 days comparedwith historical track errors for 1964-1973 (red), 1974-1983 (purple), 1984-1993 (sky blue), 1994-2002 (green), and 2003 (yellow). It is interesting that the 120 hour (5 day) forecast track error forIsabel was less than the 36 hour (1.5 day) forecast track error from 1964-1983. The 48- hourposition forecast error was 60 nautical miles (nmi), which is 90 nmi lower than the 10-yearaverage error of 150 nmi, and 70 nmi lower than the 2003 error of 130 nmi.
9
Figure 1. Hurricane Isabel track errors compared with historical track errors. From the NationalHurricane Center.
The TPC did an outstanding job forecasting the track of Hurricane Isabel! The TPCprovided more than a week’s notice that the east coast of the United States would be impacted,and provided more than 48 hours notice with the Hurricane Watch, and more than 36 hoursnotice with the Hurricane Warning. While the intensity forecasts were not as outstanding as thetrack forecasts, they were still good. TPC’s products, including forecast and public advisories,discussions, updates, and strike probabilities, were consistently well written and timely.
Emergency Management Liaison
The FEMA Operations Center strategically places personnel at the TPC during ahurricane threat for the United States to facilitate the flow of information between the twoagencies. In addition, a Hurricane Liaison Team (HLT) may be activated when a tropical cyclonein the Atlantic, Gulf of Mexico, Caribbean or eastern Pacific threatens the United States or itsterritories, and the Director or Deputy Director of TPC decides HLT assistance is required. TheHLT activated for Hurricane Isabel performed in an outstanding manner. In fact, during one ofthe HLT video teleconference briefings on Isabel with FEMA and several state EmergencyOperations Centers, Eric Tolbert (Director of the FEMA Response Directorate) said, “If we(referring to those involved with federal and state preparedness and response) could have done
10
this any better, I don’t know how we would have done it.” Director Tolbert then asked everyoneat FEMA headquarters on the video teleconference to give all the NWS folks a hand for the greatjob on forecasting Isabel. Dr. Ken Taylor, the Director of Emergency Management for NorthCarolina, added his agreement with Director Tolbert’s sentiments.
North Carolina emergency managers also praised the forecasts and products of the TPC forIsabel. They were particularly impressed with the consistency of the landfall forecast fromadvisory to advisory, and several stated that this gave them added confidence in the forecast ofthe track and associated impacts expected from the hurricane.
TPC Products to WFOs
Interviews with the WFOs most affected by Isabel (WFOs Newport, NC, Wakefield, VA,and Baltimore-Washington) did reveal some problems with Interactive Forecast ProcessingSystems (IFPS) procedures and the grids provided by the TPC for Isabel. NWS Instruction 10-503, section 2.2.3 on Issuance Time for the Zone Forecast Product (ZFP) reads as follows:
2.2.3 Issuance Time. The ZFP is an event-driven product and may be issued at any time.However, at a minimum the ZFP will be issued twice daily to remove the outdated first period ofthe forecast. These mandatory issuance times will occur no later than 4 a.m. and 4 p.m. localtime.
Tropical cyclone advisories are issued by TPC at 5 a.m./p.m. and 11 a.m./p.m., which meansthat WFOs affected by tropical cyclones must meet the 4 a.m./p.m. deadline for their ZFPpackages and then issue an update (which usually means a new complete set of grids andproducts) to incorporate and be consistent with the new advisory. While this directive did not gointo effect until October 1, 2003, which was after the Isabel event, WFOs nevertheless havestrived to meet the 4 a.m./p.m. deadline beforehand.
The same is true for the coastal marine products. NWS Instruction 10-310, section 2.2.3 onIssuance Time for the coastal waters forecast (CWF) is as follows:
2.2.3 Issuance Time. Coastal Waters Forecasts are routinely-scheduled products. WFOsshould issue Coastal Waters Forecasts based on the following:
Region/Office Scheduled Issuance Time (UTC)Eastern (Winter/Summer) 0830/0730 2030/1930Southern (EST/CST) 0930/0930 2130/2130
(EDT/CDT) 0830/0930 2030/2130WFO San Juan 0830 2030
Fact - It is a great deal of extra work for the WFO synoptic forecaster to completely issue aforecast package by 4 a.m./p.m. and then have to issue it again to incorporate the 5 a.m./p.m.advisory from TPC in an update package.

11
Finding # 1 - NWSI 10-310 Section 2.2.3 and 10-503 Section 2.2.3 require that WFOs issuethe ZFP no later than 4 a.m./p.m. local time each day and the CWF no later than 430/1030a.m./p.m. local time each day. Tropical cyclone advisories are issued by TPC at 5/11 a.m./p.m. each day, requiring a complete update to the forecast package issued only a half-hourto one hour earlier by the WFOs. This is a significant workload issue.
Recommendation # 1: NWSI 10-310 Section 2.2.3 and 10-503 Section 2.2.3 should beupdated to give WFOs an option, during a tropical cyclone event, to delay the issuance ofmorning and/or afternoon Public Forecast and Coastal Waters Forecast products untilafter TPC issues its advisories.
TPC can issue tropical cyclone watches and warnings at any time for coastal locations usingregular and special advisories. Issuing a watch or warning with the 11 p.m. EDT advisory can bea problem in rural locations in the Eastern and Atlantic Time Zones. Many radio and televisionstations (even Local Primary 1 and 2 stations) are not routinely staffed 24 hours, and are difficultto contact late at night. This should not be as much of a problem in time zones further westacross the U.S. TPC will consider this potential problem in its future operations.
B. Hydrometeorological Prediction Center
Overview
The Hydrometeorological Prediction Center (HPC) of NCEP provides forecast, guidance,and analysis products and services to support the daily public forecasting activities of the NWSand its customers, and provides tailored support to other government agencies in emergency andspecial situations. HPC supports TPC whenever tropical cyclones move west of 60 degrees westlongitude by forecasting tropical cyclone position before each hurricane coordination conferencecall. Because quantitative precipitation forecasts (QPF) are major focuses of its responsibilities,HPC provides expected QPF for inclusion in the TPC public advisories. HPC is also a routineparticipant in the HLT briefings to FEMA senior staff and senior state emergency managementofficials. HPC assumes responsibility for issuance of public advisories for tropical systems oncethey make landfall and are downgraded below tropical storm strength or become extra-tropical.HPC is also the emergency backup office for TPC should they become incapable of fulfillingtheir mission.
Before the Event
Hurricane Isabel made landfall on September 18. For more than a week before that time,the HPC assisted the TPC by providing guidance forecasts of the position of the storm for sevendays into the future. As Isabel approached land, HPC issued QPFs for the storm. For the threedays before until one day after landfall as a part of its HLT functions, HPC also supported FEMAand state EMs by delivering twice daily, live televised briefings on the expected precipitation
12
from Isabel. One of these briefings was attended by Department of Homeland Security SecretaryThomas Ridge and many were attended by White House staff.
Pre-landfall planning by HPC managers provided for additional coverage by the managersto handle phone, media and HLT duties. Contingency planning for housing forecast staff nearbyin a hotel, as well as the in-house provision of extra food and water were completed althoughthey were not used.
During the Event
Before and during Isabel, HPC coordinated extensively with affected WFOs and RFCs,especially on predicted precipitation amounts. HPC QPFs served as a starting point for the RFCforecasts and were modified as needed by the RFC staff based on RFC expertise and up-to-the-minute information and observations in the RFC’s area of responsibility. WFOs also use HPCQPFs and during Isabel frequently contacted HPC to collaborate on these QPFs. Telephone callsand 12Planet chat room, an instant messaging service, coordination /collaboration were used.
HPC provided many media interviews and hosted Fox Channel 5 (Washington, D.C.) for3-4 hours the two mornings before landfall by providing live interviews and background shots.HPC also prepared graphics several times for special briefings to White House staff and thePresident. Some of these activities were accomplished while the Federal Government in theWashington area was shut down because of the storm.
A comparison of HPC QPF issued early September 18 with the analysis of observedrainfall shows HPC’s QPF of 6 inches was very close to the observed band of 3-6 inch
rainfall, extending from northeastern North Carolina northwest into central Virginia. Within thatband HPC predicted a core of greater than 7 inches.
HPC forecasts were very close to observed in the core of the track from North Carolinathrough Virginia, but with a high bias developing from northern Virginia through West Virginiaand Pennsylvania. The forecasts included a larger area of QPF greater than five inches thanactually occurred. In particular, the QPF for portions of southeastern West Virginia and westernPennsylvania was high. Overall, the precipitation forecasts from HPC were excellent and were amajor reason HPC set a number of records for precipitation forecasting skill in September 2003.
C. Ocean Prediction Center
Overview
The Ocean Prediction Center (OPC) of NCEP provides warnings, forecasts, and analysesof the marine atmosphere and upper ocean for the North Atlantic and North Pacific Oceansextending from the east coast of the U.S. to the west coast of Europe and Africa and from thewest coast of the U.S. to the east coast of Asia. OPC products are distributed in real-timethrough the U.S. Coast Guard radio broadcast facilities, the World Meteorological Organization

13
Global Telecommunication System, the Inmarsat marine communications satellite system, andthe, among others.
A critical function of the OPC is to provide mariners with forecasts of wind and seaconditions, particularly marine warnings of gale, storm, and hurricane force winds, in theoffshore and high-seas areas. OPC works closely with the TPC and WFOs to coordinate suchinformation. In the case of Isabel, the OPC predicted extremely high waves (40 to 55 ft) up to 48hours in advance for the offshore waters. OPC was the first office of the NWS to note theseextreme conditions and informed the affected WFOs. The conditions were subsequently verifiedby buoys and other instruments. These high seas set the stage for the storm surge and floodingalong the coast and in the bays and estuaries.
OPC’s Marine Weather Discussion (MWD) was updated more frequently than the usualfour times per day. The MWDs and OPC’s three-hourly sea state analyses provided guidance tothe WFOs and marine community as to the expected evolution of the extreme conditions up tofive days in advance. The WFOs, using 12Planet chat and special OPC-initiated telephoneconferences, collaborated with OPC to develop the appropriate coastal, offshore, and high seasforecasts. As a result, maritime interests were well prepared for Isabel and were able to takeavoidance measures.
D. WFO Newport, North Carolina
Overview
Hurricane Isabel was well forecast by the TPC days before landfall on the outer banks ofNorth Carolina. Interviews with customers and partners show the WFO performed well duringthe event. The staff was already well prepared through prior Warning Event Simulator (WES)training, excellent guide material, and experience from previous tropical cyclones. Coordinationbetween the office and community was close and frequent. The quality of the NHC forecasts andlocalized, accurate surge forecasts enabled WFO Newport to provide emergency managers andcustomers and partners with excellent guidance about impacts from Isabel, allowing for theproper deployment of emergency assets.
Before the Event
Hazardous Weather Outlooks, Area Forecast Discussions, and Marine Forecasts from WFONewport began indicating a threat from Isabel to eastern North Carolina several days beforeSeptember 18, the day of eventual landfall. A Flood Potential Statement was issued Tuesday,September 16, which highlighted flash flooding as a significant threat. Discussions withemergency managers showed they also used the five day forecasts from NHC for planningpurposes, and found the forecasts accurate and useful, using them as planning tools several daysbefore the event.

14
Management at the WFO began planning to ensure the office was prepared for a potentiallandfall a full week before the event. The MIC worked with the office Union Steward toprepare a contingency work schedule to ensure all shifts would be adequately staffed.Management canceled travel to ensure sufficient staffing would be available during the event.Extra staff was made available through Eastern Region Headquarters (ERH), including a formerWCM at the WFO. WFO Newport staff said having someone in the office already familiar withthe area and office operations was a tremendous help before, during, and after the event. ERHalso made extra electronics technicians available (Best Practices 2 and 3).
During the Event
Outer bands from Hurricane Isabel began to affect the Outer Banks of WFO Newport’sCWA during the evening of Wednesday, September 17. The weather gradually deterioratedthrough the morning hours of Thursday, September 18. The eye of Hurricane Isabel madelandfall in the early afternoon between Cape Lookout and Ocracoke Inlet, and moved northnorthwest across the northeastern part of the Newport CWA.
The highest storm surges of 6 to 10 feet NGVD 1929 occurred across the lower reaches ofthe Neuse and Pamlico Rivers, with a 10 foot storm tide along the lower Neuse River being thehighest surge recorded (Figure 2). This surge caused significant flooding over parts of Craven,Carteret, Beaufort, and Dare counties. The surge moved rapidly up the Neuse, Pamlico and Tarrivers. Emergency managers reported many eyewitness accounts of high velocity, waist deepwater moving homes, trailers and other object many yards inland. As the water retreated, theseobjects were then dragged back towards the sound.
Along the Outer Banks, storm surges of 6 to 8 feet, with battering waves of 15 to 25 feet,caused major surge damage and beach erosion, particularly in Kill Devil Hills, Buxton,Rodanthe, Hatteras Village, and Ocracoke. The Kill Devil Hills area experienced severe roadand building damage. South of Kill Devil Hills, it was apparent in many locations the wavessurged through cuts in the sand berms and washed sand across Highway 12 from Nags Head toHatteras. Sand layering was also extensive near Rodanthe. A new inlet was carved just south ofFrisco cutting off Hatteras Village. Three Hatteras Village homes were washed out to sea nearthe new inlet. Two families who did not evacuate were nearly swept out to sea when their homewas destroyed. Local rescue was unable to reach them; however, they were ultimately able toreach safety. The new inlet destroyed all utility connections to Hatteras Island, isolating theresidents there.

15
A large part of the damage from Hurricane Isabel in the WFO Newport CWA occurred in theOuter Banks. Isabel’s rapid movement caused only minor freshwater flooding at the height of thestorm in a few counties and no significant damage was reported. No tornadoes were reported inthe CWA. No direct fatalities occurred, with one indirect fatality occurring after the storm.Many rescues were performed, however, by emergency personnel due to people who had notevacuated and had become trapped by storm surge flooding.
WFO Products and Services
WFO Newport’s products and services were timely, accurate, and met their customers’needs. The office was well staffed during the event. At the height of the storm, all but three staffmembers were present. Discussions with the staff suggested operations went smoothly duringthe event.
HLSs were well written, and highlighted the danger posed by Hurricane Isabel. InitialHLSs gave general forecasts of conditions, but as landfall approached and a Hurricane Warning
Figure 2. Storm Tide graphic from WFO Newport’s web site. Tide listed in feet above MSL.

16
was issued by TPC, the statements focused on impacts for specific areas. This was particularlytrue of the storm surge forecast, which gave surge forecasts targeted to local areas 24 hoursbefore landfall. For example, the HLS from 5:50 p.m. EDT Wednesday, September 17, stated:
“As northeast winds increase tonight and Thursday, water levels along the Neuse andPamlico Rivers will begin to rise. Water levels could rise to 8 to 10 feet above normal,especially near New Bern, Washington, eastern Pamlico County, and downeastCarteret County along the Neuse. Storm surges on the Outer Banks are expected to bearound 6 to 8 feet on Thursday. Storm surge in Onslow County…and in CarteretCounty west of Cape Lookout is expected to be in the 2 to 4 foot range. Storm surgeson the Albemarle Sound are expected to 3 to 5 feet along the southern shore of thesound from Tyrrell County eastward. Storm surges over the western Albemarle Soundare expected to reach 5 to 7 feet, with tidal flooding expected in the lower reachesof the Roanoke River.”
The HLS also highlighted the potential for battering waves of 10 to 15 feet with major beacherosion along the Outer Banks. Responses from EMs and media showed that this specific surgeinformation was accurate and very useful.
Hazardous Weather Outlooks (HWO) were issued daily in the early morning hours. HWOsissued early in the week discussed the possibility of Isabel affecting the area later in the week.The HWO products issued the day before landfall and on the day of landfall gave a briefoverview of valid watches and warnings, discussed the threat of tornadoes, and on the day oflandfall stated, “Hurricane conditions will be seen over eastern North Carolina through thisevening.” The HWO was not updated for any changes in watches or warnings and referred theusers to the HLS product for more detailed information.
Updates were provided through the event with frequent Short Term Forecast (NOW)products. Nineteen NOW products were issued in a 24-hour period from 6 p.m. EDTWednesday, September 17 through 6 p.m. EDT Thursday, September 18. The NOWs were wellwritten and described the hazardous weather conditions affecting the region. In particular, for thetime when the eye of the hurricane was passing over the region, the NOWs issued gave detailedforecasts of expected wind speeds and rainfall amounts. They also gave detailed, easilyunderstandable forecasts of the areas that would be affected by the eye of the storm, and advisednot to venture out when the eye was overhead.
All of the EMs interviewed by the team stated the WFO has a very effective outreach andpreparedness program. The WFO conducted many hurricane outreach talks and seminars beforeand during hurricane season. This included their annual Emergency Manager/Media day whichwas held in conjunction with Hurricane Awareness Week in late May.
Eight of the 13 counties in the WFO area of responsibility were StormReady. The EM fromPamlico County stated the StormReady process had paid off in this event by ensuring all of their

17
public facilities had NOAA Weather Radios, something that likely would not have happenedwithout the StormReady process.
Systems and Equipment
Three of the Automated Surface Observing Systems (ASOS) in Newport’s area (Hatteras,New Bern, and Beaufort) failed during the height of the storm and all three were due to loss ofpower. The staff used reports from spotters to supplement the missing ASOS data, but the ASOSfailures were problematic. One staff member said, “ASOS going out was a problem, but ithappens every storm.” He also commented the HLS and NOW products could have been betterif they would have had the ASOS observational data.
NOAA Weather Radio performed well during this event. WFO Newport uses the new VoiceImprovement Processor (VIP) voices for all products except the HLS, which is broadcastmanually. No problems with VIP or the Console Replacement System (CRS) were noted. TheWFO staff routinely monitors the broadcast during hurricane events to ensure the broadcast cycleis as short as possible, and does reduce the length of routine products to focus on critical
Picture 1. Looking south toward Hatteras Village at the new channel cut by Isabel. Photo taken byassessment team members Joel Lanier and Alan Gerard on October 1, 2003.
18
information. One NOAA Weather Radio (NWR) site failed during the event. The Mamie, NC,site failed due to a loss of commercial power followed by a failure of the site generator, which ismaintained by a contractor.
The staff reported the Advanced Weather Interactive Processing System (AWIPS) performedwell and no problems were noted. No issues with the Graphical Forecast Editor (GFE) or theInteractive Forecast Preparation System (IFPS) of the AWIPS were reported, and in fact, severalstaff members commented they found using GFE during the event was easier than they hadanticipated.
Some staff members reported some problems with the Watch, Warning, and Advisory(WWA) software package. WFO Newport had just upgraded to Operational Build 2 (OB2) ofAWIPS, which resulted in several changes to the operations of the WWA software. Severalproblems with WWA in this build had already been identified, and some of these did cause issuesfor the staff, including the inability to edit Call-to-Action statements and the inability to test aproduct without sending it out. One staff member stated he had little time to become familiarwith the software before the event. However, none of the WWA issues caused significant delaysin product issuance or any major operational problems.
WFO Newport used the tropical weather checklist for the Weather Surveillance Radar -1988Doppler (WSR-88D) prepared by the WFO in Melbourne, FL. This list is also recommended bythe Radar Operations Center.
Feedback from Customers and Partners
Emergency managers and coordinators praised the performance of WFO Newport. StanleyKite, Emergency Manager of Craven County, North Carolina, estimated he had talked to between1,200 and 1,500 people whose homes had been damaged by storm surge flooding, and, “only oneperson,” felt inadequately warned of the magnitude of surge and wind.
All of the emergency managers stated the office was always available to provide briefingsand information, and the information provided was timely and accurate. Several praised WFONewport for calling them to provide briefings, and to ask if there was any emergencymanagement information the EMs would like disseminated through the office HLS product. Theemergency managers stated the ability to disseminate critical community information through theHLS was very beneficial to their operations.
The North Carolina state emergency management holds a conference call three times a dayduring a hurricane event, with the WFOs servicing eastern North Carolina (Newport, Raleigh,Wakefield, and Wilmington) and all impacted local EMs participating. The local EMs all spokevery highly of the effectiveness of this call, and praised not only the Newport WFO, but all of theparticipating WFOs, for their briefings during this call (Best Practice 4).
WFO Newport has developed a password protected Emergency Management briefing page,on which they routinely post graphics detailing the threats from a tropical cyclone, including thehurricane track, severe weather potential, flooding potential, and storm surge. The EMs

19
interviewed all stated they use this page extensively, and found it to be of tremendous help duringtheir operations. “It is a very useful tool, and we commend them for it,” said Dare CountyEmergency Manager Sandy Sanderson (Best Practice 5).
WFO Newport uses this website to post graphics for emergency management. About 24hours before landfall, NHC provided the WFO a deterministic Sea, Lake, and Overland Surgesfrom Hurricanes (SLOSH) storm surge forecast based on the actual forecast track of Isabel. TheWFO posted this graphic on the password-protected EM page, and briefed each emergencymanager on the graphic and its potential uncertainty. Several EMs stated this SLOSH forecastgraphic was of tremendous benefit during the event. Stanley Kite, Emergency Manager ofCraven County, North Carolina, stated this SLOSH forecast confirmed earlier forecasts of a 10foot surge into a part of his county which does not typically experience heavy surge, giving himthe confidence to move “swift water” rescue equipment into that part of the county the nightbefore landfall. This equipment was then instrumental in performing several rescues duringlandfall. The EMs also stated even though the forecast surge from a deterministic SLOSH runwould obviously have significant uncertainty due to possible errors in forecast track.
Several emergency managers also stated the WFO does an excellent job of applying theirlocal knowledge of the area to give accurate forecasts of surge and wind for specific locales. TheEMs (and some media) stated WFO Newport gave surge estimates for individual streams andother specific locations, which the EMs found very beneficial to their operations. Tim Harvey,Assistant Emergency Manager for Craven County said, “They have the local knowledge, andthey put the local spin on things.”
Media perception of the performance of WFO Newport was very favorable. A radio stationand two television stations were contacted and each spoke positively of the WFO. Skip Waters,Chief Meteorologist for WCTI-TV in New Bern stated, “In my 27 years of television, I don’tknow if there’s a better office anywhere. They do a great job.” He stated the localized stormsurge forecasts provided by the WFO were particularly useful, citing historical data whichshowed surge in New Bern of 8 to10 feet was possible, but the WFO forecast of a lower 6 footsurge was right on target and helped reassure residents in that area. Mr. Waters uses the HLSextensively, and his staff, “waits by the printer,” to get the latest HLS. He felt the WFO providedfrequent updates of surge and rainfall forecasts, and that the information was, “right on.”
Mr. Waters expressed concern over the timing of advisory releases from the NHC. He statedadvisories are issued too late to be of value for certain newscasts, particularly the 5 p.m. and 11p.m. broadcasts. He felt an additional problem was the WFO had to wait for the new advisoriesto create their HLS, which meant the HLS was often too late to be used for these newscasts.
WFO Newport broadcast the advisories which initiated the Hurricane Watch and HurricaneWarning for Isabel with tone alert and SAME coding. The WFO has three Local Primary-1(LP1) radio stations for the Emergency Alert System in its CWA, with three corresponding Local

20
Primary-2 (LP2) backup stations. Contacting the LP1 and LP2 stations to ensure the advisoriesfor Hurricane Watches and Hurricane Warnings are broadcast with EAS activation is part of theWFO’s Hurricane Watch/Warning checklist.
The checklist for Isabel’s Hurricane Warning showed the WFO was unable to reach the LP1or LP2 station for Onslow County, and the warning was not broadcast by either station with EASactivation. The warning was not issued until 11 p.m. EDT on September 16, and by that time ofnight both stations were either closed or very sparsely staffed, making it difficult to contact them.This was not a significant problem since Onslow County did not receive much impact fromIsabel. However, the hurricane warning checklist also suggested difficulty reaching other LP1stations due to the late hour, forcing the delay on another LP1 of the EAS activation until the 5a.m. EDT advisory. The issuance of the warning so late at night could have caused other EASactivation problems since eastern North Carolina is predominately rural and many radio stationsdo not operate 24 hours. Some EMs said the issuance of the warning late at night causedproblems with their operations, and one stated there were several EMs on the 6 p.m. NorthCarolina EM conference call on September 17, who voiced concern the warning had not beenissued at 5 p.m. EDT.
Other Issues
Interviews with the forecasters who worked this event showed significant problems withthe timing of the gridded wind fields issued by NHC. Because these wind fields are issued fromthe Tropical Cyclone Marine Advisory, they are often not available until after the advisory timesof 5 p.m., 11 p.m., 5 a.m., and 11 a.m. EDT. This can be a problem, particularly for the 5 a.m.and 5 p.m. advisories. The main daily text products, (e.g., Zone Forecasts) generated from thegridded fields, are issued about 1 to 2 hours before these times, and the main grid editing iscompleted just before issuance of the text products.
Forecasters were confused about how to handle this situation. Editing the wind fields is atime-consuming process, and editing them again when the NHC advisory is issued is inefficient.Forecasters were also unsure of processes involving the text and graphical products issued fromthese grids. They were concerned if they issued the products at their regular time, and then hadto update them to account for the new wind grids just an hour or two later, customers andpartners could become confused. They also feared delaying the release of the text productswould cause problems for the media and emergency managers. To avoid this potential problem,WFOs should educate their customers and partners of the possibility of a delay in some productsduring a tropical cyclone event.
Interviews with the public and emergency managers showed many people base theirpreparedness decisions for a hurricane threat on “reference storms” i.e., how they were impactedby a previous tropical storm or hurricane of similar track and intensity. For example:
• In the community of Swan Quarter, significant storm surge flooding affected many homesand businesses. A few people in this community indicated they were completely taken bysurprise by the amount of water that came into town, and water was observed in places

21
where it had never been. The County Manager for Hyde County (Swan Quarter is thecounty seat) and the North Carolina Emergency Management Area Coordinator responsiblefor the area stated WFO Newport had told them to prepare for a surge about 2 feet higherthan the surge which accompanied Hurricane Floyd in 1999. This forecast was close to theobserved surge in Isabel. However, some people unfortunately did not prepare for such astorm surge since none that high had ever been observed.
• Mike Adderton, the EM for Carteret County indicated the people living along Cores Soundwere surprised by the amount of water they received from surge flooding. He said theproblem was these people had not been flooded by Hurricane Dennis in 1999, so they feltthey would not be flooded by Isabel, a storm of similar intensity and track. The EM statedhe felt the NWS forecasts of surge were right on target, and the people in the area had beenwarned adequately. He said, “We had told everyone in the low lying areas that there wouldbe 6 feet of water, and that’s what happened. The information we received (from the NWS)was right on, but these people just would not move.”
While the WFO did not state in any products, reviewed by the team, Isabel would havesimilar impacts to a particular storm, interviews with WFO personnel revealed the WFO is oftenasked to provide “reference storms.” From interviews with the WFO, public and EMs, while a“reference storm” can clearly provide the benefit of helping the public understand the potentialimpact from an impending storm, it can also give people who survived a given “reference storm”without any problems a false sense of security. No two tropical systems are identical. One EMstated he would prefer no references to previous storms.
The WFO worked very quickly after the event to conduct detailed damage assessments.This information was placed on the office’s Internet site. Feedback from partners and customersindicate this post-storm page is a tremendous resource for the community. The EmergencyManager for Carteret County sent an e-mail to the MIC regarding the site stating, “The Isabelsummary on your web page is fantastic and will be referred to many, many times over the nextfew weeks.” (Best Practice 6).
22
E. WFO Wakefield, Virginia
Overview
Over the inland areas of WFO Wakefield’s CWA, winds from Isabel produced areas ofdamage more characteristic of microbursts associated with severe thunderstorms. In southeastVirginia and northeast North Carolina, the character of the wind damage was far more severe andwidespread. In parts of Perquimans, Chowan, Pasquotank, Hertford, and Camden counties(North Carolina), scores of trees were completely uprooted and often snapped in half. Nearly 60percent of all homes and business in Chowan County, North Carolina suffered some structuraldamage due to wind, many of which were the result of large falling trees.
One of the highest storm surges on record for the Chesapeake Bay region of Virginiaaccompanied Isabel. WFO Wakefield referenced the 1933 hurricane storm surges and waterelevations as a historical comparison. In this case, emergency managers, local decision makers,and the public in coastal flood prone areas said the reference helped them prepare for potentialimpacts. Storm surges of 3 to 5 feet occurred along the Atlantic Coast resulting in significanterosion and structural damage to homes and roadways. Hardest hit areas included the JamesRiver estuary, where a surge of 8 feet occurred as far upstream as the Richmond Locks, 103 rivermiles from its confluence with the lower Chesapeake Bay. Many homes were significantlydamaged or destroyed, especially in the towns of Claremont, Sunken Meadow and Burwells Bay.The surges in several tidal rivers caught some residents by surprise, both in height and severity.
A similar situation occurred along the northern shore of the Albemarle Sound in NorthCarolina, where a 3 to 5-foot surge impacted the eastern portion, and a 5 to 8-foot surgeinundated the western portion. Some of the most significant storm surge flooding on the soundoccurred on the western shore of the Chowan River estuary where it meets Albemarle Sound, justwest of Edenton. A small cluster of four homes occupied year-round were completely destroyedby the surge, two of which were moved up to 20 feet off their concrete block foundations.
Isabel produced localized heavy rainfall with 5 to 10 inches of rain falling across theWakefield CWA resulting in widespread river flooding. The James River at Richmond Locksexperienced two separate flood crests; one late Thursday evening associated with the stormsurge, and the second crest two days later associated with runoff from the heavy rainfall in theheadwater region of the James River Basin.
The Wakefield staff was well trained and ready for Isabel. Products and services providedby WFO Wakefield were rated outstanding by many customers. This included emergencymanagers, state and local officials, the media, and local residents. The MIC of WFO Wakefieldrelayed a compliment from Senator George Allen of Virginia, “We also emphasized [to VirginiaSenator George Allen] the number of coordination calls we had with emergency managers.Senator Allen told us he talked to many local Virginia citizens and everyone had praise for thejob that the NWS did. People were prepared and lives were saved because of our work.”

23
Every member of the WFO Wakefield experienced some tree damage on their personalproperty and all of them lost power, some for as long as eight days. Three members commutingto work during the early afternoon on Thursday were unable to make it to the office due to windsdowning large trees and blocking every major roadway leading to the office. One forecaster wasable to return home, while some employees were turned away by police. They took up refuge ata Red Cross storm shelter which had been established at one of the local elementary schools.Ten staff members were in the office more than 24 hours since no relieving staff could commuteto the office due to fallen trees. The office ran on backup power for six days.
The staff at WFO Wakefield commended the TPC for outstanding track forecasts throughoutthe duration of the event. ERH was very helpful through its Regional Operation Center (ROC)pre-coordination calls and made extra personnel available (Best Practice 2). ERH was proactivein reassigning normal service backup responsibilities away from Wakefield (to WFO Charleston,WV) when WFO Blacksburg lost communications during the storm (Best Practice 7).
Some residents across the region, whether inland or along the coast, simply could not relateto the impending strength of the storm and potential for damage. Some coastal residents failed toevacuate, or did so at the last minute. Others across the interior were stunned by the magnitudeof the devastation to the trees and power infrastructure.
Home generators are becoming more available and it appeared new owners used themduring and after Isabel with little knowledge of safety rules and appropriate ventilation. Three ofthe 34 indirectly related storm deaths in Virginia were caused by improper ventilation of homegenerators resulting in carbon monoxide poisoning. From the final report of the Commonwealthof Virginia’s service assessment team:
In some areas no power meant contaminated water, loss of most formsof communications, activation of emergency back-up systems, and a rush topurchase generators, batteries, and portable radios. Despite warning labelsand in some cases, information flyers sometimes distributed at the point of sale,people did not always follow safety precautions. Ignorance about the inherentdangers of generators and carbon monoxide poisoning contributed to three ofthe 34 (Virginia) hurricane-related deaths.

24
Fact - Home generators are becoming more easily available and affordable. The threat to lifefrom carbon monoxide poisoning due to improperly ventilated generators is increasingproportionally. At least three people died of carbon monoxide poisoning in Virginia alone duringHurricane Isabel.
Finding # 2 -While carbon monoxide poisoning is considered by the NWS an indirect threatto life from the storm, a “call to action” statement for carbon monoxide poisoning includedin NWS products could help reduce the threat.
Recommendation # 2 - Regions should work with their WFOs to develop a “call to action”statement for carbon monoxide poisoning to be used whenever a threat of extended poweroutages exists (e.g., not only hurricanes but also ice storms). This statement should beincluded in NWS warning generating programs and outreach materials.Before the Event
Picture 2. A small cluster of four homes about 5 miles west of Edenton, NC, occupied year-round werecompletely destroyed by the surge, two of which were moved up to 20 feet off their concrete blockfoundations. (NWS Isabel Assessment Team photo by Dave Vallee.)

25
An HWO issued by WFO Wakefield early in the morning on September 14 first mentionedthe possibility of a threat from Hurricane Isabel. That afternoon, the WFO issued a PublicInformation Statement (PNS) containing hurricane preparedness information and a SpecialWeather Statement (SPS) highlighting increasing chances of Isabel affecting the area later in theweek.
Frequent coordination calls began early in the week with state and local officials, while theoffice continued to headline increasing chances of a direct impact from Isabel with HWOs andSPSs. The office enhanced river and small stream flooding awareness with the first of severalHydrologic Outlooks issued on the morning of September 16. Coordination extended to theSoutheast River Forecast Center during the day which was already running river model guidancewith basin average rainfall of 2 to 5 inches. These forecasts indicated the potential for moderateflooding along the Meherrin, Nottoway, and Blackwater rivers in southeast Virginia.
On September 17, the HWO stated, “An extremely large wind field will cause many trees tobe downed.” This statement was repeated in an HWO issued at 5:35 a.m. September 18. TheWFO was also vigilant concerning rip currents; HWOs issued before Isabel’s landfall highlightedthe risk of rip currents.
During the event
ERH has a policy to initiate a pre-coordination call 1 to 2 hours before the actual TPClead coordination call. This process allows the WFOs and TPC to coordinate watch/warningbreakpoints and track forecast reasoning before the full coordination call. This did not occur forthe initial issuance of the Hurricane Watch Tuesday morning September 16. Neither ERH nor theaffected offices were contacted by TPC before the 10 a.m. full coordination call during which thewatch issuance decision was made. Both ERH and WFO Wakefield believe that even a briefadvance notice of TPC’s intent would have given them more time to discuss the issue and offerany suggestions or concerns.
The TPC wind grids based on their updated 4 a.m. EDT Wednesday, September 17,conference call, were not available until after 5 a.m. This resulted in Wakefield holding textproducts and grid forecasts until 6:30 a.m. Wednesday morning. On Thursday morning, an earlysuite of forecasts was issued by 3:30 a.m. rather than hold the products through the conferencecall. Another suite of forecasts and grids were produced between 6:30 a.m. and 7 a.m. to reflectthe refined wind radii and timing of landfall (see Recommendation 1).
Most forecasters suggested six hourly TPC wind grids did not provide enough temporalresolution. NDFD requirements call for three hourly wind grids for all forecast offices. At sixhour intervals, the core of the hurricane was never physically present over the CWA. As a result,forecasters had to manually create a grid depicting the core of the hurricane for the periodsbetween the six hourly guidance grids. Future development work by NOAA’s Forecast SystemsLaboratory (FSL) in Boulder, CO, is expected to solve this problem.
As all WFOs are doing, WFO Wakefield produces text products from the forecast gridsusing the GFE formatters. In order to automatically insert headlines for watches and warnings

26
into the text products, a headline grid is created in GFE. WFO Wakefield found this method tobe very cumbersome. When multiple headlines are required in complex weather situations, thegrids became difficult to read. Due to small and complex county boundaries, some counties wereinadvertently included in some headlines and missed in others. It took a significant amount ofmanual intervention to ensure the proper locations had the appropriate headlines for variousevents.
The WSR-88D 8-bit reflectivity and velocity products were invaluable products for short-term analysis. These high resolution products clearly depicted very fine mesoscale features in thewind field and captured the reorganization of the eye wall as Isabel approached AlbemarleSound. The 8-bit product, when compared with the 16-level data product, was far superior inidentifying details in the wind field. Wind speeds near 133 mph were visible on velocityproducts at the 5,800 foot level, with speeds as high as 116 mph at the 1,800 foot level, 80 mphat the 1,000 foot level and 74 mph at the 300 foot level during the event. This informationenabled WFO Wakefield to issue highly detailed and urgent SPSs for parts of its service areaaddressing the imminent threat of high winds and the recommendation for residents to remain ina secure place.
Real-time deterministic SLOSH runs were beneficial in highlighting the most likely areas ofgreatest storm surge. SLOSH verified quite well along the eastern shore of the Chesapeake Bay,the Hampton Roads area, and over the lower portions of tidal rivers of Virginia and Maryland.SLOSH was also showing the potential for surges greater than 6 feet on the tidal reaches ofseveral rivers and on the west side of Albemarle Sound. The consensus in the Wakefield officewas that the deterministic SLOSH runs were beneficial.
WFO Products and Services
External customers believed WFO Wakefield was accurate and consistent in its forecasts.All said the forecasts matched the resulting magnitude of the event and there was no confusing orconflicting information between WFO Wakefield and adjacent offices or national centers. WFOWakefield issued 130 hazardous weather products of various types, including 43 FloodStatements and Warnings combined. The vast majority of the information contained in theproducts was considered excellent. For example, Jim Mathias, mayor of Ocean City, MD, stated,“Forecasting and information was excellent.” He added that the five-day forecast by TPC wasextremely helpful in his preparedness and awareness.
WFO Wakefield forecasters believe the potential for damage to trees and the resulting poweroutages could have been highlighted better. External customers, despite the consensus opinionthey received adequate strength and track forecasts, did not anticipate the breadth of tree damage,power loss, and high wind speeds so far inland. There was some inconsistency in the expectedtree damage and its effect on infrastructure provided by WFO Wakefield in its written products.A PNS issued on September 14, discussed the potential for strong winds inland with the phrase,“...strong winds...coastal and inland areas...” On September 16, a PNS contained the statement“assume power and water may be off for several days to several weeks after the hurricane

27
passes.” Unfortunately, the PNS was only coded for coastal counties. An Inland HurricaneWind Watch and an Inland Tropical Storm Wind Watch, issued at 6:40 a.m. September 17,contained the statement, “widespread power outages will be possible.” In an update to theproduct issued at 11:19 a.m., the following statement was included: “numerous trees andbranches may be blown down.” At 4:20 p.m., when an Inland Hurricane Wind Warning and anInland Tropical Storm Wind Warning were issued, the inland risk was downplayed, stating thatonly large branches, and small-to-medium sized rotting trees, would be downed by the winds ofthe storm.
WFO Wakefield also used WSR-88D storm relative wind products for the issuance ofTornado Warnings. The WFO issued three Tornado Warnings during the event, in effect for fourcounties. One warning did not have a follow-up SVS. The only tornado (F0) occurred in theCity of Norfolk outside the warning times.
Also, two county Flood Warnings were issued by WFO Wakefield. No Flood Statementswere issued as a follow-up to these warnings. NWS Directive 10-922, section 4.6.4a 7.2.2, statesthat one issuance criterion for Flood Statements is, “cancellation or expiration of a Flood Watchor Warning.”
River flooding at gaged sites was handled very well by WFO Wakefield. A total of 43 FloodWarnings and Flood Statements were issued for various river basins in the WFO WakefieldHydrologic Service Area (HSA) between 7:22 p.m. EDT September 18, and 4:43 a.m. EDTSeptember 25. These statements gave good detail on flood stages, flood intensity, crest stagesand times, and comparisons to past events.
Detailed PNSs were issued by WFO Wakefield at 8:50 p.m. and 11:20 p.m. September 19describing preliminary wind, rain, storm surge, and tornado information from the storm.Comprehensive Post-Storm Hurricane Reports (PSH) were issued by WFO Wakefield at 4:45p.m. September 22, 6:57 p.m. September 22, at 11:05 p.m. September 24, and 3:25 p.m.September 26.
Several storm surveys were completed in the aftermath of Hurricane Isabel. Following onestorm survey, at Claremont in Surry County, Virginia, the Wakefield MIC issued a detailed PNSon the findings of the survey. Members of the assessment team learned first-hand fromClaremont citizens of the value of this survey to work with FEMA and insurance agencies ondamage claims.
WFO Wakefield issued only nine Short Term Forecasts during the entire storm, all between8:21 a.m. and 2:01 p.m. September 18, and three SPSs between 3:31 p.m. and 4:44 p.m. as theeye moved into the Wakefield CWA (See Recommendation 8). The wind information containedin WFO Wakefield’s products, while general at the beginning of the event and through the watchphase, more precisely indicated the threat to life and property due to strong winds and longduration power outages in later statements.
28
WFO Wakefield staff was well prepared for the arrival of Hurricane Isabel. The officetraining plan routinely includes sessions addressing tropical cyclone forecasting issues. Duringthe spring of 2003, WFO Wakefield hosted a TPC Hurricane Specialist as one of its primarypresenters at an office meeting. WFO Wakefield routinely incorporates the WES to addressoperational forecast and warning issues concerning tropical cyclones. Over the past two years,this has included tornadoes associated with land falling tropical cyclones. WFO Wakefieldfrequently participates in pertinent VISIT teletraining sessions, which for 2003 included the FlashFlood Monitoring and Prediction System (FFMP). WFO Wakefield routinely conducts programdrills, which in 2003 included a spring severe weather drill and an August hurricane drill.Several forecasters commented that they used the hurricane drill as a ready reference throughoutHurricane Isabel.
WFO Wakefield is active in providing public presentations on hurricanes and severeweather. Their activities have included many public safety fairs directly addressing the hurricaneconcern. One such event, in Norfolk, VA, was conducted just one week before Hurricane Isabel.Likewise, the office has a well-developed Skywarn program and spotter network. Seminars areprovided frequently during the year and are well attended. The Wakefield office continues topursue StormReady communities, and has established one in Newport News, VA.
Systems and Equipment
NWR equipment at the office worked well during the event. Hazardous weather productswere disseminated using the proper tone alerts and EAS SAME codes. Instructions for issuinghazardous weather products via tone alerts and EAS SAME codes are mounted on the wall of theNWR broadcast room at WFO Wakefield. The Heathsville NWR went off the air during theheight of the storm, and it does not have a back-up power source. WFO Wakefield receivedcomplaints regarding the loss of the Heathsville transmitter during the hurricane. One personstated, “I purchased NWR hoping to rely on it, then it went down when it was needed the most.There should be back-up power at NWR sites.” The transmitter was still out of service sevendays after the event. This transmitter is located in a very remote area with poor security, thetower is in poor condition, and vandalism has occurred. The transmitter has corrodedcomponents, and relays and mounts for the antenna show signs of rusting and fatigue.
ERH and WFO Wakefield are working with the U.S. Navy to move the location of theHeathsville NWR to a better location just west of Reedville, VA. The Naval facility has a secure,sturdy tower with back-up power. The Reedville site, being closer to the Chesapeake Bay, wouldimprove NWR coverage for the Chesapeake Bay and the lower Delmarva Peninsula.
Fact - The Heathsville NWR site was not reliable. Many complaints about the site’s lack ofservice during Hurricane Isabel were received by NWS employees.

29
Finding # 3 - The Heathsville NWR site is quite important since it provides NWR coveragefor Chesapeake Bay shipping and the residents of east-central Virginia counties. It isimportant that this site be more reliable in its operation.
Recommendation # 3 - ERH and WFO Wakefield should acquire a new transmitter andwork with the U.S. Navy to ensure consistent, improved NWR services for east-centralVirginia.
Also, the NWR site at Mamie, NC located in Currituck County was out of service due to aloss of commercial power and the site back-up generator failed. This is a privately owned siteusing space leased from a TV station.
The cycle length on NWR during Isabel averaged 25 minutes due to lengthy products suchas HLSs. As a result, critical information important to customers was only broadcast twice anhour. The NWR Console Replacement System (CRS) offers limited ability for products to bebroadcast at only selected times.
Power to the ASOS and Automated Weather Observing System (AWOS) sites became asignificant issue. Sites in the southeast part of the Wakefield CWA failed late Thursday morningas winds began to reach sustained tropical storm force. By mid-afternoon on September 18, allbut three ASOS sites were down and remained out through the storm. This had a significantimpact on the office’s ability to determine what percentage of wind speeds shown on the 8-bitWSR-88D velocity products was making it to the ground in either sustained winds or gusts. TheASOS outages also affected the official climate record for several sites due to the inability todetermine maximum and minimum temperatures, precipitation, and highest sustained wind andgusts (Recommendation 11). Only the Norfolk site continued to provide reports, thanks to thededication of the contracted observers, who called in their observations at hourly intervals.Rainfall data for the storm was not collected by contract observers because that is not a currentrequirement in the agreement.
Only one third of the ASOS sites in the WFO Wakefield CWA have a 30 minuteuninterruptible power source (UPS) unit for short duration power outages. Once that 30 minuteperiod has passed, the site becomes inoperative. Three sites have no short duration UPS units atall, including Wallops Island, Hanover and Ocean City. Once power returned, service was notrestored because phone lines remained out. Power surges after the commercial power wasreestablished resulted in other component failures.
The Unit Control Position (UCP) connection from WFO Wakefield to the Dover, DE WSR-88D Radar was lost Thursday afternoon, September 18. The Dover WSR-88D data continued toflow but the WFO lost the ability to control the radar. The radar had been configured forhurricane operations in advance, so the loss of the connection had little impact on operations.

30
Feedback from Customers and Partners
In preparation for the event, conference calls were held twice daily between the VirginiaDepartment of Emergency Management (VDEM), 18 Virginia counties and communities, and theNWS. All believed the calls were very helpful. The information provided in the conference callswas considered timely and accurate overall. VDEM Director Michael Cline said, “Unless youwere deaf, dumb, and blind you had to know [what to expect].” Jim Mathias said, “Theforecasting and information was excellent.@ Members of the conference call interview alsopraised the consistency of the forecasts. Comparisons to the 1933 storm raised awarenessas well.
Despite the fact sufficient forecast information was provided, those interviewed found ithard to believe the impact of downed trees and lost power would be as significant well inland.One individual said, “The products were there and the information was in front of us, but we maynot have had as much belief and that is our fault.” VDEM strongly believes the wet antecedentconditions were a major factor to the wind blowing down so many trees.
The VDEM believed all NWS offices serving Virginia provided excellent support to thestate. VDEM stated NWS services provided for them are much better than 15 or 20 years ago.WFO Baltimore-Washington was not initially invited onto the Virginia conference calls becauseof the impact expected primarily in the WFO Wakefield CWA. Upon discovering that theconference calls were being held, representatives of WFO Baltimore-Washington were proactivein asking to be allowed to participate in the calls. VDEM considered the WFO’s informationvaluable.
The VDEM considers mean lower low water (MLLW) to be a very confusing term.Explanations of the term from the NWS had to be provided several times. Several employees ofVDEM frankly admit they still do not understand (See Recommendation 7).
The VDEM believes emergency services and the public of inland counties did not preparewell for Isabel, especially in areas from Richmond northward. VDEM stated, “Sufficient wordwent out,” but there was “some true disbelief at the local level.” VDEM is convinced a largerpercentage of the population was better prepared than during previous storms, partly due tocomparisons with the 1933 storm. Even so, the threat was perceived to be less far inland.
Wayne Robinson, of Dorchester County, Maryland, Emergency Management recalled astatement made in a conference call at 8:30 p.m. September 18, stating the worst of the rain andwind was over. Mr. Robinson felt this was misleading, since around 10 p.m. storm surgeinundated areas in the south part of Dorchester County, lasting until September 19.
The only tidal gauge near Dorchester County, Maryland, is on the north end of the county,near the community of Cambridge. The Chesapeake Bay narrows near the south end ofDorchester County, and the storm surge measured at Cambridge was not representative of thesurge in the south end of the county. WFO Wakefield staff members described how the

31
Cambridge readings and actual observations in the south part of Dorchester County could differby as much as 2 feet. Dorchester County is a growing area of southeast Maryland.
Fact - The tide gage at Cambridge, MD is unrepresentative of tide conditions for the southernshore of Dorchester County. EM officials in Dorchester County need better information for thesouthern shore in order to carry out their responsibilities.
Finding # 4 - The network of coastal water level monitoring stations was strategicallydesigned. Recent growth and development require continual adjustment of this networkand possibly the development and installation of additional monitoring stations or relatedstatistical schemes to describe conditions away from gaging locations.
Recommendation # 4 - NWS should study adequacy of tide gage monitoring sites anddevelop a priority list to implement new gages.
NWS Wakefield also participated in conference calls with emergency services officials fromDelaware, Maryland, and North Carolina. Several NWS Wakefield staff members participated inthese calls, primarily members of the NWS Wakefield management team (MIC, SOO, or WCM).Sometimes conference calls among different agencies were being held simultaneously and theNWS Wakefield staff ensured staff members were available to handle all calls efficiently.
Consensus of the television meteorologists was NWS Wakefield did a great job in itsforecast, and the, “information was great even as early as the Saturday before.” They believe themagnitude of the event matched the information received from the NWS.
The media believes forecasts and other information were disseminated with substantialadvance notice, giving the public plenty of preparation time. John Bernier from WRIC TV inRichmond, said, “TPC is on a hot streak,” and gave TPC a lot of credit for good forecasts notonly for Isabel, but for Fabian and Juan. Jim Duncan, of WWBT TV, also in Richmond said,“Everything was right on,@ and he remembered WFO Wakefield discussing significant treedamage in its statements as early as September 14.
All of the on-air meteorologists took the NWS information and portrayed the impendinghazards to their viewers. Jon Cash, of WAVY TV in Norfolk, said he advised viewers of thepotential for loss of power for days or weeks, with trees down, “all over.” Such information wasconveyed by NWS Wakefield in a PNS issued on September 16, “Assume power and water maybe off for several days to several weeks after the hurricane passes.” John Bernier told hisviewers, “Thursday may be the most arduous day of your life.” Bob Burnett-Curie, from WBOCTV in Salisbury, MD, felt WFO Wakefield sent out the appropriate message of a strong storm,but it would not be a superstorm. Mr. Burnett-Curie thought the public heeded messages, and inthe Salisbury area businesses closed down on time.

32
Mr. Burnett-Curie claimed the rainfall forecast was high. Reports showed rainfall amountsbetween 2 to 4 inches in the Salisbury area. Some of his weather spotters, along with reportsfrom Wallops Island, VA and Pocomoke, MD, reported rainfall totals under an inch. The NWSforecast rainfall was consistently between 6 and 10 inches in Flood Watches issued by WFOWakefield from September 17, through September 18.
Bob Burnett-Curie and Jon Cash believe the HLS product is too lengthy. Both suggested theupdates to HLSs should more effectively describe the changes being made. Mr. Cash pointed outthe difficulty in finding minor changes in an HLS. Despite WFO Wakefield issuing 14 LSRsbetween 10:15 a.m. and 11:57 p.m. September 18, Mr. Cash requested more current damageinformation in NWS products.
Bob Burnett-Curie contends that determining the tide when NWS offices use MLLW isdifficult, suggesting few people know what that term means. A term is needed which will simplyexplain how much water will occur (See recommendation 7).
WGH Radio is the LP1 station for EAS serving the Norfolk area. Station engineer KeithO’Malley stated the EAS worked well until the Norfolk/Driver NWR transmitter stoppedfunctioning. After the NWR stopped working, Mr. O’Malley coordinated with forecasters atWakefield and was told he would need to rely on the Internet to get copies of NWS products.Mr. O’Malley said his biggest concern was for tornadoes, and without the NWR functioning, hewas left, “hanging in the wind,” and, “out on their own.” The Wakefield office has explicit,detailed procedures in place to activate local EAS systems when NWRs are off the air (BestPractice 8). The procedures include a contact telephone number for WGH; text to give over thetelephone highlighting the weather emergency, providing authentication; and provisions tocontact the Virginia State Emergency Operations Center if NAWAS is also down. However, theprocedures are only to be used in case of Tornado or Flash Flood Warnings. The Wakefieldoffice did not issue any Tornado or Flash Flood Warnings after the Norfolk/Driver NWR stoppedworking.
F. WFO Baltimore/Washington
Isabel will be remembered in the Baltimore-Washington area for the very large field oftropical storm force winds which caused a great deal of tree damage, the extensive flash
flooding it caused in the Shenandoah Valley, and the unusually high storm surge in theChesapeake Bay and Potomac River Basin. Fallen trees and limbs were the overwhelmingreason for widespread power failures and damage and destruction to nearly 8,000 homes, whichwill likely make Isabel one of the most expensive storms in Virginia history. Four people losttheir lives in the WFO Baltimore-Washington area directly because of Hurricane Isabel(Appendix B).
Overall, WFO Baltimore-Washington did well in providing products and services tocustomers in its CWA. Through an excellent conference call infrastructure developed by the

33
Washington, D.C. Metropolitan Area Council of Governments, jurisdictions in the D.C. areareceived timely briefings from the WFO before and during the event. The National WarningCircuit (NAWAS) was used extensively for outlying cities and counties. The main topic ofconfusion pointed out by emergency managers was the reference height used in storm surgeforecasts (See Recommendation 7).
Although the information flow from the WFO to the media was good before Isabel, the flowof information decreased during the event. The Tropical Storm Warning was broadcast on NWRbut the product was not SAME coded with the 1050 MHz tone. This was not used becausespecific codes do not exist for Tropical Storm Warnings. Therefore, EAS was not activated forthis product.
WFO Baltimore-Washington’s response and service during Isabel were excellent. The teamreceived commendations from the public, emergency management and the broadcast media onWFO Baltimore/Washington’s performance. The forecasts, watches, and warnings for Isabelwere accurate, timely, and well done. WFO Baltimore-Washington advised customers five daysbefore landfall Hurricane Isabel could affect the region. Preparedness information was providedto customers four days before the event. Extra staff was provided to the WFO by ERH and WSHfrom Wednesday, September 18 through Friday, September 19 (Best Practice 2). Extensivecoordination via telephone, NAWAS, and in-person briefings took place before and during theevent between WFO Baltimore-Washington and emergency managers in its CWA (Best Practice9). The workload on the WFO staff was huge, especially conducting more than 500 briefings andcalls. Richard McKoy, Emergency Manager for the City of Baltimore, stated his office spokewith WFO Baltimore-Washington several times via NAWAS. He was satisfied with NWSservices. He specifically singled out the Baltimore-Washington WCM as providing excellentservice to the EM community. He did note that storm surge height was under-forecast but he saidthey had ample advance notice to plan for the event.
Before the Event
Several conference calls were held with the Metropolitan Washington Council ofGovernments Tuesday and Wednesday, September 16 and 17. A conference call Wednesdayresulted in a decision by the Metropolitan Transit Authority to stop running buses and light rail at11 a.m. Thursday, September 18. Based on this decision, regional schools cancelled classes forThursday and the Federal Government’s Office of Personnel Management closed federalbuildings on Thursday. Washington’s Reagan National and Dulles International Airports plannedfor Isabel impacts to begin Thursday afternoon. Airlines moved aircraft and personnel out of thearea to lessen impact on their operations. Local governments and jurisdictions planned for stormsurge impact along Chesapeake Bay Thursday night. Fairfax County advised residents along thePotomac River that flooding could result in evacuations Thursday night.
ERH assigned extra personnel from other offices to the Baltimore-Washington WFO fromTuesday, September, 16 through Friday, September 19 (Best Practice 2). WFO MIC JamesTravers also requested assistance from nearby NWSH. Several volunteers from NWSH andNOAA Public Affairs helped the WFO with media interviews Wednesday and Thursday.

34
During the Event
Rain and wind increased over the southern portion of the CWA Thursday morning. Thisspread into the Washington metropolitan area at mid afternoon and into the Baltimore area bylate afternoon. Peak wind gusts during the event ranged from 48 mph at Dulles InternationalAirport to 78 mph at Quantico Marine Corps Air Base. The MIC estimated thousands of treeswere blown down across the Baltimore-Washington CWA. More than 700 trees were destroyedin the District of Columbia alone. Due to the massive tree fall, commercial power was lost tomost of the region overnight Thursday and remained out of service in many locations for severaldays. More than 2 million customers were without electricity in the Baltimore-Washington CWAbecause of Isabel. Although storm-caused tree damage is a common problem in Baltimore-Washington CWA, tree falls likely increased with Isabel due to wet antecedent conditions acrossthe region. Precipitation in the Baltimore-Washington CWA was 10 to 20 inches above normalbefore Isabel.
WFO Products and Services
The first product mentioning a threat from Hurricane Isabel was the HWO issued onThursday, September 10, 2003, a full week before Isabel made landfall in North Carolina. WFOBaltimore-Washington began their planning and response to Hurricane Isabel’s threat as early asSunday, September 14, with a PNS specifically advising residents of the CWA of HurricaneIsabel’s potential impacts. It also included specific actions for immediate preparation.
WFO Baltimore-Washington’s products before, during, and after the Hurricane Isabel werevery good overall. The products were well written, accurate, specific and contained valuableadvice to residents about winds, tides, rainfall, flood potential, and the possibility of isolatedtornadoes. Appropriate watches and warnings were composed and transmitted with appropriatelead times according to the Directives. HLSs were issued regularly. Based on opinions fromemergency management and the media, more emphasis and detail concerning storm surgeflooding were needed in the HLSs.
Rainfall forecasts contained in products from HPC, TPC, and the WFOs, were consistently 3to 6 inches in the Baltimore-Washington metro area and 6 to 10 inches with local amounts to 15inches possible elsewhere. These forecast amounts were well above flash flood guidance. TheWFO issued a Flash Flood Watch at 11 a.m. EDT Wednesday, September 17, from Thursdaynight through Friday night.
The most rainfall occurred in the Shenandoah Valley and the Blue Ridge Mountains where 4to more than 20 inches of rain were reported. The maximum 24-hour rainfall, 20.20 inches, inthe CWA was reported by an Integrated Flood Observing and Warning System (IFLOWS) gagingsite at Upper Sherando in Augusta County, Virginia. This gaging site is in the headwaters of theSouth River, which flows through the city of Waynesboro, VA. Reports in excess of 10 incheswere received from Devil’s Knob (10.70 inches) in Nelson County and Big Meadows (11.10inches) in Page County for the same 24-hour period. Rainfall across northern Virginia, Marylandand the District of Columbia was less, ranging from 1 to 3 inches and from 2 to over 6 inches in

35
eastern West Virginia. Extensive flash flooding accompanied the rainfall in eastern West Virginiaand the Shenandoah Valley of Virginia. WFO Baltimore-Washington issued Flash FloodWarnings for 28 counties and independent cities during Hurricane Isabel. Moderate to majormain stem river flooding occurred in the North Branch of the Potomac Basin, the South Branchof the Potomac Basin, the Shenandoah Basin, the main Potomac Basin, the Rapidan Basin, andthe Rappahannock Basin.
The WCM contacted officials and emergency managers for the City of Waynesboro and forAugusta County, and based on the report of 20.20 inches at Upper Sherando and a briefing by theWCM, over 100 people were successfully evacuated from the area.
The torrential rains in Augusta County caused flash floods on Back Creek, the St. Mary’sRiver, Mill Creek, and Coles Creek, all tributaries of the South River, which flows throughWaynesboro and north through the Shenandoah Valley. Extensive runoff in the high terraincaused flows over emergency spillways, including a stage of about 2.5 feet above the emergencyspillway at Mill Creek Dam which caused substantial damage to the dam. The water also causeda rapid rise to a crest near 13.9 feet between 4 and 5 a.m. EDT Friday, September 19, on theSouth River at Waynesboro, where the record flood is 15.3 feet. The flood caused 2 to 3 feet ofwater in downtown businesses in Waynesboro, where emergency management personnelevacuated about 300 people and about $250,000 damage was caused to public property. About200 FEMA claims had been filed as early as October 1, 2003, in Waynesboro due to the flooding.
The only forecast problem mentioned by VDEM was the Quantitative Precipitation Forecast(QPF) for parts of northern Virginia. Though the heaviest rain occurred in a small location at thehead of a valley, the VDEM reported that flash flooding picked up mobile homes and washed thebacks out of some houses. WFO Baltimore-Washington continued to mention the possibility ofup to 6 inches of rainfall after totals had exceeded 6 inches in some locations. Flood watcheswere in effect, but VDEM believes the NWS products could have raised the level of floodawareness sooner for areas with excessive rainfall.
Some WFO staff believes the QPF from HPC was conservative and this led to low riverforecasts on September 18. Since HPC issues QPF on a broad scale for the entire nation, it willnot necessarily capture small scale rainfall maxima. The WFO did request contingency riverforecasts with higher QPF amounts later that same day, but the official river forecasts issued fromthe WFO did not include the higher WFO QPF. Flood warnings using river forecasts containingQPF were also not issued.
The Middle Atlantic River Forecast Center (MARFC) main stem river forecasts for the WFOBaltimore-Washington HSA were low on Thursday, September 18, because the QPF includedwas low for the basins where the heaviest rain fell. The MARFC uses QPF from the HPCadjusted by the HAS unit as standard procedure for main stem river forecasts. MARFC willoften adjust QPF used in the main stem river forecasts based on coordination calls with WFOs inthe MARFC service area. QPF made by WFO forecasters in the GFE for the IFPS grids is notused by RFCs for use in their river forecasts, and therefore the coordination calls between the

36
WFOs and the RFCs remain necessary to ensure the appropriate amount of QPF is used by theRFC. The Service Hydrologist position must be a vital player in coordination of this type.
River forecasts issued by MARFC were included in Flood Warnings and Flood Statementsissued by WFO Baltimore-Washington and these were accurate, timely, and properly formatted.Coordination between MARFC and WFO Baltimore-Washington was not always accomplished,however, as the event progressed.
Issuance Issuance Office Forecast Crest Crest Date Crest Time Date Time
9/18 10:40 p.m. MARFC 15.0 9/19 8:00 p.m.9/19 2:54 a.m. WFO-BW 23.0 9/19 6:00 p.m.9/19 3:38 a.m. MARFC 19.1 9/19 3:00 p.m.9/19 9:24 a.m. MARFC 23.5 9/19 2:00 p.m.9/19 2:25 p.m. MARFC 23.9 9/19 8:00 p.m.
Table 4. Chronological listing of the products from the MARFC and the WFO for the Shenandoah Rivernear Lynwood, VA during the period 10:40 p.m. September 18 to 2:25 p.m. EDT, September 19.
Fact - WFO Baltimore-Washington updated the forecast for the South Fork of the ShenandoahRiver near Lynnwood without coordinating with MARFC. Thus, the forecast crest for Lynnwoodfrom MARFC differed from the forecast crest in the Flood Warning issued by WFO Baltimore-Washington from 2:54 a.m. EDT until 9:24 a.m. EDT Friday, September 19. NWS Directive 10-921 section 3.1.2 states that for large scale forecast points, WFOs must coordinate changes ordisagreements with the RFC forecast with the responsible RFC. In the event consensus cannotbe reached, the WFO must use the RFC values in the official forecast.
Fact - The crest forecast issued by WFO Baltimore-Washington at 2:54 a.m. EDT Friday,September 19 was more accurate than the crest forecast issued by MARFC at 3:38 a.m. EDTFriday, September 19.
Fact - There is no evidence that the inconsistency between the forecasts issued by WFOBaltimore-Washington and MARFC for the Lynnwood forecast point caused confusion orresulted in bad decisions by local emergency management agencies but it could have. Theinconsistency occurred late at night and early in the morning.
Fact - The WFO Baltimore-Washington Service Hydrologist position is part time, 24 hours perweek. Several WFO Baltimore-Washington employees, MARFC employees, and emergencymanagement personnel in Virginia interviewed believe a part time Service Hydrologist positionat WFO Baltimore-Washington hurts the program.

37
Finding # 5 - The WFO Baltimore-Washington Hydrologic Service Area contains complexterrain, including mountains, plains, valleys, and coastal effects across 3 states and theDistrict of Columbia, with a population of approximately 8 million people. Flash floodingis a very real threat in the mountains and valleys, not to mention main stem river forecastresponsibility and flooding potential. Coordination between WFO Baltimore-Washingtonand MARFC was not consistent during Isabel, and the team believes a part-time ServiceHydrologist is part of the problem. The WFO Baltimore-Washington HSA desperatelyneeds a dedicated full-time Service Hydrologist who can handle the training, coordination,field work, and technical responsibilities inherent with this position.
Recommendation # 5 - Eastern Region should maintain the Service Hydrologist position atWFO Baltimore-Washington equal to one full-time equivalent.
Storm surge late Thursday night and Friday morning in the Chesapeake Bay at BaltimoreandAnnapolis, MD reached the highest levels since a hurricane in August 1933. The peak waterlevel at Baltimore was 8.1 feet above NGVD at 8:06 a.m. EDT Friday, September 19 and atAnnapolis the water level peaked at 7.3 feet NGVD at 7:42 a.m. EDT Friday. At Washington,D.C., (Water Street headquarters of the police and fire harbor patrol) the Potomac River waterlevel peaked at 9.7 feet NGVD Friday morning around 4:42 a.m. EDT.
Flooding caused by Hurricane Isabel caused extensive damage at the Naval Academy inAnnapolis, MD (see picture 4 page 39). Half the classrooms were unusable. Lab
equipment, plumbing and ventilation systems were also damaged. Several buildings weresandbagged, but officials say they underestimated the storm. Some parts of campus werecovered by eight feet of water. Spokesman Rod Gibbons said the flood damage was,“unprecedented.”
Significant flooding occurred in the low-lying areas of Old Town Alexandria. Portions ofKing Street near the intersection of Union Street were under as much as 5 to 6 feet of water.
The area is about two blocks from the Potomac River. Sergeant Steve Carr with the city’s policedepartment called the amount of water, “very unusual.” One resident who has lived in the areafor 20 years said the situation was, “insane.” In northern Virginia, flooding was the worst everin the Belle View subdivision south of Alexandria in Fairfax County. Fairfax County emergencymanagement declared a mandatory evacuation of the Belle View neighborhood, but manyresidents chose to stay anyway.
Fairfax County’s Stormwater Planning Division (SPD) conducted town hall meetings forBelle View residents and distributed flyers concerning the expected flooding. Carl Bouchard,P.E., Fairfax County SPD, calculated storm surge levels to MSL rather than MLLW. He was thenable to map likely flood/evacuation areas based on their elevation maps. The county was thenable to pinpoint where action was needed. Mr. Bouchard suggested storm surge forecasts beconverted to shape (.shp) files so that they can be sent electronically to cities, counties and themedia for application to topographic and land use maps. The electronic data then could be

38
referenced to either MLLW or MSL. With the focus in the HLSs on rainfall and river floodingrather than storm surge flooding, there was some confusion on the part of local governments andcitizens during the event itself. When the storm surge began flooding Belle View and Old TownAlexandria, only 1.5 inches of rain had fallen thus far at Dulles International Airport. Again,HLSs and supporting statements need to emphasize the most important threat first.
Picture 3. Storm surge flooding in Baltimore’s Inner Harbor from Hurricane Isabel.Courtesy of Maryland Historical Trust Internet site.
WFO Baltimore-Washington forecasted the surge height to reach 9 feet MSL in these areasin advance of the storm causing the emergency manager to block the streets below 10 feet MSLin preparation for the storm. The water reached 9.5 feet MSL.
Reactions from residents varied considerably. One woman from the Belle ViewApartments said, “I evacuated after hearing about the storm surge on the evening news (TV).”Another resident did not evacuate stating, “When I went to bed, water was not over the road. Itdid not look as bad as Agnes (1972), so I didn’t think it would get that bad.” His home sustained3-4 feet of water from storm surge.

39
Picture 4. Storm surge flooding from Isabel at the U.S. Naval Academy in Annapolis, MD. Courtesy of U.S.Naval Academy Public Affairs.
In Baltimore, the most extensive flooding was at Fell’s Point and Inner Harbor, neardowntown. There, several feet of water inundated streets and alleys. The Police Headquarterswas flooded with damage to backup generators.
WFO Baltimore-Washington policy is to have HLS composition assigned by the Forecaster-In-Charge (FIC) on each shift. During the event, HLSs focused more on rainfall-driven inlandflooding at the expense of awareness of storm surge flooding. Little was added to storm surgeflooding detail over that issued by TPC. Veronica Johnson, local television meteorologist atWRC-TV, expressed a desire for more information for points along Chesapeake Bay so surgeflooding could be applied to specific communities. She said, “The Baltimore-Washington officedid well in preparing the media and everyone for the storm. However, the broadcast media couldhave used more frequent NWS info during the event as television was providing continuouscoverage (wall to wall). Also, storm surge info was not detailed enough to make it easy for the
40
media to apply the forecast to specific neighborhoods and communities along the Potomac andChesapeake Bay.” Several emergency managers expressed a desire for more accurate stormsurge forecasts and using mean sea level as the elevation on which to measure storm surges.Other aspects of the HLSs were well done and understood by emergency managers and media.Wind effects were well covered in Tropical Storm Inland Wind Watches and Warnings.
Fact - Substantial flooding from storm surge was experienced by residents and businesses inBaltimore, Annapolis, northern Virginia, and Washington, D.C., as well as along the coast of themouth of the Potomac River and the coast of Chesapeake Bay. While not record flooding, it wasthe highest storm surge since at least 1942.
Finding # 6 - The NWS/TPC has a responsibility to convey information about storm surgein advisories on tropical cyclones. That information is enhanced and expanded to the locallevel in WFO HLSs. The WFO Baltimore-Washington HLSs did include information aboutstorm surge along the Potomac River and Chesapeake Bay for Hurricane Isabel, but onlyin very broad and general terms. In fact, it was for the most part repeating the informationin the TPC advisory. The WFO did not include vital information about the expected timeof the maximum surge or specific information available from emergency managers aboutevacuations or areas that would likely experience the worst flooding.
Recommendation # 6 - WFOs affected by Isabel should use the high water markinformation from Isabel’s storm surge flooding in their CWAs to enhance knowledge andability to predict future storm surges. Future HLS issuances from WFOs should includespecific information concerning localized effects from storm surge including forecast timesof the maximum water level and potential effects. Information from emergency managerson voluntary or mandatory evacuations should also be included as available.
Fact - Interviews with media, and emergency management and storm water drainage personnelrevealed confusion over the exact height of the storm surge expected.
Finding # 7 - Emergency Managers, media and storm drainage personnel could use StormTide forecasts (a forecast of the total height of water expected) more effectively than stormsurge and normal tide forecasts.
\Recommendation # 7 - WFOs should highlight any Storm Tide forecasts in their tropicalcyclone products and emphasize the total height of water expected. Any Storm Tideforecasts should be referenced in NGVD 1929 since most storm surge maps are referencedin NGVD 1929.
Fact - Only seven short-term forecasts (NOWs) were issued by WFO Baltimore-Washingtonduring the Isabel event (from Wednesday, September 17, evening through Friday, September 19,noon). Nine NOWs were issued by WFO Wakefield during the Isabel event, and 19 NOWs wereissued by WFO Newport. Guidance on the issuance of NOWs varies widely from region to

41
region and even from WFO to WFO. Some WFOs embrace the NOW product whole-heartedlyand issue them frequently, while other WFOs have all but abandoned the product.
Finding # 8 - Interviews with emergency managers and media in both the Wakefield andBaltimore-Washington CWAs revealed a need for more real time information on short-term trends in the hurricane’s progress. Real-time damage reports, times of onset oftropical storm force winds, onset of gusts to hurricane force , heavier rainfall includingshort-term QPF, and convective trends are areas where NWS forecasters can provide muchneeded information and excel in service to our users.
Recommendation # 8 - The NWS should re-evaluate the short-term forecast (NOW)program and more uniform guidance should be provided to WFOs nationwide on how toissue short term forecasts during extreme events such as a hurricane. If NOWs are not thebest way to communicate short term forecast information in a timely manner, othermethods should be investigated (perhaps Special Weather Statements SPS and/orConvective Alerts).
WFO Baltimore-Washington has a hurricane drill each year. This year the drill was done inJune. The hurricane focal point for the WFO participated in a large regional tabletop hurricaneexercise presented by the State of Maryland in June.
WFO Baltimore-Washington has an “Adopt-A-County” program for its staff. Membersof the staff who participate in the program take responsibility to represent the WFO and NWS tothe emergency manager, media, school districts and other customers in the county adopted. Thisprogram has resulted in excellent relations between the WFO and emergency managers in theCWA and aided coordination between the WFO and affected counties during Isabel (BestPractice 10).
The WFO holds media workshops twice per year, once in the fall for winter weather andagain in the spring for summer weather. NWS products and services are reviewed with themedia at these workshops. The WFO also maintains a good Emergency Manager web page (BestPractice 5).
WFO Baltimore-Washington has more than 2,000 spotters in its CWA, as well as an activeamateur radio program. Two amateur radio volunteers staffed a voice/packet radio station in theWFO Thursday and Thursday night. Many helpful spotter reports were received during the eventvia telephone, amateur radio and e-mail.
There are four approved StormReady jurisdictions in the Baltimore-Washington CWA,Hartford County (MD), Alleghany County (MD), Fairfax County (VA), and the University ofMaryland.

42
Systems and Equipment
The initial Hurricane Watch issued at 11 p.m. EDT Tuesday, September 16, was 1050 Hztone alerted and coded for the Specific Alert Message Encoder (SAME) by WFO Baltimore-Washington as required. The Tropical Storm Warning was neither tone alerted (using 1050 Hz)nor coded for SAME. Neither the Inland Tropical Storm Wind Watch nor the Inland TropicalStorm Wind Warning were 1050 Hz tone alerted or coded for SAME. At the time, the onlyauthorized SAME codes for tropical cyclone watches and warnings were HUA and HUW forhurricane.
Fact - Appendix G of NWS Directive 10-1710, Use of NWR SAME Codes and 1050 Hz ToneAlarm, is required for Hurricane Watches and Warnings and optional for Hurricane LocalStatements, High Wind Watches, and High Wind Warnings.
Finding # 9 - New SAME codes have been authorized for NOAA Weather Radio and will bea welcome addition for the effective dissemination of NWS products. However, the newcodes will require Emergency Alert System stations to purchase compatible equipment fordecoding. While this equipment is not expensive (estimated less than $100), at present thepurchase of the new equipment is voluntary.
Recommendation # 9 - Because NOAA Weather Radio will truly become an all-hazardsradio with the ability to broadcast Amber alerts, terrorist threat information, and nuclearincident information as well as weather information, NOAA and the NWS should workwith the states’ emergency management agencies to promote the purchase of the newequipment by Local Primary 1 (LP1) and Local Primary 2 (LP2) stations.
The satellite version of the Emergency Managers’ Weather Information Network(EMWIN) failed from approximately 4 p.m. EDT Thursday, September 18, to 11:30 a.m.Monday, September 22, due to T1 data communications line failure between Suitland, MD andWallops Island, VA. The Internet version of EMWIN remained available, however, and EMWINusers were notified of this.
Fact - Four (Charlottesville, VA, Frostburg, MD, Hagerstown, MD, and Manassas, VA) of theseven NOAA Weather Radio sites in the WFO Baltimore-Washington CWA have emergencyback-up power. Two (Baltimore, MD and Moorefield, WV) do not. The transmitter atCharlottesville was out approximately 8 hours from Thursday night September 18, to Fridaymorning September 19, due to loss of phone line. The transmitter at Baltimore was outapproximately 24 hours from Thursday evening September 18, to Friday evening September 19,due to loss of phone line and power.

43
Finding # 10 - NWR is fast becoming an all-hazards radio and a resource that must beavailable to the country during emergencies.
Recommendation # 10 - Emergency back-up generator power should be provided for allNWR transmitters across the entire country.
Hurricane Local Statements were not set up for automated broadcast on NWR using theConsole Replacement System (CRS) at several WFOs. The HMT staff had to read themmanually. WFO Baltimore-Washington still has a telephone recording service. This is notautomated and HMTs must also record messages manually for the recording.
Fact - There are eight ASOS sites in the Baltimore-Washington CWA. Only data from theAnnapolis ASOS site was lost due to flooding of the building that supplied electricity andtelephone service. Tide gage data from the National Ocean Service (NOS) was lost at somelocations Thursday night September 18.
Finding # 11 - ASOS has become the official data collection platform for climatological andcurrent weather information. Without ASOS data in severe weather events, no verifyinginformation is available for NWS or private meteorologists. NOS tide gages are vitalsources of information for many users concerning tidal levels. Without tide gage data insevere weather events, government officials and emergency management personnel mustrely on manual readings of staff gages. Even if communications are lost, the record itself isvaluable information and could be salvaged if properly protected.
Recommendation # 11 - A source of emergency power should be installed for all ASOS sitesand key tide gage sites where possible.
Feedback from Customers and Partners
Feedback from emergency managers was nearly all positive. The emergency managers wereimpressed with the availability of the WFO to their requests for briefings and to answerquestions. Emergency managers in the Washington Metro area obtained briefings via conferencecalls with the WFO. Emergency managers outside the Washington area, including Baltimore,relied on NAWAS for group briefings and individual calls. Many one-on-one calls wereconducted between individual jurisdictions and the WFO. The WCM used the NWS Meet-Meconference call capability to coordinate with and brief emergency managers in West Virginia dueto the threat of flooding and flash flooding.
Some emergency managers wanted storm surge forecasts to be more accurate and specific.There was also a desire that mean sea level (MSL) be used as the common reference elevation forstorm surge/tidal flooding. Emergency managers were confident that use of mean sea levelwould reduce confusion both in their jurisdictions and with the public.

44
Media relied on private services and the WFO web site to obtain NWS and WFO productsduring the event. Most media also made individual telephone calls to the WFO both for updatesas well as interviews. Print media quoted the WFO frequently in stories throughout the event.WFO staff did mention that the Washington Post has several field bureaus in the region and eachbureau called the WFO independently, often asking the same question(s). This became aworkload issue for the WFO staff.
Broadcast media noted that the WFO was excellent in preparing for the event and providingvery useful information in early HLSs. However, the broadcast media thought that the WFO didnot supply enough short term and local information during Thursday night and Friday morning(See Finding and Recommendation 8).
G. River Forecast Centers
Overview
The two NWS River Forecast Centers (RFCs) impacted by Hurricane Isabel’s landfallwere Southeast RFC (SERFC) in Peachtree City, GA, and the Middle Atlantic RFC (MARFC) inState College, PA. Both RFCs have had extensive experience with torrential rainfall andextensive flooding from past hurricanes (e.g., Agnes, 1972; Fran, 1996; and Floyd, 1999). EachRFC planned well for the event, went to 24 hour staffing during the event, and overall performedvery well with accurate and timely forecasts, updates, and discussions.
Middle Atlantic RFC
In the MARFC area, extensive flooding occurred from Isabel’s rains, including theShenandoah, Potomac, Rapidan, and Rappahannock River basins. The worst flooding fromIsabel’s heavy rainfall occurred in the Shenandoah and Potomac River Basins of Virginia andWest Virginia, especially on the South River at Waynesboro, VA; the South Fork of theShenandoah River near Lynnwood and at Front Royal, VA; the Shenandoah River at Millville,VA; and the South Branch of the Potomac River at Franklin, WV. Moderate to major main stemriver flooding also occurred in the main Potomac Basin, the Rapidan Basin, and theRappahannock Basin.
WFO Blacksburg, VA, lost AWIPS and NOAA Weather Radio capability when workmenaccidentally cut fiber optic cables to the office Thursday, September 18. Not only did this requiresecondary back-up (primary back-up for Blacksburg is WFO Baltimore-Washington, and becauseof the storm, ERH assigned WFO Charleston, WV, to assume Blacksburg’s operationalresponsibilities), but the IFLOWS data stream was interrupted. Although more than 20 NWSoffices participate in collection of IFLOWS data, WFO Blacksburg is a single point of entry forIFLOWS data in their area.

45
Fact - WFO Blacksburg lost AWIPS and NOAA Weather Radio capability Thursday, September18, when workmen cut the fiber optic cables to the office. WFO Blacksburg lost not only T1WAN capability for AWIPS but also dial backup capability. Because WFO Blacksburg wasdown, IFLOWS data was available only through redundant back-up sources, but not via theprimary AWIPS interface at Blacksburg.
Finding #- 12 - Losing both T1 and dial backup capabilities for AWIPS is devastating tooperations at any office in the NWS. IFLOWS data are critical for accurate and timelyweather monitoring at WFOs as well as RFCs.
Recommendation # 12 - Because the IFLOWS data stream is very important to NWSoperations, NWSH should assure all WFO and RFC operational staff understand howIFLOWS data can be obtained from redundant sources in the event of an AWIPS failure.
Uncertainty concerning a rainfall report of 20.20 inches in just a few hours from anIFLOWS tipping bucket gage at Upper Sherando, VA, caused some problems with the forecastfor the South River at Waynesboro, a mountainous headwater forecast point, which normallycrests within 12 hours of a heavy rain event. The Flood Warning issued by WFO Baltimore-Washington at 10:15 p.m. EDT on September 18 (first forecast from MARFC was issued at10:40 p.m. EDT on September 18) called for a crest near 13.0 feet at 8 a.m. EDT on September19. At that time, the river at Waynesboro was at 8.5 feet and rising rapidly. This forecast wasaccurate. An update from MARFC issued at 3:38 a.m. EDT on September 19, 2003 for the SouthRiver at Waynesboro (flood stage 9.5 feet) raised the forecast to 15.2 feet and warned of apossible record flood. The river crested near 13.9 feet around 4 a.m. EDT, approximately 9-12hours after the heaviest rainfall in the basin. Six homes were destroyed, and about 55 homes and28 businesses sustained major damage. Approximately 450 persons were evacuated due toflooding in Waynesboro and Augusta County.
Forecasts for river locations, such as Waynesboro, which crest in less than 12 hours afterheavy rainfall, are very difficult for NWS hydrologists when they are modeled on a 6 hour timestep. The National Weather Service River Forecast System (NWSRFS) can be implemented atvarious time steps from 1 to 24 hours but is most often used at 6 hour time steps because of theavailability of real-time data and historical data for calibration. For any basin that crests in 12hours or less, a 6-hour time step is not optimum for an accurate forecast since the actual crestcould easily fall between time steps.
As discussed in WFO Products and Services section (Table 4), the MARFC guidance for thenext downstream point on the Shenandoah from Waynesboro, the South Fork near Lynnwood,was updated several times during the event culminating in a crest forecast of 23.9 feet onSeptember 19, around 8 p.m. EDT. The observed crest was 22.5 feet late in the evening ofFriday, September 19.
The South Fork at Front Royal is the next downstream point from Lynnwood. Here theMARFC forecast was much too high. MARFC issued an updated forecast at 3:38 a.m. EDT

46
September 19, calling for a crest of 19.2 feet around 8 a.m. on September 20, which was raised ina further update at 9:46 a.m. on September 19 to a forecast crest of 24.6 feet and a mention of“major flooding” around 2 a.m. on September 20. The actual double crest at Front Royal was18.1 feet around midnight and again around 6 a.m. on September 20. To help understand whythe Front Royal Forecast was so high, the input data and hydrologic modeling at Front Royalshould be examined. Among the factors to consider are the observed rainfall distribution and therouting hydrology. The high forecast at Front Royal contributed to an over-forecast at the nextdownstream point, the Shenandoah River at Millville, as well.
Fact - NWS River Forecast Centers use a default 6 hour time step at most of their dailyoperational river forecast locations. Smaller time steps (anywhere from 1- 4 hours) can be andare being implemented in NWSRFS in river basins that respond rapidly during heavy rainfall.
Finding # 13 - A shorter time step (less than 6 hours) would be more effective in producingaccurate river forecasts for river basins that respond rapidly during heavy rainfall.Implementation of shorter time steps may be dependant on the availability of data, bothreal-time and historical.
Figure 3. MARFC river forecast points across northern VA, western MD and eastern WV.
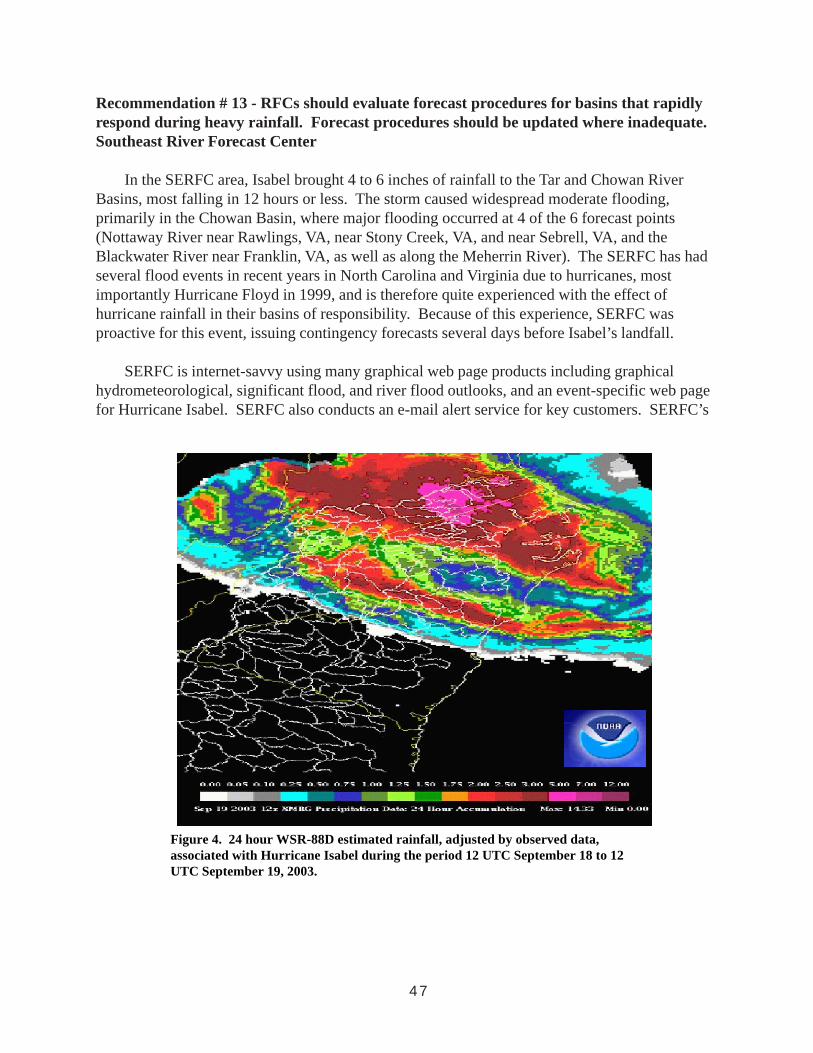
47
Recommendation # 13 - RFCs should evaluate forecast procedures for basins that rapidlyrespond during heavy rainfall. Forecast procedures should be updated where inadequate.Southeast River Forecast Center
In the SERFC area, Isabel brought 4 to 6 inches of rainfall to the Tar and Chowan RiverBasins, most falling in 12 hours or less. The storm caused widespread moderate flooding,primarily in the Chowan Basin, where major flooding occurred at 4 of the 6 forecast points(Nottaway River near Rawlings, VA, near Stony Creek, VA, and near Sebrell, VA, and theBlackwater River near Franklin, VA, as well as along the Meherrin River). The SERFC has hadseveral flood events in recent years in North Carolina and Virginia due to hurricanes, mostimportantly Hurricane Floyd in 1999, and is therefore quite experienced with the effect ofhurricane rainfall in their basins of responsibility. Because of this experience, SERFC wasproactive for this event, issuing contingency forecasts several days before Isabel’s landfall.
SERFC is internet-savvy using many graphical web page products including graphicalhydrometeorological, significant flood, and river flood outlooks, and an event-specific web pagefor Hurricane Isabel. SERFC also conducts an e-mail alert service for key customers. SERFC’s
Figure 4. 24 hour WSR-88D estimated rainfall, adjusted by observed data,associated with Hurricane Isabel during the period 12 UTC September 18 to 12UTC September 19, 2003.

48
Internet Technology (IT) capabilities, including color graphics and specialized web pages, greatlyenhanced their service to their users. Most RFCs now provide these graphics to their users. Theimplementation of dynamic routing on the Tar River by SERFC and the capability to producespecific reach and point inundation maps for placement on the Internet is a wonderful tool whichenhances service to users.
H. NOAA Public Affairs
Overview
Media interest in Hurricane Isabel intensified when the storm reached Category 5 strengththe weekend of September 13. For the period September 15-19, NOAA Public Affairs (PA)assisted more than 600 media inquiries at the National Hurricane Center (NHC) andapproximately 200 by NOAA PA personnel in the Washington D.C. metro area and NWS ERH.The broadcast pool operation at the NHC aired approximately 315 broadcast updates on Isabel tonational network and affiliate stations. The NHC also handled more than 300 print, radio, andtelevision inquiries from national and international outlets. The prearranged broadcast pooloperation at NHC commenced Monday, September 15 at 5 p.m. EDT. This operation continuedon a daily basis through 3 p.m. EDT Thursday, September 18, the day of landfall. Operationswere supervised by two NOAA Public Affairs personnel on site working 12 hour shifts. The pooloperation worked well except for a lack of a dedicated telephone line for the pool producer. Thepool producer is assigned from Miami metro affiliates and they currently use their own telephonewhen on duty. This means there can be two different lines each day depending on which affiliateis coordinating the pool operation.
Fact - An advisory was prepared and distributed Tuesday, September 16, listing media contactsfor specific hurricane issues.
Finding # 14 - This advisory proved invaluable, redirecting many inquiries from the NHCto NWS headquarters, the WFOs, NCEP or NWS ERH. This provided more timelyresponses to media inquiries.
Recommendation # 14 - Continue this practice but distribute the advisory beforeestablishing broadcast pool operation. This will entail advance planning to ensure expertsare lined up and available.
I. Sea Lake and Overland Surges from Hurricanes (SLOSH) Model
The Sea Lake and Overland Surges from Hurricanes (SLOSH) program provides a tool forWFOs and emergency managers predicting a maximum envelope of water accompanying a landfalling tropical cyclone. For many coastal offices, evacuation times to clear flood prone areas

49
along the coastline can be more than 36 hours. WFOs therefore must provide a specificassessment of the surge threat over a broad area, knowing that the highest realized values mayonly occur over a small portion of the mentioned coastline.
Coastal surge models require best track guidance, including the accompanying wind fieldand intensity at landfall. A small adjustment in track, sustained wind speeds or radii location (orthe presence of localized wind maxima) can have a tremendous impact on surge produced alongthe coastline. TPC fears that placing too much emphasis on a very specific track dependantdeterministic surge forecast could result in the communication of far too much confidence inexact water elevations, and lead to a less than adequate response to evacuation orders or at worst,the non-evacuation of areas more seriously at risk.
During Isabel’s approach, WFOs along the coast had access to a series of track specificdeterministic SLOSH runs for their coastal basins. These runs are usually generated only within24 hours of a tropical cyclone affecting the coast. The model is run at TPC, where storm track,and intensity, and wind radii information is manually entered. Coastal offices were pleased withthe runs but believe they should start within 12 hours of landfall. SLOSH did extremely wellalong the east coast and into Chesapeake Bay, but may have under-forecast surges which traveledup some of the tidal rivers as well as the upper reaches of the Chesapeake. Because Isabel’swinds affected Chesapeake Bay for a considerable time after landfall, at least one SLOSHdeveloper believes the deterministic SLOSH runs should routinely start within 24 hours oflandfall. SLOSH runs accomplished after the storm showed that the additional runs moreaccurately predicted the timing and maximum surges which impacted the upper reaches of theChesapeake. Also, significant manual modification and expansion of the forecast wind radiineeded to be done to more accurately capture the surges on Chesapeake Bay because the stormsurge guidance did not account for the unusual (non climatological) size of the storm.
In the last several years, Dr. Lian Xie at North Carolina State University (NCSU) has beenrunning a three dimensional surge model for portions of the Mid-Atlantic coast. These imagesand output were available during Isabel’s approach, via the NCSU meteorology departmentwebsite. Coastal offices were very impressed with its detail. Several WFOs believe the addedresolution and sophistication of the model should be explored further within the NWS in anattempt to provide more accurate surge forecasts.
While the ability to provide deterministic specific elevation forecasts and more site accuracyis desirable, given the intrinsic errors in track, intensity and wind field forecasts, the NWS couldultimately be providing very detailed but grossly incorrect surge information. This could have adevastating impact if the deterministic forecast was wrong and evacuations were not conductedin advance for the magnitude of the threat. Several sources at TPC, the WFOs, and NWSH notedthat NOAA has funded advanced surge modeling at universities like Louisiana State University(LSU) and NCSU, but funding for SLOSH development and operations within the NWS andNOAA has not been a priority. Dr. Lian Xie with NCSU stated that the SLOSH model is viewedby most modern day coastal zone modelers as, “an older two dimensional model which needs
50
updating.” At present, there is no development work being done with SLOSH. With so muchdamage potential from tropical cyclones in the coastal zone, perhaps the storm surge effort withinthe NWS and NOAA should be re-tasked to a dedicated and well-funded group. WFOs shouldcontinue to use the storm specific SLOSH runs with the knowledge they are subject to track andintensity errors. The storm specific runs should be supplemented with information using theMaximum Envelope of Water (MEOW) files in SLOSH.
Fact - Coastal offices appreciated deterministic SLOSH model runs made available within 24hours of Isabel’s landfall.
Fact - Deterministic SLOSH model runs under-predicted the storm surge from Isabel in theChesapeake Bay.
Fact - NOAA has funded advanced surge modeling at universities like LSU and NCSU butfunding for SLOSH development and operations within the NWS and NOAA has not been apriority. No updating of the SLOSH model is currently underway within the NWS and NOAA.
Fact - The SLOSH model is still a tool which can be used effectively to predict storm surge withland-falling tropical cyclones. However, it is in need of updating, both in mechanics and inmethodology
51
Best Practices1. The TPC/NHC augmented its hurricane forecasters with volunteers staffing TPC’s informal
round-the-clock “Hurricane Support Meteorologist” (HSM) position. The HSM programand its predecessors for years have provided the critical mass of personnel required tohandle the surplus of data synthesis, analysis and forecasting, media and emergency man-agement interviews, and telephone calls during such events. HSMs are drawn from trainedstaff in other TPC units contributing many hours over several days of overtime/compensa-tory time, as well as drawn from student volunteers and technically-inclined visitors fromother organizations. This staffing deficiency was noted in the Tropical Storm programPPBES documents. The TPC would like to eventually introduce a formal HSM position,possibly as an “intern” but is realistic about the constraints on increasing FTEs.
2. ERH detailed extra staff to affected offices. Detailed staff already familiar with the CWAof the office as well as the operations of the office proved especially valuable during Isabel.
3. WFOs Baltimore-Washington, Newport, and Wakefield had continuous electronics techni-cian staff available during the event, supplemented by ERH.
4. Each state held regular coordination conference calls several times daily during the hurri-cane event with WFOs and all impacted local EM officials participating. The local EMspraised the effectiveness of these calls, especially the contributions of the WFOs
5. WFOs Newport, Wakefield, and Baltimore-Washington have a section of their web pagededicated solely to emergency management use.
6. WFO Newport worked very quickly after the event to conduct detailed damage assess-ments. This information was then placed on the office’s Internet site. Feedback frompartners and customers indicate this post-storm page is a tremendous resource for thecommunity.
7. ERH also was proactive in reassigning service backup responsibilities away fromWakefield (to WFO Charleston, WV) when WFO Blacksburg lost communications duringthe storm.
8. The Wakefield office has explicit, detailed procedures in place to activate local EAS sys-tems when NWRs are off the air. The procedures include a contact telephone number forthe LP1 station, text to give over the telephone highlighting the weather emergency, provid-ing authentication, and provisions to contact the Virginia State Emergency OperationsCenter if NAWAS is also down. The procedures are only to be used in the event of Tornadoor Flash Flood warnings.

52
9. WFOs Baltimore-Washington, Newport, and Wakefield conducted extensive pre-eventbriefings with emergency managers, customers and partners.
10. The Adopt-A-County program assigned to WFO Baltimore-Washington staff improvedrelationships and communications between the WFO and emergency managers.

A-1
Appendix A
The Saffir-Simpson Hurricane Scale
The Saffir-Simpson Hurricane Scale is a 1-5 rating based on the hurricane’s presentintensity. This is used to give an estimate of the potential property damage and flooding expectedalong the coast from a hurricane landfall. Wind speed is the determining factor in the scale, asstorm surge values are highly dependent on the slope of the continental shelf in the landfallregion. Note that all winds are using the U.S. 1-minute average.
Category Sustained Barometric Storm Surge DamageWinds in mph Pressure in in feet above
millibars normal
1 74-95 > 980 4-5 Minimal
2 96-110 965-979 6-8 Moderate
3 111-130 945-964 9-12 Extensive
4 131-155 920-944 13-18 Extreme
5 >155 < 920 >18 Catastrophic

B-1
Appendix B
Summary of Fatalities
Date State County Details
9/13/03 FL Nassau Drowning (body surfer pulled under by ripcurrent), male, 43 (1)
9/18/03 VA Chesterfield Falling tree, male, 27, Asian-American (2)
9/18/03 VA City of Richmond Tree fell on home, female, 45, African-American (3)
9/18/03 VA New Kent Falling tree, male, 47, white, non-Hispanic (4)
9/18/03 VA Accomack Tree fell on trailer, male, 53, African-American (5)
9/18/03 VA City of Harrisonburg Drowning (canoeing in high water), male, 21,white, non-Hispanic (6)
9/18/03 VA Isle of Wight Drowning (car attempting to cross high water onJames River bridge washed off the road), male,62, African-American (7)
9/18/03 VA City of Hopewell Falling tree limb, male, 48, white,non-Hispanic (8)
9/18/03 NC Chowan Tree fell on vehicle, female, 32 (9)
9/18/03 NY Nassau Drowning (police officer body surfing pushedinto rocks), male, 42 (10)
9/18/03 RI Washington Drowning (swept off rocks by high seas), male,66 (11)
9/19/03 VA Henrico Drowning (car found in creek), male, 54 (12)
9/19/03 MD Baltimore Storm surge drowning in Turner Station area ofDundalk, male, 27 (13)
9/19/03 NJ Warren Tree fell on car, female (14)
9/20/03 NJ Cape May Drowning (rough surf off Wildwood Crest),male 51 (15)
9/21/03 VA Rockingham Two drownings (Mennonite horse and buggywashed away crossing low water bridge), male,85, female, 43, both white, non-Hispanic (17)