HURRICANE IRENE Introduction / Background - hurricane irene.pdf · storm (wind between 39-73mph) by...
5
Name: ________________________________ HURRICANE IRENE Introduction / Background: Hurricane Irene (winds greater than 74mph) began as a tropical depression (winds less than 38mph) off the coast of Africa in August 2011. Irene began to gain strength and organize into a tropical storm (wind between 39-73mph) by August 20. Irene continued to move towards the United States and concerns began to grow as weather forecast models showed Irene having an impact on the northeast United States. During the next several days, Irene traveled across the tropical Atlantic and through the Caribbean Sea. The first landfall was in the Outer Banks, North Carolina. Irene then made a second landfall that was very close to New York City and moved up the NY-Connecticut line. This was one of relatively few storms to ever take this track. Similar storms include Hurricane Bob from 1991 and the famous “Long Island Express” storm of 1938. Irene set records all along the Northeast. Marlboro, NY, recorded a record breaking 9.75” of rain. Many roads were covered with several feet of rushing water as streams overflowed their banks. The Hudson River rose nearly 7 feet and engulfed boat docks and yacht club. PART 1: 1. Using the map of the Atlantic/Caribbean, record each location (latitude and longitude) for the 16 data points for Hurricane Irene. Be sure each dot is labeled with a the corresponding number. Once you have marked all the dots, connect with a smooth line. You now have Hurricane Irene’s path. 2. Using the Hurricane data sheet, plot the air pressure and the wind speed on the graph on the following page. Label the X-axis at bottom of graph with the advisory number 1-16 – skip a space in between. There will be a separate line for the air pressure and a separate line for wind speed. See top of graph on how to label pressure and wind speed
Transcript of HURRICANE IRENE Introduction / Background - hurricane irene.pdf · storm (wind between 39-73mph) by...

Name: ________________________________
HURRICANE IRENE
Introduction / Background: Hurricane Irene (winds greater than 74mph) began as a tropical depression (winds less than 38mph)
off the coast of Africa in August 2011. Irene began to gain strength and organize into a tropical
storm (wind between 39-73mph) by August 20. Irene continued to move towards the United States
and concerns began to grow as weather forecast models showed Irene having an impact on the
northeast United States.
During the next several days, Irene traveled across the tropical Atlantic and through the Caribbean
Sea. The first landfall was in the Outer Banks, North Carolina. Irene then made a second landfall
that was very close to New York City and moved up the NY-Connecticut line. This was one of
relatively few storms to ever take this track. Similar storms include Hurricane Bob from 1991 and the
famous “Long Island Express” storm of 1938. Irene set records all along the Northeast. Marlboro,
NY, recorded a record breaking 9.75” of rain. Many roads were covered with several feet of rushing
water as streams overflowed their banks. The Hudson River rose nearly 7 feet and engulfed boat
docks and yacht club.
PART 1:
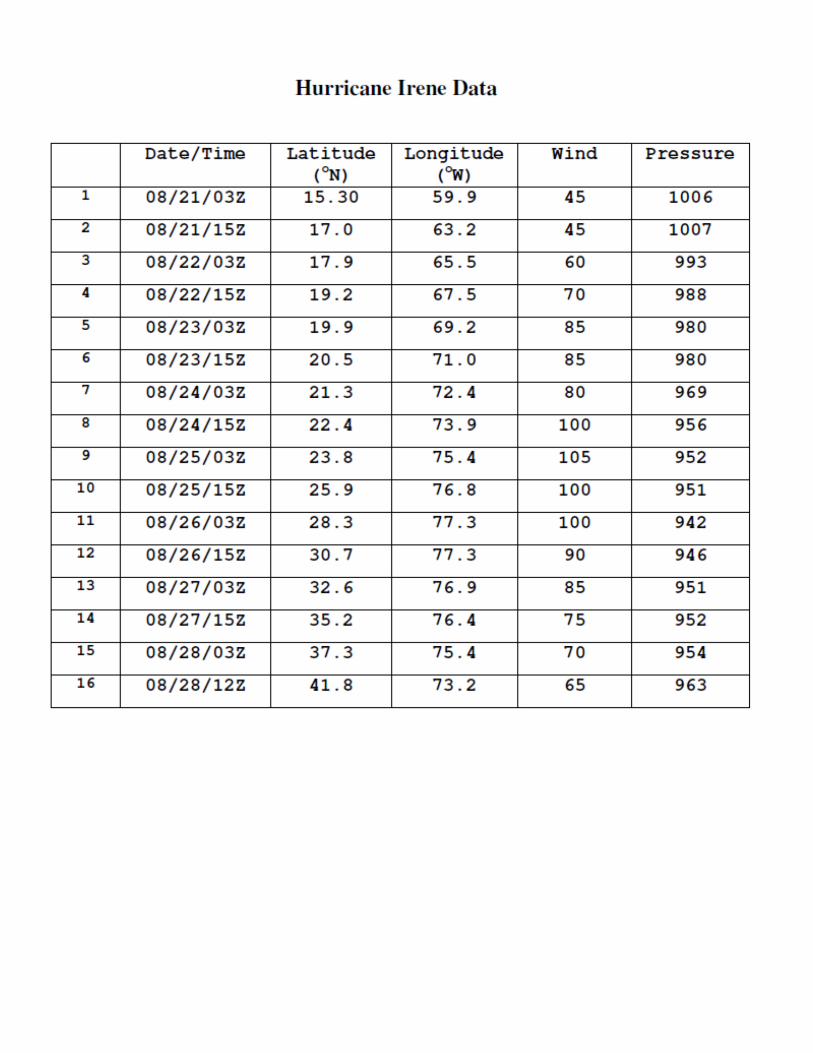
1. Using the map of the Atlantic/Caribbean, record each location (latitude and longitude) for the 16 data points for Hurricane Irene. Be sure each dot is labeled with a the corresponding number. Once you have marked all the dots, connect with a smooth line. You now have Hurricane Irene’s path.
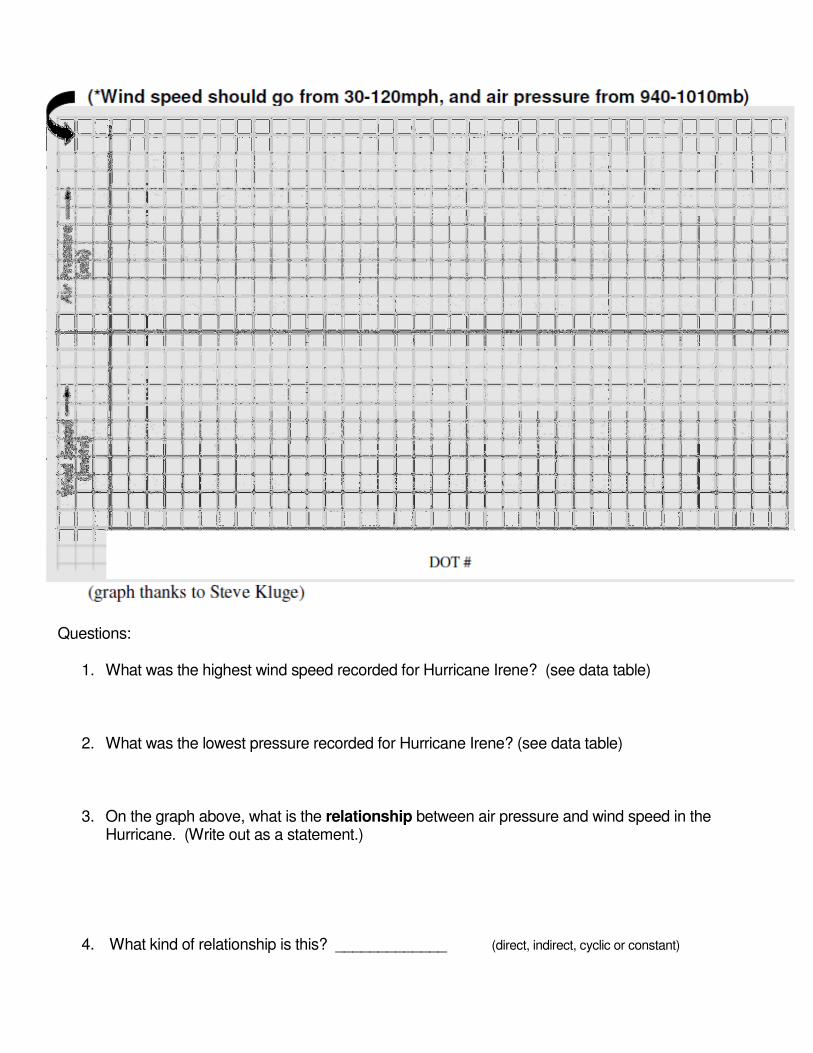
2. Using the Hurricane data sheet, plot the air pressure and the wind speed on the graph on the following page. Label the X-axis at bottom of graph with the advisory number 1-16 – skip a space in between. There will be a separate line for the air pressure and a separate line for wind speed. See top of graph on how to label pressure and wind speed
Questions:
1. What was the highest wind speed recorded for Hurricane Irene? (see data table)
2. What was the lowest pressure recorded for Hurricane Irene? (see data table)
3. On the graph above, what is the relationship between air pressure and wind speed in the Hurricane. (Write out as a statement.)
4. What kind of relationship is this? _____________ (direct, indirect, cyclic or constant)

Part 2: Connection to open water temperature? Use the two maps below to study the connection between ocean water temperature and popularity of hurricanes. Answer questions on the next page.
QUESTIONS from previous page:
5. What is the relationship between sea surface temperature and the number of hurricanes?
6. Which part of the Atlantic Ocean has the warmest temperatures (N, S,E,W,NE, NW, SE, SW)
7. Which part of the United State is at the greatest risk for hurricanes?
8. Which direction do almost all hurricanes seem to curve towards?
MORE QUESTIONS:
9. Using the data points and your map showing Irene’s movement, what happened to the pressure and the wind speed as Irene moved over land?
10. How many days were Irene classified as a Hurricane? (Hint: is each data point a day?)
11. Hurricane Wilma, part of the extremely active and deadly 2005 Hurricane season, had a pressure of 882 mb, the lowest pressure ever recorded in a tropical system. Compare the wind speeds of Wilma versus Hurricane Irene.
12. Describe the movement of air flow within a hurricane? (hint: remember, hurricanes are associated with low pressure.
13. Hurricanes can form in places other than the Atlantic as long as the conditions are right. What do hurricanes need to develop and strengthen?
14. Even though Irene was only a Category 1 hurricane at landfall, what was the primary cause of this natural disaster? (hint: read Intro/background)
15. Why were so many people evacuated?