Humidite These
271
University of East London School of Computing and Technology Londbridge Road Dagenham RM82AS tel. 44(0)2082233215 1
-
Upload
ilie-alin-colesa -
Category
Documents
-
view
91 -
download
5
description
Humidite These
Transcript of Humidite These
University of East London School of Computing and TechnologyLondbridge Road
Dagenham RM82AStel. 44(0)2082233215
1
Humidity in straw bale walls and its
effect on the decomposition of straw
Jakub Wihan1
July 2007
1I’d like to thank Mike Thompson for running the course. My thanks are due toSharon for editing, selfless support and love, to Adam and Zabelle as well as to myfather Josef, mother Maria, brother Lukas and his wife Marketa. Without them Iwouldn’t have been able to start or finish the course. I was very fortunate to haveBobby Gilbert and Sofie Pelsmakers as supervisors; thank you Bobby for seeing thepotential in this thesis. I’d like to express my gratitude to Martin and MarianneOehlmann, Herwig Van Soom and his family, Bee Rowan, Barbara Jones, all the Am-bassadors, Tom Rijven, Simon Ayres, Tomas Ficker, Tim Padfield, Daniel Zirkelbachfor the free use of WUFI, all the wonderful straw bale building professionals fromGSBN discussion forum and Kay. This work is the manifestation of a life force, rep-resenting itself as an ever loving Straw Bale Goddess.
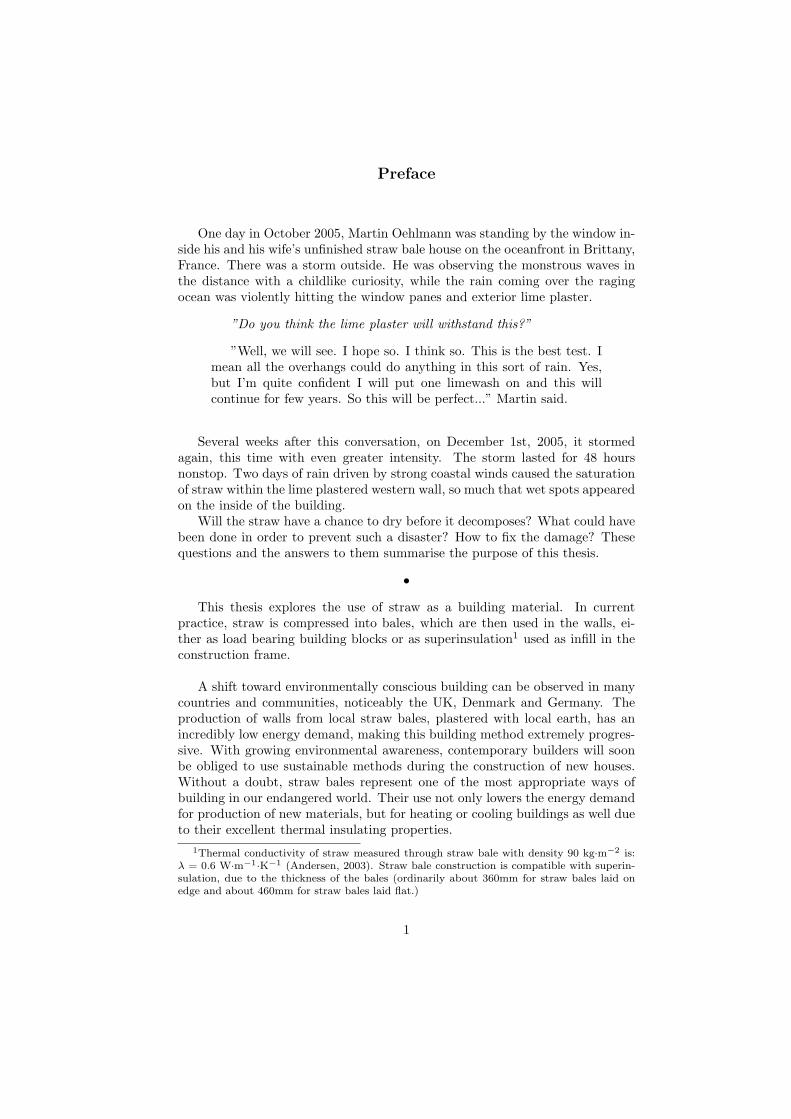
Preface
One day in October 2005, Martin Oehlmann was standing by the window in-side his and his wife’s unfinished straw bale house on the oceanfront in Brittany,France. There was a storm outside. He was observing the monstrous waves inthe distance with a childlike curiosity, while the rain coming over the ragingocean was violently hitting the window panes and exterior lime plaster.
”Do you think the lime plaster will withstand this?”
”Well, we will see. I hope so. I think so. This is the best test. Imean all the overhangs could do anything in this sort of rain. Yes,but I’m quite confident I will put one limewash on and this willcontinue for few years. So this will be perfect...” Martin said.
Several weeks after this conversation, on December 1st, 2005, it stormedagain, this time with even greater intensity. The storm lasted for 48 hoursnonstop. Two days of rain driven by strong coastal winds caused the saturationof straw within the lime plastered western wall, so much that wet spots appearedon the inside of the building.
Will the straw have a chance to dry before it decomposes? What could havebeen done in order to prevent such a disaster? How to fix the damage? Thesequestions and the answers to them summarise the purpose of this thesis.
•This thesis explores the use of straw as a building material. In current
practice, straw is compressed into bales, which are then used in the walls, ei-ther as load bearing building blocks or as superinsulation1 used as infill in theconstruction frame.
A shift toward environmentally conscious building can be observed in manycountries and communities, noticeably the UK, Denmark and Germany. Theproduction of walls from local straw bales, plastered with local earth, has anincredibly low energy demand, making this building method extremely progres-sive. With growing environmental awareness, contemporary builders will soonbe obliged to use sustainable methods during the construction of new houses.Without a doubt, straw bales represent one of the most appropriate ways ofbuilding in our endangered world. Their use not only lowers the energy demandfor production of new materials, but for heating or cooling buildings as well dueto their excellent thermal insulating properties.
1Thermal conductivity of straw measured through straw bale with density 90 kg·m−2 is:λ = 0.6 W·m−1·K−1 (Andersen, 2003). Straw bale construction is compatible with superin-sulation, due to the thickness of the bales (ordinarily about 360mm for straw bales laid onedge and about 460mm for straw bales laid flat.)
1
What are the weaknesses of straw bale construction?
The first doubts that generally come to mind in connection with straw balewalls are always related to fire and rodents. While these worries can easily bedispelled by application of good plaster onto straw (Jones, 2003), the questionof the vulnerability of straw to moisture is more serious. This thesis focuses onclarifying the problem of moisture in straw bale walls. It explains the boundarieswithin which straw and humidity in the walls can coexist. It investigates thequestion of how to stay within these boundaries, so that straw bale buildingscan become more innovative, more progressive and better adapted to modernclimates.
In straw bale building literature, the authors usually limit the uneasy topicof moisture in straw bale walls to several rules of thumb explaining the funda-mentals of moisture damage prevention. There is very little literature availablethat manages to provide a complex picture of moisture behaviour in straw balewalls directly connected to principles of straw decay. There is either literatureexplaining the decay of straw (e.g. Summers et al., 2003), or literature describ-ing the principles of moisture behaviour in straw bale walls (e.g. Straube, 2005).Due to growing interest in this topic, there is also a number of case studies onmoisture monitoring in existing straw bale buildings (e.g. Fugler, 1997).
This thesis offers a holistic approach.
• It explores the physics of moisture in walls in relation to the degradationof organic matter such as straw.
• It considers practical experience through case studies of straw bale houses.
• It compares simple design calculations for the prediction of moisture risk inbuilding envelopes (as are often used as a guideline by contemporary civilengineers and architects) with computer simulation, developed in order tostudy moisture transfer in walls in great complexity.
• It looks at the relevance of using those computational methods to predictmoisture performance in simple straw bale wall assemblies.
• It uses computer simulation to uncover the basic principles of moisturetransfer through straw bales plastered with different materials.
The conclusions are compared to knowledge from existing situations from 27professional straw bale builders in order to give a comprehensive guideline forfuture straw bale construction work.
2
Contents
1 Introduction 141.1 Warming . . . . . . . . . . . . . . . . . . . . . . . . . . . . . . . 141.2 Building sector . . . . . . . . . . . . . . . . . . . . . . . . . . . . 161.3 Construction materials . . . . . . . . . . . . . . . . . . . . . . . . 161.4 Straw bale houses . . . . . . . . . . . . . . . . . . . . . . . . . . . 181.5 Thesis Overview . . . . . . . . . . . . . . . . . . . . . . . . . . . 18
2 Decomposition of straw in a wall 212.1 Microorganisms in straw bales . . . . . . . . . . . . . . . . . . . . 222.2 Straw physiology . . . . . . . . . . . . . . . . . . . . . . . . . . . 24
2.2.1 Cellular composition . . . . . . . . . . . . . . . . . . . . . 252.2.2 Lignin . . . . . . . . . . . . . . . . . . . . . . . . . . . . . 262.2.3 Silica . . . . . . . . . . . . . . . . . . . . . . . . . . . . . 272.2.4 Nutrients . . . . . . . . . . . . . . . . . . . . . . . . . . . 28
2.3 Environment in straw bale walls . . . . . . . . . . . . . . . . . . 302.3.1 Fungicides . . . . . . . . . . . . . . . . . . . . . . . . . . . 302.3.2 Oxygen . . . . . . . . . . . . . . . . . . . . . . . . . . . . 322.3.3 Moisture, temperature and exposure time . . . . . . . . . 33
2.4 Summary of Chapter 2 . . . . . . . . . . . . . . . . . . . . . . . . 36
3 Relative humidity as a critical factor determining the conditionof straw 383.1 Kinetic (thermal) and electrical energy . . . . . . . . . . . . . . . 383.2 Water molecule . . . . . . . . . . . . . . . . . . . . . . . . . . . . 393.3 Water vapour pressure . . . . . . . . . . . . . . . . . . . . . . . . 393.4 Saturation water vapour pressure . . . . . . . . . . . . . . . . . . 403.5 Moisture content . . . . . . . . . . . . . . . . . . . . . . . . . . . 413.6 Relative humidity . . . . . . . . . . . . . . . . . . . . . . . . . . . 433.7 Relative humidity versus moisture content of hygroscopic materials 453.8 Relative humidity versus water availability to microorganisms . . 49
3.8.1 Microorganisms and liquid water . . . . . . . . . . . . . . 503.8.2 Microorganisms and water vapour . . . . . . . . . . . . . 51
3.9 Relative humidity versus moisture content of straw in an actualwall . . . . . . . . . . . . . . . . . . . . . . . . . . . . . . . . . . 52
3
3.10 Influence of relative humidity on microbial life . . . . . . . . . . . 543.11 Summary of Chapter 3 . . . . . . . . . . . . . . . . . . . . . . . . 54
4 Case studies 574.1 Overview of existing moisture monitoring in straw bale walls . . 58
4.1.1 Response of straw bale walls to atmospheric humidity . . 594.1.2 Response of straw bale walls to rain and sun . . . . . . . 614.1.3 Vertical variations of humidity in straw bale walls . . . . 624.1.4 Construction details . . . . . . . . . . . . . . . . . . . . . 644.1.5 Sheet moisture barriers . . . . . . . . . . . . . . . . . . . 654.1.6 Air infiltration . . . . . . . . . . . . . . . . . . . . . . . . 694.1.7 Air convection . . . . . . . . . . . . . . . . . . . . . . . . 704.1.8 Moisture balance . . . . . . . . . . . . . . . . . . . . . . . 72
4.2 Monitoring in straw bale walls done exclusively for this thesis . . 744.2.1 Case study I. Plozevet, France . . . . . . . . . . . . . . . 744.2.2 Case study II. Blanden, Belgium . . . . . . . . . . . . . . 81
4.3 Summary of Chapter 4 . . . . . . . . . . . . . . . . . . . . . . . . 85
5 Moisture transfer in a straw bale wall, steady state calculation 865.1 Principle of Glaser’s model; Introduction to the theory of mois-
ture transfer . . . . . . . . . . . . . . . . . . . . . . . . . . . . . . 875.2 Designing straw bale walls in Blanden; Prediction of interstitial
condensation build up using Glaser’s model . . . . . . . . . . . . 885.2.1 Design input data . . . . . . . . . . . . . . . . . . . . . . 895.2.2 Calculation of interstitial condensation using design con-
ditions . . . . . . . . . . . . . . . . . . . . . . . . . . . . . 945.2.3 Calculation of drying in summer using design conditions . 975.2.4 Summary of results . . . . . . . . . . . . . . . . . . . . . . 985.2.5 Straw bale wall in Blanden; prediction’s accuracy . . . . . 98
5.3 Straw bale wall in Blanden; Benchmarking of Glaser’s model . . 1015.3.1 Real input data . . . . . . . . . . . . . . . . . . . . . . . . 1015.3.2 Calculation of interstitial condensation using real conditions1015.3.3 Summary of results . . . . . . . . . . . . . . . . . . . . . . 101
5.4 Limitations of the steady state calculation using Glaser’s model . 1035.5 Summary of Chapter 5 . . . . . . . . . . . . . . . . . . . . . . . . 104
6 Moisture transfer in straw bale wall, dynamic simulation 1066.1 Overview of hygrothermal computer models . . . . . . . . . . . . 1066.2 Choosing a model for analysis of hygrothermal behaviour in plasered
straw bale wall . . . . . . . . . . . . . . . . . . . . . . . . . . . . 1076.3 WUFI, advanced moisture transfer theory . . . . . . . . . . . . . 109
6.3.1 WUFI and air convection . . . . . . . . . . . . . . . . . . 1106.3.2 WUFI and straw . . . . . . . . . . . . . . . . . . . . . . . 110
6.4 Straw bale wall in Blanden; Benchmarking of WUFI model . . . 1116.4.1 Input data for WUFI simulation . . . . . . . . . . . . . . 1116.4.2 Calculation of moisture transfer with the WUFI model . . 113
4
6.4.3 Summary of results . . . . . . . . . . . . . . . . . . . . . . 1146.4.4 Influence of input data on results of WUFI model . . . . 119
6.5 Limitations of the WUFI model . . . . . . . . . . . . . . . . . . . 1196.6 Summary of Chapter 6 . . . . . . . . . . . . . . . . . . . . . . . . 120
7 Investigation using WUFI dynamic simulation 1227.1 Dynamic simulation in extreme climates . . . . . . . . . . . . . . 122
7.1.1 Choosing extreme exterior ambient conditions . . . . . . . 1237.1.2 Choosing internal ambient conditions . . . . . . . . . . . 1247.1.3 Choosing the appropriate plaster . . . . . . . . . . . . . . 1257.1.4 Choosing appropriate wall assemblies . . . . . . . . . . . 1297.1.5 Input for WUFI simulation . . . . . . . . . . . . . . . . . 1307.1.6 WUFI calculation . . . . . . . . . . . . . . . . . . . . . . 1337.1.7 Summary of results . . . . . . . . . . . . . . . . . . . . . . 1347.1.8 Resume . . . . . . . . . . . . . . . . . . . . . . . . . . . . 142
7.2 Simulation of a case study in Plozevet, Brittany, France . . . . . 1437.2.1 Choosing an appropriate wall assembly to match the wall
in Plozevet . . . . . . . . . . . . . . . . . . . . . . . . . . 1437.2.2 Choosing ambient conditions to match those in Plozevet . 1437.2.3 Input data . . . . . . . . . . . . . . . . . . . . . . . . . . 1447.2.4 Calculation by WUFI . . . . . . . . . . . . . . . . . . . . 1467.2.5 Summary of results . . . . . . . . . . . . . . . . . . . . . . 1477.2.6 Resume . . . . . . . . . . . . . . . . . . . . . . . . . . . . 148
7.3 Summary of Chapter 7 . . . . . . . . . . . . . . . . . . . . . . . . 148
8 Questionnaire 1518.1 Sending out the questionnaire . . . . . . . . . . . . . . . . . . . . 1518.2 Statistical analyzes of the questionnaire . . . . . . . . . . . . . . 152
8.2.1 Profession . . . . . . . . . . . . . . . . . . . . . . . . . . . 1528.2.2 Experience . . . . . . . . . . . . . . . . . . . . . . . . . . 1538.2.3 Favourite straw bale wall finish . . . . . . . . . . . . . . . 1538.2.4 Weather resistance of exterior straw bale wall finish . . . 1548.2.5 Condensation in straw bale walls . . . . . . . . . . . . . . 1548.2.6 Causes of moisture problems in straw bale walls . . . . . 1558.2.7 Previously rained on straw . . . . . . . . . . . . . . . . . 1558.2.8 Weeds and grass in straw . . . . . . . . . . . . . . . . . . 1568.2.9 Monitoring of straw moisture content . . . . . . . . . . . 1568.2.10 Acceptable moisture content of straw . . . . . . . . . . . . 1578.2.11 Straw bale walls in a hot and humid climate . . . . . . . . 157
8.3 Quotes from completed questionnaires . . . . . . . . . . . . . . . 1588.4 Summary of results . . . . . . . . . . . . . . . . . . . . . . . . . . 160
9 Conclusion 162
5
10 Terminology needing explanation: 16610.1 Chapter 1 terminology: . . . . . . . . . . . . . . . . . . . . . . . 16610.2 Chapter 2 terminology: . . . . . . . . . . . . . . . . . . . . . . . 16610.3 Chapter 3 terminology: . . . . . . . . . . . . . . . . . . . . . . . 169
A Interviews 186A.1 Interview with Barbara Jones of Amazon Nails at Ecobuild 2006
in London. . . . . . . . . . . . . . . . . . . . . . . . . . . . . . . . 187A.2 Interview with Tom Rijven of Habitat Vegetal on the way to
Brittany . . . . . . . . . . . . . . . . . . . . . . . . . . . . . . . . 192A.3 Interview with Martin Oehlmann in his and his wife’s straw bale
house in Plozevet—Brittany, France. . . . . . . . . . . . . . . . . 200A.4 Interview with Simon Ayres of Lime green products ltd. and Bee
Rowan of Amazon Nails at Ecobuild 2006 in London. . . . . . . . 204
B Tables 210B.0.1 Monitors accuracy . . . . . . . . . . . . . . . . . . . . . . 214B.0.2 Tables of material properties . . . . . . . . . . . . . . . . 215B.0.3 Summary of case study investigation . . . . . . . . . . . . 227
C Illustrations 233
D Calibration of moisture meters 236
E Additional monitoring; Plozevet 237
F Adjustment of interior input data from monitor #4; Blanden 239
G Calculations 240G.0.4 Blanden - design conditions; Calculation of evaporation . 241G.0.5 Blanden - real data; Calculation of interstitial condensa-
tion occurance in straw bale wall . . . . . . . . . . . . . . 243
H Principles of WUFI model; Advanced moisture transfer theory245H.1 Moisture storage . . . . . . . . . . . . . . . . . . . . . . . . . . . 245
H.1.1 Moisture region A . . . . . . . . . . . . . . . . . . . . . . 246H.1.2 Moisture region B . . . . . . . . . . . . . . . . . . . . . . 246H.1.3 Moisture region C . . . . . . . . . . . . . . . . . . . . . . 246
H.2 Moisture transfer mechanisms . . . . . . . . . . . . . . . . . . . . 247H.2.1 Water vapour transfer . . . . . . . . . . . . . . . . . . . . 249H.2.2 Liquid water transfer . . . . . . . . . . . . . . . . . . . . . 251
H.3 Moisture transfer mechanisms, WUFI’s solution . . . . . . . . . . 252H.4 Moisture transfer in straw . . . . . . . . . . . . . . . . . . . . . . 253H.5 Moisture transfer below frost level . . . . . . . . . . . . . . . . . 253
H.5.1 Vapour diffusion . . . . . . . . . . . . . . . . . . . . . . . 253H.5.2 Liquid transfer . . . . . . . . . . . . . . . . . . . . . . . . 254
H.6 Heat storage and heat transfer in moist building material . . . . 254
6
H.6.1 Moisture dependent thermal conductivity . . . . . . . . . 254H.6.2 Heat content . . . . . . . . . . . . . . . . . . . . . . . . . 255H.6.3 Transfer of heat with a phase change . . . . . . . . . . . . 256
H.7 Surface transfer coefficients in advanced theory . . . . . . . . . . 257H.7.1 Exterior and interior heat and vapor transfer coefficients . 257H.7.2 Energy absorption factor and rain water absorption factor 258
I Input data for WUFI simulation in Chapter 6 259I.1 Time step . . . . . . . . . . . . . . . . . . . . . . . . . . . . . . . 259I.2 Climate data . . . . . . . . . . . . . . . . . . . . . . . . . . . . . 259
I.2.1 Exterior climate data . . . . . . . . . . . . . . . . . . . . 260I.2.2 Interior climate data . . . . . . . . . . . . . . . . . . . . . 260
I.3 Surface transfer coefficients . . . . . . . . . . . . . . . . . . . . . 261I.3.1 Vapour diffusion thickness [m] . . . . . . . . . . . . . . . 261I.3.2 Short wave radiation absorptivity [-] . . . . . . . . . . . . 261I.3.3 Long wave radiation emissivity [-] . . . . . . . . . . . . . 261I.3.4 Rain water absorption factor [-] . . . . . . . . . . . . . . . 261
I.4 Wall assembly . . . . . . . . . . . . . . . . . . . . . . . . . . . . . 262I.4.1 Monitor positions . . . . . . . . . . . . . . . . . . . . . . . 262I.4.2 Grid . . . . . . . . . . . . . . . . . . . . . . . . . . . . . . 262I.4.3 Orientation, inclination, height of the component . . . . . 262
J WUFIs equations 263
K Letters 265K.1 From: Martin Hammer, Saturday, April 08, 2006 1:33 AM . . . . 266K.2 From: Tim Padfield, Saturday, November 12, 2005 10:55 AM . . 267K.3 From: Dirk Scharmer, Wednesday, April 19, 2006 10:14 AM . . . 268
L Questionnaires 269
7
List of Figures
1.1 Annual growth rate of atmospheric CO2 . . . . . . . . . . . . . . 151.2 Annual growth rate of global annual surface temperature . . . . 151.3 CO2 emissions produced by industrialized countries . . . . . . . . 161.4 Overall CO2 emissions by weight released by production of 1 kg
of twenty-five common building materials including straw bales . 17
2.1 An image by an electron microscope of fungal spores and fungalhyphae . . . . . . . . . . . . . . . . . . . . . . . . . . . . . . . . . 21
2.2 bacterial nanoclimate on phyllosphere . . . . . . . . . . . . . . . 232.3 Rate of straw decomposition, after it had been left to decay in a
field . . . . . . . . . . . . . . . . . . . . . . . . . . . . . . . . . . 242.4 Cell wall . . . . . . . . . . . . . . . . . . . . . . . . . . . . . . . . 262.5 image by an electron microscope of cross sections through wheat
, miscanthus and hemp straw . . . . . . . . . . . . . . . . . . . . 272.6 Development of oxygen and CO2 in an enclosure with decompos-
ing tree bark . . . . . . . . . . . . . . . . . . . . . . . . . . . . . 322.7 Rate of anaerobic degradation versus moisture content of rice straw. 332.8 The rate of organic matter loss during aerobic decomposition in
samples of rice straw above the fiber saturation point . . . . . . . 342.9 The rate of organic matter loss during aerobic decomposition in
samples of rice straw below the fiber saturation point . . . . . . . 352.10 Ideal environment for aerobic decomposition . . . . . . . . . . . . 35
3.1 Molecule of water . . . . . . . . . . . . . . . . . . . . . . . . . . . 393.2 Psychrometric chart . . . . . . . . . . . . . . . . . . . . . . . . . 403.3 Wet weight basis moisture content versus dry weight basis mois-
ture content . . . . . . . . . . . . . . . . . . . . . . . . . . . . . . 423.4 Capillary condensation . . . . . . . . . . . . . . . . . . . . . . . . 463.5 Straw Isotherm . . . . . . . . . . . . . . . . . . . . . . . . . . . . 473.6 Sorption and desorption curves for straw . . . . . . . . . . . . . . 493.7 Intermolecular forces on a surface of a solution . . . . . . . . . . 503.8 Solution in a narrow capillary . . . . . . . . . . . . . . . . . . . . 513.9 4 days of relative humidity monitoring in straw bale wall in
Blanden, Belgium . . . . . . . . . . . . . . . . . . . . . . . . . . . 533.10 General sorption isotherm of straw . . . . . . . . . . . . . . . . . 55
8
4.1 Pilgrim Holiness Church in Arthur, Nebraska, 1928 . . . . . . . . 574.2 Straw bale house in Devon, England. Monitoring of ambient
humidity, straw misture content and rainfall. . . . . . . . . . . . 604.3 Californian winery. Monitoring at mid-height of the south wall
in heavy rain. . . . . . . . . . . . . . . . . . . . . . . . . . . . . . 614.4 Monitoring under the exterior plaster in the eastern wall of a
Californian winery . . . . . . . . . . . . . . . . . . . . . . . . . . 634.5 Rising damp . . . . . . . . . . . . . . . . . . . . . . . . . . . . . . 644.6 Moisture problem under the window sill . . . . . . . . . . . . . . 654.7 No drip edge on the window sill is a bad practice in straw bale
construction. . . . . . . . . . . . . . . . . . . . . . . . . . . . . . 654.8 Monitoring in straw under Tyvek, exterior moisture barrier . . . 664.9 One of the first prefabricated straw bale houses in Breitenfurt in
Austria . . . . . . . . . . . . . . . . . . . . . . . . . . . . . . . . 694.10 Monitoring air infiltration in wet straw bale wall in Plozevet,
Brittany, France . . . . . . . . . . . . . . . . . . . . . . . . . . . 704.11 Load bearing straw bale wall as a natural convection free building
method . . . . . . . . . . . . . . . . . . . . . . . . . . . . . . . . 724.12 Moisture storage . . . . . . . . . . . . . . . . . . . . . . . . . . . 734.13 Drying in straw bale wall . . . . . . . . . . . . . . . . . . . . . . 734.14 Building straw bale house in Plozevet, France . . . . . . . . . . . 744.15 Bird perspective of the straw bale house in Plozevet . . . . . . . 754.16 Section through the wall in Plozevet shows monitor placement. . 764.17 8 months of monitoring in Plozevet . . . . . . . . . . . . . . . . . 764.18 Samples of straw from the wall in Plozevet, February 17th 2006 . 774.19 Straw bale house in Plozevet, Brittany, France. . . . . . . . . . . 784.20 Samples of straw from the wall in Plozevet, September 20th, 2006 794.21 Straw bale house in Blanden, Belgium. . . . . . . . . . . . . . . . 814.22 Monitor positions in the straw bale wall in Blanden—section . . 834.23 Monitor positions in the straw bale wall in Blanden—picture . . 834.24 Monitoring of ambient data in Blanden . . . . . . . . . . . . . . 844.25 Horizontal distribution of humidity in the straw bale wall in
Blanden . . . . . . . . . . . . . . . . . . . . . . . . . . . . . . . . 84
5.1 3 days of relative humidity an temperature monitoring inside thestraw bal wall in Blanden. . . . . . . . . . . . . . . . . . . . . . . 89
5.2 Section through the straw bale wall in Blanden . . . . . . . . . . 935.3 Monitoring under the exterior plaster in straw bale wall in Blanden 995.4 Interior conditions in the bathroom of the straw bale house in
Blanden. December 6th, 2005 - May 1st . . . . . . . . . . . . . . 1005.5 Relative humidity and temperature distribution across the straw
bale wall in Blanden . . . . . . . . . . . . . . . . . . . . . . . . . 102
6.1 Section through the straw bale wall in Blanden taken from WUFIdialog. . . . . . . . . . . . . . . . . . . . . . . . . . . . . . . . . . 111
6.2 Flow chart for the WUFI model. . . . . . . . . . . . . . . . . . . 114
9
6.3 Comparison of WUFI simulation with real data in Blanden strawbale wall. February 19th 2006 — March 12th 2006 . . . . . . . . 115
6.4 Output of WUFI compared with the real measured data in thewall in Blanden at monitor position 1, December 7th 2005 —May 1st 2006 . . . . . . . . . . . . . . . . . . . . . . . . . . . . . 116
6.5 Position of the external monitor #5 in straw bale house in Blanden,Belgium. . . . . . . . . . . . . . . . . . . . . . . . . . . . . . . . . 116
6.6 Convergency improvement of calculation with the measured rel-ative humidity data at position 1 in Blanden, Belgium. . . . . . . 117
6.7 Output of WUFI compared with the real measured data in thewall in Blanden at monitor position 2 . . . . . . . . . . . . . . . 118
6.8 Output of WUFI compared with the real measured data in thewall in Blanden at monitor position 3 . . . . . . . . . . . . . . . 118
6.9 Influence of input data on results of WUFI model . . . . . . . . . 119
7.1 One year data. Average monthly data of relative humidity andtemperature in several locations with extreme weather. . . . . . . 123
7.2 One year data. Indicators for precipitation and average directsolar radiation in several locations with extreme weather. . . . . 123
7.3 Barrow, Northern Alaska; Kota Baharu, Indonesia . . . . . . . . 1247.4 Clay . . . . . . . . . . . . . . . . . . . . . . . . . . . . . . . . . . 1257.5 Sand for lime plaster . . . . . . . . . . . . . . . . . . . . . . . . . 1267.6 Cement in a plaster . . . . . . . . . . . . . . . . . . . . . . . . . 1277.7 ”French” dip in a clay slip . . . . . . . . . . . . . . . . . . . . . . 1297.8 Wall assembly EdSdE . . . . . . . . . . . . . . . . . . . . . . . . 1317.9 Wall assembly LESE . . . . . . . . . . . . . . . . . . . . . . . . . 1317.10 Wall assembly LSE . . . . . . . . . . . . . . . . . . . . . . . . . . 1317.11 Wall assembly LSL . . . . . . . . . . . . . . . . . . . . . . . . . . 1327.12 Water density in straw over 2 years run of simulation in Indone-
sian climate . . . . . . . . . . . . . . . . . . . . . . . . . . . . . . 1347.13 Result of simulation: instantaneous profiles through wall assem-
bly ESE and EdSdE . . . . . . . . . . . . . . . . . . . . . . . . . 1357.14 Result of simulation: total water density and water density in straw1367.15 Result of simulation: water density in plaster . . . . . . . . . . . 1377.16 Simulation results: 1 year dynamic relative humidity develop-
ment in Alaskan straw bale wall . . . . . . . . . . . . . . . . . . . 1387.17 Simulation results: 10 days of dynamic relative humidity devel-
opment in Alaskan straw bale wall in monitor position 3 . . . . . 1397.18 Simulation results: 1 year dynamic relative humidity develop-
ment in Indonesian straw bale wall . . . . . . . . . . . . . . . . . 1407.19 Simulation results: total moisture density and moisture density
in straw with adjusted interior ambient conditions in a straw balehouse in Indonesia . . . . . . . . . . . . . . . . . . . . . . . . . . 141
7.20 Simulation results: 1 year dynamic relative humidity develop-ment in Indonesian straw bale wall with adjusted interior ambientconditions . . . . . . . . . . . . . . . . . . . . . . . . . . . . . . . 142
10
7.21 Wall assembly LSL in Plozevet Brittany, France . . . . . . . . . . 1447.22 Simulation results: comparison of drying rate in Plozevet . . . . 1477.23 Simulation results: comparison of 3 years of relative humidity in
Plozevet wall . . . . . . . . . . . . . . . . . . . . . . . . . . . . . 147
8.1 Questionnaire: profession . . . . . . . . . . . . . . . . . . . . . . 1528.2 Questionnaire: experience . . . . . . . . . . . . . . . . . . . . . . 1538.3 Questionnaire: interior finish . . . . . . . . . . . . . . . . . . . . 1538.4 Questionnaire: exterior finish . . . . . . . . . . . . . . . . . . . . 1548.5 Questionnaire: exterior protection . . . . . . . . . . . . . . . . . 1548.6 Questionnaire: condensation . . . . . . . . . . . . . . . . . . . . . 1558.7 Questionnaire: causes of moisture problems . . . . . . . . . . . . 1558.8 Questionnaire: previously rained on straw . . . . . . . . . . . . . 1568.9 Questionnaire: weeds and grasses . . . . . . . . . . . . . . . . . . 1568.10 Questionnaire: moisture meters . . . . . . . . . . . . . . . . . . . 1578.11 Questionnaire: acceptable moisture content . . . . . . . . . . . . 1578.12 Questionnaire: hot and humid climate . . . . . . . . . . . . . . . 157
B.1 Carbon Dioxide Emissions by Sector for Industrialized Countries 211B.2 Table of composition of different organic materials. . . . . . . . . 212B.3 Percent wheat straw decomposition as affected by N fertilizer rates.213B.4 Percent wheat straw decomposition as affected by P fertilizer rates.213
C.1 Secondary cell wall structure. . . . . . . . . . . . . . . . . . . . . 234C.2 Simplified psychrometric chart . . . . . . . . . . . . . . . . . . . 235
E.1 Relative humidity and temperature data from datalogger #1 inPlozevet . . . . . . . . . . . . . . . . . . . . . . . . . . . . . . . . 237
E.2 Data from hygro/thermometer #3 in Plozevet . . . . . . . . . . . 238
H.1 Schematic sorption isotherm showing moisture storage functionof hygroscopic material. . . . . . . . . . . . . . . . . . . . . . . . 246
H.2 Relative humidity, temperature and vapour pressure gradientsacross the straw bale wall in Blanden . . . . . . . . . . . . . . . . 248
H.3 Schema demonstrating moisture transfer . . . . . . . . . . . . . . 248H.4 Relationship between temperature and freezing limit potential . . 254H.5 Steady state heat balance in two layered exterior wall exposed to
driving rain. . . . . . . . . . . . . . . . . . . . . . . . . . . . . . . 257
11
List of Tables
2.1 Average morphological fractions of various cereal straws. . . . . . 292.2 Factors affecting the durability of straw . . . . . . . . . . . . . . 37
5.1 Outdoor and indoor design conditions to be used in the model . 905.2 Parameters and the units commonly used to specify a material’s
resistance to heat flow and water vapour flow. . . . . . . . . . . . 915.3 Materials and their characteristics used as input in Glaser’s model,
Blanden . . . . . . . . . . . . . . . . . . . . . . . . . . . . . . . . 935.4 The comparison between the calculated results of Glaser’s model
and the real monitored data . . . . . . . . . . . . . . . . . . . . . 102
6.1 Sophistication contest WUFI and Galser’s model . . . . . . . . . 1086.2 Mechanisms contributing to overall moisture transfer through the
building envelope . . . . . . . . . . . . . . . . . . . . . . . . . . . 1096.3 Material characteristics as an input for WUFI simulation . . . . 1126.4 The rest of input data required by WUFI . . . . . . . . . . . . . 113
7.1 Indoor climate as an input for WUFI . . . . . . . . . . . . . . . . 1247.2 Feasibility plaster contest for use in a straw bale construction . . 1287.3 Material properties required by WUFI simulation in Plozvet wall. 1327.4 The rest of the input data required by WUFI simulation for case
in Plozevet . . . . . . . . . . . . . . . . . . . . . . . . . . . . . . 1337.5 Input of interior conditions for WUFI simulation, adjusted for
Indonesia . . . . . . . . . . . . . . . . . . . . . . . . . . . . . . . 1417.6 Interior conditions for WUFI simulation . . . . . . . . . . . . . . 1447.7 Material properties required by WUFI simulation in case of Plozevet.1457.8 The rest of input data required by WUFI simulation software for
Plozevet simulation . . . . . . . . . . . . . . . . . . . . . . . . . . 146
B.1 Accuracy of dataloggers claimed by LASCAR manufacturer . . . 214
G.1 Outdoor and indoor design conditions to be used in the calcula-tion of evaporation. . . . . . . . . . . . . . . . . . . . . . . . . . . 241
G.2 Results of calculation of evaporation as an output of Glaser’s model241G.3 Outdoor and indoor real conditions . . . . . . . . . . . . . . . . . 243
12
G.4 Results of calculation based on real conditions in Blanden . . . . 244
H.1 Forms of moisture transfer in porous media. . . . . . . . . . . . . 247H.2 Surface transfer coefficients considered by WUFI. . . . . . . . . . 257
13
Chapter 1
Introduction
1.1 Warming
Tom and Jerry, two satellites launched into the Earth’s orbit by NASA and theGerman aerospace agency Deutsches Zentrum fur Luft und Raumfahrt (Buis,2002), recorded the first evidence in history that the total mass balance of theAntarctic ice sheet is in significant decline. Tom and Jerry are measuring thechanges in Earth’s gravitational field. They had been chasing each other aroundthe Earth, 16 times a day for four years, when in March 2006, researchers at theUniversity of Colorado at Boulder published the results of an analysis based onthe satellite’s data. It proved that the rate of loss of Antarctic ice is around 36cubic miles or 152 cubic kilometers per year1 (Wahr, 2006).
A process called the ”natural greenhouse effect” was first described by theBritish physicist John Tyndall in 1859. He discovered that the most commonelements in the air, oxygen and nitrogen, are perfectly transparent to bothvisible and infrared radiation. On the other hand, air constituents like carbondioxide, methane and water vapour are not. He declared that these imperfectlytransparent gases were largely responsible for determining the Earth’s climate(Kolbert, 2005):
Energy from the sun arrives on Earth mostly in the form of visiblelight, which effectively heats up the Earth’s surface. The greenhousegases let the visible light pass through, but will not let the Earth’sheat, in the form of infrared radiation, escape easily to outer space.The greenhouse gases absorb the Earth’s heat and warm up. Asthey ”reradiate” the heat partly to space and partly towards Earth,Earth’s climate becomes livable. This complex heat exchange be-tween Earth, its envelope, and outer space, results in a stabilizedaverage global temperature of 13.9◦C.
1For comparison, the city of London uses about 0.16 cubic mile or 0.68 cubic kilometer ofwater annually. (CLEAR, 2006)
14
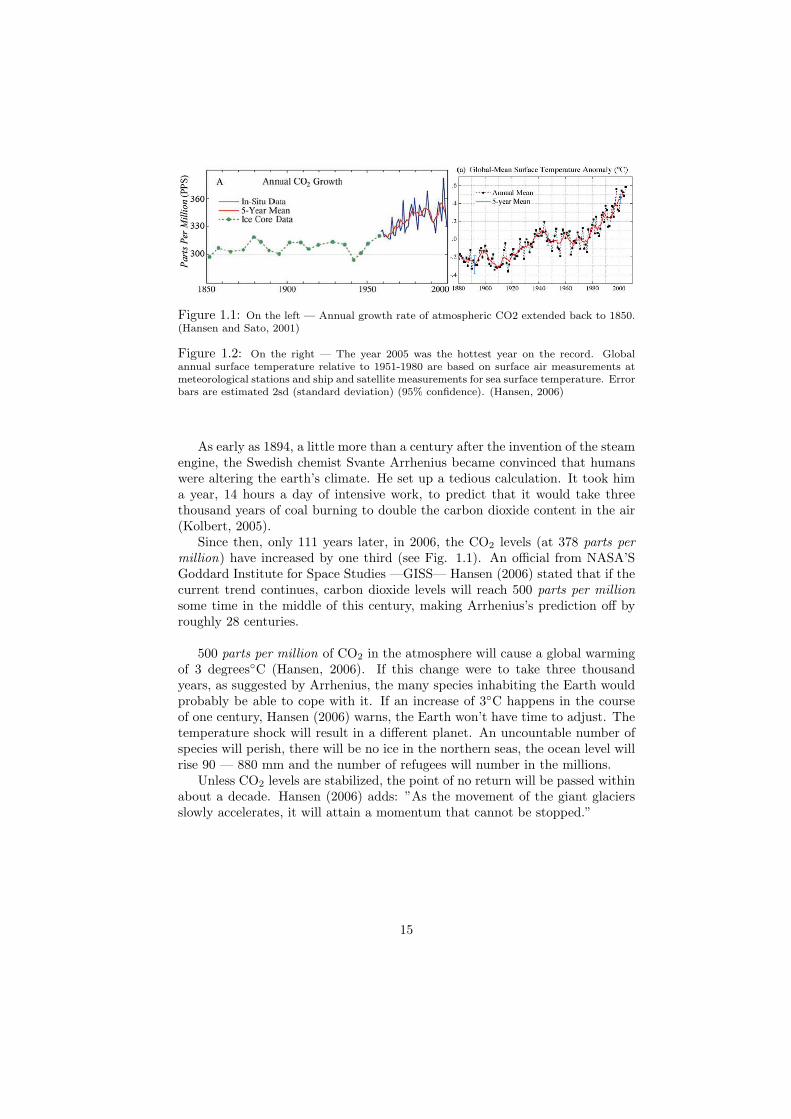
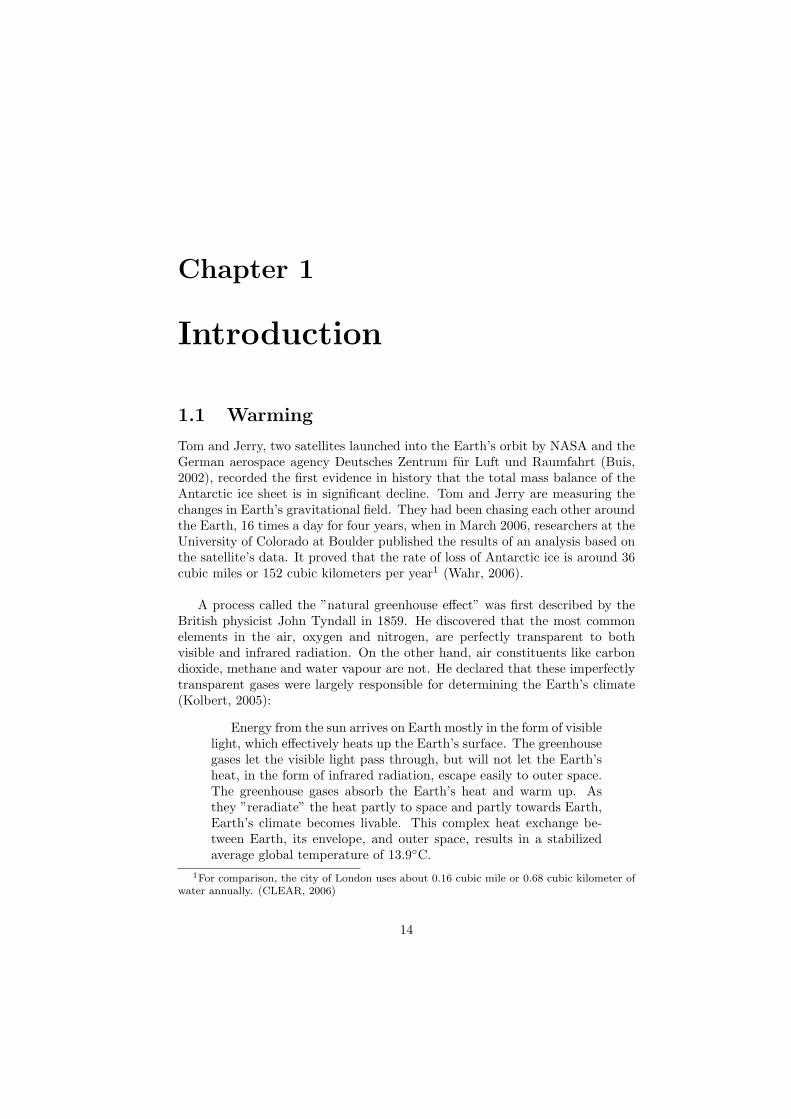
Figure 1.1: On the left — Annual growth rate of atmospheric CO2 extended back to 1850.(Hansen and Sato, 2001)
Figure 1.2: On the right — The year 2005 was the hottest year on the record. Globalannual surface temperature relative to 1951-1980 are based on surface air measurements atmeteorological stations and ship and satellite measurements for sea surface temperature. Errorbars are estimated 2sd (standard deviation) (95% confidence). (Hansen, 2006)
As early as 1894, a little more than a century after the invention of the steamengine, the Swedish chemist Svante Arrhenius became convinced that humanswere altering the earth’s climate. He set up a tedious calculation. It took hima year, 14 hours a day of intensive work, to predict that it would take threethousand years of coal burning to double the carbon dioxide content in the air(Kolbert, 2005).
Since then, only 111 years later, in 2006, the CO2 levels (at 378 parts permillion) have increased by one third (see Fig. 1.1). An official from NASA’SGoddard Institute for Space Studies —GISS— Hansen (2006) stated that if thecurrent trend continues, carbon dioxide levels will reach 500 parts per millionsome time in the middle of this century, making Arrhenius’s prediction off byroughly 28 centuries.
500 parts per million of CO2 in the atmosphere will cause a global warmingof 3 degrees◦C (Hansen, 2006). If this change were to take three thousandyears, as suggested by Arrhenius, the many species inhabiting the Earth wouldprobably be able to cope with it. If an increase of 3◦C happens in the courseof one century, Hansen (2006) warns, the Earth won’t have time to adjust. Thetemperature shock will result in a different planet. An uncountable number ofspecies will perish, there will be no ice in the northern seas, the ocean level willrise 90 — 880 mm and the number of refugees will number in the millions.
Unless CO2 levels are stabilized, the point of no return will be passed withinabout a decade. Hansen (2006) adds: ”As the movement of the giant glaciersslowly accelerates, it will attain a momentum that cannot be stopped.”
15
1.2 Building sector
The table in Appendix B.1 shows that almost half of the world’s CO2 emissionsis produced by industrialized countries (Price et al., 1999). In those countries,buildings are responsible for about 35% of total carbon dioxide emissions, thelargest portion of the pie (see Fig. 1.3).
Figure 1.3: CO2 emissions produced by industrialized countries (Price et al., 1999; eia,2005)
The majority of carbon dioxide emitted by buildings comes from heating andcooling (eia, 2005). Fig. 1.3 shows that by changing existing building stock forhighly insulated zero energy (passive) houses, a savings of about 15% of totalCO2 emissions could be achieved.
1.3 Construction materials
In 1999, the United Nations estimated that the production of new constructionmaterials accounts for approximately 11% of global CO2 emissions (Guy, 2004).This means that by building houses exclusively from local materials that requirevery little energy for their production (e.g. earth, straw and wood), another 11%of emissions could be saved. By using biomass for building, some of the currentCO2 emissions could even be stored as locked carbon in the construction.
A plant uses carbon dioxide from the air during photosynthesis while pro-ducing oxygen. Although carbon dioxide is released back into the air when aplant is destroyed (during decomposition or burning), the utilization of plantmaterials in construction ensures that the release of carbon dioxide is postponedfor the lifetime of the construction. That is why in the short term, local naturalorganic materials could be CO2 negative:
”A net CO2 sink is a material which contains an amount of carbon inits mass greater than the equivalent amount of CO2 released duringrelated raw material acquisition, transportation, manufacture anddistribution” (MacMath, 2000) (see Fig. 1.4).
16
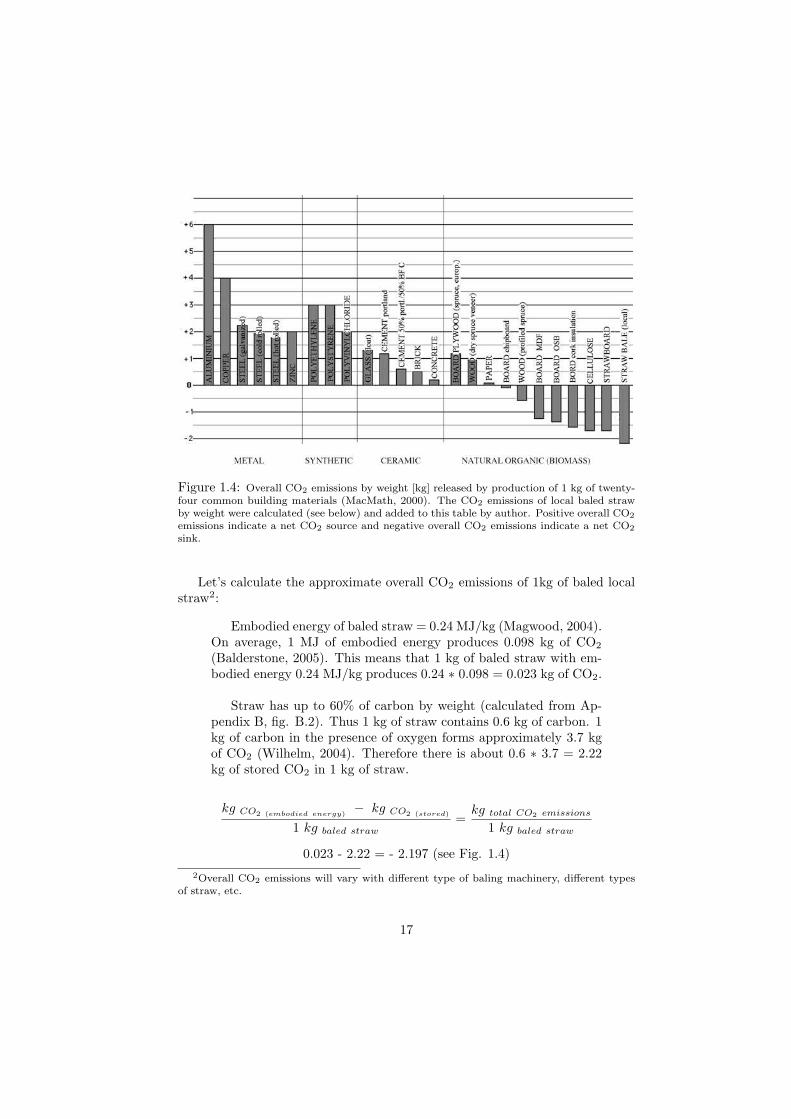
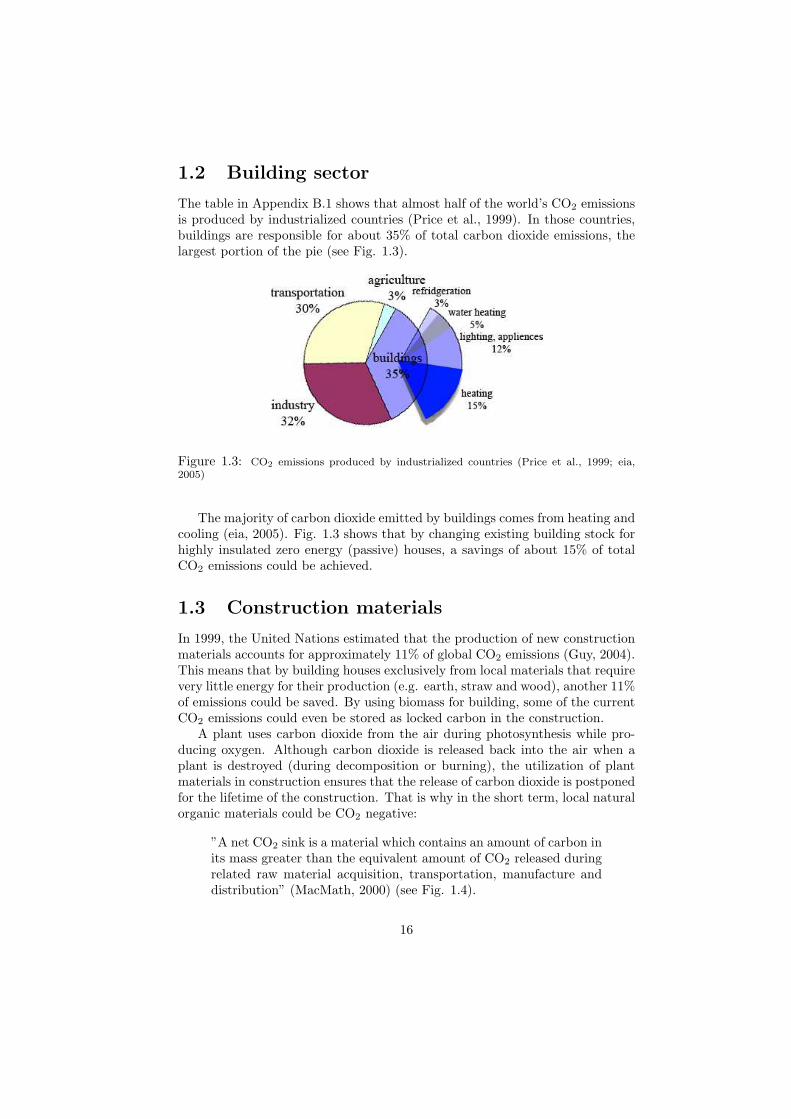
Figure 1.4: Overall CO2 emissions by weight [kg] released by production of 1 kg of twenty-four common building materials (MacMath, 2000). The CO2 emissions of local baled strawby weight were calculated (see below) and added to this table by author. Positive overall CO2
emissions indicate a net CO2 source and negative overall CO2 emissions indicate a net CO2
sink.
Let’s calculate the approximate overall CO2 emissions of 1kg of baled localstraw2:
Embodied energy of baled straw = 0.24 MJ/kg (Magwood, 2004).On average, 1 MJ of embodied energy produces 0.098 kg of CO2
(Balderstone, 2005). This means that 1 kg of baled straw with em-bodied energy 0.24 MJ/kg produces 0.24 ∗ 0.098 = 0.023 kg of CO2.
Straw has up to 60% of carbon by weight (calculated from Ap-pendix B, fig. B.2). Thus 1 kg of straw contains 0.6 kg of carbon. 1kg of carbon in the presence of oxygen forms approximately 3.7 kgof CO2 (Wilhelm, 2004). Therefore there is about 0.6 ∗ 3.7 = 2.22kg of stored CO2 in 1 kg of straw.
kg CO2 (embodied energy) − kg CO2 (stored)
1 kg baled straw=
kg total CO2 emissions
1 kg baled straw
0.023 - 2.22 = - 2.197 (see Fig. 1.4)2Overall CO2 emissions will vary with different type of baling machinery, different types
of straw, etc.
17
Above calculation means that local straw is a net CO2 sink with2.197 kg of CO2 stored in 1 kg of straw. Overall CO2 emissions of 1kg of baled straw are - 2.197 kg.
1.4 Straw bale houses
Sections 1.2 and 1.3 summarize two great advantages of straw bale construction.Straw bale buildings are potentially CO2 sinks. They can be made exclusivelyfrom renewable sources for the cost of a conventional house and at the sametime, they can ensure insulation quality of a passive house standard withoutany special technology3 (Wihan, 2005). Although insulating existing buildingstock with straw bales in industrialized countries seems unrealistic, as doesconstructing all new buildings using zero energy straw bale technology, the im-pact of such an act would result in a total carbon dioxide reduction of about26%4. Additionally, straw is an annually renewed waste product, appearing inabundance in the most of the world and after its life span, a straw bale housebiodegrades without leaving any toxic waste.
These properties put straw bales in a unique position among contemporarybuilding materials. However, the ubiquity of straw bales can be problematic.Straw bales defy standardization, because of their variable physical properties,and therefore bales from locally harvested straw can’t easily be classified asproper building material. Unless building regulations completely change theirview regarding the assessment of building materials, straw bales are doomed toremain an interesting, but marginal alternative.
Building with straw bales attracts self-builders because they are easy andpleasant to work with. Nevertheless, there are great risks in unskilled handlingand design. Straw bales are sensitive to moisture and vulnerable to rot. Thearea of moisture behavior in straw bale walls remains largely unexamined. Someresearch has been done and some theories are available. Along with measure-ments of humidity in actual walls, this thesis summarizes the existing ideas andfurther extends them using computer simulation to offer guidance to anyonewho is interested in designing or building a faultless straw bale structure.
1.5 Thesis Overview
The second Chapter of this thesis addresses the issue of straw decay. Itreviews the existing literature concerned with the decomposition of straw. Atthe end, the reader will become familiar with the factors affecting durability ofstraw in a wall, particularly with humidity (or moisture content of straw),oneof the most influential factors.
3When using straw bales for building, heating energy consumption of the house can bereduced to close to 20 kWh/m2·annum. This can be achieved without a heat exchanger andwithout sealing the house air tight.
415% heating (see Section 1.2) + 11% material production (see Section 1.3).
18
The third Chapter focuses on the physical nature of humidity. It will explainthe relevence of relative humidity as a physical quality determining straw decay.
The fourth Chapter further explores the connection between relative humid-ity and the condition of straw in a wall. It concentrates on different case studiesin order to support the physical theory with practical experience.
Its first part analyzes a few selected investigations describing moisture mon-itoring in straw bale walls done by others.
The second part introduces two case studies monitored exclusively for thepurpose of this thesis. One of them follows in a great detail the serious moistureproblem in Martin and Marianne Oehlmann’s straw bale house on the Atlanticoceanfront in Brittany, France, (mentioned in preface to this thesis). The othercase study presents relative humidity and temperature monitoring in an earthplastered straw bale wall in Blanden, Belgium. This particular case study pro-vides valuable data for benchmarking the mathematical models that are usedin the following chapters for analysis of moisture transfer in different straw balewall assemblies.
The fifth Chapter serves as an introduction to the complex theory behindmoisture transfer in building components. It focuses on a simple mathematicalmodel that is widely used by contemporary civil engineering practice knownas Glaser’s model. Glaser’s mathematical model is prescribed as a norm bybuilding standards in many industrialized countries all over the world includingEuropean countries like the UK, Germany, France, and others. It is used forthe prediction of condensation inside building envelopes. At the end of thisChapter, the results of Glaser’s calculation of moisture performance in strawbale walls are compared with real data measured in a real wall to reveal its lackof accuracy.
This thesis does not use Glaser’s model for its final investigation of moisturebehaviour in straw bale walls. There are more advanced models available thatseem to be much more reliable, notably the computer model WUFI.
The sixth Chapter deals with advanced moisture transfer theory. It explainsthe pros and cons of the WUFI mathematical model and examines its viabilityas regards the simulation of moisture transfer through different straw bale wallassemblies. The comparison of the WUFI model’s output with real data mon-itored in actual straw bale walls reveals that the WUFI model can be used forinvestigation of moisture transfer through basic straw bale wall assemblies withreasonable accuracy.
In the seventh Chapter, the WUFI model serves as a useful tool for a the-oretical survey of moisture transfer through various simple straw bale wall as-semblies. A reliable computer model is an extremely valuable tool. It enablesa researcher to build a virtual straw bale house anywhere, without any greateffort. It next allows the house to perform for couple of years (within a time
19
frame of several minutes), and then the researcher can open the virtual wallsand scrutinize them for any traces of moisture damage. This thesis examines,in this way, the impact of extremely cold and humid weather on a virtual strawbale house in Alaska and compares it to the influence of an extremely hot andhumid climate on a fictional straw bale house in Indonesia. The results of thesimulation will tell how well straw bale walls covered by various plasters performin such diverse climates.
The end of this Chapter reveals a surprising fact concerning the saturatedstraw bale wall in Plozevet. The computer simulation will help to uncover itspresumable drying time.
Finally, the eighth Chapter is reserved for expert opinion. A questionnairewas sent out to professional straw bale builders in order to examine the differ-ent straw bale moisture issues that they have encountered during their careers.27 straw bale building professionals answered 22 questions which were thenstatistically processed and analyzed. The Chapter’s summary winds up the in-vestigations of this thesis with these well-founded opinions based on experience.
Chapter Nine summarizes the conclusions drawn from this research.
The Appendix provides some interesting material that didn’t fit into theframework of this thesis. It includes, for example, an interview with the fore-most British straw bale builder Barbara Jones, the author of Building withStraw Bales, A Practical Guide for the UK and Ireland and an interview withTom Rijven, who is recognized as one of the world’s leading specialists on earthplastered straw bale walls. It also includes various illustrations, tables with dif-ferent material characteristics, detailed calculations, encouraging letters, sub-mitted questionnaires and others.
20
Chapter 2
Decomposition of straw in awall
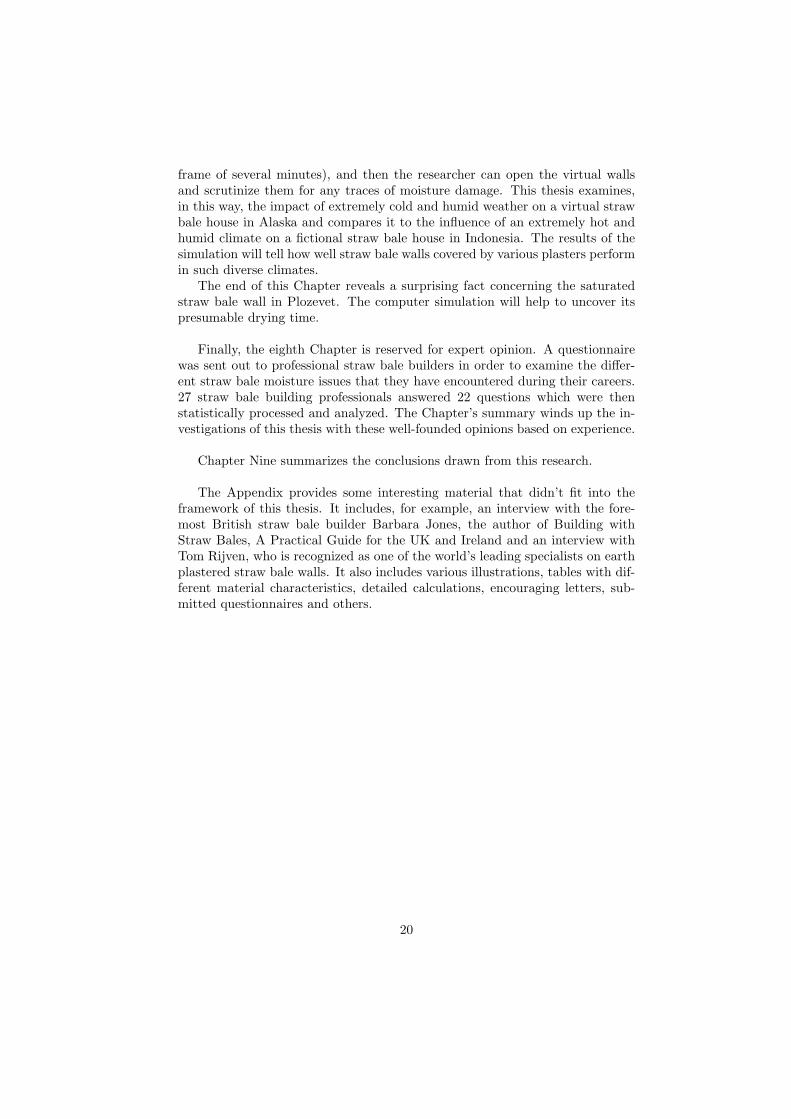
A great number of inorganic elements — nutrients — (e.g. oxygen, hydrogen,carbon, nitrogen) pass through straw during its lifetime in the form of solvents.When straw grows, some of these elements become molecules, creating neworganic substances in the new plant (EELS, 2005; Fogel, 2001). Decompositionreverses this process. After the harvest, straw contains a reservoir of organicelements. The breakdown of massive organic molecules into simple inorganicnutrients takes its course during the chemical process of decomposition initiatedby specific enzymes released by bacteria and fungi, or simply — microorganismsor microbes (see Fig. 2.1).
Figure 2.1: On the left — An image scanned by an electron microscope shows fungal sporesand fungal hyphae that are beginning to be visible in the internal structure of the basal part ofwheat straw after 1 week in a compost pile. (Dresboll, Magid, 2004) Fungi releases enzymes,that cause the straw tissue’s decomposition. On the right — Schema of enzymatic functionduring decomposition. (Mustin, 1987)
21
2.1 Microorganisms in straw bales
Bacteria1 and fungi1 are ubiquitous. Bacterial and fungal spores, and bacteriaitself, are single cell organisms, which are spread through the air or by animals.Most of them are deposited within a 100m radius and only a few travel longdistances (Hawksworth, 1995).
The microbiological population living on a particular piece of land differsevery year and varies from place to place (Arnolds, 1992). In general, thedeciding factor for the amount of microorganisms in a particular place is theamount of available food - nutrients (Kudo, 1971).
According to research by Arnolds (1992), the diversity and density of mi-croorganisms found in intensively cultivated, small scale fields is low in com-parison to the microbial population of wild forests, natural meadows, etc... Inaddition to the lack of varied food (nutrient diversity), microorganisms on arablelands suffer the periodic breakdown of fungal mycelia that happens every yearduring harvest. Annual harvesting is apparently destructive for most macrofungispecies, which are especially important for the complete structural decomposi-tion of straw (see the Section 2.2.2). On the other hand, nitrogen-rich fieldfertilization might give good competitive habitat to microfungi and bacteria(Arnolds, 1992).
The microbial population that thrives on seeds, stalks and leaves at the timeof harvest is of special interest to the builder, because these microorganisms willinevitably be baled with the straw (Summers et al., 2004) and transported allthe way into the wall.
GrAT — The Center for Appropriate Technology at the Vienna Universityof Technology — is carrying out the first long term research of the occurrence ofdifferent microbial species and their quantities inside straw bale walls (Wimmeret al., 2004). Similar research over a period of two years is in progress inGermany. The German Straw Bale Association — FASBA — together with theFraunhofer Institut fur Bauphysik are searching for evidence to support generalapproval for straw bales as insulation (see appendix K.3). However, the resultsof their research aren’t available yet.
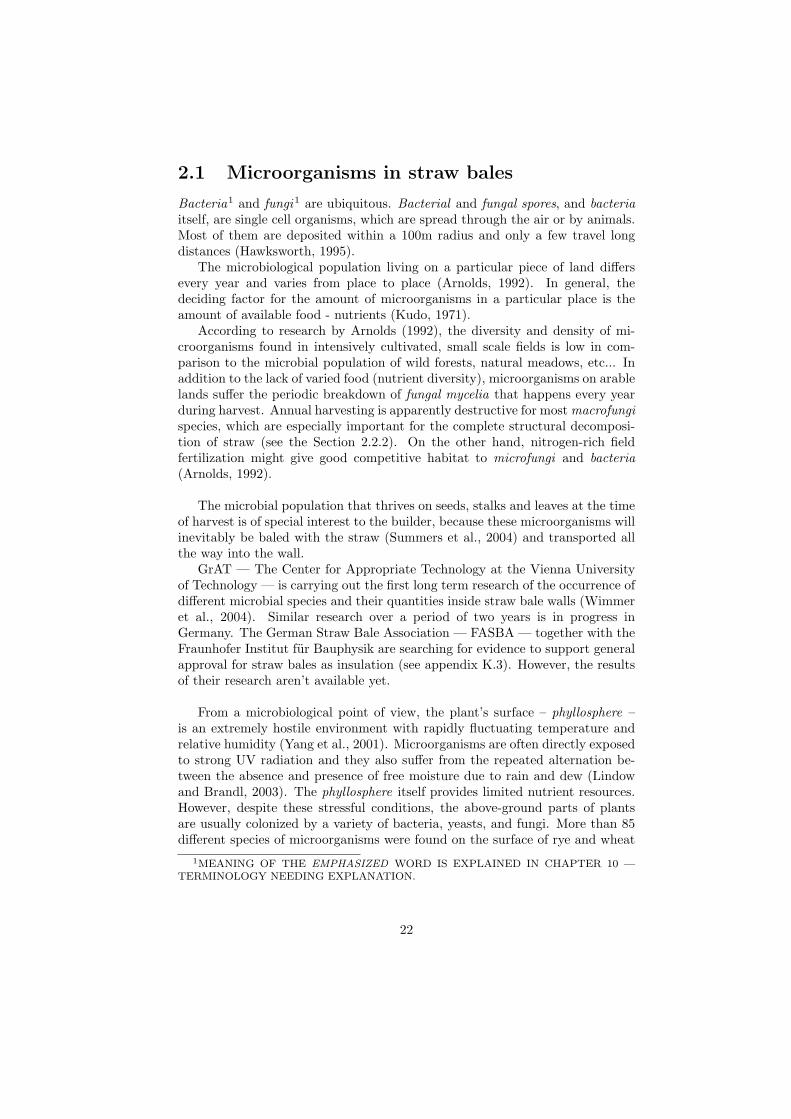
From a microbiological point of view, the plant’s surface – phyllosphere –is an extremely hostile environment with rapidly fluctuating temperature andrelative humidity (Yang et al., 2001). Microorganisms are often directly exposedto strong UV radiation and they also suffer from the repeated alternation be-tween the absence and presence of free moisture due to rain and dew (Lindowand Brandl, 2003). The phyllosphere itself provides limited nutrient resources.However, despite these stressful conditions, the above-ground parts of plantsare usually colonized by a variety of bacteria, yeasts, and fungi. More than 85different species of microorganisms were found on the surface of rye and wheat
1MEANING OF THE EMPHASIZED WORD IS EXPLAINED IN CHAPTER 10 —TERMINOLOGY NEEDING EXPLANATION.
22
by a number of studies mentioned in Yang, et al. (2001). Lindow and Brandl(2003) refer to a common occurrence of up to 105 bacterial cells per 1 mm2 ofplant leaf surface (equal to 108 cells per gram of leaf material).
Apparently bacteria make up by far the most abundant population of thephyllosphere. Filamentous fungi, on the other hand, are considered to be tran-sient inhabitants, existing on living plant surfaces mainly in the form of spores(Lindow and Brandl, 2003). While the major microbial population is periodi-cally washed away by rain, or killed by UV light and agents like fungicides, therest seems to somehow tolerate the severe living conditions (Yang et al., 2001).Bacteria often create large aggregates on plant bodies (Lindow, 2005), whichhelp them to establish their own temperate ”nanoclimate” (see Fig. 2.2).
Figure 2.2: Hypothetical bacterial-habitat modification in the phyllosphere via the produc-tion of extracellular polysaccharide (EPS) in bacterial aggregates. The heavy EPS slime mayprevent bacteria from dehydration. (Lindow and Brandl, 2003).
Plants have a natural ability to resist microorganisms during their lifespan,therefore healthy crops will barely suffer from the presence of a microbial pop-ulation on their surface (Wieland, 2004). The phyllosphere microbial activitystarts mainly with the death of a plant – in the case of straw, the harvest.
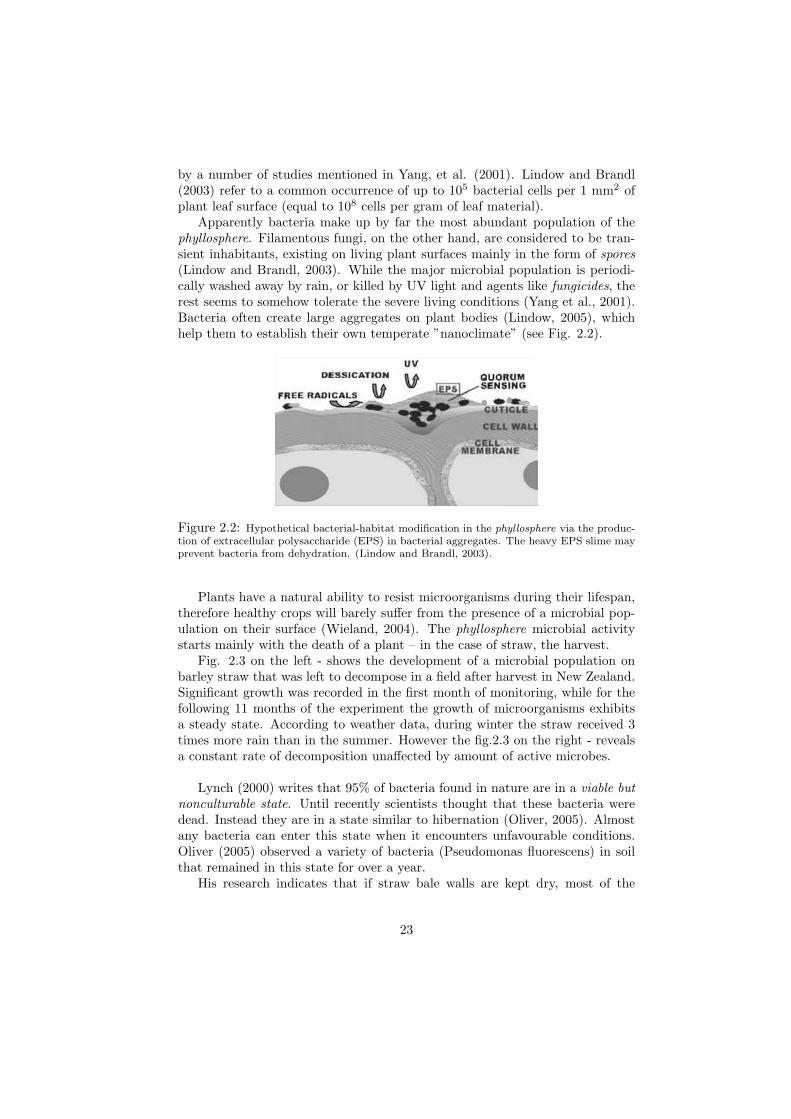
Fig. 2.3 on the left - shows the development of a microbial population onbarley straw that was left to decompose in a field after harvest in New Zealand.Significant growth was recorded in the first month of monitoring, while for thefollowing 11 months of the experiment the growth of microorganisms exhibitsa steady state. According to weather data, during winter the straw received 3times more rain than in the summer. However the fig.2.3 on the right - revealsa constant rate of decomposition unaffected by amount of active microbes.
Lynch (2000) writes that 95% of bacteria found in nature are in a viable butnonculturable state. Until recently scientists thought that these bacteria weredead. Instead they are in a state similar to hibernation (Oliver, 2005). Almostany bacteria can enter this state when it encounters unfavourable conditions.Oliver (2005) observed a variety of bacteria (Pseudomonas fluorescens) in soilthat remained in this state for over a year.
His research indicates that if straw bale walls are kept dry, most of the
23
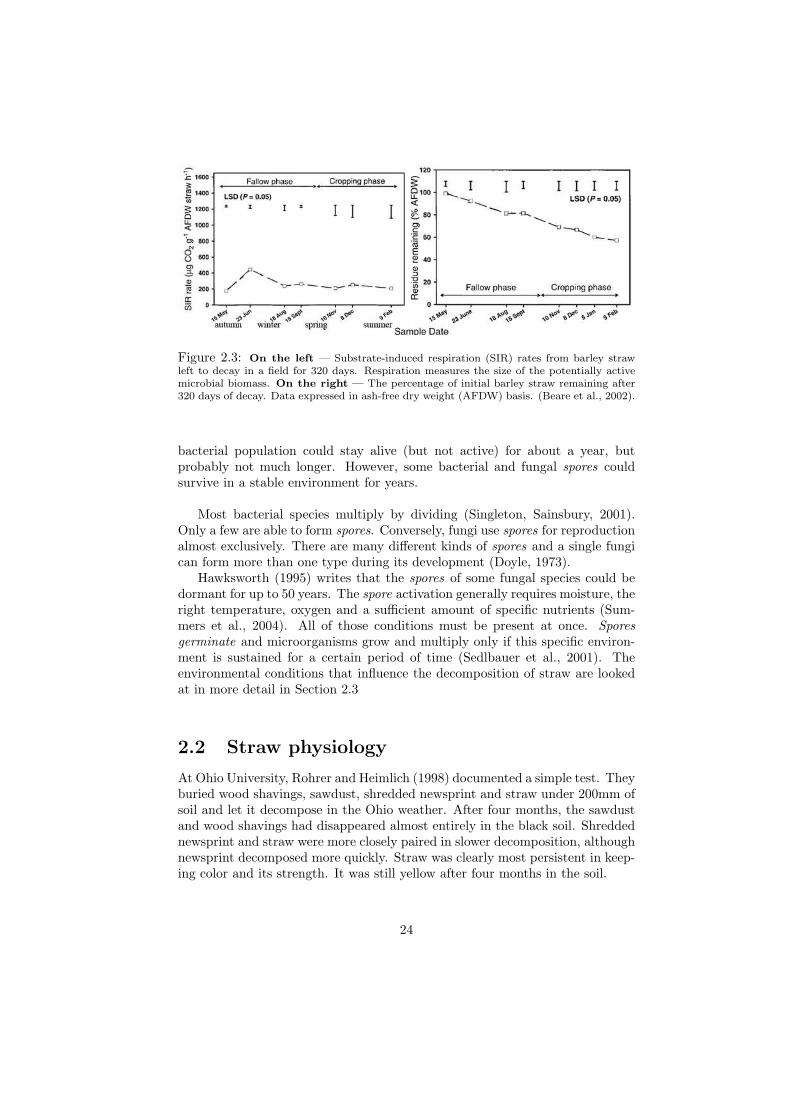
Figure 2.3: On the left — Substrate-induced respiration (SIR) rates from barley strawleft to decay in a field for 320 days. Respiration measures the size of the potentially activemicrobial biomass. On the right — The percentage of initial barley straw remaining after320 days of decay. Data expressed in ash-free dry weight (AFDW) basis. (Beare et al., 2002).
bacterial population could stay alive (but not active) for about a year, butprobably not much longer. However, some bacterial and fungal spores couldsurvive in a stable environment for years.
Most bacterial species multiply by dividing (Singleton, Sainsbury, 2001).Only a few are able to form spores. Conversely, fungi use spores for reproductionalmost exclusively. There are many different kinds of spores and a single fungican form more than one type during its development (Doyle, 1973).
Hawksworth (1995) writes that the spores of some fungal species could bedormant for up to 50 years. The spore activation generally requires moisture, theright temperature, oxygen and a sufficient amount of specific nutrients (Sum-mers et al., 2004). All of those conditions must be present at once. Sporesgerminate and microorganisms grow and multiply only if this specific environ-ment is sustained for a certain period of time (Sedlbauer et al., 2001). Theenvironmental conditions that influence the decomposition of straw are lookedat in more detail in Section 2.3
2.2 Straw physiology
At Ohio University, Rohrer and Heimlich (1998) documented a simple test. Theyburied wood shavings, sawdust, shredded newsprint and straw under 200mm ofsoil and let it decompose in the Ohio weather. After four months, the sawdustand wood shavings had disappeared almost entirely in the black soil. Shreddednewsprint and straw were more closely paired in slower decomposition, althoughnewsprint decomposed more quickly. Straw was clearly most persistent in keep-ing color and its strength. It was still yellow after four months in the soil.
24
While the relatively high decomposition resistance of straw favors straw balebuilding, it bothers farmers. A considerable number of scientific reports docu-menting tests of straw degradation is widely available. Agronomists are strug-gling to find the fastest and most effective way of straw composting (Beare etal., 2002). To use composted straw as a fertilizer is often seen as the easiest wayof getting rid of problematic agricultural waste.
Decomposition of straw in straw bale walls has not been the subject ofmuch research. Nonetheless, comparisons between degradation in walls anddecomposition in soil can be made, as long as the major differences are takeninto account (Dresboll and Magid, 2005):
• The main difference is the presence of moisture. The straw in soil orcompost is usually exposed to much more water than straw in a wall.
• The relatively dry and dark environment in a wall will eliminate mostof the bacteria, algae, and yeasts, because bacteria needs a high level ofmoisture to grow (Padfield, 2002), while algae and yeasts need, in additionto a high level of moisture, light.
• Another important difference is in microbial diversity. In general, there isa larger microbial population in soil than on the surface of the straw ina wall, where fungi will most likely be the main cause of decomposition(Beare, 2002; Padfield, 2003).
• There are also differences in nutrient values. The amount of nutrients inthe soil by far exceeds the overall nutrient value in a straw bale wall, wherethe only source of nutrients is the low nutrient straw itself. (see Section2.2.4).
The Rohrer and Heimlich experiment (1998) shows that straw decays ata slower rate than woodchips, woodshavings and newsprint. Another studycarried out by Dresboll and Magid (2005) proved that wheat straw decomposesin the same compost pile faster than hemp and miscanthus grass. In order tofind out why some types of organic matter decompose faster than others, it isuseful to look at the plants under a microscope.
2.2.1 Cellular composition
All plants have a more or less similar cellular composition. The contents ofthe cells are vulnerable to decomposition and that is why they are naturallyprotected by the cell wall. During its growth, the plant cell forms a flexibleprimary cell wall, which consists of randomly arranged micro fibers of cellulosein a matrix of hemicellulose, pectins and proteins.
Once the cell stops growing, the cell wall develops structural strength in asophisticated, multi layered system with increased resistance against enzymaticattack (Hopkins, 1999) (see Fig. 2.4). The chemical changes, which are still
25
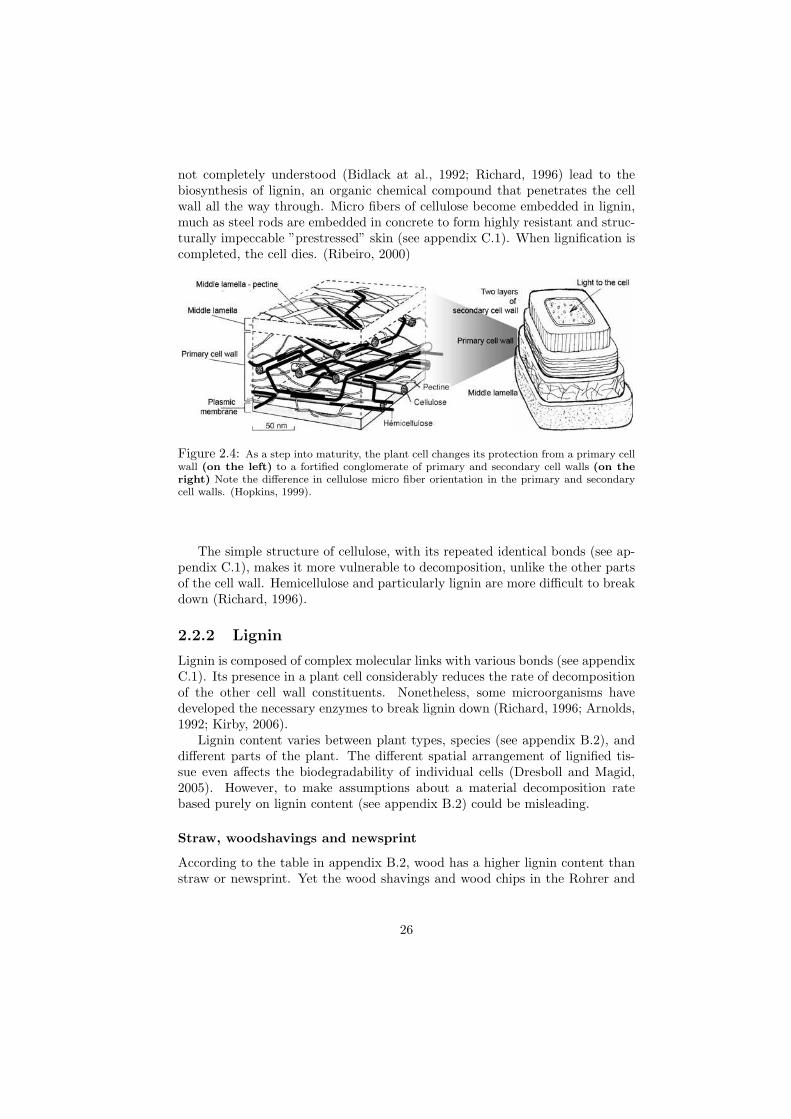
not completely understood (Bidlack at al., 1992; Richard, 1996) lead to thebiosynthesis of lignin, an organic chemical compound that penetrates the cellwall all the way through. Micro fibers of cellulose become embedded in lignin,much as steel rods are embedded in concrete to form highly resistant and struc-turally impeccable ”prestressed” skin (see appendix C.1). When lignification iscompleted, the cell dies. (Ribeiro, 2000)
Figure 2.4: As a step into maturity, the plant cell changes its protection from a primary cellwall (on the left) to a fortified conglomerate of primary and secondary cell walls (on theright) Note the difference in cellulose micro fiber orientation in the primary and secondarycell walls. (Hopkins, 1999).
The simple structure of cellulose, with its repeated identical bonds (see ap-pendix C.1), makes it more vulnerable to decomposition, unlike the other partsof the cell wall. Hemicellulose and particularly lignin are more difficult to breakdown (Richard, 1996).
2.2.2 Lignin
Lignin is composed of complex molecular links with various bonds (see appendixC.1). Its presence in a plant cell considerably reduces the rate of decompositionof the other cell wall constituents. Nonetheless, some microorganisms havedeveloped the necessary enzymes to break lignin down (Richard, 1996; Arnolds,1992; Kirby, 2006).
Lignin content varies between plant types, species (see appendix B.2), anddifferent parts of the plant. The different spatial arrangement of lignified tis-sue even affects the biodegradability of individual cells (Dresboll and Magid,2005). However, to make assumptions about a material decomposition ratebased purely on lignin content (see appendix B.2) could be misleading.
Straw, woodshavings and newsprint
According to the table in appendix B.2, wood has a higher lignin content thanstraw or newsprint. Yet the wood shavings and wood chips in the Rohrer and
26
Heimlich (1998) experiment showed the fastest decomposition. The reason forthis could be the better accessibility of the broken wooden particles to microor-ganisms and thus better availability of nutrients. Dresboll and Magid (2005)proved that broken tissue enhances further degradation and reduces the stabil-ity of the material. Furthermore, intact straw, with its large pores, facilitatesfast drainage of moisture into the soil, while small wood shavings and woodchips tend to retain water creating a wet environment ideal for microorganismgrowth.
Hemp and miscanthus grass
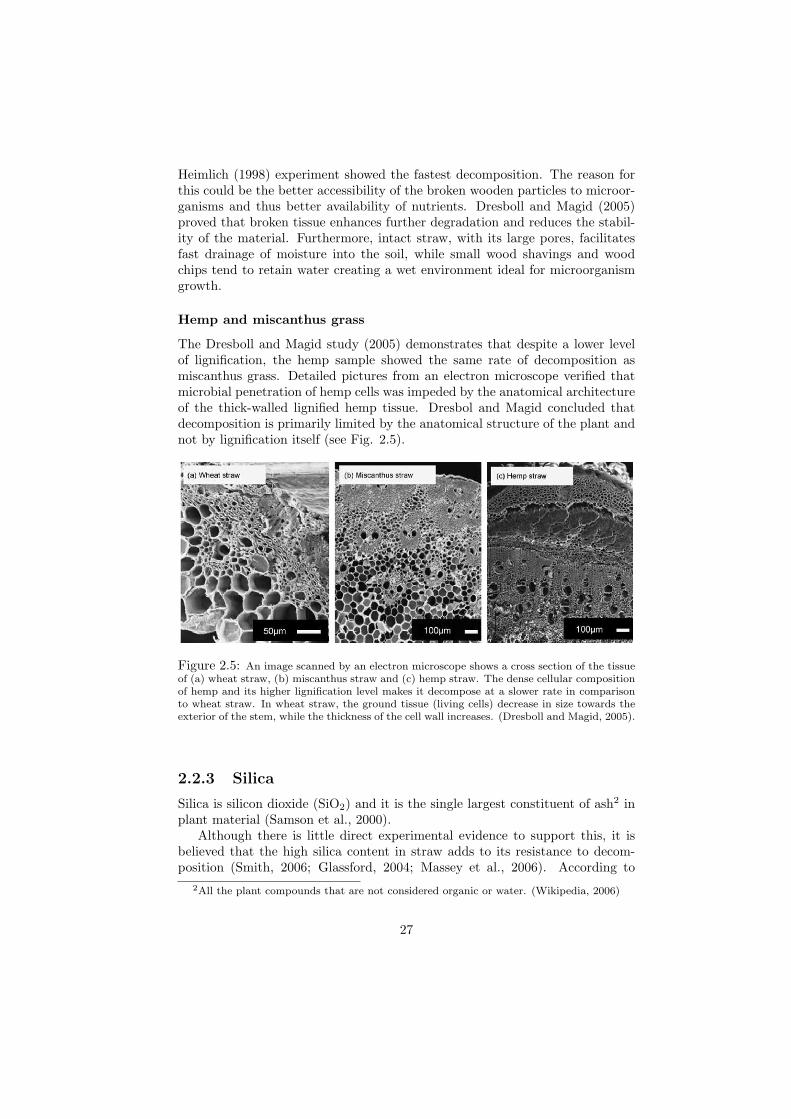
The Dresboll and Magid study (2005) demonstrates that despite a lower levelof lignification, the hemp sample showed the same rate of decomposition asmiscanthus grass. Detailed pictures from an electron microscope verified thatmicrobial penetration of hemp cells was impeded by the anatomical architectureof the thick-walled lignified hemp tissue. Dresbol and Magid concluded thatdecomposition is primarily limited by the anatomical structure of the plant andnot by lignification itself (see Fig. 2.5).
Figure 2.5: An image scanned by an electron microscope shows a cross section of the tissueof (a) wheat straw, (b) miscanthus straw and (c) hemp straw. The dense cellular compositionof hemp and its higher lignification level makes it decompose at a slower rate in comparisonto wheat straw. In wheat straw, the ground tissue (living cells) decrease in size towards theexterior of the stem, while the thickness of the cell wall increases. (Dresboll and Magid, 2005).
2.2.3 Silica
Silica is silicon dioxide (SiO2) and it is the single largest constituent of ash2 inplant material (Samson et al., 2000).
Although there is little direct experimental evidence to support this, it isbelieved that the high silica content in straw adds to its resistance to decom-position (Smith, 2006; Glassford, 2004; Massey et al., 2006). According to
2All the plant compounds that are not considered organic or water. (Wikipedia, 2006)
27
International Rice Research Institute (2004), rice straw does not decompose asreadily as other straw, such as wheat or barley, due to much higher silica content(see Appendix B.2).
The majority of silica enters the cereal plant through the intake of monosilicicacid in water, and is deposited within a plant mainly in its leaves. Varying silicacontents between straw species is often related to the photosynthetic mechanism,and to the amount of water being transpired by the plant. Decreased waterusage reduces the intake of monosilicic acid, resulting in lower silica levels in aplant. Within species, the water use efficiency will fluctuate depending on theregion in which the crops are grown, and on the soil type (Samson et al., 2000).
In their paper, Samson et al. (2000) mention that silica levels in plantmaterial are highly influenced by soil type. Clay soils have higher monosilicicacid content than sandy soils, and therefore produce plants with higher silicalevels.
Professional straw bale builder Tom Rijven observed that organic straw hasa higher resistance to water than its nonorganic counterparts. According toRijven, the reason is that the silica film on the surface of the stems and leavesacts as a natural water repellent (see Appendix A.2). Nevertheless, Rijvenobserved that when left in the sun for a while, organic straw looses its waterrepelling capacity. This indicates that the protective film might be based onnatural waxes rather than silica. However, the natural water resistance of strawas well as question of to what extent the silica content of straw is related to itsdecomposition should be the objective of future studies.
2.2.4 Nutrients
Straw, like any other organic matter, contains enough nutrients to support mi-crobial life. It provides microorganisms with carbon, hydrogen, nitrogen andother nutrients they need (Brandon et al., 1995).
Nitrogen
Nitrogen seems to be the nutrient preferred by many micoorganisms.Nitrogen is an essential constituent of the amino acids that make proteins
in organic cells. It is also a critical part of chlorophyll and is indispensable inenzymes, hormones, vitamins as well as nucleic acids DNA and RNA (Kummer,2004).
Animals and humans get their nitrogen from plants and microorganisms,which have the ability to convert simple forms of mineral nitrogen into organicnitrogen compounds. Plants and most microorganisms take the nitrogen thatthey require for growth from dead organic tissue (Kummer, 2004).
Straw has a relatively low nitrogen content (see Appendix B.2). Dresboll andMagid (2005) observed that the microbes decomposing straw in a compost piletook the nitrogen necessary for progressive decomposition of straw from the sur-rounding nitrogen-rich clover-grass tissue. Microorganisms in straw bales grow
28
more slowly and sustain smaller populations in comparison to microorganismsin clover-grass compost (Summers et al., 2003).
Other nutrients
Other nutrients like carbon, phosphorus, magnesium, e.g. don’t typically limitstraw decomposition (Summers et al., 2003).
Tissue
Different tissues contain different concentrations of nutrients, thus the quantityof nutrients varies within a single plant (Orskov, 2002).
Yang et al. (2001, p.79) write that the quality of tissue, tissue age, tissuephysiological status, and the presence of tissue damage affects the compositionand quantity of nutrients.
There are many different tissues in a single plant. Photosynthetic tissue, forexample, is one of the most nutrient-rich tissues (Dresboll and Magid, 2005).The greener the straw, the more susceptible to decomposition (Summers et al.2003).
Nodes contain a special tissue that is capable of developing into new plantparts. Because this tissue is more vulnerable to decomposition, nodes have ahigher rate of degradation than stems (Orskov, 2002).
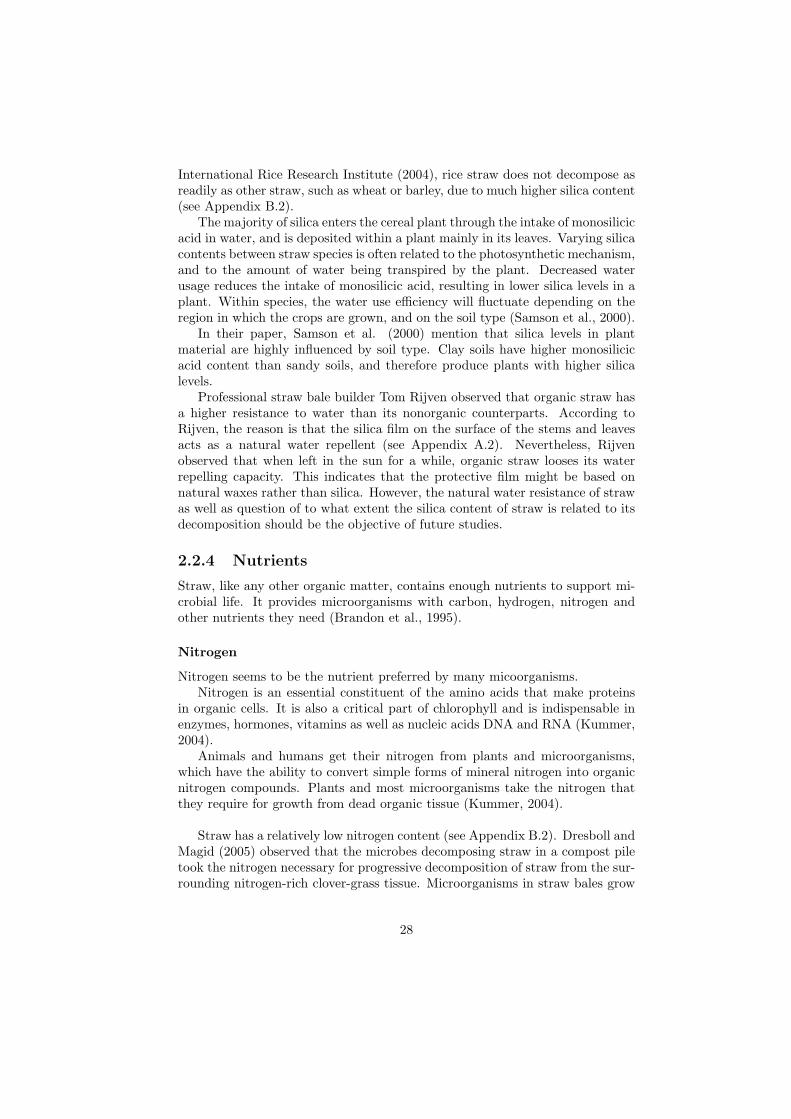
In cereals like wheat, oats, rye and barley, the leaves have up to twice asmany nutrients as the stems. Rice, on the other hand, has stems that have aslightly higher nutritive value compared to leaves. It is clear that the amountof leaves and nodes in the straw during harvesting influences the rate of strawdecomposition (Orskov, 2002) (see the Table 2.1).
Table 2.1: Average morphological fractions of various cereal straws. From Orskov (2002).
In order to increase stem content and reduce the leaf content of grasses,overwintering is used in the pulp and paper industries (Samson et al., 2000).Perhaps in the future, when the market for straw bale housing becomes sub-stantial, similar strategies will be developed for the production of ideal buildingstraw.
29

Water soluble nutrients in soil
Orskov (2002) wondered why the same cereal species shows up to a 30% differ-ence in degradability from year to year until he compared degradability ratesto the content of water soluble nutrients in the soil. If the amount of solublenutrients in a particular year was higher, the straw was more easily degradable.This has a further implication in fertilization.
Fertilization
In their study, Kaboneka et al. (2002) show that fertilizer (depending on type)increases the decomposition rate of straw by up to 150% (see appendix B.3 andB.4). There is also evidence that stems benefit much more from chemical treat-ment than leaves (Orskov, 2002), which means that with increasing fertilization,the difference in degradability between stems and leaves of cereals (except rice— see above) decreases.
Organic straw decomposition
According to Kaboneka et al. (2002), untreated straw has the lowest rate ofdecomposition. Though organic straw might have more microorganisms on itssurface due to lack of fungicides, it is apparently less attractive food.
The greater silica/wax build up on the surface of organic straw (see Section2.2.3) and its effect on water repulsion needs to be studied further.
2.3 Environment in straw bale walls
Once the straw is in the wall, the overall building structure should provide anenvironment which will prevent decay. This Section reviews studies describingthe interactions of microorganisms on straw with their environment. A goodunderstanding of the physical and chemical criteria responsible for straw decaywill give the builder an idea of how to make the life of microorganisms inside ofstraw bale walls as difficult as possible.
2.3.1 Fungicides
Straw in a wall can contain two types of fungicides:
• One is usually sprayed over the field to protect the straw against disease.This fungicide inhabits the straw surface as well as the straw structuredue to cellular absorption (ITCF, 2002). The International Programmeon Chemical Safety (1987) mentions a Swedish study which shows thatthe decomposition of straw in the field was not affected in clay soils byannual applications of up to 2 kg/ha of fungicide. More than 2kg/haresulted in slightly inhibited initial stages of decomposition. Two otherstudies described by Liebich (1997) and Mustin (1987) proved that unless
30
the fungicide was applied on straw earlier than three weeks before test,its effect was substantially degraded by straw metabolism and weather.
• The other type of fungicide is largely ignored not only by researchers butalso by most builders. It is a fungicide that is applied in order to protectthe straw inside a wall against vermin and decomposition. There are prob-ably many examples of such preventive care around the world, but onlyfew are known to the author. Platts (1997) in his study mentions strawbales powdered with lime in one building, the bales in Samuel Courge’sstraw bale house in the French Jura were treated with powdered lime aswell.
The effect of a fungicide application to a straw in a wall on the overalldurability of construction is unknown. One might theorize that fungicidecould have a powerful influence on the growth of microorganisms in a wall.
Hoflich (1977) writes that fungicides are most effective in eliminating fungi,in comparison to bacteria and yeast, and that it is actually fungi which areprimarily responsible for the decomposition of straw.
”An inhibition of the decomposition of straw by an application offungicides is possible.” he writes,
”In order to stop the decomposition of straw completely it is neces-sary to inhibit both the physiologically active bacteria and the fungifor a longer period of time. Combinations of bactericides and fungi-cides can bring about synergistic decomposition retarding effects.”(Hoflich, 1977)
Straw in the commercially produced boards ”STRAMIT” (compressed strawpanels) is routinely treated with a borax based substance (Bares, 2003), as is cel-lulose insulation. Timber shows a remarkably better resistance to harmful fungiwhen treated with number of available chemicals (Viitanen, 2000). Fungicideshave become an unremarkable part of the contemporary building industry.
One of the reasons why fungicides aren’t commonly used in straw bale con-struction is often their chemical origin. The use of natural material like strawleads to a higher environmental sensibility. Once people choose straw bales forthe construction of their home, it is quite easy to employ other natural materi-als (like timber, earth, etc.) in the creation of non-toxic indoor environments.In the eyes of the occupants of straw bale houses, fungicide could be a poisonwhich could spoil the ”healthy home” objective. Nevertheless fungicides likeborax, boron, and lime are of natural origin3. Further research is necessary toproperly evaluate the potential of such easy and cheap solutions which couldlead to an overall improvement in straw bale house durability.
3During his pilot study, Platts (1997) observed that powdered lime applied to straw balesrapidly reduces their bond with lime plaster.
31
Another reason why the use of fungicides is overlooked could be the beliefthat good design, well executed details, faultless plaster (or wall cover) andregular maintenance are sufficient to keep the straw bales in perfect conditionindefinitely.
2.3.2 Oxygen
Straw decays most readily in the presence of oxygen. At the right tempera-ture and moisture levels the aerobic decomposition process may be quite rapid(Brandon et al., 1995).
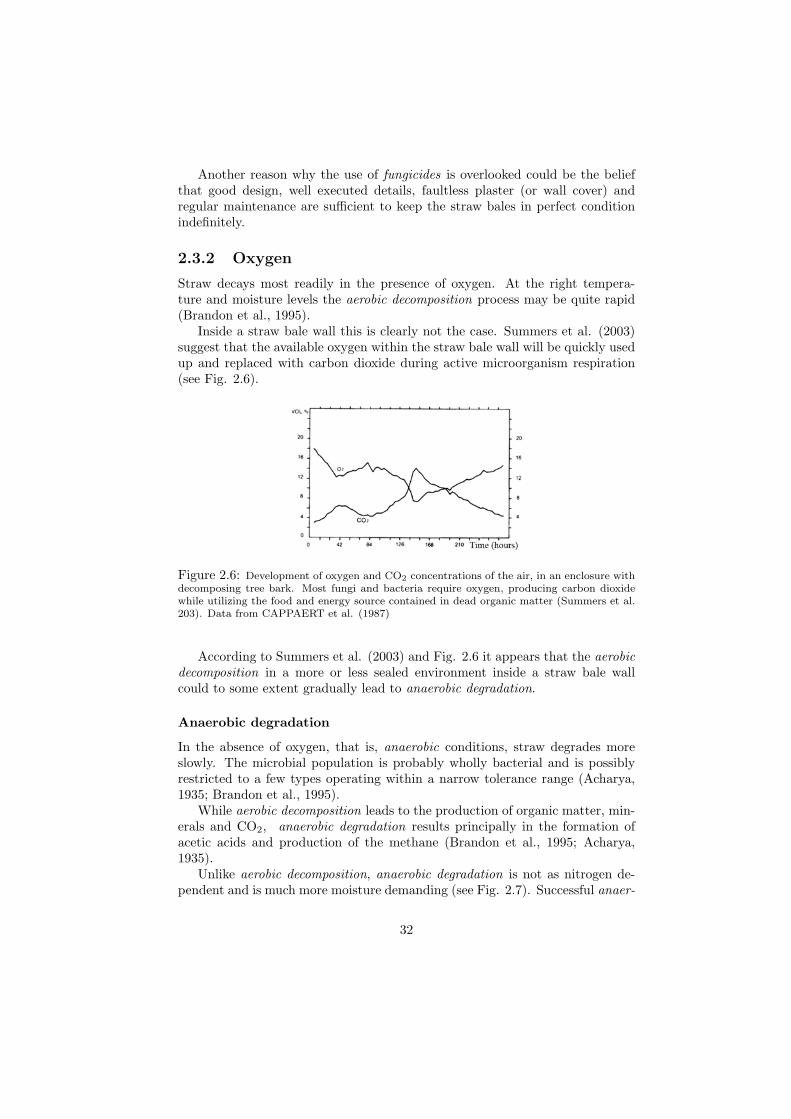
Inside a straw bale wall this is clearly not the case. Summers et al. (2003)suggest that the available oxygen within the straw bale wall will be quickly usedup and replaced with carbon dioxide during active microorganism respiration(see Fig. 2.6).
Figure 2.6: Development of oxygen and CO2 concentrations of the air, in an enclosure withdecomposing tree bark. Most fungi and bacteria require oxygen, producing carbon dioxidewhile utilizing the food and energy source contained in dead organic matter (Summers et al.203). Data from CAPPAERT et al. (1987)
According to Summers et al. (2003) and Fig. 2.6 it appears that the aerobicdecomposition in a more or less sealed environment inside a straw bale wallcould to some extent gradually lead to anaerobic degradation.
Anaerobic degradation
In the absence of oxygen, that is, anaerobic conditions, straw degrades moreslowly. The microbial population is probably wholly bacterial and is possiblyrestricted to a few types operating within a narrow tolerance range (Acharya,1935; Brandon et al., 1995).
While aerobic decomposition leads to the production of organic matter, min-erals and CO2, anaerobic degradation results principally in the formation ofacetic acids and production of the methane (Brandon et al., 1995; Acharya,1935).
Unlike aerobic decomposition, anaerobic degradation is not as nitrogen de-pendent and is much more moisture demanding (see Fig. 2.7). Successful anaer-
32
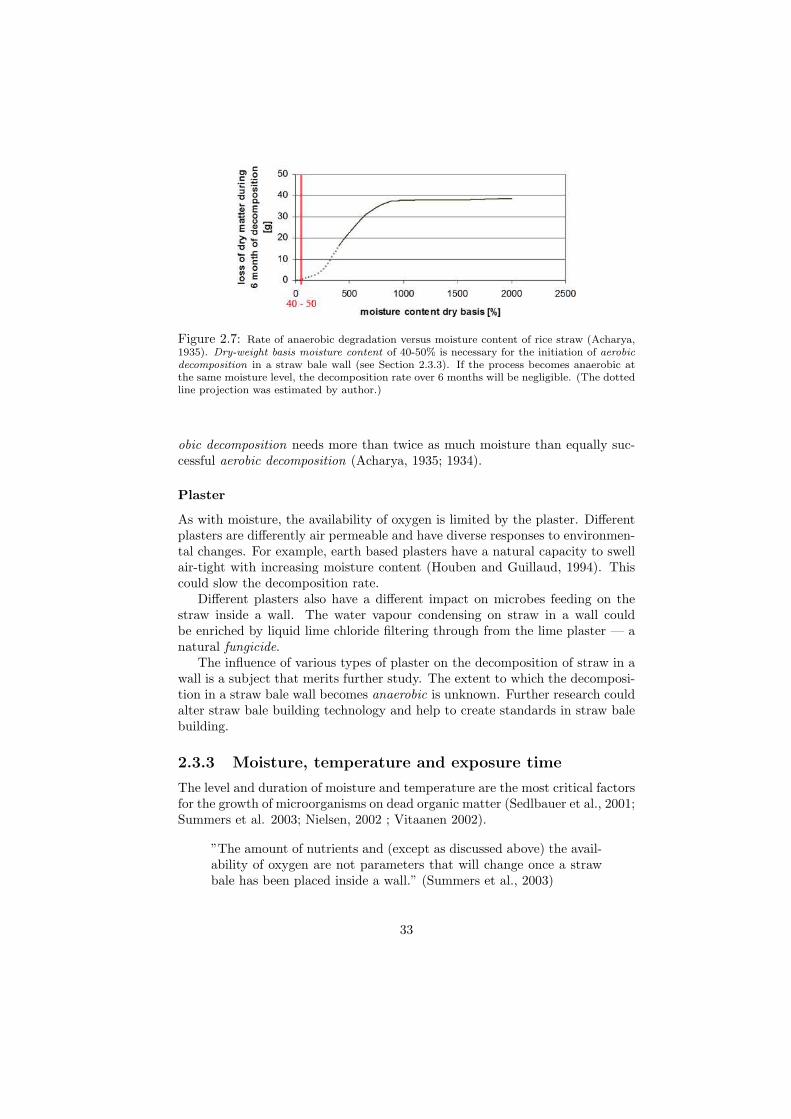
Figure 2.7: Rate of anaerobic degradation versus moisture content of rice straw (Acharya,1935). Dry-weight basis moisture content of 40-50% is necessary for the initiation of aerobicdecomposition in a straw bale wall (see Section 2.3.3). If the process becomes anaerobic atthe same moisture level, the decomposition rate over 6 months will be negligible. (The dottedline projection was estimated by author.)
obic decomposition needs more than twice as much moisture than equally suc-cessful aerobic decomposition (Acharya, 1935; 1934).
Plaster
As with moisture, the availability of oxygen is limited by the plaster. Differentplasters are differently air permeable and have diverse responses to environmen-tal changes. For example, earth based plasters have a natural capacity to swellair-tight with increasing moisture content (Houben and Guillaud, 1994). Thiscould slow the decomposition rate.
Different plasters also have a different impact on microbes feeding on thestraw inside a wall. The water vapour condensing on straw in a wall couldbe enriched by liquid lime chloride filtering through from the lime plaster — anatural fungicide.
The influence of various types of plaster on the decomposition of straw in awall is a subject that merits further study. The extent to which the decomposi-tion in a straw bale wall becomes anaerobic is unknown. Further research couldalter straw bale building technology and help to create standards in straw balebuilding.
2.3.3 Moisture, temperature and exposure time
The level and duration of moisture and temperature are the most critical factorsfor the growth of microorganisms on dead organic matter (Sedlbauer et al., 2001;Summers et al. 2003; Nielsen, 2002 ; Vitaanen 2002).
”The amount of nutrients and (except as discussed above) the avail-ability of oxygen are not parameters that will change once a strawbale has been placed inside a wall.” (Summers et al., 2003)
33
Moisture and temperature in a wall, however, change in time according toexternal environment (weather) and interior conditions.
Time
It takes time for a previously dry spore to germinate. It takes even longer foran older spore. After a material is saturated with water, it takes 4 - 10 daysbefore it is wholly covered with fungi (Nielsen, 2002). When the saturationis sustained, the growth becomes rapid. When the moisture level decreasesslightly, the growth rate slows down significantly (Summers et al., 2003). Andif the moisture levels after this point drop significantly, it will discomfort, butnot kill the microorganisms (Padfield, 2002).
In reality, conditions fluctuate. The exterior face of an unshaded southernwall experiences the most extreme fluctuations, where wetting and drying sup-ported by rapid changes of temperature vary greatly within the course of oneday. The effect of variative moisture concentration on the growth of fungi wasobserved by Adan. The summary of his research by Nielsen (2002) reveals thathigh moisture levels alternating with low to medium moisture levels resulted infairly constant growth. The dramatic increase of fungal growth was recordedonly when these changes took place within a range of high moisture levels.
Temperature
At about 0◦C, the freezing point of water, microbial life dies out.Most of the fungi and bacteria that can be found inside a straw bale wall
consider a temperature between 20 - 45◦C optimal for their growth (Summers etal., 2003). This optimal temperature range differs with each microbial speciesand is closely related to moisture levels (Arango, 1981).
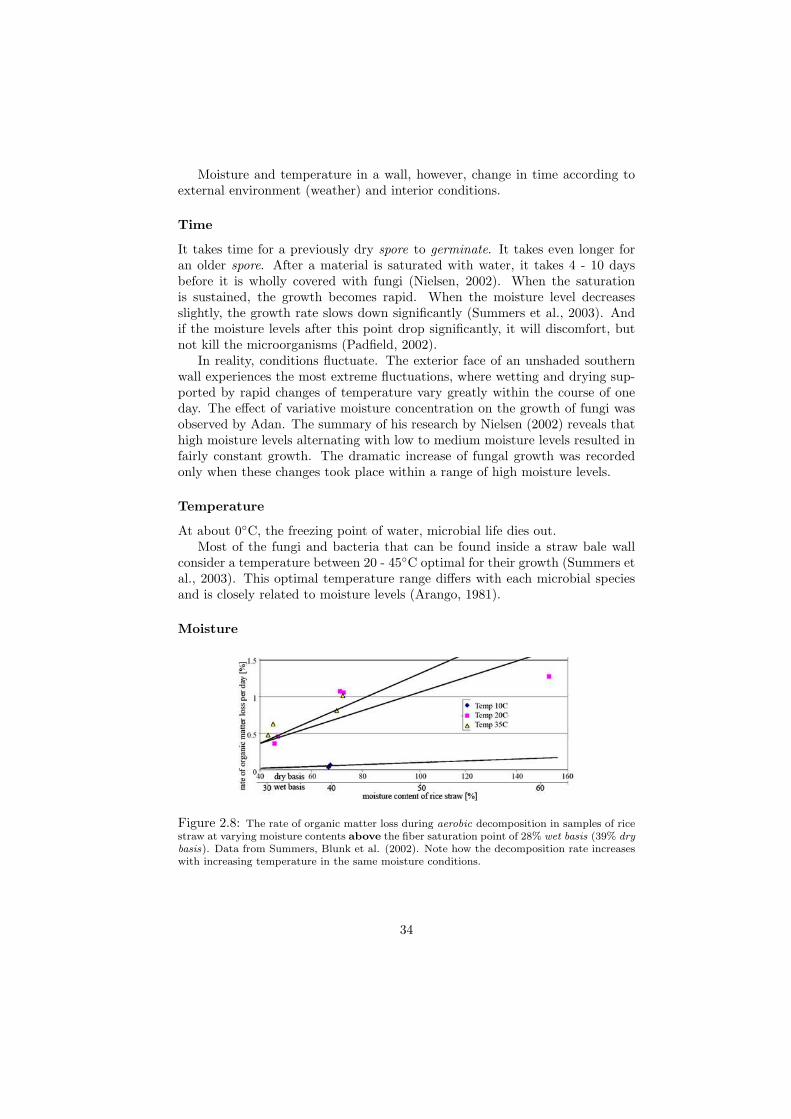
Moisture
Figure 2.8: The rate of organic matter loss during aerobic decomposition in samples of ricestraw at varying moisture contents above the fiber saturation point of 28% wet basis (39% drybasis). Data from Summers, Blunk et al. (2002). Note how the decomposition rate increaseswith increasing temperature in the same moisture conditions.
34
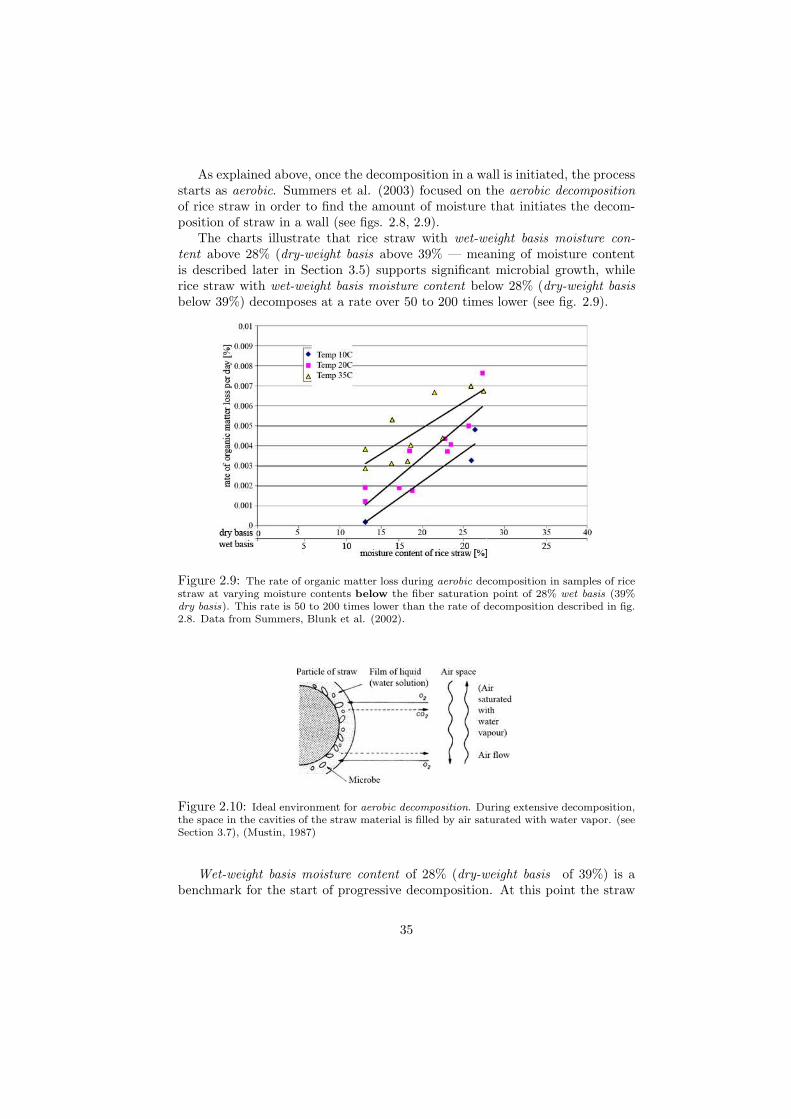
As explained above, once the decomposition in a wall is initiated, the processstarts as aerobic. Summers et al. (2003) focused on the aerobic decompositionof rice straw in order to find the amount of moisture that initiates the decom-position of straw in a wall (see figs. 2.8, 2.9).
The charts illustrate that rice straw with wet-weight basis moisture con-tent above 28% (dry-weight basis above 39% — meaning of moisture contentis described later in Section 3.5) supports significant microbial growth, whilerice straw with wet-weight basis moisture content below 28% (dry-weight basisbelow 39%) decomposes at a rate over 50 to 200 times lower (see fig. 2.9).
Figure 2.9: The rate of organic matter loss during aerobic decomposition in samples of ricestraw at varying moisture contents below the fiber saturation point of 28% wet basis (39%dry basis). This rate is 50 to 200 times lower than the rate of decomposition described in fig.2.8. Data from Summers, Blunk et al. (2002).
Figure 2.10: Ideal environment for aerobic decomposition. During extensive decomposition,the space in the cavities of the straw material is filled by air saturated with water vapor. (seeSection 3.7), (Mustin, 1987)
Wet-weight basis moisture content of 28% (dry-weight basis of 39%) is abenchmark for the start of progressive decomposition. At this point the straw
35
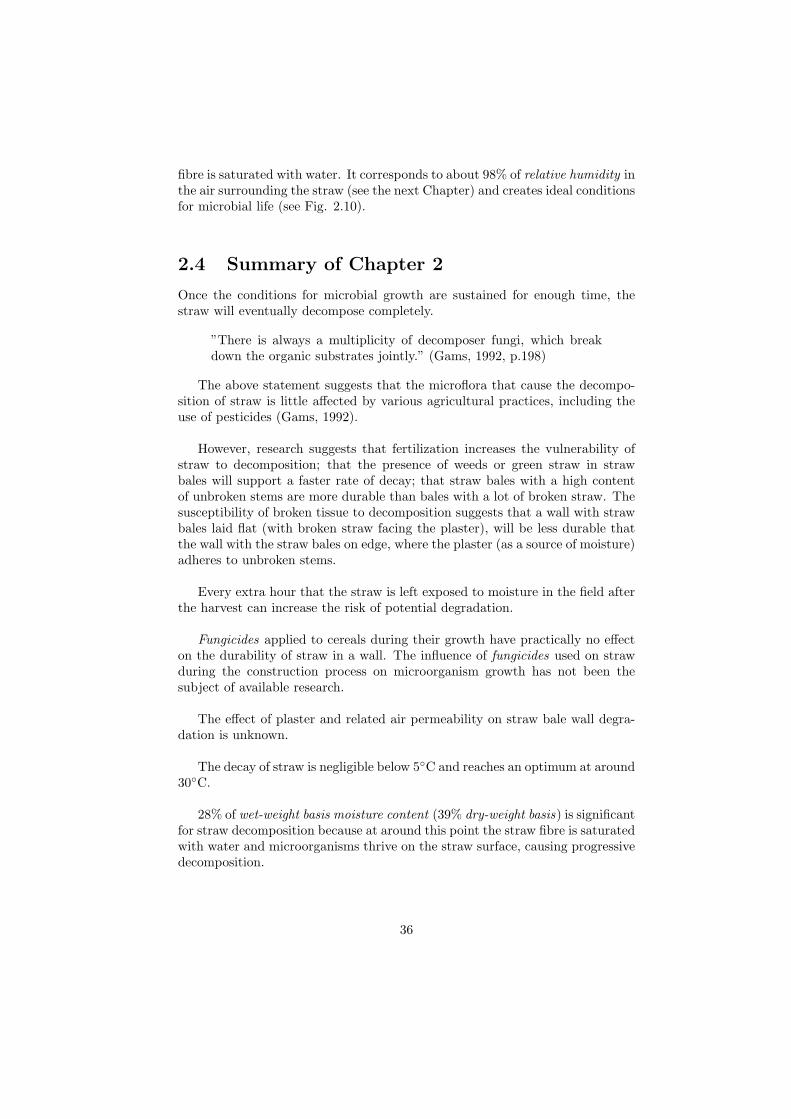
fibre is saturated with water. It corresponds to about 98% of relative humidity inthe air surrounding the straw (see the next Chapter) and creates ideal conditionsfor microbial life (see Fig. 2.10).
2.4 Summary of Chapter 2
Once the conditions for microbial growth are sustained for enough time, thestraw will eventually decompose completely.
”There is always a multiplicity of decomposer fungi, which breakdown the organic substrates jointly.” (Gams, 1992, p.198)
The above statement suggests that the microflora that cause the decompo-sition of straw is little affected by various agricultural practices, including theuse of pesticides (Gams, 1992).
However, research suggests that fertilization increases the vulnerability ofstraw to decomposition; that the presence of weeds or green straw in strawbales will support a faster rate of decay; that straw bales with a high contentof unbroken stems are more durable than bales with a lot of broken straw. Thesusceptibility of broken tissue to decomposition suggests that a wall with strawbales laid flat (with broken straw facing the plaster), will be less durable thatthe wall with the straw bales on edge, where the plaster (as a source of moisture)adheres to unbroken stems.
Every extra hour that the straw is left exposed to moisture in the field afterthe harvest can increase the risk of potential degradation.
Fungicides applied to cereals during their growth have practically no effecton the durability of straw in a wall. The influence of fungicides used on strawduring the construction process on microorganism growth has not been thesubject of available research.
The effect of plaster and related air permeability on straw bale wall degra-dation is unknown.
The decay of straw is negligible below 5◦C and reaches an optimum at around30◦C.
28% of wet-weight basis moisture content (39% dry-weight basis) is significantfor straw decomposition because at around this point the straw fibre is saturatedwith water and microorganisms thrive on the straw surface, causing progressivedecomposition.
36
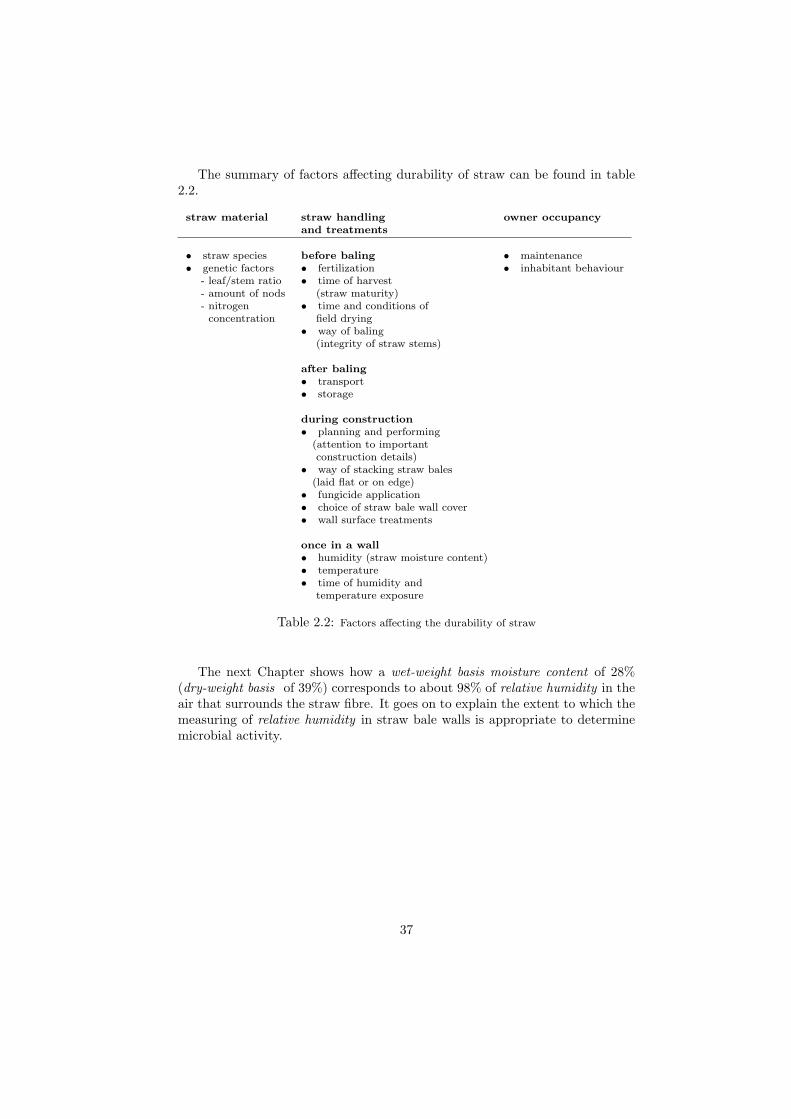
The summary of factors affecting durability of straw can be found in table2.2.
straw material straw handling owner occupancyand treatments
• straw species before baling • maintenance• genetic factors • fertilization • inhabitant behaviour
- leaf/stem ratio • time of harvest- amount of nods (straw maturity)- nitrogen • time and conditions of
concentration field drying• way of baling
(integrity of straw stems)
after baling• transport• storage
during construction• planning and performing
(attention to importantconstruction details)
• way of stacking straw bales(laid flat or on edge)
• fungicide application• choice of straw bale wall cover• wall surface treatments
once in a wall• humidity (straw moisture content)• temperature• time of humidity and
temperature exposure
Table 2.2: Factors affecting the durability of straw
The next Chapter shows how a wet-weight basis moisture content of 28%(dry-weight basis of 39%) corresponds to about 98% of relative humidity in theair that surrounds the straw fibre. It goes on to explain the extent to which themeasuring of relative humidity in straw bale walls is appropriate to determinemicrobial activity.
37
Chapter 3
Relative humidity as acritical factor determiningthe condition of straw
Having considered the causes of straw rot as being largely influenced by themoisture content of straw, it is now necessary to introduce the indicator ofmoisture level inside the straw bale wall.
This Chapter explains why relative humidity is the best indicator of themoisture content of straw and points out its limitations on determining mi-croorganism growth. It begins with an outline of basic physics, followed by adetailed description of the interaction between water molecules and materials,and finally, between water molecules and microorganisms.
3.1 Kinetic (thermal) and electrical energy
All matter consists of small particles called atoms. Atoms vibrate above thetemperature of absolute zero. The higher the temperature of a body, the fasterits atoms move. The kinetic energy of those vibrations is called thermal energy(Boyle 2004).
Besides kinetic energy, atoms are also affected by electrical energy. In eachatom, a cloud of electrons constantly moves around the electrically charged cen-tral nuclei. They are held in the vicinity of the nuclei by an opposing electricalcharge. However, positive and negative electrical forces in one atom are usu-ally not balanced. The atoms with unbalanced consequential electrical chargesare strong magnets. They can be attracted to other unbalanced atoms withopposing consequential electrical charges to form a molecule (Boyle, 2004).
38
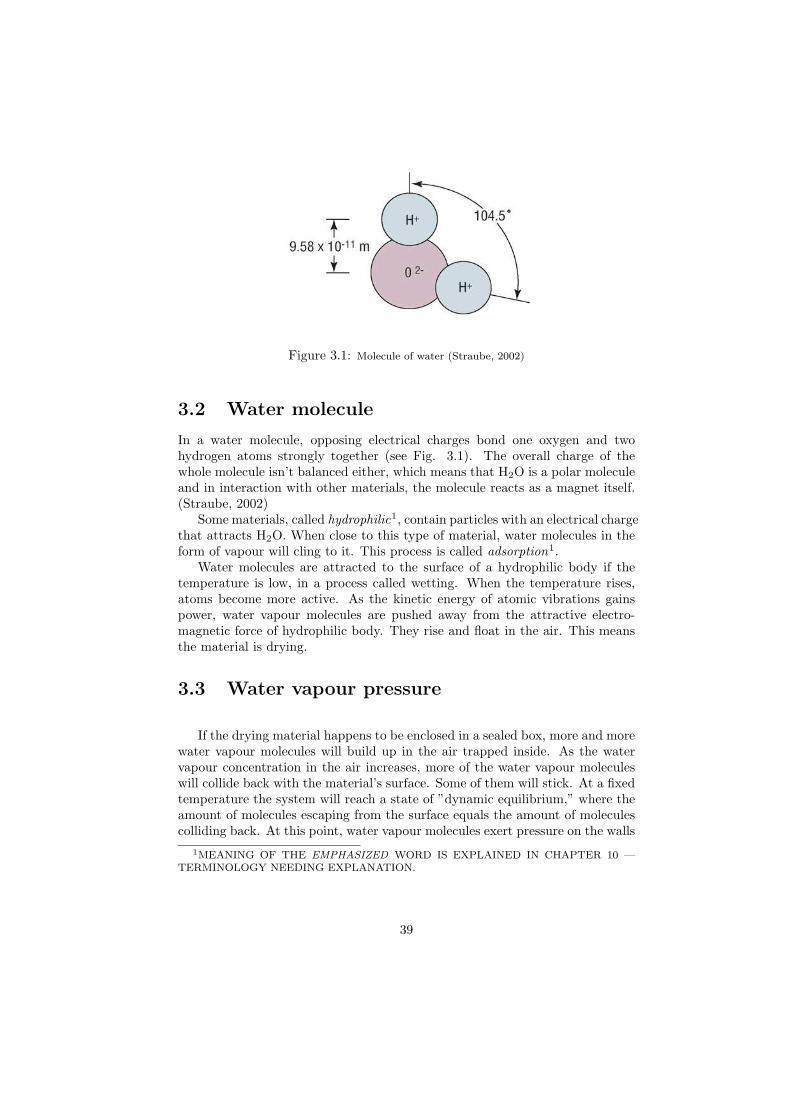
Figure 3.1: Molecule of water (Straube, 2002)
3.2 Water molecule
In a water molecule, opposing electrical charges bond one oxygen and twohydrogen atoms strongly together (see Fig. 3.1). The overall charge of thewhole molecule isn’t balanced either, which means that H2O is a polar moleculeand in interaction with other materials, the molecule reacts as a magnet itself.(Straube, 2002)
Some materials, called hydrophilic1, contain particles with an electrical chargethat attracts H2O. When close to this type of material, water molecules in theform of vapour will cling to it. This process is called adsorption1.
Water molecules are attracted to the surface of a hydrophilic body if thetemperature is low, in a process called wetting. When the temperature rises,atoms become more active. As the kinetic energy of atomic vibrations gainspower, water vapour molecules are pushed away from the attractive electro-magnetic force of hydrophilic body. They rise and float in the air. This meansthe material is drying.
3.3 Water vapour pressure
If the drying material happens to be enclosed in a sealed box, more and morewater vapour molecules will build up in the air trapped inside. As the watervapour concentration in the air increases, more of the water vapour moleculeswill collide back with the material’s surface. Some of them will stick. At a fixedtemperature the system will reach a state of ”dynamic equilibrium,” where theamount of molecules escaping from the surface equals the amount of moleculescolliding back. At this point, water vapour molecules exert pressure on the walls
1MEANING OF THE EMPHASIZED WORD IS EXPLAINED IN CHAPTER 10 —TERMINOLOGY NEEDING EXPLANATION.
39
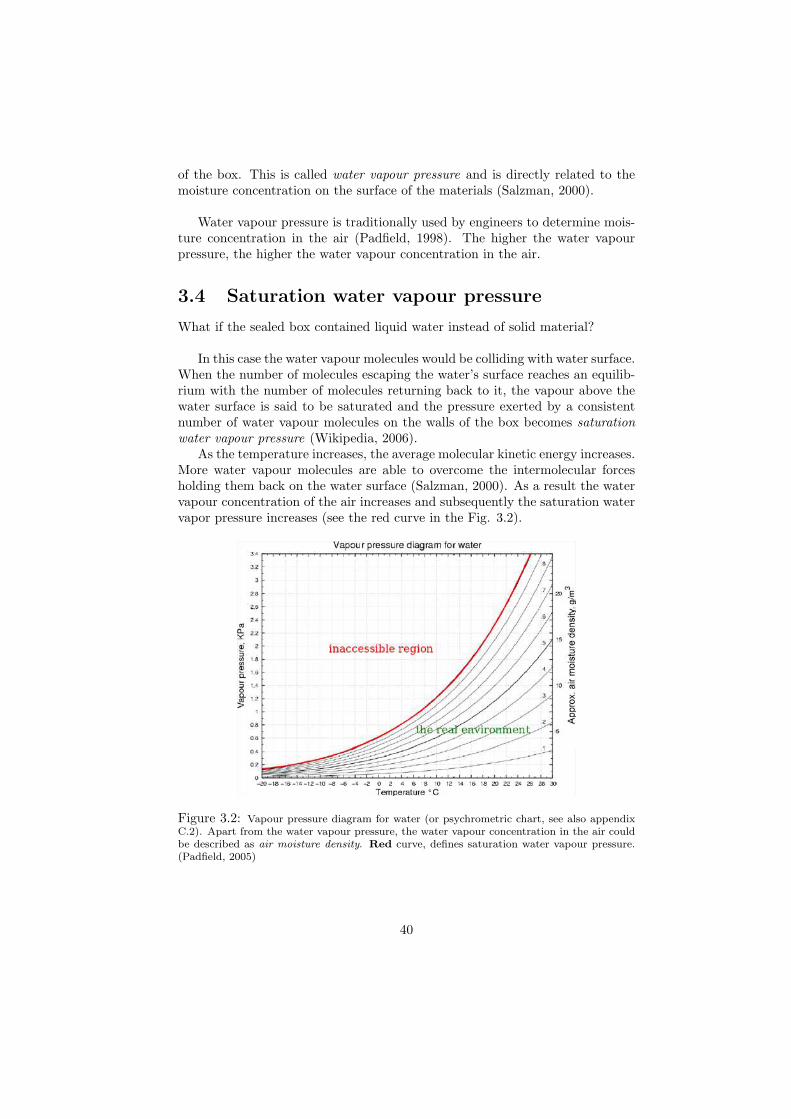
of the box. This is called water vapour pressure and is directly related to themoisture concentration on the surface of the materials (Salzman, 2000).
Water vapour pressure is traditionally used by engineers to determine mois-ture concentration in the air (Padfield, 1998). The higher the water vapourpressure, the higher the water vapour concentration in the air.
3.4 Saturation water vapour pressure
What if the sealed box contained liquid water instead of solid material?
In this case the water vapour molecules would be colliding with water surface.When the number of molecules escaping the water’s surface reaches an equilib-rium with the number of molecules returning back to it, the vapour above thewater surface is said to be saturated and the pressure exerted by a consistentnumber of water vapour molecules on the walls of the box becomes saturationwater vapour pressure (Wikipedia, 2006).
As the temperature increases, the average molecular kinetic energy increases.More water vapour molecules are able to overcome the intermolecular forcesholding them back on the water surface (Salzman, 2000). As a result the watervapour concentration of the air increases and subsequently the saturation watervapor pressure increases (see the red curve in the Fig. 3.2).
Figure 3.2: Vapour pressure diagram for water (or psychrometric chart, see also appendixC.2). Apart from the water vapour pressure, the water vapour concentration in the air couldbe described as air moisture density. Red curve, defines saturation water vapour pressure.(Padfield, 2005)
40
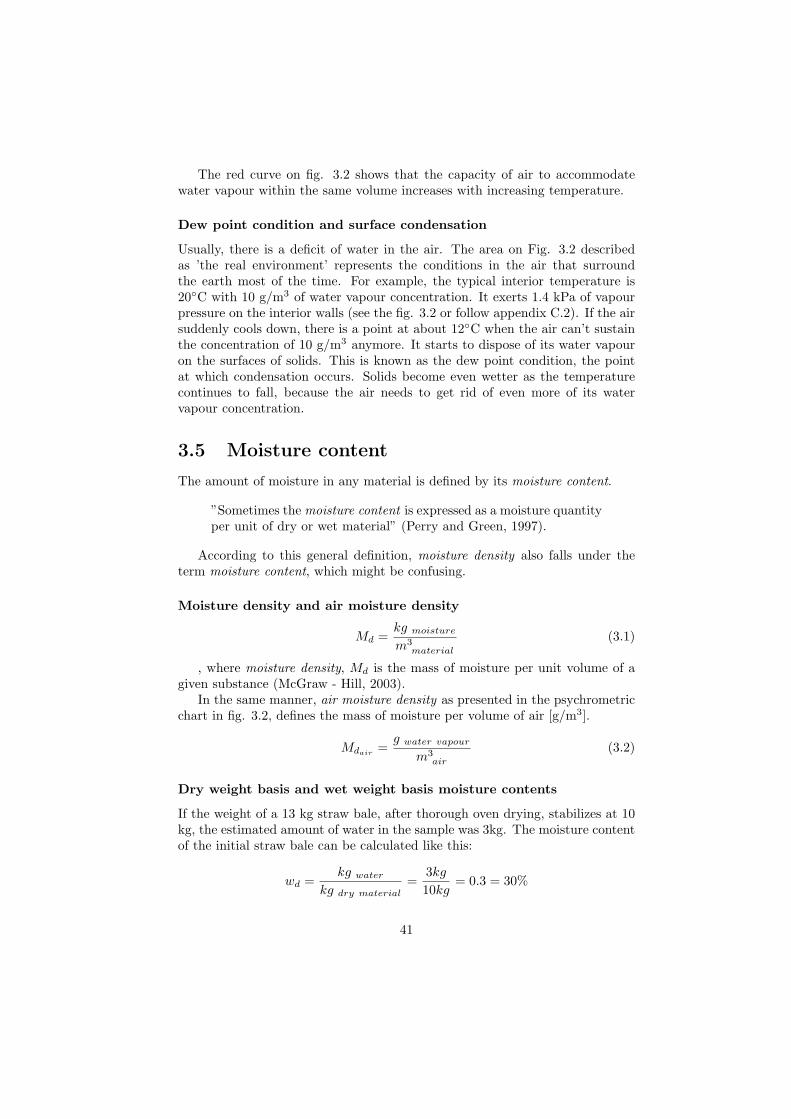
The red curve on fig. 3.2 shows that the capacity of air to accommodatewater vapour within the same volume increases with increasing temperature.
Dew point condition and surface condensation
Usually, there is a deficit of water in the air. The area on Fig. 3.2 describedas ’the real environment’ represents the conditions in the air that surroundthe earth most of the time. For example, the typical interior temperature is20◦C with 10 g/m3 of water vapour concentration. It exerts 1.4 kPa of vapourpressure on the interior walls (see the fig. 3.2 or follow appendix C.2). If the airsuddenly cools down, there is a point at about 12◦C when the air can’t sustainthe concentration of 10 g/m3 anymore. It starts to dispose of its water vapouron the surfaces of solids. This is known as the dew point condition, the pointat which condensation occurs. Solids become even wetter as the temperaturecontinues to fall, because the air needs to get rid of even more of its watervapour concentration.
3.5 Moisture content
The amount of moisture in any material is defined by its moisture content.
”Sometimes the moisture content is expressed as a moisture quantityper unit of dry or wet material” (Perry and Green, 1997).
According to this general definition, moisture density also falls under theterm moisture content, which might be confusing.
Moisture density and air moisture density
Md =kg moisture
m3material
(3.1)
, where moisture density, Md is the mass of moisture per unit volume of agiven substance (McGraw - Hill, 2003).
In the same manner, air moisture density as presented in the psychrometricchart in fig. 3.2, defines the mass of moisture per volume of air [g/m3].
Mdair =g water vapour
m3air
(3.2)
Dry weight basis and wet weight basis moisture contents
If the weight of a 13 kg straw bale, after thorough oven drying, stabilizes at 10kg, the estimated amount of water in the sample was 3kg. The moisture contentof the initial straw bale can be calculated like this:
wd =kg water
kg dry material=
3kg
10kg= 0.3 = 30%
41
, where wd, represents dry weight basis moisture content.
There is another way to calculate the moisture content of that straw bale:
ww =kg water
kg wet material=
3kg
13kg= 0.23 = 23%
, then ww is wet weight basis moisture content.
• wd, dry weight basis moisture content suggests the quantity of water in amass of dry material
• ww, wet weight basis moisture content represents the quantity of water ina mass of wet material (see the Fig. 3.3).
Figure 3.3: Wet weight basis moisture content versus dry weight basis moisture content.Chart is from Perry and Green (1997)
For the purposes of this thesis it is necessary to distinguish between thetwo kinds of moisture content. Even though it would be logical to prioritizethe dry-weight basis moisture content, as the building industry prefers it, theauthor of this thesis has decided to emphasize wet-weight basis moisture content.According to Summers et al. (2003), most of the moisture meters used by strawbale builders actually measure wet-weight basis moisture content, which is morecommonly used in the food industry and agriculture. Dry-weight basis moisturecontents, where possible, follow in the brackets.
Air moisture content (absolute humidity)
Besides the water vapour pressure and air moisture density, air moisture contentis used to define the amount of water in the air:
H =kg water vapour
kg dry air(3.3)
Dry-weight basis air moisture content is often referred to as absolute humidity(H).
42
3.6 Relative humidity
The process of adsorption, by which material gets wet from the concentration ofwater vapour in the air, was described in sections 3.2 and 3.3. There is certainlya correlation between moisture concentration in the air and the moisture contentof hydrophilic material. Parameters like water vapour pressure, air moisturedensity, or air moisture content tell how much moisture is in the air, but fail totell to what degree the air surrounding a material makes it wet.
Here are two examples:
1. Material in a sufficiently warm environment might remain relatively drydespite high humidity levels.
Water vapour molecules might fill the air excessively, but if their thermalenergy is too high, none of them will stick to the material’s surface. In thatcase water vapour pressure, air moisture density, or air moisture content,will show high readings, but the moisture content of the material willremain low.
2. At low temperatures, even a very low water vapour concentration in theair will make the material wet.
If there are only a few water vapour molecules in the air, at low tem-peratures their kinetic energy might be so low that they will cling to thematerial making it wet. Despite low readings of water vapour pressure,air moisture density, or air moisture content, the moisture content of thematerial will be high.
In addition to water vapour pressure, air moisture density, or air moisturecontent, the researcher needs to know the material’s surface temperature inorder to discover the wetting potential of the water vapour concentration in theair. Only then he is able to classify the dew point condition, for which he needsa psychrometric chart (see appendix C.2). If the dew point condition in the airis approaching, than he knows that the material is getting considerably wet (seethe Section 3.7).
While all the parameters mentioned in the previous three sections describingwater vapour concentration in the air tell only half of what a researcher needsto know, the relative humidity manages to tell the whole story in one figure.
Relative humidity shows clearly how close the air surrounding a material is toa limit (RH = 100%), which manifests itself as dew and fog2 For the straw balebuilder, relative humidity serves as an indicator of potential damage of straw.Summers et al. (2002) showed that extensive straw decomposition appears onlywhen relative humidity of the air in a wall remains above 98% (see Chapter 2).
2When liquid water starts to condense on numerous dust particles in a cold atmosphere,clouds (fog) appear (Thompson, 2000).
43
The percentage of relative humidity is defined by following equation:
RH = 100 ∗ p
ps, (3.4)
where (RH) is percentage of relative humidity, (p) is the partial vapourpressure in air and (ps) is saturation vapour pressure (the vapour pressure ofair above the water’s surface) at a given temperature (Perry and Green, 1997;CIBSE, 2002) .
The relative humidity doesn’t necessarily refer to water vapour pressure.Padfield (1999) considers the units in which the ratio is expressed to be in-significant, because the ratio will always remain the same. However, CIBSE(2002), Guide C, strictly differentiates between the ratio defined by vapor pres-sure (by CIBSE (2002) called Relative Humidity), and the ratio relating to theair moisture content (by CIBSE (2002) called Percentage Saturation). Thosetwo characteristics give slightly different values for the same specific conditions.
For example:
20◦C warm air with 8.85 g/kg of moisture content, exerts 1.4kPa watervapour pressure (CIBSE, 2002)
Temperature = 20◦C
Air moisture content: 8.85 g moisture / kg dry air
(Saturation air moisture content for 20◦C = 14.75 g moisture / kgdry air (CIBSE, 2002))
Percentage saturation = 8.85 g moisture/kg dry air
14.75 g moisture/kg dry air= 60%
Water vapour pressure = 1.415 kPa
(Saturation water vapour pressure for 20◦C = 2.34 kPa (see Appen-dix C.2))
Relative humidity = 1.415 kPa2.34 kPa = 60.56 %
The difference is: 60 - 60.56 = 0.56%. The dataloggers used for the researchof this thesis work with an accuracy ±3.5%3 (LASCAR, 2005). In order tosimplify an already complicated issue, this thesis follows the assumption madeby Padfield (1999), which is accurate enough for its purposes.
Relative humidity has another advantage over water vapour pressure, airmoisture density and air moisture content. It can be easily measured:
• by whirling hygrometer. Relative humidity is defined as a temperaturevalue subtracted from measurements by wet bulb and dry bulb thermome-ters (Thompson, 2000).
3This specifies the overall error in the logged readings, for relative humidity measurementsbetween 20 and 80% RH
44
• by hair hygrometer. This measuring technology is based on the fact thathuman or horse hair changes its length according to relative humidity. Hairmovement is transmitted by levers to the calibrated display. (Singletonand Sainsbury, 1978)
• by capacitive electronic sensors - dataloggers (see Chapter 4).
• by wooden disc moisture probes. The resistance to electric current ismeasured between two wires connected to a wooden disc which absorbsthe moisture from the air. The wetter the wood, the lower the resistance.The relative humidity is then estimated from a calibration in laboratoryconditions (Goodhew et al., 2004).
In addition to showing how close the environment is to dew point condi-tion with a simple device, relative humidity is extremely useful because of itsremarkable relation to moisture content in hygroscopic materials.
3.7 Relative humidity versus moisture contentof hygroscopic materials
Before discussing the reactions of materials to changes in relative humidity, itis important to distinguish between hygroscopic and nonhygroscopic materials.
Nonhygroscopic material is non-absorbent, it remains dry; while hy-groscopic material gets wet in contact with water.
While the inner structure of nonhygroscopic material (e.g. glass, metal)is unaffected by changes in the percentage of relative humidity, hygroscopicmaterial (e.g. wood, brick, straw, plasters, renders, and most other buildingmaterials) tends to attract water vapour molecules from the air at the surfaceof its complicated inner pore system (Kunzel, 1995).
The surface area of hygroscopic material is usually very large. It includes allthe inner pores and capillaries. Straube (2002, p.38) writes that ”the interiorsurface area of gypsum board is about 50 ft2/ounce (164 m2/kg - ed. author);of cement paste about 5000 ft2/ounce (16400 m2/kg - ed. author), and evenmore for wood or cellulose”.
The moisture content of all materials surrounded by air with 0% relativehumidity is zero (Perry and Green, 1997).
From 0% to around 50% relative humidity, hygroscopic materials get wetdue to adsorption, described in detail by Section 3.2.
In contact with air at about 50% relative humidity, water molecules havealready adsorbed to the material’s surface in a layer one or several moleculesthick. Any further increase in relative humidity results in condensation due toa process called capillary condensation (Kunzel, 2004).
45
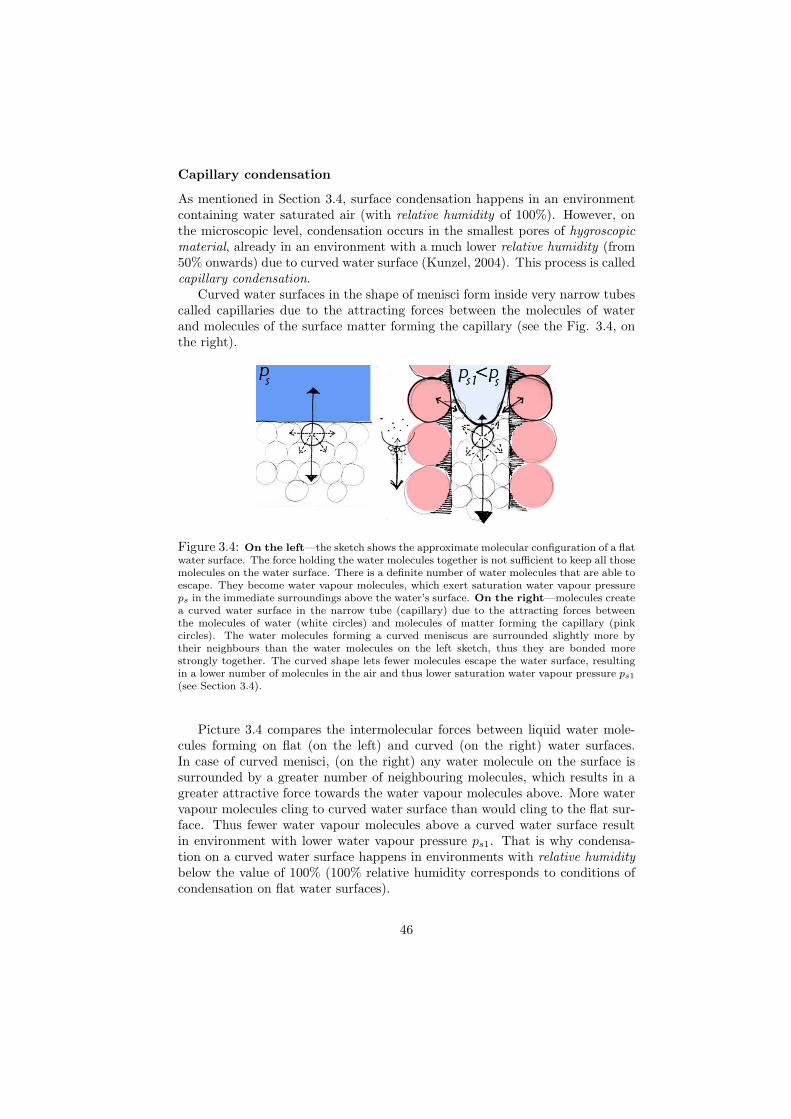
Capillary condensation
As mentioned in Section 3.4, surface condensation happens in an environmentcontaining water saturated air (with relative humidity of 100%). However, onthe microscopic level, condensation occurs in the smallest pores of hygroscopicmaterial, already in an environment with a much lower relative humidity (from50% onwards) due to curved water surface (Kunzel, 2004). This process is calledcapillary condensation.
Curved water surfaces in the shape of menisci form inside very narrow tubescalled capillaries due to the attracting forces between the molecules of waterand molecules of the surface matter forming the capillary (see the Fig. 3.4, onthe right).
Figure 3.4: On the left—the sketch shows the approximate molecular configuration of a flatwater surface. The force holding the water molecules together is not sufficient to keep all thosemolecules on the water surface. There is a definite number of water molecules that are able toescape. They become water vapour molecules, which exert saturation water vapour pressureps in the immediate surroundings above the water’s surface. On the right—molecules createa curved water surface in the narrow tube (capillary) due to the attracting forces betweenthe molecules of water (white circles) and molecules of matter forming the capillary (pinkcircles). The water molecules forming a curved meniscus are surrounded slightly more bytheir neighbours than the water molecules on the left sketch, thus they are bonded morestrongly together. The curved shape lets fewer molecules escape the water surface, resultingin a lower number of molecules in the air and thus lower saturation water vapour pressure ps1
(see Section 3.4).
Picture 3.4 compares the intermolecular forces between liquid water mole-cules forming on flat (on the left) and curved (on the right) water surfaces.In case of curved menisci, (on the right) any water molecule on the surface issurrounded by a greater number of neighbouring molecules, which results in agreater attractive force towards the water vapour molecules above. More watervapour molecules cling to curved water surface than would cling to the flat sur-face. Thus fewer water vapour molecules above a curved water surface resultin environment with lower water vapour pressure ps1. That is why condensa-tion on a curved water surface happens in environments with relative humiditybelow the value of 100% (100% relative humidity corresponds to conditions ofcondensation on flat water surfaces).
46
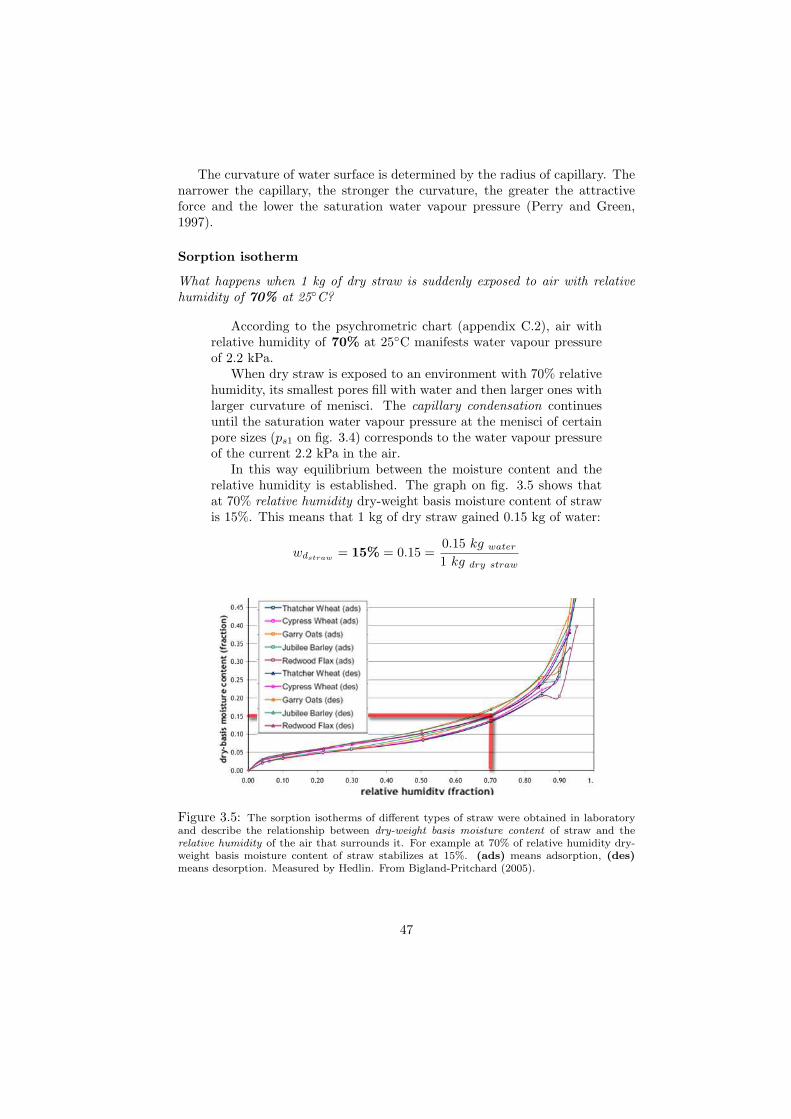
The curvature of water surface is determined by the radius of capillary. Thenarrower the capillary, the stronger the curvature, the greater the attractiveforce and the lower the saturation water vapour pressure (Perry and Green,1997).
Sorption isotherm
What happens when 1 kg of dry straw is suddenly exposed to air with relativehumidity of 70% at 25◦C?
According to the psychrometric chart (appendix C.2), air withrelative humidity of 70% at 25◦C manifests water vapour pressureof 2.2 kPa.
When dry straw is exposed to an environment with 70% relativehumidity, its smallest pores fill with water and then larger ones withlarger curvature of menisci. The capillary condensation continuesuntil the saturation water vapour pressure at the menisci of certainpore sizes (ps1 on fig. 3.4) corresponds to the water vapour pressureof the current 2.2 kPa in the air.
In this way equilibrium between the moisture content and therelative humidity is established. The graph on fig. 3.5 shows thatat 70% relative humidity dry-weight basis moisture content of strawis 15%. This means that 1 kg of dry straw gained 0.15 kg of water:
wdstraw = 15% = 0.15 =0.15 kg water
1 kg dry straw
Figure 3.5: The sorption isotherms of different types of straw were obtained in laboratoryand describe the relationship between dry-weight basis moisture content of straw and therelative humidity of the air that surrounds it. For example at 70% of relative humidity dry-weight basis moisture content of straw stabilizes at 15%. (ads) means adsorption, (des)means desorption. Measured by Hedlin. From Bigland-Pritchard (2005).
47
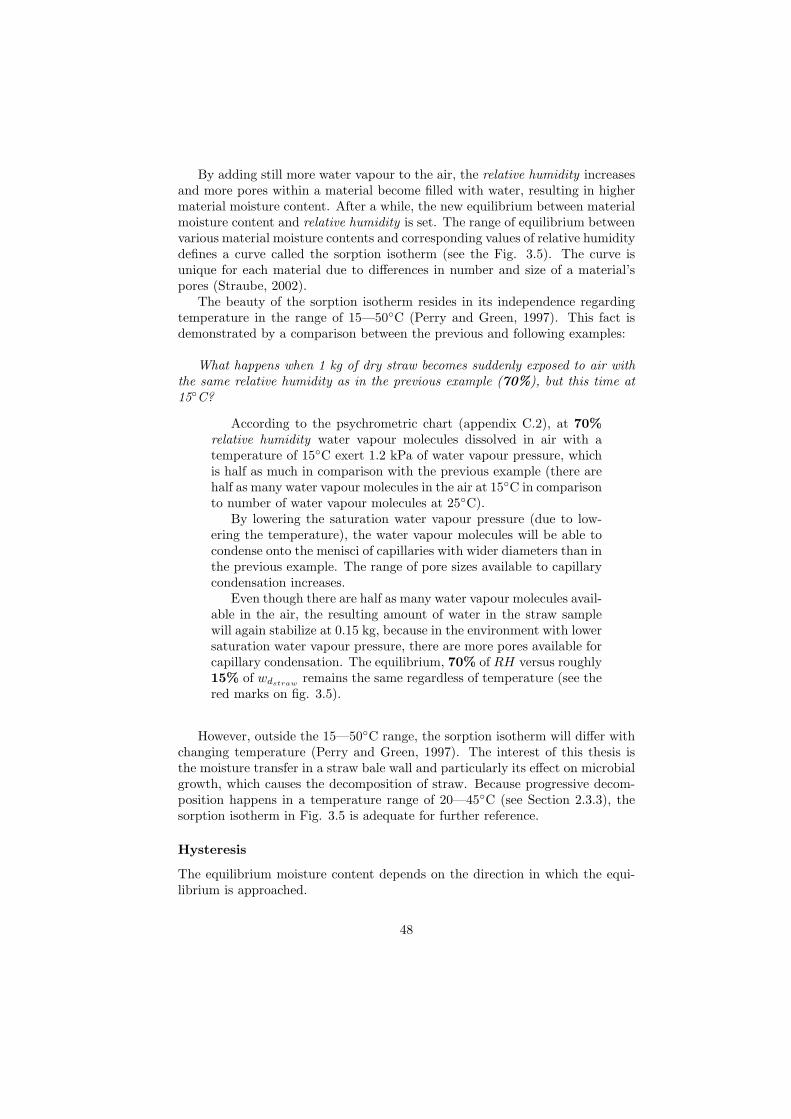
By adding still more water vapour to the air, the relative humidity increasesand more pores within a material become filled with water, resulting in highermaterial moisture content. After a while, the new equilibrium between materialmoisture content and relative humidity is set. The range of equilibrium betweenvarious material moisture contents and corresponding values of relative humiditydefines a curve called the sorption isotherm (see the Fig. 3.5). The curve isunique for each material due to differences in number and size of a material’spores (Straube, 2002).
The beauty of the sorption isotherm resides in its independence regardingtemperature in the range of 15—50◦C (Perry and Green, 1997). This fact isdemonstrated by a comparison between the previous and following examples:
What happens when 1 kg of dry straw becomes suddenly exposed to air withthe same relative humidity as in the previous example (70%), but this time at15◦C?
According to the psychrometric chart (appendix C.2), at 70%relative humidity water vapour molecules dissolved in air with atemperature of 15◦C exert 1.2 kPa of water vapour pressure, whichis half as much in comparison with the previous example (there arehalf as many water vapour molecules in the air at 15◦C in comparisonto number of water vapour molecules at 25◦C).
By lowering the saturation water vapour pressure (due to low-ering the temperature), the water vapour molecules will be able tocondense onto the menisci of capillaries with wider diameters than inthe previous example. The range of pore sizes available to capillarycondensation increases.
Even though there are half as many water vapour molecules avail-able in the air, the resulting amount of water in the straw samplewill again stabilize at 0.15 kg, because in the environment with lowersaturation water vapour pressure, there are more pores available forcapillary condensation. The equilibrium, 70% of RH versus roughly15% of wdstraw remains the same regardless of temperature (see thered marks on fig. 3.5).
However, outside the 15—50◦C range, the sorption isotherm will differ withchanging temperature (Perry and Green, 1997). The interest of this thesis isthe moisture transfer in a straw bale wall and particularly its effect on microbialgrowth, which causes the decomposition of straw. Because progressive decom-position happens in a temperature range of 20—45◦C (see Section 2.3.3), thesorption isotherm in Fig. 3.5 is adequate for further reference.
Hysteresis
The equilibrium moisture content depends on the direction in which the equi-librium is approached.
48
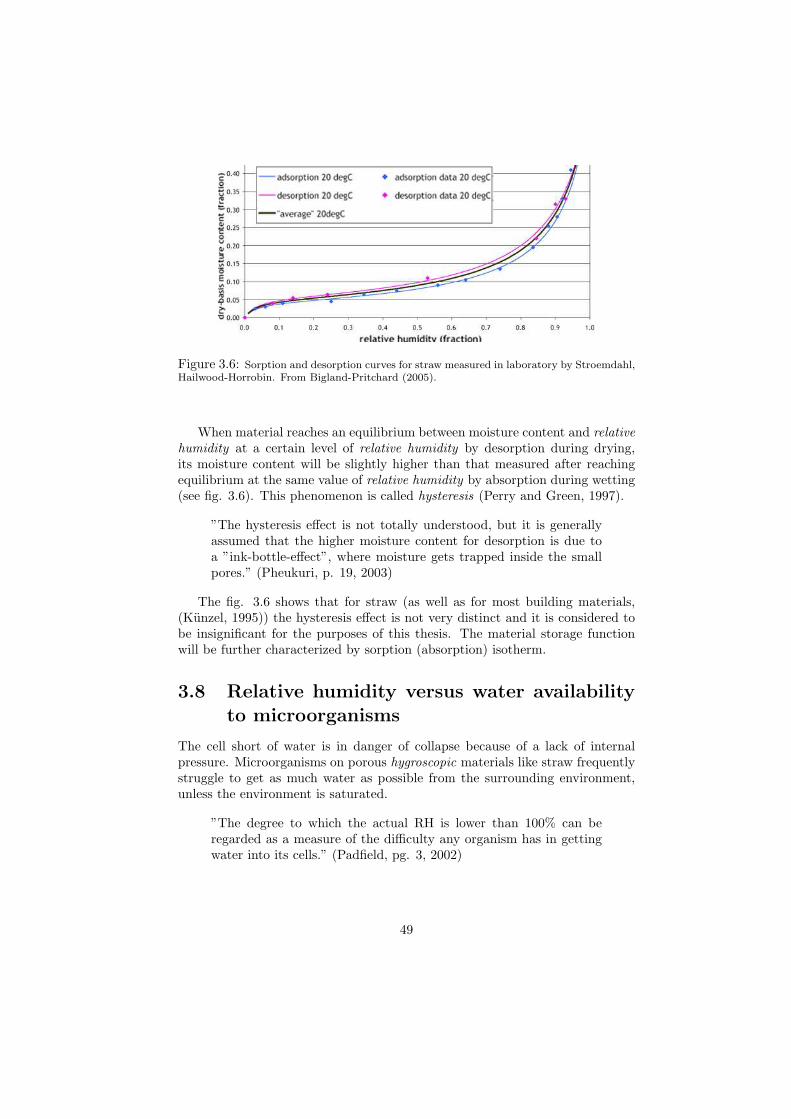
Figure 3.6: Sorption and desorption curves for straw measured in laboratory by Stroemdahl,Hailwood-Horrobin. From Bigland-Pritchard (2005).
When material reaches an equilibrium between moisture content and relativehumidity at a certain level of relative humidity by desorption during drying,its moisture content will be slightly higher than that measured after reachingequilibrium at the same value of relative humidity by absorption during wetting(see fig. 3.6). This phenomenon is called hysteresis (Perry and Green, 1997).
”The hysteresis effect is not totally understood, but it is generallyassumed that the higher moisture content for desorption is due toa ”ink-bottle-effect”, where moisture gets trapped inside the smallpores.” (Pheukuri, p. 19, 2003)
The fig. 3.6 shows that for straw (as well as for most building materials,(Kunzel, 1995)) the hysteresis effect is not very distinct and it is considered tobe insignificant for the purposes of this thesis. The material storage functionwill be further characterized by sorption (absorption) isotherm.
3.8 Relative humidity versus water availabilityto microorganisms
The cell short of water is in danger of collapse because of a lack of internalpressure. Microorganisms on porous hygroscopic materials like straw frequentlystruggle to get as much water as possible from the surrounding environment,unless the environment is saturated.
”The degree to which the actual RH is lower than 100% can beregarded as a measure of the difficulty any organism has in gettingwater into its cells.” (Padfield, pg. 3, 2002)
49
3.8.1 Microorganisms and liquid water
Normally, there is some liquid water in narrow capillaries, but high surface ten-sion, described in previous Section, interferes with the ability of microorganismsto draw water into their cells. Nevertheless, microbes are able to overcome highsurface tension in order to ”drink” from those narrow tubes even in environmentswith relative humidity lower than 100%. They do it by lowering the saturationvapour pressure within their cells in a process called osmosis. Osmosis createssuction pressure so that water can diffuse through the channels in the cell wallsfrom the surrounding liquid, or, in principle, from the surrounding humid air(Calamita, 2005; Padfield, 2002).
Osmotic regulation of the cell fluid
During osmosis, microorganisms synthesize hygroscopic chemicals like glycerol,manitol and various sugars, which make dilute solutions in their cells. Themolecules of those solutes (dissolved materials) have greater attractive force onwater molecules within a solution than water molecules would impose on eachother in pure liquid water (see the fig. 3.7).
Figure 3.7: On the left—approximate molecular configuration of a flat water surface. Onthe right—Intermolecular forces on a surface of a solution. Pink circles represent moleculesof a solute, white circles are molecules of water.
”Increased interactive force between molecules of water and mole-cules of solution results in decreased tendency for water to escapeinto the vapour phase.” (Padfield, 2002)
As a consequence, there is a smaller number of water vapour molecules abovethe surface of the solution, which results in decreased saturation water vapourpressure.
Once the molecules of a solute are present within a microbe, their attractiveforces will draw the water molecules through the cell wall to the inside. Theprocess is similar to surface condensation, the only difference is that due topresence of a solute, osmosis works in environments with relative humidity lowerthan 100%.
50
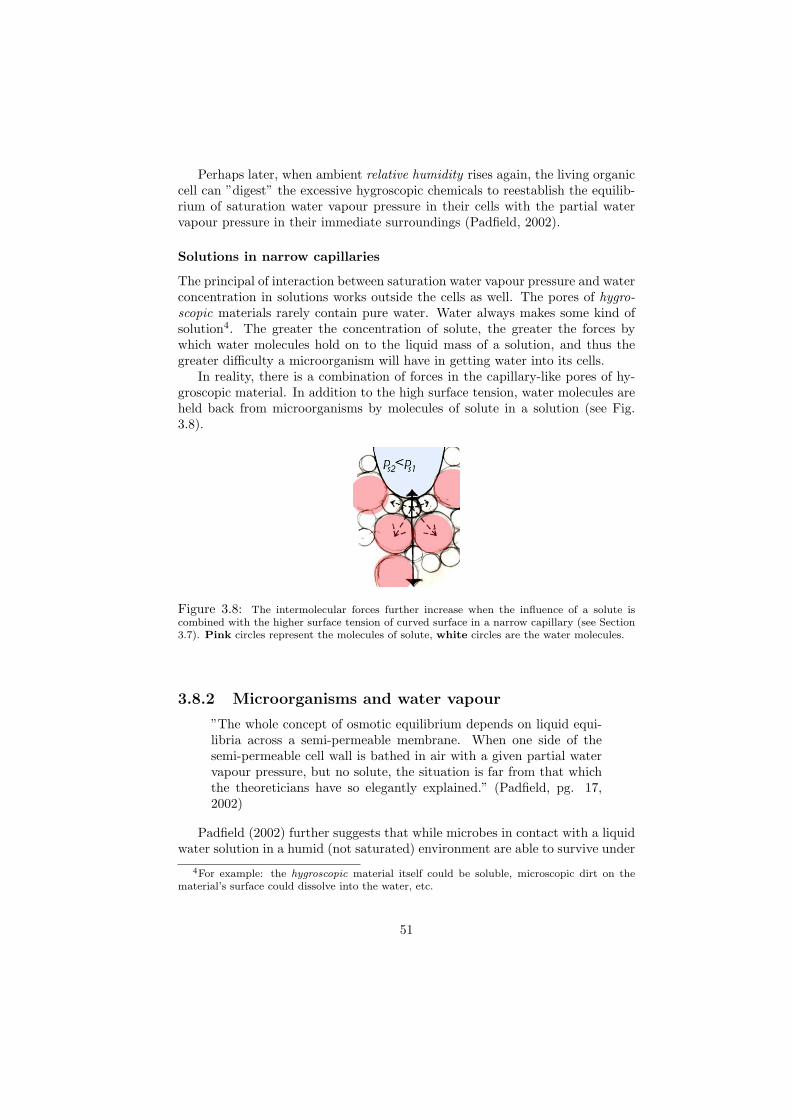
Perhaps later, when ambient relative humidity rises again, the living organiccell can ”digest” the excessive hygroscopic chemicals to reestablish the equilib-rium of saturation water vapour pressure in their cells with the partial watervapour pressure in their immediate surroundings (Padfield, 2002).
Solutions in narrow capillaries
The principal of interaction between saturation water vapour pressure and waterconcentration in solutions works outside the cells as well. The pores of hygro-scopic materials rarely contain pure water. Water always makes some kind ofsolution4. The greater the concentration of solute, the greater the forces bywhich water molecules hold on to the liquid mass of a solution, and thus thegreater difficulty a microorganism will have in getting water into its cells.
In reality, there is a combination of forces in the capillary-like pores of hy-groscopic material. In addition to the high surface tension, water molecules areheld back from microorganisms by molecules of solute in a solution (see Fig.3.8).
Figure 3.8: The intermolecular forces further increase when the influence of a solute iscombined with the higher surface tension of curved surface in a narrow capillary (see Section3.7). Pink circles represent the molecules of solute, white circles are the water molecules.
3.8.2 Microorganisms and water vapour
”The whole concept of osmotic equilibrium depends on liquid equi-libria across a semi-permeable membrane. When one side of thesemi-permeable cell wall is bathed in air with a given partial watervapour pressure, but no solute, the situation is far from that whichthe theoreticians have so elegantly explained.” (Padfield, pg. 17,2002)
Padfield (2002) further suggests that while microbes in contact with a liquidwater solution in a humid (not saturated) environment are able to survive under
4For example: the hygroscopic material itself could be soluble, microscopic dirt on thematerial’s surface could dissolve into the water, etc.
51
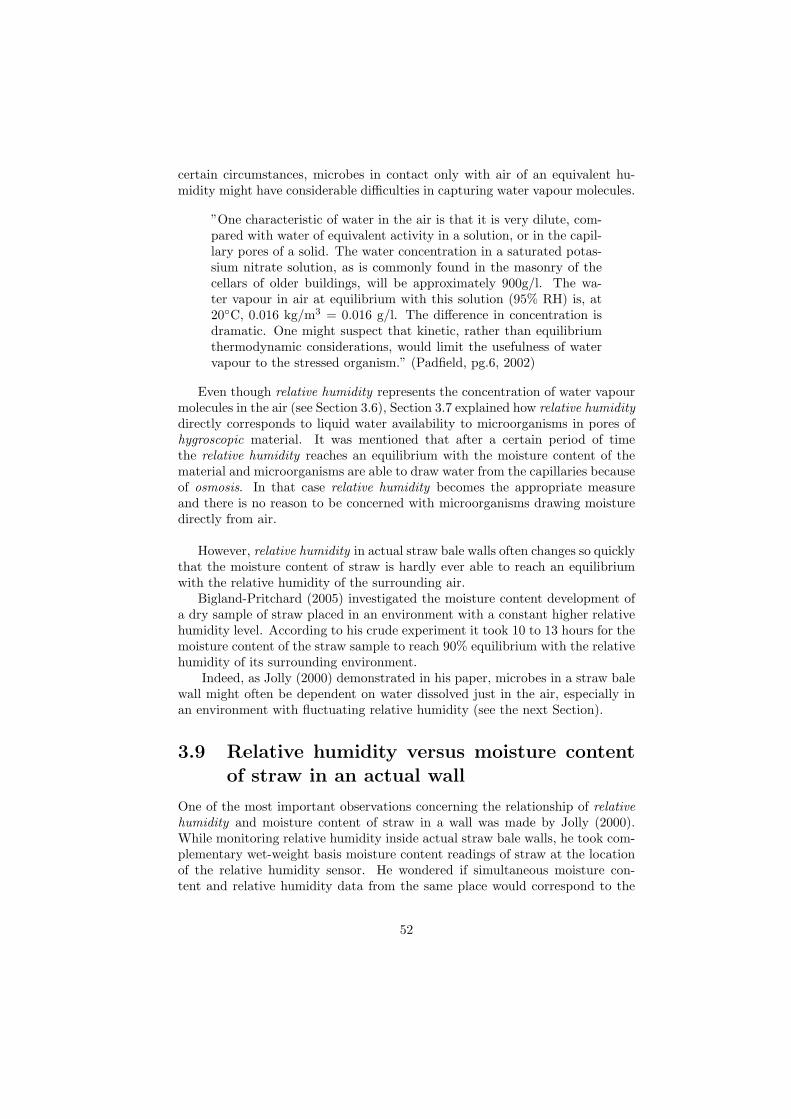
certain circumstances, microbes in contact only with air of an equivalent hu-midity might have considerable difficulties in capturing water vapour molecules.
”One characteristic of water in the air is that it is very dilute, com-pared with water of equivalent activity in a solution, or in the capil-lary pores of a solid. The water concentration in a saturated potas-sium nitrate solution, as is commonly found in the masonry of thecellars of older buildings, will be approximately 900g/l. The wa-ter vapour in air at equilibrium with this solution (95% RH) is, at20◦C, 0.016 kg/m3 = 0.016 g/l. The difference in concentration isdramatic. One might suspect that kinetic, rather than equilibriumthermodynamic considerations, would limit the usefulness of watervapour to the stressed organism.” (Padfield, pg.6, 2002)
Even though relative humidity represents the concentration of water vapourmolecules in the air (see Section 3.6), Section 3.7 explained how relative humiditydirectly corresponds to liquid water availability to microorganisms in pores ofhygroscopic material. It was mentioned that after a certain period of timethe relative humidity reaches an equilibrium with the moisture content of thematerial and microorganisms are able to draw water from the capillaries becauseof osmosis. In that case relative humidity becomes the appropriate measureand there is no reason to be concerned with microorganisms drawing moisturedirectly from air.
However, relative humidity in actual straw bale walls often changes so quicklythat the moisture content of straw is hardly ever able to reach an equilibriumwith the relative humidity of the surrounding air.
Bigland-Pritchard (2005) investigated the moisture content development ofa dry sample of straw placed in an environment with a constant higher relativehumidity level. According to his crude experiment it took 10 to 13 hours for themoisture content of the straw sample to reach 90% equilibrium with the relativehumidity of its surrounding environment.
Indeed, as Jolly (2000) demonstrated in his paper, microbes in a straw balewall might often be dependent on water dissolved just in the air, especially inan environment with fluctuating relative humidity (see the next Section).
3.9 Relative humidity versus moisture contentof straw in an actual wall
One of the most important observations concerning the relationship of relativehumidity and moisture content of straw in a wall was made by Jolly (2000).While monitoring relative humidity inside actual straw bale walls, he took com-plementary wet-weight basis moisture content readings of straw at the locationof the relative humidity sensor. He wondered if simultaneous moisture con-tent and relative humidity data from the same place would correspond to the
52
”general sorption isotherm of straw”, provided to him by Oregon University (asimilar sorption isotherm to the one in fig. 3.5). After comparison of his fielddata with the data obtained in laboratory conditions, he wrote:
”In the field, moisture contents were consistently lower than whatwould be predicted (using ”general sorption isotherm of straw” - ed.author) by the recorded RH levels.
Depending on the monitor location. ... the difference between thepredicted values and the measured values was generally 1%-2% lessin measured moisture content. When diurnal variances in RH wereobserved, moisture contents always coincided most closely with min-imum daily RH values.” (Jolly, p.4, 2000)
Figure 3.9: 4 days of relative humidity monitoring, done inside a straw bale wall just underthe exterior earth plaster in Blanden, Belgium. Measured relative humidity is continuousblue line. As Jolly (2000) suggests, the red dash line represents the estimated level ofstraw moisture content.
In accordance with Jolly’s conclusions, the red dashed line in fig. 3.9 rep-resents the relative humidity that corresponds to the estimated straw moisturecontent level. It fluctuates slightly around the value of 68%, which then be-comes the actual measure of liquid moisture availability to microorganisms inthat particular case (see Section 3.8).
Jolly’s (2000) investigation shows that water vapour often diffuses througha wall independent of the movement of liquid. In the case of the Blanden wallon fig. 3.9, the relative humidity value corresponding to the concentration ofwater vapour in the air peaks for short periods of time at about 75%. This isa much higher value than the 68% that matches the liquid water availability inmaterial.
”A central question therefore is how much does a high relative hu-midity in the pore volume encourage mould growth in the absenceof an accessible liquid phase...” (Padfield, pg. 7, 2002)
The above statement represents a topic needing further investigation.
53
3.10 Influence of relative humidity on microbiallife
Even though the previous Section showed how uncertain relative humidity mightbe in indicating the moisture availability to microorganisms (especially in caseswith fluctuating relative humidity), building science tends to stubbornly repeatthat high relative humidity is largely responsible for microorganism growth.Padfield (2002, p.19) summarizes:
”The German building standard states that 80% RH is the upperlimit for safe conditions. Innumerable secondary sources give valuesbetween 65% and 80% as the limit for biological growth in buildings.”
Straube (King, 2006) writes:
”Fungal growth can begin on most surfaces when the storage mois-ture results in local relative humidity of over about 80% after manymonths. Corrosion and decay require high levels of humidity (wellover 90%) and temperatures over 15◦C to proceed at dangerousrates. It is for those reasons that the relative humidity around amaterial should be controlled...”
However, Padfield (2002) suggests that the material’s pore structure, poresize distribution, the nature of the solution forming in its pores and other en-vironmental factors which are still not clearly understood seem to have a com-paratively powerful influence on the viability of microorganisms stressed by lowwater availability.
3.11 Summary of Chapter 3
Fig. 3.10 summarizes the relationship between straw moisture content and therelative humidity of surrounding environment. It was derived from several sorp-tion isotherms of straw (including the isotherms from fig. 3.5). It includesthe influence of moisture content on the rate of microbial growth observed bySummers et. al. (2003) as was described in Chapter 2. The graph also showsthe influence of relative humidity on condensation in capillaries of different di-ameters. It explains the range of adsorption and capillary condensation andindicates where the straw starts to be in contact with liquid water.
The graph in fig. 3.10 corresponds to a steady state condition which is inreality almost never achieved. Due to dynamic changes of relative humidity inreal walls, Jolly (2000) suggests that moisture content of straw correspondingto a particular level of relative humidity will be actually 1-2% lower than themoisture content indicated by the graph 3.10. In cases with fluctuating relativehumidity, the moisture content of straw will most likely correspond to the lowervalues of relative humidity (Jolly, 2000).
54
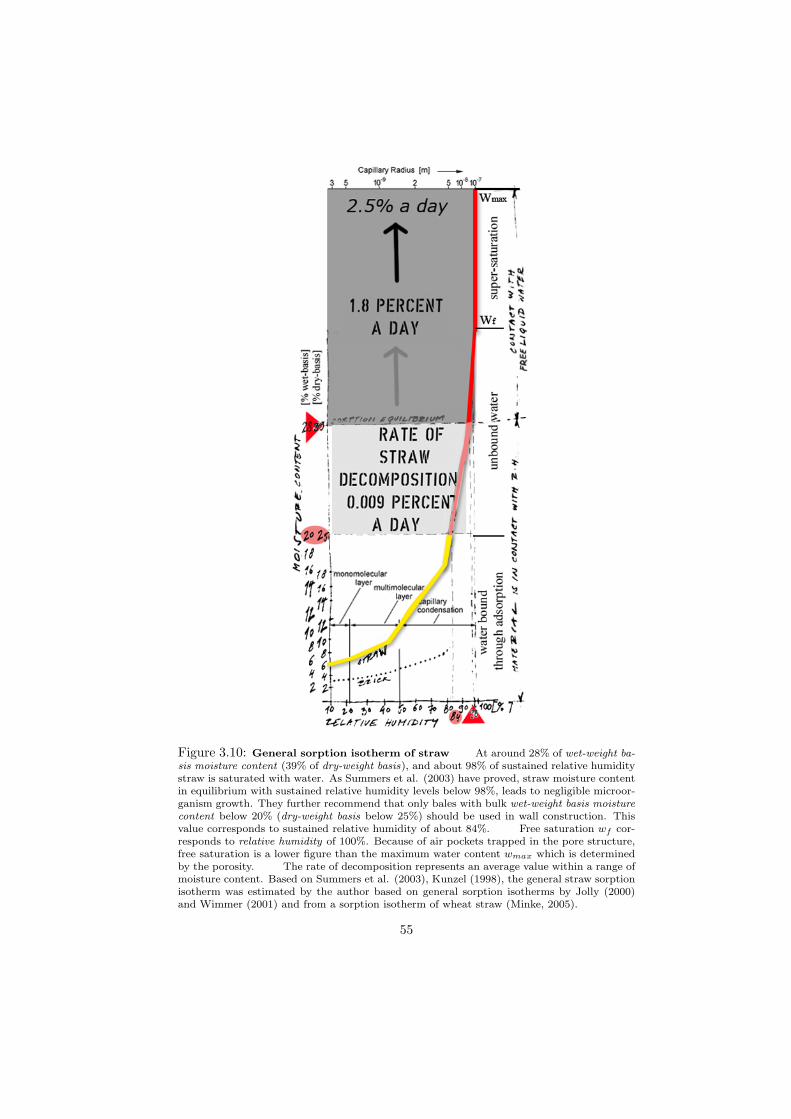
Figure 3.10: General sorption isotherm of straw At around 28% of wet-weight ba-sis moisture content (39% of dry-weight basis), and about 98% of sustained relative humiditystraw is saturated with water. As Summers et al. (2003) have proved, straw moisture contentin equilibrium with sustained relative humidity levels below 98%, leads to negligible microor-ganism growth. They further recommend that only bales with bulk wet-weight basis moisturecontent below 20% (dry-weight basis below 25%) should be used in wall construction. Thisvalue corresponds to sustained relative humidity of about 84%. Free saturation wf cor-responds to relative humidity of 100%. Because of air pockets trapped in the pore structure,free saturation is a lower figure than the maximum water content wmax which is determinedby the porosity. The rate of decomposition represents an average value within a range ofmoisture content. Based on Summers et al. (2003), Kunzel (1998), the general straw sorptionisotherm was estimated by the author based on general sorption isotherms by Jolly (2000)and Wimmer (2001) and from a sorption isotherm of wheat straw (Minke, 2005).
55
With the graph, 3.10 and knowledge of straw moisture behaviour in dynamicconditions, one can measure relative humidity and use it as an indicator of strawcondition in the wall.
However, the relative humidity isn’t necessarily the only parameter facilitat-ing microbial life.
”High relative humidity is the factor most often cited as facilitat-ing micoorganism growth, but a survey of the literature reveals amore complicated, and by no means fully understood, interplay ofenvironmental influences.” (Padfield, 2002)
Furthermore Padfield (2002) mentions that while the mechanism by whichcells are able to draw water from a liquid solution (osmosis) has been welldocumented, the process by which cells draw water vapour directly from the airis almost unknown. This makes the study of microbial growth on straw in a wallespecially difficult, because as building scientists have found, water vapour oftendiffuses through a wall independent of the movement of liquid. It suggests thatmicrobes in a straw bale wall might be often dependent only on water dissolvedin the air, especially in an environment with fluctuating relative humidity.
56
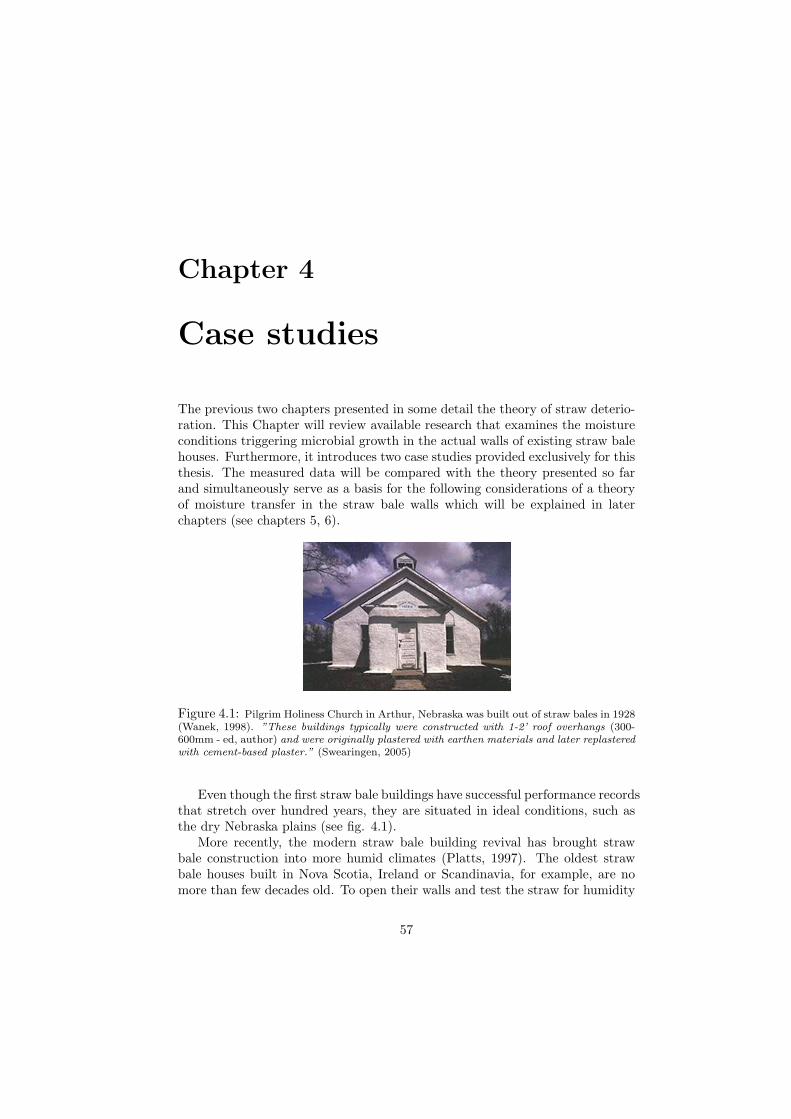
Chapter 4
Case studies
The previous two chapters presented in some detail the theory of straw deterio-ration. This Chapter will review available research that examines the moistureconditions triggering microbial growth in the actual walls of existing straw balehouses. Furthermore, it introduces two case studies provided exclusively for thisthesis. The measured data will be compared with the theory presented so farand simultaneously serve as a basis for the following considerations of a theoryof moisture transfer in the straw bale walls which will be explained in laterchapters (see chapters 5, 6).
Figure 4.1: Pilgrim Holiness Church in Arthur, Nebraska was built out of straw bales in 1928(Wanek, 1998). ”These buildings typically were constructed with 1-2’ roof overhangs (300-600mm - ed, author) and were originally plastered with earthen materials and later replasteredwith cement-based plaster.” (Swearingen, 2005)
Even though the first straw bale buildings have successful performance recordsthat stretch over hundred years, they are situated in ideal conditions, such asthe dry Nebraska plains (see fig. 4.1).
More recently, the modern straw bale building revival has brought strawbale construction into more humid climates (Platts, 1997). The oldest strawbale houses built in Nova Scotia, Ireland or Scandinavia, for example, are nomore than few decades old. To open their walls and test the straw for humidity
57
has been a subject of great interest.
4.1 Overview of existing moisture monitoring instraw bale walls
Despite the interest in wall moisture monitoring among the majority of strawbale builders, there are only a few studies available that give a broad picture ofmoisture migration in existing straw bale structures. The analysis presented inthis Section focuses on a number of investigations that were carefully selectedto meet the following criteria:
1. the survey included sufficient data about the monitor installation, building(construction details), site (exposure to elements) and climate
2. the monitoring equipment was calibrated
3. the survey was part of academic research
Inventory of selected investigations
In the late 1990’s, Canadian Mortgage and Housing Corporation commissionedcomprehensive research into the moisture conditions of straw in walls and floors(CMHC, 2000). It included:
• the development of simple and affordable ”wooden block” moisture meters(CMHC, 1996)
• a pilot study of moisture performance in stuccoed walls of four straw balestructures in Quebec — 7 to 10 years old (Platts, 1997)
• an investigation of moisture control in twelve samples of straw bale floors
• detailed monitoring of moisture conditions in walls of nine straw balehouses in Alberta (Jolly, 2000)
• a report of moisture monitoring on straw bale houses in Nova Scotia (Hen-derson, 1998)1
• research of humidity levels in straw bale walls of five houses in BritishColumbia (Gonzales, 1999)1
Additionally, subsequent analysis covers another two case studies:
• a study supported by the state of California covering in great detail thehygrothermal performance of straw in the earth plastered walls of a Cali-fornian winery (Straube and Schumacher, 2003).
1The studies of Henderson (1998) and Gonzales (1999) focused directly on cases in highhumidity and high precipitation climates.
58
• research presenting moisture content measurements in walls of a lime plas-tered, unheated, straw bale storage building situated on the north easternedge of Dartmoor in Devon, England (Goodhew et al., 2004).
A summary of the monitored data mentioned above can be found in Appen-dix B.0.3. It covers 17 structures in 92 monitoring locations, with 133 sensors2
monitoring either relative humidity or direct moisture content of straw. Someof the sensors measured temperature as well.
A few marginal studies are additionally mentioned in the following text inorder to further diversify or support the investigation of this thesis.
4.1.1 Response of straw bale walls to atmospheric humid-ity
In their study, Straube and Schummacher (2004) show that ambient relativehumidity is capable of penetrating the straw bale wall. They assume that asustained high level of relative humidity (70-85%) should be reduced, becauseit eventually imposes high stress on straw within walls. Unfortunately, theirstudy doesn’t examine any straw samples in order to consider the effect thatsustained high ambient relative humidity has on the condition of straw.
Similar evidence was provided by Jolly (2000). He monitored a house builton the Canadian west coast in an area of high atmospheric relative humidityloads. The moisture content readings in the walls indicated unacceptable con-ditions regarding microbial growth. Again, no samples of straw were examinedto support the statement. Jolly writes:
”Although the north wall is well protected from precipitation, highmoisture content readings persisted during the summer months. Thisis likely a situation where high moisture content within the wall co-incides with high atmospheric RH levels. The builder of this housefelt that the exposure may be overprotected by vegetation (forestwithin 4 m of the wall) and a reduction in air circulation may beaffecting drying.” (Jolly, p.52, 2000)
Straw with high moisture content usually occurs only in the surface areaunder the wall cover (plaster) which faces high relative humidity levels. Onemarginal case study in the moist climate of the Pacific Northwest, in Oregon,USA (Still, 1999) mentions how interior warmth reduces relative humidity allthe way to the outer side of the wall:
”Our average external relative humidity last winter hovered around85%. The buried-in-straw sensors near the outside of the bales re-flected this very high relative humidity. All the sensors near the
2In some locations up to three sensors were installed, one in the straw facing the exterior,one in the straw facing the interior of the wall and one sensor in the middle of the wall.
59
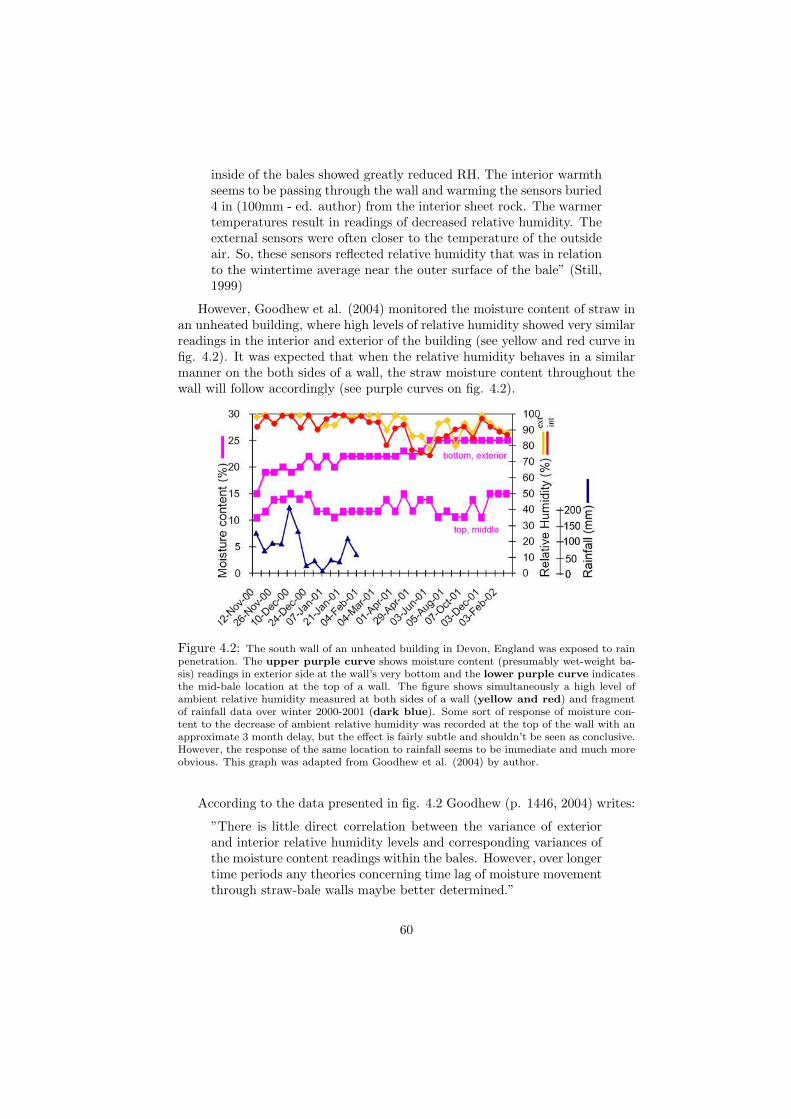
inside of the bales showed greatly reduced RH. The interior warmthseems to be passing through the wall and warming the sensors buried4 in (100mm - ed. author) from the interior sheet rock. The warmertemperatures result in readings of decreased relative humidity. Theexternal sensors were often closer to the temperature of the outsideair. So, these sensors reflected relative humidity that was in relationto the wintertime average near the outer surface of the bale” (Still,1999)
However, Goodhew et al. (2004) monitored the moisture content of straw inan unheated building, where high levels of relative humidity showed very similarreadings in the interior and exterior of the building (see yellow and red curve infig. 4.2). It was expected that when the relative humidity behaves in a similarmanner on the both sides of a wall, the straw moisture content throughout thewall will follow accordingly (see purple curves on fig. 4.2).
Figure 4.2: The south wall of an unheated building in Devon, England was exposed to rainpenetration. The upper purple curve shows moisture content (presumably wet-weight ba-sis) readings in exterior side at the wall’s very bottom and the lower purple curve indicatesthe mid-bale location at the top of a wall. The figure shows simultaneously a high level ofambient relative humidity measured at both sides of a wall (yellow and red) and fragmentof rainfall data over winter 2000-2001 (dark blue). Some sort of response of moisture con-tent to the decrease of ambient relative humidity was recorded at the top of the wall with anapproximate 3 month delay, but the effect is fairly subtle and shouldn’t be seen as conclusive.However, the response of the same location to rainfall seems to be immediate and much moreobvious. This graph was adapted from Goodhew et al. (2004) by author.
According to the data presented in fig. 4.2 Goodhew (p. 1446, 2004) writes:
”There is little direct correlation between the variance of exteriorand interior relative humidity levels and corresponding variances ofthe moisture content readings within the bales. However, over longertime periods any theories concerning time lag of moisture movementthrough straw-bale walls maybe better determined.”
60
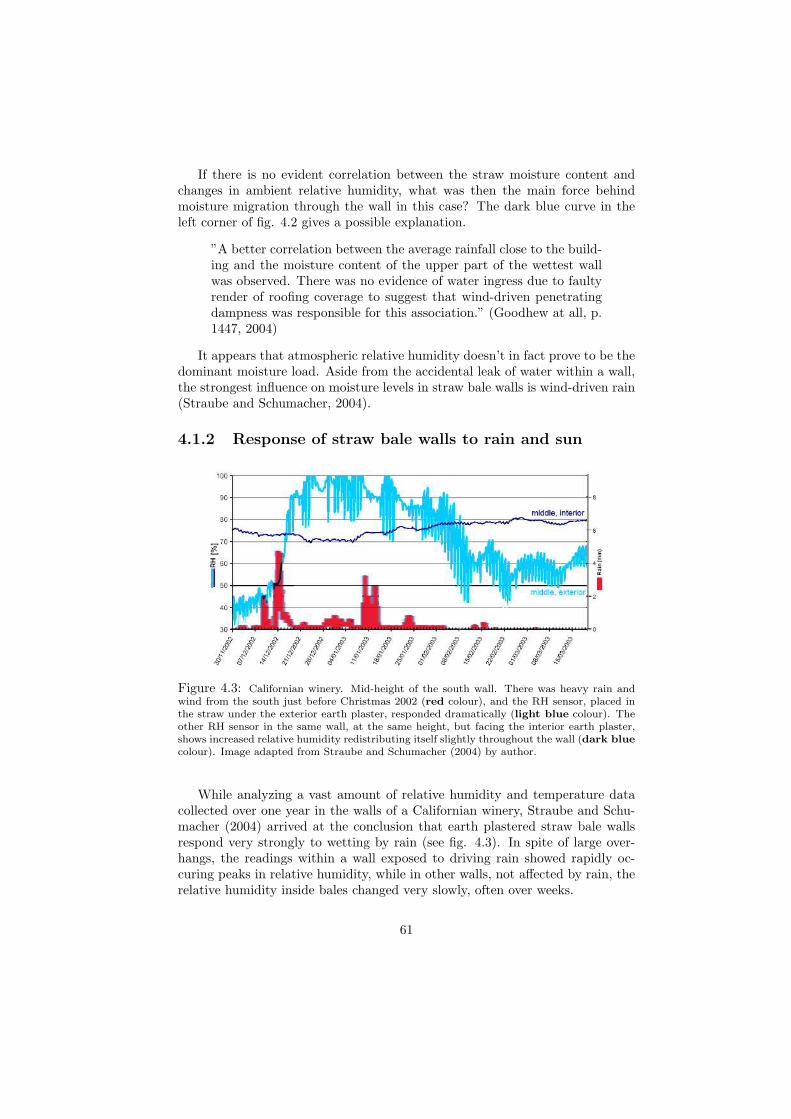
If there is no evident correlation between the straw moisture content andchanges in ambient relative humidity, what was then the main force behindmoisture migration through the wall in this case? The dark blue curve in theleft corner of fig. 4.2 gives a possible explanation.
”A better correlation between the average rainfall close to the build-ing and the moisture content of the upper part of the wettest wallwas observed. There was no evidence of water ingress due to faultyrender of roofing coverage to suggest that wind-driven penetratingdampness was responsible for this association.” (Goodhew at all, p.1447, 2004)
It appears that atmospheric relative humidity doesn’t in fact prove to be thedominant moisture load. Aside from the accidental leak of water within a wall,the strongest influence on moisture levels in straw bale walls is wind-driven rain(Straube and Schumacher, 2004).
4.1.2 Response of straw bale walls to rain and sun
Figure 4.3: Californian winery. Mid-height of the south wall. There was heavy rain andwind from the south just before Christmas 2002 (red colour), and the RH sensor, placed inthe straw under the exterior earth plaster, responded dramatically (light blue colour). Theother RH sensor in the same wall, at the same height, but facing the interior earth plaster,shows increased relative humidity redistributing itself slightly throughout the wall (dark bluecolour). Image adapted from Straube and Schumacher (2004) by author.
While analyzing a vast amount of relative humidity and temperature datacollected over one year in the walls of a Californian winery, Straube and Schu-macher (2004) arrived at the conclusion that earth plastered straw bale wallsrespond very strongly to wetting by rain (see fig. 4.3). In spite of large over-hangs, the readings within a wall exposed to driving rain showed rapidly oc-curing peaks in relative humidity, while in other walls, not affected by rain, therelative humidity inside bales changed very slowly, often over weeks.
61
Furthermore Straube and Schumacher (2004) proved that the wetting dueto driving rain is redistributed to the center of the wall as a part of the dryingprocess (dark blue curve on fig. 4.3).
”Rain control for earth plastered strawbale buildings is clearly essen-tial. Rain causes the greatest and quickest increase in RH. Dryingcan occur quickly after rain events if conditions allow it, but seriouswetting will often require at least 4 to 8 weeks to dry.” (Straube andSchumacher,p. 15, 2004)
The wall hit by driving rain in this study was the southern wall and thedrying in the sunny and extremely dry Californian climate took 8 weeks (seefig. 4.3). The drying depends on ambient relative humidity as well as the tem-perature, which is highly affected by solar gains. As Straube and Schummacher(p. 15, 2004) write:
”The sun can heat even the back of heavy earth plaster surfaces to20 ◦C above outdoor air temperature.”
However, different drying patterns occur in cold and wet climates, for exam-ple in the UK. Walls exposed to permanent shade, or to long periods of rains,high ambient humidity and low temperatures need to be protected from drivingrain by all means.
In damp and cloudy Dartmoor, England, an unheated building showed de-grading straw at the bottom of southern wall after only approximately two yearsof its existence due to moisture that was unable to dry out (Goodhew et al.,2004). Wind-driven rain penetrating the lime render caused gradual moisturecontent build up. The complete absence of drying at this particular location isapparent from fig. 4.2 in the previous Section. Unfortunately, the authors don’tspecify the construction details at the foot of the wall. To draw a conclusionfrom their case, it would be useful to know if the wall footing under the bottomcourse of bales was drained properly.
4.1.3 Vertical variations of humidity in straw bale walls
Assumedly, moisture has tendency to gravitate to the lower parts of a wall.Such phenomenon is apparent from fig. 4.2 and seems to occur especially inwalls that aren’t exposed to extensive sunshine (Jolly, 2000; Gonzales, 1999;Goodhew, 2004).
The readings of relative humidity in the straw under the exterior plasterof the eastern wall of the Californian winery (Straube and Schumacher, 2004),heated regularly by morning sun, reveal the opposite. Relative humidity reachedits highest values at the top of the wall, while the bottom and the middle showedmuch lower, almost identical, readings (see fig. 4.4).
62
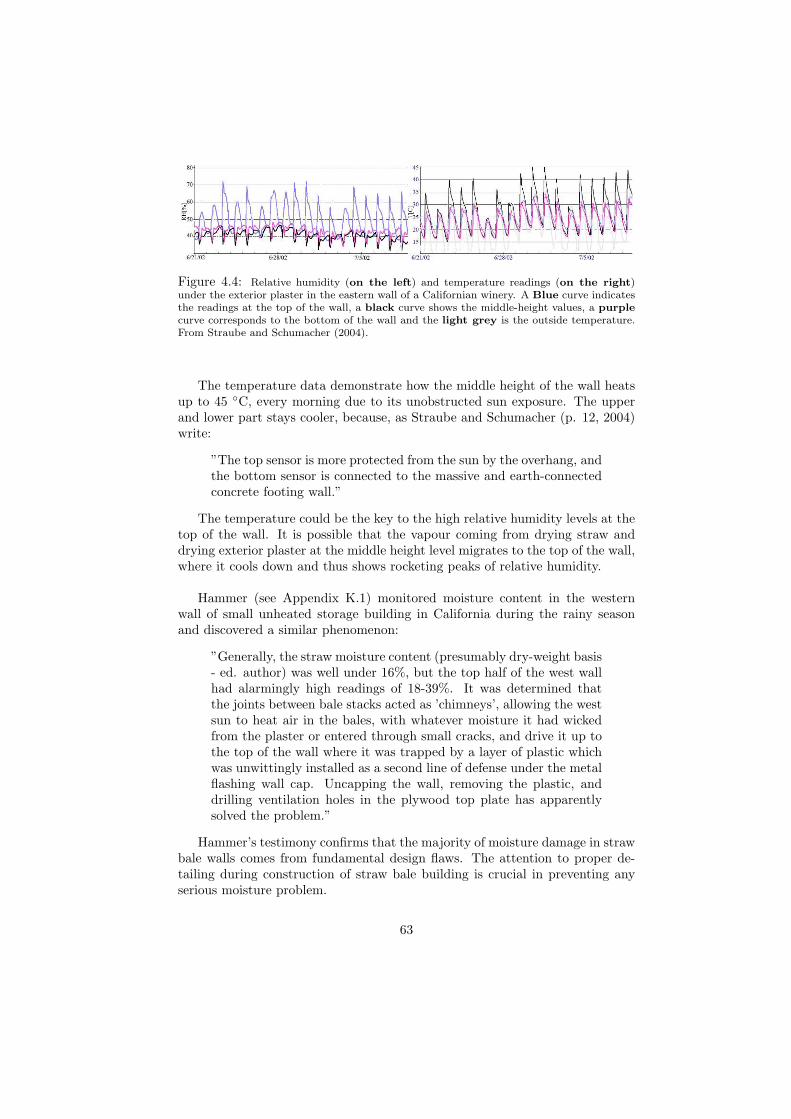
Figure 4.4: Relative humidity (on the left) and temperature readings (on the right)under the exterior plaster in the eastern wall of a Californian winery. A Blue curve indicatesthe readings at the top of the wall, a black curve shows the middle-height values, a purplecurve corresponds to the bottom of the wall and the light grey is the outside temperature.From Straube and Schumacher (2004).
The temperature data demonstrate how the middle height of the wall heatsup to 45 ◦C, every morning due to its unobstructed sun exposure. The upperand lower part stays cooler, because, as Straube and Schumacher (p. 12, 2004)write:
”The top sensor is more protected from the sun by the overhang, andthe bottom sensor is connected to the massive and earth-connectedconcrete footing wall.”
The temperature could be the key to the high relative humidity levels at thetop of the wall. It is possible that the vapour coming from drying straw anddrying exterior plaster at the middle height level migrates to the top of the wall,where it cools down and thus shows rocketing peaks of relative humidity.
Hammer (see Appendix K.1) monitored moisture content in the westernwall of small unheated storage building in California during the rainy seasonand discovered a similar phenomenon:
”Generally, the straw moisture content (presumably dry-weight basis- ed. author) was well under 16%, but the top half of the west wallhad alarmingly high readings of 18-39%. It was determined thatthe joints between bale stacks acted as ’chimneys’, allowing the westsun to heat air in the bales, with whatever moisture it had wickedfrom the plaster or entered through small cracks, and drive it up tothe top of the wall where it was trapped by a layer of plastic whichwas unwittingly installed as a second line of defense under the metalflashing wall cap. Uncapping the wall, removing the plastic, anddrilling ventilation holes in the plywood top plate has apparentlysolved the problem.”
Hammer’s testimony confirms that the majority of moisture damage in strawbale walls comes from fundamental design flaws. The attention to proper de-tailing during construction of straw bale building is crucial in preventing anyserious moisture problem.
63
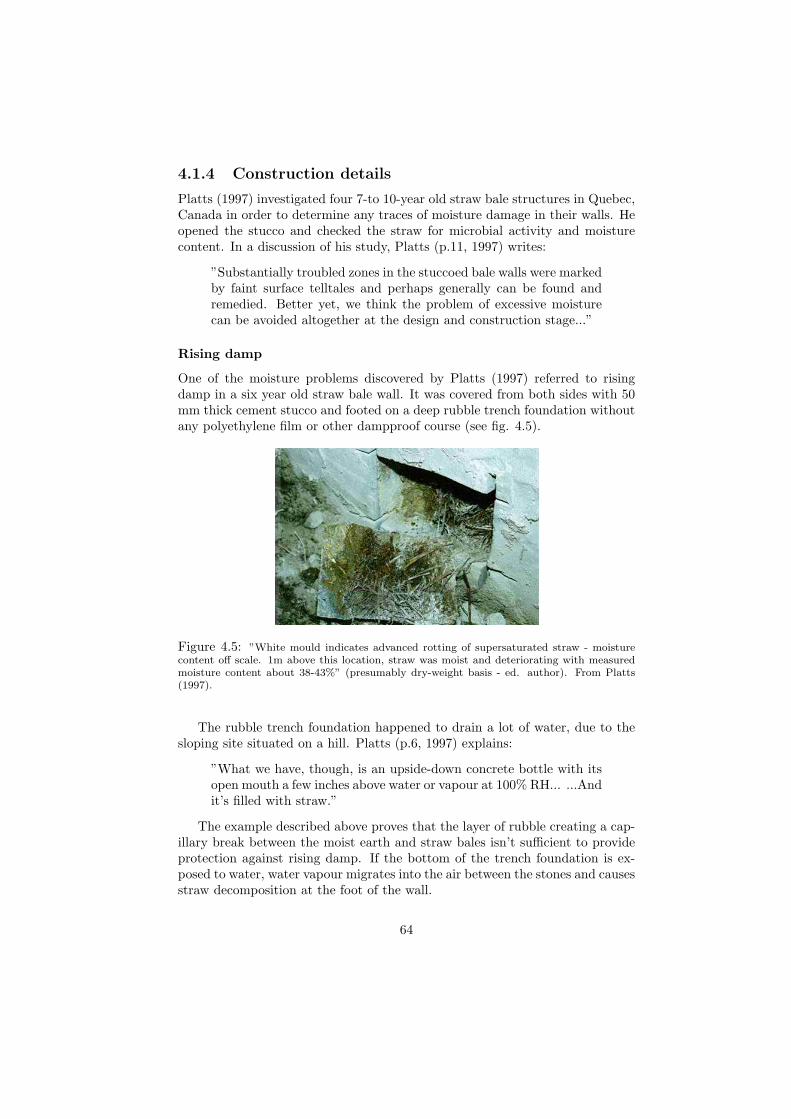
4.1.4 Construction details
Platts (1997) investigated four 7-to 10-year old straw bale structures in Quebec,Canada in order to determine any traces of moisture damage in their walls. Heopened the stucco and checked the straw for microbial activity and moisturecontent. In a discussion of his study, Platts (p.11, 1997) writes:
”Substantially troubled zones in the stuccoed bale walls were markedby faint surface telltales and perhaps generally can be found andremedied. Better yet, we think the problem of excessive moisturecan be avoided altogether at the design and construction stage...”
Rising damp
One of the moisture problems discovered by Platts (1997) referred to risingdamp in a six year old straw bale wall. It was covered from both sides with 50mm thick cement stucco and footed on a deep rubble trench foundation withoutany polyethylene film or other dampproof course (see fig. 4.5).
Figure 4.5: ”White mould indicates advanced rotting of supersaturated straw - moisturecontent off scale. 1m above this location, straw was moist and deteriorating with measuredmoisture content about 38-43%” (presumably dry-weight basis - ed. author). From Platts(1997).
The rubble trench foundation happened to drain a lot of water, due to thesloping site situated on a hill. Platts (p.6, 1997) explains:
”What we have, though, is an upside-down concrete bottle with itsopen mouth a few inches above water or vapour at 100% RH... ...Andit’s filled with straw.”
The example described above proves that the layer of rubble creating a cap-illary break between the moist earth and straw bales isn’t sufficient to provideprotection against rising damp. If the bottom of the trench foundation is ex-posed to water, water vapour migrates into the air between the stones and causesstraw decomposition at the foot of the wall.
64
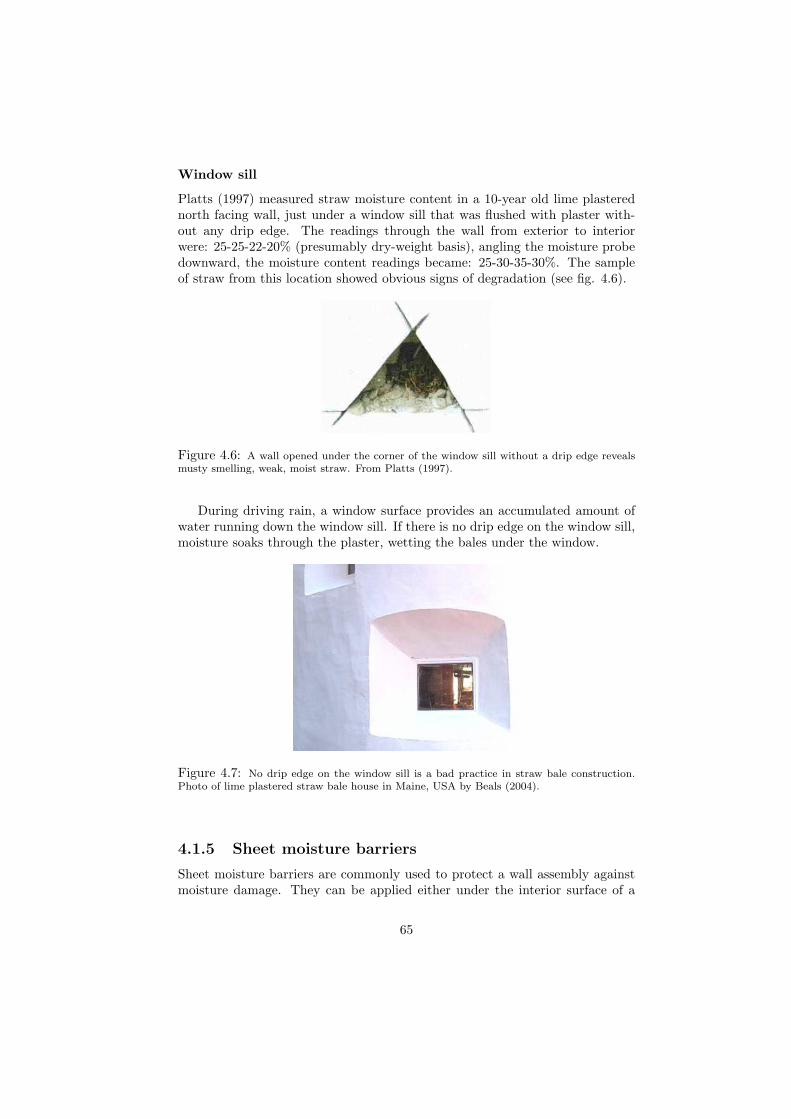
Window sill
Platts (1997) measured straw moisture content in a 10-year old lime plasterednorth facing wall, just under a window sill that was flushed with plaster with-out any drip edge. The readings through the wall from exterior to interiorwere: 25-25-22-20% (presumably dry-weight basis), angling the moisture probedownward, the moisture content readings became: 25-30-35-30%. The sampleof straw from this location showed obvious signs of degradation (see fig. 4.6).
Figure 4.6: A wall opened under the corner of the window sill without a drip edge revealsmusty smelling, weak, moist straw. From Platts (1997).
During driving rain, a window surface provides an accumulated amount ofwater running down the window sill. If there is no drip edge on the window sill,moisture soaks through the plaster, wetting the bales under the window.
Figure 4.7: No drip edge on the window sill is a bad practice in straw bale construction.Photo of lime plastered straw bale house in Maine, USA by Beals (2004).
4.1.5 Sheet moisture barriers
Sheet moisture barriers are commonly used to protect a wall assembly againstmoisture damage. They can be applied either under the interior surface of a
65
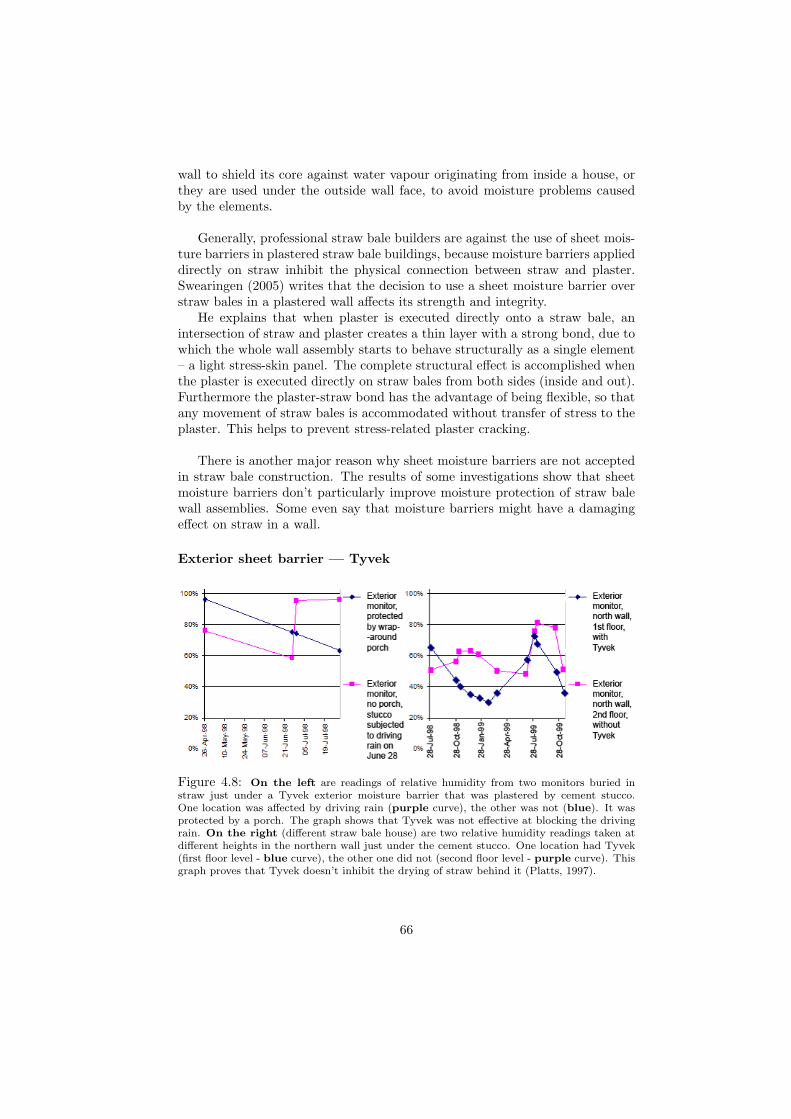
wall to shield its core against water vapour originating from inside a house, orthey are used under the outside wall face, to avoid moisture problems causedby the elements.
Generally, professional straw bale builders are against the use of sheet mois-ture barriers in plastered straw bale buildings, because moisture barriers applieddirectly on straw inhibit the physical connection between straw and plaster.Swearingen (2005) writes that the decision to use a sheet moisture barrier overstraw bales in a plastered wall affects its strength and integrity.
He explains that when plaster is executed directly onto a straw bale, anintersection of straw and plaster creates a thin layer with a strong bond, due towhich the whole wall assembly starts to behave structurally as a single element– a light stress-skin panel. The complete structural effect is accomplished whenthe plaster is executed directly on straw bales from both sides (inside and out).Furthermore the plaster-straw bond has the advantage of being flexible, so thatany movement of straw bales is accommodated without transfer of stress to theplaster. This helps to prevent stress-related plaster cracking.
There is another major reason why sheet moisture barriers are not acceptedin straw bale construction. The results of some investigations show that sheetmoisture barriers don’t particularly improve moisture protection of straw balewall assemblies. Some even say that moisture barriers might have a damagingeffect on straw in a wall.
Exterior sheet barrier — Tyvek
Figure 4.8: On the left are readings of relative humidity from two monitors buried instraw just under a Tyvek exterior moisture barrier that was plastered by cement stucco.One location was affected by driving rain (purple curve), the other was not (blue). It wasprotected by a porch. The graph shows that Tyvek was not effective at blocking the drivingrain. On the right (different straw bale house) are two relative humidity readings taken atdifferent heights in the northern wall just under the cement stucco. One location had Tyvek(first floor level - blue curve), the other one did not (second floor level - purple curve). Thisgraph proves that Tyvek doesn’t inhibit the drying of straw behind it (Platts, 1997).
66
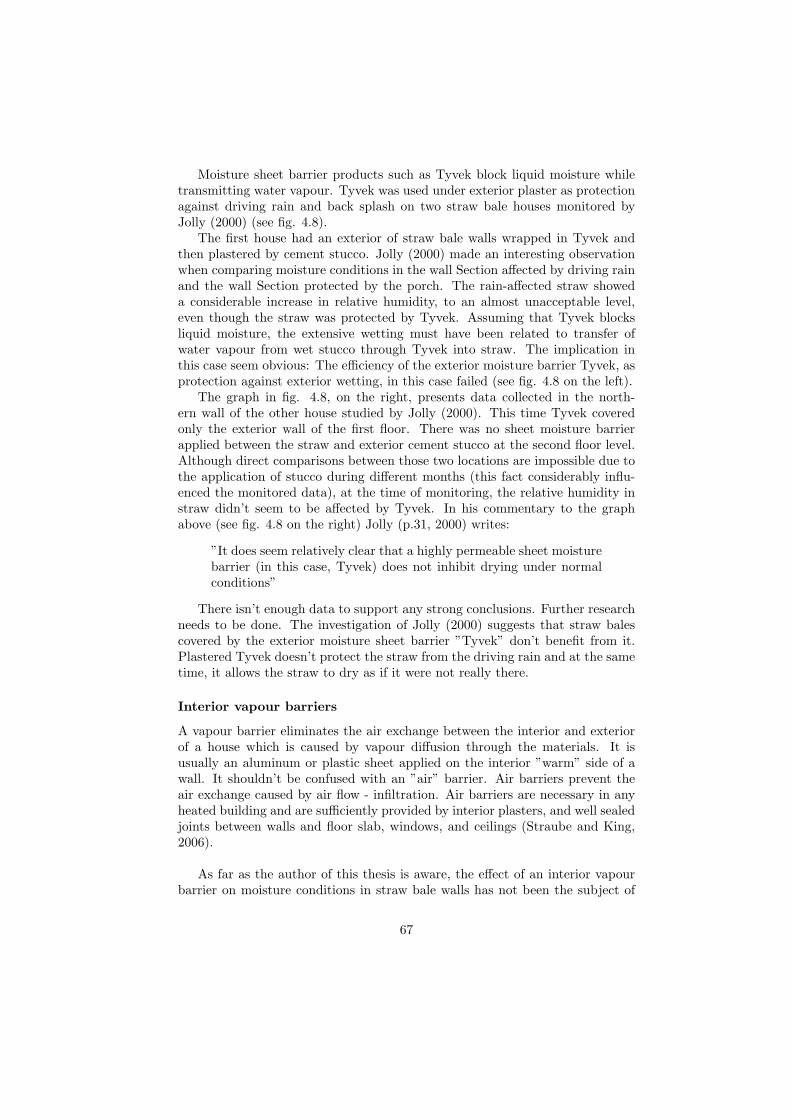
Moisture sheet barrier products such as Tyvek block liquid moisture whiletransmitting water vapour. Tyvek was used under exterior plaster as protectionagainst driving rain and back splash on two straw bale houses monitored byJolly (2000) (see fig. 4.8).
The first house had an exterior of straw bale walls wrapped in Tyvek andthen plastered by cement stucco. Jolly (2000) made an interesting observationwhen comparing moisture conditions in the wall Section affected by driving rainand the wall Section protected by the porch. The rain-affected straw showeda considerable increase in relative humidity, to an almost unacceptable level,even though the straw was protected by Tyvek. Assuming that Tyvek blocksliquid moisture, the extensive wetting must have been related to transfer ofwater vapour from wet stucco through Tyvek into straw. The implication inthis case seem obvious: The efficiency of the exterior moisture barrier Tyvek, asprotection against exterior wetting, in this case failed (see fig. 4.8 on the left).
The graph in fig. 4.8, on the right, presents data collected in the north-ern wall of the other house studied by Jolly (2000). This time Tyvek coveredonly the exterior wall of the first floor. There was no sheet moisture barrierapplied between the straw and exterior cement stucco at the second floor level.Although direct comparisons between those two locations are impossible due tothe application of stucco during different months (this fact considerably influ-enced the monitored data), at the time of monitoring, the relative humidity instraw didn’t seem to be affected by Tyvek. In his commentary to the graphabove (see fig. 4.8 on the right) Jolly (p.31, 2000) writes:
”It does seem relatively clear that a highly permeable sheet moisturebarrier (in this case, Tyvek) does not inhibit drying under normalconditions”
There isn’t enough data to support any strong conclusions. Further researchneeds to be done. The investigation of Jolly (2000) suggests that straw balescovered by the exterior moisture sheet barrier ”Tyvek” don’t benefit from it.Plastered Tyvek doesn’t protect the straw from the driving rain and at the sametime, it allows the straw to dry as if it were not really there.
Interior vapour barriers
A vapour barrier eliminates the air exchange between the interior and exteriorof a house which is caused by vapour diffusion through the materials. It isusually an aluminum or plastic sheet applied on the interior ”warm” side of awall. It shouldn’t be confused with an ”air” barrier. Air barriers prevent theair exchange caused by air flow - infiltration. Air barriers are necessary in anyheated building and are sufficiently provided by interior plasters, and well sealedjoints between walls and floor slab, windows, and ceilings (Straube and King,2006).
As far as the author of this thesis is aware, the effect of an interior vapourbarrier on moisture conditions in straw bale walls has not been the subject of
67
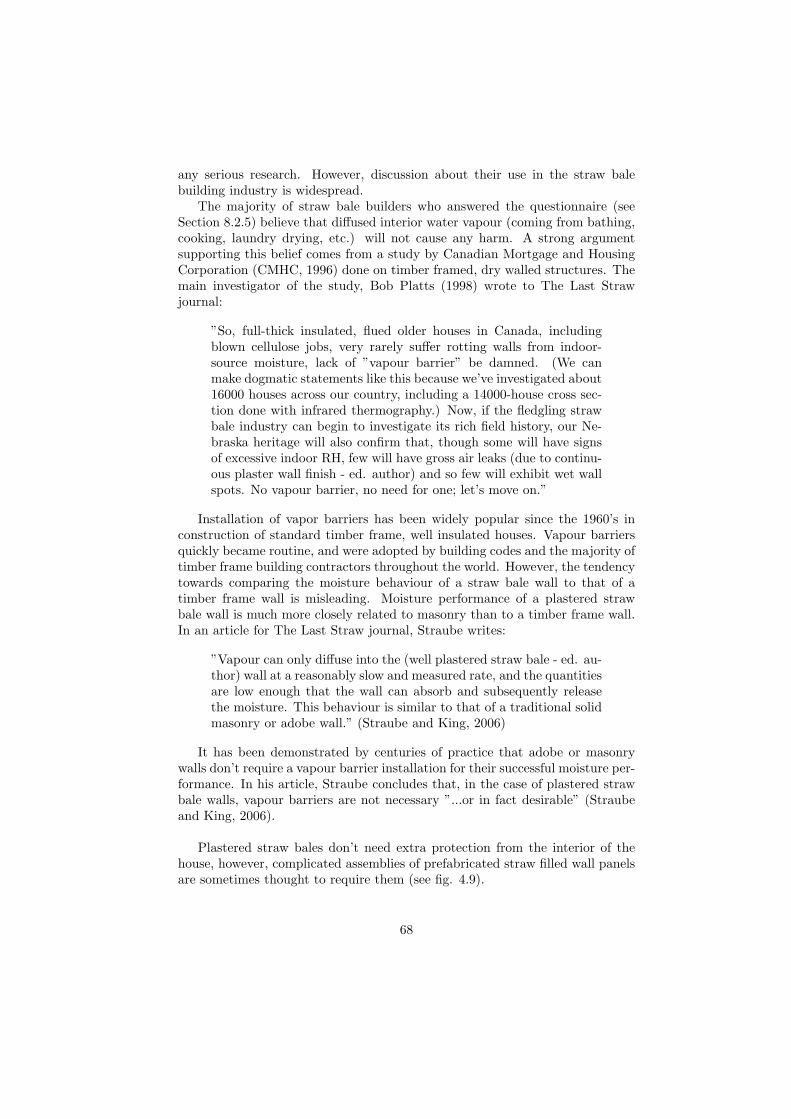
any serious research. However, discussion about their use in the straw balebuilding industry is widespread.
The majority of straw bale builders who answered the questionnaire (seeSection 8.2.5) believe that diffused interior water vapour (coming from bathing,cooking, laundry drying, etc.) will not cause any harm. A strong argumentsupporting this belief comes from a study by Canadian Mortgage and HousingCorporation (CMHC, 1996) done on timber framed, dry walled structures. Themain investigator of the study, Bob Platts (1998) wrote to The Last Strawjournal:
”So, full-thick insulated, flued older houses in Canada, includingblown cellulose jobs, very rarely suffer rotting walls from indoor-source moisture, lack of ”vapour barrier” be damned. (We canmake dogmatic statements like this because we’ve investigated about16000 houses across our country, including a 14000-house cross sec-tion done with infrared thermography.) Now, if the fledgling strawbale industry can begin to investigate its rich field history, our Ne-braska heritage will also confirm that, though some will have signsof excessive indoor RH, few will have gross air leaks (due to continu-ous plaster wall finish - ed. author) and so few will exhibit wet wallspots. No vapour barrier, no need for one; let’s move on.”
Installation of vapor barriers has been widely popular since the 1960’s inconstruction of standard timber frame, well insulated houses. Vapour barriersquickly became routine, and were adopted by building codes and the majority oftimber frame building contractors throughout the world. However, the tendencytowards comparing the moisture behaviour of a straw bale wall to that of atimber frame wall is misleading. Moisture performance of a plastered strawbale wall is much more closely related to masonry than to a timber frame wall.In an article for The Last Straw journal, Straube writes:
”Vapour can only diffuse into the (well plastered straw bale - ed. au-thor) wall at a reasonably slow and measured rate, and the quantitiesare low enough that the wall can absorb and subsequently releasethe moisture. This behaviour is similar to that of a traditional solidmasonry or adobe wall.” (Straube and King, 2006)
It has been demonstrated by centuries of practice that adobe or masonrywalls don’t require a vapour barrier installation for their successful moisture per-formance. In his article, Straube concludes that, in the case of plastered strawbale walls, vapour barriers are not necessary ”...or in fact desirable” (Straubeand King, 2006).
Plastered straw bales don’t need extra protection from the interior of thehouse, however, complicated assemblies of prefabricated straw filled wall panelsare sometimes thought to require them (see fig. 4.9).
68
Figure 4.9: One of the first prefabricated straw bale houses in Breitenfurt in Austria. Wallsection on the left: 1— light, silicate based exterior plaster, 2— cement based wood woolpanel (heraklith), 3— diagonally clad timber, 4-6— straw bales between double timber studs,7— diagonally clad timber, 8— vapour barrier, plastic sheet, 9— gypsum plasterboard, 10—interior plaster. Image of exterior of the house under construction is in the middle andinterior, prior to sheeting with ”vapour” barrier, is on the right. Section is from Wimmeret al. (2001) and images from www.baubilogie.at.
Since the year 2000, Austrian architects have been developing a unique strawbale ”passive house”3 technology with an attempt to increase the enclosure’sairtightness by installing a vapour barrier (this measure is also supposed toreduce the amount of wetting in the wall).
4.1.6 Air infiltration
Piepkorn (2000) assumes that the interior of a house that is wrapped in vapourbarrier could act like an air balloon, because the vapour pressure doesn’t havea chance to equalize evenly through the enclosure. Vapour pressure could buildup inside a house and any small break in the vapor barrier system, almost likea perforated tire tube, could allow a startling amount of humid interior air tofind its way into the wall.
”The volume of moisture will be anywhere from ten to hundredtimes more at that location (behind perforated vapour barrier - ed.author).” (Piepkorn, 2000)
In building envelopes, it is not only a vapour barrier due to increased vapourpressure that contributes to moisture problems, but on smaller scale any airbarrier (e.g. plaster) makes a vapour pressurized enclosure that might lead totrouble. Any discontinuity or crack in an air barrier creates a passage for humidair and causes moisture infiltration in plastered straw.
3Generally, a building falls within the ”passive building standard”, if its annual heatingenergy consumption meets the target of 20 kWh/m2. Contemporary building practice believesthat in order to meet passive house standard, homes need to be equipped with heat exchangingair conditioning, which requires air tight building envelopes (Wihan, 2005).
69
The impact of air infiltration on humidity in a straw bale wall was docu-mented during monitoring in Plozevet, Brittany, France (this case will be intro-duced in great detail further in this Chapter). A perfectly sealed monitor in themiddle of a wet straw bale wall in Plozevet showed more or less stable valuesof relative humidity until the monitor was taken out for data download. There-entry of the monitor wasn’t done properly and the hole in the lime plasterwasn’t sealed well. In this case, because the straw in the wall was very hu-mid, infiltration of interior air through the badly sealed plug into the monitorlocation contributed to drying (see fig. 4.10).
Figure 4.10: Monitoring in wet wall at mid-bale depth in straw bale house in Plozevet,Brittany, France. The chart shows a fragment of the data collected for this thesis (see Section4.2.1). The monitor was adequately sealed in the lime plastered straw only during first monthof monitoring. At the beginning of March, the monitor was taken out of the wall for datadownload and after its reentry into the same position, it wasn’t properly sealed. The datafrom March til mid April were affected by infiltration from interior air. In the middle of April,the monitor was well sealed to give stable mid-wall depth readings again.
It could be expected that in normal conditions (with dry straw in a walland humid air), any crack in an air barrier (e.g. plaster) could cause significantwetting.
4.1.7 Air convection
Air infiltration introduces air carrying water vapour into a construction. Theconvective flows of humid air then occur in the air gaps and air pockets withina wall.
The effect of air convection in straw bale walls was mentioned in Section4.1.3, when Hammer (see Appendix K.1) observed migrating moisture in ”chim-neys” behind the exterior plaster, causing condensation and straw rot under theimpermeable roof (top) plate built on top of the wall.
Another anecdote regarding air convection was recorded by Magwood (seeAppendix L). He writes:
”We often see patterns of moisture accumulation behind the exteriorplaster on houses we have built. At first these scared the heck outof me! But having spent some time opening up walls in these places
70
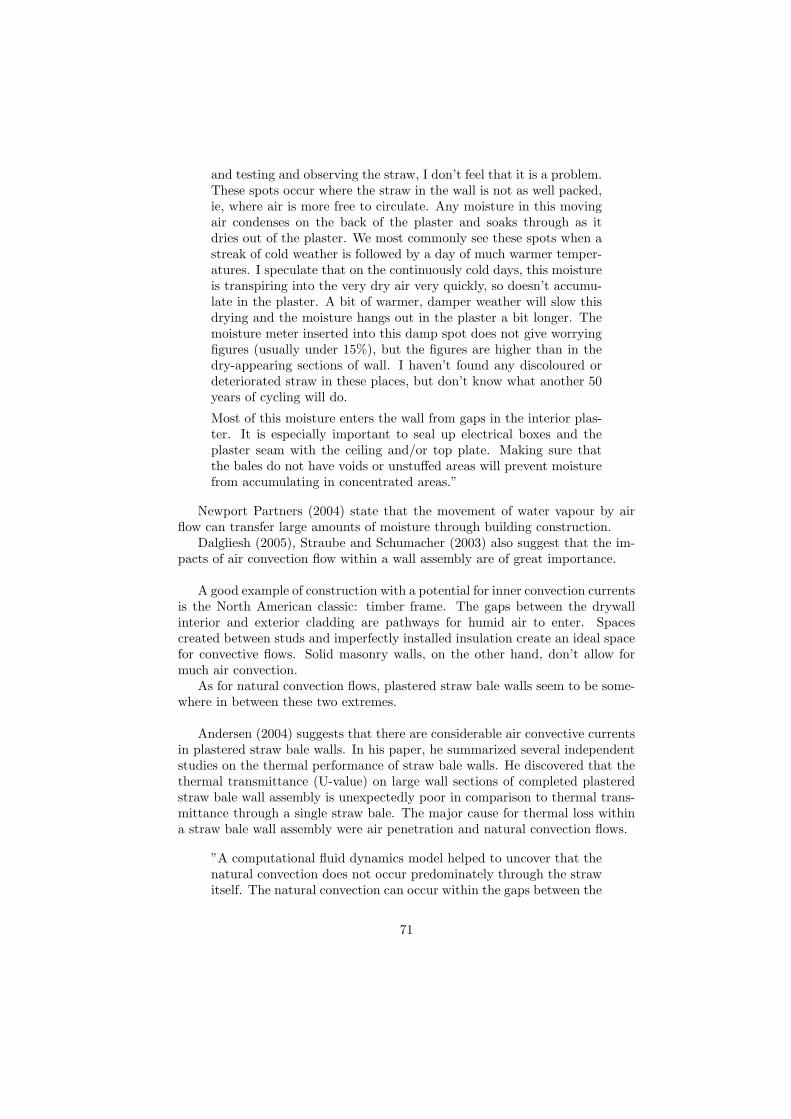
and testing and observing the straw, I don’t feel that it is a problem.These spots occur where the straw in the wall is not as well packed,ie, where air is more free to circulate. Any moisture in this movingair condenses on the back of the plaster and soaks through as itdries out of the plaster. We most commonly see these spots when astreak of cold weather is followed by a day of much warmer temper-atures. I speculate that on the continuously cold days, this moistureis transpiring into the very dry air very quickly, so doesn’t accumu-late in the plaster. A bit of warmer, damper weather will slow thisdrying and the moisture hangs out in the plaster a bit longer. Themoisture meter inserted into this damp spot does not give worryingfigures (usually under 15%), but the figures are higher than in thedry-appearing sections of wall. I haven’t found any discoloured ordeteriorated straw in these places, but don’t know what another 50years of cycling will do.
Most of this moisture enters the wall from gaps in the interior plas-ter. It is especially important to seal up electrical boxes and theplaster seam with the ceiling and/or top plate. Making sure thatthe bales do not have voids or unstuffed areas will prevent moisturefrom accumulating in concentrated areas.”
Newport Partners (2004) state that the movement of water vapour by airflow can transfer large amounts of moisture through building construction.
Dalgliesh (2005), Straube and Schumacher (2003) also suggest that the im-pacts of air convection flow within a wall assembly are of great importance.
A good example of construction with a potential for inner convection currentsis the North American classic: timber frame. The gaps between the drywallinterior and exterior cladding are pathways for humid air to enter. Spacescreated between studs and imperfectly installed insulation create an ideal spacefor convective flows. Solid masonry walls, on the other hand, don’t allow formuch air convection.
As for natural convection flows, plastered straw bale walls seem to be some-where in between these two extremes.
Andersen (2004) suggests that there are considerable air convective currentsin plastered straw bale walls. In his paper, he summarized several independentstudies on the thermal performance of straw bale walls. He discovered that thethermal transmittance (U-value) on large wall sections of completed plasteredstraw bale wall assembly is unexpectedly poor in comparison to thermal trans-mittance through a single straw bale. The major cause for thermal loss withina straw bale wall assembly were air penetration and natural convection flows.
”A computational fluid dynamics model helped to uncover that thenatural convection does not occur predominately through the strawitself. The natural convection can occur within the gaps between the
71
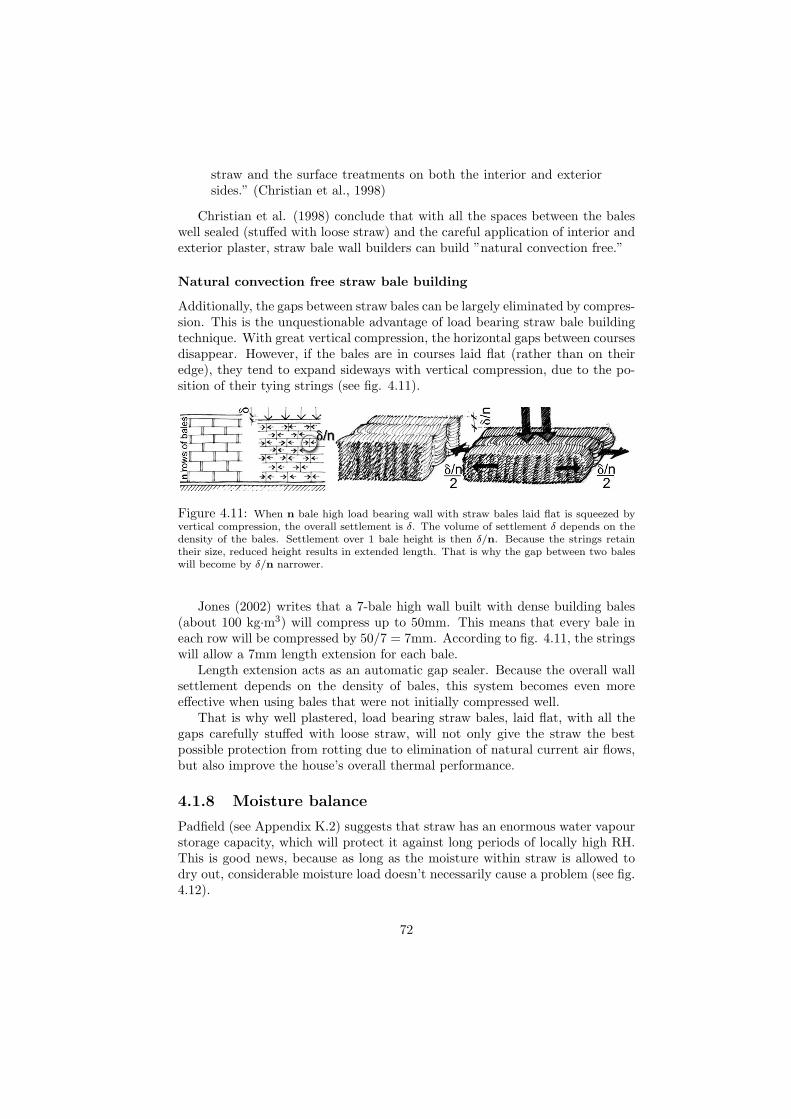
straw and the surface treatments on both the interior and exteriorsides.” (Christian et al., 1998)
Christian et al. (1998) conclude that with all the spaces between the baleswell sealed (stuffed with loose straw) and the careful application of interior andexterior plaster, straw bale wall builders can build ”natural convection free.”
Natural convection free straw bale building
Additionally, the gaps between straw bales can be largely eliminated by compres-sion. This is the unquestionable advantage of load bearing straw bale buildingtechnique. With great vertical compression, the horizontal gaps between coursesdisappear. However, if the bales are in courses laid flat (rather than on theiredge), they tend to expand sideways with vertical compression, due to the po-sition of their tying strings (see fig. 4.11).
Figure 4.11: When n bale high load bearing wall with straw bales laid flat is squeezed byvertical compression, the overall settlement is δ. The volume of settlement δ depends on thedensity of the bales. Settlement over 1 bale height is then δ/n. Because the strings retaintheir size, reduced height results in extended length. That is why the gap between two baleswill become by δ/n narrower.
Jones (2002) writes that a 7-bale high wall built with dense building bales(about 100 kg·m3) will compress up to 50mm. This means that every bale ineach row will be compressed by 50/7 = 7mm. According to fig. 4.11, the stringswill allow a 7mm length extension for each bale.
Length extension acts as an automatic gap sealer. Because the overall wallsettlement depends on the density of bales, this system becomes even moreeffective when using bales that were not initially compressed well.
That is why well plastered, load bearing straw bales, laid flat, with all thegaps carefully stuffed with loose straw, will not only give the straw the bestpossible protection from rotting due to elimination of natural current air flows,but also improve the house’s overall thermal performance.
4.1.8 Moisture balance
Padfield (see Appendix K.2) suggests that straw has an enormous water vapourstorage capacity, which will protect it against long periods of locally high RH.This is good news, because as long as the moisture within straw is allowed todry out, considerable moisture load doesn’t necessarily cause a problem (see fig.4.12).
72
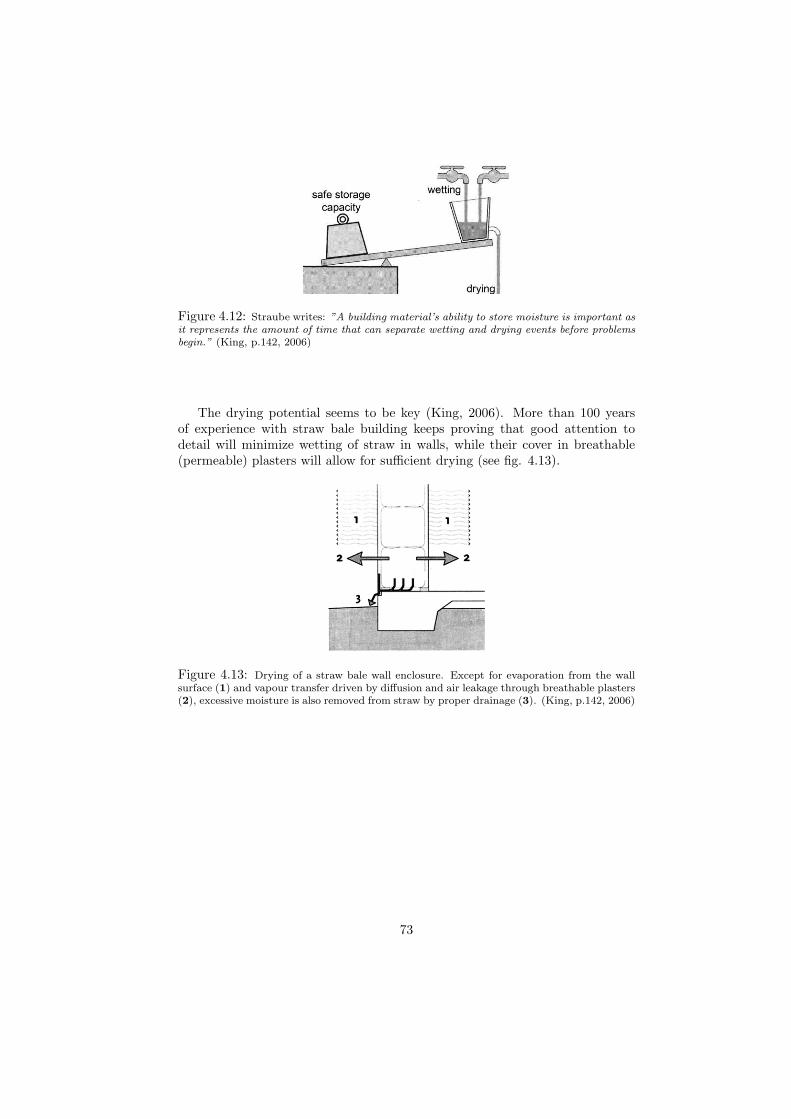
Figure 4.12: Straube writes: ”A building material’s ability to store moisture is important asit represents the amount of time that can separate wetting and drying events before problemsbegin.” (King, p.142, 2006)
The drying potential seems to be key (King, 2006). More than 100 yearsof experience with straw bale building keeps proving that good attention todetail will minimize wetting of straw in walls, while their cover in breathable(permeable) plasters will allow for sufficient drying (see fig. 4.13).
Figure 4.13: Drying of a straw bale wall enclosure. Except for evaporation from the wallsurface (1) and vapour transfer driven by diffusion and air leakage through breathable plasters(2), excessive moisture is also removed from straw by proper drainage (3). (King, p.142, 2006)
73
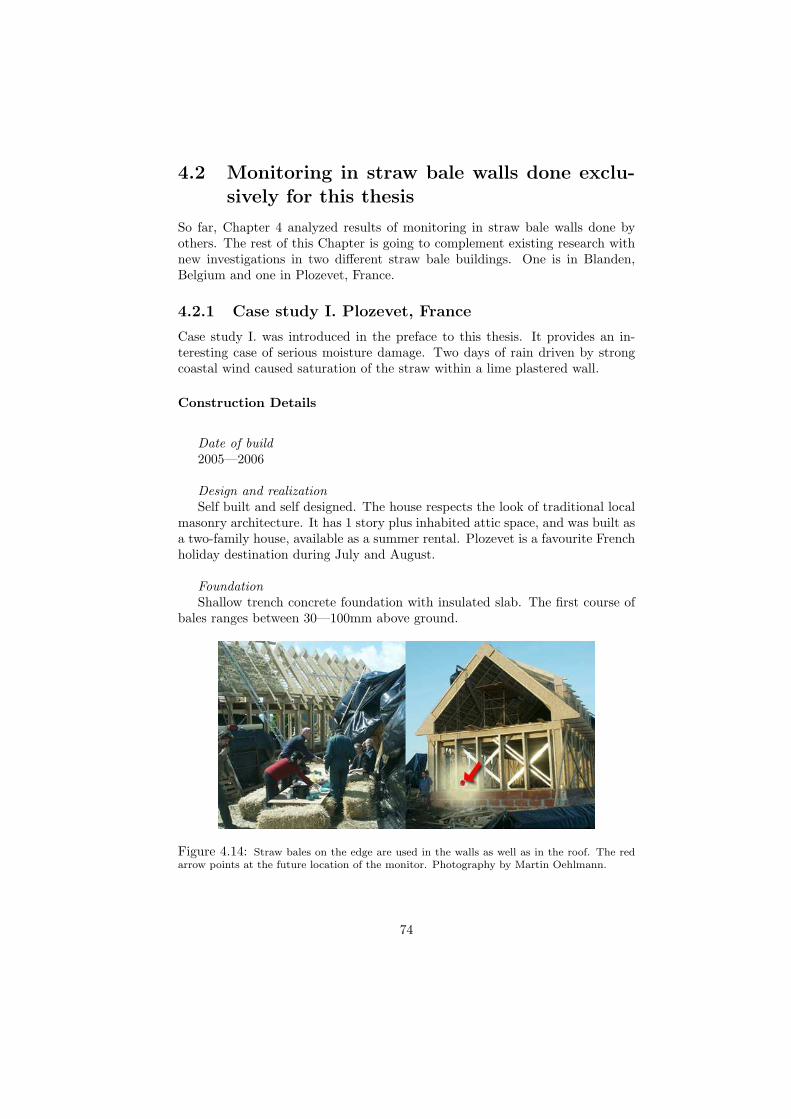
4.2 Monitoring in straw bale walls done exclu-sively for this thesis
So far, Chapter 4 analyzed results of monitoring in straw bale walls done byothers. The rest of this Chapter is going to complement existing research withnew investigations in two different straw bale buildings. One is in Blanden,Belgium and one in Plozevet, France.
4.2.1 Case study I. Plozevet, France
Case study I. was introduced in the preface to this thesis. It provides an in-teresting case of serious moisture damage. Two days of rain driven by strongcoastal wind caused saturation of the straw within a lime plastered wall.
Construction Details
Date of build2005—2006
Design and realizationSelf built and self designed. The house respects the look of traditional local
masonry architecture. It has 1 story plus inhabited attic space, and was built asa two-family house, available as a summer rental. Plozevet is a favourite Frenchholiday destination during July and August.
FoundationShallow trench concrete foundation with insulated slab. The first course of
bales ranges between 30—100mm above ground.
Figure 4.14: Straw bales on the edge are used in the walls as well as in the roof. The redarrow points at the future location of the monitor. Photography by Martin Oehlmann.
74
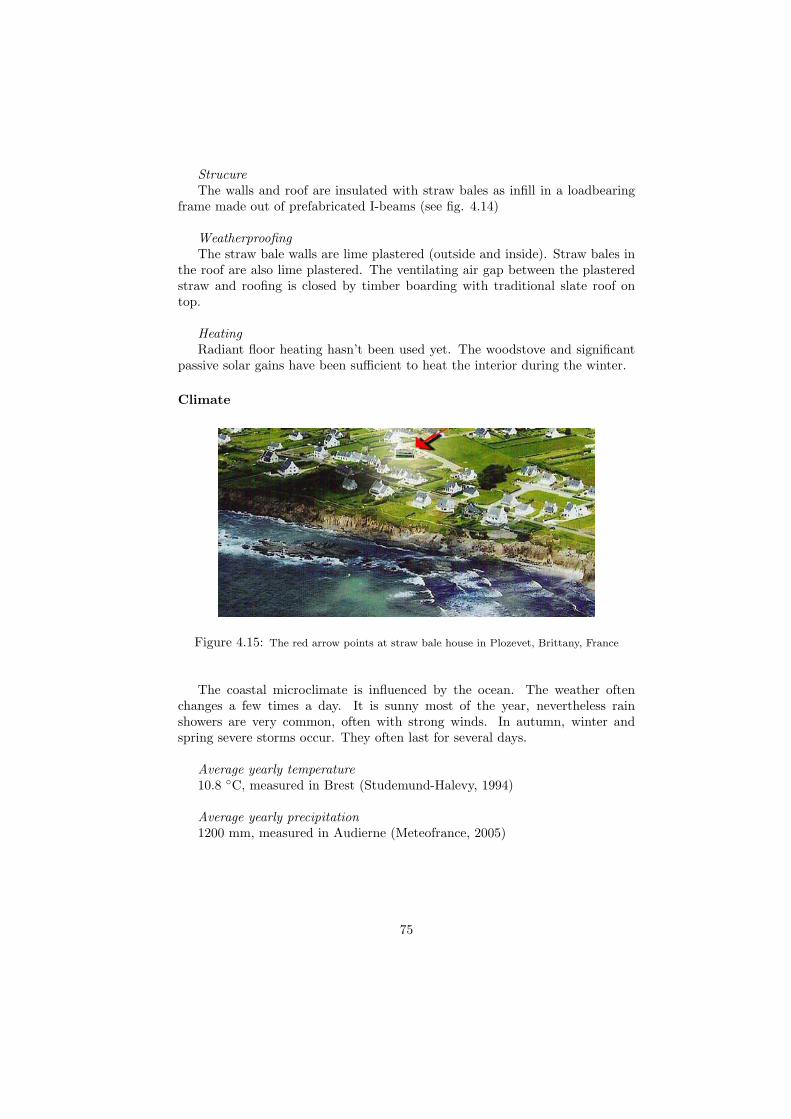
StrucureThe walls and roof are insulated with straw bales as infill in a loadbearing
frame made out of prefabricated I-beams (see fig. 4.14)
WeatherproofingThe straw bale walls are lime plastered (outside and inside). Straw bales in
the roof are also lime plastered. The ventilating air gap between the plasteredstraw and roofing is closed by timber boarding with traditional slate roof ontop.
HeatingRadiant floor heating hasn’t been used yet. The woodstove and significant
passive solar gains have been sufficient to heat the interior during the winter.
Climate
Figure 4.15: The red arrow points at straw bale house in Plozevet, Brittany, France
The coastal microclimate is influenced by the ocean. The weather oftenchanges a few times a day. It is sunny most of the year, nevertheless rainshowers are very common, often with strong winds. In autumn, winter andspring severe storms occur. They often last for several days.
Average yearly temperature10.8 ◦C, measured in Brest (Studemund-Halevy, 1994)
Average yearly precipitation1200 mm, measured in Audierne (Meteofrance, 2005)
75
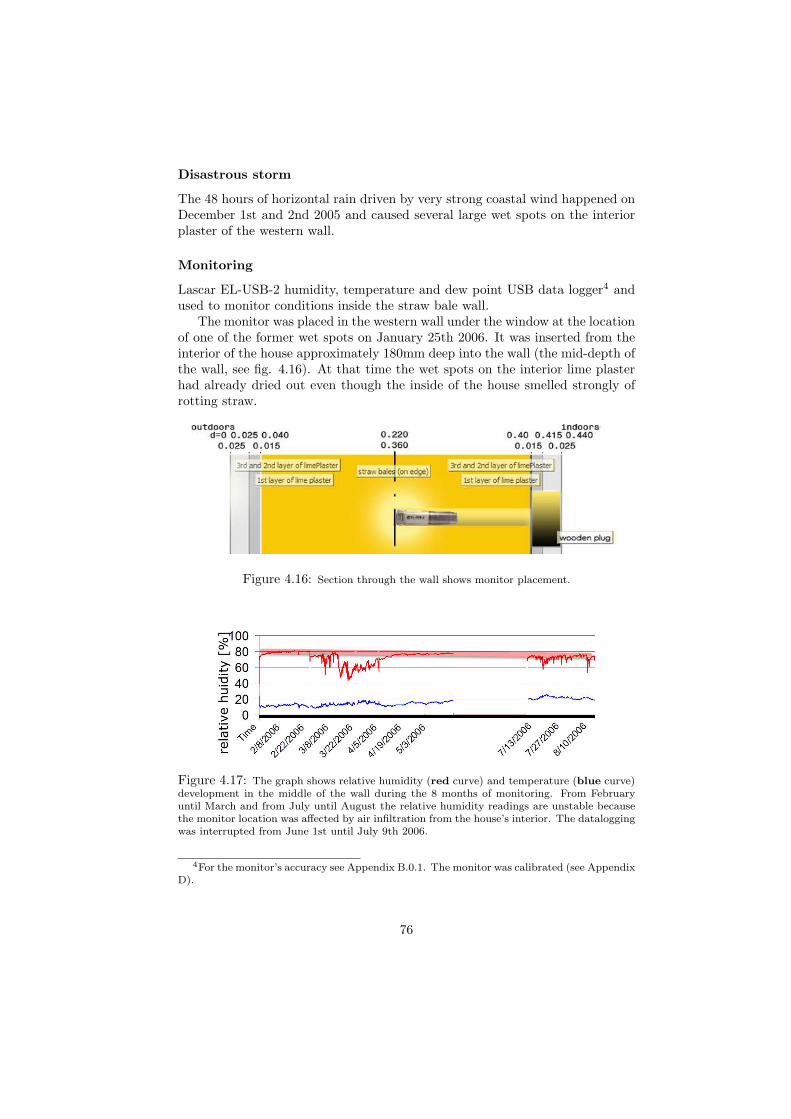
Disastrous storm
The 48 hours of horizontal rain driven by very strong coastal wind happened onDecember 1st and 2nd 2005 and caused several large wet spots on the interiorplaster of the western wall.
Monitoring
Lascar EL-USB-2 humidity, temperature and dew point USB data logger4 andused to monitor conditions inside the straw bale wall.
The monitor was placed in the western wall under the window at the locationof one of the former wet spots on January 25th 2006. It was inserted from theinterior of the house approximately 180mm deep into the wall (the mid-depth ofthe wall, see fig. 4.16). At that time the wet spots on the interior lime plasterhad already dried out even though the inside of the house smelled strongly ofrotting straw.
Figure 4.16: Section through the wall shows monitor placement.
Figure 4.17: The graph shows relative humidity (red curve) and temperature (blue curve)development in the middle of the wall during the 8 months of monitoring. From Februaryuntil March and from July until August the relative humidity readings are unstable becausethe monitor location was affected by air infiltration from the house’s interior. The dataloggingwas interrupted from June 1st until July 9th 2006.
4For the monitor’s accuracy see Appendix B.0.1. The monitor was calibrated (see AppendixD).
76
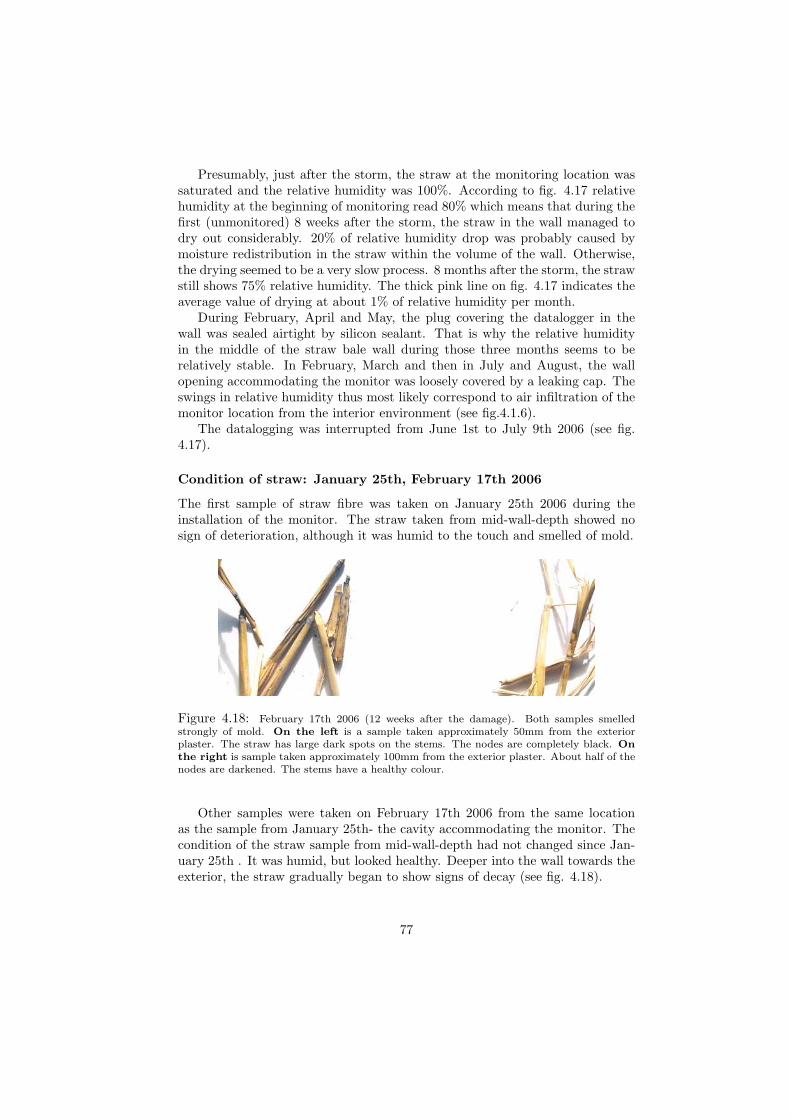
Presumably, just after the storm, the straw at the monitoring location wassaturated and the relative humidity was 100%. According to fig. 4.17 relativehumidity at the beginning of monitoring read 80% which means that during thefirst (unmonitored) 8 weeks after the storm, the straw in the wall managed todry out considerably. 20% of relative humidity drop was probably caused bymoisture redistribution in the straw within the volume of the wall. Otherwise,the drying seemed to be a very slow process. 8 months after the storm, the strawstill shows 75% relative humidity. The thick pink line on fig. 4.17 indicates theaverage value of drying at about 1% of relative humidity per month.
During February, April and May, the plug covering the datalogger in thewall was sealed airtight by silicon sealant. That is why the relative humidityin the middle of the straw bale wall during those three months seems to berelatively stable. In February, March and then in July and August, the wallopening accommodating the monitor was loosely covered by a leaking cap. Theswings in relative humidity thus most likely correspond to air infiltration of themonitor location from the interior environment (see fig.4.1.6).
The datalogging was interrupted from June 1st to July 9th 2006 (see fig.4.17).
Condition of straw: January 25th, February 17th 2006
The first sample of straw fibre was taken on January 25th 2006 during theinstallation of the monitor. The straw taken from mid-wall-depth showed nosign of deterioration, although it was humid to the touch and smelled of mold.
Figure 4.18: February 17th 2006 (12 weeks after the damage). Both samples smelledstrongly of mold. On the left is a sample taken approximately 50mm from the exteriorplaster. The straw has large dark spots on the stems. The nodes are completely black. Onthe right is sample taken approximately 100mm from the exterior plaster. About half of thenodes are darkened. The stems have a healthy colour.
Other samples were taken on February 17th 2006 from the same locationas the sample from January 25th- the cavity accommodating the monitor. Thecondition of the straw sample from mid-wall-depth had not changed since Jan-uary 25th . It was humid, but looked healthy. Deeper into the wall towards theexterior, the straw gradually began to show signs of decay (see fig. 4.18).
77
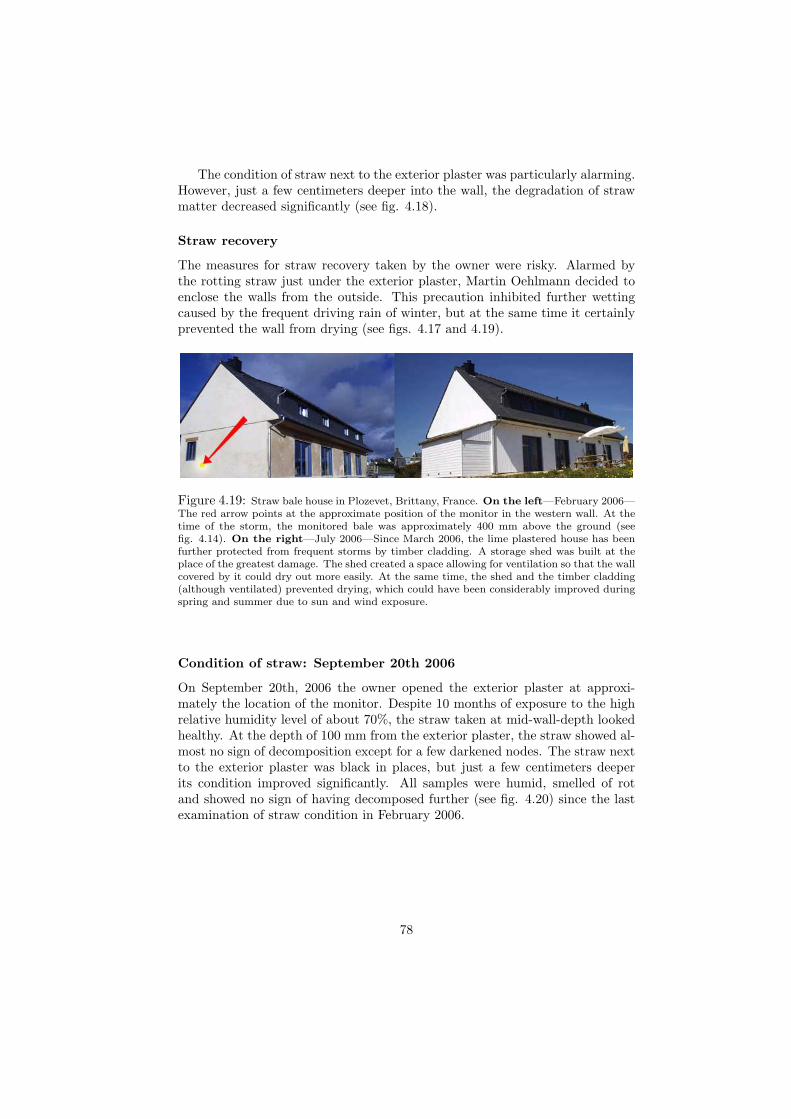
The condition of straw next to the exterior plaster was particularly alarming.However, just a few centimeters deeper into the wall, the degradation of strawmatter decreased significantly (see fig. 4.18).
Straw recovery
The measures for straw recovery taken by the owner were risky. Alarmed bythe rotting straw just under the exterior plaster, Martin Oehlmann decided toenclose the walls from the outside. This precaution inhibited further wettingcaused by the frequent driving rain of winter, but at the same time it certainlyprevented the wall from drying (see figs. 4.17 and 4.19).
Figure 4.19: Straw bale house in Plozevet, Brittany, France. On the left—February 2006—The red arrow points at the approximate position of the monitor in the western wall. At thetime of the storm, the monitored bale was approximately 400 mm above the ground (seefig. 4.14). On the right—July 2006—Since March 2006, the lime plastered house has beenfurther protected from frequent storms by timber cladding. A storage shed was built at theplace of the greatest damage. The shed created a space allowing for ventilation so that the wallcovered by it could dry out more easily. At the same time, the shed and the timber cladding(although ventilated) prevented drying, which could have been considerably improved duringspring and summer due to sun and wind exposure.
Condition of straw: September 20th 2006
On September 20th, 2006 the owner opened the exterior plaster at approxi-mately the location of the monitor. Despite 10 months of exposure to the highrelative humidity level of about 70%, the straw taken at mid-wall-depth lookedhealthy. At the depth of 100 mm from the exterior plaster, the straw showed al-most no sign of decomposition except for a few darkened nodes. The straw nextto the exterior plaster was black in places, but just a few centimeters deeperits condition improved significantly. All samples were humid, smelled of rotand showed no sign of having decomposed further (see fig. 4.20) since the lastexamination of straw condition in February 2006.
78
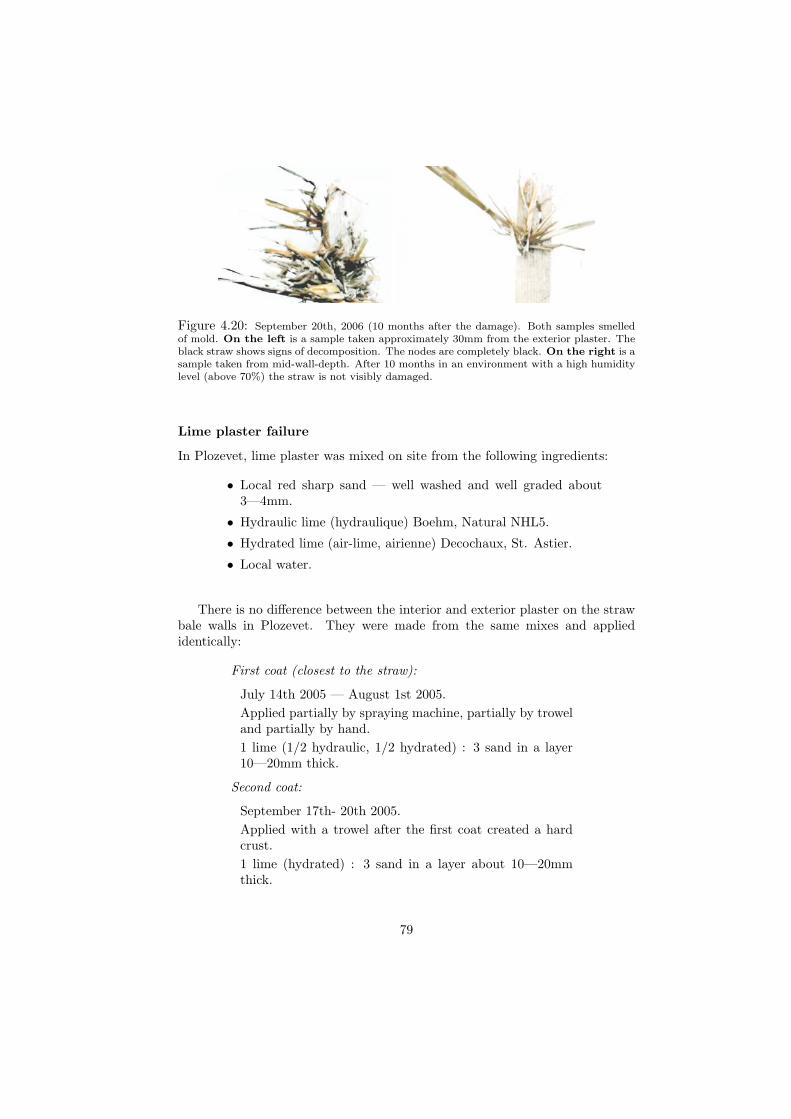
Figure 4.20: September 20th, 2006 (10 months after the damage). Both samples smelledof mold. On the left is a sample taken approximately 30mm from the exterior plaster. Theblack straw shows signs of decomposition. The nodes are completely black. On the right is asample taken from mid-wall-depth. After 10 months in an environment with a high humiditylevel (above 70%) the straw is not visibly damaged.
Lime plaster failure
In Plozevet, lime plaster was mixed on site from the following ingredients:
• Local red sharp sand — well washed and well graded about3—4mm.
• Hydraulic lime (hydraulique) Boehm, Natural NHL5.
• Hydrated lime (air-lime, airienne) Decochaux, St. Astier.
• Local water.
There is no difference between the interior and exterior plaster on the strawbale walls in Plozevet. They were made from the same mixes and appliedidentically:
First coat (closest to the straw):
July 14th 2005 — August 1st 2005.Applied partially by spraying machine, partially by troweland partially by hand.1 lime (1/2 hydraulic, 1/2 hydrated) : 3 sand in a layer10—20mm thick.
Second coat:
September 17th- 20th 2005.Applied with a trowel after the first coat created a hardcrust.1 lime (hydrated) : 3 sand in a layer about 10—20mmthick.
79
Third coat:
October 1st-6th 2005Applied by a trowel after the second coat created a hardcrust.1 lime (hydrated) : 3 sand in a layer about 3-5mm thick.
Simon Ayres, the director of Lime Green, the British lime producer whopromotes healthy, breathable buildings, was interviewed for this article, as wellas Barbara Jones of Amazon Nails, the UK’s foremost straw bale building spe-cialist, in order to give their expertise on Plozevet’s lime plaster (see AppendixA.1 and A.4). While crumbling a sample of plaster from Plozevet in their hands,they both independently agreed that the plaster didn’t go through enough car-bonation to protect the straw from the driving rain.
For sufficient protection from driving rain, Jones suggests that the last coatof lime plaster needed to have a chance to carbonate for at least three months,but the duration varies according to the weather conditions. Ayres, who seemsto know the rough weather at the coast of Brittany well, suggests that underthose specific conditions the third coat of plaster made of (air, or hydrated)lime would need to carbonate for at least five months to give the straw sufficientprotection from driving rain.
According to Ayres, the carbonation of lime is a chemical process that hap-pens only in an environment with temperatures above 8◦C. Since the completionof the exterior plaster on 6 October 2005 till the event of the storm on 1-2 De-cember 2005, 2 months had elapsed. 16 days out of those 2 months had anaverage daily temperature below 8◦C (Meteo, 2005), which means that the lastprotective layer of lime plaster was able to carbonate before the incident foronly about 1 and a half months. Additionally, Ayres says that effective car-bonation requires a moderate level of ambient humidity. In this case, the car-bonation process was further slowed by frequent driving rain during November2005 which kept the plaster soaking wet for long periods of time. Furthermore,temperatures in the middle of November 2005 were often below freezing (Meteo,2005), causing serious plaster disintegration in places.
Jones has been lime plastering straw bale buildings in harsh climates suchas Wales, Scotland and Ireland since the mid- nineties and all of those buildingsseem to perform remarkably well. Amazon Nails use lime putty in their plastermixes. However, Jones is not quite sure if the properly made and cured limeplaster itself would be able to withstand driving rain directly by the Atlanticocean. In extreme cases, such as Plozevet, she would recommend giving thehouse additional protection from the wind by trees, or until trees grow, a naturalscreen of some sort.
Resume
On December 2nd, 2005 the straw throughout the whole wall section at thelocation of the monitor was saturated with water. Since then the interior of
80
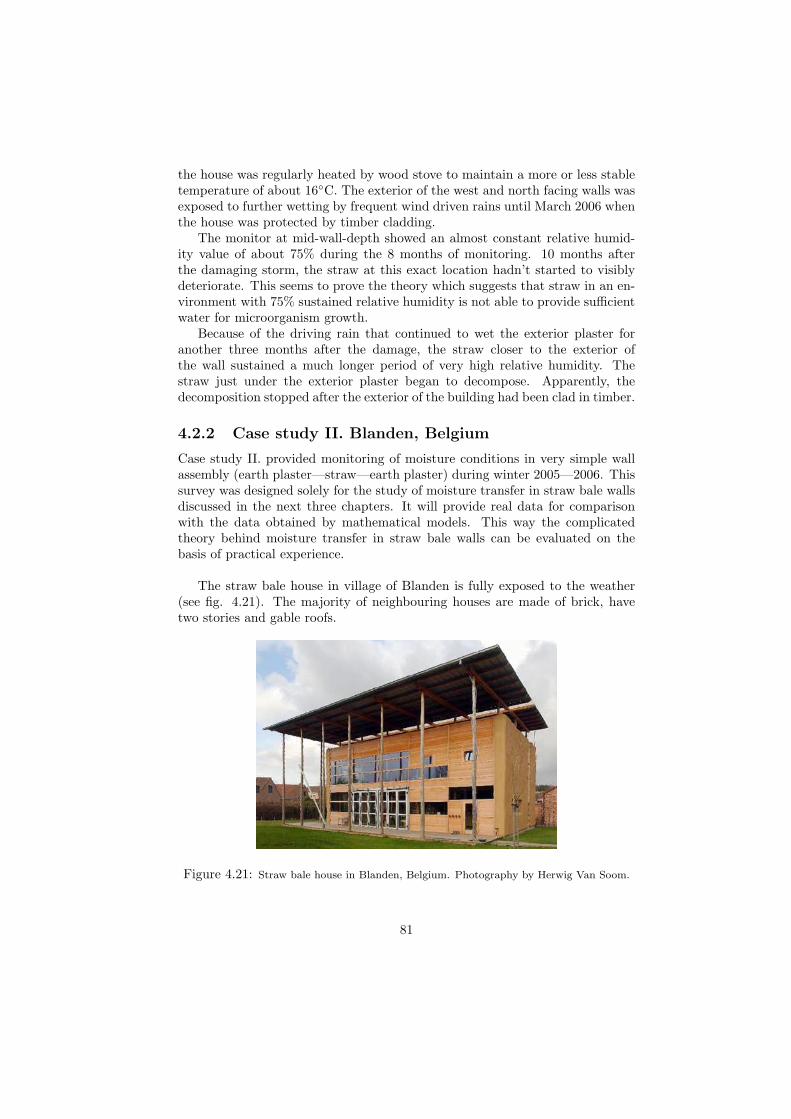
the house was regularly heated by wood stove to maintain a more or less stabletemperature of about 16◦C. The exterior of the west and north facing walls wasexposed to further wetting by frequent wind driven rains until March 2006 whenthe house was protected by timber cladding.
The monitor at mid-wall-depth showed an almost constant relative humid-ity value of about 75% during the 8 months of monitoring. 10 months afterthe damaging storm, the straw at this exact location hadn’t started to visiblydeteriorate. This seems to prove the theory which suggests that straw in an en-vironment with 75% sustained relative humidity is not able to provide sufficientwater for microorganism growth.
Because of the driving rain that continued to wet the exterior plaster foranother three months after the damage, the straw closer to the exterior ofthe wall sustained a much longer period of very high relative humidity. Thestraw just under the exterior plaster began to decompose. Apparently, thedecomposition stopped after the exterior of the building had been clad in timber.
4.2.2 Case study II. Blanden, Belgium
Case study II. provided monitoring of moisture conditions in very simple wallassembly (earth plaster—straw—earth plaster) during winter 2005—2006. Thissurvey was designed solely for the study of moisture transfer in straw bale wallsdiscussed in the next three chapters. It will provide real data for comparisonwith the data obtained by mathematical models. This way the complicatedtheory behind moisture transfer in straw bale walls can be evaluated on thebasis of practical experience.
The straw bale house in village of Blanden is fully exposed to the weather(see fig. 4.21). The majority of neighbouring houses are made of brick, havetwo stories and gable roofs.
Figure 4.21: Straw bale house in Blanden, Belgium. Photography by Herwig Van Soom.
81
Construction Details
Date of build2001—2002
Self built and self designed by an architect. The house has 2 stories plus alarge outdoor terrace under the roof. The majority of the interior is a doublestory living room. There is also a kitchen downstairs. All the bedrooms andone bathroom are upstairs.
FoundationTrench concrete foundation with insulated slab. The first course of bales is
about 100—200mm above ground.
StrucureRound timber columns three stories high carry the 2nd floor, roof terrace
and roof timber joists creating a load bearing timber frame construction. Thestraw bale walls were built as self bearing, independently of the timber frame.They were afterwards anchored to the frame by long screws for stability reasons.The southern wall is partially glazed, partially timber clad. Opaque areas areinsulated by mineral wool. Mineral wool is also used as horizontal insulationunder the roof terrace. There is a lightweight corrugated metal roof on top ofthe frame at the height of 9m above the ground.
WeatherproofingThe straw bale walls are earth plastered (outside and inside). Commercially
produced earth plaster (CLAYTEC, Lehm Unterputz) was mixed with waterand sprayed in three layers onto both sides of straw bales. The southern facadeis protected by about 4m and the western facade by about a 3m roof overhang.East and north facades are left unprotected.
HeatingThe house is heated by a warm air distribution system, which is supported
by significant passive solar gain in winter.
Climate
The weather in Blanden is mild. The winds are broken by the surroundingbuildings and according to the owner there are almost never northern or easternwinds blowing in this locality.
Average yearly temperature (Bruxelles)9.8 ◦C (ISHS, 2005)Average yearly precipitation (Bruxelles)675 mm (ISHS, 2005)
82
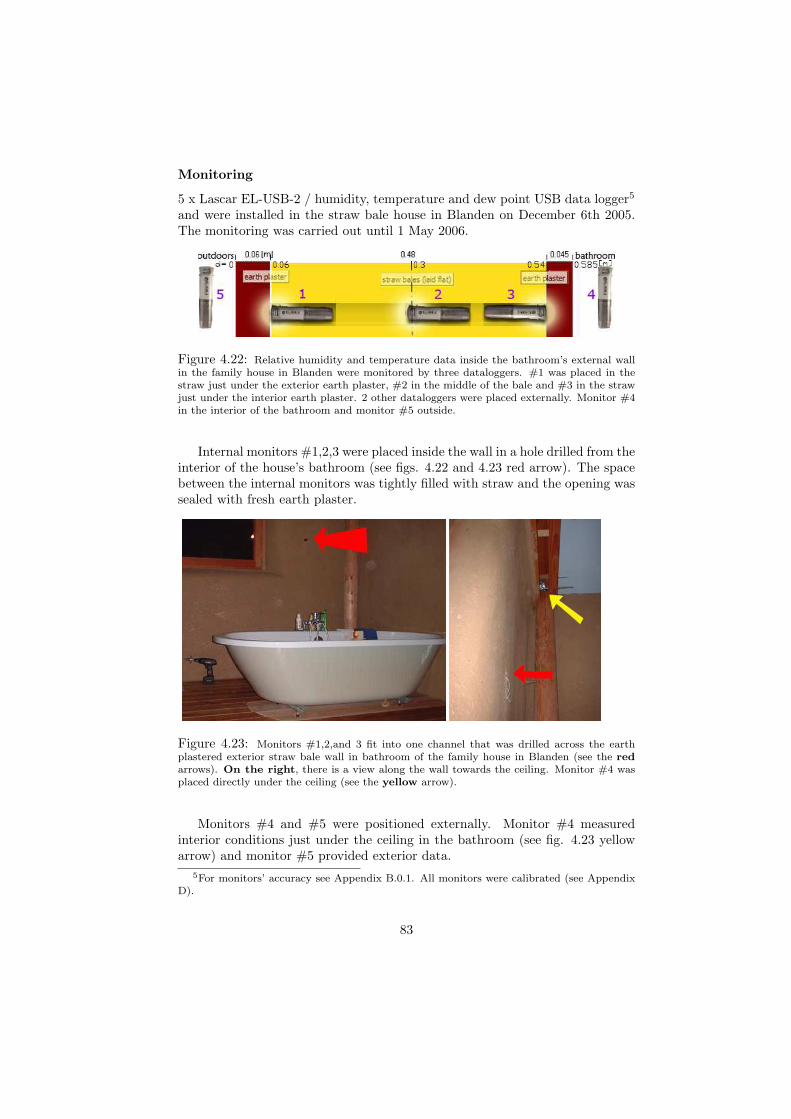
Monitoring
5 x Lascar EL-USB-2 / humidity, temperature and dew point USB data logger5
and were installed in the straw bale house in Blanden on December 6th 2005.The monitoring was carried out until 1 May 2006.
Figure 4.22: Relative humidity and temperature data inside the bathroom’s external wallin the family house in Blanden were monitored by three dataloggers. #1 was placed in thestraw just under the exterior earth plaster, #2 in the middle of the bale and #3 in the strawjust under the interior earth plaster. 2 other dataloggers were placed externally. Monitor #4in the interior of the bathroom and monitor #5 outside.
Internal monitors #1,2,3 were placed inside the wall in a hole drilled from theinterior of the house’s bathroom (see figs. 4.22 and 4.23 red arrow). The spacebetween the internal monitors was tightly filled with straw and the opening wassealed with fresh earth plaster.
Figure 4.23: Monitors #1,2,and 3 fit into one channel that was drilled across the earthplastered exterior straw bale wall in bathroom of the family house in Blanden (see the redarrows). On the right, there is a view along the wall towards the ceiling. Monitor #4 wasplaced directly under the ceiling (see the yellow arrow).
Monitors #4 and #5 were positioned externally. Monitor #4 measuredinterior conditions just under the ceiling in the bathroom (see fig. 4.23 yellowarrow) and monitor #5 provided exterior data.
5For monitors’ accuracy see Appendix B.0.1. All monitors were calibrated (see AppendixD).
83
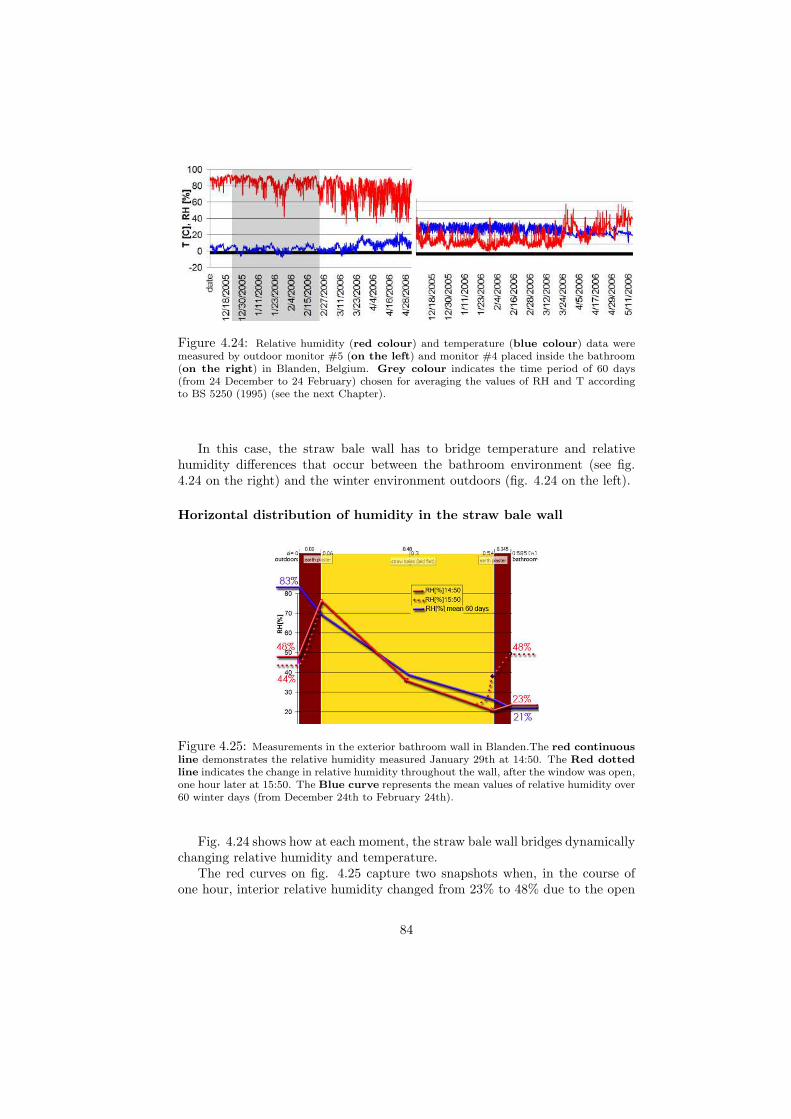
Figure 4.24: Relative humidity (red colour) and temperature (blue colour) data weremeasured by outdoor monitor #5 (on the left) and monitor #4 placed inside the bathroom(on the right) in Blanden, Belgium. Grey colour indicates the time period of 60 days(from 24 December to 24 February) chosen for averaging the values of RH and T accordingto BS 5250 (1995) (see the next Chapter).
In this case, the straw bale wall has to bridge temperature and relativehumidity differences that occur between the bathroom environment (see fig.4.24 on the right) and the winter environment outdoors (fig. 4.24 on the left).
Horizontal distribution of humidity in the straw bale wall
Figure 4.25: Measurements in the exterior bathroom wall in Blanden.The red continuousline demonstrates the relative humidity measured January 29th at 14:50. The Red dottedline indicates the change in relative humidity throughout the wall, after the window was open,one hour later at 15:50. The Blue curve represents the mean values of relative humidity over60 winter days (from December 24th to February 24th).
Fig. 4.24 shows how at each moment, the straw bale wall bridges dynamicallychanging relative humidity and temperature.
The red curves on fig. 4.25 capture two snapshots when, in the course ofone hour, interior relative humidity changed from 23% to 48% due to the open
84
window and exterior relative humidity dropped from 48% to 44%. The bluecurve on fig. 4.25 represents the mean values measured over 60 winter days(calculated from 24 December till 24 February). The juxtaposition of the mean60 day values with the immediate measurements indicates that the variations ofrelative humidity within the straw portion of a wall are minimal. The dynamicchanges (daily fluctuations) of ambient relative humidity are registered mainlywithin the interior and exterior earth plaster (see fig. 4.25).
Resume:
After being part of the wall for 5 years, the straw samples taken out duringmonitor placement were found to be completely dry, healthy, with a fresh smell.Although the wall is facing the interior of the bathroom, relative humiditythroughout the wall turned out to be surprisingly low (especially close to theinterior) due to the low levels of interior relative humidity (see fig. 4.24). Lowrelative humidity in the bathroom during winter was caused by relatively highinterior temperature sometimes reaching over 30◦C.
4.3 Summary of Chapter 4
The summary of the monitoring investigated by this thesis can be found inAppendix B.0.3. Out of all the cases available for this research (see Section4.1), the most frequent cause of unacceptable moisture content levels in strawbale walls (close to 100% of relative humidity of air surrounding straw) waswind driven rain—seven cases. In one case the unacceptable moisture contentlevels were caused by sustained high ambient relative humidity.
Even though wind driven rain raises moisture levels in straw bale walls rela-tively quickly, the straw often manages to dry out without imposing any seriousdamage. The actual decomposition of straw caused by wind driven rain wasrecorded only in two cases. Serious decay of straw was caused by rising damp inthree cases and in one case by a leaking window sill. All of this damage couldhave been avoided by proper design and careful execution.
One of the two case studies monitored exclusively for the purpose of thisthesis, case study I. (see Section 4.2.1), showed how easily proper protection ofstraw bale walls could be underestimated. It provided straw samples in orderto demonstrate that despite 10 months in an environment with sustained highrelative humidity (above 75%), the great majority of straw in the wall didn’tstart to visibly mould.
The other case study, case study II. (see Section 4.2.2) provided useful datato support the research in next chapters concerning a theory of moisture transferin a straw bale wall.
85
Chapter 5
Moisture transfer in a strawbale wall, steady statecalculation
Previous chapters considered the theory and practice of straw degradation in awall in some detail. They examined the moisture requirements for mold growthand relative humidity as its main indicator. Analyzes of case studies revealedthat the risk of water penetration within a straw bale wall can in each case beminimized by proper design and careful execution. However, another concernof this thesis is the evaluation of moisture behaviour within different straw balewall assemblies in different conditions by mathematical model. Therefore, itis necessary to introduce the main principles of mathematics behind moisturetransfer in straw bale walls.
”Moisture transfer in porous media involves a complex interaction ofdifferent transport mechanisms, their driving forces, and the effectsof available capacity and possible temperature gradients” (Pheukuri,p. 17, 2003).
While the next Chapter will consider all the possible influences on moisturetransfer using an accurate mathematical model, it will be beneficial to startwith a simple analogy. This Chapter focuses on only one of the aspects of themoisture transfer mechanism through a wall: on water vapour diffusion withwater vapour pressure as its driving force.
Even though scientists doubt that the water vapour by itself has any majorsignificance in the moisture transition through a building envelope (Padfield,1998), a mathematical model for the prediction of water vapour condensationin a wall has been widely adopted by norms and standards all over the world.
86
For example, the British standard BS 5250 (1995)1, European norm EN13788 (2002), German standard DIN 4108, as well as CIBSE (1999)2 recom-mend testing external building envelopes for condensation due to water vapourmovement using a simplistic theoretical model developed in the 1950’s in Ger-many by H. Glaser (Sanders, 2005). His model is based on the assumption thatcondensation inside a wall occurs where the value of calculated water vaporpressure within a wall reaches its saturation level.
Glaser’s mathematical model will serve as an introduction to the theoryunder investigation.
5.1 Principle of Glaser’s model; Introduction tothe theory of moisture transfer
Mathematical (or theoretical) models are based on mathematical theory andphysics. They are equations describing certain natural phenomenon. The cre-ator of the model, who forms the equations, decides what factors are relevant tothe problem, observes their mutual relationship and describes it in mathemati-cal language. It is an evolving process. Once a model answers a given question,it should be critically examined. If the model doesn’t reflect the observed realityof the phenomenon with satisfactory accuracy, the equations are modified.
”Generally the success of a model depends on how easily it can beused and how accurate are its predictions.” (Edwards & Hamson,1990)
The success of Glaser’s model resides in its simplicity. The model assumesthat buildings are enclosures that behave like sealed boxes (see the experimentdescribed in Section 3.3). A source of water (e.g. bathroom, kitchen, laundryroom) inside of such an enclosure generates water vapour molecules in the air.Free water vapour molecules exert pressure on the interior of a building enve-lope. There is a water vapour pressure on the envelope from the outside aswell. However, due to the differing climate conditions outdoors, water vapourpressures on each side of a wall differ. This difference is called the water vapourpressure gradient and results in a flow of water vapour across the external wall.
The flow of water vapour molecules happens only through a building envelopethat is made of permeable materials. In wall assemblies containing a continuouslayer of non permeable material, like plastic, metal or glass, the exchange ofwater vapour between the interior and exterior of a building doesn’t happen.Nonetheless, porous hygroscopic materials are permeable and the water vapourmigrating through their volumes is prone to condensation.
Water vapour gradually condenses in the pores of hygroscopic material withincreasing relative humidity due to capillary condensation, as was described inChapter 3. Glaser’s model doesn’t consider capillary condensation. It simply
1Code of practice for control of condensation in buildings2Guide A - Environmental Design
87
expects that a permeable material remains completely dry until dew point con-dition is reached somewhere within a material (for an explanation of dew pointcondition, see Section 3.4).
Besides water vapour flow across building envelope, Glaser’s model allows fora flow of thermal energy. The difference between the temperature outside andinside of a building (temperature gradient) drives heat from the warmer side tothe colder side of a wall. Let’s assume that in winter, in a heating climate, theinterior surface of an external wall is gaining heat. As the permeable materialof that wall cools towards the cold exterior, the material (which, according toGlaser’s model, is still completely dry) might at a certain point become coldenough to cause water vapour to condense within a wall. It is only at this pointand at that exact place that Glaser’s model considers a permeable material wet(100% relative humidity). This type of condensation is known as interstitialcondensation.
The purpose of Glaser’s model is to predict the long term build-up of in-terstitial condensation (CIBSE, 1999). Architects and engineers usually use itat the design stage of a building, particularly when choosing the materials tobe used in the building’s envelope. The prediction of interstitial condensationbased on Glaser’s method often determines the feasibility of external walls in fu-ture houses. It is a widely used tool and therefore useful to question its accuracyand relevance.
5.2 Designing straw bale walls in Blanden; Pre-diction of interstitial condensation build upusing Glaser’s model
This Section uses a calculation based on Glaser’s model for the prediction of in-terstitial condensation in external walls in the way that designers and architectsare advised to use it by British Standard BS 5250 (1995) and CIBSE, Guide A(1999)3. The temperature and relative humidity monitoring that was done forthis thesis inside the existing external straw bale wall of the bathroom in thefamily house in Blanden, Belgium (see case study II., Section 4.2.2), gives thefollowing calculation a point of reference.
At first the prediction will be made as though the house in Blanden hasn’tbeen built yet and is still in the design stage. Later the model’s results willbe compared with real monitored data. This way, Glaser’s model will not onlyprovide a good exercise that leads to a better understanding of moisture transferthrough a wall, but the juxtaposition of its results with the data and measure-ments of the existing wall in the occupied building will give a clear picture ofmodel’s accuracy.
3The author used CIBSE, Guide A (1999) - Environmental Design - as a guideline for thefollowing calculation. However, CIBSE refers to BS 5250.
88
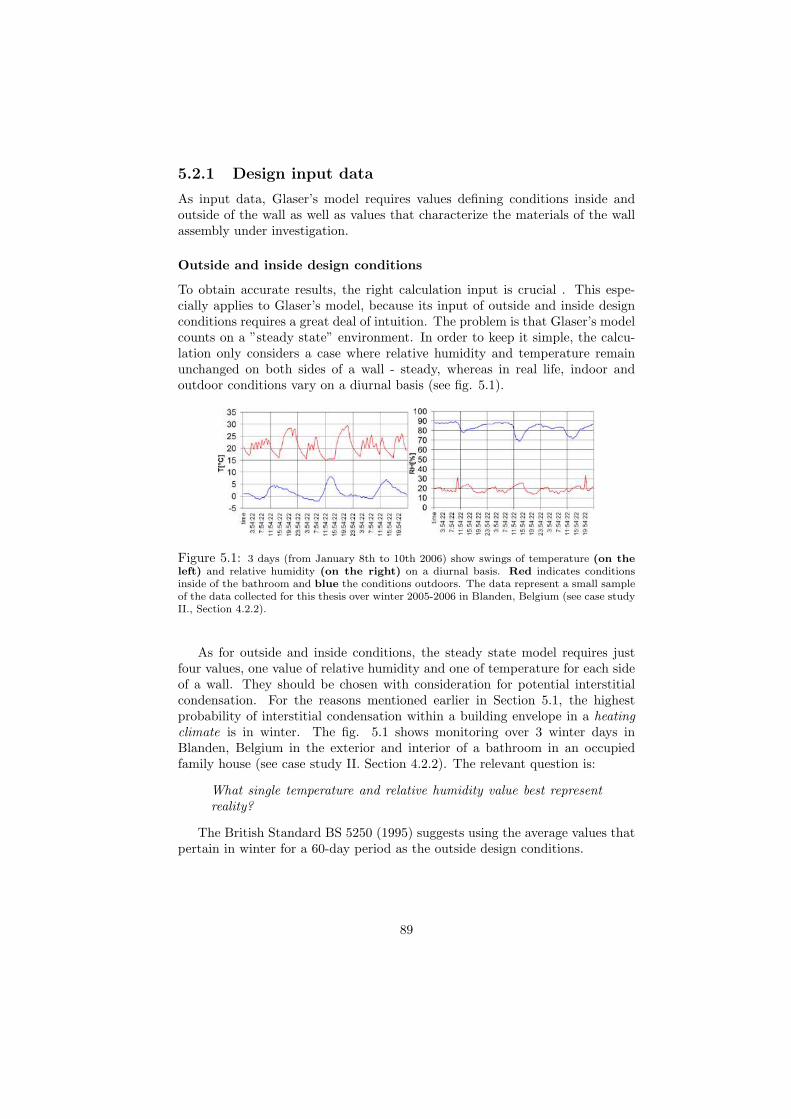
5.2.1 Design input data
As input data, Glaser’s model requires values defining conditions inside andoutside of the wall as well as values that characterize the materials of the wallassembly under investigation.
Outside and inside design conditions
To obtain accurate results, the right calculation input is crucial . This espe-cially applies to Glaser’s model, because its input of outside and inside designconditions requires a great deal of intuition. The problem is that Glaser’s modelcounts on a ”steady state” environment. In order to keep it simple, the calcu-lation only considers a case where relative humidity and temperature remainunchanged on both sides of a wall - steady, whereas in real life, indoor andoutdoor conditions vary on a diurnal basis (see fig. 5.1).
Figure 5.1: 3 days (from January 8th to 10th 2006) show swings of temperature (on theleft) and relative humidity (on the right) on a diurnal basis. Red indicates conditionsinside of the bathroom and blue the conditions outdoors. The data represent a small sampleof the data collected for this thesis over winter 2005-2006 in Blanden, Belgium (see case studyII., Section 4.2.2).
As for outside and inside conditions, the steady state model requires justfour values, one value of relative humidity and one of temperature for each sideof a wall. They should be chosen with consideration for potential interstitialcondensation. For the reasons mentioned earlier in Section 5.1, the highestprobability of interstitial condensation within a building envelope in a heatingclimate is in winter. The fig. 5.1 shows monitoring over 3 winter days inBlanden, Belgium in the exterior and interior of a bathroom in an occupiedfamily house (see case study II. Section 4.2.2). The relevant question is:
What single temperature and relative humidity value best representreality?
The British Standard BS 5250 (1995) suggests using the average values thatpertain in winter for a 60-day period as the outside design conditions.
89
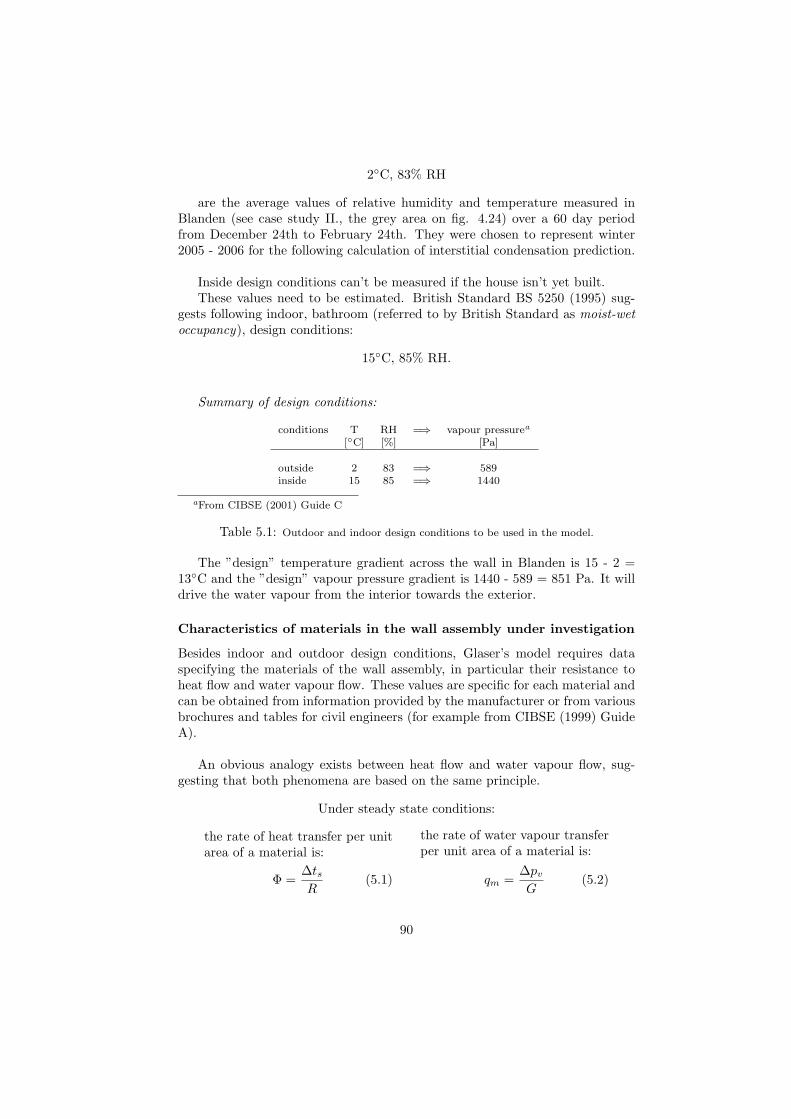
2◦C, 83% RH
are the average values of relative humidity and temperature measured inBlanden (see case study II., the grey area on fig. 4.24) over a 60 day periodfrom December 24th to February 24th. They were chosen to represent winter2005 - 2006 for the following calculation of interstitial condensation prediction.
Inside design conditions can’t be measured if the house isn’t yet built.These values need to be estimated. British Standard BS 5250 (1995) sug-
gests following indoor, bathroom (referred to by British Standard as moist-wetoccupancy), design conditions:
15◦C, 85% RH.
Summary of design conditions:
conditions T RH =⇒ vapour pressurea
[◦C] [%] [Pa]
outside 2 83 =⇒ 589inside 15 85 =⇒ 1440
aFrom CIBSE (2001) Guide C
Table 5.1: Outdoor and indoor design conditions to be used in the model.
The ”design” temperature gradient across the wall in Blanden is 15 - 2 =13◦C and the ”design” vapour pressure gradient is 1440 - 589 = 851 Pa. It willdrive the water vapour from the interior towards the exterior.
Characteristics of materials in the wall assembly under investigation
Besides indoor and outdoor design conditions, Glaser’s model requires dataspecifying the materials of the wall assembly, in particular their resistance toheat flow and water vapour flow. These values are specific for each material andcan be obtained from information provided by the manufacturer or from variousbrochures and tables for civil engineers (for example from CIBSE (1999) GuideA).
An obvious analogy exists between heat flow and water vapour flow, sug-gesting that both phenomena are based on the same principle.
Under steady state conditions:
the rate of heat transfer per unitarea of a material is:
the rate of water vapour transferper unit area of a material is:
Φ =∆tsR
(5.1) qm =∆pv
G(5.2)
90
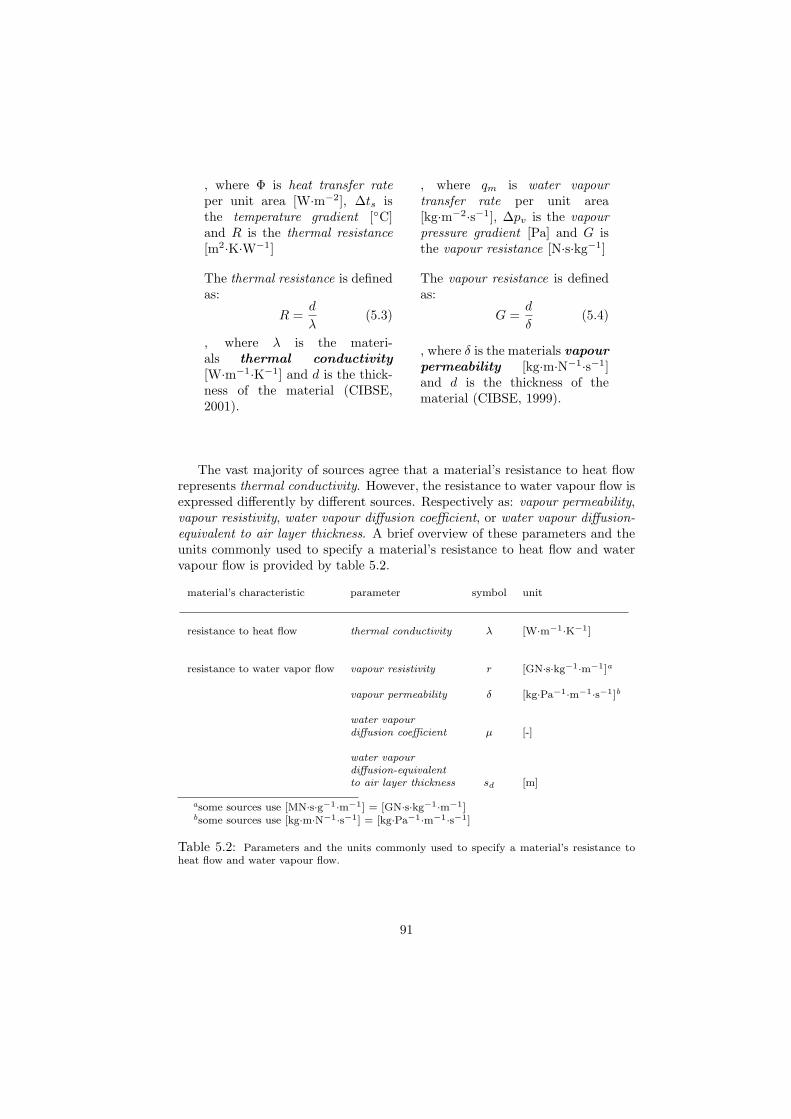
, where Φ is heat transfer rateper unit area [W·m−2], ∆ts isthe temperature gradient [◦C]and R is the thermal resistance[m2·K·W−1]
, where qm is water vapourtransfer rate per unit area[kg·m−2·s−1], ∆pv is the vapourpressure gradient [Pa] and G isthe vapour resistance [N·s·kg−1]
The thermal resistance is definedas:
The vapour resistance is definedas:
R =d
λ(5.3) G =
d
δ(5.4)
, where λ is the materi-als thermal conductivity[W·m−1·K−1] and d is the thick-ness of the material (CIBSE,2001).
, where δ is the materials vapourpermeability [kg·m·N−1·s−1]and d is the thickness of thematerial (CIBSE, 1999).
The vast majority of sources agree that a material’s resistance to heat flowrepresents thermal conductivity. However, the resistance to water vapour flow isexpressed differently by different sources. Respectively as: vapour permeability,vapour resistivity, water vapour diffusion coefficient, or water vapour diffusion-equivalent to air layer thickness. A brief overview of these parameters and theunits commonly used to specify a material’s resistance to heat flow and watervapour flow is provided by table 5.2.
material’s characteristic parameter symbol unit
resistance to heat flow thermal conductivity λ [W·m−1·K−1]
resistance to water vapor flow vapour resistivity r [GN·s·kg−1·m−1]a
vapour permeability δ [kg·Pa−1·m−1·s−1]b
water vapourdiffusion coefficient µ [-]
water vapourdiffusion-equivalentto air layer thickness sd [m]
asome sources use [MN·s·g−1·m−1] = [GN·s·kg−1·m−1]bsome sources use [kg·m·N−1·s−1] = [kg·Pa−1·m−1·s−1]
Table 5.2: Parameters and the units commonly used to specify a material’s resistance toheat flow and water vapour flow.
91
All of the different parameters indicating a material’s water vapour resistancebasically express the same value. The basic definitions are discussed in thefollowing text:
Reciprocal value to vapour permeability (δ) [kg·m·N−1·s−1] (see5.4) is vapour resistivity (r) [GN·s·kg−1·m−1]:
r =1
δ ∗ 1 000 000 000(5.5)
Vapour diffusion coefficient (µ) [-] indicates how much lessvapour permeable is the layer of a material in comparison to the layerof air with the same thickness:
µ =δair
δmaterial(5.6)
, where δair = 1.884·10−10 kg·Pa−1·m−1·s−1 at T = 5◦C and atambient atmospheric pressure of 101.325 kPa (Tywoniak and Kul-hanek, 1995).
The great advantage of vapour diffusion coefficient µ is its tem-perature independence. In general, vapour permeability δ is depen-dent on temperature. While both, δair and δmaterial change propor-tionately with temperature, µ remains constant.
Water vapour diffusion-equivalent to air layer thickness(sd) [m] quantifies (for comparison’s sake), the thickness of motion-less air layer that has equivalent µ to µ of given material (µair =µmaterial):
sd = µ ∗ d (5.7)
, where d [m] is thickness of material and µ [-] is materials vapourdiffusion coefficient (Tywoniak and Kulhanek, 1995; Time and Uvs-lokk, 2003).
sd is also temperature independent.
A more detailed explanation of these expressions and terms is given in ENISO12572:2001 (Time and Uvsløkk, 2003).
Following Glaser’s model, a calculation based on BS 5250 (1996) will usevapour resistivity (r) [GN·s·kg−1·m−1] as the parameter defining resistance towater vapour flow4.
4However, the computer simulation model explored in the next Chapter requires a vapourdiffusion coefficient (µ) [-].
92
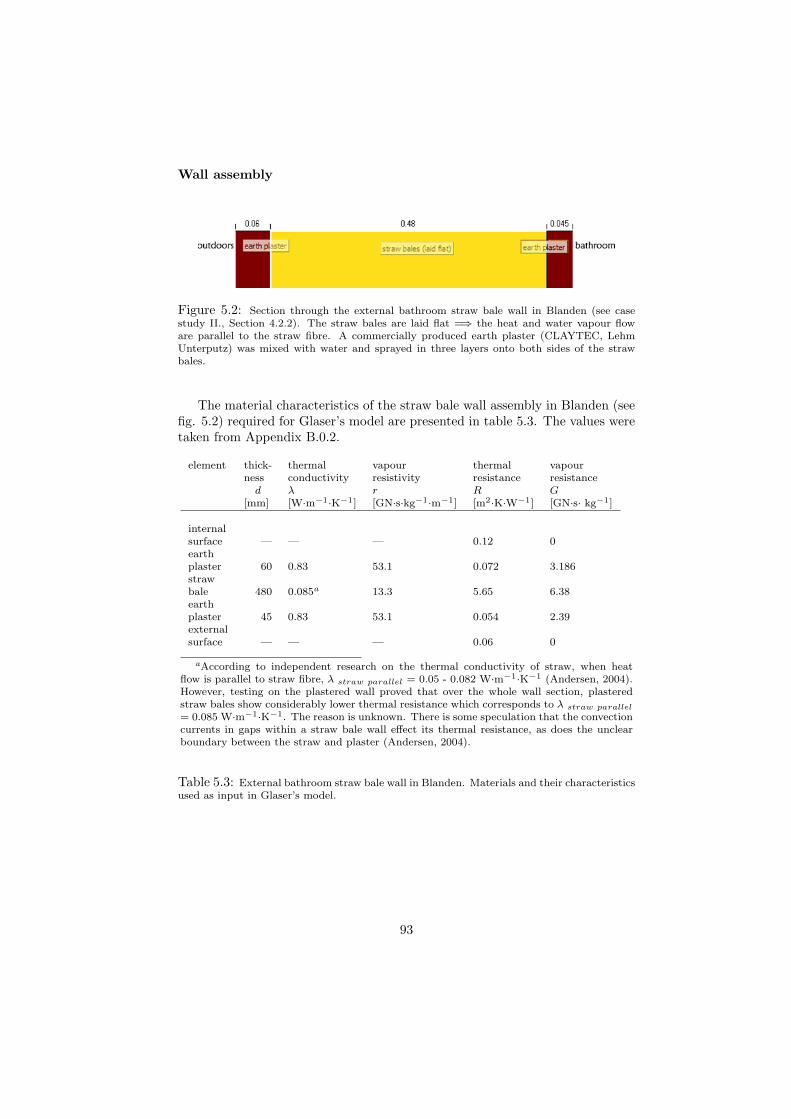
Wall assembly
Figure 5.2: Section through the external bathroom straw bale wall in Blanden (see casestudy II., Section 4.2.2). The straw bales are laid flat =⇒ the heat and water vapour floware parallel to the straw fibre. A commercially produced earth plaster (CLAYTEC, LehmUnterputz) was mixed with water and sprayed in three layers onto both sides of the strawbales.
The material characteristics of the straw bale wall assembly in Blanden (seefig. 5.2) required for Glaser’s model are presented in table 5.3. The values weretaken from Appendix B.0.2.
element thick- thermal vapour thermal vapourness conductivity resistivity resistance resistance
d λ r R G[mm] [W·m−1·K−1] [GN·s·kg−1·m−1] [m2·K·W−1] [GN·s· kg−1]
internalsurface — — — 0.12 0earthplaster 60 0.83 53.1 0.072 3.186strawbale 480 0.085a 13.3 5.65 6.38earthplaster 45 0.83 53.1 0.054 2.39externalsurface — — — 0.06 0
aAccording to independent research on the thermal conductivity of straw, when heatflow is parallel to straw fibre, λ straw parallel = 0.05 - 0.082 W·m−1·K−1 (Andersen, 2004).However, testing on the plastered wall proved that over the whole wall section, plasteredstraw bales show considerably lower thermal resistance which corresponds to λ straw parallel
= 0.085 W·m−1·K−1. The reason is unknown. There is some speculation that the convectioncurrents in gaps within a straw bale wall effect its thermal resistance, as does the unclearboundary between the straw and plaster (Andersen, 2004).
Table 5.3: External bathroom straw bale wall in Blanden. Materials and their characteristicsused as input in Glaser’s model.
93
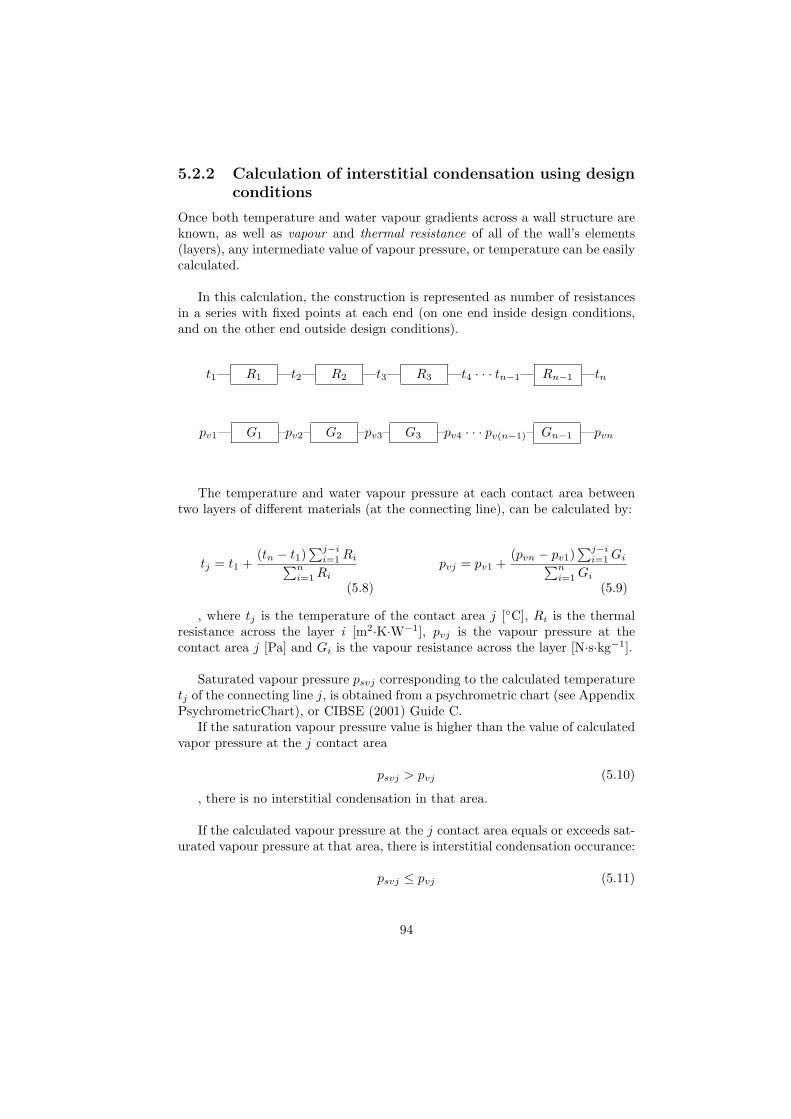
5.2.2 Calculation of interstitial condensation using designconditions
Once both temperature and water vapour gradients across a wall structure areknown, as well as vapour and thermal resistance of all of the wall’s elements(layers), any intermediate value of vapour pressure, or temperature can be easilycalculated.
In this calculation, the construction is represented as number of resistancesin a series with fixed points at each end (on one end inside design conditions,and on the other end outside design conditions).
t1— R1 —t2— R2 —t3— R3 —t4 · · · tn−1— Rn−1 —tn
pv1— G1 –pv2– G2 –pv3– G3 –pv4 · · · pv(n−1)– Gn−1 —pvn
The temperature and water vapour pressure at each contact area betweentwo layers of different materials (at the connecting line), can be calculated by:
tj = t1 +(tn − t1)
∑j−ii=1 Ri∑n
i=1 Ri
(5.8)
pvj = pv1 +(pvn − pv1)
∑j−ii=1 Gi∑n
i=1 Gi
(5.9)
, where tj is the temperature of the contact area j [◦C], Ri is the thermalresistance across the layer i [m2·K·W−1], pvj is the vapour pressure at thecontact area j [Pa] and Gi is the vapour resistance across the layer [N·s·kg−1].
Saturated vapour pressure psvj corresponding to the calculated temperaturetj of the connecting line j, is obtained from a psychrometric chart (see AppendixPsychrometricChart), or CIBSE (2001) Guide C.
If the saturation vapour pressure value is higher than the value of calculatedvapor pressure at the j contact area
psvj > pvj (5.10)
, there is no interstitial condensation in that area.
If the calculated vapour pressure at the j contact area equals or exceeds sat-urated vapour pressure at that area, there is interstitial condensation occurance:
psvj ≤ pvj (5.11)
94
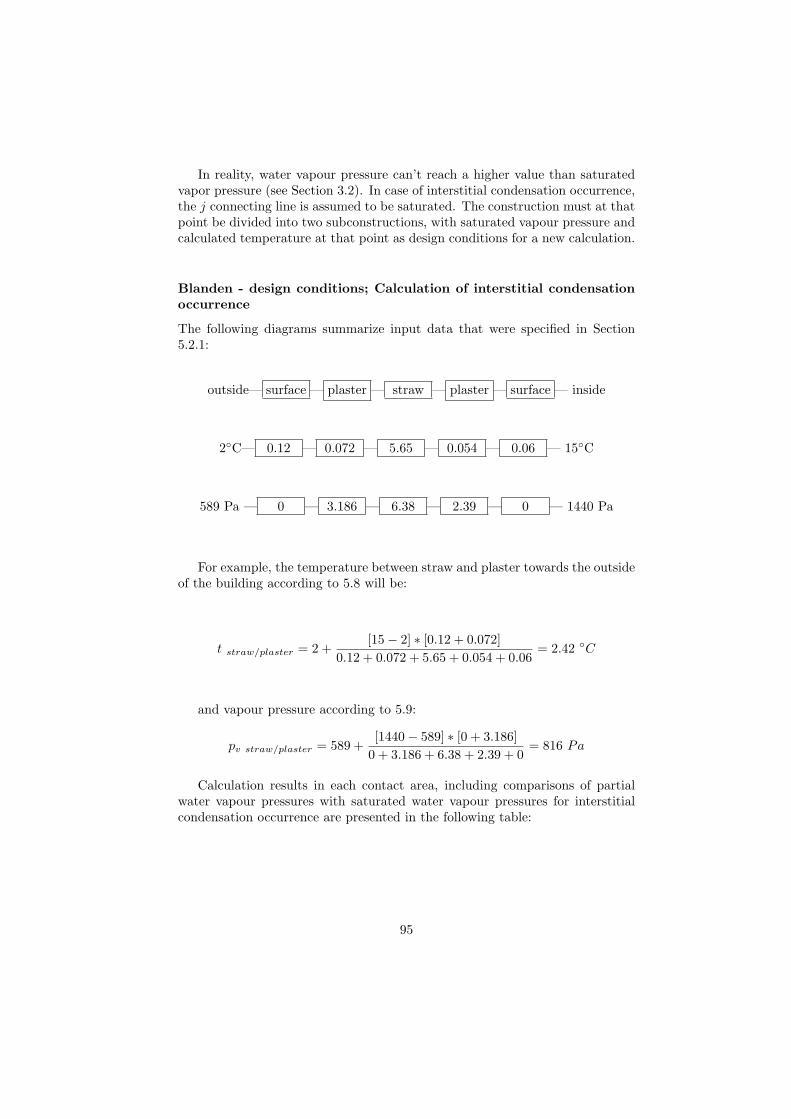
In reality, water vapour pressure can’t reach a higher value than saturatedvapor pressure (see Section 3.2). In case of interstitial condensation occurrence,the j connecting line is assumed to be saturated. The construction must at thatpoint be divided into two subconstructions, with saturated vapour pressure andcalculated temperature at that point as design conditions for a new calculation.
Blanden - design conditions; Calculation of interstitial condensationoccurrence
The following diagrams summarize input data that were specified in Section5.2.1:
outside— surface — plaster — straw — plaster — surface — inside
2◦C— 0.12 — 0.072 — 5.65 — 0.054 — 0.06 — 15◦C
589 Pa — 0 — 3.186 — 6.38 — 2.39 — 0 — 1440 Pa
For example, the temperature between straw and plaster towards the outsideof the building according to 5.8 will be:
t straw/plaster = 2 +[15− 2] ∗ [0.12 + 0.072]
0.12 + 0.072 + 5.65 + 0.054 + 0.06= 2.42 ◦C
and vapour pressure according to 5.9:
pv straw/plaster = 589 +[1440− 589] ∗ [0 + 3.186]
0 + 3.186 + 6.38 + 2.39 + 0= 816 Pa
Calculation results in each contact area, including comparisons of partialwater vapour pressures with saturated water vapour pressures for interstitialcondensation occurrence are presented in the following table:
95
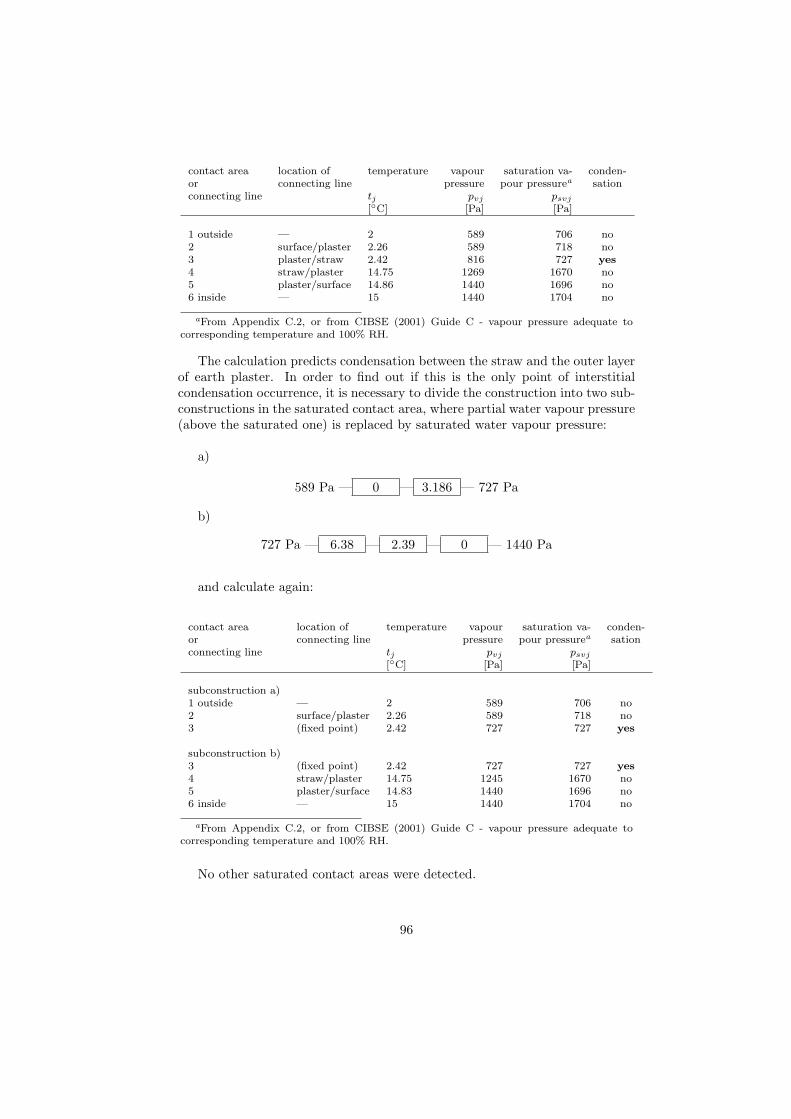
contact area location of temperature vapour saturation va- conden-or connecting line pressure pour pressurea sationconnecting line tj pvj psvj
[◦C] [Pa] [Pa]
1 outside — 2 589 706 no2 surface/plaster 2.26 589 718 no3 plaster/straw 2.42 816 727 yes4 straw/plaster 14.75 1269 1670 no5 plaster/surface 14.86 1440 1696 no6 inside — 15 1440 1704 no
aFrom Appendix C.2, or from CIBSE (2001) Guide C - vapour pressure adequate tocorresponding temperature and 100% RH.
The calculation predicts condensation between the straw and the outer layerof earth plaster. In order to find out if this is the only point of interstitialcondensation occurrence, it is necessary to divide the construction into two sub-constructions in the saturated contact area, where partial water vapour pressure(above the saturated one) is replaced by saturated water vapour pressure:
a)
589 Pa — 0 — 3.186 — 727 Pa
b)
727 Pa — 6.38 — 2.39 — 0 — 1440 Pa
and calculate again:
contact area location of temperature vapour saturation va- conden-or connecting line pressure pour pressurea sationconnecting line tj pvj psvj
[◦C] [Pa] [Pa]
subconstruction a)1 outside — 2 589 706 no2 surface/plaster 2.26 589 718 no3 (fixed point) 2.42 727 727 yes
subconstruction b)3 (fixed point) 2.42 727 727 yes4 straw/plaster 14.75 1245 1670 no5 plaster/surface 14.83 1440 1696 no6 inside — 15 1440 1704 no
aFrom Appendix C.2, or from CIBSE (2001) Guide C - vapour pressure adequate tocorresponding temperature and 100% RH.
No other saturated contact areas were detected.
96
The following calculation predicts the amount of moisture buildup in thelocation of the interstitial condensation occurance.
Blanden - design conditions; Calculation of interstitial condensationbuildup
The amount of condensation in subconstruction a) can be determined fromequation H.2:
qma =727− 5893.186 ∗ 109
=
= 43.3 ∗ 10−9 kg ·m−2 · s−1
and similarly the amount of condensation in subconstruction b):
qmb=
1440− 727(6.38 + 2.39) ∗ 109
=
= 81.3 ∗ 10−9 kg ·m−2 · s−1
The rate of condensation is the difference between the moisture flowing fromthe inside to the contact area qmb
and the moisture flowing from the contactarea to the outside qma :
qm = qmb− qma =
= (81.3− 43.3) ∗ 10−9 = 38 ∗ 10−9 kg ·m−2 · s−1 == 0.14 g ·m−2 · h−1
The question that suggests itself at this point is:
Does the moisture accumulated in winter due to interstitial conden-sation have a chance to dry out over the summer?
5.2.3 Calculation of drying in summer using design con-ditions
The calculation of evaporation (summer drying) is equivalent to calculation ofinterstitial condensation (see 5.2.2). The only difference is in the input data,respectively, the calculation of evaporation uses summer exterior design condi-tions.
97
Blanden - design conditions; Calculation of evaporation
Monitored summer conditions in Blanden are not available . Therefore, theBS6229 (2002) recommends including the estimated average outside summerdesign conditions in the calculation described above:
18◦C, 65% RH.
and calculate the rate of evaporation. If the amount of condensation doesn’texceed amount of evaporated water, the prediction considers the building struc-ture to be convenient.
Calculation of the rate of evaporation qe is analogous to calculation of con-densation build up (see Section 5.2.2) and can be found in Appendix G.0.4.
5.2.4 Summary of results
condensation rate +0.14 g ·m−2 · h−1
evaporation rate -1 g ·m−2 · h−1
The evaporation rate over the summer is more than 7 times greater thanthe winter condensation rate. Over the year there shouldn’t be any moisturegain between the straw and outside earth plaster of the straw bale wall underinvestigation.
5.2.5 Straw bale wall in Blanden; prediction’s accuracy
Even though Glaser’s model showed that winter condensation would sufficientlyevaporate over summer, it predicted that in winter, condensation would continueto deposit 0.14 g of moisture in every 1m2 of surface area every hour, betweenthe straw and external earth plaster.
Let’s compare the model’s output with reality. That is to say, with the actualdata measured inside of the existing bathroom wall in Blanden. The relevantdata was provided by monitor #1 (see case study II.,Section 4.2.2), which wasplaced directly in the area of predicted condensation occurrence: in the strawjust under the exterior plaster.
According to the prediction (see Section 5.2.4) it was expected that thedatalogger would often measure, in that particular place, relative humidity of100% which corresponds to saturation or, in other words, to liquid moistureoccurrence, or occurrence of condensation. Fig. 5.3 shows that in reality therelative humidity in this area never reached 100%.
98
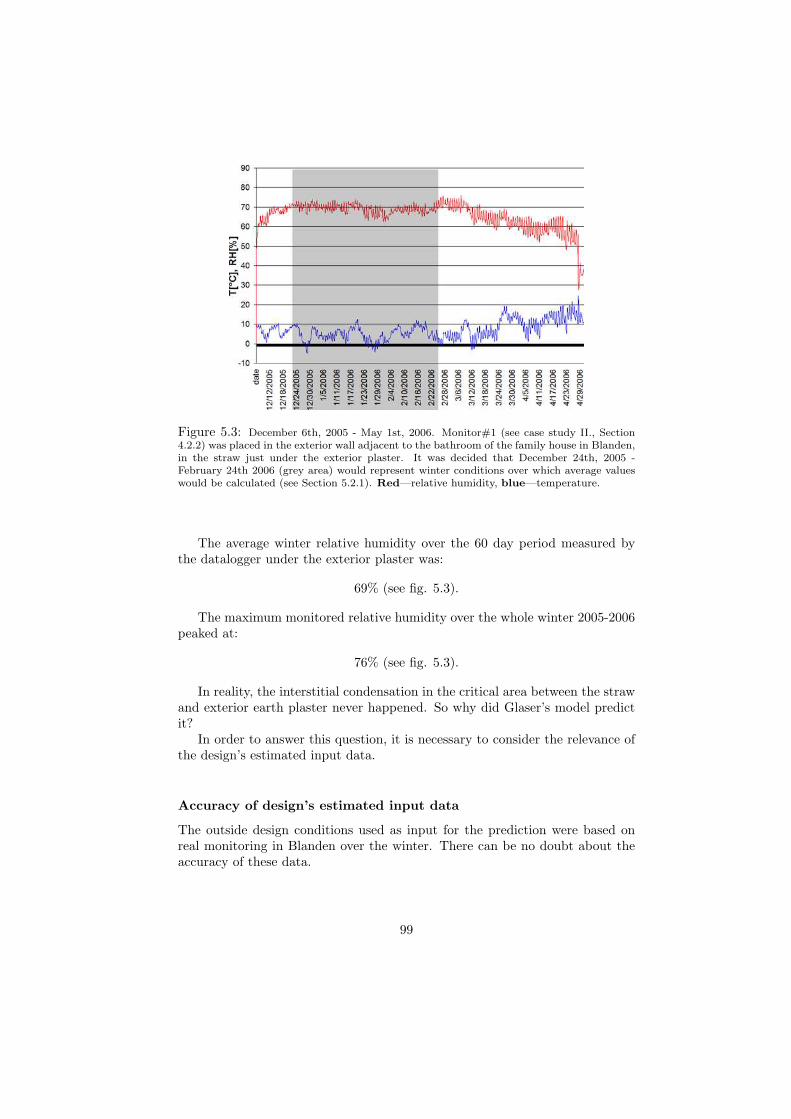
Figure 5.3: December 6th, 2005 - May 1st, 2006. Monitor#1 (see case study II., Section4.2.2) was placed in the exterior wall adjacent to the bathroom of the family house in Blanden,in the straw just under the exterior plaster. It was decided that December 24th, 2005 -February 24th 2006 (grey area) would represent winter conditions over which average valueswould be calculated (see Section 5.2.1). Red—relative humidity, blue—temperature.
The average winter relative humidity over the 60 day period measured bythe datalogger under the exterior plaster was:
69% (see fig. 5.3).
The maximum monitored relative humidity over the whole winter 2005-2006peaked at:
76% (see fig. 5.3).
In reality, the interstitial condensation in the critical area between the strawand exterior earth plaster never happened. So why did Glaser’s model predictit?
In order to answer this question, it is necessary to consider the relevance ofthe design’s estimated input data.
Accuracy of design’s estimated input data
The outside design conditions used as input for the prediction were based onreal monitoring in Blanden over the winter. There can be no doubt about theaccuracy of these data.
99
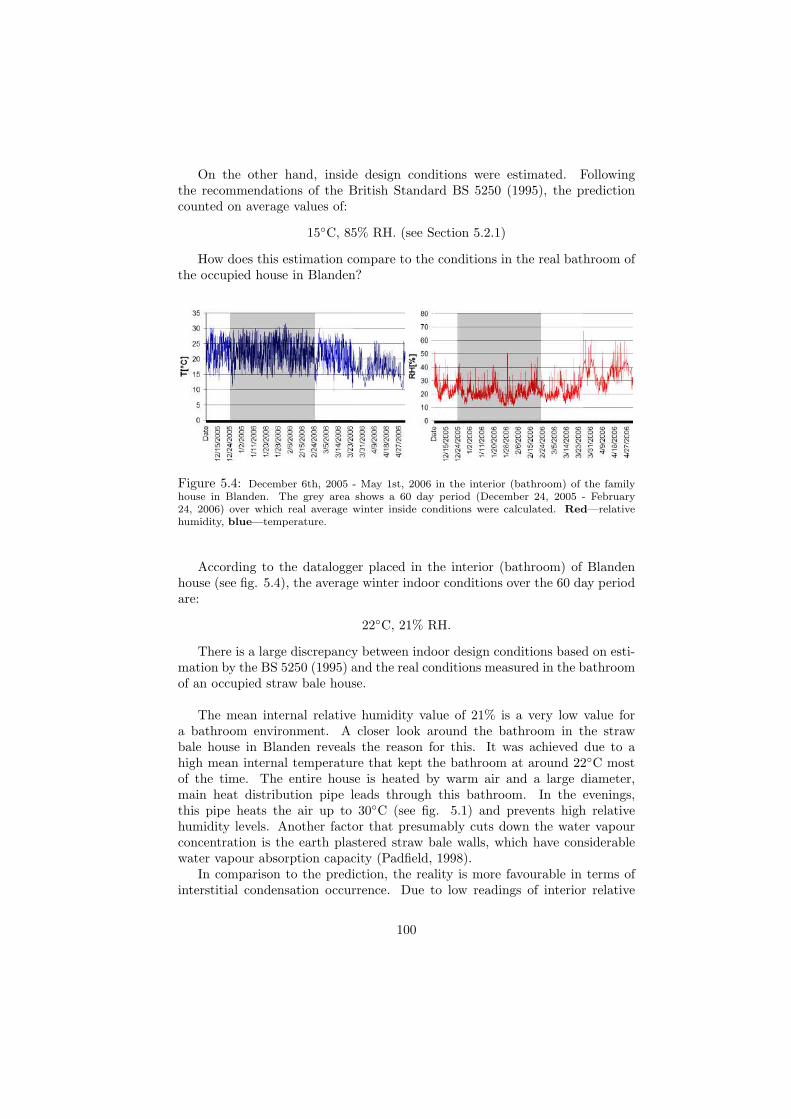
On the other hand, inside design conditions were estimated. Followingthe recommendations of the British Standard BS 5250 (1995), the predictioncounted on average values of:
15◦C, 85% RH. (see Section 5.2.1)
How does this estimation compare to the conditions in the real bathroom ofthe occupied house in Blanden?
Figure 5.4: December 6th, 2005 - May 1st, 2006 in the interior (bathroom) of the familyhouse in Blanden. The grey area shows a 60 day period (December 24, 2005 - February24, 2006) over which real average winter inside conditions were calculated. Red—relativehumidity, blue—temperature.
According to the datalogger placed in the interior (bathroom) of Blandenhouse (see fig. 5.4), the average winter indoor conditions over the 60 day periodare:
22◦C, 21% RH.
There is a large discrepancy between indoor design conditions based on esti-mation by the BS 5250 (1995) and the real conditions measured in the bathroomof an occupied straw bale house.
The mean internal relative humidity value of 21% is a very low value fora bathroom environment. A closer look around the bathroom in the strawbale house in Blanden reveals the reason for this. It was achieved due to ahigh mean internal temperature that kept the bathroom at around 22◦C mostof the time. The entire house is heated by warm air and a large diameter,main heat distribution pipe leads through this bathroom. In the evenings,this pipe heats the air up to 30◦C (see fig. 5.1) and prevents high relativehumidity levels. Another factor that presumably cuts down the water vapourconcentration is the earth plastered straw bale walls, which have considerablewater vapour absorption capacity (Padfield, 1998).
In comparison to the prediction, the reality is more favourable in terms ofinterstitial condensation occurrence. Due to low readings of interior relative
100
humidity, the actual moisture levels inside the wall will be much lower thanpredicted, making the prediction in this case unreasonably overestimated.
Before looking at the general limitations that the prediction based on Glaser’smodel has in practice, it is useful to apply Glaser’s model to the same wall, butthis time with accurate, real input data.
5.3 Straw bale wall in Blanden; Benchmarkingof Glaser’s model
In this Section, Glaser’s model will calculate the condensation occurrence in thestraw bale wall using the same procedure as in Section 5.2.2. The only differ-ence is that this time, the calculation will be based on real interior bathroomconditions.
5.3.1 Real input data
The average indoor conditions in the bathroom in Blanden are:
22◦C, 21% RH (see Section 5.2.5).
Real outdoor winter conditions in Blanden remain the same as in the calcu-lation with design conditions:
2◦C, 83% RH (see Section 5.2.1).
By aligning the model’s input with real measured data, it will be possibleto compare calculation results in each intermediate layer of the straw bale wallassembly with adequate monitoring, and thus assess the calculation’s accuracy.
5.3.2 Calculation of interstitial condensation using realconditions
Calculation of interstitial condensation occurrence in the straw bale wall inBlanden based on real data can be found in Appendix G.0.5
5.3.3 Summary of results
The calculation based on real conditions didn’t indicate interstitial condensationoccurrence in the straw bale wall in Blanden.
Besides the two external monitors monitoring outside and inside (bathroom)conditions in Blanden, three monitors (#1,2,3) were internal. They were buriedinside the straw bale wall (see case study II., Section 4.2.2).
While comparing the calculation results of Glaser’s model from AppendixG.0.5 with the output from the internal monitors (considered as a mean valueover 60 winter days of monitoring, see Section 4.2.2), the accuracy of modelbecomes apparent (see table 5.4 and fig. 5.5).
101
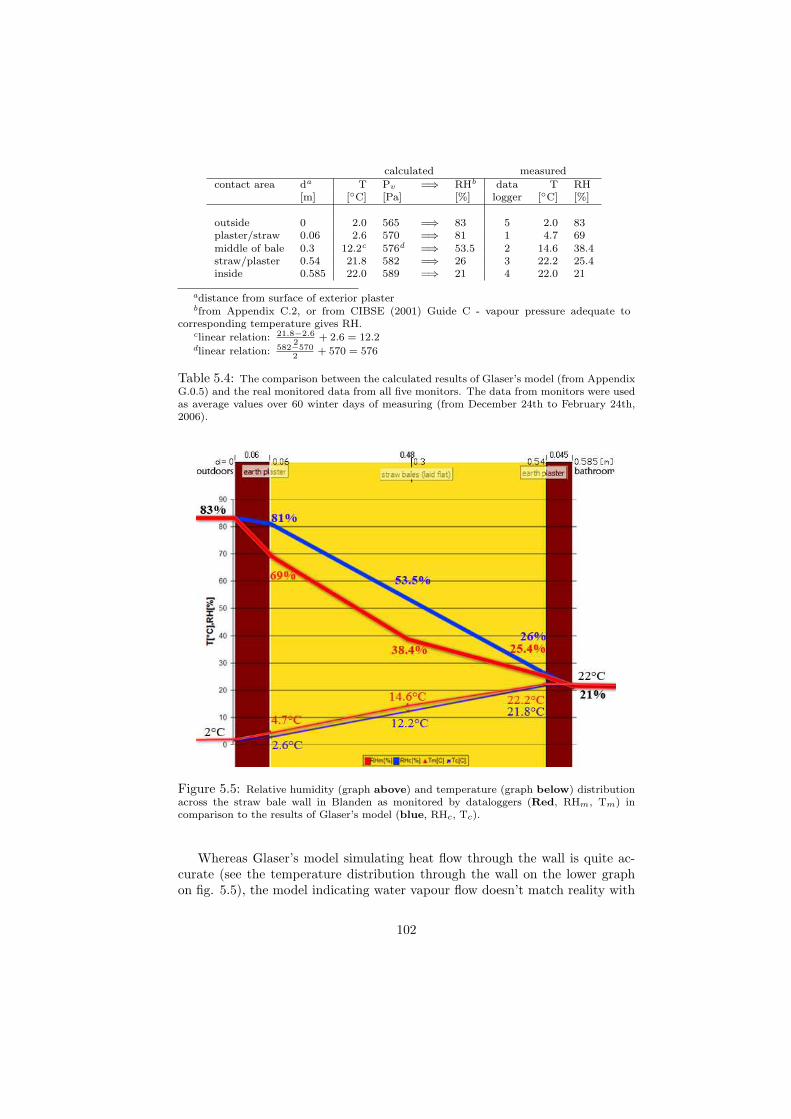
calculated measured
contact area da T Pv =⇒ RHb data T RH[m] [◦C] [Pa] [%] logger [◦C] [%]
outside 0 2.0 565 =⇒ 83 5 2.0 83plaster/straw 0.06 2.6 570 =⇒ 81 1 4.7 69middle of bale 0.3 12.2c 576d =⇒ 53.5 2 14.6 38.4straw/plaster 0.54 21.8 582 =⇒ 26 3 22.2 25.4inside 0.585 22.0 589 =⇒ 21 4 22.0 21
adistance from surface of exterior plasterbfrom Appendix C.2, or from CIBSE (2001) Guide C - vapour pressure adequate to
corresponding temperature gives RH.clinear relation: 21.8−2.6
2+ 2.6 = 12.2
dlinear relation: 582−5702
+ 570 = 576
Table 5.4: The comparison between the calculated results of Glaser’s model (from AppendixG.0.5) and the real monitored data from all five monitors. The data from monitors were usedas average values over 60 winter days of measuring (from December 24th to February 24th,2006).
Figure 5.5: Relative humidity (graph above) and temperature (graph below) distributionacross the straw bale wall in Blanden as monitored by dataloggers (Red, RHm, Tm) incomparison to the results of Glaser’s model (blue, RHc, Tc).
Whereas Glaser’s model simulating heat flow through the wall is quite ac-curate (see the temperature distribution through the wall on the lower graphon fig. 5.5), the model indicating water vapour flow doesn’t match reality with
102
satisfactory precision (see the upper graph on fig. 5.5).The relative humidity calculated by Glaser’s model (see the upper blue curve
on fig. 5.5) refers to the relative humidity of humid air diffusing through com-pletely dry material. This doesn’t actually happen. The humid air constantlyinteracts with the hygroscopic material due to the material’s adsorption andcapillary condensation (see Chapter 3). The real, monitored, relative humidity(see the upper red curve on fig. 5.5) corresponds to equilibria between humidair and moist material. The distribution of moisture in the straw is in fact farfrom being linear, as Glaser’s model suggests. Straw gets exponentially morewet the closer it gets to the exterior, but it never develops enough moisturecontent to threaten significant decomposition (see Chapter 2). The exteriorpart of the bale remains reasonably dry. The moisture performance of exteriorearth plaster makes an interesting point. In compliance with the observationsof Padfield (2002), the real measured data show that 60 mm of exterior earthplaster functions as an excellent humidity buffer, capable of keeping the exteriorface of the straw bales 12% less humid than anticipated by the model.
5.4 Limitations of the steady state calculationusing Glaser’s model
In reality, moisture transfer consists not only of vapour diffusion, but of liquidwater transfer as well.
Glaser’s model counts solely on vapour diffusion, with vapour pressure gra-dient as its driving potential. Water vapour pressure is a driving potential ofvapour diffusion only in isothermal conditions (when the ambient temperaturesare equal on both sides of a wall). In reality, the ambient conditions affecting abuilding envelope are rarely isothermal and the process driving the water vapourthrough the wall becomes more complex (Ficker, 2003).
The major limitation of Glaser’s model lies in the assumption that vapourresistivity, δ always stays constant throughout the wall component. In fact δvalue changes with temperature (Ficker, 2003), with relative humidity or mois-ture content (Vinha et al., 2002), with direction of driving potentials and withtheir mutual interaction (Peuhkuri et al., 2003).
Glaser’s model doesn’t consider capillary condensation and the related stor-age capacity of building materials.
Glaser’s model doesn’t consider the dynamic changes in ambient relativehumidity and temperature that characterize real, actual conditions.
103
5.5 Summary of Chapter 5
Glaser’s model is simple to use and understand, however, it is inaccurate. Largedeviations from reality could easily occur if the model is supplied with inaccurateinput data, as was demonstrated in Section 5.2.5. The input data recommendedby norms and standards are generally overestimated in order to secure resultsfor the worst case scenario.
Section 5.3 showed that under equal boundary conditions, Glaser’s modeldoesn’t agree with the measured relative humidity in the actual wall in Blanden.Glaser’s model doesn’t consider the material’s moisture buffering capacity (ormoisture storage - see the next Chapter), which appear to have a large impact onthe overall moisture performance of the wall. In reality, the excellent bufferingability of the exterior earth plaster lowers the overall relative humidity level inthe straw. Additionally, the distribution of relative humidity throughout thehomogeneous straw material isn’t linear, as the model suggests. The interiorhalf of the wall is drier and gets gradually wetter towards the exterior.
Glaser’s model is used by building science for the prediction of interstitialcondensation occurrence. The research on straw bale walls (see Chapter 4) showsthat interstitial condensation due to vapour diffusion through a wall assemblyisn’t a substantial threat to the integrity of plastered straw bale walls anyway,so the use of Glaser’s model in order to avoid possible condensation in plasteredstraw bale walls is misleading.
Despite its shortcomings, Glaser’s model serves as the ideal tool for an initialpreview of moisture transfer theory. Bigland-Pritchard, (2005) for example,used Glaser’s model in his dissertation for preliminary analyzes of humidityoccurrence in different straw bale wall assemblies. There is no reason to thinkthat professionals in the construction industry will suddenly stop using Glaser’smodel because of its pessimistic results. Given its popularity, it is likely that itwill continue to be widely utilized. As for assessments of humidity performancein plastered straw bale walls, it would be be helpful to give a researcher someguidance on how to get the most accurate and useful results out of this tool.The following recommendations are based on the research in this Chapter:
• Boundary conditions are much more significant for reliable calculationresults than material properties. That is why it is important to give themodel as much accurate input of the ambient conditions as possible.
• In some cases, CIBSE Guide A (1999) recommends using overall extremedesign conditions for the prediction of short term condensation buildup.When modeling straw bale walls, it is much more useful to use averagevalues over the continuous (most extreme) 60 day period (as it was donein this Chapter) in order to asses long term moisture performance in strawbale walls. The overall extreme design conditions tend to appear over tooshort a period to notably affect the humidity of straw in a plastered wall.
104
• In the case that Glaser’s model predicts condensation between straw andexterior plaster, the results are most likely exaggerated. The model doesn’ttake into account the moisture buffering capacity of the wall’s materials.The excellent moisture buffering capacity of straw and earth appears tohave a significant effect on moisture transfer within straw bale walls.
In order to understand moisture transfer in a straw bale wall at a moredetailed level, it is now necessary to introduce a more powerful and accuratetool - a mathematical model based on computer simulation.
105
Chapter 6
Moisture transfer in strawbale wall, dynamicsimulation
Although Glaser’s model is capable of simultaneously describing heat and mois-ture transfer in building components (Glaser’s is a hygrothermal model), it istoo simplified for any serious research. This Chapter looks into moisture trans-fer theory in greater complexity. It introduces advanced hygrothermal modelWUFI Pro 4.0 IBP1.
After its validation at the end of this Chapter, the WUFI model is usedin the next Chapter as a tool for analyzing various straw bale wall assembliesunder different ambient conditions.
6.1 Overview of hygrothermal computer models
The goal of steady state modeling using Glaser’s model in the previous Chap-ter was to determine the possibility of interstitial condensation occurance in aparticular wall assembly.
”While this problem is computationally tractable, it has also beenrecognized as one of the least important parts of the overall mois-ture picture since it is limited to diffusion. More recent models haveworked to encompass a variety of other transport modes and effectswhile lifting the constraints of one-dimensional steadystate analy-sis.” (Newport Partners, p. 92, 2004)
Due to the growing complexity of mathematical models, which utilize physics,and due to the large amount of data that needs to be precisely calculated, it
1Available from: http://www.hoki.ibp.fraunhofer.de/wufi/bezug e.html
106
is necessary to employ computers to obtain a modeling environment which cor-responds to reality with greater precision. Computer simulation has become arecent trend in moisture transfer science. There are number of well validatedadvanced hygrothermal computer models available not only to scientists, butalso to architects and engineers.
Straube and Burnett (2001) organized the hygrothermal models into twobasic categories.
• Glaser’s model together with its extensions such as EMPTIED and SHAMbelong, according to Straube and Burnett, (2001) to simplified mod-els.DIAL and DRAL (Ficker, 2003)fall into the same category.
• A more advanced category includes detailed computer models suchas: WALLDRY, TRATMO, MATCH, MOIST, TCCD2, FSEC, WUFI,WUFIZ, and LATENITE. Besides those mentioned by Straube and Bur-nett (2001), there are still models like MOISTURE-EXPERT, hygIRCand DELPHIN that should be included in the ”detailed hygrothermalcomputer models” category (Tariku and Kumaran, 2006).
6.2 Choosing a model for analysis of hygrother-mal behaviour in plasered straw bale wall
There are many aspects influencing the researcher’s choice of suitable hygrother-mal computer model, but in general there are three major issues that need tobe considered:
1. Dimension:
• Whether a model is one, two, or three dimensional: whether it per-forms calculation at one point of the wall (1D—usually horizontallythrough the whole wall section—like Glaser’s model or WUFI Pro4.0 IBP), or whether it considers two (2D—planar) or even threedimensional (3D—spatial) performance within a particular buildingassembly.
2. Time:
• Whether a model describes hygrothermal behaviour in ambient con-ditions that don’t change over time (steady state) or whether it con-siders the input of changing ambient conditions (dynamic hygrother-mal behaviour).
3. Accessibility to researcher:
• Whether a model asks for data that is readily available;
107
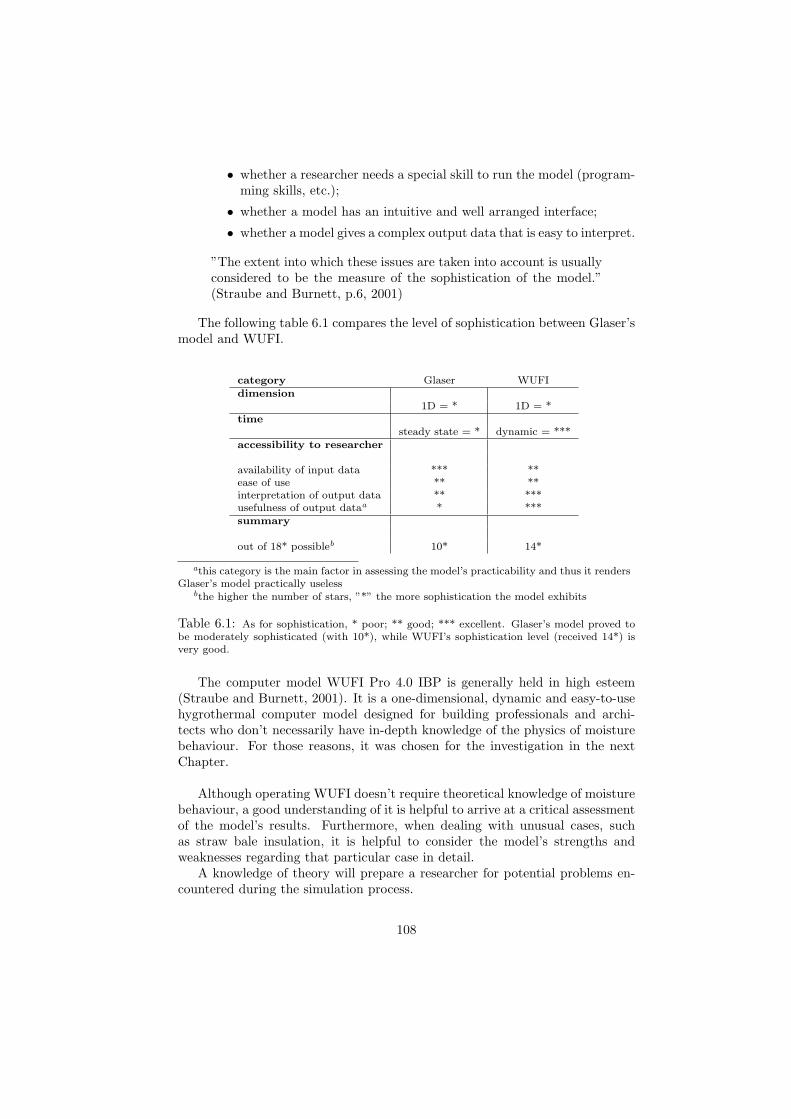
• whether a researcher needs a special skill to run the model (program-ming skills, etc.);
• whether a model has an intuitive and well arranged interface;
• whether a model gives a complex output data that is easy to interpret.
”The extent into which these issues are taken into account is usuallyconsidered to be the measure of the sophistication of the model.”(Straube and Burnett, p.6, 2001)
The following table 6.1 compares the level of sophistication between Glaser’smodel and WUFI.
category Glaser WUFIdimension
1D = * 1D = *time
steady state = * dynamic = ***accessibility to researcher
availability of input data *** **ease of use ** **interpretation of output data ** ***usefulness of output dataa * ***summary
out of 18* possibleb 10* 14*
athis category is the main factor in assessing the model’s practicability and thus it rendersGlaser’s model practically useless
bthe higher the number of stars, ”*” the more sophistication the model exhibits
Table 6.1: As for sophistication, * poor; ** good; *** excellent. Glaser’s model proved tobe moderately sophisticated (with 10*), while WUFI’s sophistication level (received 14*) isvery good.
The computer model WUFI Pro 4.0 IBP is generally held in high esteem(Straube and Burnett, 2001). It is a one-dimensional, dynamic and easy-to-usehygrothermal computer model designed for building professionals and archi-tects who don’t necessarily have in-depth knowledge of the physics of moisturebehaviour. For those reasons, it was chosen for the investigation in the nextChapter.
Although operating WUFI doesn’t require theoretical knowledge of moisturebehaviour, a good understanding of it is helpful to arrive at a critical assessmentof the model’s results. Furthermore, when dealing with unusual cases, suchas straw bale insulation, it is helpful to consider the model’s strengths andweaknesses regarding that particular case in detail.
A knowledge of theory will prepare a researcher for potential problems en-countered during the simulation process.
108
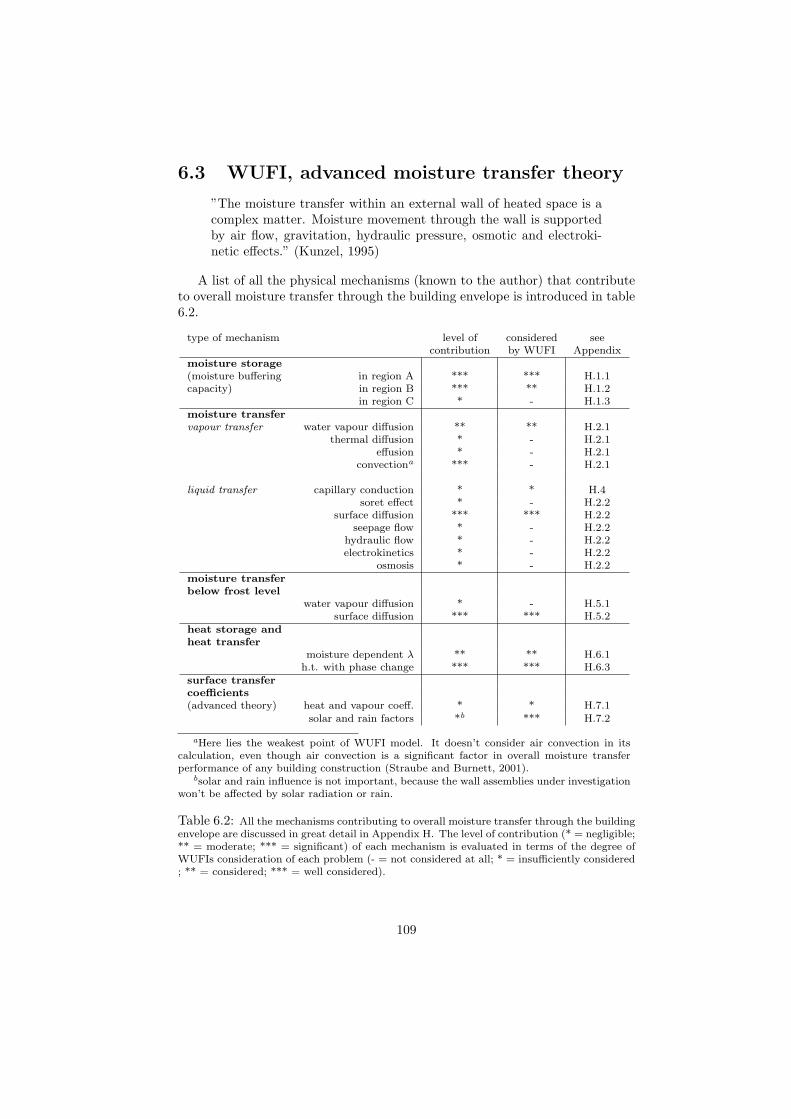
6.3 WUFI, advanced moisture transfer theory
”The moisture transfer within an external wall of heated space is acomplex matter. Moisture movement through the wall is supportedby air flow, gravitation, hydraulic pressure, osmotic and electroki-netic effects.” (Kunzel, 1995)
A list of all the physical mechanisms (known to the author) that contributeto overall moisture transfer through the building envelope is introduced in table6.2.
type of mechanism level of considered seecontribution by WUFI Appendix
moisture storage(moisture buffering in region A *** *** H.1.1capacity) in region B *** ** H.1.2
in region C * - H.1.3moisture transfervapour transfer water vapour diffusion ** ** H.2.1
thermal diffusion * - H.2.1effusion * - H.2.1
convectiona *** - H.2.1
liquid transfer capillary conduction * * H.4soret effect * - H.2.2
surface diffusion *** *** H.2.2seepage flow * - H.2.2
hydraulic flow * - H.2.2electrokinetics * - H.2.2
osmosis * - H.2.2moisture transferbelow frost level
water vapour diffusion * - H.5.1surface diffusion *** *** H.5.2
heat storage andheat transfer
moisture dependent λ ** ** H.6.1h.t. with phase change *** *** H.6.3
surface transfercoefficients(advanced theory) heat and vapour coeff. * * H.7.1
solar and rain factors *b *** H.7.2
aHere lies the weakest point of WUFI model. It doesn’t consider air convection in itscalculation, even though air convection is a significant factor in overall moisture transferperformance of any building construction (Straube and Burnett, 2001).
bsolar and rain influence is not important, because the wall assemblies under investigationwon’t be affected by solar radiation or rain.
Table 6.2: All the mechanisms contributing to overall moisture transfer through the buildingenvelope are discussed in great detail in Appendix H. The level of contribution (* = negligible;** = moderate; *** = significant) of each mechanism is evaluated in terms of the degree ofWUFIs consideration of each problem (- = not considered at all; * = insufficiently considered; ** = considered; *** = well considered).
109
Table 6.2 helps to uncover the possible strengths and weaknesses of theWUFI hygrothermal model. It estimates the degree of contribution that a singlemechanism imposes on overall moisture transfer through a building componentand simultaneously, it shows the level of WUFI’s consideration of that particularproblem. A detailed explanation of each mechanism, including a discussion ofWUFI’s involvement with it, is provided in Appendix H.
According to the table 6.2, WUFI sufficiently covers all of the importantissues concerning moisture transfer except one — air convection.
6.3.1 WUFI and air convection
The greatest weakness of the WUFI model is its failure to acknowledge vapourpenetration into the construction due to infiltration through gaps, cracks andvarious imperfect details. Newport Partners (2004) state that compared towater vapour diffusion (the only form of moisture transfer considered by Glaser’smodel), the movement of water vapour by air flow can transfer much largeramounts of moisture through building construction. Consequently, moisturemovement through hollow spaces within a wall isn’t considered by WUFI either.
”The detailed simulation of heat and moisture transport in air layers(including convection, turbulence etc.) is much more complicatedand is outside WUFI’s scope.” (WUFI, 2005)
Research on straw bale buildings by Andersen (2004) proves that there areconsiderable convective air currents in plastered straw bale walls, due to airpockets between straw bales. However, building ”natural convection-free” strawbale walls is possible, if not always achieved in practice (see Section 4.1.7).
It is necessary to take natural convection into account when analyzing theresults of the WUFI model, since by ignoring air convection, WUFI counts onperfect, ”natural convection-free” straw bale construction.
6.3.2 WUFI and straw
Another reason why WUFI could be unreliable for the purposes of this thesis isits questionable relationship with organic fibrous materials.
WUFI is tailored for the calculation of moisture transfer within porous min-eral materials like renders, bricks, porous stones and concrete. Though theWUFI manual (2005) says that moisture transfer through fibrous organic mat-ter like hemp, reed or straw isn’t generally different from the moisture transferin porous mineral materials, it also mentions that determining a liquid trans-fer coefficient for organic fibrous matter might be difficult or even impossible,because it could change its consistency in high moisture content levels (dur-ing caking, for example). It is advisable to take WUFI’s results showing highmoisture contents in straw (90% relative humidity and more) as conservativeestimates.
In this thesis, the liquid transfer coefficients of straw will be ignored, sinceWUFI doesn’t consider liquid transfer in normal conditions anyway. Liquid
110
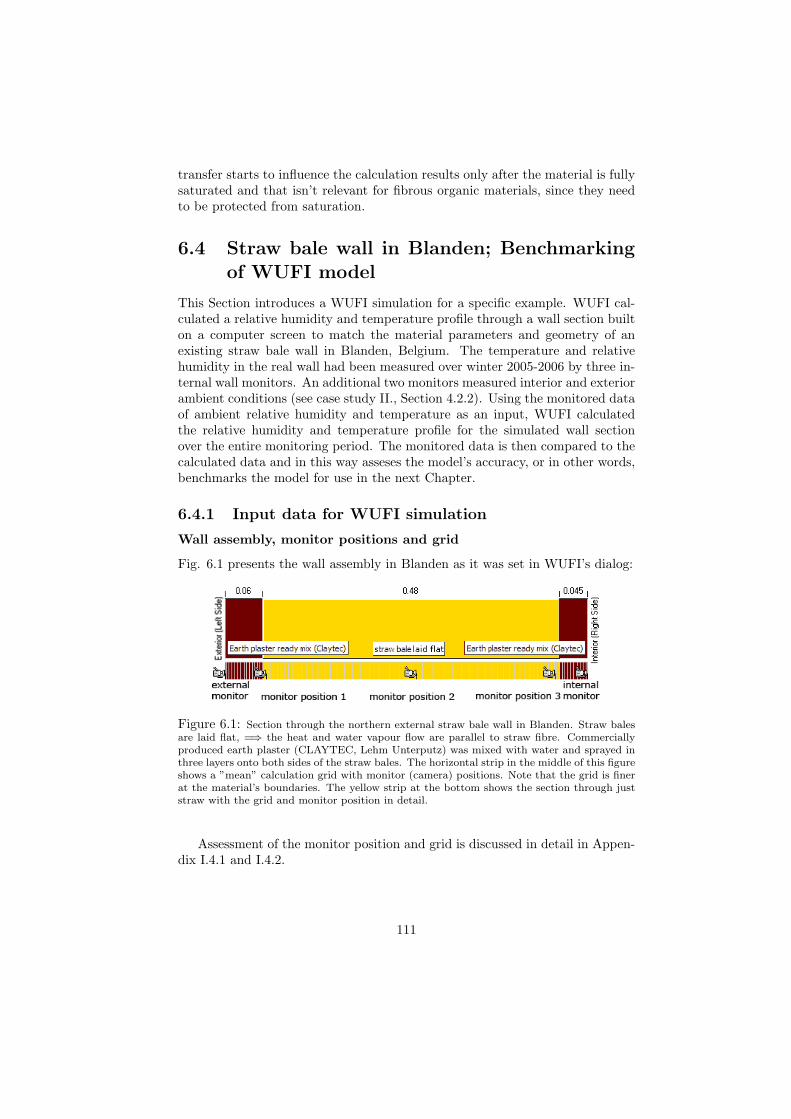
transfer starts to influence the calculation results only after the material is fullysaturated and that isn’t relevant for fibrous organic materials, since they needto be protected from saturation.
6.4 Straw bale wall in Blanden; Benchmarkingof WUFI model
This Section introduces a WUFI simulation for a specific example. WUFI cal-culated a relative humidity and temperature profile through a wall section builton a computer screen to match the material parameters and geometry of anexisting straw bale wall in Blanden, Belgium. The temperature and relativehumidity in the real wall had been measured over winter 2005-2006 by three in-ternal wall monitors. An additional two monitors measured interior and exteriorambient conditions (see case study II., Section 4.2.2). Using the monitored dataof ambient relative humidity and temperature as an input, WUFI calculatedthe relative humidity and temperature profile for the simulated wall sectionover the entire monitoring period. The monitored data is then compared to thecalculated data and in this way asseses the model’s accuracy, or in other words,benchmarks the model for use in the next Chapter.
6.4.1 Input data for WUFI simulation
Wall assembly, monitor positions and grid
Fig. 6.1 presents the wall assembly in Blanden as it was set in WUFI’s dialog:
Figure 6.1: Section through the northern external straw bale wall in Blanden. Straw balesare laid flat, =⇒ the heat and water vapour flow are parallel to straw fibre. Commerciallyproduced earth plaster (CLAYTEC, Lehm Unterputz) was mixed with water and sprayed inthree layers onto both sides of the straw bales. The horizontal strip in the middle of this figureshows a ”mean” calculation grid with monitor (camera) positions. Note that the grid is finerat the material’s boundaries. The yellow strip at the bottom shows the section through juststraw with the grid and monitor position in detail.
Assessment of the monitor position and grid is discussed in detail in Appen-dix I.4.1 and I.4.2.
111
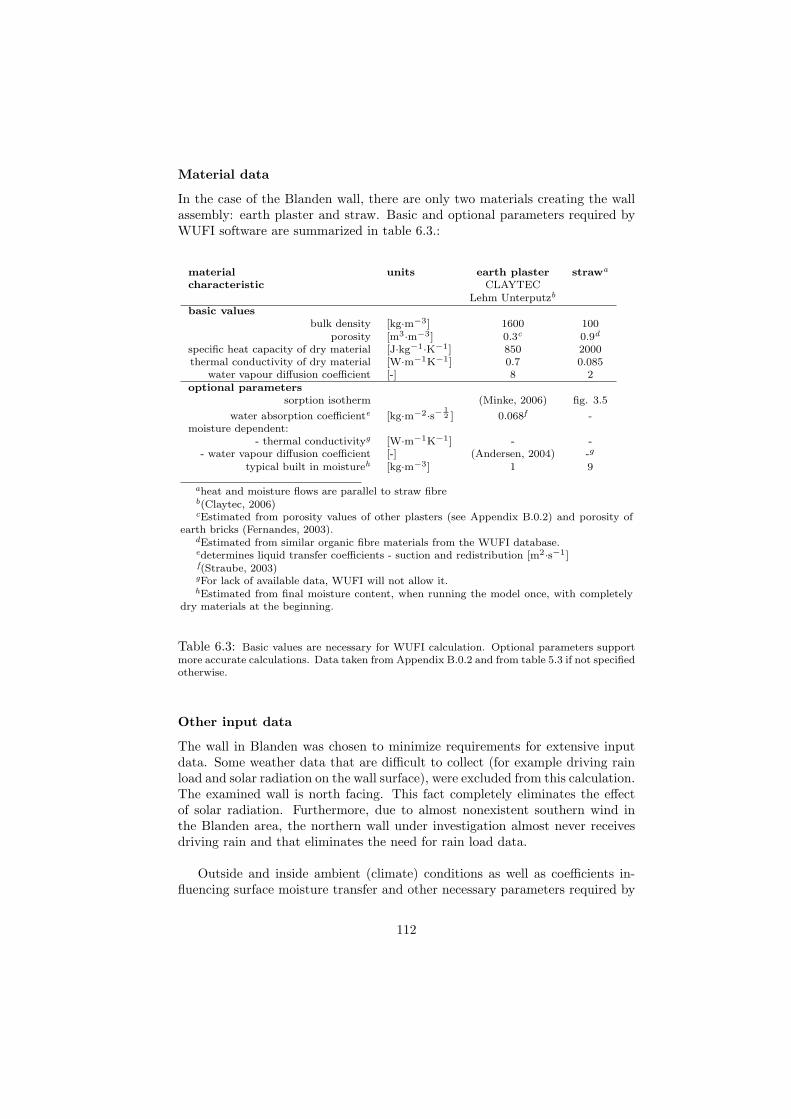
Material data
In the case of the Blanden wall, there are only two materials creating the wallassembly: earth plaster and straw. Basic and optional parameters required byWUFI software are summarized in table 6.3.:
material units earth plaster strawa
characteristic CLAYTECLehm Unterputzb
basic valuesbulk density [kg·m−3] 1600 100
porosity [m3·m−3] 0.3c 0.9d
specific heat capacity of dry material [J·kg−1·K−1] 850 2000thermal conductivity of dry material [W·m−1K−1] 0.7 0.085
water vapour diffusion coefficient [-] 8 2optional parameters
sorption isotherm (Minke, 2006) fig. 3.5
water absorption coefficiente [kg·m−2·s− 12 ] 0.068f -
moisture dependent:- thermal conductivityg [W·m−1K−1] - -
- water vapour diffusion coefficient [-] (Andersen, 2004) -g
typical built in moistureh [kg·m−3] 1 9
aheat and moisture flows are parallel to straw fibreb(Claytec, 2006)cEstimated from porosity values of other plasters (see Appendix B.0.2) and porosity of
earth bricks (Fernandes, 2003).dEstimated from similar organic fibre materials from the WUFI database.edetermines liquid transfer coefficients - suction and redistribution [m2·s−1]f(Straube, 2003)gFor lack of available data, WUFI will not allow it.hEstimated from final moisture content, when running the model once, with completely
dry materials at the beginning.
Table 6.3: Basic values are necessary for WUFI calculation. Optional parameters supportmore accurate calculations. Data taken from Appendix B.0.2 and from table 5.3 if not specifiedotherwise.
Other input data
The wall in Blanden was chosen to minimize requirements for extensive inputdata. Some weather data that are difficult to collect (for example driving rainload and solar radiation on the wall surface), were excluded from this calculation.The examined wall is north facing. This fact completely eliminates the effectof solar radiation. Furthermore, due to almost nonexistent southern wind inthe Blanden area, the northern wall under investigation almost never receivesdriving rain and that eliminates the need for rain load data.
Outside and inside ambient (climate) conditions as well as coefficients in-fluencing surface moisture transfer and other necessary parameters required by
112
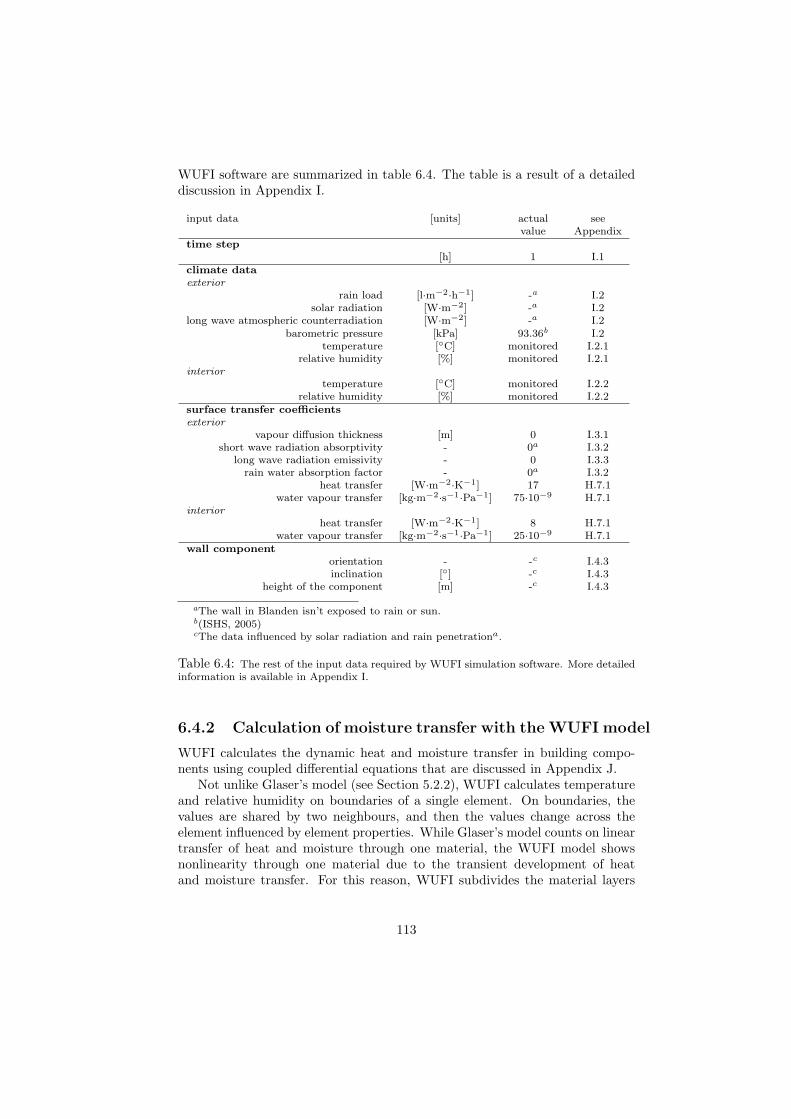
WUFI software are summarized in table 6.4. The table is a result of a detaileddiscussion in Appendix I.
input data [units] actual seevalue Appendix
time step[h] 1 I.1
climate dataexterior
rain load [l·m−2·h−1] -a I.2solar radiation [W·m−2] -a I.2
long wave atmospheric counterradiation [W·m−2] -a I.2barometric pressure [kPa] 93.36b I.2
temperature [◦C] monitored I.2.1relative humidity [%] monitored I.2.1
interiortemperature [◦C] monitored I.2.2
relative humidity [%] monitored I.2.2surface transfer coefficientsexterior
vapour diffusion thickness [m] 0 I.3.1short wave radiation absorptivity - 0a I.3.2
long wave radiation emissivity - 0 I.3.3rain water absorption factor - 0a I.3.2
heat transfer [W·m−2·K−1] 17 H.7.1water vapour transfer [kg·m−2·s−1·Pa−1] 75·10−9 H.7.1
interiorheat transfer [W·m−2·K−1] 8 H.7.1
water vapour transfer [kg·m−2·s−1·Pa−1] 25·10−9 H.7.1wall component
orientation - -c I.4.3inclination [◦] -c I.4.3
height of the component [m] -c I.4.3
aThe wall in Blanden isn’t exposed to rain or sun.b(ISHS, 2005)cThe data influenced by solar radiation and rain penetrationa.
Table 6.4: The rest of the input data required by WUFI simulation software. More detailedinformation is available in Appendix I.
6.4.2 Calculation of moisture transfer with the WUFI model
WUFI calculates the dynamic heat and moisture transfer in building compo-nents using coupled differential equations that are discussed in Appendix J.
Not unlike Glaser’s model (see Section 5.2.2), WUFI calculates temperatureand relative humidity on boundaries of a single element. On boundaries, thevalues are shared by two neighbours, and then the values change across theelement influenced by element properties. While Glaser’s model counts on lineartransfer of heat and moisture through one material, the WUFI model showsnonlinearity through one material due to the transient development of heatand moisture transfer. For this reason, WUFI subdivides the material layers
113
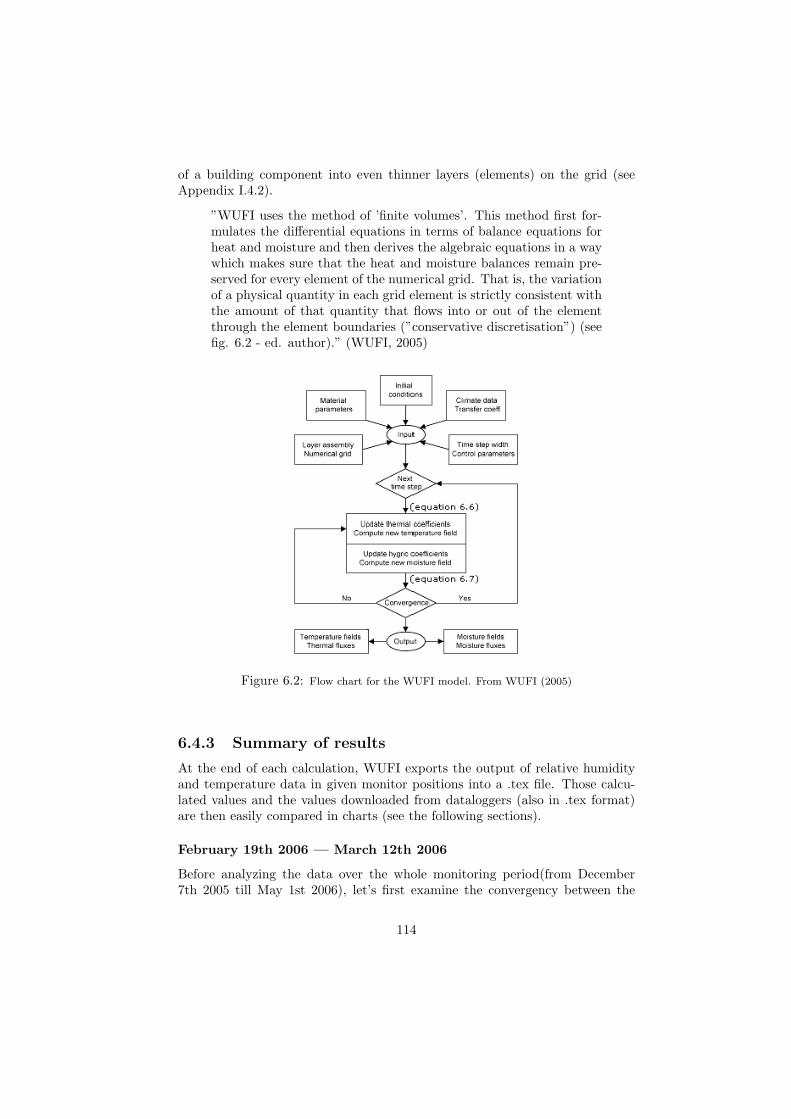
of a building component into even thinner layers (elements) on the grid (seeAppendix I.4.2).
”WUFI uses the method of ’finite volumes’. This method first for-mulates the differential equations in terms of balance equations forheat and moisture and then derives the algebraic equations in a waywhich makes sure that the heat and moisture balances remain pre-served for every element of the numerical grid. That is, the variationof a physical quantity in each grid element is strictly consistent withthe amount of that quantity that flows into or out of the elementthrough the element boundaries (”conservative discretisation”) (seefig. 6.2 - ed. author).” (WUFI, 2005)
Figure 6.2: Flow chart for the WUFI model. From WUFI (2005)
6.4.3 Summary of results
At the end of each calculation, WUFI exports the output of relative humidityand temperature data in given monitor positions into a .tex file. Those calcu-lated values and the values downloaded from dataloggers (also in .tex format)are then easily compared in charts (see the following sections).
February 19th 2006 — March 12th 2006
Before analyzing the data over the whole monitoring period(from December7th 2005 till May 1st 2006), let’s first examine the convergency between the
114
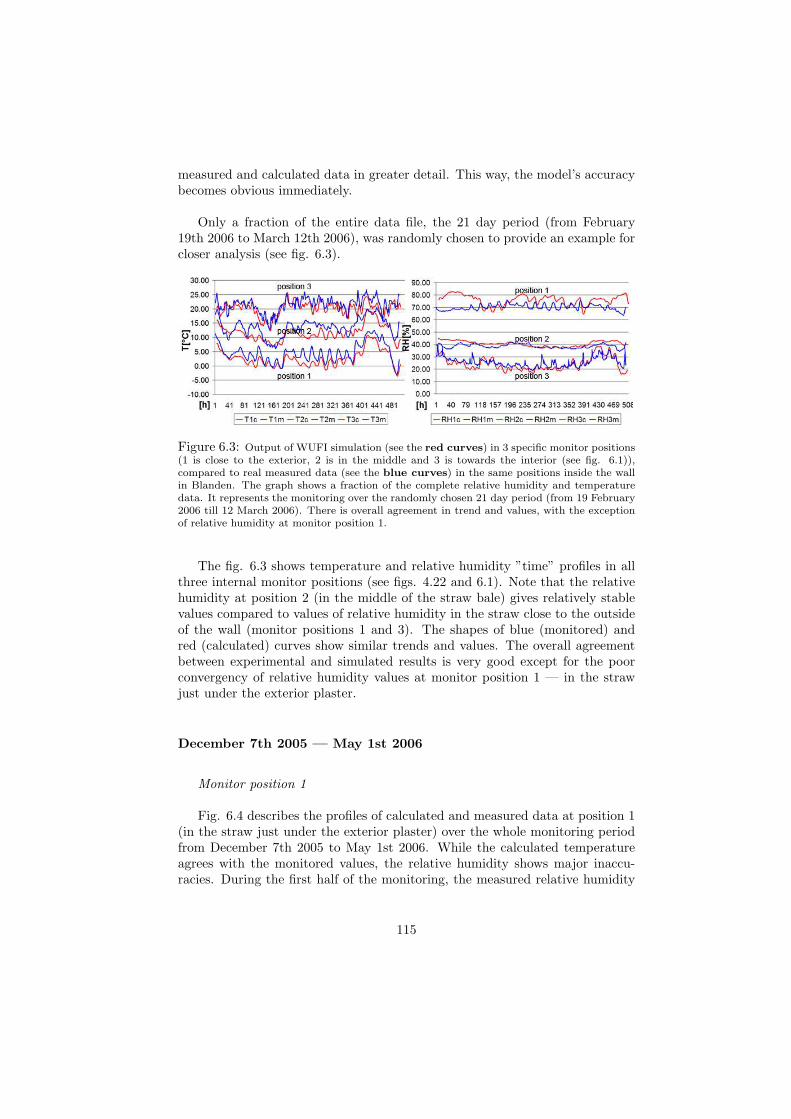
measured and calculated data in greater detail. This way, the model’s accuracybecomes obvious immediately.
Only a fraction of the entire data file, the 21 day period (from February19th 2006 to March 12th 2006), was randomly chosen to provide an example forcloser analysis (see fig. 6.3).
Figure 6.3: Output of WUFI simulation (see the red curves) in 3 specific monitor positions(1 is close to the exterior, 2 is in the middle and 3 is towards the interior (see fig. 6.1)),compared to real measured data (see the blue curves) in the same positions inside the wallin Blanden. The graph shows a fraction of the complete relative humidity and temperaturedata. It represents the monitoring over the randomly chosen 21 day period (from 19 February2006 till 12 March 2006). There is overall agreement in trend and values, with the exceptionof relative humidity at monitor position 1.
The fig. 6.3 shows temperature and relative humidity ”time” profiles in allthree internal monitor positions (see figs. 4.22 and 6.1). Note that the relativehumidity at position 2 (in the middle of the straw bale) gives relatively stablevalues compared to values of relative humidity in the straw close to the outsideof the wall (monitor positions 1 and 3). The shapes of blue (monitored) andred (calculated) curves show similar trends and values. The overall agreementbetween experimental and simulated results is very good except for the poorconvergency of relative humidity values at monitor position 1 — in the strawjust under the exterior plaster.
December 7th 2005 — May 1st 2006
Monitor position 1
Fig. 6.4 describes the profiles of calculated and measured data at position 1(in the straw just under the exterior plaster) over the whole monitoring periodfrom December 7th 2005 to May 1st 2006. While the calculated temperatureagrees with the monitored values, the relative humidity shows major inaccu-racies. During the first half of the monitoring, the measured relative humidity
115
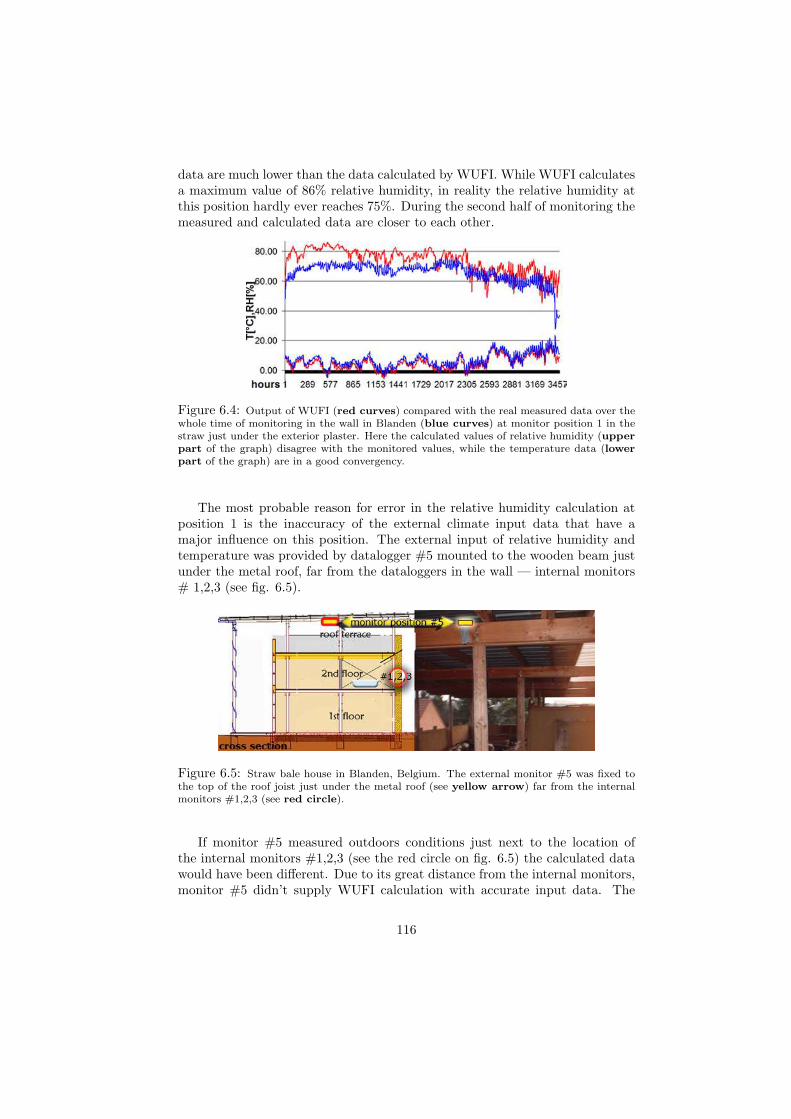
data are much lower than the data calculated by WUFI. While WUFI calculatesa maximum value of 86% relative humidity, in reality the relative humidity atthis position hardly ever reaches 75%. During the second half of monitoring themeasured and calculated data are closer to each other.
Figure 6.4: Output of WUFI (red curves) compared with the real measured data over thewhole time of monitoring in the wall in Blanden (blue curves) at monitor position 1 in thestraw just under the exterior plaster. Here the calculated values of relative humidity (upperpart of the graph) disagree with the monitored values, while the temperature data (lowerpart of the graph) are in a good convergency.
The most probable reason for error in the relative humidity calculation atposition 1 is the inaccuracy of the external climate input data that have amajor influence on this position. The external input of relative humidity andtemperature was provided by datalogger #5 mounted to the wooden beam justunder the metal roof, far from the dataloggers in the wall — internal monitors# 1,2,3 (see fig. 6.5).
Figure 6.5: Straw bale house in Blanden, Belgium. The external monitor #5 was fixed tothe top of the roof joist just under the metal roof (see yellow arrow) far from the internalmonitors #1,2,3 (see red circle).
If monitor #5 measured outdoors conditions just next to the location ofthe internal monitors #1,2,3 (see the red circle on fig. 6.5) the calculated datawould have been different. Due to its great distance from the internal monitors,monitor #5 didn’t supply WUFI calculation with accurate input data. The
116
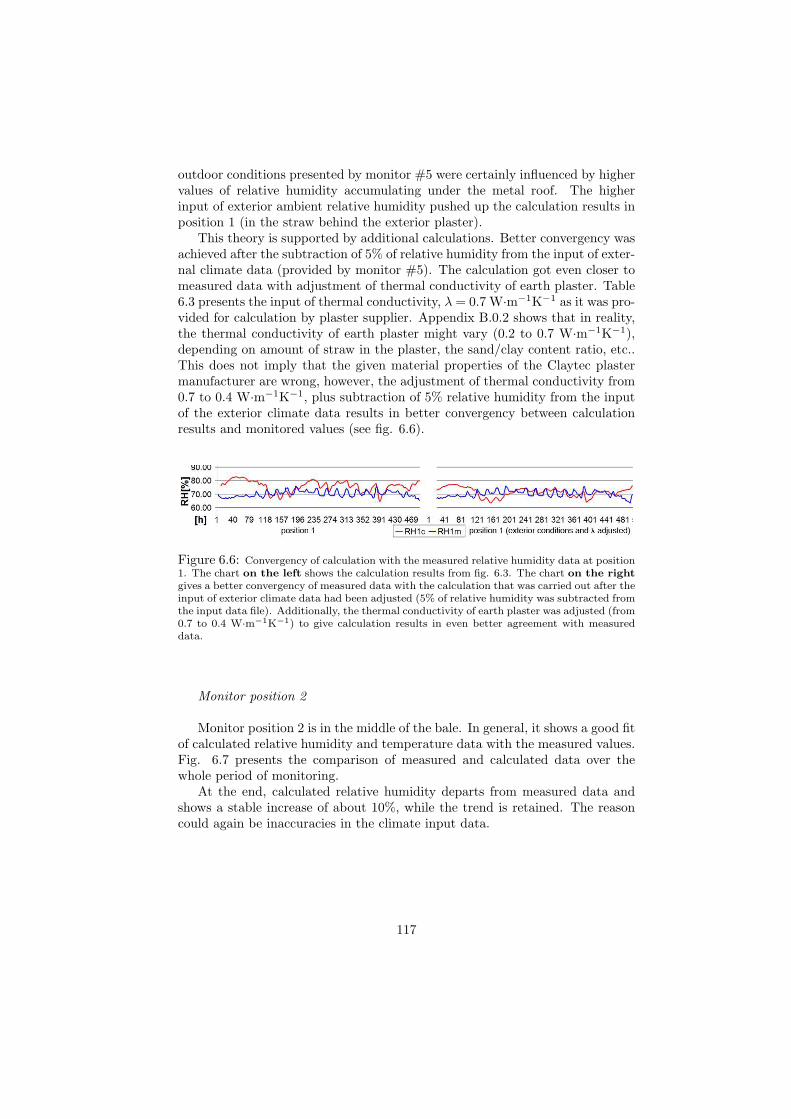
outdoor conditions presented by monitor #5 were certainly influenced by highervalues of relative humidity accumulating under the metal roof. The higherinput of exterior ambient relative humidity pushed up the calculation results inposition 1 (in the straw behind the exterior plaster).
This theory is supported by additional calculations. Better convergency wasachieved after the subtraction of 5% of relative humidity from the input of exter-nal climate data (provided by monitor #5). The calculation got even closer tomeasured data with adjustment of thermal conductivity of earth plaster. Table6.3 presents the input of thermal conductivity, λ = 0.7 W·m−1K−1 as it was pro-vided for calculation by plaster supplier. Appendix B.0.2 shows that in reality,the thermal conductivity of earth plaster might vary (0.2 to 0.7 W·m−1K−1),depending on amount of straw in the plaster, the sand/clay content ratio, etc..This does not imply that the given material properties of the Claytec plastermanufacturer are wrong, however, the adjustment of thermal conductivity from0.7 to 0.4 W·m−1K−1, plus subtraction of 5% relative humidity from the inputof the exterior climate data results in better convergency between calculationresults and monitored values (see fig. 6.6).
Figure 6.6: Convergency of calculation with the measured relative humidity data at position1. The chart on the left shows the calculation results from fig. 6.3. The chart on the rightgives a better convergency of measured data with the calculation that was carried out after theinput of exterior climate data had been adjusted (5% of relative humidity was subtracted fromthe input data file). Additionally, the thermal conductivity of earth plaster was adjusted (from0.7 to 0.4 W·m−1K−1) to give calculation results in even better agreement with measureddata.
Monitor position 2
Monitor position 2 is in the middle of the bale. In general, it shows a good fitof calculated relative humidity and temperature data with the measured values.Fig. 6.7 presents the comparison of measured and calculated data over thewhole period of monitoring.
At the end, calculated relative humidity departs from measured data andshows a stable increase of about 10%, while the trend is retained. The reasoncould again be inaccuracies in the climate input data.
117
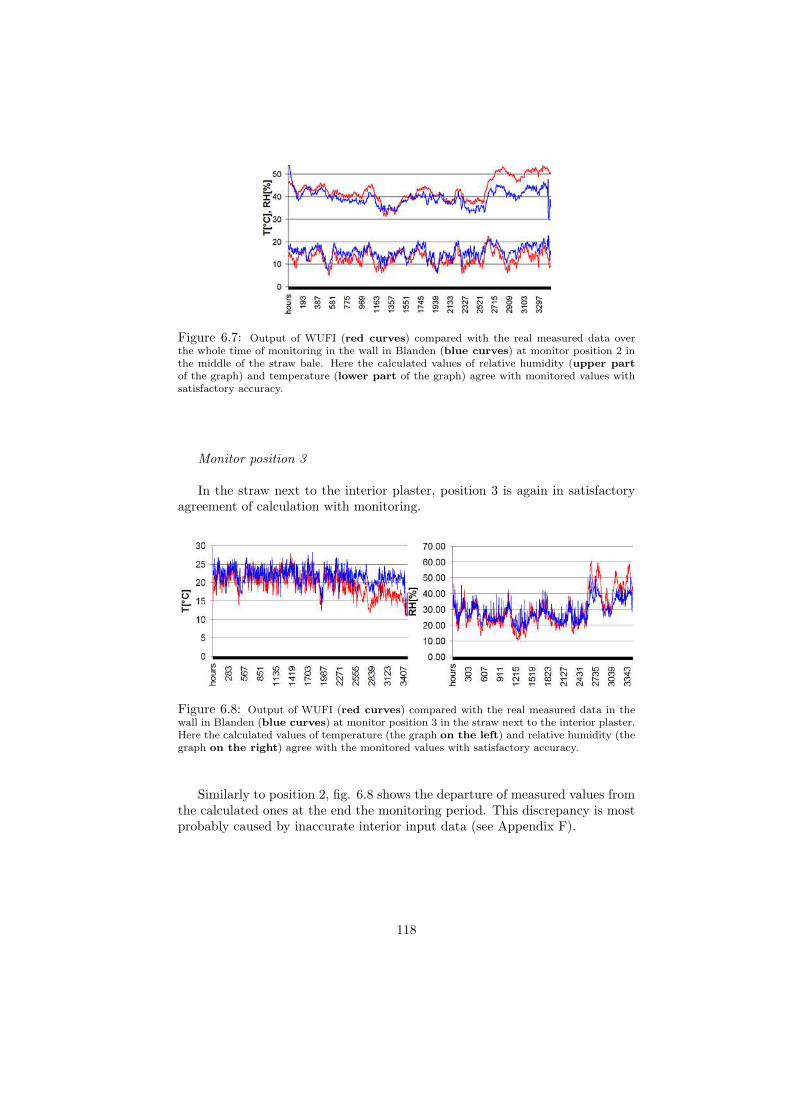
Figure 6.7: Output of WUFI (red curves) compared with the real measured data overthe whole time of monitoring in the wall in Blanden (blue curves) at monitor position 2 inthe middle of the straw bale. Here the calculated values of relative humidity (upper partof the graph) and temperature (lower part of the graph) agree with monitored values withsatisfactory accuracy.
Monitor position 3
In the straw next to the interior plaster, position 3 is again in satisfactoryagreement of calculation with monitoring.
Figure 6.8: Output of WUFI (red curves) compared with the real measured data in thewall in Blanden (blue curves) at monitor position 3 in the straw next to the interior plaster.Here the calculated values of temperature (the graph on the left) and relative humidity (thegraph on the right) agree with the monitored values with satisfactory accuracy.
Similarly to position 2, fig. 6.8 shows the departure of measured values fromthe calculated ones at the end the monitoring period. This discrepancy is mostprobably caused by inaccurate interior input data (see Appendix F).
118
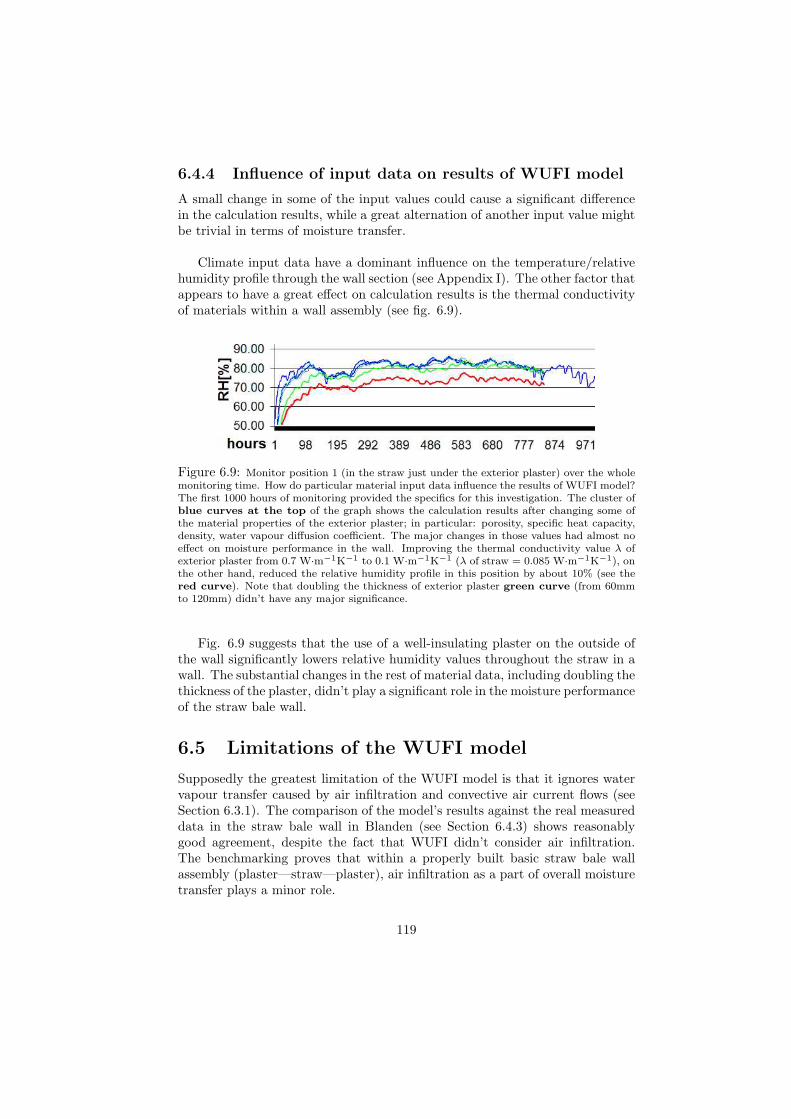
6.4.4 Influence of input data on results of WUFI model
A small change in some of the input values could cause a significant differencein the calculation results, while a great alternation of another input value mightbe trivial in terms of moisture transfer.
Climate input data have a dominant influence on the temperature/relativehumidity profile through the wall section (see Appendix I). The other factor thatappears to have a great effect on calculation results is the thermal conductivityof materials within a wall assembly (see fig. 6.9).
Figure 6.9: Monitor position 1 (in the straw just under the exterior plaster) over the wholemonitoring time. How do particular material input data influence the results of WUFI model?The first 1000 hours of monitoring provided the specifics for this investigation. The cluster ofblue curves at the top of the graph shows the calculation results after changing some ofthe material properties of the exterior plaster; in particular: porosity, specific heat capacity,density, water vapour diffusion coefficient. The major changes in those values had almost noeffect on moisture performance in the wall. Improving the thermal conductivity value λ ofexterior plaster from 0.7 W·m−1K−1 to 0.1 W·m−1K−1 (λ of straw = 0.085 W·m−1K−1), onthe other hand, reduced the relative humidity profile in this position by about 10% (see thered curve). Note that doubling the thickness of exterior plaster green curve (from 60mmto 120mm) didn’t have any major significance.
Fig. 6.9 suggests that the use of a well-insulating plaster on the outside ofthe wall significantly lowers relative humidity values throughout the straw in awall. The substantial changes in the rest of material data, including doubling thethickness of the plaster, didn’t play a significant role in the moisture performanceof the straw bale wall.
6.5 Limitations of the WUFI model
Supposedly the greatest limitation of the WUFI model is that it ignores watervapour transfer caused by air infiltration and convective air current flows (seeSection 6.3.1). The comparison of the model’s results against the real measureddata in the straw bale wall in Blanden (see Section 6.4.3) shows reasonablygood agreement, despite the fact that WUFI didn’t consider air infiltration.The benchmarking proves that within a properly built basic straw bale wallassembly (plaster—straw—plaster), air infiltration as a part of overall moisturetransfer plays a minor role.
119
The WUFI manual (2005) warns that calculation results concerned withsaturated straw will be distorted, because the WUFI model fails to accuratelydescribe the behaviour of natural fibrous material in very high relative humiditylevels (90% and more).
This thesis consciously limits itself to the most frequently used and mostrecommended) straw bale building practice - a wall configuration of plaster—straw—plaster. The implication of the WUFI model on a more intricate wallassembly needs to be further examined.
The fact that the benchmarking ignored the effects of driving rain and solarradiation further limits the following research. Investigation in the next Chap-ter will not consider the effects of driving rain or sunshine on straw bale wallmoisture performance.
6.6 Summary of Chapter 6
This Chapter looked at moisture transfer in great detail, documented the dataused for input into the model, compared the results of the simulation withthe results of the monitoring, explained the differences between monitored andmodeled values and discussed the input variables that had the greatest effect onthe output. Finally, it would be useful to give few recommendations regardingfuture benchmarking of the WUFI model:
• When benchmarking a computer hygrothermal model, it is essential toprovide reliable climate input data. Ideally, the external monitors supply-ing a model with climate input data should be placed in close proximityto the control monitors in the wall.
• Out of all material properties, thermal resistivity influences the moisturetransfer the most significantly. When benchmarking a hygrothermal modelit is important to know the thermal resistivity values of all the materialsin a wall accurately.
With the exception of thermal resistivity, other material properties don’tplay a significant role in moisture performance inside the wall. The investigationshowed that when using thermally insulating plaster, the moisture performancein the straw bale wall is improved.
The benchmarking uncovered the following fact: Air infiltration seems toplay a minor role in overall moisture transfer through the straw bale wall if thewalls are built and plastered correctly.
The advanced theory behind moisture transfer quickly becomes very com-plex. Computer simulation programs like WUFI, for example, struggle to sim-plify the theory without losing an acceptable level of accuracy. Although quite
120
simplified (see Appendix H.2), the WUFI model proved to be reasonably accu-rate for the purposes of investigation in the next Chapter.
121
Chapter 7
Investigation using WUFIdynamic simulation
”... the programs are a long way from being able to deal with theintricate forms of real architecture, spiced with typical constructiondefects. The real usefulness of the programs is to explore generalideas about constructing fault tolerant buildings ...” (Padfield, p.22, 2002)
The previous Chapter proved that the WUFI model can be used for basichumidity research in simple, ”air convection free” straw bale wall assemblies(plaster—straw—plaster) with reasonable accuracy. By using simplified inputdata (without rain penetration or solar radiation), it will be possible to concen-trate on the general ideas behind the moisture transfer through different strawbale wall covers without getting lost ”in the intricate forms of real architecture”as Padfield (2002) puts it.
This Chapter will revisit the wet wall in Plozevet in order to give an esti-mation of its total drying time and also, in the next Section, it will explore theeffect of various plasters on moisture transfer through straw bale walls exposedto extreme weather conditions.
7.1 Dynamic simulation in extreme climates
The advantage of the WUFI computer simulation resides in its power to analysehumidity inside a construction even after it’s been standing for years in almostany conditions, anywhere in the world, without any great effort. The abilityof the program to provide a researcher with 1 year moisture profiles throughdifferently plastered straw bale walls after they’ve been part of occupied familyhouses built in Alaska or Indonesia for example, without waiting and withoutany traveling, is fascinating — and it is exactly what is this Section about. It
122
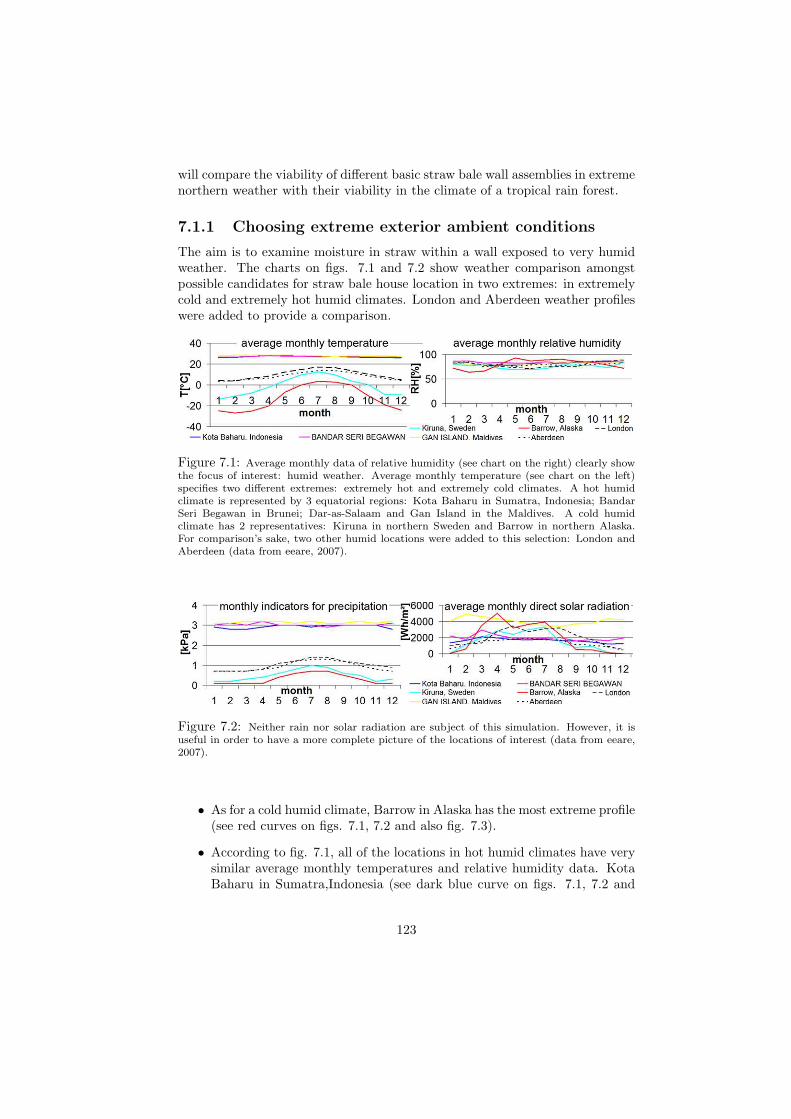
will compare the viability of different basic straw bale wall assemblies in extremenorthern weather with their viability in the climate of a tropical rain forest.
7.1.1 Choosing extreme exterior ambient conditions
The aim is to examine moisture in straw within a wall exposed to very humidweather. The charts on figs. 7.1 and 7.2 show weather comparison amongstpossible candidates for straw bale house location in two extremes: in extremelycold and extremely hot humid climates. London and Aberdeen weather profileswere added to provide a comparison.
Figure 7.1: Average monthly data of relative humidity (see chart on the right) clearly showthe focus of interest: humid weather. Average monthly temperature (see chart on the left)specifies two different extremes: extremely hot and extremely cold climates. A hot humidclimate is represented by 3 equatorial regions: Kota Baharu in Sumatra, Indonesia; BandarSeri Begawan in Brunei; Dar-as-Salaam and Gan Island in the Maldives. A cold humidclimate has 2 representatives: Kiruna in northern Sweden and Barrow in northern Alaska.For comparison’s sake, two other humid locations were added to this selection: London andAberdeen (data from eeare, 2007).
Figure 7.2: Neither rain nor solar radiation are subject of this simulation. However, it isuseful in order to have a more complete picture of the locations of interest (data from eeare,2007).
• As for a cold humid climate, Barrow in Alaska has the most extreme profile(see red curves on figs. 7.1, 7.2 and also fig. 7.3).
• According to fig. 7.1, all of the locations in hot humid climates have verysimilar average monthly temperatures and relative humidity data. KotaBaharu in Sumatra,Indonesia (see dark blue curve on figs. 7.1, 7.2 and
123
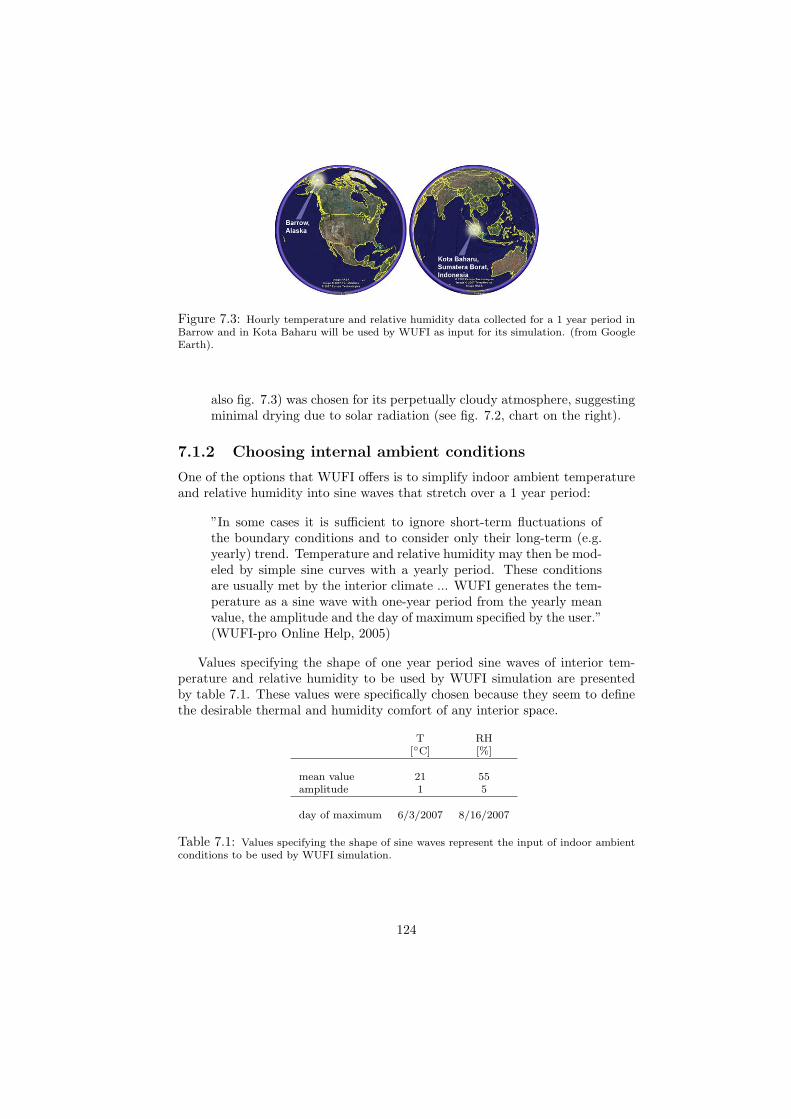
Figure 7.3: Hourly temperature and relative humidity data collected for a 1 year period inBarrow and in Kota Baharu will be used by WUFI as input for its simulation. (from GoogleEarth).
also fig. 7.3) was chosen for its perpetually cloudy atmosphere, suggestingminimal drying due to solar radiation (see fig. 7.2, chart on the right).
7.1.2 Choosing internal ambient conditions
One of the options that WUFI offers is to simplify indoor ambient temperatureand relative humidity into sine waves that stretch over a 1 year period:
”In some cases it is sufficient to ignore short-term fluctuations ofthe boundary conditions and to consider only their long-term (e.g.yearly) trend. Temperature and relative humidity may then be mod-eled by simple sine curves with a yearly period. These conditionsare usually met by the interior climate ... WUFI generates the tem-perature as a sine wave with one-year period from the yearly meanvalue, the amplitude and the day of maximum specified by the user.”(WUFI-pro Online Help, 2005)
Values specifying the shape of one year period sine waves of interior tem-perature and relative humidity to be used by WUFI simulation are presentedby table 7.1. These values were specifically chosen because they seem to definethe desirable thermal and humidity comfort of any interior space.
T RH[◦C] [%]
mean value 21 55amplitude 1 5
day of maximum 6/3/2007 8/16/2007
Table 7.1: Values specifying the shape of sine waves represent the input of indoor ambientconditions to be used by WUFI simulation.
124
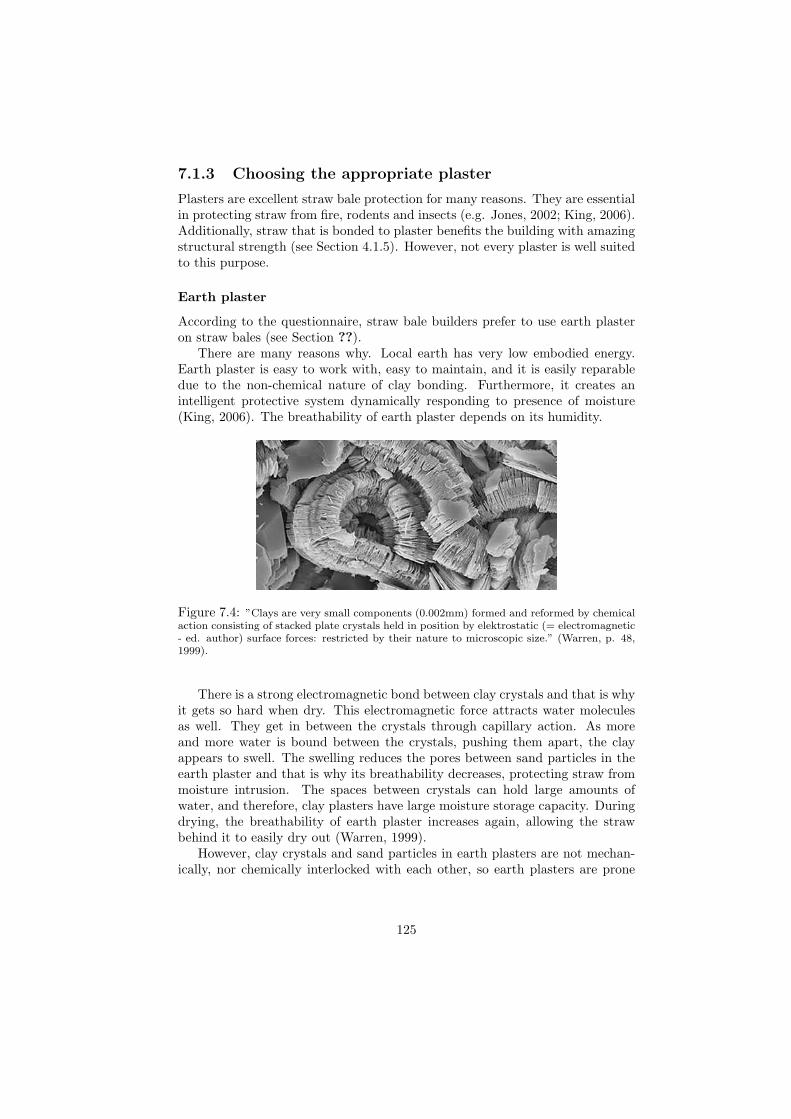
7.1.3 Choosing the appropriate plaster
Plasters are excellent straw bale protection for many reasons. They are essentialin protecting straw from fire, rodents and insects (e.g. Jones, 2002; King, 2006).Additionally, straw that is bonded to plaster benefits the building with amazingstructural strength (see Section 4.1.5). However, not every plaster is well suitedto this purpose.
Earth plaster
According to the questionnaire, straw bale builders prefer to use earth plasteron straw bales (see Section ??).
There are many reasons why. Local earth has very low embodied energy.Earth plaster is easy to work with, easy to maintain, and it is easily reparabledue to the non-chemical nature of clay bonding. Furthermore, it creates anintelligent protective system dynamically responding to presence of moisture(King, 2006). The breathability of earth plaster depends on its humidity.
Figure 7.4: ”Clays are very small components (0.002mm) formed and reformed by chemicalaction consisting of stacked plate crystals held in position by elektrostatic (= electromagnetic- ed. author) surface forces: restricted by their nature to microscopic size.” (Warren, p. 48,1999).
There is a strong electromagnetic bond between clay crystals and that is whyit gets so hard when dry. This electromagnetic force attracts water moleculesas well. They get in between the crystals through capillary action. As moreand more water is bound between the crystals, pushing them apart, the clayappears to swell. The swelling reduces the pores between sand particles in theearth plaster and that is why its breathability decreases, protecting straw frommoisture intrusion. The spaces between crystals can hold large amounts ofwater, and therefore, clay plasters have large moisture storage capacity. Duringdrying, the breathability of earth plaster increases again, allowing the strawbehind it to easily dry out (Warren, 1999).
However, clay crystals and sand particles in earth plasters are not mechan-ically, nor chemically interlocked with each other, so earth plasters are prone
125
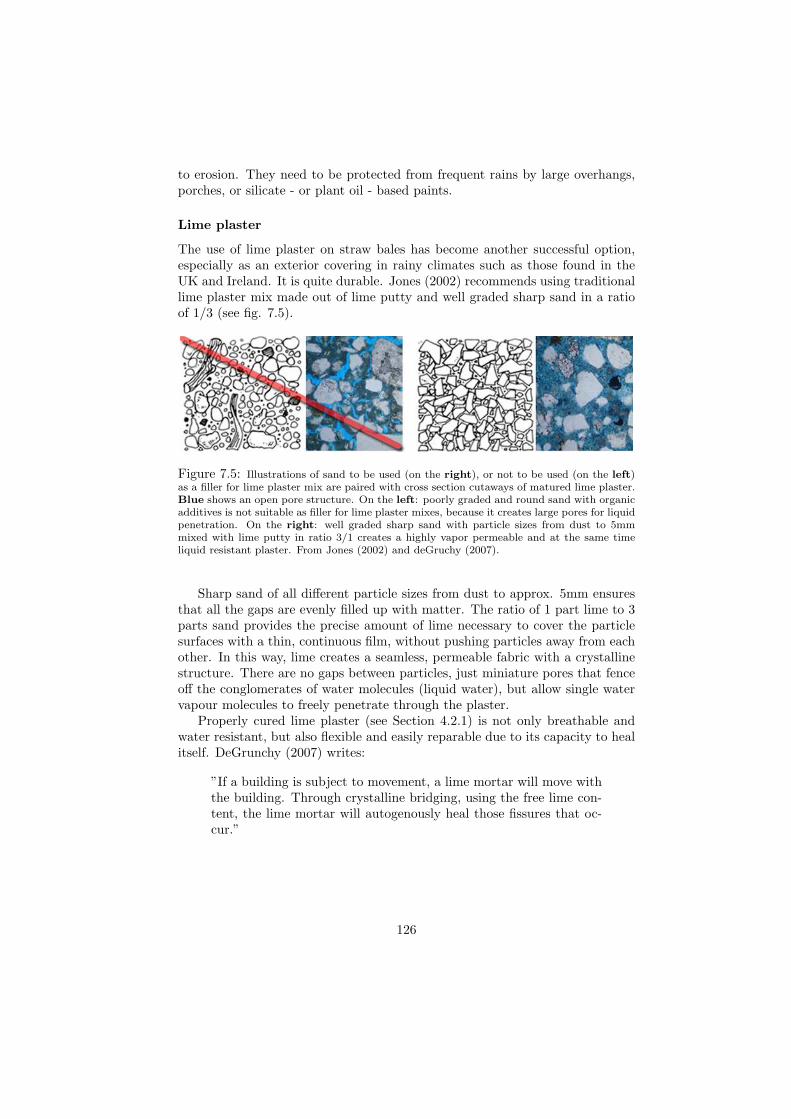
to erosion. They need to be protected from frequent rains by large overhangs,porches, or silicate - or plant oil - based paints.
Lime plaster
The use of lime plaster on straw bales has become another successful option,especially as an exterior covering in rainy climates such as those found in theUK and Ireland. It is quite durable. Jones (2002) recommends using traditionallime plaster mix made out of lime putty and well graded sharp sand in a ratioof 1/3 (see fig. 7.5).
Figure 7.5: Illustrations of sand to be used (on the right), or not to be used (on the left)as a filler for lime plaster mix are paired with cross section cutaways of matured lime plaster.Blue shows an open pore structure. On the left: poorly graded and round sand with organicadditives is not suitable as filler for lime plaster mixes, because it creates large pores for liquidpenetration. On the right: well graded sharp sand with particle sizes from dust to 5mmmixed with lime putty in ratio 3/1 creates a highly vapor permeable and at the same timeliquid resistant plaster. From Jones (2002) and deGruchy (2007).
Sharp sand of all different particle sizes from dust to approx. 5mm ensuresthat all the gaps are evenly filled up with matter. The ratio of 1 part lime to 3parts sand provides the precise amount of lime necessary to cover the particlesurfaces with a thin, continuous film, without pushing particles away from eachother. In this way, lime creates a seamless, permeable fabric with a crystallinestructure. There are no gaps between particles, just miniature pores that fenceoff the conglomerates of water molecules (liquid water), but allow single watervapour molecules to freely penetrate through the plaster.
Properly cured lime plaster (see Section 4.2.1) is not only breathable andwater resistant, but also flexible and easily reparable due to its capacity to healitself. DeGrunchy (2007) writes:
”If a building is subject to movement, a lime mortar will move withthe building. Through crystalline bridging, using the free lime con-tent, the lime mortar will autogenously heal those fissures that oc-cur.”
126
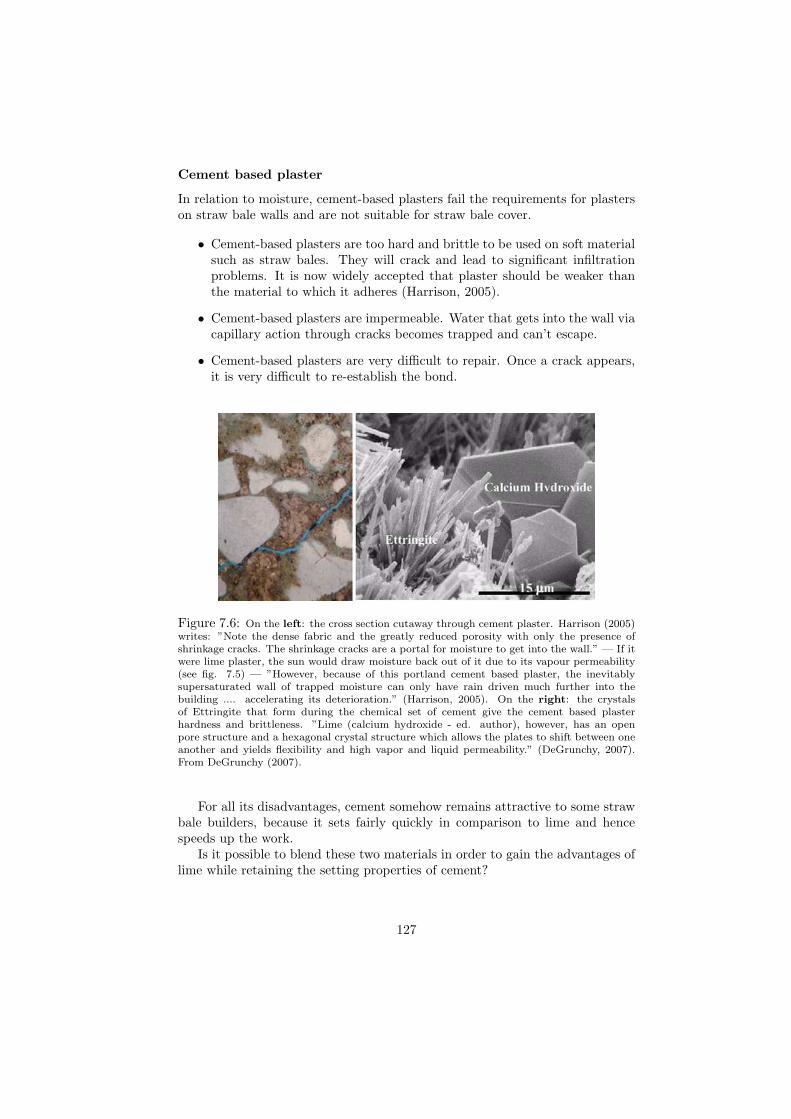
Cement based plaster
In relation to moisture, cement-based plasters fail the requirements for plasterson straw bale walls and are not suitable for straw bale cover.
• Cement-based plasters are too hard and brittle to be used on soft materialsuch as straw bales. They will crack and lead to significant infiltrationproblems. It is now widely accepted that plaster should be weaker thanthe material to which it adheres (Harrison, 2005).
• Cement-based plasters are impermeable. Water that gets into the wall viacapillary action through cracks becomes trapped and can’t escape.
• Cement-based plasters are very difficult to repair. Once a crack appears,it is very difficult to re-establish the bond.
Figure 7.6: On the left: the cross section cutaway through cement plaster. Harrison (2005)writes: ”Note the dense fabric and the greatly reduced porosity with only the presence ofshrinkage cracks. The shrinkage cracks are a portal for moisture to get into the wall.” — If itwere lime plaster, the sun would draw moisture back out of it due to its vapour permeability(see fig. 7.5) — ”However, because of this portland cement based plaster, the inevitablysupersaturated wall of trapped moisture can only have rain driven much further into thebuilding .... accelerating its deterioration.” (Harrison, 2005). On the right: the crystalsof Ettringite that form during the chemical set of cement give the cement based plasterhardness and brittleness. ”Lime (calcium hydroxide - ed. author), however, has an openpore structure and a hexagonal crystal structure which allows the plates to shift between oneanother and yields flexibility and high vapor and liquid permeability.” (DeGrunchy, 2007).From DeGrunchy (2007).
For all its disadvantages, cement somehow remains attractive to some strawbale builders, because it sets fairly quickly in comparison to lime and hencespeeds up the work.
Is it possible to blend these two materials in order to gain the advantages oflime while retaining the setting properties of cement?
127
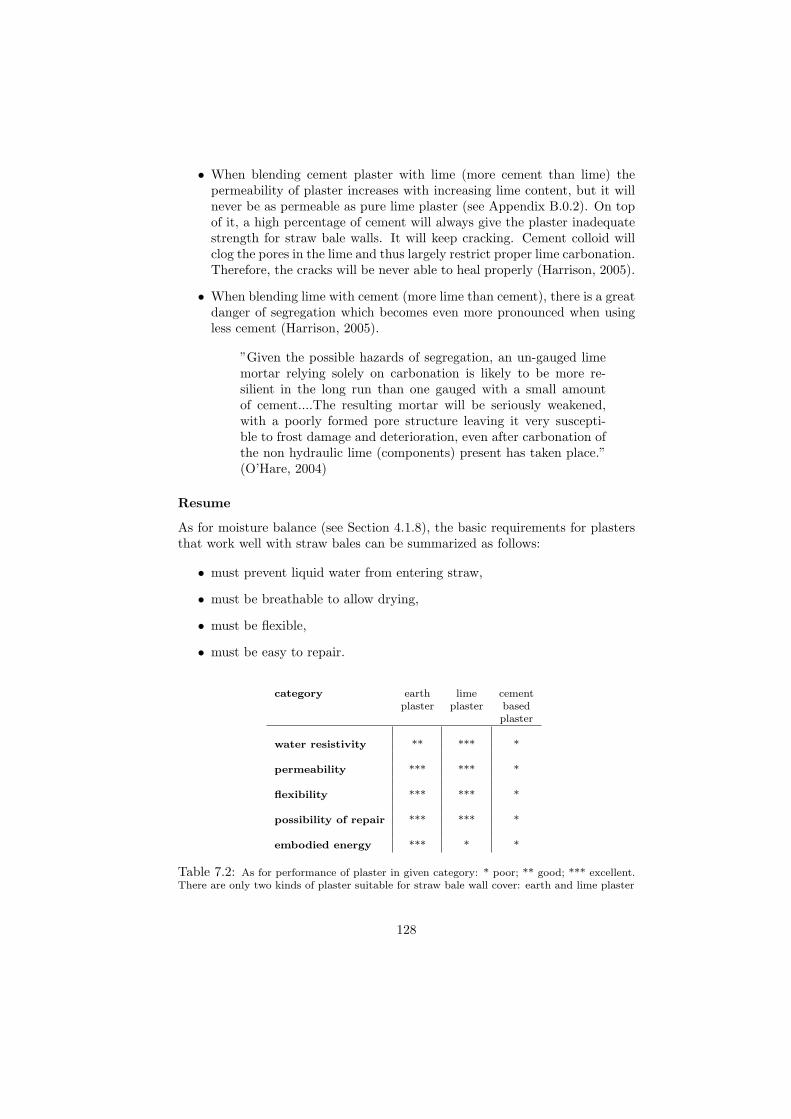
• When blending cement plaster with lime (more cement than lime) thepermeability of plaster increases with increasing lime content, but it willnever be as permeable as pure lime plaster (see Appendix B.0.2). On topof it, a high percentage of cement will always give the plaster inadequatestrength for straw bale walls. It will keep cracking. Cement colloid willclog the pores in the lime and thus largely restrict proper lime carbonation.Therefore, the cracks will be never able to heal properly (Harrison, 2005).
• When blending lime with cement (more lime than cement), there is a greatdanger of segregation which becomes even more pronounced when usingless cement (Harrison, 2005).
”Given the possible hazards of segregation, an un-gauged limemortar relying solely on carbonation is likely to be more re-silient in the long run than one gauged with a small amountof cement....The resulting mortar will be seriously weakened,with a poorly formed pore structure leaving it very suscepti-ble to frost damage and deterioration, even after carbonation ofthe non hydraulic lime (components) present has taken place.”(O’Hare, 2004)
Resume
As for moisture balance (see Section 4.1.8), the basic requirements for plastersthat work well with straw bales can be summarized as follows:
• must prevent liquid water from entering straw,
• must be breathable to allow drying,
• must be flexible,
• must be easy to repair.
category earth lime cementplaster plaster based
plaster
water resistivity ** *** *
permeability *** *** *
flexibility *** *** *
possibility of repair *** *** *
embodied energy *** * *
Table 7.2: As for performance of plaster in given category: * poor; ** good; *** excellent.There are only two kinds of plaster suitable for straw bale wall cover: earth and lime plaster
128
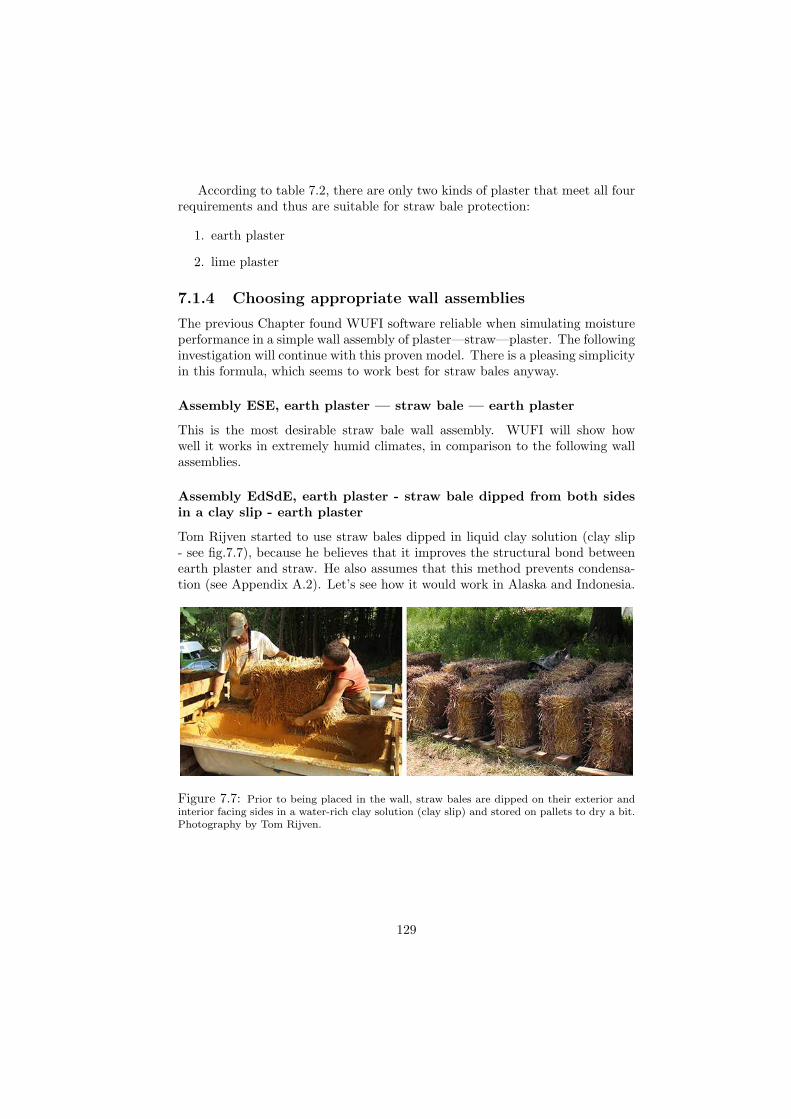
According to table 7.2, there are only two kinds of plaster that meet all fourrequirements and thus are suitable for straw bale protection:
1. earth plaster
2. lime plaster
7.1.4 Choosing appropriate wall assemblies
The previous Chapter found WUFI software reliable when simulating moistureperformance in a simple wall assembly of plaster—straw—plaster. The followinginvestigation will continue with this proven model. There is a pleasing simplicityin this formula, which seems to work best for straw bales anyway.
Assembly ESE, earth plaster — straw bale — earth plaster
This is the most desirable straw bale wall assembly. WUFI will show howwell it works in extremely humid climates, in comparison to the following wallassemblies.
Assembly EdSdE, earth plaster - straw bale dipped from both sidesin a clay slip - earth plaster
Tom Rijven started to use straw bales dipped in liquid clay solution (clay slip- see fig.7.7), because he believes that it improves the structural bond betweenearth plaster and straw. He also assumes that this method prevents condensa-tion (see Appendix A.2). Let’s see how it would work in Alaska and Indonesia.
Figure 7.7: Prior to being placed in the wall, straw bales are dipped on their exterior andinterior facing sides in a water-rich clay solution (clay slip) and stored on pallets to dry a bit.Photography by Tom Rijven.
129
Assembly LESE, lime plaster - earth plaster — straw bale — earthplaster
A finishing coat of lime plaster is used over the scratch (body) coat of earthplaster to protect it from erosion in rainy climates by some professional builders.Unlike lime plaster, earth plaster can be applied in a thick layer, so this methodoffers the advantage of having flat and even surfaces on the exterior of the house(any deep grooves in the straw bale wall can be filled with a thick layer of earth),with the advantage of durability provided by a thin layer of lime plaster finish.
”There is some risk in using dissimilar materials, as the layers mayexpand and contract differently in response to temperature andmoisture and thus delaminate over time.” (King, p.30, 2006)
However, let’s assume that the lime plaster finish was properly done overa base of earth plaster and that it will prove to be a durable solution. Thequestion is: will the thin layer of lime plaster over the earthen base influencethe moisture performance of the whole wall?
Assembly LSE, lime plaster — straw bale — earth plaster
Having lime plaster outside and earth plaster in the interior of a house is a verycommon and preferable straw bale wall assembly used in rainy climates.
In general, the permeability of earth plaster is greater than permeabilityof lime plaster (see Appendix B.0.2). It is now widely accepted that havinga more breathable plaster on the outside and a less breathable plaster on theinside of the house is beneficial for overall wall moisture performance in heatingclimates. In the tropics, however, the opposite is true. Having less permeablelime plaster on the outside of a house in Indonesia should be advantageous. Howwill this wall assembly, which protects straw from rainy weather, perform in theequatorial region and how it will perform in the extreme north?
Assembly LSL, lime plaster — straw — lime plaster
The final straw bale wall assembly is another common possibility for a rainyclimate. As for moisture transfer, will lime plaster perform better than earthplaster?
7.1.5 Input for WUFI simulation
Wall assembly, monitor position and grid
Wall assembly ESE
Wall assembly earth plaster — straw bale — earth plaster was already usedfor to benchmark of the WUFI simulation and is described in Section 6.4.1 (seefig. 6.1).
130
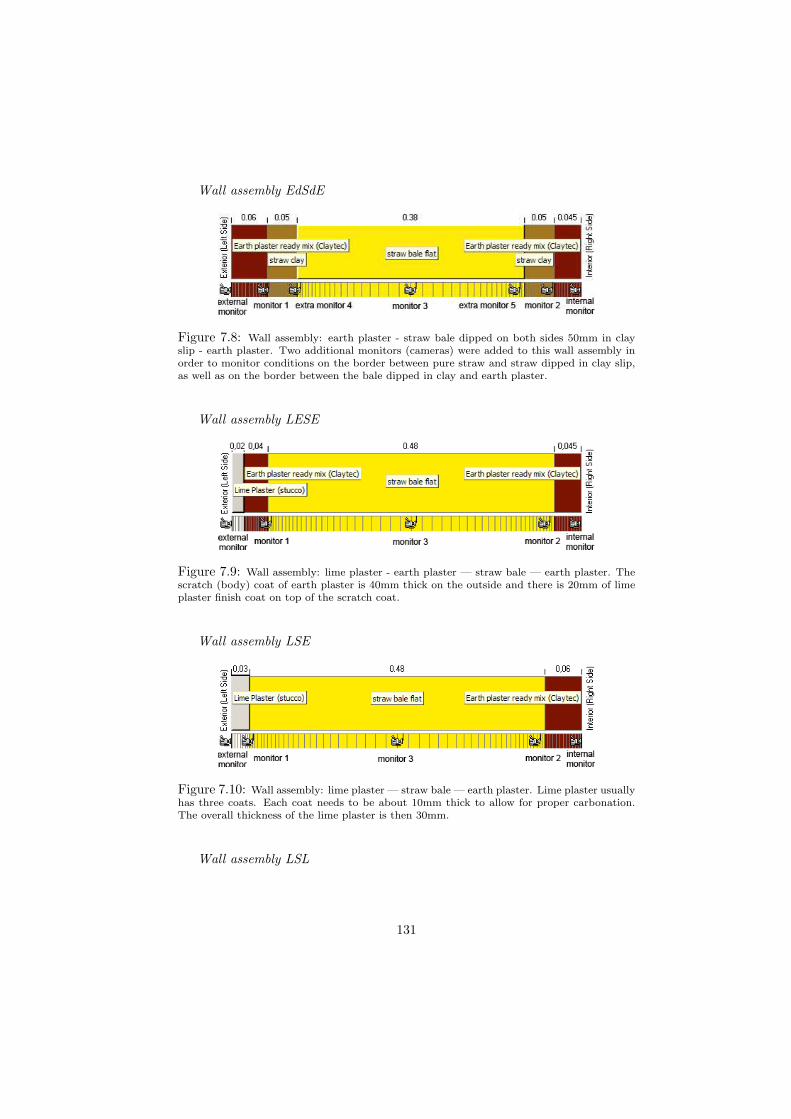
Wall assembly EdSdE
Figure 7.8: Wall assembly: earth plaster - straw bale dipped on both sides 50mm in clayslip - earth plaster. Two additional monitors (cameras) were added to this wall assembly inorder to monitor conditions on the border between pure straw and straw dipped in clay slip,as well as on the border between the bale dipped in clay and earth plaster.
Wall assembly LESE
Figure 7.9: Wall assembly: lime plaster - earth plaster — straw bale — earth plaster. Thescratch (body) coat of earth plaster is 40mm thick on the outside and there is 20mm of limeplaster finish coat on top of the scratch coat.
Wall assembly LSE
Figure 7.10: Wall assembly: lime plaster — straw bale — earth plaster. Lime plaster usuallyhas three coats. Each coat needs to be about 10mm thick to allow for proper carbonation.The overall thickness of the lime plaster is then 30mm.
Wall assembly LSL
131
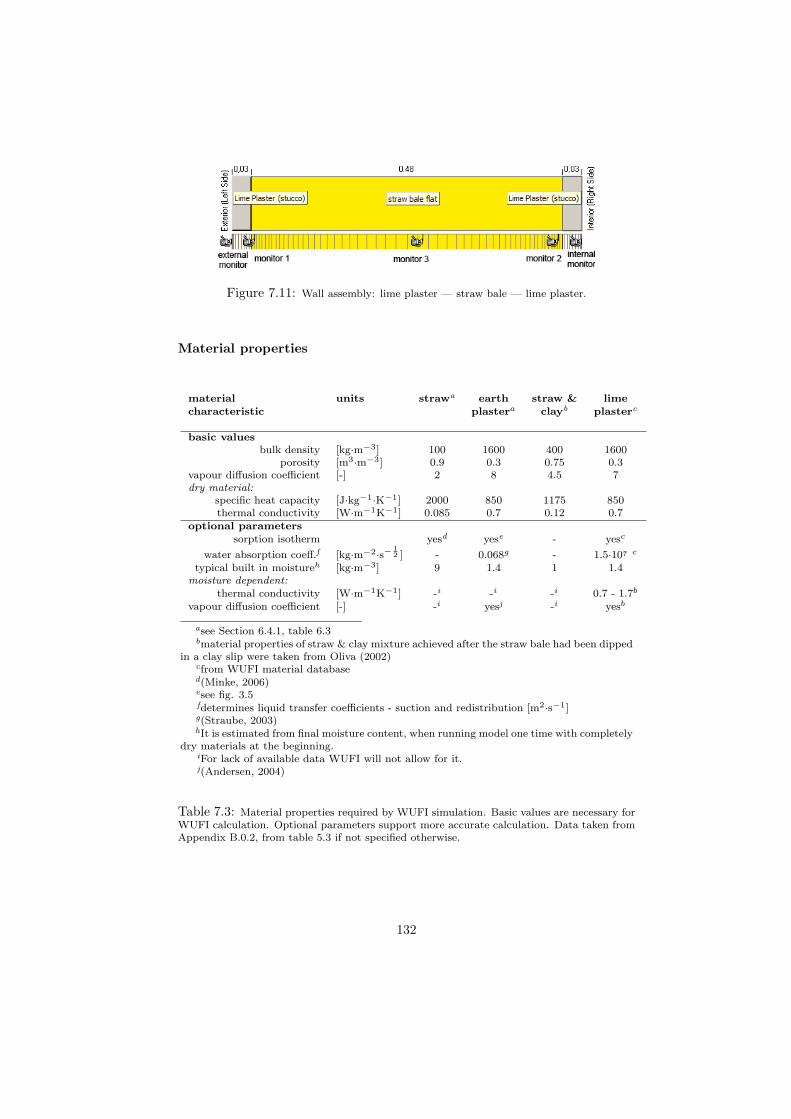
Figure 7.11: Wall assembly: lime plaster — straw bale — lime plaster.
Material properties
material units strawa earth straw & limecharacteristic plastera clayb plasterc
basic valuesbulk density [kg·m−3] 100 1600 400 1600
porosity [m3·m−3] 0.9 0.3 0.75 0.3vapour diffusion coefficient [-] 2 8 4.5 7dry material:
specific heat capacity [J·kg−1·K−1] 2000 850 1175 850thermal conductivity [W·m−1K−1] 0.085 0.7 0.12 0.7
optional parameterssorption isotherm yesd yese - yesc
water absorption coeff.f [kg·m−2·s− 12 ] - 0.068g - 1.5·107 c
typical built in moistureh [kg·m−3] 9 1.4 1 1.4moisture dependent:
thermal conductivity [W·m−1K−1] -i -i -i 0.7 - 1.7b
vapour diffusion coefficient [-] -i yesj -i yesb
asee Section 6.4.1, table 6.3bmaterial properties of straw & clay mixture achieved after the straw bale had been dipped
in a clay slip were taken from Oliva (2002)cfrom WUFI material databased(Minke, 2006)esee fig. 3.5fdetermines liquid transfer coefficients - suction and redistribution [m2·s−1]g(Straube, 2003)hIt is estimated from final moisture content, when running model one time with completely
dry materials at the beginning.iFor lack of available data WUFI will not allow for it.j(Andersen, 2004)
Table 7.3: Material properties required by WUFI simulation. Basic values are necessary forWUFI calculation. Optional parameters support more accurate calculation. Data taken fromAppendix B.0.2, from table 5.3 if not specified otherwise.
132
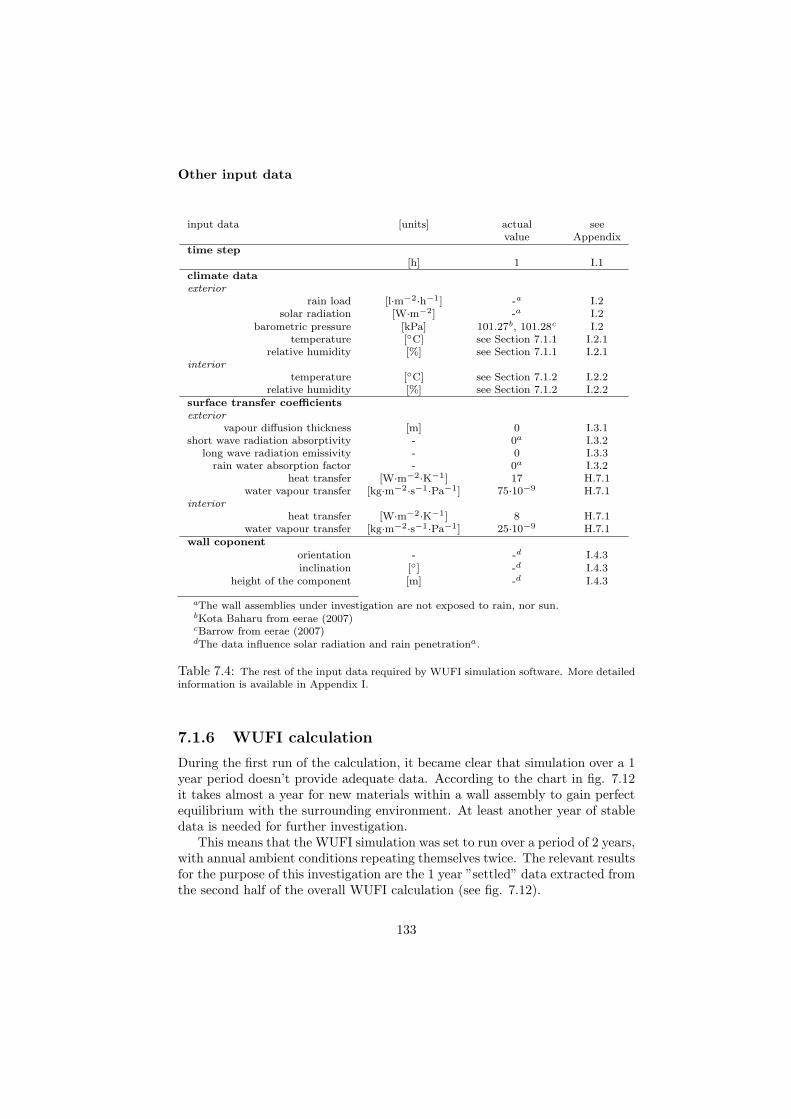
Other input data
input data [units] actual seevalue Appendix
time step[h] 1 I.1
climate dataexterior
rain load [l·m−2·h−1] -a I.2solar radiation [W·m−2] -a I.2
barometric pressure [kPa] 101.27b, 101.28c I.2temperature [◦C] see Section 7.1.1 I.2.1
relative humidity [%] see Section 7.1.1 I.2.1interior
temperature [◦C] see Section 7.1.2 I.2.2relative humidity [%] see Section 7.1.2 I.2.2
surface transfer coefficientsexterior
vapour diffusion thickness [m] 0 I.3.1short wave radiation absorptivity - 0a I.3.2
long wave radiation emissivity - 0 I.3.3rain water absorption factor - 0a I.3.2
heat transfer [W·m−2·K−1] 17 H.7.1water vapour transfer [kg·m−2·s−1·Pa−1] 75·10−9 H.7.1
interiorheat transfer [W·m−2·K−1] 8 H.7.1
water vapour transfer [kg·m−2·s−1·Pa−1] 25·10−9 H.7.1wall coponent
orientation - -d I.4.3inclination [◦] -d I.4.3
height of the component [m] -d I.4.3
aThe wall assemblies under investigation are not exposed to rain, nor sun.bKota Baharu from eerae (2007)cBarrow from eerae (2007)dThe data influence solar radiation and rain penetrationa.
Table 7.4: The rest of the input data required by WUFI simulation software. More detailedinformation is available in Appendix I.
7.1.6 WUFI calculation
During the first run of the calculation, it became clear that simulation over a 1year period doesn’t provide adequate data. According to the chart in fig. 7.12it takes almost a year for new materials within a wall assembly to gain perfectequilibrium with the surrounding environment. At least another year of stabledata is needed for further investigation.
This means that the WUFI simulation was set to run over a period of 2 years,with annual ambient conditions repeating themselves twice. The relevant resultsfor the purpose of this investigation are the 1 year ”settled” data extracted fromthe second half of the overall WUFI calculation (see fig. 7.12).
133
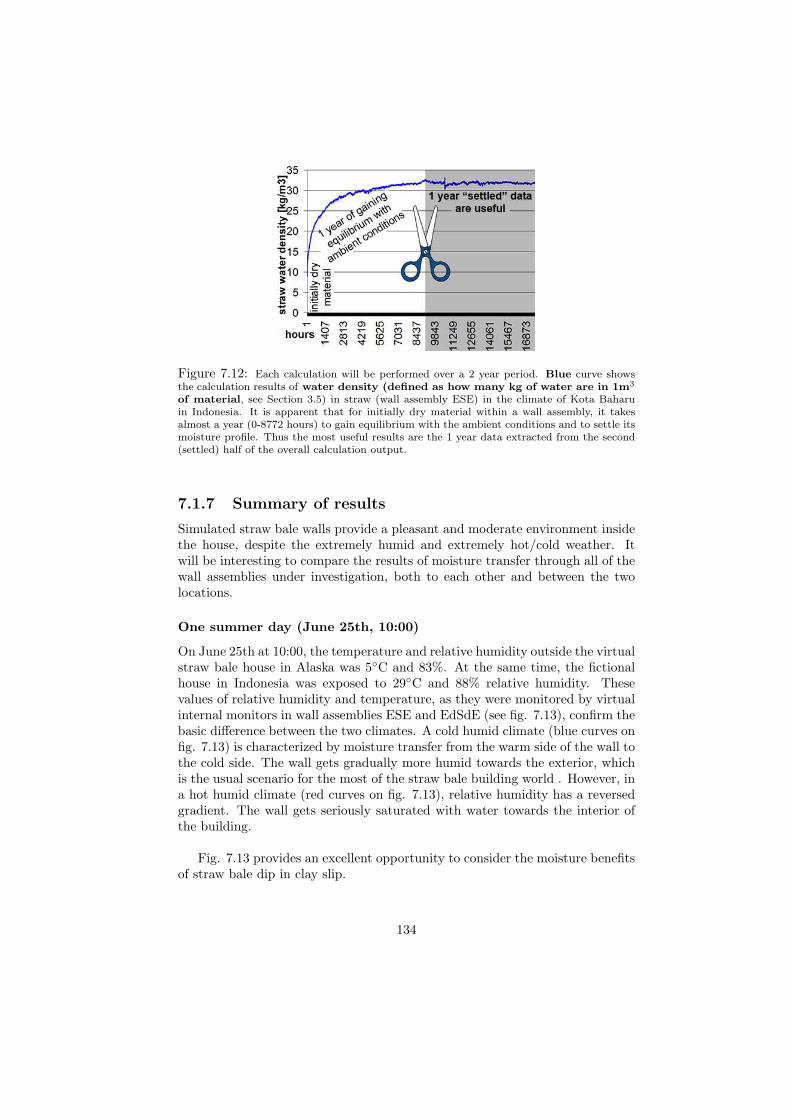
Figure 7.12: Each calculation will be performed over a 2 year period. Blue curve showsthe calculation results of water density (defined as how many kg of water are in 1m3
of material, see Section 3.5) in straw (wall assembly ESE) in the climate of Kota Baharuin Indonesia. It is apparent that for initially dry material within a wall assembly, it takesalmost a year (0-8772 hours) to gain equilibrium with the ambient conditions and to settle itsmoisture profile. Thus the most useful results are the 1 year data extracted from the second(settled) half of the overall calculation output.
7.1.7 Summary of results
Simulated straw bale walls provide a pleasant and moderate environment insidethe house, despite the extremely humid and extremely hot/cold weather. Itwill be interesting to compare the results of moisture transfer through all of thewall assemblies under investigation, both to each other and between the twolocations.
One summer day (June 25th, 10:00)
On June 25th at 10:00, the temperature and relative humidity outside the virtualstraw bale house in Alaska was 5◦C and 83%. At the same time, the fictionalhouse in Indonesia was exposed to 29◦C and 88% relative humidity. Thesevalues of relative humidity and temperature, as they were monitored by virtualinternal monitors in wall assemblies ESE and EdSdE (see fig. 7.13), confirm thebasic difference between the two climates. A cold humid climate (blue curves onfig. 7.13) is characterized by moisture transfer from the warm side of the wall tothe cold side. The wall gets gradually more humid towards the exterior, whichis the usual scenario for the most of the straw bale building world . However, ina hot humid climate (red curves on fig. 7.13), relative humidity has a reversedgradient. The wall gets seriously saturated with water towards the interior ofthe building.
Fig. 7.13 provides an excellent opportunity to consider the moisture benefitsof straw bale dip in clay slip.
134
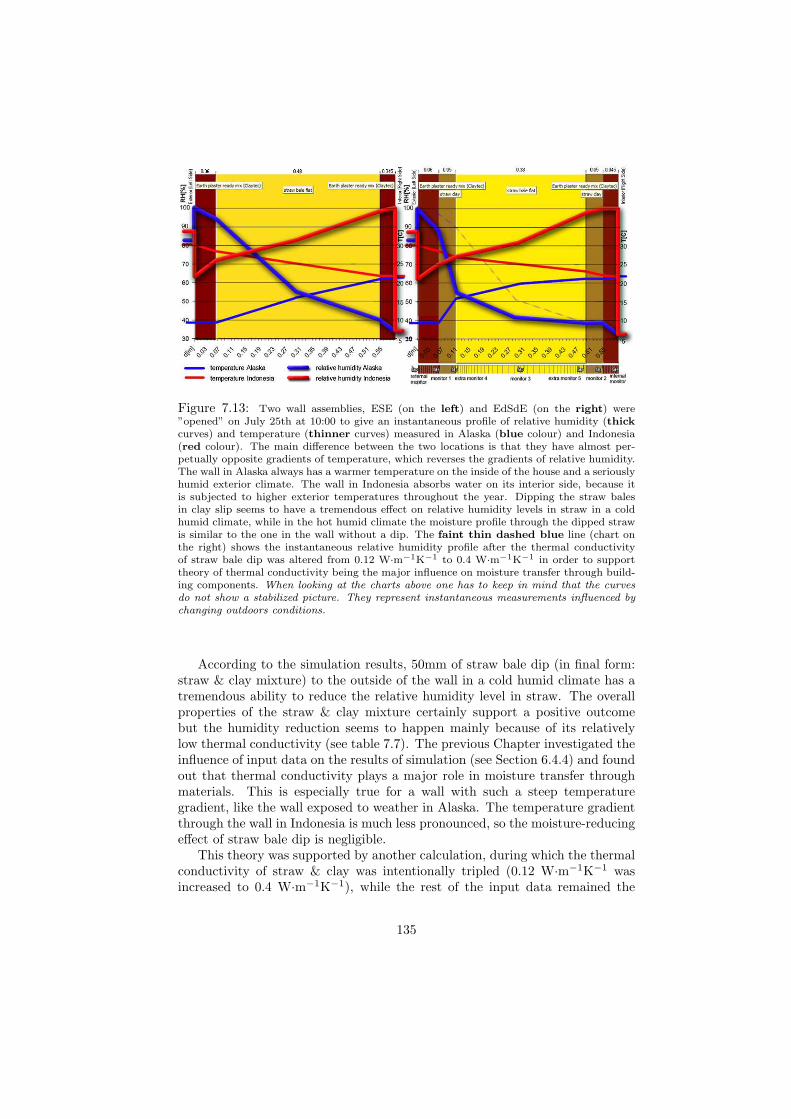
Figure 7.13: Two wall assemblies, ESE (on the left) and EdSdE (on the right) were”opened” on July 25th at 10:00 to give an instantaneous profile of relative humidity (thickcurves) and temperature (thinner curves) measured in Alaska (blue colour) and Indonesia(red colour). The main difference between the two locations is that they have almost per-petually opposite gradients of temperature, which reverses the gradients of relative humidity.The wall in Alaska always has a warmer temperature on the inside of the house and a seriouslyhumid exterior climate. The wall in Indonesia absorbs water on its interior side, because itis subjected to higher exterior temperatures throughout the year. Dipping the straw balesin clay slip seems to have a tremendous effect on relative humidity levels in straw in a coldhumid climate, while in the hot humid climate the moisture profile through the dipped strawis similar to the one in the wall without a dip. The faint thin dashed blue line (chart onthe right) shows the instantaneous relative humidity profile after the thermal conductivityof straw bale dip was altered from 0.12 W·m−1K−1 to 0.4 W·m−1K−1 in order to supporttheory of thermal conductivity being the major influence on moisture transfer through build-ing components. When looking at the charts above one has to keep in mind that the curvesdo not show a stabilized picture. They represent instantaneous measurements influenced bychanging outdoors conditions.
According to the simulation results, 50mm of straw bale dip (in final form:straw & clay mixture) to the outside of the wall in a cold humid climate has atremendous ability to reduce the relative humidity level in straw. The overallproperties of the straw & clay mixture certainly support a positive outcomebut the humidity reduction seems to happen mainly because of its relativelylow thermal conductivity (see table 7.7). The previous Chapter investigated theinfluence of input data on the results of simulation (see Section 6.4.4) and foundout that thermal conductivity plays a major role in moisture transfer throughmaterials. This is especially true for a wall with such a steep temperaturegradient, like the wall exposed to weather in Alaska. The temperature gradientthrough the wall in Indonesia is much less pronounced, so the moisture-reducingeffect of straw bale dip is negligible.
This theory was supported by another calculation, during which the thermalconductivity of straw & clay was intentionally tripled (0.12 W·m−1K−1 wasincreased to 0.4 W·m−1K−1), while the rest of the input data remained the
135
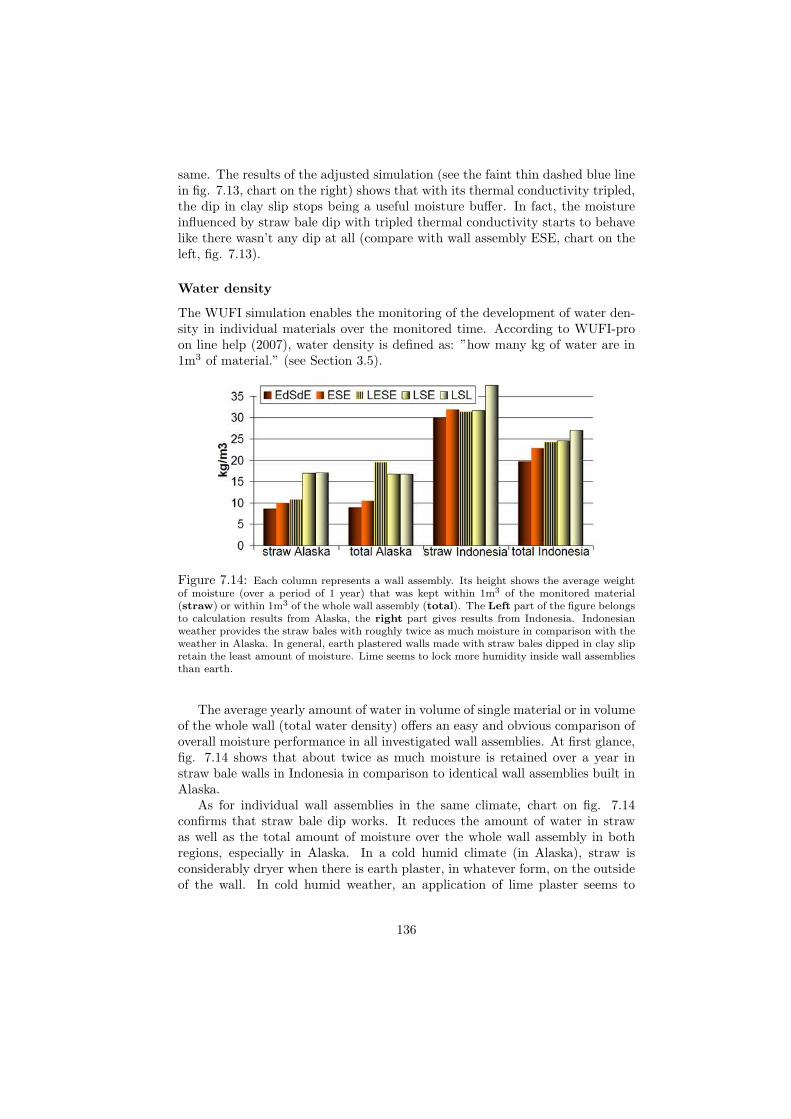
same. The results of the adjusted simulation (see the faint thin dashed blue linein fig. 7.13, chart on the right) shows that with its thermal conductivity tripled,the dip in clay slip stops being a useful moisture buffer. In fact, the moistureinfluenced by straw bale dip with tripled thermal conductivity starts to behavelike there wasn’t any dip at all (compare with wall assembly ESE, chart on theleft, fig. 7.13).
Water density
The WUFI simulation enables the monitoring of the development of water den-sity in individual materials over the monitored time. According to WUFI-proon line help (2007), water density is defined as: ”how many kg of water are in1m3 of material.” (see Section 3.5).
Figure 7.14: Each column represents a wall assembly. Its height shows the average weightof moisture (over a period of 1 year) that was kept within 1m3 of the monitored material(straw) or within 1m3 of the whole wall assembly (total). The Left part of the figure belongsto calculation results from Alaska, the right part gives results from Indonesia. Indonesianweather provides the straw bales with roughly twice as much moisture in comparison with theweather in Alaska. In general, earth plastered walls made with straw bales dipped in clay slipretain the least amount of moisture. Lime seems to lock more humidity inside wall assembliesthan earth.
The average yearly amount of water in volume of single material or in volumeof the whole wall (total water density) offers an easy and obvious comparison ofoverall moisture performance in all investigated wall assemblies. At first glance,fig. 7.14 shows that about twice as much moisture is retained over a year instraw bale walls in Indonesia in comparison to identical wall assemblies built inAlaska.
As for individual wall assemblies in the same climate, chart on fig. 7.14confirms that straw bale dip works. It reduces the amount of water in strawas well as the total amount of moisture over the whole wall assembly in bothregions, especially in Alaska. In a cold humid climate (in Alaska), straw isconsiderably dryer when there is earth plaster, in whatever form, on the outsideof the wall. In cold humid weather, an application of lime plaster seems to
136
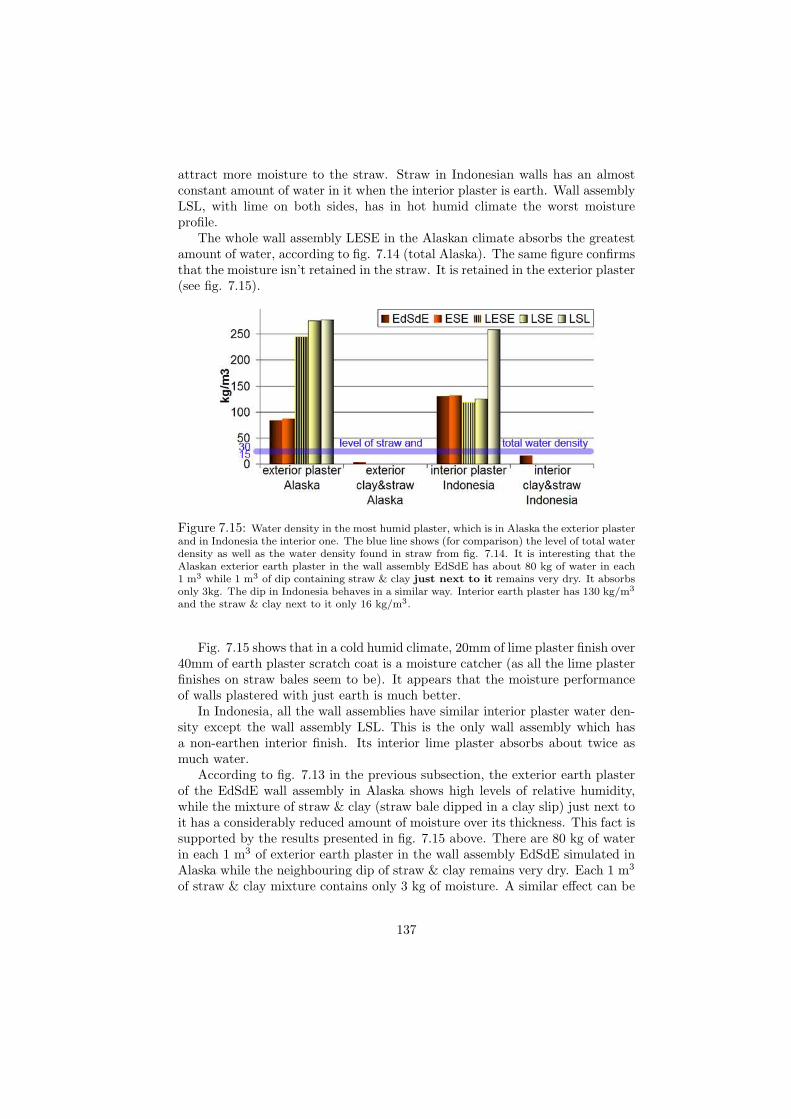
attract more moisture to the straw. Straw in Indonesian walls has an almostconstant amount of water in it when the interior plaster is earth. Wall assemblyLSL, with lime on both sides, has in hot humid climate the worst moistureprofile.
The whole wall assembly LESE in the Alaskan climate absorbs the greatestamount of water, according to fig. 7.14 (total Alaska). The same figure confirmsthat the moisture isn’t retained in the straw. It is retained in the exterior plaster(see fig. 7.15).
Figure 7.15: Water density in the most humid plaster, which is in Alaska the exterior plasterand in Indonesia the interior one. The blue line shows (for comparison) the level of total waterdensity as well as the water density found in straw from fig. 7.14. It is interesting that theAlaskan exterior earth plaster in the wall assembly EdSdE has about 80 kg of water in each1 m3 while 1 m3 of dip containing straw & clay just next to it remains very dry. It absorbsonly 3kg. The dip in Indonesia behaves in a similar way. Interior earth plaster has 130 kg/m3
and the straw & clay next to it only 16 kg/m3.
Fig. 7.15 shows that in a cold humid climate, 20mm of lime plaster finish over40mm of earth plaster scratch coat is a moisture catcher (as all the lime plasterfinishes on straw bales seem to be). It appears that the moisture performanceof walls plastered with just earth is much better.
In Indonesia, all the wall assemblies have similar interior plaster water den-sity except the wall assembly LSL. This is the only wall assembly which hasa non-earthen interior finish. Its interior lime plaster absorbs about twice asmuch water.
According to fig. 7.13 in the previous subsection, the exterior earth plasterof the EdSdE wall assembly in Alaska shows high levels of relative humidity,while the mixture of straw & clay (straw bale dipped in a clay slip) just next toit has a considerably reduced amount of moisture over its thickness. This fact issupported by the results presented in fig. 7.15 above. There are 80 kg of waterin each 1 m3 of exterior earth plaster in the wall assembly EdSdE simulated inAlaska while the neighbouring dip of straw & clay remains very dry. Each 1 m3
of straw & clay mixture contains only 3 kg of moisture. A similar effect can be
137
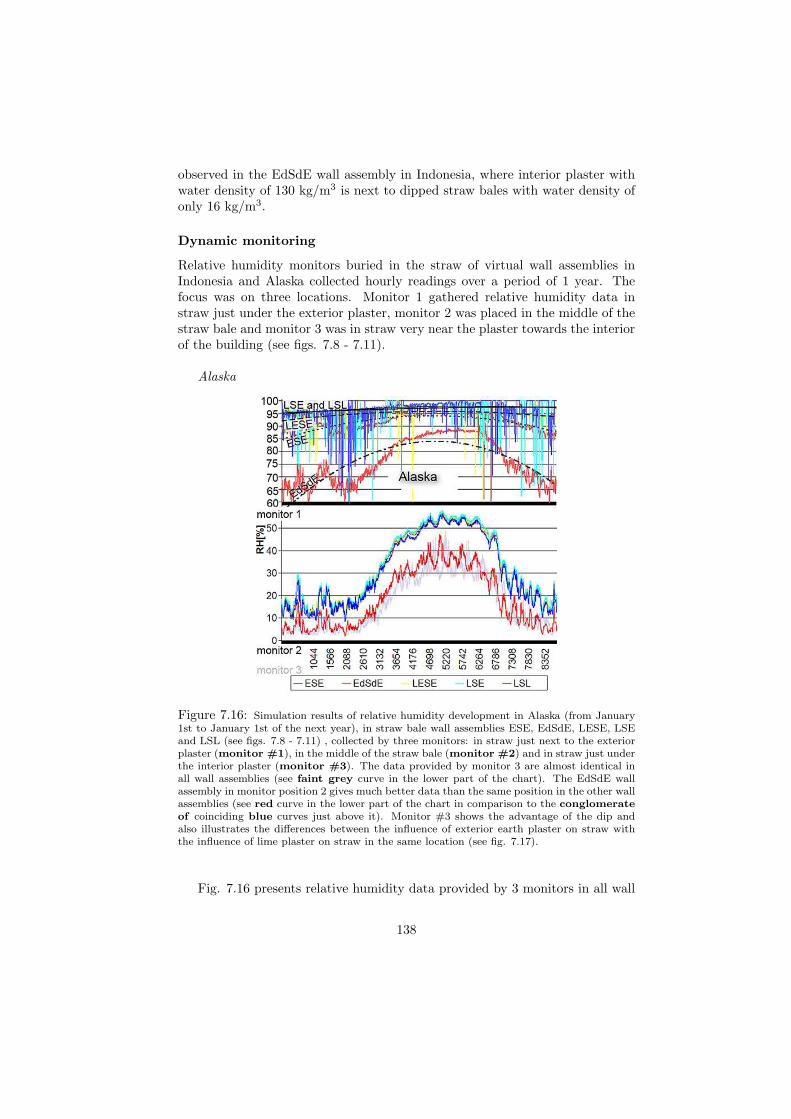
observed in the EdSdE wall assembly in Indonesia, where interior plaster withwater density of 130 kg/m3 is next to dipped straw bales with water density ofonly 16 kg/m3.
Dynamic monitoring
Relative humidity monitors buried in the straw of virtual wall assemblies inIndonesia and Alaska collected hourly readings over a period of 1 year. Thefocus was on three locations. Monitor 1 gathered relative humidity data instraw just under the exterior plaster, monitor 2 was placed in the middle of thestraw bale and monitor 3 was in straw very near the plaster towards the interiorof the building (see figs. 7.8 - 7.11).
Alaska
Figure 7.16: Simulation results of relative humidity development in Alaska (from January1st to January 1st of the next year), in straw bale wall assemblies ESE, EdSdE, LESE, LSEand LSL (see figs. 7.8 - 7.11) , collected by three monitors: in straw just next to the exteriorplaster (monitor #1), in the middle of the straw bale (monitor #2) and in straw just underthe interior plaster (monitor #3). The data provided by monitor 3 are almost identical inall wall assemblies (see faint grey curve in the lower part of the chart). The EdSdE wallassembly in monitor position 2 gives much better data than the same position in the other wallassemblies (see red curve in the lower part of the chart in comparison to the conglomerateof coinciding blue curves just above it). Monitor #3 shows the advantage of the dip andalso illustrates the differences between the influence of exterior earth plaster on straw withthe influence of lime plaster on straw in the same location (see fig. 7.17).
Fig. 7.16 presents relative humidity data provided by 3 monitors in all wall
138
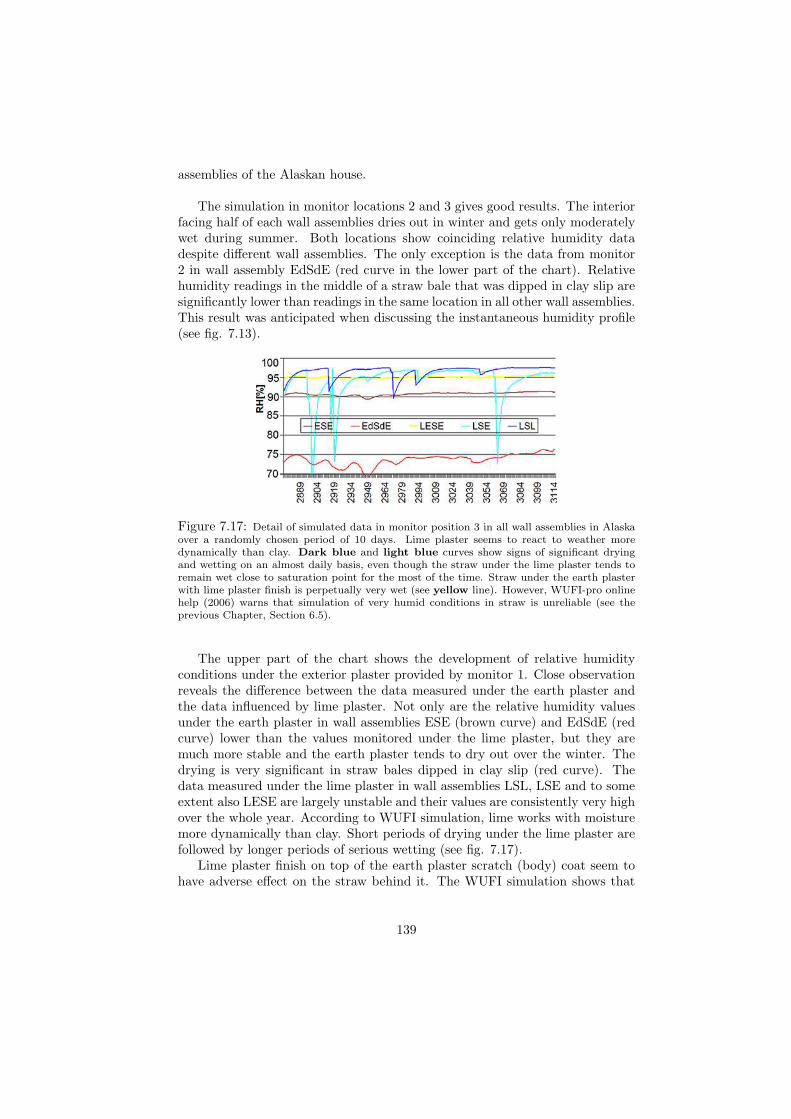
assemblies of the Alaskan house.
The simulation in monitor locations 2 and 3 gives good results. The interiorfacing half of each wall assemblies dries out in winter and gets only moderatelywet during summer. Both locations show coinciding relative humidity datadespite different wall assemblies. The only exception is the data from monitor2 in wall assembly EdSdE (red curve in the lower part of the chart). Relativehumidity readings in the middle of a straw bale that was dipped in clay slip aresignificantly lower than readings in the same location in all other wall assemblies.This result was anticipated when discussing the instantaneous humidity profile(see fig. 7.13).
Figure 7.17: Detail of simulated data in monitor position 3 in all wall assemblies in Alaskaover a randomly chosen period of 10 days. Lime plaster seems to react to weather moredynamically than clay. Dark blue and light blue curves show signs of significant dryingand wetting on an almost daily basis, even though the straw under the lime plaster tends toremain wet close to saturation point for the most of the time. Straw under the earth plasterwith lime plaster finish is perpetually very wet (see yellow line). However, WUFI-pro onlinehelp (2006) warns that simulation of very humid conditions in straw is unreliable (see theprevious Chapter, Section 6.5).
The upper part of the chart shows the development of relative humidityconditions under the exterior plaster provided by monitor 1. Close observationreveals the difference between the data measured under the earth plaster andthe data influenced by lime plaster. Not only are the relative humidity valuesunder the earth plaster in wall assemblies ESE (brown curve) and EdSdE (redcurve) lower than the values monitored under the lime plaster, but they aremuch more stable and the earth plaster tends to dry out over the winter. Thedrying is very significant in straw bales dipped in clay slip (red curve). Thedata measured under the lime plaster in wall assemblies LSL, LSE and to someextent also LESE are largely unstable and their values are consistently very highover the whole year. According to WUFI simulation, lime works with moisturemore dynamically than clay. Short periods of drying under the lime plaster arefollowed by longer periods of serious wetting (see fig. 7.17).
Lime plaster finish on top of the earth plaster scratch (body) coat seem tohave adverse effect on the straw behind it. The WUFI simulation shows that
139
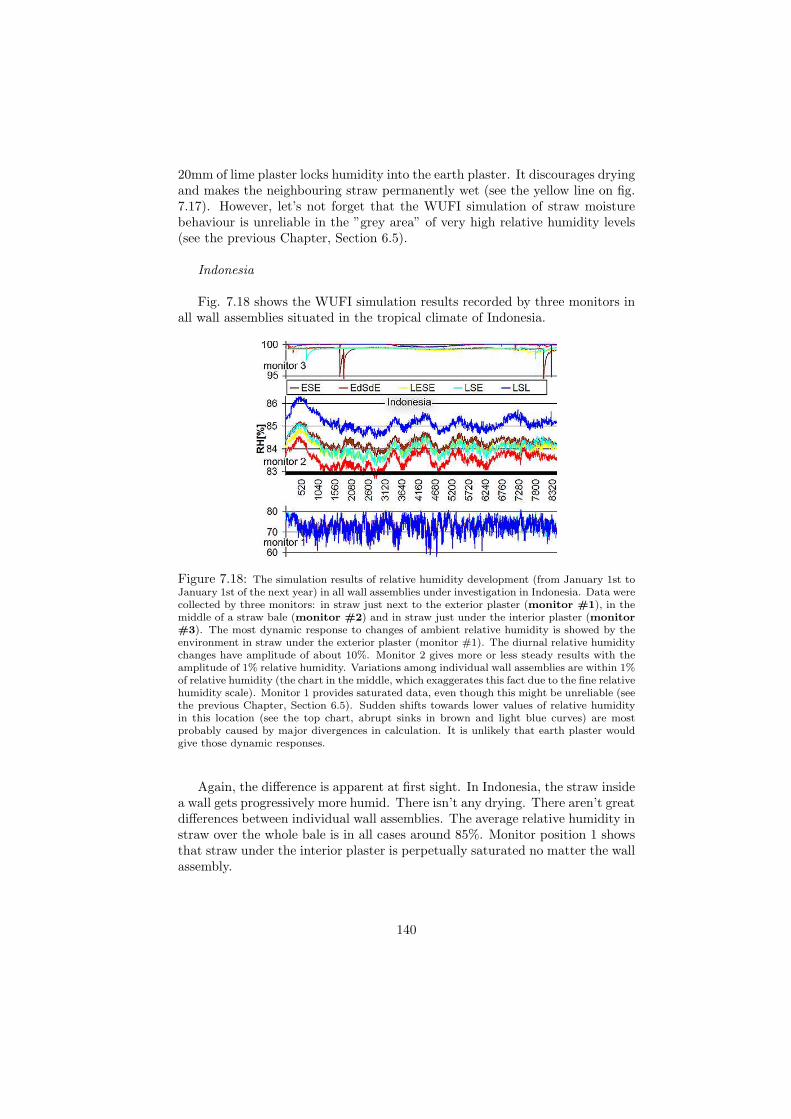
20mm of lime plaster locks humidity into the earth plaster. It discourages dryingand makes the neighbouring straw permanently wet (see the yellow line on fig.7.17). However, let’s not forget that the WUFI simulation of straw moisturebehaviour is unreliable in the ”grey area” of very high relative humidity levels(see the previous Chapter, Section 6.5).
Indonesia
Fig. 7.18 shows the WUFI simulation results recorded by three monitors inall wall assemblies situated in the tropical climate of Indonesia.
Figure 7.18: The simulation results of relative humidity development (from January 1st toJanuary 1st of the next year) in all wall assemblies under investigation in Indonesia. Data werecollected by three monitors: in straw just next to the exterior plaster (monitor #1), in themiddle of a straw bale (monitor #2) and in straw just under the interior plaster (monitor#3). The most dynamic response to changes of ambient relative humidity is showed by theenvironment in straw under the exterior plaster (monitor #1). The diurnal relative humiditychanges have amplitude of about 10%. Monitor 2 gives more or less steady results with theamplitude of 1% relative humidity. Variations among individual wall assemblies are within 1%of relative humidity (the chart in the middle, which exaggerates this fact due to the fine relativehumidity scale). Monitor 1 provides saturated data, even though this might be unreliable (seethe previous Chapter, Section 6.5). Sudden shifts towards lower values of relative humidityin this location (see the top chart, abrupt sinks in brown and light blue curves) are mostprobably caused by major divergences in calculation. It is unlikely that earth plaster wouldgive those dynamic responses.
Again, the difference is apparent at first sight. In Indonesia, the straw insidea wall gets progressively more humid. There isn’t any drying. There aren’t greatdifferences between individual wall assemblies. The average relative humidity instraw over the whole bale is in all cases around 85%. Monitor position 1 showsthat straw under the interior plaster is perpetually saturated no matter the wallassembly.
140
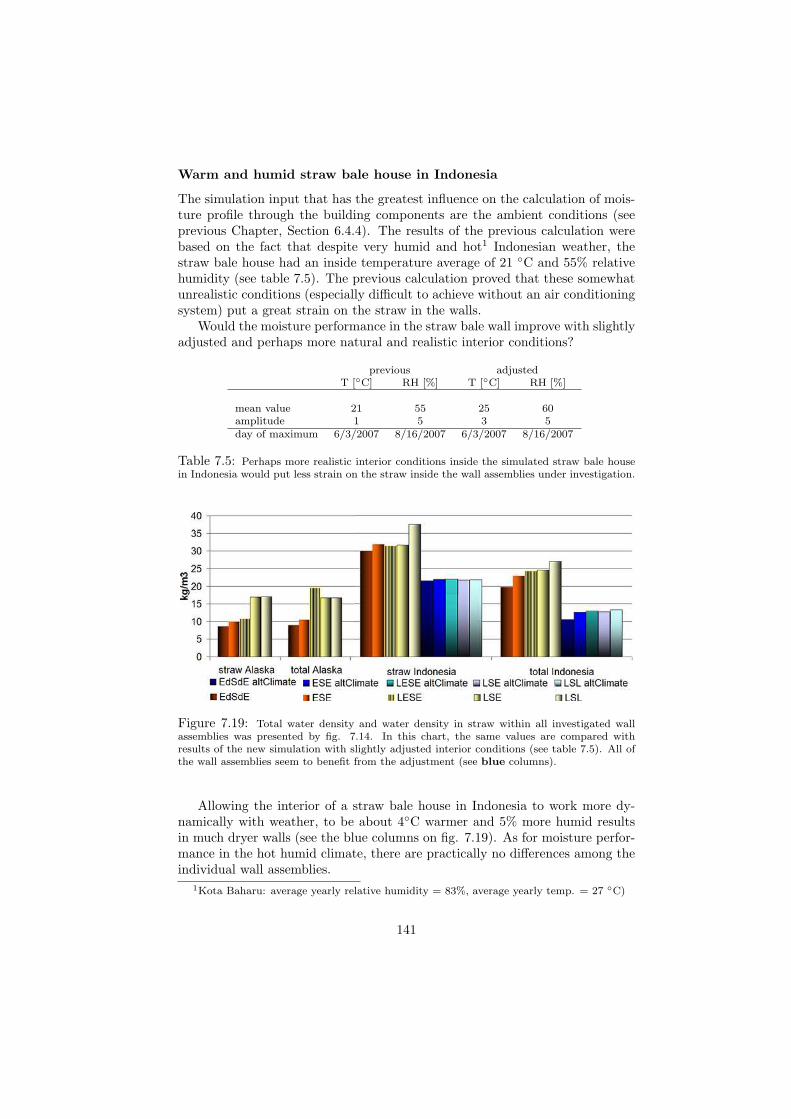
Warm and humid straw bale house in Indonesia
The simulation input that has the greatest influence on the calculation of mois-ture profile through the building components are the ambient conditions (seeprevious Chapter, Section 6.4.4). The results of the previous calculation werebased on the fact that despite very humid and hot1 Indonesian weather, thestraw bale house had an inside temperature average of 21 ◦C and 55% relativehumidity (see table 7.5). The previous calculation proved that these somewhatunrealistic conditions (especially difficult to achieve without an air conditioningsystem) put a great strain on the straw in the walls.
Would the moisture performance in the straw bale wall improve with slightlyadjusted and perhaps more natural and realistic interior conditions?
previous adjustedT [◦C] RH [%] T [◦C] RH [%]
mean value 21 55 25 60amplitude 1 5 3 5day of maximum 6/3/2007 8/16/2007 6/3/2007 8/16/2007
Table 7.5: Perhaps more realistic interior conditions inside the simulated straw bale housein Indonesia would put less strain on the straw inside the wall assemblies under investigation.
Figure 7.19: Total water density and water density in straw within all investigated wallassemblies was presented by fig. 7.14. In this chart, the same values are compared withresults of the new simulation with slightly adjusted interior conditions (see table 7.5). All ofthe wall assemblies seem to benefit from the adjustment (see blue columns).
Allowing the interior of a straw bale house in Indonesia to work more dy-namically with weather, to be about 4◦C warmer and 5% more humid resultsin much dryer walls (see the blue columns on fig. 7.19). As for moisture perfor-mance in the hot humid climate, there are practically no differences among theindividual wall assemblies.
1Kota Baharu: average yearly relative humidity = 83%, average yearly temp. = 27 ◦C)
141
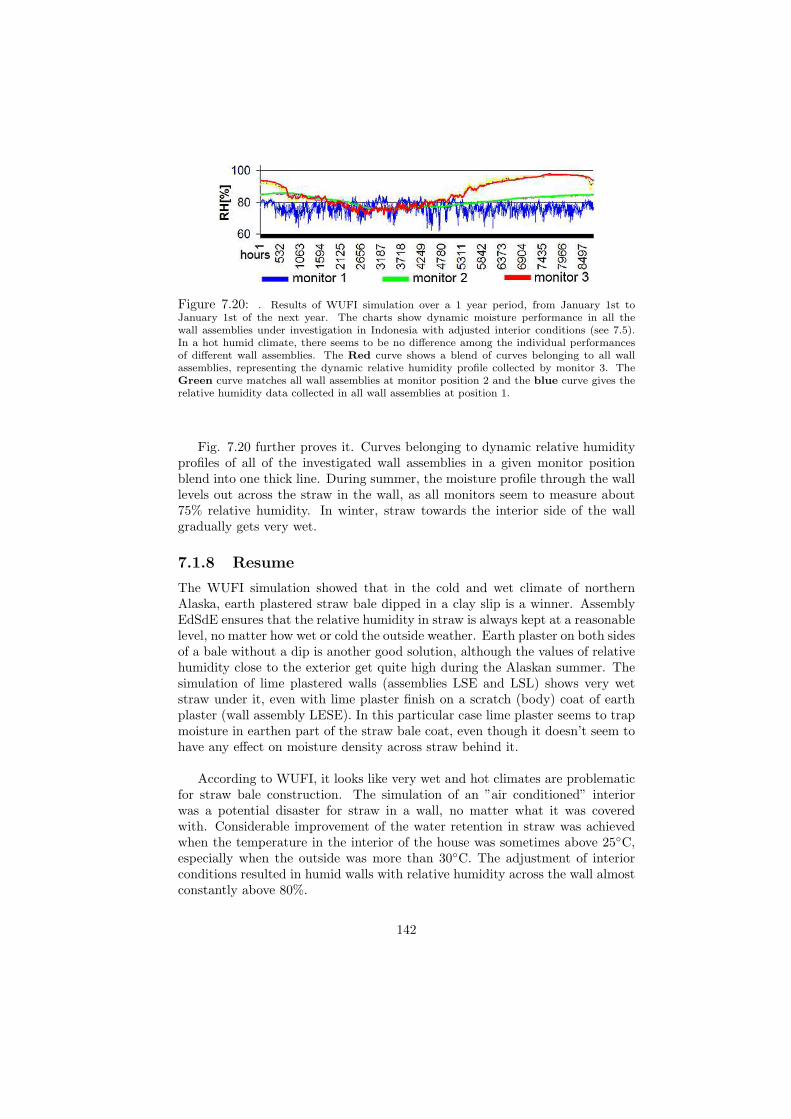
Figure 7.20: . Results of WUFI simulation over a 1 year period, from January 1st toJanuary 1st of the next year. The charts show dynamic moisture performance in all thewall assemblies under investigation in Indonesia with adjusted interior conditions (see 7.5).In a hot humid climate, there seems to be no difference among the individual performancesof different wall assemblies. The Red curve shows a blend of curves belonging to all wallassemblies, representing the dynamic relative humidity profile collected by monitor 3. TheGreen curve matches all wall assemblies at monitor position 2 and the blue curve gives therelative humidity data collected in all wall assemblies at position 1.
Fig. 7.20 further proves it. Curves belonging to dynamic relative humidityprofiles of all of the investigated wall assemblies in a given monitor positionblend into one thick line. During summer, the moisture profile through the walllevels out across the straw in the wall, as all monitors seem to measure about75% relative humidity. In winter, straw towards the interior side of the wallgradually gets very wet.
7.1.8 Resume
The WUFI simulation showed that in the cold and wet climate of northernAlaska, earth plastered straw bale dipped in a clay slip is a winner. AssemblyEdSdE ensures that the relative humidity in straw is always kept at a reasonablelevel, no matter how wet or cold the outside weather. Earth plaster on both sidesof a bale without a dip is another good solution, although the values of relativehumidity close to the exterior get quite high during the Alaskan summer. Thesimulation of lime plastered walls (assemblies LSE and LSL) shows very wetstraw under it, even with lime plaster finish on a scratch (body) coat of earthplaster (wall assembly LESE). In this particular case lime plaster seems to trapmoisture in earthen part of the straw bale coat, even though it doesn’t seem tohave any effect on moisture density across straw behind it.
According to WUFI, it looks like very wet and hot climates are problematicfor straw bale construction. The simulation of an ”air conditioned” interiorwas a potential disaster for straw in a wall, no matter what it was coveredwith. Considerable improvement of the water retention in straw was achievedwhen the temperature in the interior of the house was sometimes above 25◦C,especially when the outside was more than 30◦C. The adjustment of interiorconditions resulted in humid walls with relative humidity across the wall almostconstantly above 80%.
142
The simulation results weren’t significantly different from one wall assemblyto another. The amount of moisture in straw within a wall in hot humid weatherdoesn’t significantly depend on a particular wall assembly. According to WUFI’sresults, the theory of having a less permeable surface on the outside and a morepermeable on the interior of the house (wall assembly LESE and LSE) didn’tprove effective in a tropical climate.
7.2 Simulation of a case study in Plozevet, Brit-tany, France
Section 4.2.1 analyzed the consequences of a disastrous storm that caused alasting high humidity level (about 75%) in straw in the western wall of a strawbale house in Plozevet, Brittany, France. The research estimates drying at thevery slow rate of about 1% of relative humidity per month (see fig. 4.17). Itcould be interesting to use WUFI to simulate this case study in order to see ifit agrees with the data showing such a slow drying process. If the results of aWUFI simulation match the monitoring, WUFI can estimate how long it wouldactually take for this wall to dry out.
In order to obtain a successful simulation it is necessary to provide WUFIwith input that would match the case study in Plozevet as closely as possible.However, the following simulation serves to give a general trend, rather thanprecise values, so when considering the input data, some simplification will benecessary.
7.2.1 Choosing an appropriate wall assembly to match thewall in Plozevet
The complete wall assembly in Plozevet includes exterior timber cladding witha ventilated air gap approximately 40mm in front of a lime plastered strawbale wall. The WUFI model fails to calculate moisture transfer through an airgap (see Section 6.3.1), though it proved to be quite accurate in calculatingmoisture profiles through the simple wall assembly plaster—straw—plaster. Itis reasonable to simplify the model. Let’s assume that the ventilated air gap willsupply the lime plastered straw bale wall with relative humidity and temperaturein accordance with the weather outside. The timber claddng and ventilated airgap will be omitted from the simulation. Further simplification will be achievedby assuming that the timber cladding shields the wall assembly from the directinfluence of rain and sun. This way solar radiation and precipitation data canbe omitted from the input of exterior ambient conditions.
7.2.2 Choosing ambient conditions to match those in Plozevet
External ambient conditions
143
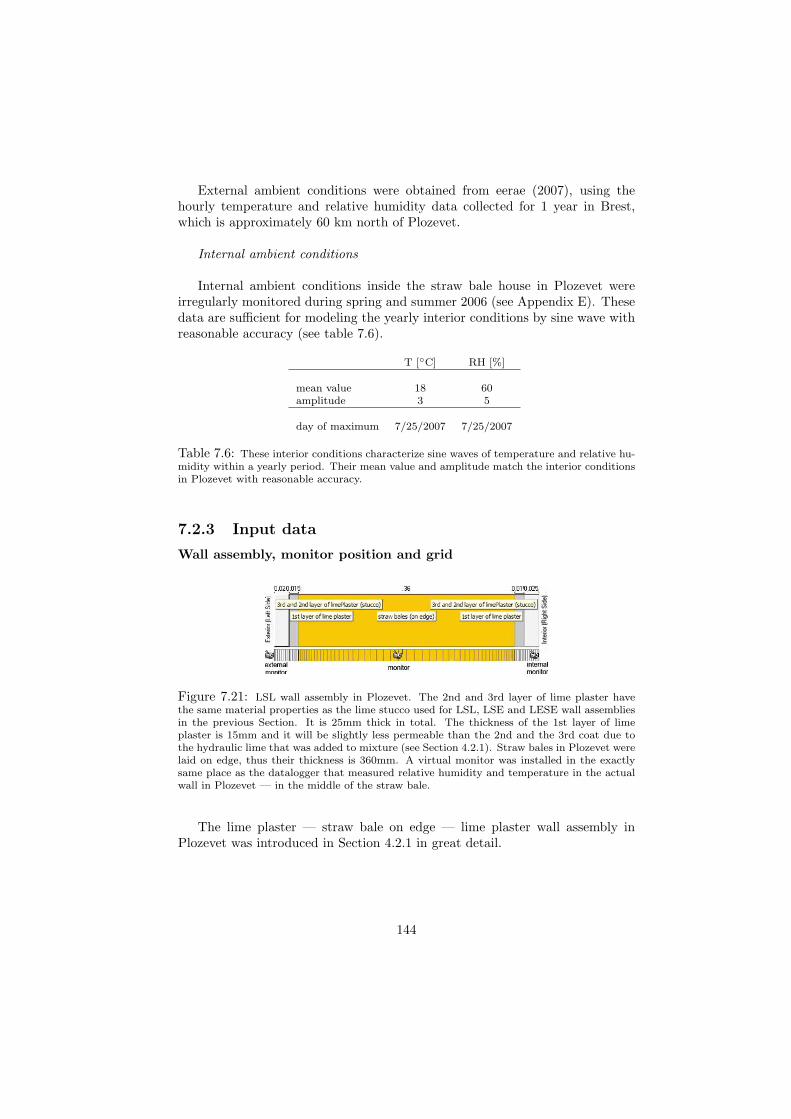
External ambient conditions were obtained from eerae (2007), using thehourly temperature and relative humidity data collected for 1 year in Brest,which is approximately 60 km north of Plozevet.
Internal ambient conditions
Internal ambient conditions inside the straw bale house in Plozevet wereirregularly monitored during spring and summer 2006 (see Appendix E). Thesedata are sufficient for modeling the yearly interior conditions by sine wave withreasonable accuracy (see table 7.6).
T [◦C] RH [%]
mean value 18 60amplitude 3 5
day of maximum 7/25/2007 7/25/2007
Table 7.6: These interior conditions characterize sine waves of temperature and relative hu-midity within a yearly period. Their mean value and amplitude match the interior conditionsin Plozevet with reasonable accuracy.
7.2.3 Input data
Wall assembly, monitor position and grid
Figure 7.21: LSL wall assembly in Plozevet. The 2nd and 3rd layer of lime plaster havethe same material properties as the lime stucco used for LSL, LSE and LESE wall assembliesin the previous Section. It is 25mm thick in total. The thickness of the 1st layer of limeplaster is 15mm and it will be slightly less permeable than the 2nd and the 3rd coat due tothe hydraulic lime that was added to mixture (see Section 4.2.1). Straw bales in Plozevet werelaid on edge, thus their thickness is 360mm. A virtual monitor was installed in the exactlysame place as the datalogger that measured relative humidity and temperature in the actualwall in Plozevet — in the middle of the straw bale.
The lime plaster — straw bale on edge — lime plaster wall assembly inPlozevet was introduced in Section 4.2.1 in great detail.
144
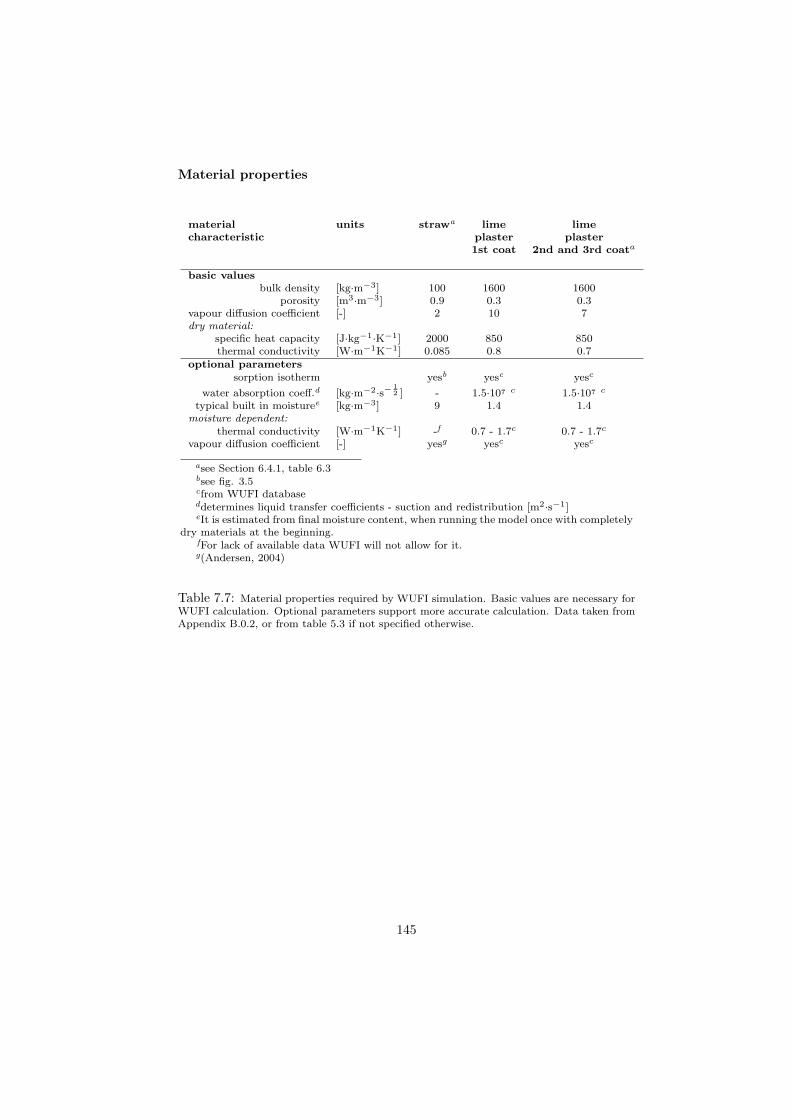
Material properties
material units strawa lime limecharacteristic plaster plaster
1st coat 2nd and 3rd coata
basic valuesbulk density [kg·m−3] 100 1600 1600
porosity [m3·m−3] 0.9 0.3 0.3vapour diffusion coefficient [-] 2 10 7dry material:
specific heat capacity [J·kg−1·K−1] 2000 850 850thermal conductivity [W·m−1K−1] 0.085 0.8 0.7
optional parameterssorption isotherm yesb yesc yesc
water absorption coeff.d [kg·m−2·s− 12 ] - 1.5·107 c 1.5·107 c
typical built in moisturee [kg·m−3] 9 1.4 1.4moisture dependent:
thermal conductivity [W·m−1K−1] -f 0.7 - 1.7c 0.7 - 1.7c
vapour diffusion coefficient [-] yesg yesc yesc
asee Section 6.4.1, table 6.3bsee fig. 3.5cfrom WUFI databaseddetermines liquid transfer coefficients - suction and redistribution [m2·s−1]eIt is estimated from final moisture content, when running the model once with completely
dry materials at the beginning.fFor lack of available data WUFI will not allow for it.g(Andersen, 2004)
Table 7.7: Material properties required by WUFI simulation. Basic values are necessary forWUFI calculation. Optional parameters support more accurate calculation. Data taken fromAppendix B.0.2, or from table 5.3 if not specified otherwise.
145
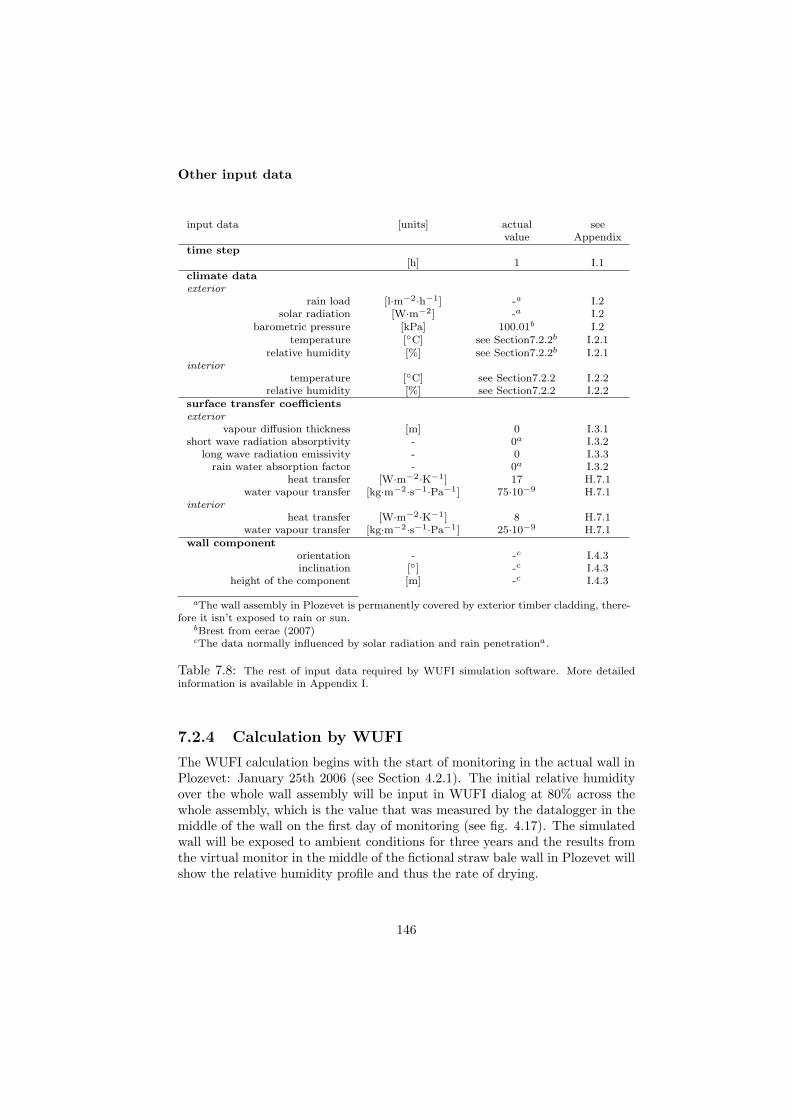
Other input data
input data [units] actual seevalue Appendix
time step[h] 1 I.1
climate dataexterior
rain load [l·m−2·h−1] -a I.2solar radiation [W·m−2] -a I.2
barometric pressure [kPa] 100.01b I.2temperature [◦C] see Section7.2.2b I.2.1
relative humidity [%] see Section7.2.2b I.2.1interior
temperature [◦C] see Section7.2.2 I.2.2relative humidity [%] see Section7.2.2 I.2.2
surface transfer coefficientsexterior
vapour diffusion thickness [m] 0 I.3.1short wave radiation absorptivity - 0a I.3.2
long wave radiation emissivity - 0 I.3.3rain water absorption factor - 0a I.3.2
heat transfer [W·m−2·K−1] 17 H.7.1water vapour transfer [kg·m−2·s−1·Pa−1] 75·10−9 H.7.1
interiorheat transfer [W·m−2·K−1] 8 H.7.1
water vapour transfer [kg·m−2·s−1·Pa−1] 25·10−9 H.7.1wall component
orientation - -c I.4.3inclination [◦] -c I.4.3
height of the component [m] -c I.4.3
aThe wall assembly in Plozevet is permanently covered by exterior timber cladding, there-fore it isn’t exposed to rain or sun.
bBrest from eerae (2007)cThe data normally influenced by solar radiation and rain penetrationa.
Table 7.8: The rest of input data required by WUFI simulation software. More detailedinformation is available in Appendix I.
7.2.4 Calculation by WUFI
The WUFI calculation begins with the start of monitoring in the actual wall inPlozevet: January 25th 2006 (see Section 4.2.1). The initial relative humidityover the whole wall assembly will be input in WUFI dialog at 80% across thewhole assembly, which is the value that was measured by the datalogger in themiddle of the wall on the first day of monitoring (see fig. 4.17). The simulatedwall will be exposed to ambient conditions for three years and the results fromthe virtual monitor in the middle of the fictional straw bale wall in Plozevet willshow the relative humidity profile and thus the rate of drying.
146
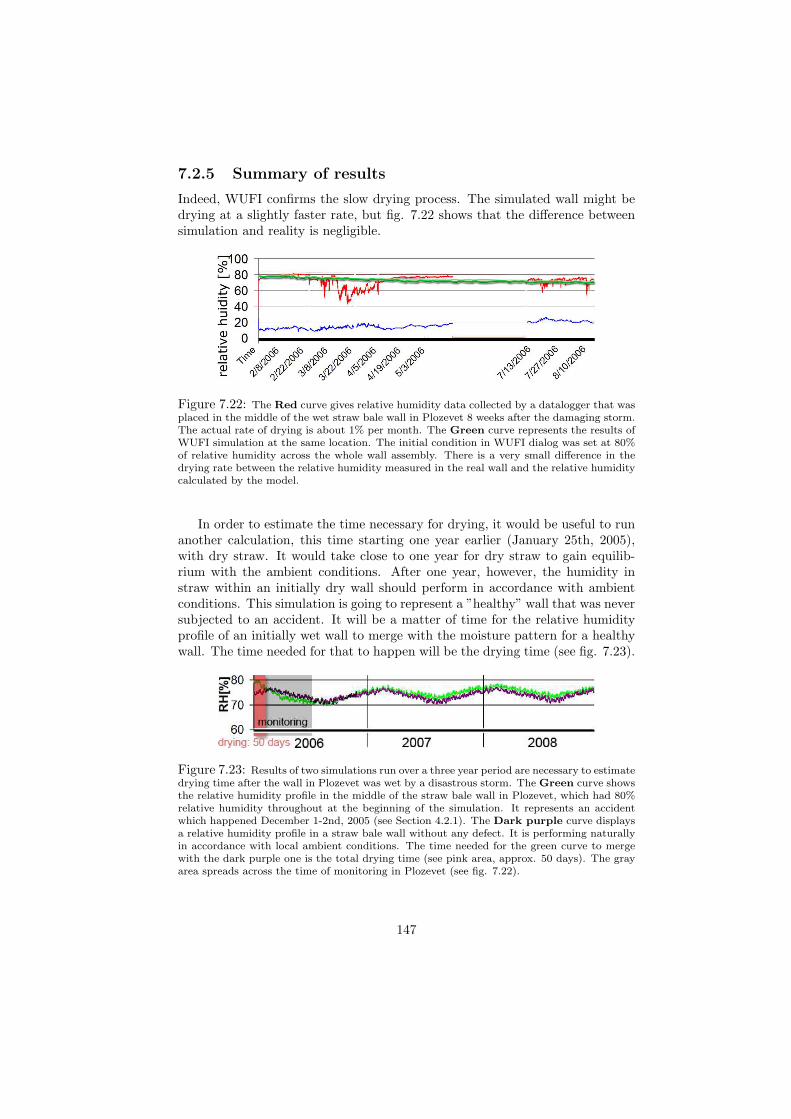
7.2.5 Summary of results
Indeed, WUFI confirms the slow drying process. The simulated wall might bedrying at a slightly faster rate, but fig. 7.22 shows that the difference betweensimulation and reality is negligible.
Figure 7.22: The Red curve gives relative humidity data collected by a datalogger that wasplaced in the middle of the wet straw bale wall in Plozevet 8 weeks after the damaging storm.The actual rate of drying is about 1% per month. The Green curve represents the results ofWUFI simulation at the same location. The initial condition in WUFI dialog was set at 80%of relative humidity across the whole wall assembly. There is a very small difference in thedrying rate between the relative humidity measured in the real wall and the relative humiditycalculated by the model.
In order to estimate the time necessary for drying, it would be useful to runanother calculation, this time starting one year earlier (January 25th, 2005),with dry straw. It would take close to one year for dry straw to gain equilib-rium with the ambient conditions. After one year, however, the humidity instraw within an initially dry wall should perform in accordance with ambientconditions. This simulation is going to represent a ”healthy” wall that was neversubjected to an accident. It will be a matter of time for the relative humidityprofile of an initially wet wall to merge with the moisture pattern for a healthywall. The time needed for that to happen will be the drying time (see fig. 7.23).
Figure 7.23: Results of two simulations run over a three year period are necessary to estimatedrying time after the wall in Plozevet was wet by a disastrous storm. The Green curve showsthe relative humidity profile in the middle of the straw bale wall in Plozevet, which had 80%relative humidity throughout at the beginning of the simulation. It represents an accidentwhich happened December 1-2nd, 2005 (see Section 4.2.1). The Dark purple curve displaysa relative humidity profile in a straw bale wall without any defect. It is performing naturallyin accordance with local ambient conditions. The time needed for the green curve to mergewith the dark purple one is the total drying time (see pink area, approx. 50 days). The grayarea spreads across the time of monitoring in Plozevet (see fig. 7.22).
147
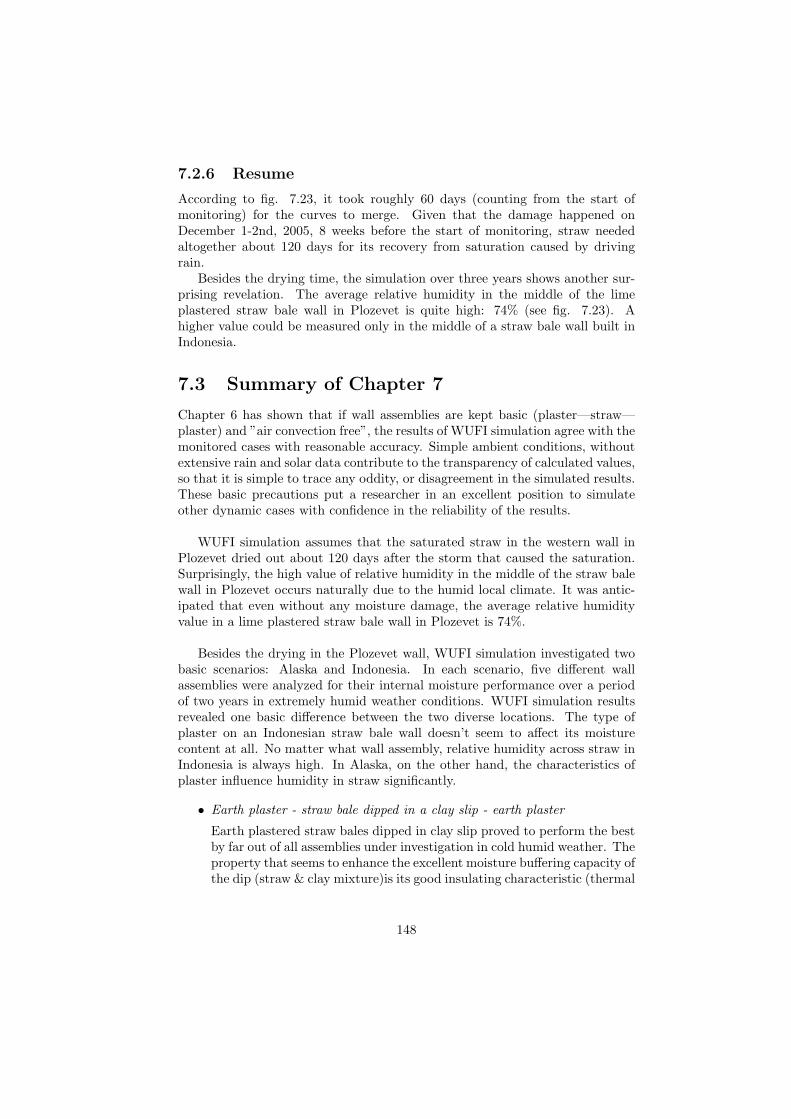
7.2.6 Resume
According to fig. 7.23, it took roughly 60 days (counting from the start ofmonitoring) for the curves to merge. Given that the damage happened onDecember 1-2nd, 2005, 8 weeks before the start of monitoring, straw neededaltogether about 120 days for its recovery from saturation caused by drivingrain.
Besides the drying time, the simulation over three years shows another sur-prising revelation. The average relative humidity in the middle of the limeplastered straw bale wall in Plozevet is quite high: 74% (see fig. 7.23). Ahigher value could be measured only in the middle of a straw bale wall built inIndonesia.
7.3 Summary of Chapter 7
Chapter 6 has shown that if wall assemblies are kept basic (plaster—straw—plaster) and ”air convection free”, the results of WUFI simulation agree with themonitored cases with reasonable accuracy. Simple ambient conditions, withoutextensive rain and solar data contribute to the transparency of calculated values,so that it is simple to trace any oddity, or disagreement in the simulated results.These basic precautions put a researcher in an excellent position to simulateother dynamic cases with confidence in the reliability of the results.
WUFI simulation assumes that the saturated straw in the western wall inPlozevet dried out about 120 days after the storm that caused the saturation.Surprisingly, the high value of relative humidity in the middle of the straw balewall in Plozevet occurs naturally due to the humid local climate. It was antic-ipated that even without any moisture damage, the average relative humidityvalue in a lime plastered straw bale wall in Plozevet is 74%.
Besides the drying in the Plozevet wall, WUFI simulation investigated twobasic scenarios: Alaska and Indonesia. In each scenario, five different wallassemblies were analyzed for their internal moisture performance over a periodof two years in extremely humid weather conditions. WUFI simulation resultsrevealed one basic difference between the two diverse locations. The type ofplaster on an Indonesian straw bale wall doesn’t seem to affect its moisturecontent at all. No matter what wall assembly, relative humidity across straw inIndonesia is always high. In Alaska, on the other hand, the characteristics ofplaster influence humidity in straw significantly.
• Earth plaster - straw bale dipped in a clay slip - earth plaster
Earth plastered straw bales dipped in clay slip proved to perform the bestby far out of all assemblies under investigation in cold humid weather. Theproperty that seems to enhance the excellent moisture buffering capacity ofthe dip (straw & clay mixture)is its good insulating characteristic (thermal
148
conductivity). That might explain why it works so well in Alaska wherethere is a large temperature gradient through the wall, while it doesn’taffect the humidity profile in a wall in Indonesia, where the temperatureof the outside air is similar to that inside a house.
• Earth plaster — straw bale — earth plaster
WUFI confirmed that this classic straw bale assembly, well-tested in build-ings standing for more than 100 years in Nebraska, performs reasonablywell in Alaska, despite the fact that relative humidity values in the wettestpart of the straw (next to the exterior plaster) sometimes reached as muchas 95% during summer months.
• Lime plaster finish - scratch (body) coat of earth plaster — straw bale —earth plaster
Even though quite common in cold and humid North America, in thecold and humid climate of Alaska this wall assembly acted as a moisturecatcher. According to WUFI results in Alaska, lime plaster finish seem toprevent earth plaster from drying and moisture tends to get trapped withinthe exterior scratch earth plaster. However, in this case the moisture levelacross the Alaskan straw bale wall seems to be reasonably good, except,again, for the very high humidity levels appearing in the most stressedpart of the wall, just under the exterior plaster.
• Lime plaster — straw bale — earth plaster, lime plaster — straw bale —lime plaster
Out of all the examined wall assemblies, lime plastered bales delivered theworst moisture performance. Straw in an Alaskan wall is often saturatedunder the exterior lime plaster, regardless of whether there is earth plasteror lime plaster on the interior of the wall. In the middle of the wall,there is no difference between the humidity level in straw plastered withlime, and humidity levels in the straw of the other wall assemblies underinvestigation.
WUFI doesn’t provide confirmation of the theory describing the benefitof having more permeable plaster on the interior side and less permeableplaster on the exterior side of straw in a hot and humid climate. Thesimulation of moisture in straw plastered with lime on the outside andearth on the inside of a house in Indonesia shows the same results assimulation across any other investigated wall assembly exposed to thesame conditions.
In order to gain more confidence in simulating wall assemblies containinglime plaster, the WUFI computer model should have been benchmarkedusing a case study with lime plastered straw bale walls.
Dynamic relative humidity profiles as results of WUFI simulation throughall of the investigated wall assemblies suggest that there is no problem with
149
building straw bale houses in northern Alaska, while it seems questionable tobuild them in Indonesia. The average relative humidity through straw bales inIndonesian walls, despite different wall assemblies, is about 85% and the strawjust behind the interior plaster of all wall assemblies was saturated most of thetime. When analyzing WUFI results displaying straw saturation one has to becareful not to draw any definite conclusions. WUFI isn’t reliable in simulatingvery high relative humidity in straw. As regards straw bale building potentialin equatorial regions, further research needs to be done to establish if straw baleconstruction is appropriate for these hot and humid climates.
150
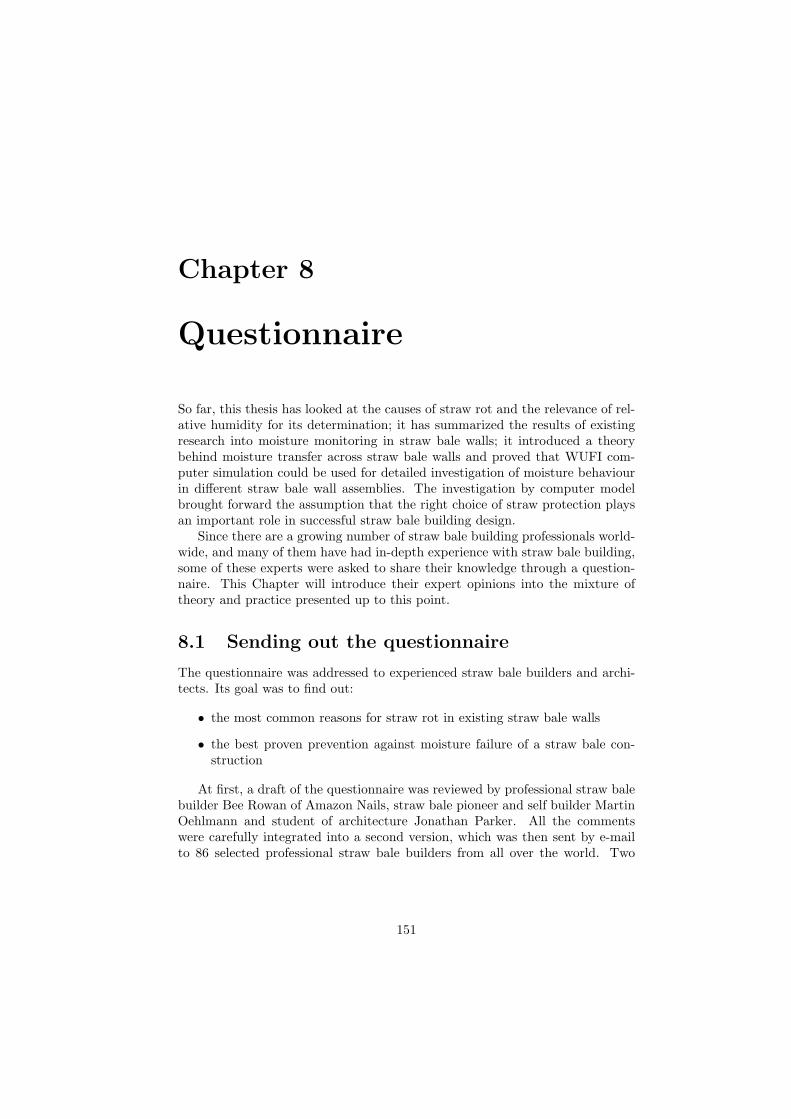
Chapter 8
Questionnaire
So far, this thesis has looked at the causes of straw rot and the relevance of rel-ative humidity for its determination; it has summarized the results of existingresearch into moisture monitoring in straw bale walls; it introduced a theorybehind moisture transfer across straw bale walls and proved that WUFI com-puter simulation could be used for detailed investigation of moisture behaviourin different straw bale wall assemblies. The investigation by computer modelbrought forward the assumption that the right choice of straw protection playsan important role in successful straw bale building design.
Since there are a growing number of straw bale building professionals world-wide, and many of them have had in-depth experience with straw bale building,some of these experts were asked to share their knowledge through a question-naire. This Chapter will introduce their expert opinions into the mixture oftheory and practice presented up to this point.
8.1 Sending out the questionnaire
The questionnaire was addressed to experienced straw bale builders and archi-tects. Its goal was to find out:
• the most common reasons for straw rot in existing straw bale walls
• the best proven prevention against moisture failure of a straw bale con-struction
At first, a draft of the questionnaire was reviewed by professional straw balebuilder Bee Rowan of Amazon Nails, straw bale pioneer and self builder MartinOehlmann and student of architecture Jonathan Parker. All the commentswere carefully integrated into a second version, which was then sent by e-mailto 86 selected professional straw bale builders from all over the world. Two
151
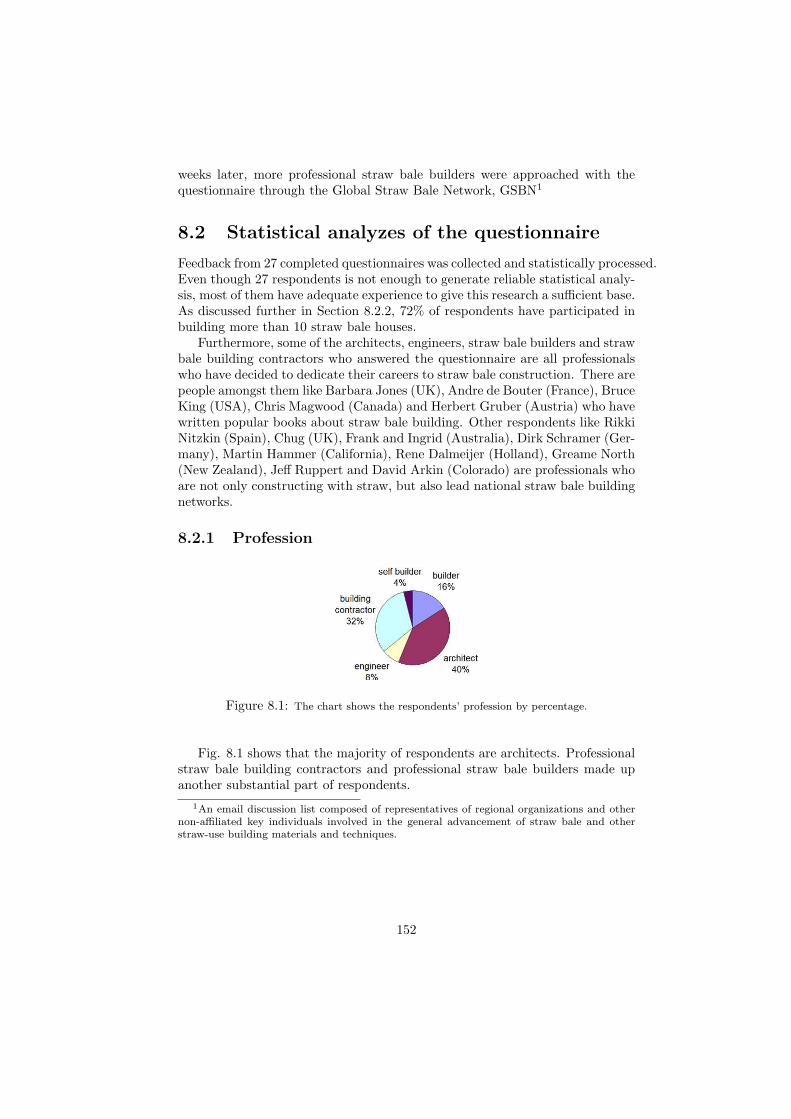
weeks later, more professional straw bale builders were approached with thequestionnaire through the Global Straw Bale Network, GSBN1
8.2 Statistical analyzes of the questionnaire
Feedback from 27 completed questionnaires was collected and statistically processed.Even though 27 respondents is not enough to generate reliable statistical analy-sis, most of them have adequate experience to give this research a sufficient base.As discussed further in Section 8.2.2, 72% of respondents have participated inbuilding more than 10 straw bale houses.
Furthermore, some of the architects, engineers, straw bale builders and strawbale building contractors who answered the questionnaire are all professionalswho have decided to dedicate their careers to straw bale construction. There arepeople amongst them like Barbara Jones (UK), Andre de Bouter (France), BruceKing (USA), Chris Magwood (Canada) and Herbert Gruber (Austria) who havewritten popular books about straw bale building. Other respondents like RikkiNitzkin (Spain), Chug (UK), Frank and Ingrid (Australia), Dirk Schramer (Ger-many), Martin Hammer (California), Rene Dalmeijer (Holland), Greame North(New Zealand), Jeff Ruppert and David Arkin (Colorado) are professionals whoare not only constructing with straw, but also lead national straw bale buildingnetworks.
8.2.1 Profession
Figure 8.1: The chart shows the respondents’ profession by percentage.
Fig. 8.1 shows that the majority of respondents are architects. Professionalstraw bale building contractors and professional straw bale builders made upanother substantial part of respondents.
1An email discussion list composed of representatives of regional organizations and othernon-affiliated key individuals involved in the general advancement of straw bale and otherstraw-use building materials and techniques.
152
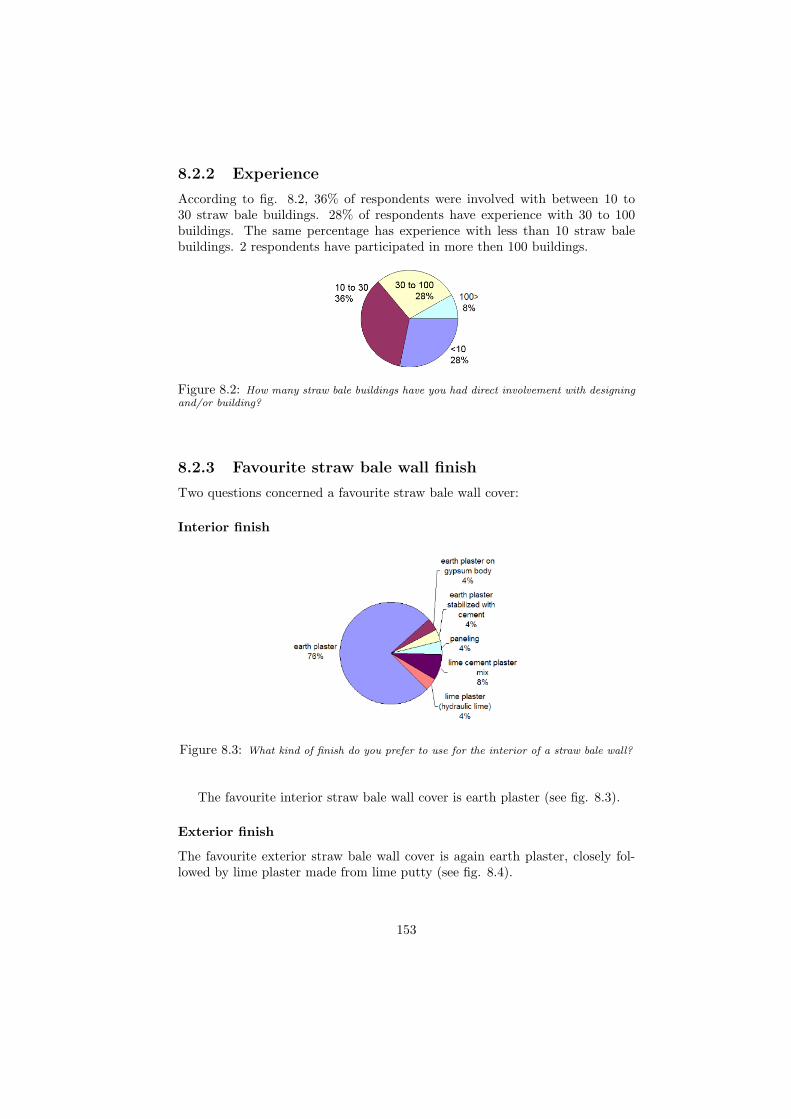
8.2.2 Experience
According to fig. 8.2, 36% of respondents were involved with between 10 to30 straw bale buildings. 28% of respondents have experience with 30 to 100buildings. The same percentage has experience with less than 10 straw balebuildings. 2 respondents have participated in more then 100 buildings.
Figure 8.2: How many straw bale buildings have you had direct involvement with designingand/or building?
8.2.3 Favourite straw bale wall finish
Two questions concerned a favourite straw bale wall cover:
Interior finish
Figure 8.3: What kind of finish do you prefer to use for the interior of a straw bale wall?
The favourite interior straw bale wall cover is earth plaster (see fig. 8.3).
Exterior finish
The favourite exterior straw bale wall cover is again earth plaster, closely fol-lowed by lime plaster made from lime putty (see fig. 8.4).
153
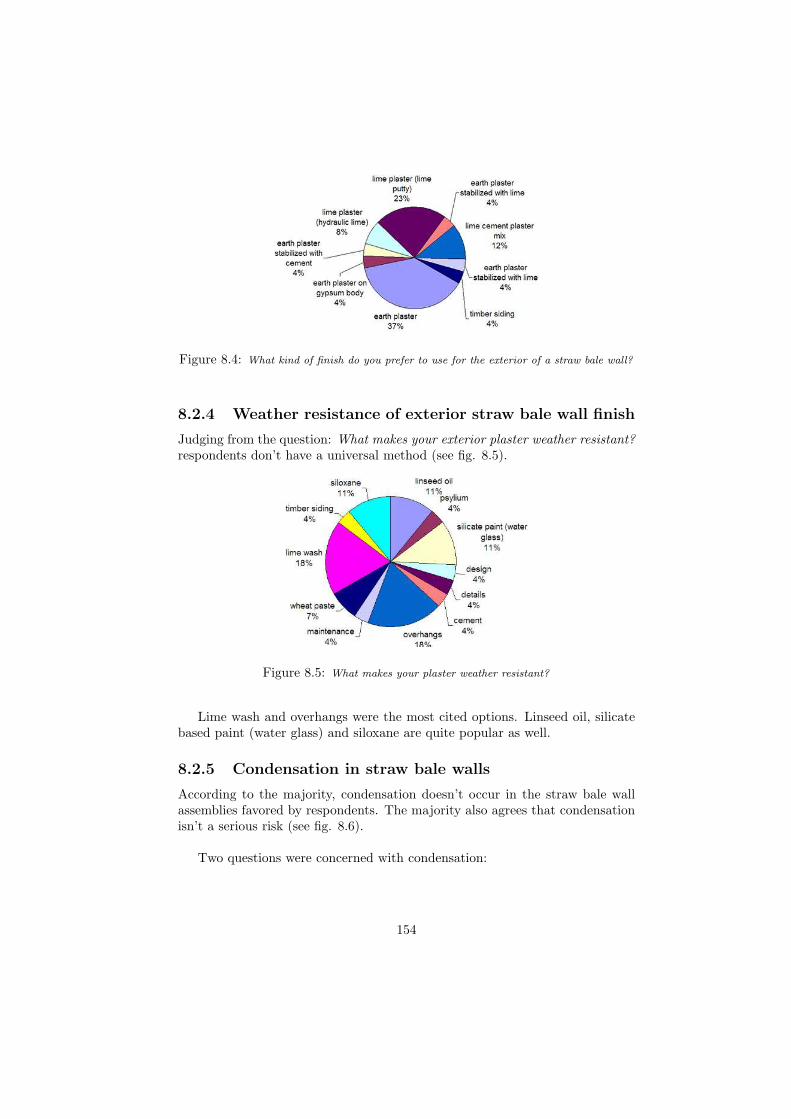
Figure 8.4: What kind of finish do you prefer to use for the exterior of a straw bale wall?
8.2.4 Weather resistance of exterior straw bale wall finish
Judging from the question: What makes your exterior plaster weather resistant?respondents don’t have a universal method (see fig. 8.5).
Figure 8.5: What makes your plaster weather resistant?
Lime wash and overhangs were the most cited options. Linseed oil, silicatebased paint (water glass) and siloxane are quite popular as well.
8.2.5 Condensation in straw bale walls
According to the majority, condensation doesn’t occur in the straw bale wallassemblies favored by respondents. The majority also agrees that condensationisn’t a serious risk (see fig. 8.6).
Two questions were concerned with condensation:
154
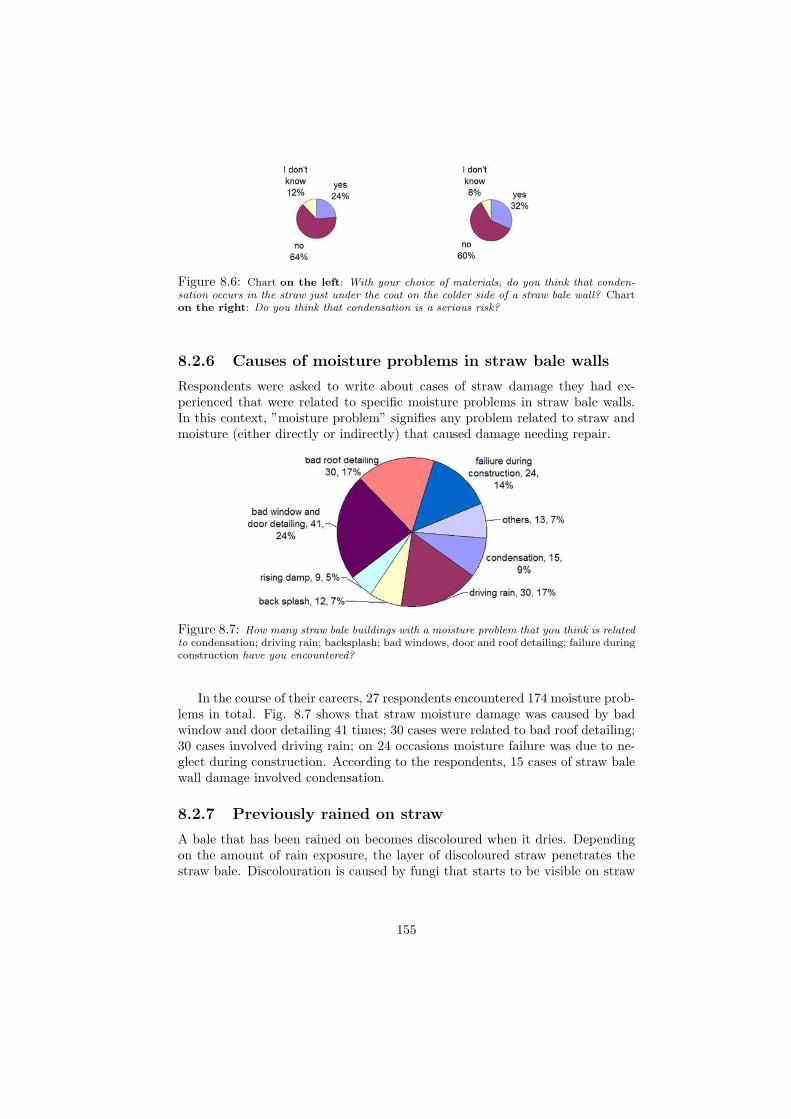
Figure 8.6: Chart on the left: With your choice of materials, do you think that conden-sation occurs in the straw just under the coat on the colder side of a straw bale wall? Charton the right: Do you think that condensation is a serious risk?
8.2.6 Causes of moisture problems in straw bale walls
Respondents were asked to write about cases of straw damage they had ex-perienced that were related to specific moisture problems in straw bale walls.In this context, ”moisture problem” signifies any problem related to straw andmoisture (either directly or indirectly) that caused damage needing repair.
Figure 8.7: How many straw bale buildings with a moisture problem that you think is relatedto condensation; driving rain; backsplash; bad windows, door and roof detailing; failure duringconstruction have you encountered?
In the course of their careers, 27 respondents encountered 174 moisture prob-lems in total. Fig. 8.7 shows that straw moisture damage was caused by badwindow and door detailing 41 times; 30 cases were related to bad roof detailing;30 cases involved driving rain; on 24 occasions moisture failure was due to ne-glect during construction. According to the respondents, 15 cases of straw balewall damage involved condensation.
8.2.7 Previously rained on straw
A bale that has been rained on becomes discoloured when it dries. Dependingon the amount of rain exposure, the layer of discoloured straw penetrates thestraw bale. Discolouration is caused by fungi that starts to be visible on straw
155
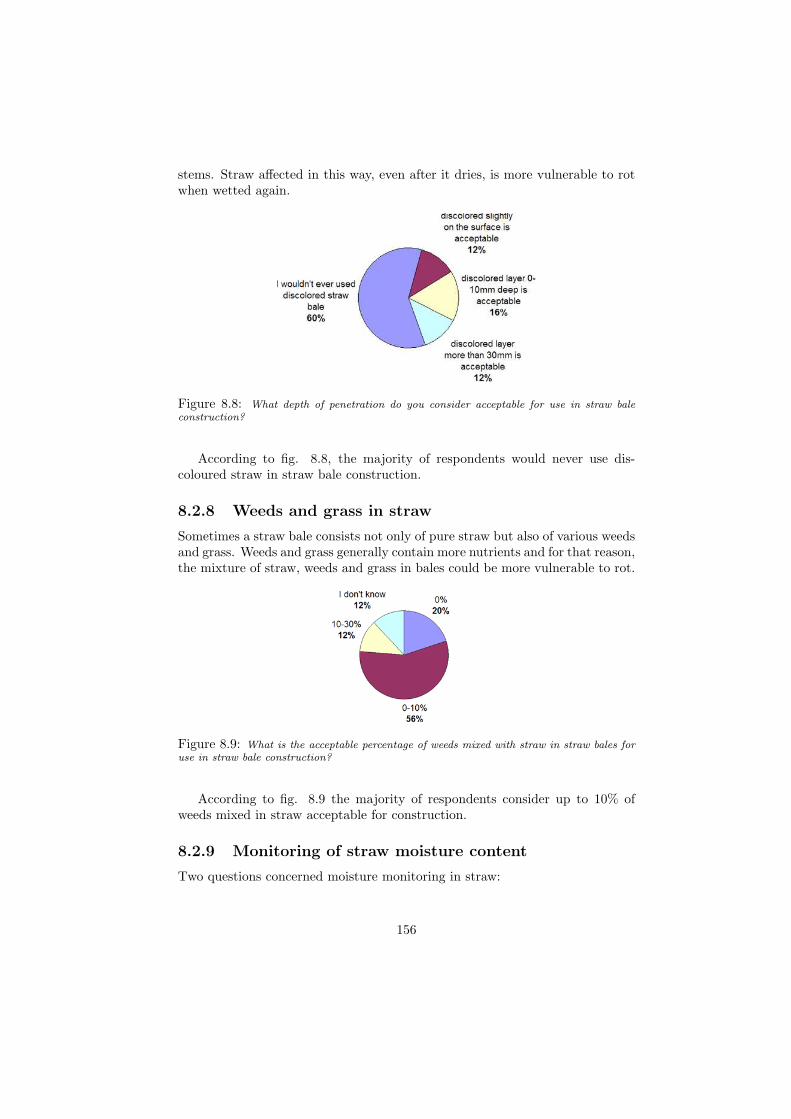
stems. Straw affected in this way, even after it dries, is more vulnerable to rotwhen wetted again.
Figure 8.8: What depth of penetration do you consider acceptable for use in straw baleconstruction?
According to fig. 8.8, the majority of respondents would never use dis-coloured straw in straw bale construction.
8.2.8 Weeds and grass in straw
Sometimes a straw bale consists not only of pure straw but also of various weedsand grass. Weeds and grass generally contain more nutrients and for that reason,the mixture of straw, weeds and grass in bales could be more vulnerable to rot.
Figure 8.9: What is the acceptable percentage of weeds mixed with straw in straw bales foruse in straw bale construction?
According to fig. 8.9 the majority of respondents consider up to 10% ofweeds mixed in straw acceptable for construction.
8.2.9 Monitoring of straw moisture content
Two questions concerned moisture monitoring in straw:
156
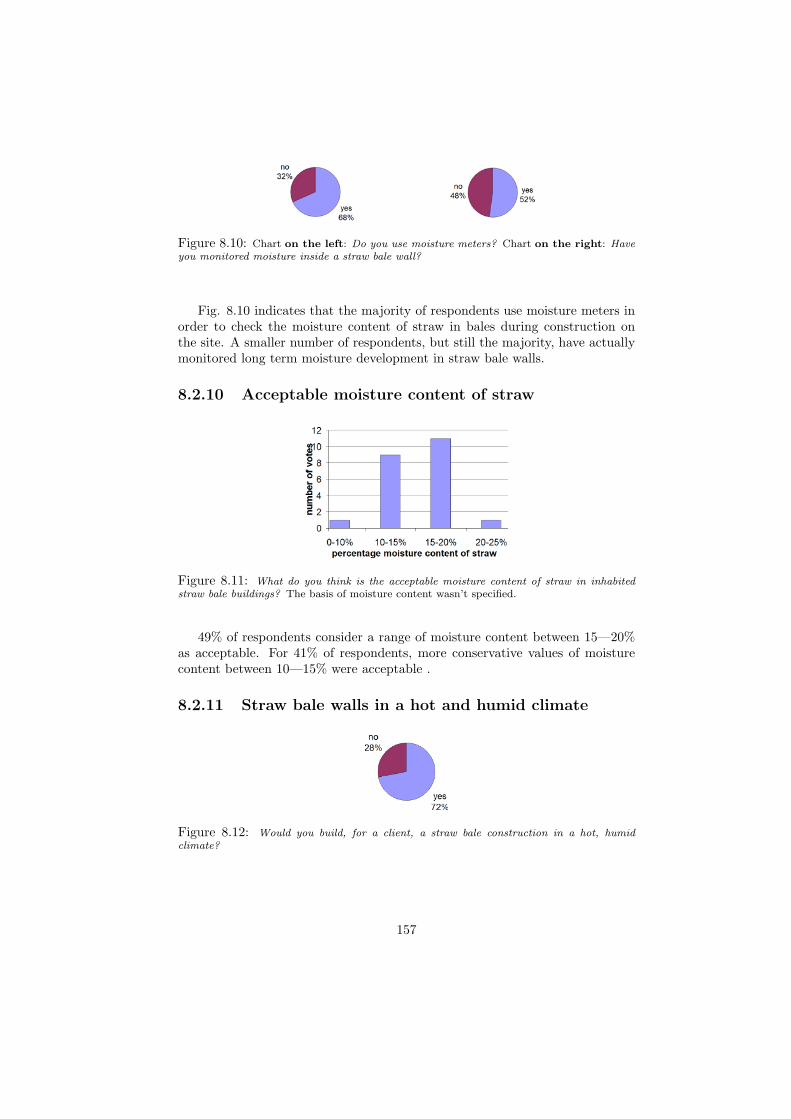
Figure 8.10: Chart on the left: Do you use moisture meters? Chart on the right: Haveyou monitored moisture inside a straw bale wall?
Fig. 8.10 indicates that the majority of respondents use moisture meters inorder to check the moisture content of straw in bales during construction onthe site. A smaller number of respondents, but still the majority, have actuallymonitored long term moisture development in straw bale walls.
8.2.10 Acceptable moisture content of straw
Figure 8.11: What do you think is the acceptable moisture content of straw in inhabitedstraw bale buildings? The basis of moisture content wasn’t specified.
49% of respondents consider a range of moisture content between 15—20%as acceptable. For 41% of respondents, more conservative values of moisturecontent between 10—15% were acceptable .
8.2.11 Straw bale walls in a hot and humid climate
Figure 8.12: Would you build, for a client, a straw bale construction in a hot, humidclimate?
157
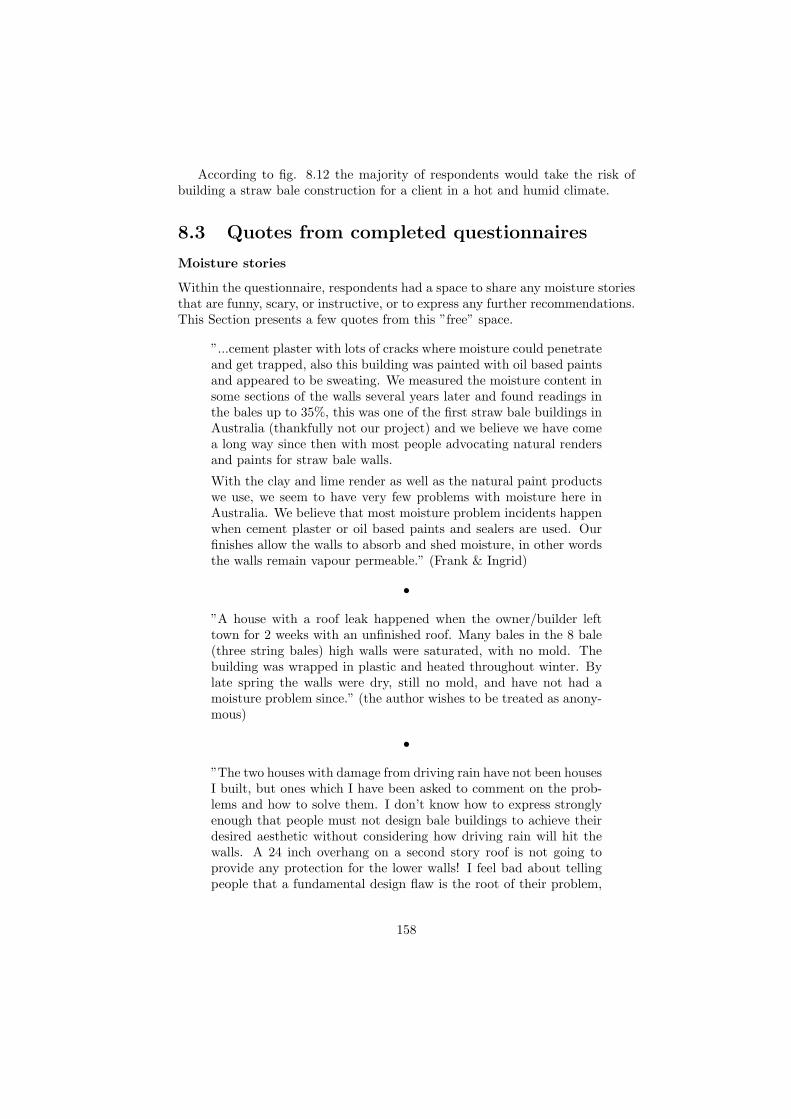
According to fig. 8.12 the majority of respondents would take the risk ofbuilding a straw bale construction for a client in a hot and humid climate.
8.3 Quotes from completed questionnaires
Moisture stories
Within the questionnaire, respondents had a space to share any moisture storiesthat are funny, scary, or instructive, or to express any further recommendations.This Section presents a few quotes from this ”free” space.
”...cement plaster with lots of cracks where moisture could penetrateand get trapped, also this building was painted with oil based paintsand appeared to be sweating. We measured the moisture content insome sections of the walls several years later and found readings inthe bales up to 35%, this was one of the first straw bale buildings inAustralia (thankfully not our project) and we believe we have comea long way since then with most people advocating natural rendersand paints for straw bale walls.
With the clay and lime render as well as the natural paint productswe use, we seem to have very few problems with moisture here inAustralia. We believe that most moisture problem incidents happenwhen cement plaster or oil based paints and sealers are used. Ourfinishes allow the walls to absorb and shed moisture, in other wordsthe walls remain vapour permeable.” (Frank & Ingrid)
•
”A house with a roof leak happened when the owner/builder lefttown for 2 weeks with an unfinished roof. Many bales in the 8 bale(three string bales) high walls were saturated, with no mold. Thebuilding was wrapped in plastic and heated throughout winter. Bylate spring the walls were dry, still no mold, and have not had amoisture problem since.” (the author wishes to be treated as anony-mous)
•
”The two houses with damage from driving rain have not been housesI built, but ones which I have been asked to comment on the prob-lems and how to solve them. I don’t know how to express stronglyenough that people must not design bale buildings to achieve theirdesired aesthetic without considering how driving rain will hit thewalls. A 24 inch overhang on a second story roof is not going toprovide any protection for the lower walls! I feel bad about tellingpeople that a fundamental design flaw is the root of their problem,
158
but it’s true. If a client truly desires a particular appearance, thenthe bale walls should have a rain screen of some kind (wood sidingI think is best) with an air gap of at least 1.5 inches to allow for airmovement between the bale wall and the rain screen.
We often see patterns of moisture accumulation behind the exteriorplaster on houses we have built. At first these scared the heck outof me! But having spent some time opening up walls in these placesand testing and observing the straw, I don’t feel that it is a problem.These spots occur where the straw in the wall is not as well packed,ie, where air is more free to circulate. Any moisture in this movingair condenses on the back of the plaster and soaks through as itdries out of the plaster. We most commonly see these spots when astreak of cold weather is followed by a day of much warmer temper-atures. I speculate that on the continuously cold days, this moistureis transpiring into the very dry air very quickly, so doesn’t accumu-late in the plaster. A bit of warmer, damper weather will slow thisdrying and the moisture hangs out in the plaster a bit longer. Themoisture meter inserted into this damp spot does not give worryingfigures (usually under 15%), but the figures are higher than in thedry-appearing sections of wall. I haven’t found any discoloured ordeteriorated straw in these places, but don’t know what another 50years of cycling will do.
Most of this moisture is entering the wall from gaps in the interiorplastering. Especially important is sealing up electrical boxes andthe plaster seam with the ceiling and/or top plate. And making surethat the bales do not have voids or unstuffed areas stops moisturefrom accumulating in concentrated areas.” (Chris Magwood)
•”As for moisture stories, I have more than I have time to describe- come to Canada and buy my new book, ”Design of Straw BaleBuildings”” (Bruce King)
•”In 1998? when visiting the oldest straw bale building I know inCalifornia (built 1982) by Jon Hammond, which had the bales juststacked on a slab on grade, we were able to stick a bale moisture me-ter into the walls at their base, where we found.... air! Apparently,the bales had rotted away where they met the concrete, and thewalls were being held up by the cement stucco skins.” (Bob Theis)
•”...also am concerned about snow accumulation next to bale wallswhere the snow melt takes place over an extended period, say over30 days, that would keep the walls wet.” (John Swearingen)
159
•
”Parapet roofs etc. are so high risk they should be banned.” (GreameNorth)
Regarding the question: Would you build a straw bale house in a hotand humid climate?
”Doesn’t everyone? Think of your bathrooms and kitchens. Whatis important is to balance wetting potential with drying potential.In high humidity areas, this means the wetting potential should bezero. Maybe cladding could do this.” (Chris Newton)
•
”This is a YES, with a big MAYBE attached to it. I would evaluatethe entire scope of the project and determine if it would work. Iwouldn’t generally recommend it, but it could be done.” (Jeff Rup-pert)
•
”In a hot climate yes. It’s humidity that I think is the problem. Ithink that you could build a straw bale sauna for instance and havea humid atmosphere inside, because it would pass to the outside aslong as you have breathable plasters, but if you had humidity insideand outside the building, because of the climate, I think it would berisky. I can’t say definitely whether it would work or not, becauseI’ve never tried it. I think it might be risky.” (from an interviewwith Barbara Jones, see Appendix A.1)
•
”The experience is already there. The local people do build theirhouses with natural fibre. The truth is that the layer of fibre theyuse is less than 35cm thick straw bale, so they get more airation.They might also use other fibre than straw. They use fibre comingfrom that area, so I think it has to have its own natural protection.Maybe we should make the bales from that local fibre.
Yes. For sure I would take that job. I would take that risk.” (frominterview with Tom Rijven, see Appendix A.2)
8.4 Summary of results
At the end of this thesis, the summary of statistical data obtained by the ques-tionnaire will serve as a tool for final recapitulation.
160
Earth plaster seems to be the favourite wall cover for both sides of strawbale walls. Lime plaster made out of lime putty is the second most popularexterior cover.
Exterior straw bale walls are most frequently protected by large overhangsand lime wash wall finish.
There seems to be a general consensus that previously rained on straw isnot acceptable in straw bale construction, while a small percentage of weed andgrass content in straw bales doesn’t matter.
The majority of respondents use portable moisture meters to measure theimmediate moisture content of straw. The acceptable level of moisture contentseems to be 20-25%.
The subject of building with straw bales in a hot and humid climate provokescontroversial responses . With the exception of Chris Newton, respondents lackexperience. However, the majority believes that it could be done and would takethe risk of building a straw bale house for a client in those specific conditions.
The most important conclusion the questionnaire provided is that moisturetransfer caused by a difference between inside and outside vapor pressure, orinside and outside relative humidity and temperature isn’t a threat to a strawrot inside a straw bale wall (no matter what plaster or cladding is used). Thequestionnaire supports the analyzes of the case studies from Chapter 4 in thatthe reason for straw rot in a straw bale wall is usually a concentrated leak ofliquid water into a wall caused by:
bad design, lack of attention to detailing, or driving rain.
161
Chapter 9
Conclusion
While interest in environmentally appropriate building is increasing, and withthe likelihood of environmental impact methods being imposed through legisla-tion and regulation, now is the time for the building industry to fully acknowl-edge the potential of straw bale as a valuable building component.
”Building physicists have much to offer to, and maybe to learn from,the alternative ecological enthusiasts who mix their clay with waterfrom holy springs then tramp the mud to the accompaniment oflyrics from the high school songbook before smacking the dough upon the slowly rising wall of their new house. Practical work bringsnew insight and surprises.” (Padfield, p.39, 2002)
Actual research, as well as a survey of theory, suggests that even with relativehumidity of 78% peaking over the winter, the walls in Plozevet won’t provideenough moisture for microorganisms to break them down.
Relative humidity is a satisfactory indicator of microbial growth because itis in absolute equilibrium with straw moisture content. Fluctuating relativehumidity in a wall doesn’t fully correspond to the amount of moisture absorbedby its materials, which will be always less than peaks of relative humidity wouldsuggest. However, moisture isn’t the only indicator of microbial life, and itsinfluence on organic matter breakdown, as well as the influence of the otherfactors, is still not completely understood. However, it is clear that for theextensive decomposition of straw, microorganisms need a long term supply ofliquid water, that is, an environment with relative humidity very close to 100%.
When designing and constructing straw bale buildings, it is extremely im-portant to avoid any long-term liquid moisture occurrence within the straw balewalls.
• The most frequent source of long-lived liquid moisture within straw balewalls, and thus the most common cause of straw decomposition is:
162
- due to bad window and door detailing,- related to leakage from a badly executed roof.
When building with straw bales, special attention needs to be paid to thewindow, door and roof details.
• Although driving rain in a cold and humid climate is a fairly common causeof high humidity levels inside straw bale walls, it is usually a relativelyshort-lived moisture source and the straw generally manages to dry outwithout any serious damage.
• Drying within a straw bale wall is possible due to the use of permeable plas-ters, which are able to absorb and subsequently release moisture. Earthand lime plasters are ideally suited to this objective.
• The danger of straw rot posed by condensation due to water vapour trans-fer caused by air infiltration and air convection can be avoided by carefulinfill of all the spaces between bales with loose straw and by seamlessplaster execution directly on straw bales. Further improvements could beachieved by building ”air convection free” load bearing walls with strawbales laid flat.
• Condensation due to water vapour diffusion through a simple straw balewall assembly (plaster—straw—plaster) doesn’t prove to be a potent enoughsource of moisture to cause straw decay.
• Moisture transfer in straw bale walls due to inadequate drainage can beproblematic. Attention should be paid to the creation of an efficientdrainage system under the bottom row of bales.
• The bottom of the wall also often suffers from rising damp. The properapproach to the base of straw bale walls needs to include either an im-permeable barrier of some sort or an effective capillary break. In the caseof gravel trench foundations, the trench needs to be drained in order toprevent liquid moisture accumulation directly under the walls.
• To stop moisture problems caused by rainwater backsplash, it is essentialto lift the straw bale walls at least 350mm above the grade.
It is tempting to use a scientific proof and assess moisture performancein straw bale walls by mathematical model. It might be unreliable as well.Building science has gotten used to employing Glaser’s model for the predictionof interstitial condensation in constructions to such an extent that the resultsof Glaser’s model can influence major decision making. As for plastered strawbale walls, Glaser’s model is misleading because it isn’t accurate, and it tendsto shift the main focus to condensation due to water vapour diffusion, which israrely a problem anyway.
The WUFI computer model, on the other hand, proved to be reliable inassessing moisture performance in plastered straw bale walls as long as they
163
have been built ”naturally convection free” and are spared driving rain andsunshine. The simplified investigation by WUFI model into straw bale wallswith various plasters resulted in following main findings:
• In a cold and humid climate, out of all the investigated wall assemblies,earth plastered straw bale dipped in 50mm of a clay slip (only on the sidesof bales facing the plaster) ensures the driest environment for straw withina wall. The dip (a mixture of straw & clay) becomes increasingly effectiveas a humidity buffer the colder the outdoor climate.
• Lime plaster finish over an earth plaster scratch (body) coat in a coldand humid climate prevents the earth plaster under it from drying, eventhough it doesn’t seem to significantly affect the moisture level in straw.
• For keeping straw moisture content in the wall low, earth plaster is superiorto lime plaster in a cold and humid climate.
• In a hot and humid climate, the different wall assemblies all performed thesame, no matter what kind of plaster the straw was covered with. Inves-tigation by computer simulation of virtual straw bale houses in Indonesiareported high yearly average relative humidity of about 85% across thewhole straw section, with long lasting (2 month) winter peaks of 98% inthe straw next to the interior plaster.
72% of the straw bale building professionals who responded to the question-naire wouldn’t hesitate to build a straw bale house for a client in a hot andhumid climate.
This thesis began with saturated straw in the western wall of a lime plasteredstraw bale house in Plozevet, Brittany, France. Now that the thesis is at itsend, it turned out to be a successful story. One of the questions in the Prefacerelated to this moisture damage caused by driving rain was: Will the straw havea chance to dry before it decomposes?
The interior of the straw bale house in Plozevet lost its rotten smell long ago.The walls dried out naturally to an adequate average moisture content of 74%relative humidity in about 120 days after the disastrous storm. The moisturedamage was fixed by cladding the entire house in a ventilated timber facade,which removed the cause of any further damage. The damage could have beenprevented if the lime plaster had been sufficiently carbonated at the time of thestorm.
The issue of humidity in straw bale walls and how it affects the decompositionof straw within is quite important, because if we understand how to preventstraw in walls from rotting, straw bale houses will be durable. A great majorityof that understanding comes from common sense. Most of the world has ancientand traditional local knowledge of how to handle organic natural materials. Ineffect, if you want to know how to prevent straw from rotting in your walls,
164
look at the oldest timber houses in your area. This thesis approached the topicof moisture from a scientific point of view and based its research on currentscientific knowledge and data collection. It is gratifying to see that practicalknowledge based on the observation of natural houses over the centuries seemsto dovetail with the results of the latest scientific understanding and analysis.
165
Chapter 10
Terminology needingexplanation:
10.1 Chapter 1 terminology:
Parts Per Million
(PPM) A unit of concentration often used when measuring levelsof pollutants in air, water, body fluids, etc. One ppm is 1 partin 1,000,000. The common unit mg/liter is equal to ppm. Fourdrops of ink in a 55-gallon barrel of water would produce an ”inkconcentration” of 1 ppm (Kimball, 1997)
10.2 Chapter 2 terminology:
Decomposition
is more or less permanent structural breakdown of a molecule intosimpler molecules or atoms (Mc Graw - Hill, 2003)
Enzyme
is protein that acts as a specific and highly efficient catalyst in bio-chemical reactions (Singleton, Sainsbury, 2001)
Protein
is large organic molecule containing carbon, oxygen, hydrogen andnitrogen as well as small amount of other elements. (Kendrew, 1994)
Fungi
166
is a group of diverse and widespread unicellular or multicellular mi-croorganisms, Fungi do not contain chlorophyll. (Singleton, Sains-bury, 2001)
Fungal hyphae
one of the filaments of mycelium (Hawksworth, 1996). It representsthe active phase, while resting stages like spores are inactive (Gams,1992)
Fungal mycelia
cotton like plexus of fungal hyphae - filaments (Wieland, 2004). Itis a thalus of a fungus (Hawksworth, 1996).
Macrofungi
are those fungi individually visible with naked eye, e.g larger than1mm. The remaining fungi are called microfungi. (Arnolds, 1992)
Saprothropic fungi, also saprophytic
are fungi belonging to one of the three main functional groups.Saprothropic fungi specializes in decomposition of dead organic mat-ter.
Saprothropic microfungi, also saprophytic
are involved in decomposition of simple carbon compounds. Numer-ous species are able to break down cellulose and hemicellulose, butonly few are involved in lignin decomposition.
Saprothropic macrofungi, also saprophytic
contributes substantially to the chemical degradation of cellulose,hemicellulose and lignin. Lignin being almost exclusively tackled bybasidiomycetes, which are in majority macrofungi.
Bacteria
is a group of diverse and omnipresent single celled organisms. (Sin-gleton, Sainsbury, 2001)
Bacterial Spore also endospore
167
Only few bacterial species produce spores: Bacillus, Clostridium,Coxiella, Desulfotomaculum, Sporolactobacillus, Sporomusa and Ther-moactynomices.
Spore
are specialized propagative, tough, thick-walled cells, with imper-meable outer walls, produced by bacteria, fungi, moss and ferms.(Kendrew, 1994)
Spore dormancy
is a resting state in which metabolic activity is low. There is nosynthesis of new cellular material. (Singleton, Sainsbury, 2001)
Spore germination
means activation, resulting in breakage of dormancy by physical orchemical agents like heat, cold, certain chemicals (water, requirednutrient) (Singleton, Sainsbury, 2001)
Viable but nonculturable state
is a state of bacteria, in which they are alive, but not capable ofgrowing or dividing (Oliver, 2005).
Rot
is plant disease characterized by primary decay and disintegrationof host tissue.
Mould
a fungus that produces a superficial growth on various kinds of dampor decaying organic matter (Wordnet, 2006).
Mycelia
is the thallus of a fungi. (Hawksworth, 1995)
Water activity
is an expression for the amount of available water in a given sub-strate. Water activity may be defined as 1/100th of relative humidityof air which is in equilibrium with that substrate. RH of 95% corre-sponds to aw of 0.95. Most bacteria fail to grow if the water activityof the medium is below 0.92
168
Cell wall
of a plant provides mechanical strength, maintains cell shape, con-trols cell expansion, regulates transport, provides protection, func-tions in signalling processes, and stores food reserves. (Bidlack atal., 1992)
Primary cell wall
is formed during cell expansion. The principal components arepolysaccharides - these include cellulose, hemicellulose and pectin(lignin can replace pectin at the end of the cell expansion). Withinthe primary cell wall, cellulose fibers are highly disorganized and arebond with hydrogen bonds.
Secondary cell wall
is formed inside the primary wall after cell expansion has ceased.Cellulose fibers in the secondary cell wall create discrete layers whichhave opposing patterns of deposition. Secondary cell wall becomesoften lignified.
fungicides fungi killing pesticides (Wieland, 2004). Non active fungiare not affected by it, although many species are sensitive (Gams,1992). Oomycetes - affected by benomyl, polyene antibiotics, Metaxyland similar. Fusarium species with PCNB. Penicilium species withdichloran. Rhizoctonia solani with pencycuron (Monceren). Fungalrespiration can auppressed by actidione. Streptomycin was foundto be overall most convenient surpressorbacterial activity (Gams,1992).
10.3 Chapter 3 terminology:
Hydrophobic material:
Materials like silicon, oil, etc, which repel water due to electromag-netic forces on the atomic level.
Hydrophilic material:
Material which attracts the water molecules due to electromagneticforces on atomic level. Most building materials are hydrophilic(Straube, 2002).
169
Hygroscopic material:
Materials like straw, wood, earth, concrete, ceramic, cellulose, etc,that get wet in contact with humid air.
Non-hygroscopic material:
Materials like glass, plastics, metals, that remain dry in contact withmoisture in the air . This means that moisture in liquid form doesn’tappear in these materials until dew point conditions (Kunzel, 1995).
Adsorption:
The attraction process initiated by electromagnetic forces betweenmaterial surface and the water molecules.
Absorption:
The attraction process initiated by electromagnetic forces betweenwater surface and the water molecules.
170
References:
ACHARYA C., N. (1934) LXI. STUDIES ON THE ANAEROBIC DECOM-POSITION OF PLANT MATERIALS. I. THE ANAEROBIC DECOMPOSI-TION OF RICE STRAW (ORYZA SATIVA)., [Internet], From the Fermen-tation Department, Rothamsted Experimental Station, Harpenden, Availablefrom: http://www.pubmedcentral.nih.gov/articlerender.fcgi?artid=1266647, Ac-cessed 25/07/07.
ACHARYA C., N. (1935) CXV. STUDIES ON THE ANAEROBIC DE-COMPOSITION OF PLANT MATERIALS. II. SOME FACTORS INFLU-ENCING THE ANAEROBIC DECOMPOSITION OF RICE STRAW (ORYZASATIVA)., [Internet] From the Fermentation Department, Rothamsted Experi-mental Station, Harpenden, Available from: http://www.pubmedcentral.nih.gov
/articlerender.fcgi?artid=1266647, Accessed 25/07/07.
Andersen, J., M., Andersen B., M., (2004) Halmhuse, Udformning og mate-rialeegenskaber,[Internet] Danish Building and Urban Research, Statens Bygge-forskningsinstitut, By og Byg Resultater 033 Statens, Denmark, Available from:www.dejsign.dk/cosco/by og byg resultater 033.pdf , Accessed 25/07/07.
Arango, M. (1981) Responses of Microrganisms to Tempearturein Lange, O.,L., Nobel, P.,S., Osmond, C., B., Ziegler, H. (1981) Physiological Plant Ecology1,Springer-Verlag Berlin Heidelberg, New York, p.339.
Arnolds, E., (1992) Macrofungal communities outside forests, in Winterhoff,W, (ed.), Fungi in Vegetation Science, pp. 113-149, Kluwer Academic Publish-ers, Netherlands
Balderstone, S. (2005) Built Heritage: A Major Contributor to Environmen-tal, Social and Economic Sustainability, [Internet] SUSTAINABILITY FORUMDISCUSSION PAPER, Available from Heritage Victoria database:
http://www.heritage.vic.gov.au/pages/pdfs/sustainability.pdf,Accessed 25/07/07.
Bares, J. (2003) Stavebni a energeticke vyuziti slamy - Prelouc 2003, Vyzkumnyustav zemedelske techniky a EKODESKY STRAMIT s.r.o., Sbornik prednasek,Ministerstvo zemedelstvi Ceske republiky, Praha, Czech Republic
Beare, M.H., Wilson, P.E., Fraser, P.M., Butler, R.C. (2002) ManagementEffects on Barley Straw Decomposition, Nitrogen Release, and Crop Production,[Internet] Institute for Crop & Food Research, Ltd., Canterbury, Nakas andAgriculture and Science Centre, Christchurch, New Zealand, Available from:http://soil.scijournals.org/cgi/reprint/66/3/848, Accessed 25/07/07.
171
Bidlack, J., Malone, M., Benson, R. (1991) Molecular Structure and Com-ponent Integration of Secondary Cell Walls in Plants, [Internet], Department ofBiology, University of Central Oklahoma, Edmond, USA, Available from:
http://digital.library.okstate.edu/oas/oas pdf/v72/p51 56.pdf,Accessed 25/07/07.
Boyle, G. (2004) Renewable Energy, Power for Sustainable Future, Secondedition, Oxford, Oxford University in association with The Open University.
Brandon D., M., Brouder, S., Chaney, D., Hill, J., E., Scardaci, S., C.,Williams, J., F. (1995) Rice Straw Incorporation, [Internet] Agronomy FactSheet Series 1995-1, Department of Agronomy and Range Science, University ofCalifornia, Davis, Available from: http://www.agronomy.ucdavis.edu/uccerice/
AFS/agfs0195.htm, Accessed 25/07/07.
BS 5250, (1995) Code of practice for control of condensation in buildings,British Standards Institution, London, UK
BS 6229, (2003) Flat roofs with continuously supported coverings. Code ofpractice, British Standards Institution, London, UK
Buis, A. (2002) Scientists Say ’Grace’ as Water-Sensing Satellites Lift Off[Internet], NASA News Archive, Available from earth observatory: http://earthobservatory.nasa.gov/Newsroom/NasaNews/2002/200203178303.html, Accessed 25/07/07.
Calamita, G. (2005) Aquaporins: highways for cells to recycle water withthe outside world, [Internet] Biology of the Cell 97, (351-353), Great Britain,Available from: http://www.biolcell.org/boc/097/0351/0970351.pdf, Accessed25/07/07.
Cappaert, I., Verdonck, O., De Boodt, M. (1976) Composting of bark frompulp mills and the use of bark compost for plant breeding, Compost Science, 17(4) pgs. 6-9.
CEST, (2001) MONOCOTYLEDONS, [Internet], Available from databaseof NTNU, the Pulp and Paper Group: http://www.chemeng.ntnu.no/research/
paper/Online-articles/Nonwoods/Nonwood.html, Accessed 25/07/07.
Christian, J., E., Desjarlais, A., O., Stovall, T., K. (1998) Straw Bale WallHot Box Test Results and Analysis, The Thermal Performance of the ExteriorEnvelopes of Buildings VII, 4b103, ASHRAE learning institute, Atlanta, USA.
CIBSE (1999) Environmental design, CIBSE, Guide A, The Chartered In-stitution of Building Services Engineers, London, UK
172
CIBSE (2001) Reference data, CIBSE, Guide C, London, Butterworth -Heinemann, UK.
CLAYTEC (2006) 6.1 Lehmputz, Neuauflage 01.2006, [Internet] Claytec Ar-beitsblatt, Germany, Available from:http://www.claytec.com/, Accessed 25/07/07.
CLEAR (2006) Residential Water Consumption (Per Capita), Availablefrom CLEAR Network database:http://www.clear.london.ca/Drinking
Water Residential.html, Accessed 25/07/07.
CMHC (1996) Straw Bale Moisture Sensor Study, [Internet] Canada Mort-gage and Housing Corporation, Research & Development Highlights, Availablefrom :http://www.cmhc-schl.gc.ca/publications/en/rh-pr/tech/00-103-E.htm, Ac-cessed 25/07/07.
CMHC (2000) Straw Bale House Moisture Research, [Internet] Availablefrom Canada Mortgage and Housing Corporation database: https://www03.cmhc-schl.gc.ca/b2c/b2c/init.do?language=en&shop=Z01EN&areaID=
0000000040&productID=00000000400000000030, Accessed 25/07/07.
Cortazar, V., G., Silva, P., Acevedo, H. (2001) EVALUATION OF A PRE-DICTIVE MODEL OF THE EFFECT OF TEMPERATURE AND HUMID-ITY ON WHEAT STRAW DECOMPOSITION, [Internet] Laboratorio de RelacinSuelo-Agua-Planta, Facultad de Ciencias Agronmicas, Universidad de Chile,Santiago, Available from: http://biblioteca.universia.net/html bura/ficha/
params/id/3919137.html, Accessed 25/07/07.
CWC, (2006) FAQ Mould / Mold, [Internet] Canadian Wood Council andForintek Canada Corp, Available from Wood Durability database: http://www.
durable-wood.com/faqs/mould.php#SPECIAL, Accessed 25/07/07.
Dalgliesh, A., Cornick, S., Maref, W., Mukhopadhyaya, P. (2005) Hygrother-mal performance of building envelopes: uses for 2D and 1D simulation, [Internet]10th Conference on Building Science and Technology Proceedings,
deGruchy, A. (2007) Highlights from the interview with details about lime andcements used for mortar., [Internet] Chicago Tribune/Washigton Post, USA,Available from Palimeworks database: http://www.palimeworks.com/
lwus/Infoall.html, Accessed 25/07/07.
Doyle, W.T. (1973) Nonseed Plants: Form and Function, Second Edition,Fundamentals of Botany Series, University of California, Santa Cruz, MacmillanPress Ltd, UK
Dresboll, D., B., Magid J. (2005) Structural changes of plant residues dur-ing decomposition in a compost environment, [Internet] Bioresource Technology,
173
Elsevier, Available from Science Direct database from: www.sciencedirect.com,Accessed 25/07/07.
Edwards, D., Hamson, M. (1990) Guide to mathematical modelling, CRCPress, Florida, USA
EELS, (2005) Nature Notes: Recycling Nutrients - The Decomposition Process,[Internet], Available from database of EELS, Ecological & Environmental Learn-ing Services: http://www.eelsinc.org/id41.html, Accessed 25/07/07.
eia (2005) Energy Efficiency - 9th Graders and Up, [Internet] Available from:http://www.eia.doe.gov/kids/energyfacts/saving/efficiency/savingenergy
secondary.html, Accessed 25/07/07.
EN 13788 (2002) Hygrothermal performance of building components andbuilding elements – Internal surface temperature to avoid critical surface hu-midity and interstitial condensation – Calculation methods, International Orga-nization for Standardization, Geneva, Switzerland
Fernandez, R. (2003) Fibre reinforced soil crete blocks for the constructionof low cost housing, [Internet] Laboratory of construction materials, Universityof the Witwatersrand, Available from:http://idm.epfl.ch/stages/pdf/113.pdf¿,Accessed 25/07/07.
Ficker, T. (2003) Non-isothermal steady-state diffusion within Glaser’s con-densation model, [Internet] International Journal of Heat and Mass Transfer 46,Science direct, Available from: www.elsvier.com, Accessed 25/07/07.
Fogel, R. (2001) Fun Facts About Fungi, [Internet] edited by Patricia Rogers,Available from: http://herbarium.usu.edu/fungi/FunFacts/Decay.htm, Accessed25/07/07.
Gams, W. (1992) The analysis of communities of sprophytic microfungi withspecial reference to soil fungi, in Winterhoff, W, (ed.), Fungi in Vegetation Sci-ence, pp. 113-149, Kluwer Academic Publishers, Netherlands
Glassford, J. (2004) 3.4e Straw bale, [Internet] Australia’s guide to environ-mentally sustainable homes, Available from: http://www.greenhouse.gov.au
/yourhome/technical/fs34e.htm, Accessed 25/07/07.
Gonzales, H. (1999) The Outer Edge: Testing Straw Bale Wall MoistureNear the Exterior Plaster, Canadian Mortgage and Housing Corporation, Ot-tawa, Canada
174
Goodhew, S., Griffiths, R., Wooley, T. (2004) An investigation of the mois-ture content in the wall of a straw-bale building, Building and Environment, 39,pp. 1443-1451, Elsevier
Guy, B. (2004) Early recovery: collected data can yield insight into the poten-tial of the deconstruction market, [Internet] The Hamer Center for CommunityDesign Assistance at The Pennsylvania State University, Available from:http:/
/www.findarticles.com/p/articles/mi m0QMH/is 4 6/ai n6150130, Accessed25/07/07.
Hansen, J.E. (2006) GISS Surface Temperature Analysis, Global TemperatureTrends: 2005 Summation[Internet] Goddard Institute for Space Studies, NewYork, USA, Available from: http://data.giss.nasa.gov/gistemp/2005/
Hansen, J.E., Sato, M. (2001) Trends of measured climate forcing agents,Proceedings of the National Academy of Sciences, 98, 14778-14783, New York,USA
Harrison, J., W. (2205) Carbonating and Hydraulic Mortars - the differenceis not only in the binder. Aggregates are also important., [Internet] TecEco Pty.Ltd., Gaia Engineering, Tasmania, Australia, Available from:
http://www.gaiaengineering.net/files/conference papers/CarbonationOfMortarsandRequirementsSand040595.pdf, Accessed 25/07/07.
Hawksworth, D.L., Kirk, P.M., Sutton, B.C., Pegler, D.N. (1995) Ainsworth& Bisby’s Dictionary of the Fungi, Eight Edition, International MycologicalInstitute, CAB International, University Press, Cambridge, UK
Hoflich, G. (1977) The effect of biocides on the microflora of soils and theirdegradation. II. Correlations between a changed population of micro-organismsand the degradation of straw, [Internet] Zentralbl Bakteriol Parasitenkd Infek-tionskr Hyg. 132(1), Pgs. 67-74, Available from: http://www.ncbi.nlm.nih.gov
/entrez/query.fcgi?cmd=Retrieve&db=PubMed&list uids=857507&dopt=Abstract, Accessed 25/07/07.
Hopkins, W.G. (1999) Introduction to Plant Physiology, Second edition, JohnWiley & Sons, Inc, UK
Houben, H., Guillaud, H. (1994) Earth Construction, A comprehensive guide,CRATerre-EAG, ITDG Publishing, SRP Exeter, UK
INTERNATIONAL PROGRAMME ON CHEMICAL SAFETY, (1993) EN-VIRONMENTAL HEALTH CRITERIA 149, CARBENDAZIM,[Internet] WorldHealth Organization, Available from: http://products.ihs.com/Ohsis-SEO/
271300.html, Accessed 25/07/07.
175
ISHS (2005) Belgium, General info, [Internet] International Society for Hor-ticultural Science, Horticulture Research International, Available from: http:
//www.hridir.org/countries/belgium/index.htm, Accessed 25/07/07.
ITCF, (2002) Fongicides, cereales et proteagineux, Cerealiers de France,InstituteTechniques des Cereales et des Fourrages, Paris, France
Jolly, R. (2000) Straw Bale Moisture Monitoring Report, Canadian Mortgageand Housing Corporation, Ottawa, Canada.
Jones, B. (2002) Building with Straw Bales, A practical guide for the UKand Ireland, Green Books, Dartington, Devon, UK
Kaboneka, S., Nivyiza, J., C., Sibomana, L. (2002) Effects of Nitrogenand Phosphorus Fertilizer Addition on Wheat Straw Carbon Decomposition ina Burundi Acidic Soil, [Intermet] Universit du Burundi, Facult des SciencesAgronomiques, Bujumbura, Burundi, Available from: http://www.ciat.cgiar.org
/tsbf institute/managing nutrient cycles/AfNetCh10.pdf, Accessed 25/07/07.
Kargiozis, A., Kuenzel, H., Holm, A. (2002) WUFI ORNL/IBP Hygrother-mal Model, [Internet] Available from: www.ornl.gov/ webworks/cppr/y2001/pres
/111509.pdf, Accessed 25/07/07.
Kendrew, J. (1994) The Encyclopedia of Molecular Biology, Blackwell Sci-ence Ltd, Oxford and Northampton, UK
Kimball, J. (1997) Kimball’s Biology Pages, [Internet] Available from: http://users.rcn.com/jkimball.ma.ultranet/BiologyPages/P/Ppm.html,Accessed 25/07/07.
King, B. (2006) Design of Straw Bale Buildings, The State of the Art, GreenBuilding Press, San Rafael, California, USA
Kirby, R. (2006) Actinomcetes and Lignin Degradation, in Laskin, A., I.,Bennet, J., W., Gadd, G., M., Sariaslani, S. applied Microbiology, volume 58,Elsevier, USA
Kolbert, E. (2006) Chilling, New Yorker, The style issue, March 20, CondeNast Publications, USA
Kolbert, E. (2006) Chilling, New Yorker, The style issue, March 20, CondeNast Publications, USA
Katterer, T., Reichstein, M., Andrn, O., Lomander A. (1998) Temperaturedependence of organic matter decomposition: a critical review using literature
176
data analyzed with different models, [Internet] Biol Fertil Soils (1998) 27, 258262,Springer-Verlag, Available from: http://www.springerlink.com/content/
fhleah8najy1x21h/, Accessed 25/07/07.
Kudo, R.R. (1971) Protozoology, Fifth Edition, Second Printing, ThomasBooks, Springfield, Illinois, USA
Kummer, K.F. (2004) Understanding Nitrogen and its use in Agriculture,[Internet] efma, European Fertilizer Manufacturers Association, Brussels, Bel-gium Available from: http://www.efma.org/publications/Nitrogen
Kunzel, H., M. (1995) Simultaneous Heat and Moisture Transfer in BuildingComponents, one- and two-dimensional calculation using simple parameters,PhD Dissertation, Fraunhofer, IRB, Verlag, Stuttgart.
Kunzel, H., M. (2004) Questions and Answers, [Internet] WUFI-pro 3.3.1 (e),Online Help, Available from WUFI database: http://www.hoki.ibp.fhg.de/ibp/
publikationen/konferenzbeitraege/pub1 26.pdf, Accessed 25/07/07.
LASCAR (2005) EL-USB-2 Humidity, Temperature and Dew Point USBData Logger, [Internet] Available from LASCAR electronics database: http://
www.lascarelectronics.com/data/pdf/EL
Liebich, J., Schaffer, A., Burauel, P. (1997) STRUCTURAL AND FUNC-TIONAL APPROACH TO STUDYING PESTICIDE SIDE-EFFECTS ON SPE-CIFIC SOIL FUNCTIONSin Environmental Toxicology and Chemistry, Volume22, Issue: 4, Pgs: 784-790, 1552-8618
Lindow, S.E. (2005) Investigation of Communication of Bacteria on PlantSurfaces, Plant & Microbial Biology.
Lindow, S.E., Brandl, M.T. (2003) Microbiology of the Phyllosphere, [In-ternet] Applied and Environmental Microbiology, 69(4): 1874-1883, AmericanSociety for Microbiology, Available from:http://www.pubmedcentral.nih.gov/
articlerender.fcgi?artid=154815, Accessed 25/07/07.
Lynch, J.M. (2000) Agricultural practices and biodiversity., [Internet] Schoolof Biomedical and Life Sciences, University of Surrey, Guildford, UK, Availablefrom: http://webdomino1.oecd.org/comnet/agr/soil ero bio.nsf/viewHtml/
index/$FILE/Lynch8sep.PDF, Accessed 25/07/07.
MacMath, R. (2000) CARBON DIOXIDE INTENSITY RATIOS: A Methodof Evaluating the Upstream Global Warming Impact of Long-Life Building Mate-rials,[Internet] Available from: http://www.cmpbs.org/publications/T1.2-AD4.5-Up Gbl wrm.pdf, Accessed 25/07/07.
177
Magid, J., Luxhoi, J., Lyshede, O., B. (2004) Decomposition of plant residuesat low temperatures separates turnover of nitrogen and energy rich tissue com-ponents in time, [Internet] Plant and Soil 258, Kluwer Academic Publishers,Available from: http://www.springerlink.com/content/k3530j34198p3870/, Ac-cessed 25/07/07.
Magwood, C. (2004) Straw Bale Building, On the Cusp of the Mainstream,[Internet] home power 101, june & july, Available from homepower database:http://www.homepower.com/files/HP101 14.pdf, Accessed 25/07/07.
Massey, F., P., Ennos, A., R., Hartley, S., E. (2006) Silica in grasses as adefence against insect herbivores: contrasting effects on folivores and a phloemfeeder - Abstract, Journal of Animal Ecology 75, 595603 doi: 10.1111/j.1365-2656.2006.01082.x.
McGraw - Hill, (2003) McGraw - Hill Dictionnary of Scientific and TechnicalTherms, Sixth Edition, McGraw - Hill Companies, Inc., USA
Meteo (2005) Meteo-Mayenne, [Internet] Weather Archive, Available from:http://gagcbrfree.fr/
Meteofrance (2005) Climate, France, Finistere, [Internet] Available from me-teofrance database: http://www.meteofrance.com/FR/climat/dpt tempsdumois.
jsp?LIEUID=DEPT29, Accessed 25/07/07.
Minke, G. (2006) Building with Earth: Design and Technology of a Sustain-able Architecture, Birkhauser, Germany
Mustin, M. (1987) Le compost, Gestion de la matiere organique, EditionsFrancois DUBUSC, 35, rue Mathurin Regnier, 75015 Paris, France
Newport Partners, (2004) BUILDING MOISTURE AND DURABILITY;PAST, PRESENT AND FUTURE WORK[Internet] Prepared for: U.S. Depart-ment of Housing and Urban Development Washington, D.C. Office of Policy De-velopment and Research, USA, Available from: http://www.toolbase.org/PDF
/CaseStudies/BuildingMoistureandDurability.pdf, Accessed 25/07/07.
Nielsen, K., F. (2002) Mould growth on building materials, [Ineternet] By ogByg, Statens Byggeforskningsinstitut, Denmark, Available from: http://
www.sbi.dk/download/pdf/phd kfn.pdf, Accessed 25/07/07.
O’Hare, G. (2004) Lime Mortars and Renders: The Merits of Adding Ce-ment, [Internet] Gaia Engineering, Tasmania, Australia, Available from:
http://www.gaiaengineering.net/files/conference papers/CarbonationOfMortarsandRequirementsSand040595.pdf, Accessed 25/07/07.
178
Oliva, J., P. (2002) L’isolation ecologique, terre vivante, Mens, France
Oliver, J.D. (2005) The Viable but Nonculturable State in Bacteria, [Internet]The Journal of Microbiology, p.93-100, Vol. 43, special issue (No. S), The Micro-biological Society of Korea, Available from: www.msk.or.kr/jsp/downloadPDF1.
jsp?fileName=p%5B1%5D.93-100.pdf, Accessed 25/07/07.
Orskov, E.R. (2002) Consistency of differences in nutritive value of strawfrom different varieties in different seasons, [Internet] The Rowett ResearchInstitute, Bucksburn, Aberdeen, Scotland, Available from: http://www.fao.org
/Wairdocs/ILRI/x5495E/x5495e0a.htm, Accessed 25/07/07.
Padfield, T. (1998) THE ROLE OF ABSORBENT BUILDING MATERI-ALS IN MODERATING CHANGES OF RELATIVE HUMIDITY, [Internet],Ph.D. thesis, The Technical University of Denmark, Department of StructuralEngineering and Materials,Available from: www.padfield.org/tim/cfys/, Ac-cessed February 12th, 2005
Padfield, T. (2002) THE WINDOW IN CONTEXT: THE INTERPLAYBETWEEN BUILDING COMPONENTS, [Internet], Available from: http://
www.padfield.org/tim/cfys/wproj/wproj tp ver9.pdf, Accessed February 12th,2005.
Padfield, T. (2005) How to keep for a while what you want to keep forever, lecture notes for museology course at Denmark’s Library School [Internet],Available from: www.padfield.org/tim/cfys/, Accessed February 12th, 2005.
Perry, R.H., Green, D.W., (1997) Perry’s Chemical Engineers’ Handbook,Seventh edition, McGraw-Hill, USA
Peuhkuri, R. (2003) Moisture Dynamics in Building Envelopes, [Internet]Ph.D. Thesis, Report R-071, Department of Civil Engineering, Technical Uni-versity of Denmark, Available from: http://www4.byg.dtu.dk/cv-www/
rhp/publications/PeuhkuriPhDThesis web.pdf, Accessed 25/07/07.
Peuhkuri, R., Rode, C., Hansen, K., K. (2004) Response of insulation ma-terials on non-isothermal moisture transport: Final results, [Internet] Depart-ment of Civil Engineering, Technical University of Denmark, Available from:http://www.byv.kth.se/avd/byte/reykjavik/pdf/art 163.pdf, Accessed 25/07/07.
Peuhkuri, R., Rode, C., Padfield, T., Hansen, K., K., Hedegaard, L. (2003)Moisture distribution in absorbent insulation, [Internet] Dnamarsk Tekniske Uni-versitet, Sagsrapport, BYGDTU SR-03-11, Available from: http://www4.byg.
dtu.dk/cv-www/rhp/publications.htm, Accessed January 17th, 2005.
179
Piepkorn, M. (2000) Moisture and Straw-Bale Walls, [Internet] The LastStraw, bonus unpublished article, Available from: http://www.thelaststraw.
org/bonus-articles/strawter.htm, Accessed January 17th, 2005.
Platts, B. (1997) Pilot Study of Moisture Control in Stuccoed Straw BaleWalls, [Internet] Canadian Mortgage and Housing Corporation, Ottawa, Canada,Available from: http://www.cmhc-schl.gc.ca/cmhc.html, Accessed 25/07/07.
Platts, B., (1998) A Threat To Strawbale Housing, [Internet] The Last Straw,Issue #22, 1998, Available from http://www.thelaststraw.org/backissues/articles/
22 07.html, Accessed January 17th, 2005.
Price, L., Worell, E., Khrushch, M. (1999) Sector Trends and Driving Forcesof Global Energy Use and Greenhouse Gas Emissions: Focus in Industry andBuildings, [Internet] Energy Analysis Department, Environmental Energy Tech-nologies Division, Ernest Orlando Lawrence Berkeley National Laboratory, Uni-versity of California, USA, Available from: http://ies.lbl.gov/iespubs/43746.pdf,Accessed 25/07/07.
Ribeiro, R.J.M.C. (2000) Nutritive value of treated straw,ESTAAO ZOOTEC-NICA NACIONAL, SANTAREM, PORTUGAL, [Internet], Available from:
http://ressources.ciheam.org/om/pdf/b06/95605269.pdf, Accessed 25/07/07.
Richard, T. (1996) The Effect of Lignin on Biodegradability, [Internet], Avail-able from Cornell Composting database, Science & Engineering: http://
compost.css.cornell.edu/calc/lignin.html, Accessed 25/07/07.
Rohrer, J.D., Heimlich, J.E., (1998) Comparative Decomposition Rates forShredded Newsprint, Straw, and Sawdust, Ohio State University Fact Sheet,Community Development, CDFS-124-98, Ackerman, Ohio, USA, [Internet], Avail-able from: http://ohioline.osu.edu/cd-fact/0124.html, Accessed February 28,2006.
Salzman, W., R. (2004) The Melting Curve for Water; Vapor Pressure,[Internet] Available from Salzmanindex: http://www.chem.arizona.edu/ salz-manr/480a/480ants/watvp/watvp.html, Accessed 25/07/07.
Sanders, C. (2005) New Models for Interstitial Condensation, [Internet] Pre-sentation, BRE Scotland, Available from: projects.bre.co.uk/moisture/Moisture.
ppt, Accessed 25/07/07.
Schmidt, (2001) IBP Software / WUFI / Basics, [Internet] Available from:http://www.hoki.ibp.fraunhofer.de/wufi/wufi frame e.html, Accessed 25/07/07.
180
Sedlbauer, K., Krus, M., Zillig, W., Kunzel, H., M. (2001) Mold Growth Pre-diction by Computational Simulation., [Internet] ASHRAE-Conference IAQ, SanFrancisco, Available from: http://www.hoki.ibp.fraunhofer.de/ibp/publikationen
/konferenzbeitraege/pub1 32.pdf, Accessed 25/07/07.
Singleton, P., Sainsbury, D. (1978) Dictionary of Microbiology, A Wiley-Interscience Publication, John Wiley & sons, Sainsbury, UK
Smith, D. (2006) Strawbale Info:, [Internet] Available from DSAA database:http://www.dsaarch.com/SB
Still, D (1997) Testing Straw Bale Construction in the Soggy Northwest,[Internet] Available from Aprovecho database: www.aprovecho.net/at/projects/
strawbale.htm, Accessed 25/07/07.
Still, D (1999) Our Strawbale Dorm: 2 Years Later, [Internet] Available fromAprovecho database: www.aprovecho.net/at/projects/strawbale.htm, Accessed25/07/07.
Still, D (2003) Our Strawbale Dorm: 6 Years Later, [Internet] Available fromAprovecho database: www.aprovecho.net/at/projects/strawbale.htm, Accessed25/07/07.
Straube, J. (2003) Moisture Properties of Plaster and Stucco for StrawbaleBuildings, [Internet] EBNet, Available from:www.ecobuildnetwork.org/
pdfs/Straube Moisture Tests.pdf, Accessed 25/07/07.
Straube, J., Burnett, E., (2001) Review of Modeling Methods for Build-ing Enclosure Design, [Internet] University Waterloo, Canada, Available from:http://www.civil.uwaterloo.ca/beg/CE708/HAM
Straube, J., F. (2002) Moisture, Materials & Buildings, HPAC Engineering,[Internet] April, pp.37-46, Available from: www.ecobuildnetwork.org/pdfs/
Straubetextunderscore Moisturetextunderscore Tests.pdf , Accessed October 12th, 2005.
Straube, J., King, B. (2006) Moisture Basics and Straw-bale Moisture Basics,The Last Straw, Issue #53, The Green Prairie Foundation for Sustainability,GPFS, Lincoln, USA
Straube, J., Schumacher, C. (2003) Comparison of Modeled and MonitoredPerformance of a Wall Insulation Retrofit in a Solid Masonry Building, reportfor Canada Mortgage and Housing Corporation, Research Highlights, TechnicalSeries 03-111, Ontario, Canada
181
Straube, J., Schumacher, C. (2003) Monitoring the Hygrothermal Perfor-mance of Strawbale Walls, [Internet] Balnced Solutions, University of Waterloo,Canada, Available from EBNet database: http://www.ecobuildnetwork.org/pdfs
/Winery Monitoring.pdf, Accessed 25/07/07.
Studemund-Halevy, M. (1994) Tips and Hindweise, Merian, Bretagne, C4701 E, July 94, Nurenberg, Germany
Summers, M.D., Blunk S.L., Jenkins B.M., (2003) How Straw Decomposes,[Internet] EBNet Straw Bale Test Program, DRAFT 12/8/2003, Available fromecobuildnetwork Database: http://www.ecobuildnetwork.org/pdfs/Howtextunderscore Strawtextunderscore Decomposes.pdf, Accessed January 17th, 2005
Swearingen, J. (2005) Moisture Barriers in Straw-bale Construction, [Inter-net] Available from Skillful Means database: http://www.cc-w.co.uk/Documents
/Swearingham-moisture1.pdf, Accessed January 17th, 2005
Tariku, F., Kumaran, M., K. (2006) Hygrothermal modeling of aerated con-crete wall and comparison with field experiment, [Internet] International Build-ing Physics Conference, Montreal, QC., August 27, 2006, pp. 321-328, Canada,Available from: http://irc.nrc-cnrc.gc.ca, Accessed January 17th, 2005
Thompson, M. (2000) Relative Humidity and Psychometric Chart, in Mscarchitecture: Advanced Environmental and Energy Studies, Unit A2 Oct. 04,Center for Alternative Technology, Machynleth, UEL, p.91.
Time, B., Uvsløkk, S. (2003) Intercomparison on measurement of watervapour permeance, Prosjektrpport 339, Norges byggforskningstitutt, Blindern,Norway
Tuller M., Or, D., Dudley, L.,M. (1999) Liquid retention and interfacialconfigurations in angular pores, [Internet] WATER RESOURCES RESEARCH,VOL. 35, NO. 7, PAGES 19491964, Available from: soils.ag.uidaho.edu/Tuller/
Markus Tuller/Publications pdf/1999WR900098.pdf, Accessed 25/07/07.
Tywoniak, J., Kulhanek, F. (1995) Stavebni fyzika 20, Stavebni tepelna tech-nika - Pomucka pro cviceni, Ceske vysoke uceni technicke, Fakulta stavebni,Vydavatelstvi CVUT, Praha, Czech Republic
Vinha, J., Mikkil, A., Valovirta, I., Lindberg, R. (2002) Water Vapour Re-sistance as a Function of Humidity, Building Physics - 6th Nordic Symposium,Session 12: Hygrothermal Properties of Materials, Norway.
Wahr, J. (2006) Antarctic ice sheet losing mass, says University of Coloradostudy[Internet] University of Colorado at Boulder, Available from Eurek Alert
182
database: http://www.eurekalert.org/pub releases/2006-03/uoca-ais022806.php,Accessed January 17th, 2005.
Wanek, C. (1998) Straw-Bale Buildings You Can Visit, The Last Straw, ANat Works Production, Issue #23, New Mexico, USA
Warren, J. (1999) Conservation of Earth Structures, Butterworth Heine-mann, Oxford, UK
Washington University, 2005 Compost Fundamentals, Compost Needs, [In-ternet] Washington State University, Whatcom County Extension Availablefromhttp://whatcom.wsu.edu/ag/compost/fundamentals/needs carbon
nitrogen.htm, Accessed 25/07/07.
Wieland, H. (2004) Mikrobielle Empfindlichkeit von Bau-Strohballen, [Inter-net] Fachverband Strohballenbau, Deutschland, Available from fasba database:http://www.downloads.fasba.de/3mikrobiell 72dpi.pdf, Accessed 25/07/07.
Wihan, J. (2005) Is it necessary to build airtight and to use heat recovery inorder toachieve the energy efficiency of passive-enrgy building standard?, [Inter-net] UEL/CAT Msc AEES, Student essay, Machynlleth, UK
Wilhelm, G. (2004) The Realities of CO2: Seeing through the Smog ofRhetoric and Politics, [Internet] Conservation Design Forum, Available from:http://www.cdfinc.com/CDF Resources/Realities
Wimmer, R., Hohensinner, H., Drack, M. (2004) S-HOUSE SUSTAIN-ABLE BUILDING DEMONSTRATED BY A PASSIVE HOUSE MADE OFRENEWABLE RESOURCES, [Internet] GrAT - Center for Appropriate Tech-nology at the Vienna University of Technology, Vienna, Austria, Available fromGrAT database: http://www.strawbalebuilding.ca/documents.shtml, Accessed25/07/07.
Wimmer, R., Hohensinner, H., Janisch, L., Drack, M. (2001) Wandsys-teme aus nachwachsenden Rohstoffen, [Internet] Haus der Zukunft, GruppeAngepasste Technologie an der TU Wien, Available from Baubiology data-base: http://www.grat.at/Publikationen/Wandaufbau aus NWR.pdf, Accessed25/07/07.
WUFI (2005) WUFI pro 4.0 Online-Help, Microsoft Windows Help, IBP,feature of WUFI pro 4.0 software
Yang, C.H., Crowley D.E., Borneman, J., Keen, N.T. (2001) Microbial phyl-losphere populations are more complex than previously realized, [Internet] Pro-ceedings of the National Academy of Sciences of the United States of America,
183
The National Academy of Sciences, Available from Pub Med Central data-base: http://www.pubmedcentral.nih.gov/articlerender.fcgi?artid=31148, Ac-cessed 25/07/07.
184
Bibliography:
EEA (2005) The European Environment, State and Outlook 2005,[Internet] EEA, Copenhagen,
CMHC (1997) Pilot Study of Moisture Control in Stuccoed StrawBale Walls, [Internet] Available from Canada Mortgage and HousingCorporation database:
Fugler, D., Starube, J. (2000) Moisture Properties of Plaster andStucco for Straw bale Buildings, [Internet] Available from CanadaMortgage and Housing Corporation database:
Fugler, D. (1997) Straw Bale Moisture Sensor Study, [Internet] Avail-able from Canada Mortgage and Housing Corporation database:
185

Appendix A
Interviews
186
A.1 Interview with Barbara Jones of AmazonNails at Ecobuild 2006 in London.
April 2006
On how many straw bale buildings have you participated so far?
Probably over a hundred.
Since...?
Since 1994.
How many times have you encountered moisture problems instraw bale walls?
Very, very rarely. There’s two I can think of. No, three.
What was it about?
Two of them were because they were left unplastered and open to the weatherand they went through quite severe wind and rain during winter. Some of thestraw wasn’t protected enough and got very wet right through the center of thebale.
Where was it?
It was in northern Scotland and the other was in Ireland.
Was the cause driving rain or moisture that leaked through thetop of the wall?
One of them happened because the roofers didn’t put tarpaulins over thetop of the roof and rain got into the top of the wall and went down throughthe center. That one also had a problem from rain hitting the wall on thesouthwest side. And those bales got very wet right at the bottom just on top ofthe foundation.
The other one was also a driving rain on unplastered wall.
Those two cases were unplastered straw bales. What about thethird one?
The third one was a design failure, I think. It was plastered, but architecthad designed very wide window sills covered in lead and they collected a lot ofrain. Wind funeled it off the edge, so it was like house pipe that went on to partof the wall and that got very wet. We had really great success repairing that.
Did you repair those previous cases as well?
187
Yes. They all were repaired successfully.
Even though they all were loadbearing structures? People pro-moting post and beam,with straw as infill, often stress the fact thatinfill is much more easily repaired.
When it’s loadbearing it is absolutely easy to replace the straw, becauseyou’ve got a wall plate around the top that acts as a lintel so you don’t haveto prop anything. You can take out whole sections of straw and replace them.We’ve done that. In fact there is another building,
there are four buildings that I know of. They got very wet through a lackof proper care and attention. And we’ve repaired them successfully by takingout sections. Sometimes we’ve taken out sections about 300mm wide. From thewall plate down to the base plate. And we’ve repaired it from bottom upwardswith fresh straw.
Flakes of fresh straw?
Yes. With one of them, the one in Ireland, we advised the owner to drill holesin the wall. Holes about 50mm in diameter, and to leave them with newspaperinside, because the newspaper draws water from the wall. One of the qualitiesof straw is that it gets wet very quickly, but it also gets dry very quickly andif you make the hole through the whole wall as long as it isn’t raining on it, itwill dry out very quickly. And you can do that all over the wall if you want. Itdoesn’t effect the structure.
How many times have you seen mold growing on a plastered strawbale wall, when the building was occupied?
Never.
What is your favourite straw bale wall cover?
Always, either lime or clay.
Exterior?
For the exterior, lime and for the interior lime or clay.
What kind of lime do you use?
Almost exclusively fat lime—lime putty. We sometimes use hydraulic limeif it’s little bit late in the season, but we would never use lime beyond the endof August.
Would you mix lime putty and hydraulic lime together?
No there is no point in doing that as far as I’m concerned.
188
Why?
Because it is still hydraulic, so you might as well use hydraulic. If you mixlime putty with hydraulic you’v got hydraulic.
Is it weaker?
Well it is debatable. People have different theories about whether it is reallyweaker or not weaker, or what it does.
When would you apply your plaster so that it has time to carbon-ate enough for protection of straw through the winter?
We always say that all the plaster coats on the outside have to be completedby the end of August. Otherwise you risk the frost damage from lack of car-bonation, because lime won’t carbonate if the temperature drops below 10◦Cand if the temperature is not much above 10◦C it will carbonate much, muchmore slowly. So, you just don’t have protection against the weather and thanthe rain can penetrate through the plaster.
I heard that carbonation is a very slow process anyway, 2mm permonth. How much time then is enough to protect the straw? Doesthe plaster need to be fully carbonated?
Not fully carbonated. No, some of the buildings in England that were built400 years ago are still not fully carbonated. (Barbara laughs) It’s a slow process,but it takes about three months in good conditions for it to carbonate enoughto provide a weather resistant coating.
What about interior plaster?
Well, it is not the same. Very often the interior plaster takes longer tocarbonate if the house isn’t inhabited, because it is cold inside and it doesn’thave any ventilation, or not enough ventilation. So it can actually stay softlonger on the inside than it does on the outside. And that is a big problem ifyou are plastering during the winter. I mean, plastering is a seasonal processand it is not sensible to try to do it over the winter months.
Would you rather use clay than lime in interiors?
There are reasons for and against. Clay is wonderful tactile material likelime is and is not toxic. It is much better to use that with people that want toput their hands into the mix and to do sculptural work. And for many, manyapplication clay is just the best to use, but it is not as durable as lime. Forinstance schools need something more durable than clay on the parts of wallsthat might get knocked or banged, or where cleaning equipment might rub upagainst it. In those cases it might be more sensible to use lime, than clay, butclay has real beauty to it that you just can’t match.
189
There is a lot of debate about breathability and how it is importantin straw bale walls. To maintain a more breathable cover of the strawbales inside rather than outside seems to be beneficial. It is supposeto prevent condensation. Would you believe in those theories andare you threatened by condensation?
Not at all. I don’t think the condensation in a wall is actually an issue atall. I think it is a myth. It is like a myth that you can’t built houses out ofstraw.
Would you use discoloured straw bale that was rained on?
No. I would always be really careful about my choice of bales. If they’vebeen wet and they’ve dried out and they’ve been out in the elements, they’remuch more likely to decay, than if they’re straight off the field and they’ve beenkept dry. And it’s not worth messing about with if you’re a building new house.I think you need to have bales that have never been wet.
What about content of weeds, hey, grases in straw?
I’m not sure. I don’t know about that. I think you sort of make a practicalassessment when you are looking at the bale. You can see very clearly if it’s gota lots of something else in it or not and I would generally not use it if it has alots of material in it that could compost. Not that it would compost. It mightnever. It’s just if you’ve got a choice of bales than I would go for absolute bestyou can get.
Do you use moisture meter?
Never. I think moisture meters should only be used by people who absolutelyknow what they are doing, otherwise all that happens is that you get scared.
Have you ever monitored moisture inside a wall?
Not in any formal way. No. We’ve done it by sticking the things into strawbefore it’s been plastered and things like that, but I’ve never done the moisture.I’d like to do some, but we’ve never had an opportunity.
Would you build a straw bale house in a hot and humid climate?
In hot climate yes. It’s humidity, that I think, its the problem. I think thatyou could build a straw bale sauna for instance and have it humid atmosphereinside, because it would pass to the outside as long as you have a breathableplasters, but if you had a humidity inside and outside the building, because ofthe climate, I think it would be risky. I can’t say definitely weather it wouldwork or not, because I’ve never tried it. I think it might be risky.
Thank you very much.
190
There was still a bit of time, so Barbara had the opportunity to give herexpertise on a sample of lime plaster from Plozevet:
Barbara:I wouldn’t say I’m an expert really on analyzing lime. Is this what happened
to it?(Barbara crumbles the plaster in her hand)
Yes.
In the rain?
Crumbles.
Yes. It looks like it is not carbonated.
That is what happened. Martin (the owner) plastered in Septem-ber and it didn’t carbonate.
That is what it looks like. Was it just on the weather side or was it all over?
More or less all over. And the wind is so bad that driving rainpenetrated the whole building all the way through.
Yes.
Now the owner has to make timber cladding all around it. He isconvinced that you can’t make a plaster that would withstand condi-tions in Plozevet. I thought, he had probably never seen your limeplasters before. They are like sealed skin. Do you think that the limeplaster you are applying would withstand such driving rain by theAtlantic ocean?
Well, I don’t know, I started recommending people to put a weather screenat some point to give it some protection.
What do you mean by weather screen?
Either trees, or until the trees grow a natural screen of some sort. A fencethat prevents all wind.
191
A.2 Interview with Tom Rijven of Habitat Veg-etal on the way to Brittany
October 2005
On how many straw bale buildings have you participated so far?
I think between 50 and 60?
Do you keep any notes about it?
Well my notes are more special, because I do actually two parts in construc-tion. The first is putting up the wall and the second is a clay plaster. So myinterest is a follow up of the construction and clay plaster. I take notes of whatkind of earth I have on the spot and then I do tests, so I know what kind ofclay is in there for the next step.
If we are talking about humidity, I have moisture meter and I’m measuringmoisture content in a straw bales already when farmer brings them. I need tocheck if there isn’t too much humidity inside. I do the second check when I puton the clay, namely the first layer of clay plaster, the body coat. When the bodycoat dries out, it changes the colour on the outside, but you don’t actually knowexactly what is happening inside. So I put the moisture meter in. It has 25cmlong sensor, so I can stick it to the inside of the bale and if I take it out slowly,I can see almost exactly when the bale starts to get more humid, because of thewet plaster.
What is still acceptable value of moisture content for you?
I agree to 25%. That is for me not a problem for straw bale. The transportof humidity is going on all the time there and the percentage is changing. Ifit is more than 25% or even 30% for longer period of time, and I’m talkingabout between two weeks and a month, then I’m asking myself what is goingon? Because if it was just drying it would take less time. So there should beanother reason why it stays humid.
How many times have you encountered straw bale rot in a wall?
Actually one time I had a rot so that part of a building was lost, almost.And that was because of the wall cover failure. The roof wasn’t still there.Normally, I cover top of the wall with plastic, so it actually can stay withoutroof, so that the rain can’t get inside the bales. In this case the carpenter tookoff my protection and than he put it back poorly. When the rain came, watergathered in one place and from there it followed the wooden column, came underthe water protection and then it was in the center of the wall, so that the waterfrom all that large plastic came to one spot. This happened during two weekswhen I wasn’t on the site.
192
Two weeks was enough to make the straw completely rotten?
Yes. That was actually what happened.I had already a body coat on, so I made holes in the body coat. Later on in
the season, when the roof was there already, I was heating inside of the buildingto 50◦C with a special heating machine for one week. It didn’t work, because Ithink that body coat in a way is blocking the drying process and the bales thenrot.
Did you heat the wall inside?
No, I heated the building inside. Because the walls were already there Icould heat one spot of the wall very very well.
Where did you make the holes?
On the inside and the outside as well. Finally what I had to do was that Itook off the body coat from the inside. I took out—not the bale, because thebale wasn’t existing anymore—I took out a black mess. But because the way Iconstruct, I have a light wooden structure in the wall, the roof was still holdingdespite missing straw. And also I had still a body coat on the outside. It wasalready dry and standing intact by itself as a skin. I filled the large hole witha dry straw again. Then I put on the face of the fresh straw a panel and thenI plastered from the inside on top of that panel. Now you don’t see anymore adifference.
Was that the only time you had encountered a straw rot?
On this level yes. There is another experience with a building that wehave built in the winter, so it wasn’t the best time. The straw bales that myapprentice had put in the wall were grey. I came to measure a humidity and itwas more than my scale could give. It was more than 45%. Normally I thinkthis is lost. There was nothing I could do to save the straw. This was a centerfor experimenting, so it wasn’t for a private person, and we decided to leave itthere to see if it will spontaneously dry out. It had no body coat. It just hada French dip (3 to 6cm thick layer of clay slip applied by dipping a side of abale in bathtub filled with a clay slip). I came two months later and it wasn’tstill a hot season, it was early in spring and I measured moisture content. Itcame down to 30%. It dried out very well already, so I was thinking if I waitanother two months it will be in my limits. Luckily the body coat was not thereto block the drying process. This was for me an example that straw bale has agreat capacity of getting out the humidity, if there isn’t body coat or even finalcoat on top.
I just remembered another example. In one building, there was a roof con-struction on, but not covered with tiles yet. It was a very bad weather, one ofthose big storms in France. Many roofs were gone, you know. Finally we hadtraced down the leakage that came to the very bottom of the wall. Those bales
193
were gone. The only solution was to take them out. It was another system. Itwas loadbearing, but if only the small section is damaged you can get the strawout.
You have probably seen a lot of occupied straw bale buildings fromthe inside. How many times have you seen mold growing on strawbale wall (in occupied building)?
I have seen mold growing, but that wasn’t straw bale, it was claystraw (wetmixture of straw and clay, where straw makes substantial part of the mix. It isusually poured into form work and then compacted). This was my first building.Claystraw in the formwork can dry out in about three months, because there isa wet straw even in the middle of the wall. It is also dipped in clay.
It takes three months for claystraw to dry out in high summer season. Ifyou are late in the season, it can not dry anymore. That is what I saw. I was inthe winter time there. The outside of the wall had dried out. I’m talking about30cm thick wall. I had to install the electricity lines, so I took drill machine anddrilled may be 6 or 7cm of solid stuff, which was all right and then, there wasnothing and then again came the wall skin on the other side of the wall. I haddrilled on several places. I thought: what’s going on? So I opened the wall andinside was nothing, it was gone, it was air, or it was all wet. It was mush. Thewall was made in September, which was too late in the season. Because the twosides of the wall were intact skins, and because of the wooden frame structure,the wall stayed as it is, with advantage of insulation created by air layer. Wewere lucky.
What kind of finish do you prefer to use for the interior of yourstraw bale projects?
Actually when you are looking at the both sides of the wall, you want tohave the less permeable cover on straw to the inside. In general I’m workingwith the clay plaster, so I’m using on the inside the clay plaster anyway for agood indoor climate. This means that to the outside you need to have at leastalso a clay plaster and not the lime. I’m convinced that it doesn’t matter if youmake lime plaster only on the part of your house, for example if you lime plasterthe western wall exposed to the heaviest wind and rain, to give the house extraprotection. I think that the rest of the house provides enough surface to breath.
Let’s talk about the inside now. Do you use any special ingredi-ents, or trick for the interior earth plaster?
For outside clay plaster I do water proofing with the fixative, with a productthat I spray on the wall. Actually the spraying gives water protection, but it isalso closing free passage for humidity, that is for sure. So actually I do need todo this also inside to get the equal permeability, even though I don’t need anywater protection there. I do this only sometimes and not for the whole interiorsurface. I’m still thinking that if you are looking at the whole house that thepart of its surface can take less transpiration than the majority of surface area.
194
You do French dip in clay slip on both sides. Interior as well asexterior side of the bale. Why do you do this?
It is for the construction purpose. Your straw bales get immediately stabi-lized this way. If you put them into the wall and on top of each bale you fix alintel (lath 30mm x 30mm), every straw bale is stabilized. The surface is alsostabilized. When dipping is still wet and straw bale is fixed in the wall I puta board, some kind of plywood, on the wall surface and hammer surface flatto get further compression in this direction. Structurally, this is important tome, because the wall gets well stabilized and the bales are becoming leveled bytapping on board.
And they get attached to each other.
Yes. And there is another advantage. The clay slip is not on top of the balessurface, but inside a bale. This means that my glue is inside the straw. WhenI do on top of this a body coat, the connection between the body coat and thispart of clay slip and straw mixture is more logical, more natural, because it isalready the same thing, you know? It is very logical to do that.
How many centimeters do you dip?
Dip is between 3 and 5 cm.
And by dipping, clay slip goes all the way in. It doesn’t stay onthe surface?
It is in. By using all the other methods, it stays on top. People tell methat they have very strong spraying machines. I don’t believe them, becausethe straw is closing itself under the pressure of sprayed plaster. If you put aforce on the straw it bends in and there is another straw and another to blockthe passage inside.
Intermezzo: Playing with straw
I have so many ideas, you know. I just want to play in winter. To play withround bales, big jumbo bales, this and that. So much to experiment.
In a way I like the building process, because at first you don’t know thebuilding. After one, two weeks you start to get ideas, you see what is possible,but you are not paid for that, so you need to do something extra. For examplewe do the research on the weekend and we find another colour of earth. Thatis because you are there and you see what is possible. This is exactly a processthat I appreciate, because every house is then different. In every house we didthis year, we used something extra but different way. That is fun, you know.
With building for a client there are too many things that you have to thinkabout, but we need to do more research, not only building for clients and notonly in a small scale, but also real buildings. There we could show what are the
195
possibilities of a straw bale. We don’t know. We think we know, but we don’tknow. You are researching humidity, someone else is researching fire-protection,but I want to experiment how far I can tip the wall on the angel before itcollapses, or something like that. We don’t know how much weight can roundbale carry, we haven’t done research on that. There is a lot, a lot, a lot.
To make a research on building, you need a free contract, so may be nota house, but some other building, where you are going to be really free to doanything you want. May be if it takes a year. Than you will have a building asa standard for straw bales. You can say ”O.K., this is a beauty” or ”So, this isthe quality of straw bale!”. Something that you can not do with anything else,because this is what only straw bale can do. Then the architects can say ”Hmm,these are not African cabins, that you are making. No, this is real architecture,this is another approach.” The ecological architecture doesn’t need to be rigid.I’m not talking about the sun orientation e.t.c. These are technical things. I’mtalking about the material. It is not an infill, it is just not a brick. No. Strawbale is something else. As an architect, you can put juice into your design. Strawbale is flexible. You can put it on edge, but next to it in single row you canalternate the directions for example, so you can do in the building alternatingwidths of the wall. That is also what I’d like to explore.
Do you think that there is a condensation happening in the strawbale wall, especially on the cold inner surface of exterior plaster inthe winter?
Yes.
Do you think that this is a serious risk?
Well, there is a relation between risk and the time the condensate stays inthe wall. In the moment the sun hits the plaster, condensation dries very fast.Here I wouldn’t be worried.
Would you worry about the wall with northern exposure in win-ter?
There is in my opinion also a difference between a plaster, adhering just tothe bale surface and plaster that gradually merges with straw. In the middleof the bale there is a straw and then slowly the clay comes in, so condensationis gradual. There is more density in body coat and then even more density infinish layer. So there is the whole process going on in there. It isn’t abruptchange.
Like glass for example.
Yes. That is for sure. Also I think that cement for example creates such anabrupt environment. Or you need to dip your bales in cement, so that you have
196
3cm dip where there is a mixture of air straw and cement. The condensationwill be different than the condensation would be on the pure cement stucco.
This is just my imagination saying that the part of the risk of the condensa-tion is taken by the concentration of the clay, where the clay comes in contactwith the straw. But still I think, the condensation happens.
A bale that had been previously wetted by rain, becomes dis-coloured. Would you put discoloured bale in the wall?
I put them in, if they are dry. What had happened before doesn’t matter. Ihad built with bales damaged by moisture from one side, because I took themdirectly from the ground, where they had been laying for several months. WhenI placed them into the wall they were dry. When it is dry, it is dry. Once thestraw bale is moisturized the way that the fungus is visible, then the fungusgrows easier the next time the bale gets wet again, because the straw is morevulnerable. When straw bales stay dry enough the fungus is not a problem.I’m convinced about that. I wouldn’t use discoloured straw bales for the wholeconstruction, but few are acceptable.
Would you built with a bale that has a lot of grass in it?
Especially in biological straw, you can see from which part of the field a balecomes from. At the edge of the field, there are many other plants, for examplethe plants with needles. This is one of the reasons why I don’t like too muchworking with biological straw. I’m working with bare hands, you know. Peoplehave their own reasons to use biological straw, but me as an constructor, it isn’tmy first choice.
How often have you worked with biological straw?
At least 50% of building straw in France is biological, because people whochoose to have straw bale building, they are often looking for the biologicalalternative.
Biological straw is different, isn’t it?
Yes, Can be. First of all there are other plants in it, so the work isn’t sopleasant and second of all, if I dip a biological bale, its straw is more protectedso that my dip in clay slip doesn’t attach to it so well.
Why is that?
Because biological straw is protected by silica, which is a natural coating.When it is still on the field, the straw is protected from humidity. In the momentI want to dip it in clay slip it is also protected. So I recommend to let biologicalstraw bales weather in the sun for one or two months. The sun arrays breakdown this protection on the bale surface. This is just a little detail. There is adifference.
197
Would you build for a client straw bale building in hot and humidclimate?
In tropics, there is a period before a monsoon comes, when the humiditylevel is constantly almost 100%. I have seen what this can do. It isn’t rain, buthumidity is everywhere. You can’t escape anymore. I had my clothes hangingon line with maximum aireation and they were damp for very long time, so Ilost it. Another example, I was on a bicycle and I had a saddle from naturalleather, but in this climate few weeks before a monsoon the saddle started torot. If it continued for few months I would have lost it. I was really impressedby the amount of the humidity and what it can do with materials.
I’m not 100% sure. The experience is already there. The local people dobuild their houses with natural fibre. The truth is, that the layer of fibre theyuse is less than 35cm thick straw bale, so they get more airation. They mightalso use other fibre than straw. They use fibre coming from that area, so I thinkit has to have its own natural protection. May be we should make the balesfrom that local fibre.
So would you take that job?
Yes. For sure I would take that job. I would take that risk.Before I start with any building I do research in the area to see how the local
people build traditionally with fibre.
At the end of our interview, would you have any interesting mois-ture story for me?
There is the most beautiful straw bale building I’v ever seen near Prededome,centre of France, known for it’s rough climate. It is humid there and everything.Cold. It is an exceptional building. It has unplastered straw bales. Are theyhumid? Are they rotten? No, not at all. The colour has faded out, but anyway,the owner said, when it rains and later on - the wind comes, it is not the sun,it is the wind that dries it out. And it is dry.
For how long has been this house standing in there?
For 12 years without plaster. It is still there.
Is there a plaster inside?
There is a lime plaster on the inside.
Who built it?
The guy himself. He build it only with a quarter of the page from book”Shelter”. It is the most simple house I’v seen in straw bales and the mostcharming. Very light roof. He prevented the roof from blowing away by hangingthe ropes over the roof and on both sides of the rope he tied the rock. Only tworopes. That was it.
198
Is it loadbearing?
Yes. On top of the wall there is a round wood, log. He didn’t fix it to thewall and on top of that he put his roof.
It must have been one of the first houses in France.
You know, we don’t know. Nowadays there are in France at least 500 strawbale houses. At least! Because everywhere where I come, and I build in a lotof different regions, people tell me: ”Yes, there is somebody who has built instraw bales already.” Everywhere. You don’t know. The known structures areoften the ones that have been build officially with an architect, or people whoare looking for publicity. Cabins, sheds e.t.c—we don’t know.
Thank you very much.
199
A.3 Interview with Martin Oehlmann in his andhis wife’s straw bale house in Plozevet—Brittany, France.
House still under construction, October 2005 (few weeks before thegreat storm that soaked the walls all the way through)
On how many straw bale projects have you participated so far?
I think during last ten years about 4 each year? I just don’t know.
What kind of plaster have you chosen to protect the exterior ofyour straw bale walls?
Here, because the house is in a very rough climate by the Atlantic ocean I’vchosen lime plaster. The lime had been used traditionally in this location. It isa product that you can buy in every building store. You can’t buy clay plasterhere, by the way.
What makes your plaster weather resistant?
First of all there are three layers of lime plaster. The last finish is very muchrubbed in and smoothed out by trowel, so that it is almost like a tadallact finish,which is absolutely moisture resistant.
Lets look at your plaster in detail layer by layer. Exterior andinterior. How was it made?
I was at first informed a bit about lime plaster in general, because there aredifferent qualities available. I went to different supplier. I also talked to Pascal1,who did a lot of lime plastering on straw bales here in Brittany. It is good touse the materials that he has direct experience with, because there are differentproducts, which may vary in quality. Even though we have European standards,like NHL2 for example, there are differences in quality within these limes. I waslistening to other opinions as well. Someone who used rather ruff sand, sort ofstony for the first layer to build it up roughly and then get into the smaller sizesof sand in next layers ending up with fine plaster on the surface. I didn’t dothat. I applied the first layer of lime plaster made out 50% of hydraulic limeand 50% of air lime (hydrated lime - ed. author). 1 part of lime mixture likethis and 3 parts of sand.
How did you apply this layer?1Pascal Thepaut is Europe’s first pioneer of straw bale construction.
200
Partly with a spray machine and partly by hand, because with the spray wedidn’t have very good experience and even the hose was not long enough to getall the way to the north side.
Have you used netting as well?
We used netting on all walls and it was very good.
For the inside and for the outside?
The same think. The same materials, the same way of application are oneither side of a wall.
We’ve chosen netting because the ”I” beams in the walls are surfacing in thesame level as the straw bales and the ”I” beams need to be covered. We actuallyapplied some scotch tape directly on to the beams before plaster application toprevent cracking. In case the wood is working, the scotch won’t be connectedwith the lime plaster as well as wood would be. (After the winter with manydriving rain conditions the wood of ”I” beams started to rot under the scotchtape. This we learned when we opened the soaking wet plaster - ed. author)Afterwards we covered the whole wall with netting. It is black plastic netting15mm by 15mm. It appeared to be very nice to work with.
Did you staple the netting on the wood?
Yes. The netting gave a very nice key.
How did you apply the first layer, when plastering by hand? Haveyou rubbed it in?
We had many people, volunteers who have worked on that. There were evensome professionals who knew how to throw plaster on the wall. It went into thewall with some power, it went very well. It is a good method. Somebody usedthe board, instead of throwing plaster with a trowel.
How thick is the first layer?
Well, it is about 10mm. Somewhere few millimeters more, but not much.
What about the second layer?
Like a first layer, only that the lime isn’t mixed with hydraulic lime. Thereis just air lime (hydrated lime ed. author) in the second layer. Proportion limeto sand is again 1 to 3. We used the same sand with 0.4mm grade. It is ared sand and we’ve used it for all the three layers. First I though I’ll use thefine sand for the finishing layer, but the local professional warned me that thecracking might be more obvious in fine and smooth surface. We had crackinganyway. The first layer was cracking and the second layer as well. In the firstlayer we had cracking just around the ”I”beams despite the scotch tape and
201
netting. Around the doors and windows I wanted to put over cracks even muchfiner plastic mesh. Green mesh. Local professional said: ”Don’t do that”. Thiswas a man who worked with lime plaster before. ”Just add some cement” Hemixed the cement to plaster on the board in his hand and applied the mix overthe cracks. Now we have the light spots on plaster around the windows anddoors in places where the cement was added into it.
Is the second layer 10mm thick as well?
Yes. Sometimes it is little bit thicker because the surface was uneven. Weput the bales on edge and they were impossible to shave.
The last layer.
The last layer is the finishing. We also had few cracks in it. I was a bitconcern. Because of the wind and sun the plaster dried out in places so quickly,that it cracked. The air lime needs shading and slow dying process. It is alsopossible that it cracked in places where we applied the render too thick. Weapplied the third layer also by hand and then we massaged it into he wall withwooden plank.
Do you mean trowel?
Not with a trowel. Just with a plank. We got this way a really smoothsurface and stiffness. If you do that, the surface is getting more solid under thatplank. After few days some cracks appeared so I went around and rubbed thecracks in. This is the way to close it, because the drying process has been slow.It is still wet now. Just the surface is little bit dry, but under it—it is not dry,because of the air lime.
Are you going to limewash the walls as a final weather protection?
Yes. Also because of aesthetic reasons.
How many layers of limewash?
In the inside just one and in the outside three, four layers. One layer eachyear.
Thank you very much
202
Standing with Martin Oehlmann by the window in the straw balehouse under the construction in Plozevet. There is a stormy weatheroutside and rain in large quantities hits te window. The stormy At-lantic ocean is in close distance.
October 2005 (few weeks before the great storm that soaked the wallsall the way through)
Martin
Look at the waves over there (pointing at the ocean behind the window).
We have a lot of driving rain here.
Yes it is just coming over. The horizontal rain.
Do you think the lime plaster will withstand this?
Well, we will see. I hope so. I think so. This is the best test. I mean all theoverhangs will do anything in this sort of rain. Yes, but I’m quite confident Iwill put one limewash on and this will continue for few years. So this will beperfect.
203
A.4 Interview with Simon Ayres of Lime greenproducts ltd. and Bee Rowan of AmazonNails at Ecobuild 2006 in London.
Friday
Simon was supervising the spraying of one of his products, hydraulic lime readymix, on the walls of straw bale lecture theater built by Amazon Nails as acontemporary structure and demonstration project for the event.
How do you make lime breathable?
Lime is breathable. Different limes are differently breathable. The breath-able is down to not just the lime, is down to aggregates, the mix composition alots of things.
I heard that in medieval times people added blood into the mix tomake it more breathable.
In our ready mixes we add different stuff that does that sort of thing. Sothe soap agent will make tiny bubbles, there is a tallow or things like that.
What kind of sand do you use in your ready mixes?
It varies. In this particular product (referring to ready mix that has beensprayed on straw bale walls in front of us) there is a silica sand, some lime stoneand special aggregate which is recycled, which is only small percentage in thisone, but in other renders we have up to 60% recycled aggregate. It makes itlighter and more thermally efficient as well.
204
Sitting with Bee Rowan of Amazon Nails and Simon Ayres over thesample of lime plaster from Plozevet at Ecobuild 2006 in London.
Saturday
There are two Plozevet samples in front of us. One that was taken from thewooden post (”I” beam), the other sample was taken from the major part ofthe wall.
”the sand is local red sand ca. 3-4 mm. 1. layer: 1/2 airienne(Decochaux)= St. Astier + 1/2 hydraulique = Boehm natural NHL55 (ca. 1O-20 mm; 2. layer: 1 St. Astier airienne (Decochaux)20 mm;3. layer same as 2. ca. 3-5 mm working in with a taloche = plank.Same inside outside.” (M.Oehlmann, 2006)
How is the sand in this sample?
(Simon is crumbling sample of lime plaster from Plozevet in his hand.)French sands are in general better than our sands, for use with lime. The
grading; how well washed they are.
The sand that was used in Plozevet is nice sand. Clean.
I don’t know why they have sands which are good for use with lime.
Bee:(Also crumbling bit of plaster.)Sharp, well graded
Simon:Yeah. They use it with artificial hydraulic lime. In this country we have
in general finer, stogier less well washed sands. So I don’t think the sand is aproblem in this case.
Let’s say, they applied the lime, it’s a nice weather. They waituntil its hard, they apply another layer and another one. For howmany days has to weather sustain after that above 8◦C, in order tomake plaster withstand the frost and the kind of weather common inBrittany? Is it even possible for the lime to withstand this kind ofweather?
Brittany is pretty tough.
It is very tough.
I know because, similar render we’ve used on there (pointing at straw balelecture theater at ECOBUILT 2006), very similar is sold in France. Everywherein France it’s two coats, or just one coat, in Brittany it is three coats. And that’slike industrial render, modified type of render. It has got water preservative. It
205
is like a formulated product with a water repelents in it, with air drainers thatsort of thing. It’s called monocouche. And in Brittany they say especially onwest facing gables you put the third coat.
West facing. That’s it.So is it possible for lime plaster in general to withstand this kind
of weather?
Yes. We sell it in places like Scotland, Western Wales...
Do you think that it stops the driving rain from penetrating thewall? I experienced that rain there. It was enormous storm.
Bee:In North Yorkshire, we would never use this (pointing at the sample of plaster
from Plozevet on the table). We use non hydraulic lime that has a chance tofully carbonate. It’s amazing. In Clow Back, because of the wide windowsill,the nonstop wind is driving rain against the same spot on the wall the wholewinter and Bill Chaytor (the owner of Childerns farm in Clow Back—one of theprojects of Amazon Nails - ed. author) was incredibly worried. He had Barbara(Jones) come up to take the lime off, frightened that straw will be ruined. Sothey took off the lime and behind it the straw was bone dry. And that, inour experience, is how lime works, that is how it works in Scotland. If it iscarbonated, certainly non hydraulic lime, the ability to take that moisture inand release it, while protecting what is behind it, it’s remarkable. It fails whenit doesn’t carbonate.
Simon:Yeah. The carbonation needs right humidity, right temperature above 8◦C.
Average carbonation is about 2mm per month.
Bee:It’s a long time.
Simon:So if someone did that in September (pointing at the sample from Plozevet)
and the whole thing was nonhydraulic lime or air lime or hydrated lime whatever, That thick (50—60mm) in Brittany, in order to protect it, till spring inright conditions, really. It is going to carbonate for a long time.
Bee:If it is exposed place they need to look after it.
Simon:Or they have to start in spring.
206
What about pollution? I heard that pollution causes degradationof lime. What about pollution in the rain, or in the air?
Simon:Anything acidic will dissolve it, but there is no gypsum in lime, unlike in
cement. Portugees hydraulic lime has got 3-4% gypsum in it. Which is as muchas you find in cement. That is going to be affected by solfex, may be water born,or from the ground from wherever. But in general limes have better resistancethan cement. Look at Roman structures. Once they’v carbonated as Bee says,they’re normally pretty good for long time. They get better over time.
Do you put any kind of water resistant material into your mix-tures?
In our renders we do. In some. We put it into a natural render, as wedescribe a natural render. In a lime putty we don’t. In hydraulic lime mix theremight be included generally tallow or sterate. Commercially it is sterate, butit’s tallow.
For instance Cardiff castle. They were having a lot of problems actually overthe last few years. They spent five years try to repaint it and they had failures.Originally they had specified product which contained tallow. They had wallpaintings inside of tower, very hard rock, some sort of granite or something.Highest point in Cardiff roughly. A lot of wind driven rain off the Irish sea,Atlantic. Very important wall paintings inside and they got water penetration.They spent a lots of time and money researching on this. Initially they specifiedsomething with small amount of sterate or tallow in it. Unfortunately thecontractor thought he could skip that part. They did all sorts of other stuff. Itfailed and they got water penetration, so they are gone back to drawing boardand start it again. They have to redo their work with a bit of tallow in.
It can repel water, because water will run off something in droplet form.But with the wind as you say, the lime is generally more porous which allows itto breathe, but if you’ve got high pressure, the wind blowing in, it will get in ifyou’re not careful. It can make a significant difference.
Some people add lime wash, some people don’t. We don’t put limewash, wesay put another couple of coats on. But in some of the renders we do, we putit in.
Bee:How would you include it’s porosity and in the same time it would be water
resistant?
Simon:(Having the sample from from Plozevet in his hand)
207
Compare to sort of UK aggregate, this is going to be more porous, becauseit is better graded, low fines. If you imagine, on sides of motorways they usea low fines concrete sometimes against the curb. Water comes right throughit. That runs off from the road. It is just course aggregate. In the same wayyou’d the same thing with this, but you would have the great trouble in tryingto get the stuff on the wall, because it will reduce workability. But you can addcouple of things into it, that will give you back some sort of stodge, if you like,or body to the mortar. What the fines do, they give you body to the mix. Soif you imagine, you have course bits and fine bits. To make something moreporous you take some of the fines out. People in this country love using a dryscreened sand. Dry screened sand hasn’t been washed. It is full of clay and silt.Makes very quick ice cream mix. It is very dense nonbreathable mix becauseof that clay and silt in there. If you have got some clay or silt in it, it is notporous. But this is more porous (referring to sample of render from Plozevet).It doesn’t have that bottom end if you like. That end makes it very workableand creamy. So you can remove that, you can add a cellulose. For instance wehad a cellulose back in and starch and they give you sort of body to it.
Does it also prevent cracking, because with the cellulose you addfiber into it?
Getting a sand absolutely right prevents cracking. I’d be surprised if there isa lot of shrinkage in that type of sand. (refering to sample from Plozevet). Theother thing is, that lime is always more breathable than sand. In general. If youuse lime putty 1:2, the researchers say that it is more breathable than 1:3. Butit depends. It depends on sand, depends on the clay content. I know companiesthat sell 1:3 mix for plastering, but their sand may have more fines in it orsomething like that. In general we use very well washed sand in proportion 1:2.It makes it more porous, carbonates more quickly. I’v been seeing jobs quitewell known in Wales, that used A sands A lime that was actually hydraulic limeand it wasn’t going off. What happened? They basically left very tight surfaceover the render. Not really like that (pointing at the sample from Plozevet) andthe sand was full of clay. They sort of floated all the clay up to the surface. Theclay was forming sort of film over the render. It was taking long time to go off.That is another thing to watch out. Clay is really quite bad. Potentially quitebad. Some people are mixing it in...
You wouldn’t recommend it?
It’s knowing is there. For instance if you’re mixing hydraulic lime and airlime, if you know that it is going to work, if you know how it performs andyou’ve done it lots of times, then you know for instance that in September youdon’t want to be doing it. It is the same with clay, If you know the mix has clayin it, it is going to shrink a bit and that sort of thing. We know people they’vehad huge problems with that in a past. Clay is a binder and it’s quite cheap forpeople to include sand as an aggregate which has clay already in it, because itsaves on the expensive bit, which is lime or cement. If you know it is in there,you can be aware.
208
You wouldn’t probably finish it smooth so that clay comes out...
Precisely. You might put on thinner coats, you might do all sorts of stuff.It is safer not to do it, but it gets quite complex to be honest. Lime is verydifficult product to get right, because you are trying to use something as softas possible, but soft and breathable. So as soft and as breathable as possible inharsh environment. Cement is quite easy. It just goes off and goes rock hard.With lime it is quite thin line you’re threading and there is a lot of ways whichcan go wrong.
Thank you both very much.
209

Appendix B
Tables
210
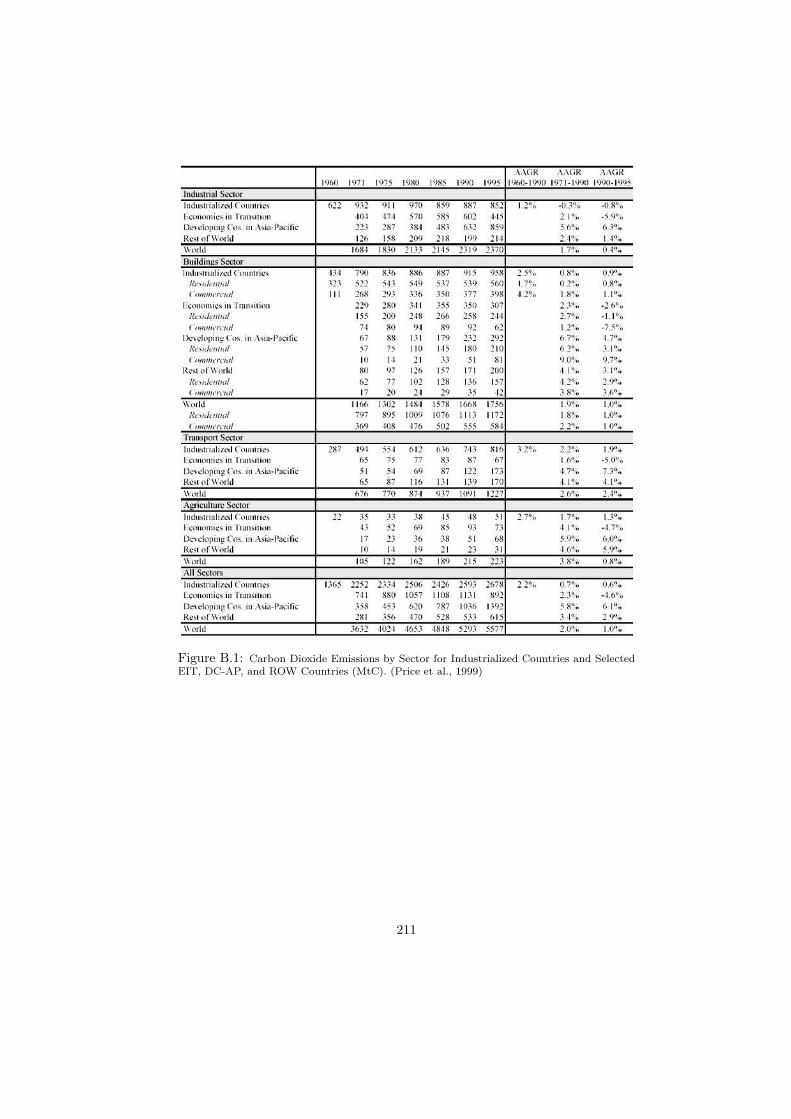
Figure B.1: Carbon Dioxide Emissions by Sector for Industrialized Countries and SelectedEIT, DC-AP, and ROW Countries (MtC). (Price et al., 1999)
211
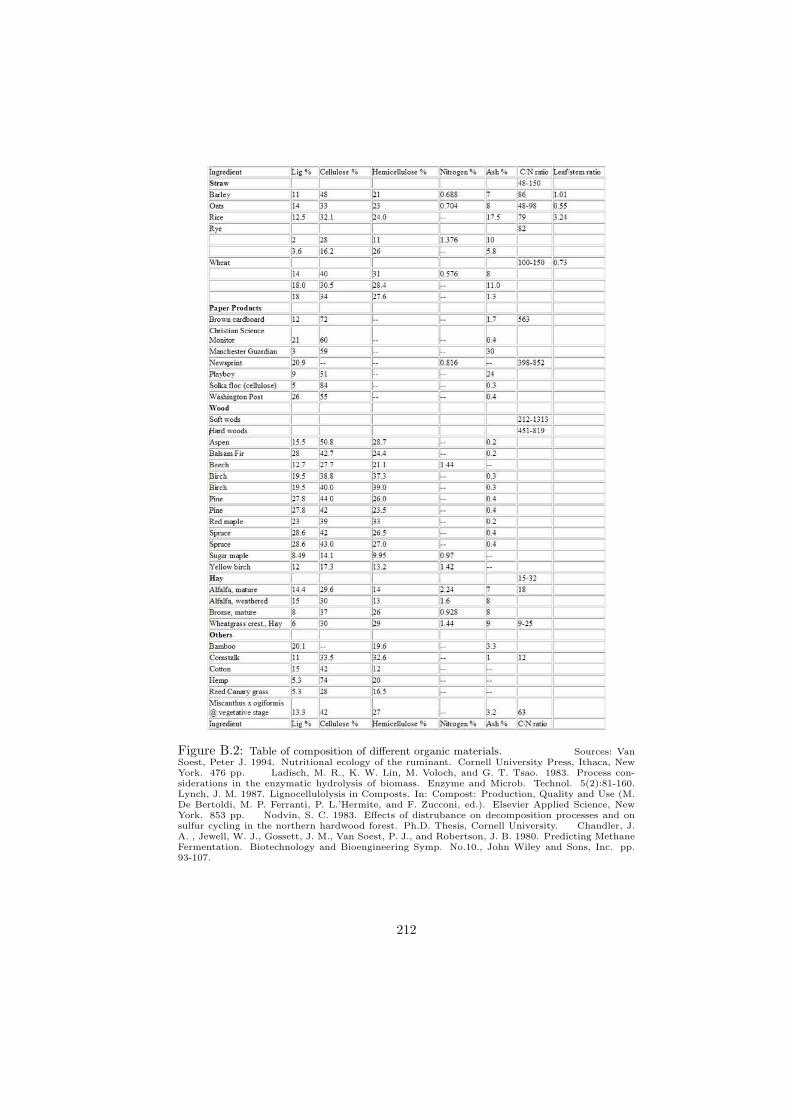
Figure B.2: Table of composition of different organic materials. Sources: VanSoest, Peter J. 1994. Nutritional ecology of the ruminant. Cornell University Press, Ithaca, NewYork. 476 pp. Ladisch, M. R., K. W. Lin, M. Voloch, and G. T. Tsao. 1983. Process con-siderations in the enzymatic hydrolysis of biomass. Enzyme and Microb. Technol. 5(2):81-160.Lynch, J. M. 1987. Lignocellulolysis in Composts. In: Compost: Production, Quality and Use (M.De Bertoldi, M. P. Ferranti, P. L.’Hermite, and F. Zucconi, ed.). Elsevier Applied Science, NewYork. 853 pp. Nodvin, S. C. 1983. Effects of distrubance on decomposition processes and onsulfur cycling in the northern hardwood forest. Ph.D. Thesis, Cornell University. Chandler, J.A. , Jewell, W. J., Gossett, J. M., Van Soest, P. J., and Robertson, J. B. 1980. Predicting MethaneFermentation. Biotechnology and Bioengineering Symp. No.10., John Wiley and Sons, Inc. pp.93-107.
212
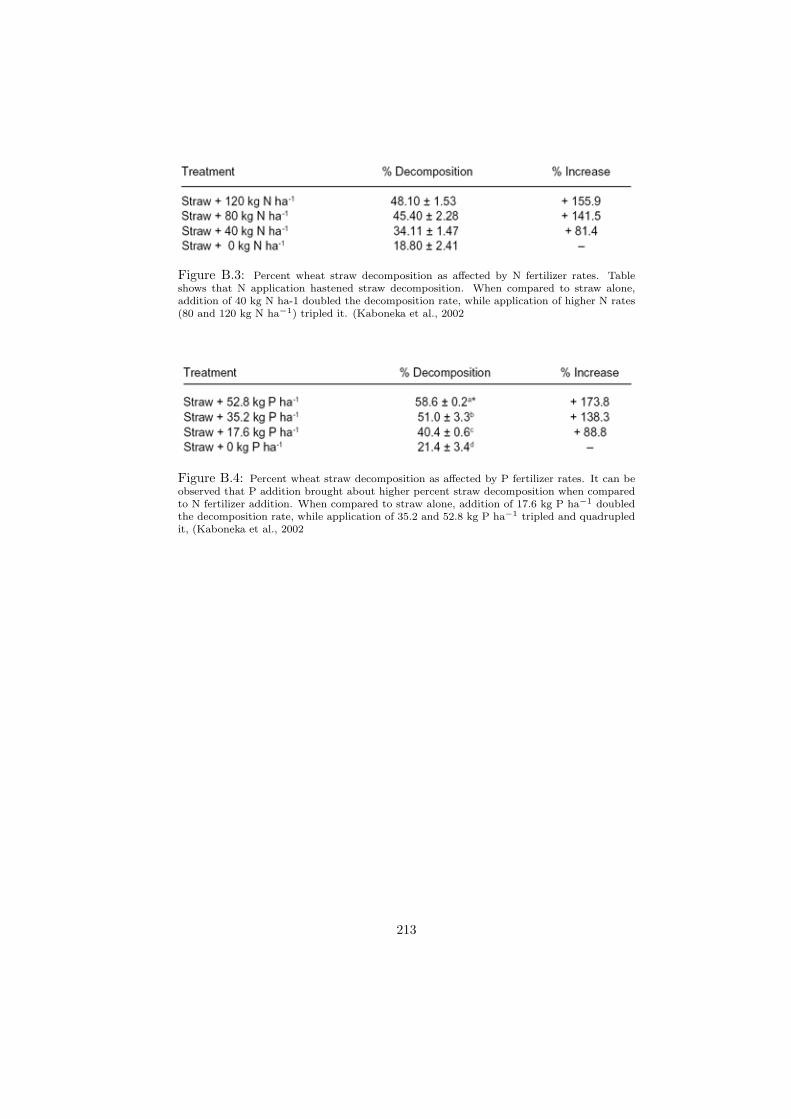
Figure B.3: Percent wheat straw decomposition as affected by N fertilizer rates. Tableshows that N application hastened straw decomposition. When compared to straw alone,addition of 40 kg N ha-1 doubled the decomposition rate, while application of higher N rates(80 and 120 kg N ha−1) tripled it. (Kaboneka et al., 2002
Figure B.4: Percent wheat straw decomposition as affected by P fertilizer rates. It can beobserved that P addition brought about higher percent straw decomposition when comparedto N fertilizer addition. When compared to straw alone, addition of 17.6 kg P ha−1 doubledthe decomposition rate, while application of 35.2 and 52.8 kg P ha−1 tripled and quadrupledit, (Kaboneka et al., 2002
213
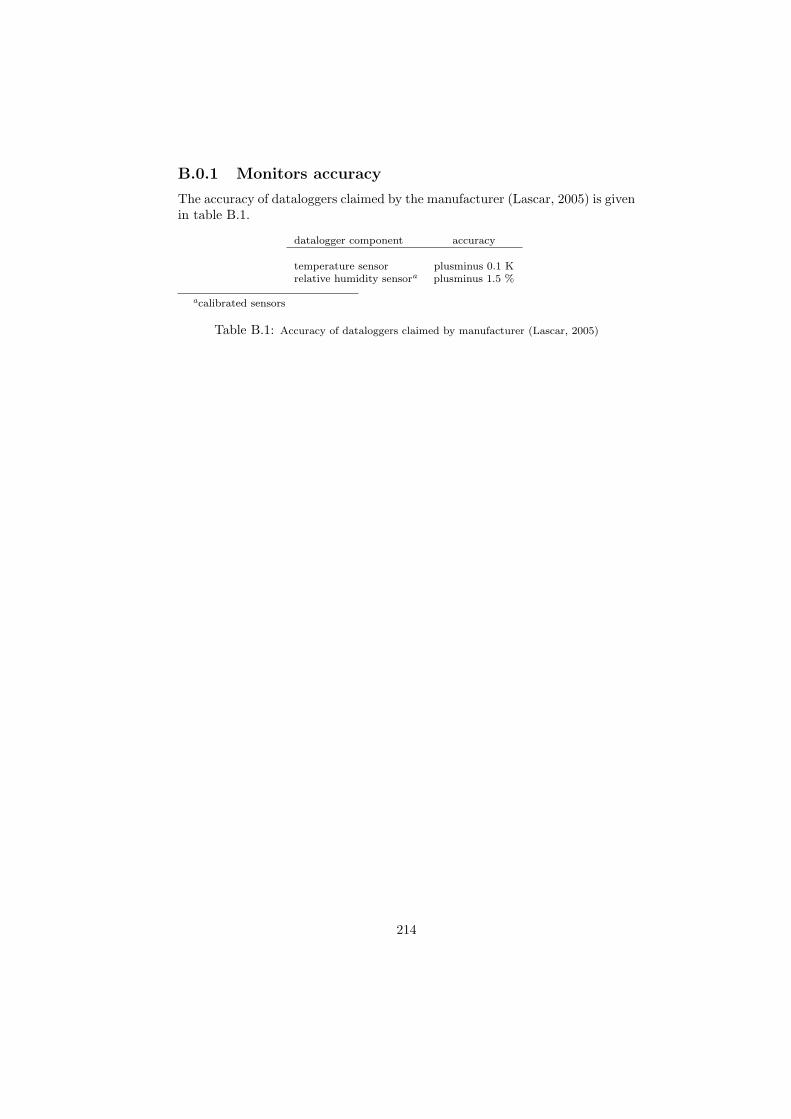
B.0.1 Monitors accuracy
The accuracy of dataloggers claimed by the manufacturer (Lascar, 2005) is givenin table B.1.
datalogger component accuracy
temperature sensor plusminus 0.1 Krelative humidity sensora plusminus 1.5 %
acalibrated sensors
Table B.1: Accuracy of dataloggers claimed by manufacturer (Lascar, 2005)
214
B.0.2 Tables of material properties
215
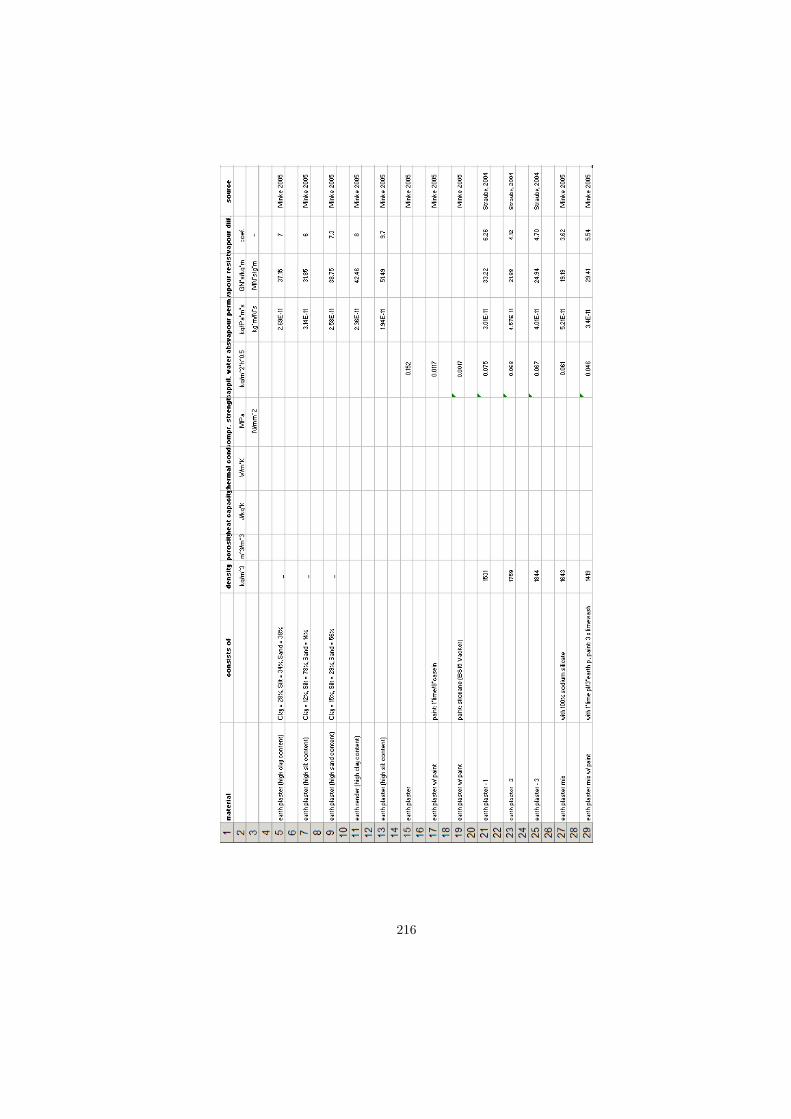
216
217
218
219
220
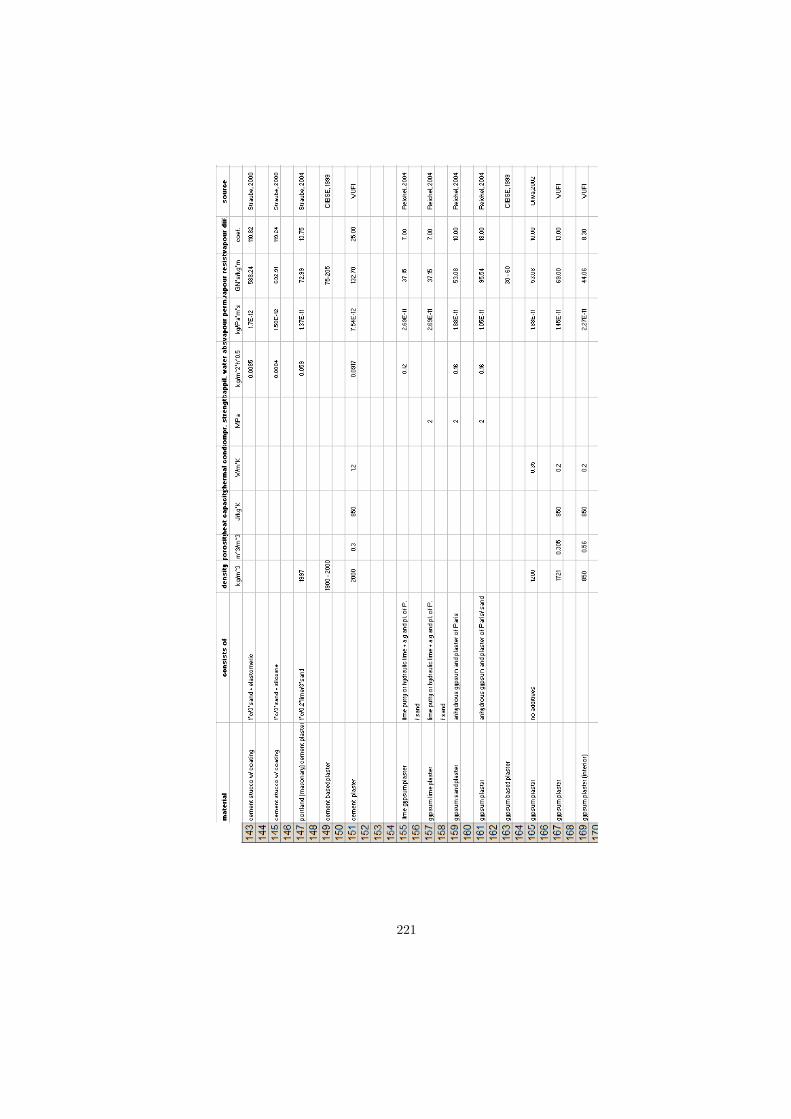
221
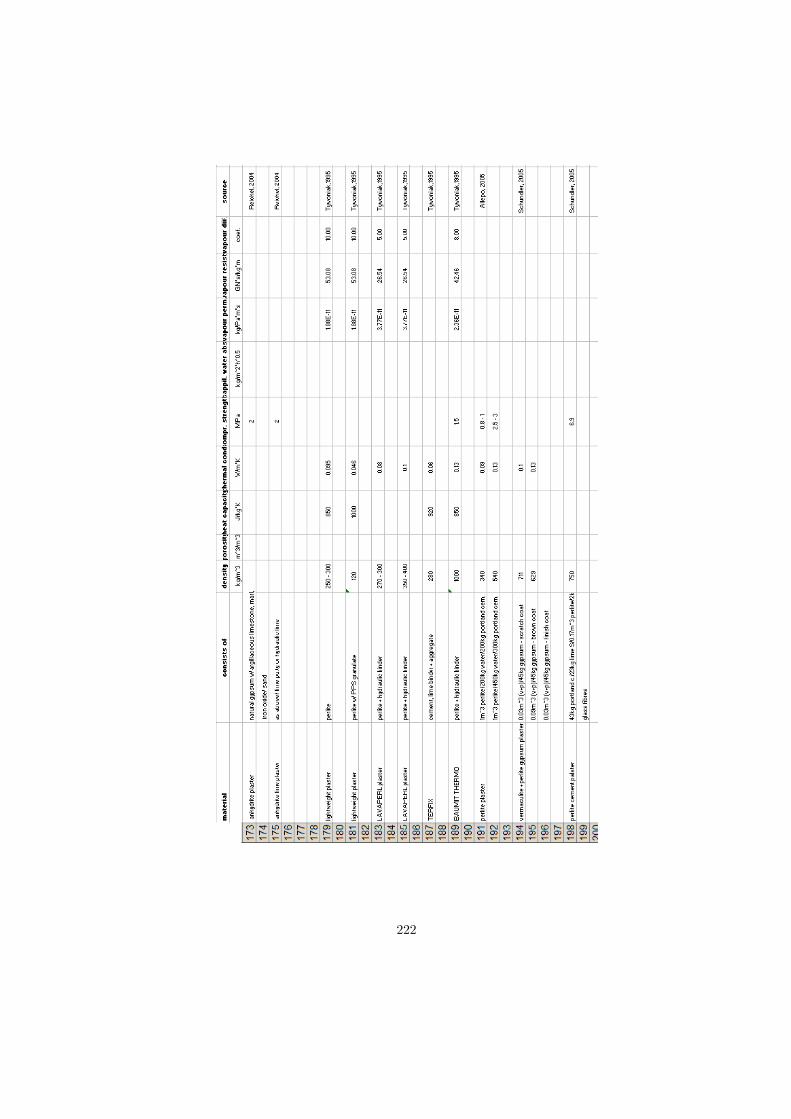
222
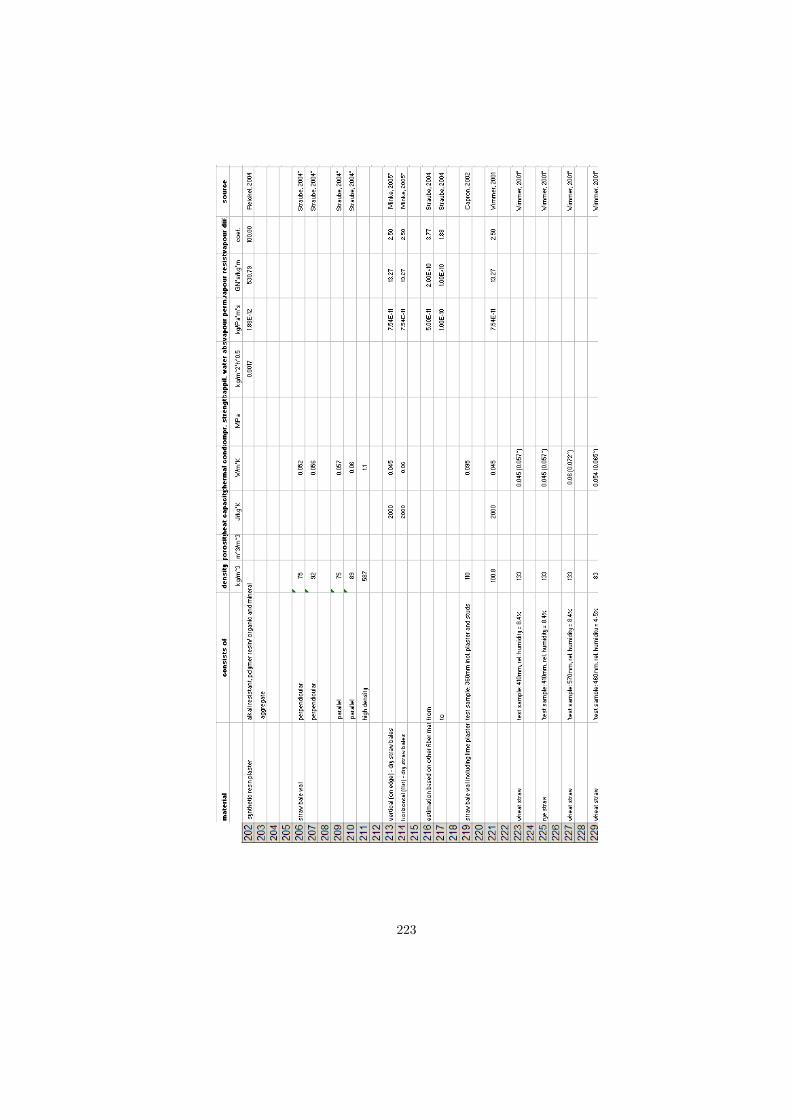
223

224
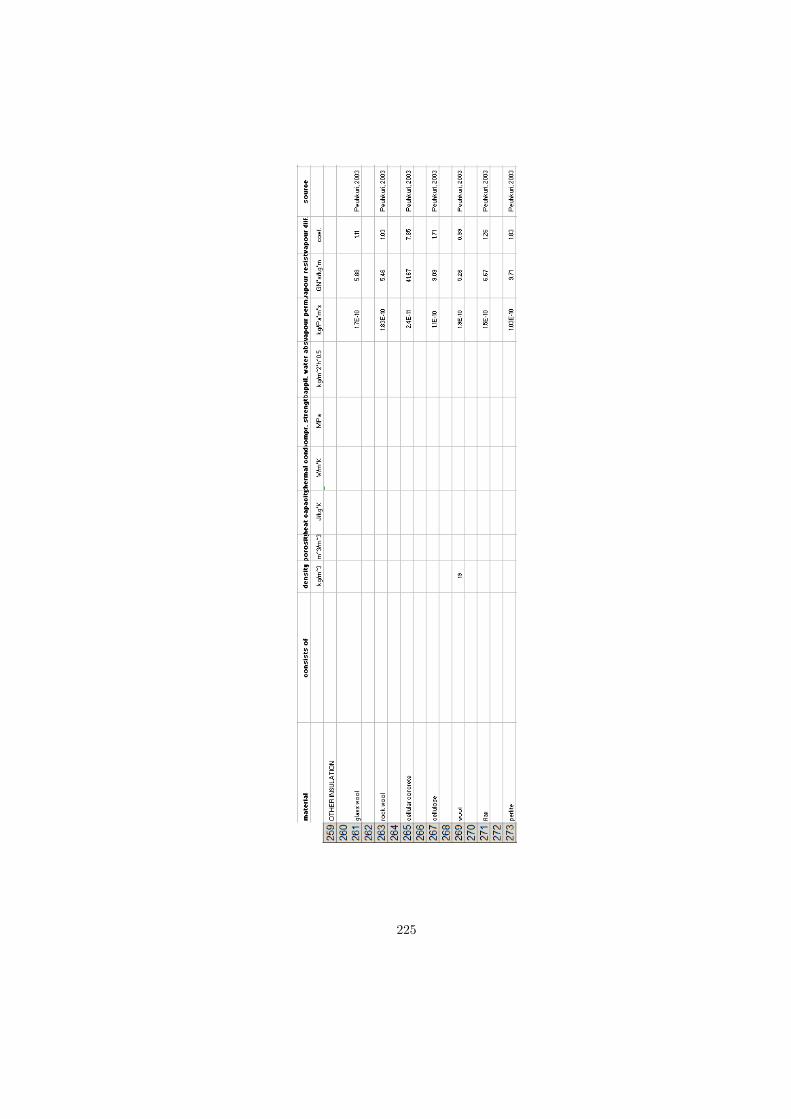
225
226

B.0.3 Summary of case study investigation
227
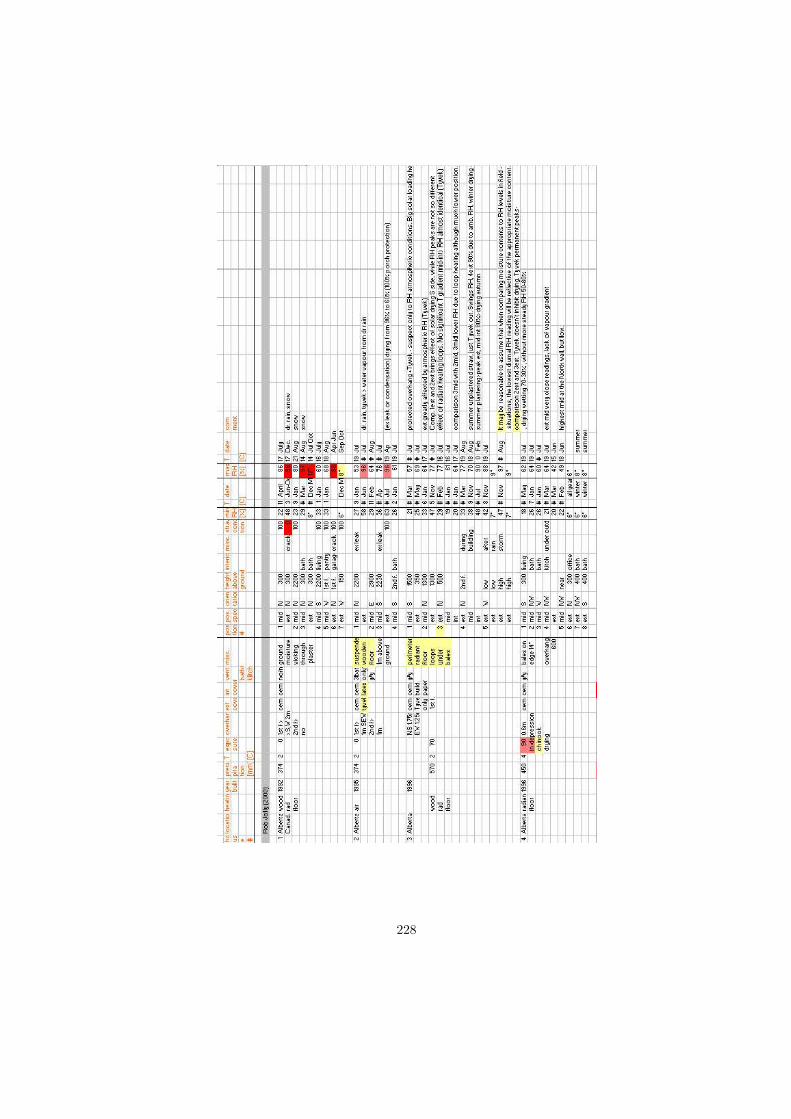
228
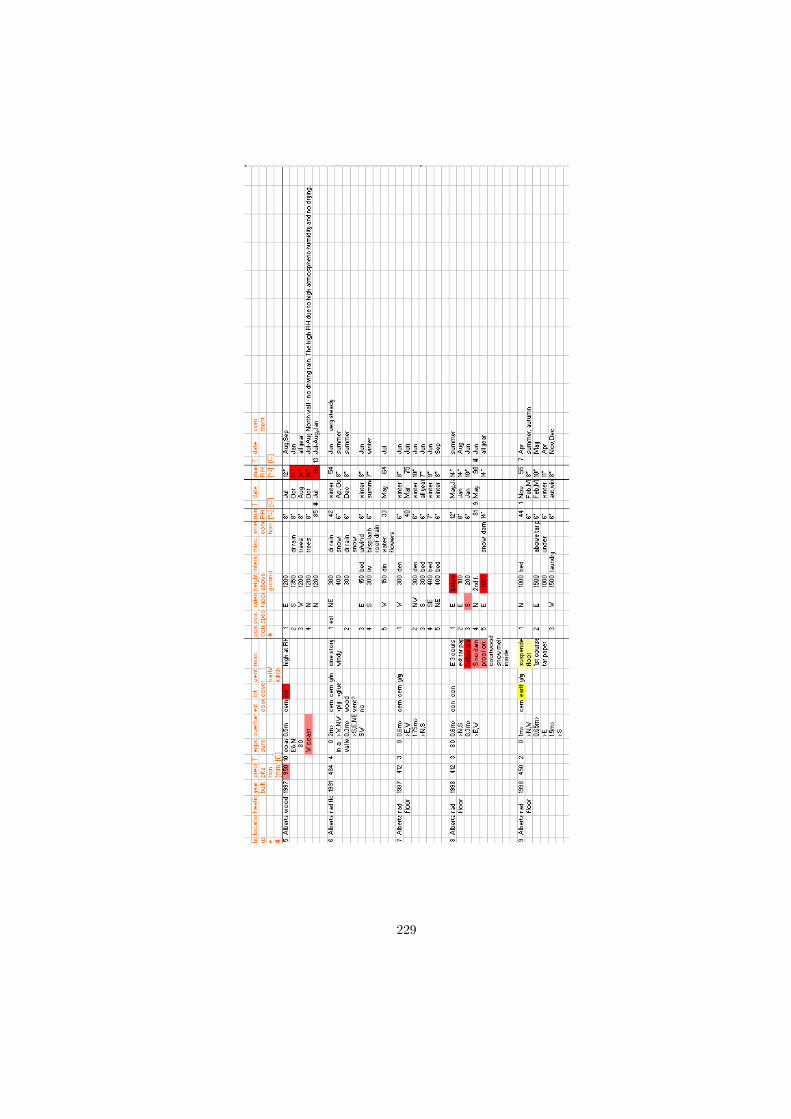
229
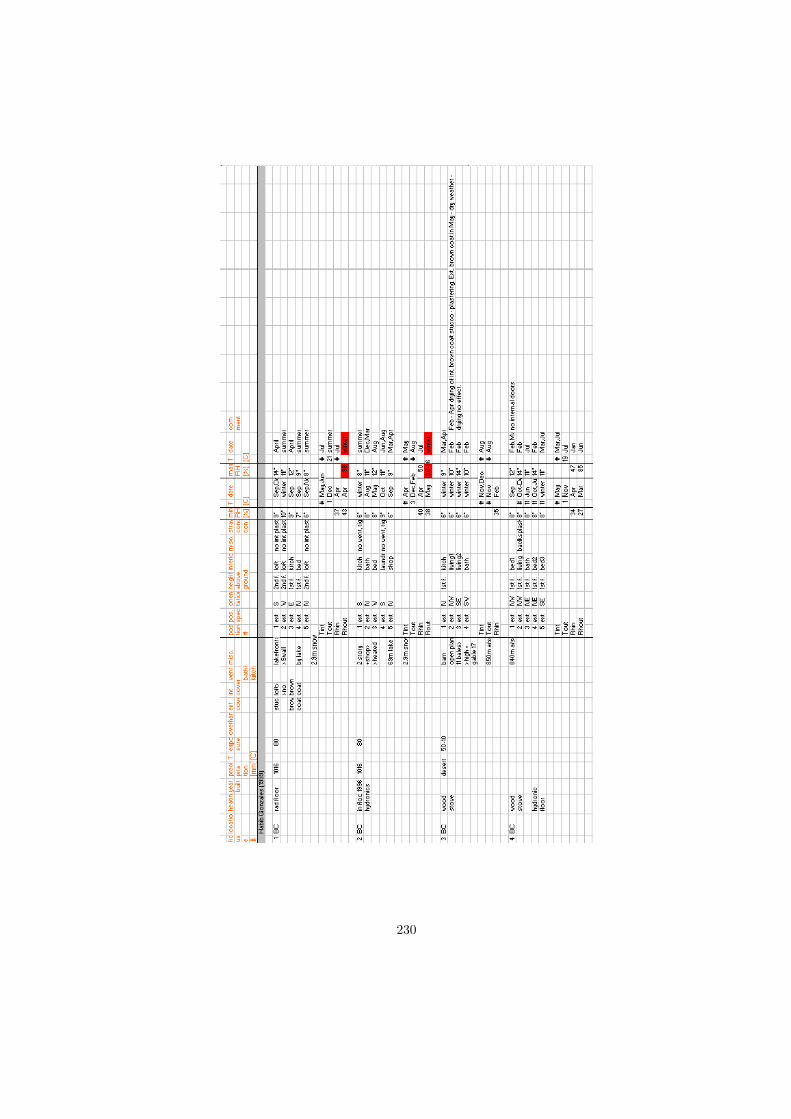
230
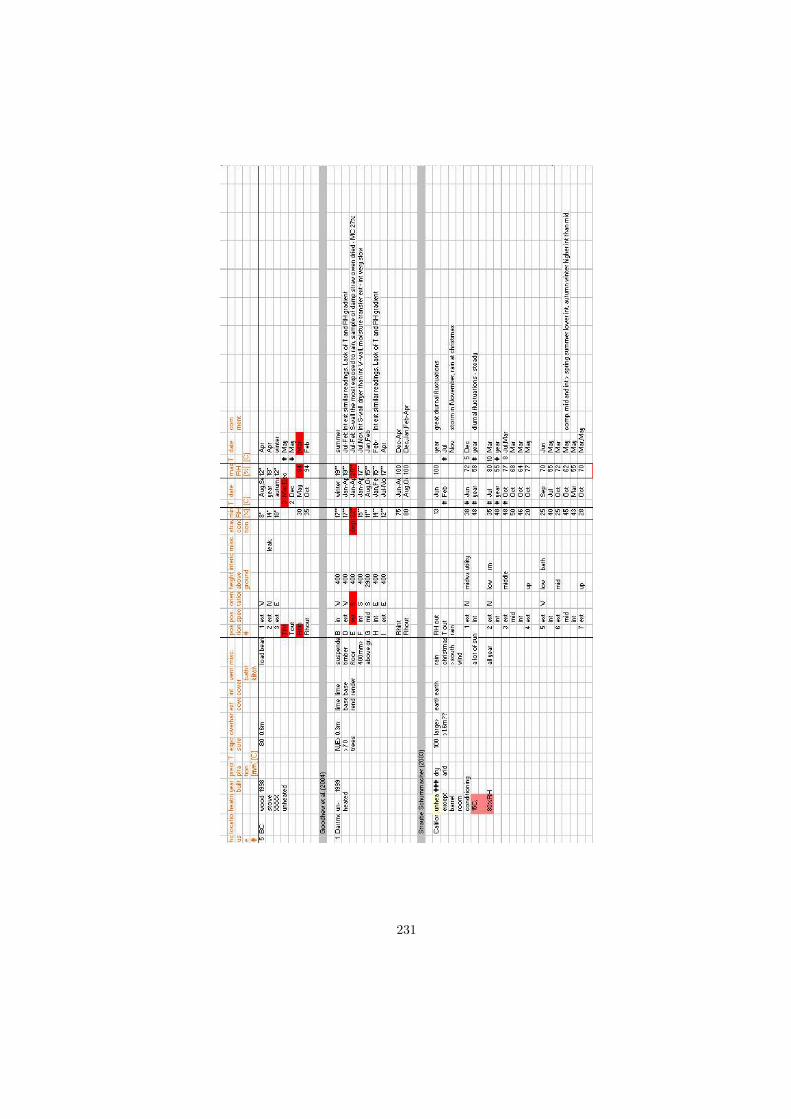
231
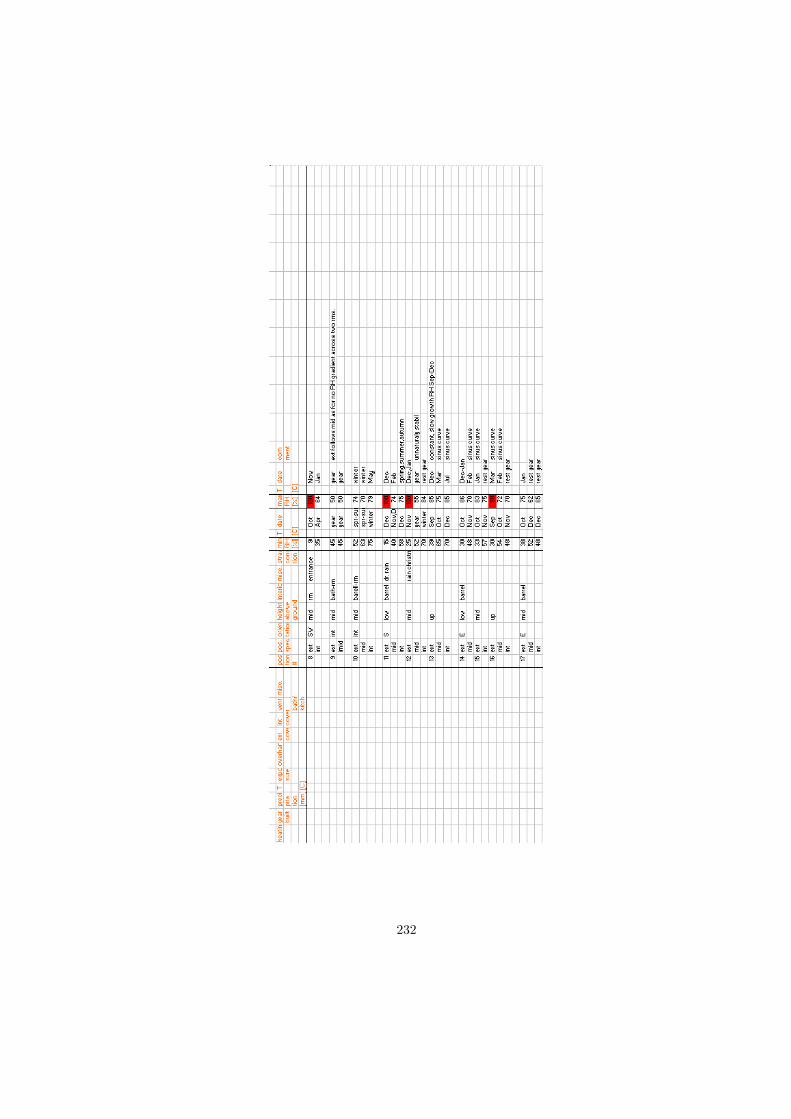
232

Appendix C
Illustrations
233
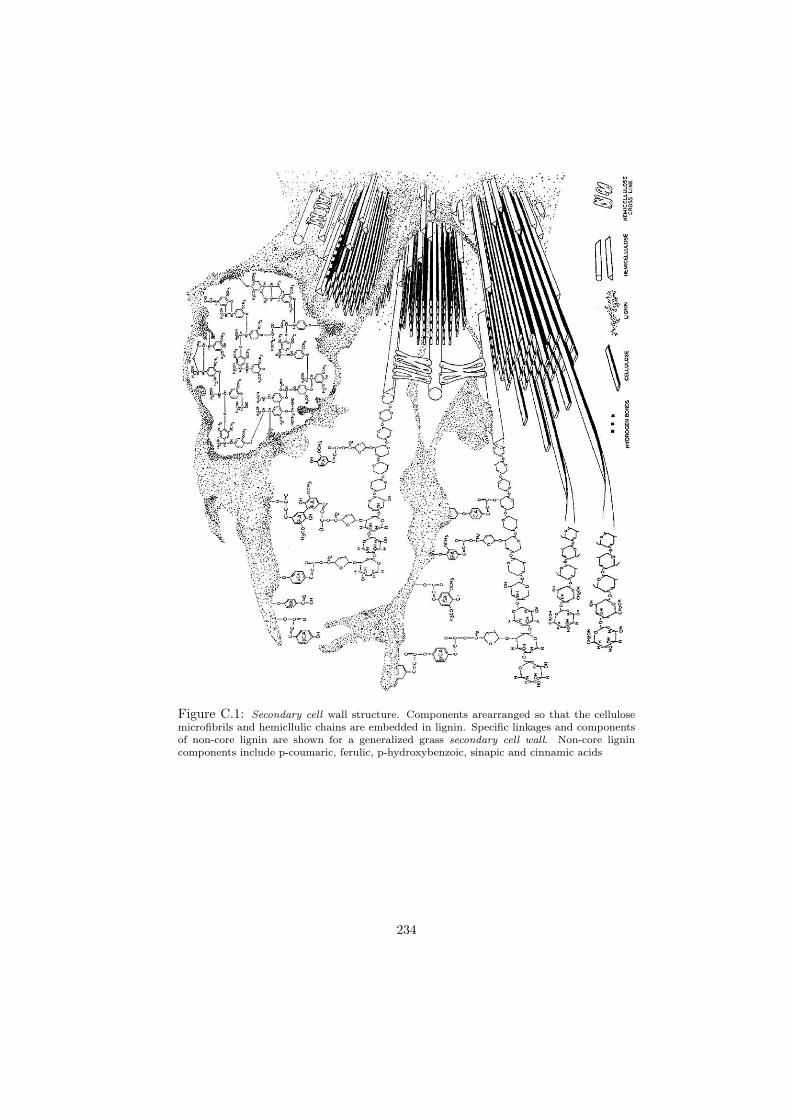
Figure C.1: Secondary cell wall structure. Components arearranged so that the cellulosemicrofibrils and hemicllulic chains are embedded in lignin. Specific linkages and componentsof non-core lignin are shown for a generalized grass secondary cell wall. Non-core lignincomponents include p-coumaric, ferulic, p-hydroxybenzoic, sinapic and cinnamic acids
234
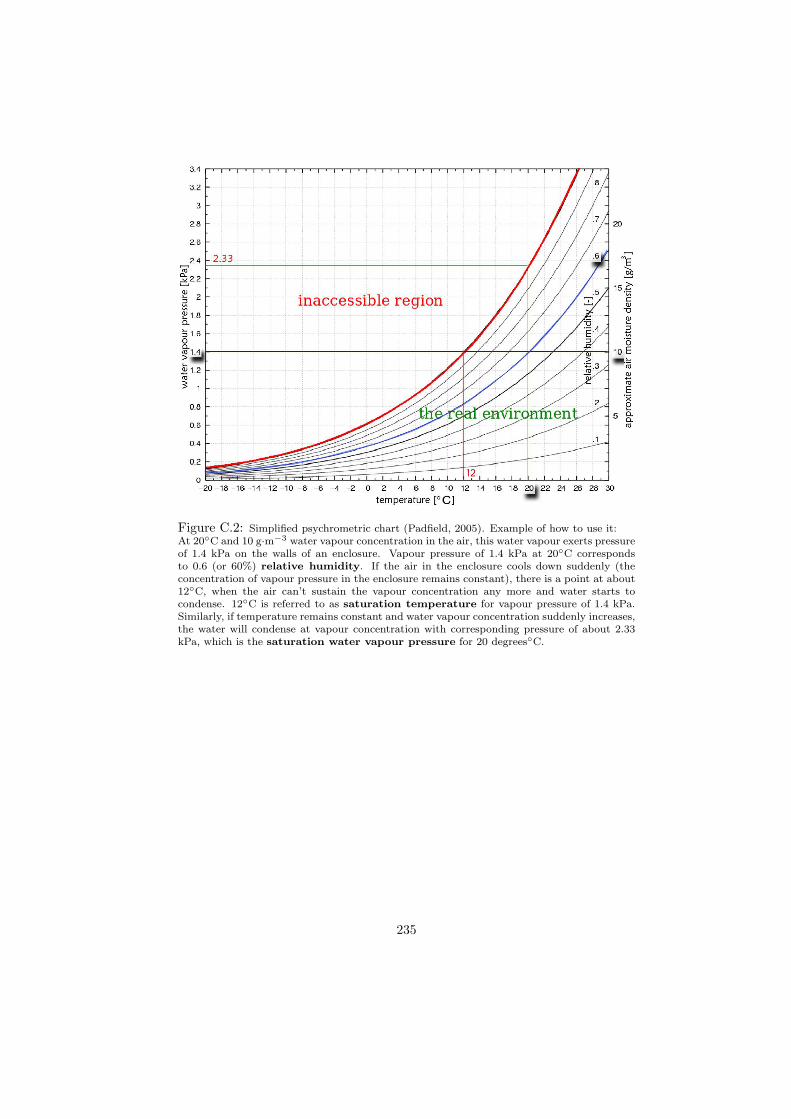
Figure C.2: Simplified psychrometric chart (Padfield, 2005). Example of how to use it:At 20◦C and 10 g·m−3 water vapour concentration in the air, this water vapour exerts pressureof 1.4 kPa on the walls of an enclosure. Vapour pressure of 1.4 kPa at 20◦C correspondsto 0.6 (or 60%) relative humidity. If the air in the enclosure cools down suddenly (theconcentration of vapour pressure in the enclosure remains constant), there is a point at about12◦C, when the air can’t sustain the vapour concentration any more and water starts tocondense. 12◦C is referred to as saturation temperature for vapour pressure of 1.4 kPa.Similarly, if temperature remains constant and water vapour concentration suddenly increases,the water will condense at vapour concentration with corresponding pressure of about 2.33kPa, which is the saturation water vapour pressure for 20 degrees◦C.
235
Appendix D
Calibration of moisturemeters
The relative humidity above surface of a solution is less than above the sur-face of a pure water, which is always 100%. It’s value depends on the natureof the solution. This physical phenomenon was explained in the section 3.8.The relative humidity above solution of table salt (sodium chloride) is at roomtemperature 75.7% (Padfield, 2005).
All dataloggers and thermo/hygrometers used in this thesis were calibratedby measuring the relative humidity above the surface of saturated table saltsolution. The dry salt was spread in 3mm thick layer along the bottom of aplastic container. The water was mixed into the crystals of table salt until themixture reached a muddy texture. The dataloggers and hygro/thermo meterswere placed above the solution on perforated tray within the container andthe container was hermetically sealed. After about 30 minutes the containerwas opened and the measured data were compared with known value of 75.7%relative humidity.
236
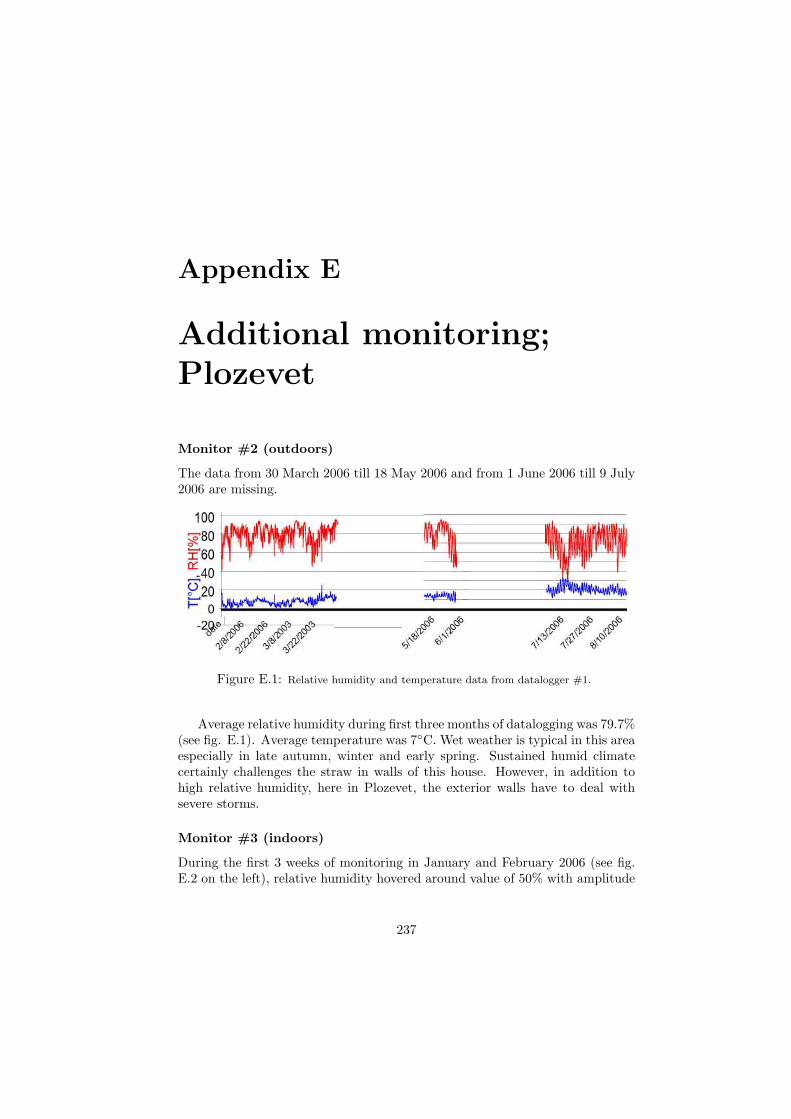
Appendix E
Additional monitoring;Plozevet
Monitor #2 (outdoors)
The data from 30 March 2006 till 18 May 2006 and from 1 June 2006 till 9 July2006 are missing.
Figure E.1: Relative humidity and temperature data from datalogger #1.
Average relative humidity during first three months of datalogging was 79.7%(see fig. E.1). Average temperature was 7◦C. Wet weather is typical in this areaespecially in late autumn, winter and early spring. Sustained humid climatecertainly challenges the straw in walls of this house. However, in addition tohigh relative humidity, here in Plozevet, the exterior walls have to deal withsevere storms.
Monitor #3 (indoors)
During the first 3 weeks of monitoring in January and February 2006 (see fig.E.2 on the left), relative humidity hovered around value of 50% with amplitude
237
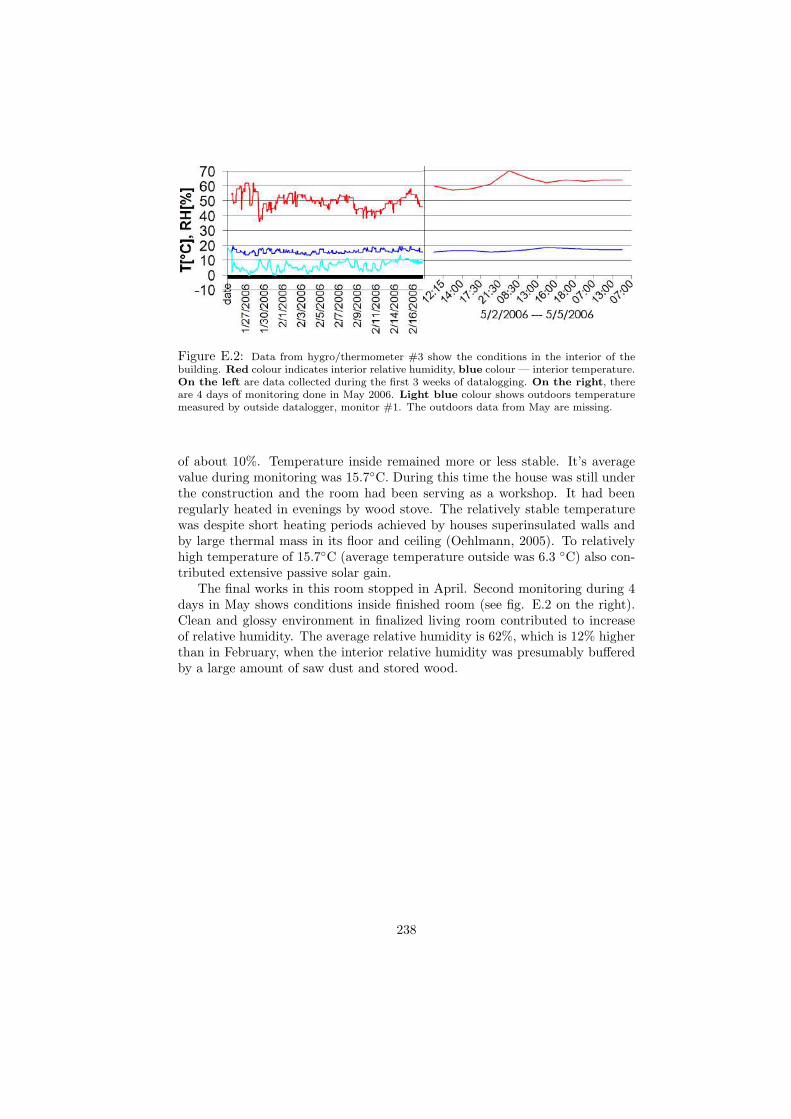
Figure E.2: Data from hygro/thermometer #3 show the conditions in the interior of thebuilding. Red colour indicates interior relative humidity, blue colour — interior temperature.On the left are data collected during the first 3 weeks of datalogging. On the right, thereare 4 days of monitoring done in May 2006. Light blue colour shows outdoors temperaturemeasured by outside datalogger, monitor #1. The outdoors data from May are missing.
of about 10%. Temperature inside remained more or less stable. It’s averagevalue during monitoring was 15.7◦C. During this time the house was still underthe construction and the room had been serving as a workshop. It had beenregularly heated in evenings by wood stove. The relatively stable temperaturewas despite short heating periods achieved by houses superinsulated walls andby large thermal mass in its floor and ceiling (Oehlmann, 2005). To relativelyhigh temperature of 15.7◦C (average temperature outside was 6.3 ◦C) also con-tributed extensive passive solar gain.
The final works in this room stopped in April. Second monitoring during 4days in May shows conditions inside finished room (see fig. E.2 on the right).Clean and glossy environment in finalized living room contributed to increaseof relative humidity. The average relative humidity is 62%, which is 12% higherthan in February, when the interior relative humidity was presumably bufferedby a large amount of saw dust and stored wood.
238
Appendix F
Adjustment of interiorinput data from monitor#4; Blanden
Before running the simulation by WUFI, the interior input data from monitor#4 had to be adjusted.
Fig. 4.23 (see Section 4.2.2) shows that the datalogger (monitor #4) wasplaced just under the ceiling in the interior of the bathroom. The internalmonitors #1,2,3 were on the other hand buried in the wall approximately 1.3mabove the floor level. This difference in hight of monitor positions made adifference in readings. For the most accurate simulation output, WUFI requiresambient relative humidity and temperature input data collected as close to thelocation of internal monitors as possible. Thanks to the stratification1 of relativehumidity and temperature, the monitor #4 under the ceiling (approximately2.6m above the floor) measured unfortunately different values in comparison tothe values that appeared 1.3m above the floor level and thus provided inadequateinput.
The additional measuring was performed year later, in January 2007, bythe house keeper. It provided the differential analysis of relative humidity andtemperature data measured just under the ceiling (in the position of formermonitor #4) with values measured next to the place where the internal monitors#1,2,3 had been buried. It was observed that monitor #4 under the ceiling readmore or less constantly higher temperature of about 6 C◦ and lower relativehumidity of about 9% in comparison with the location next to the place offormer internal monitors #1,2,3—1.3m above the floor level.
1horizontal redistribution within an enclosed space
239

Appendix G
Calculations
240
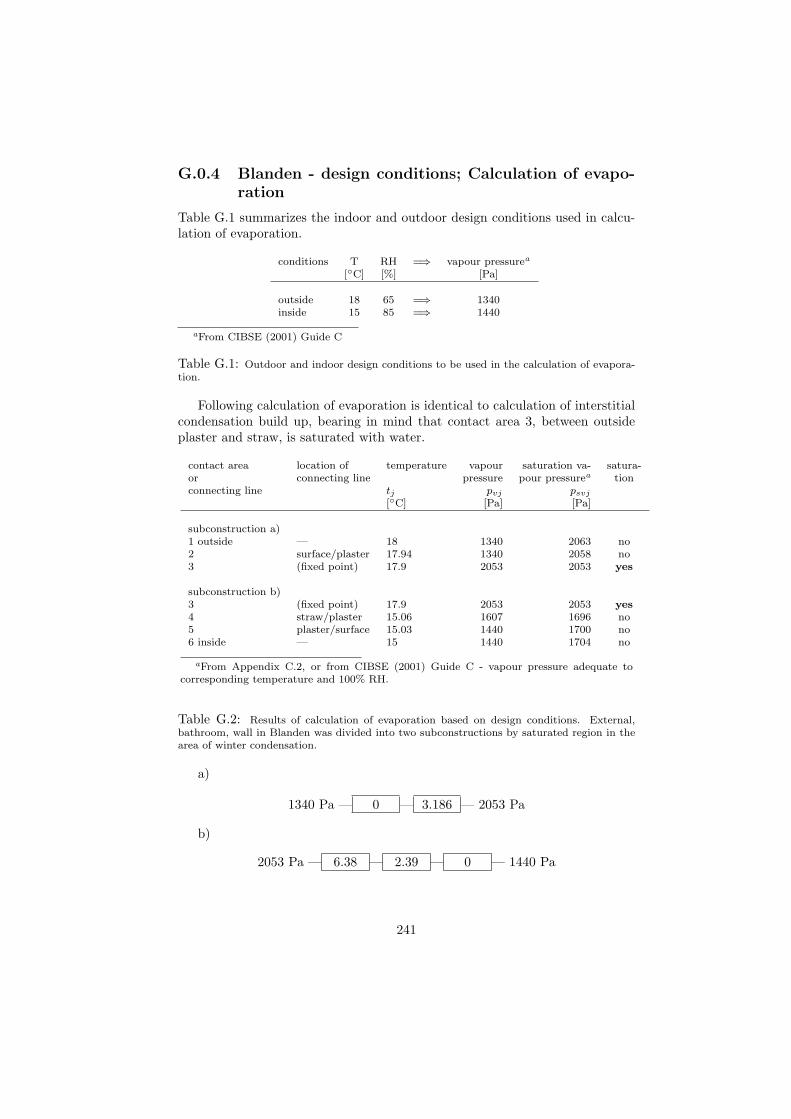
G.0.4 Blanden - design conditions; Calculation of evapo-ration
Table G.1 summarizes the indoor and outdoor design conditions used in calcu-lation of evaporation.
conditions T RH =⇒ vapour pressurea
[◦C] [%] [Pa]
outside 18 65 =⇒ 1340inside 15 85 =⇒ 1440
aFrom CIBSE (2001) Guide C
Table G.1: Outdoor and indoor design conditions to be used in the calculation of evapora-tion.
Following calculation of evaporation is identical to calculation of interstitialcondensation build up, bearing in mind that contact area 3, between outsideplaster and straw, is saturated with water.
contact area location of temperature vapour saturation va- satura-or connecting line pressure pour pressurea tionconnecting line tj pvj psvj
[◦C] [Pa] [Pa]
subconstruction a)1 outside — 18 1340 2063 no2 surface/plaster 17.94 1340 2058 no3 (fixed point) 17.9 2053 2053 yes
subconstruction b)3 (fixed point) 17.9 2053 2053 yes4 straw/plaster 15.06 1607 1696 no5 plaster/surface 15.03 1440 1700 no6 inside — 15 1440 1704 no
aFrom Appendix C.2, or from CIBSE (2001) Guide C - vapour pressure adequate tocorresponding temperature and 100% RH.
Table G.2: Results of calculation of evaporation based on design conditions. External,bathroom, wall in Blanden was divided into two subconstructions by saturated region in thearea of winter condensation.
a)
1340 Pa — 0 — 3.186 — 2053 Pa
b)
2053 Pa — 6.38 — 2.39 — 0 — 1440 Pa
241
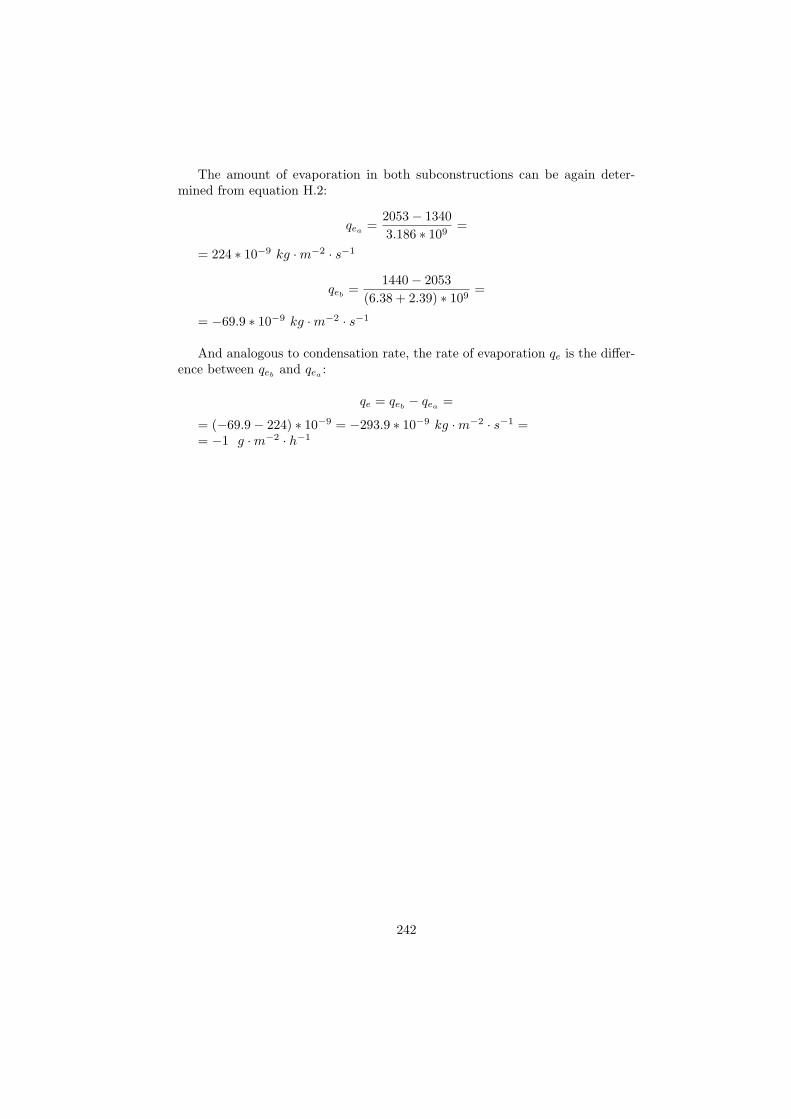
The amount of evaporation in both subconstructions can be again deter-mined from equation H.2:
qea =2053− 13403.186 ∗ 109
=
= 224 ∗ 10−9 kg ·m−2 · s−1
qeb=
1440− 2053(6.38 + 2.39) ∗ 109
=
= −69.9 ∗ 10−9 kg ·m−2 · s−1
And analogous to condensation rate, the rate of evaporation qe is the differ-ence between qeb
and qea :
qe = qeb− qea
=
= (−69.9− 224) ∗ 10−9 = −293.9 ∗ 10−9 kg ·m−2 · s−1 == −1 g ·m−2 · h−1
242
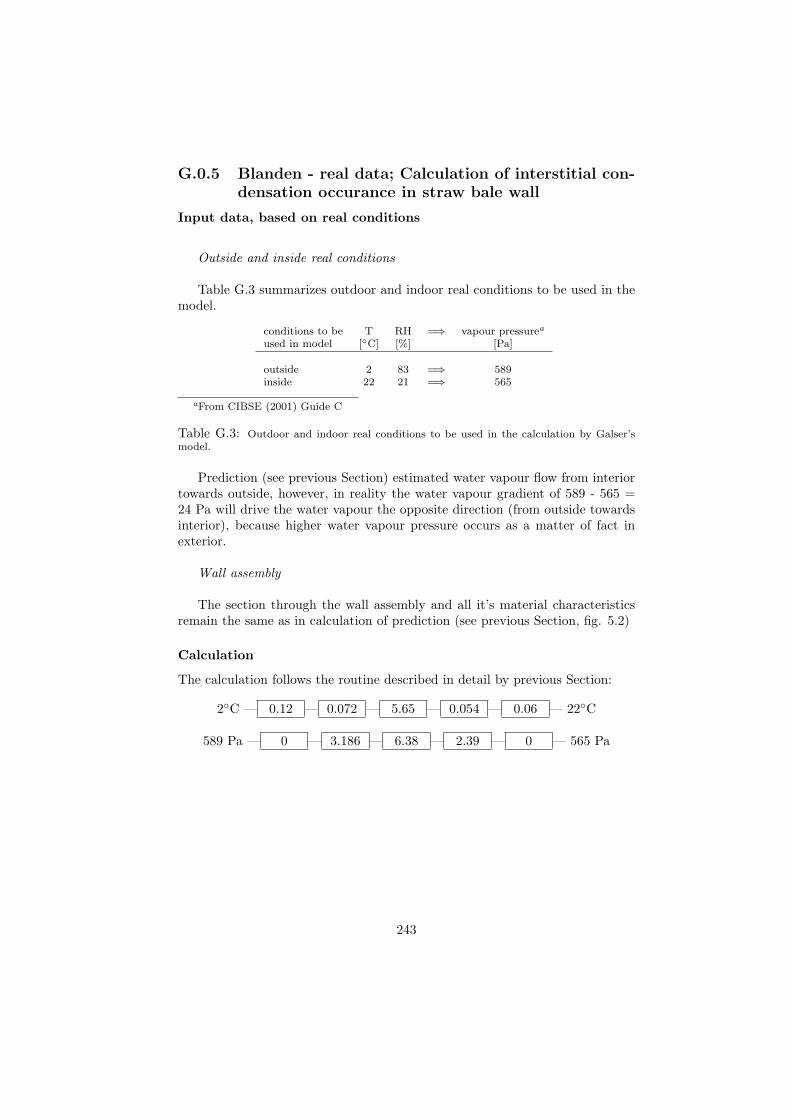
G.0.5 Blanden - real data; Calculation of interstitial con-densation occurance in straw bale wall
Input data, based on real conditions
Outside and inside real conditions
Table G.3 summarizes outdoor and indoor real conditions to be used in themodel.
conditions to be T RH =⇒ vapour pressurea
used in model [◦C] [%] [Pa]
outside 2 83 =⇒ 589inside 22 21 =⇒ 565
aFrom CIBSE (2001) Guide C
Table G.3: Outdoor and indoor real conditions to be used in the calculation by Galser’smodel.
Prediction (see previous Section) estimated water vapour flow from interiortowards outside, however, in reality the water vapour gradient of 589 - 565 =24 Pa will drive the water vapour the opposite direction (from outside towardsinterior), because higher water vapour pressure occurs as a matter of fact inexterior.
Wall assembly
The section through the wall assembly and all it’s material characteristicsremain the same as in calculation of prediction (see previous Section, fig. 5.2)
Calculation
The calculation follows the routine described in detail by previous Section:
2◦C — 0.12 — 0.072 — 5.65 — 0.054 — 0.06 — 22◦C
589 Pa — 0 — 3.186 — 6.38 — 2.39 — 0 — 565 Pa
243
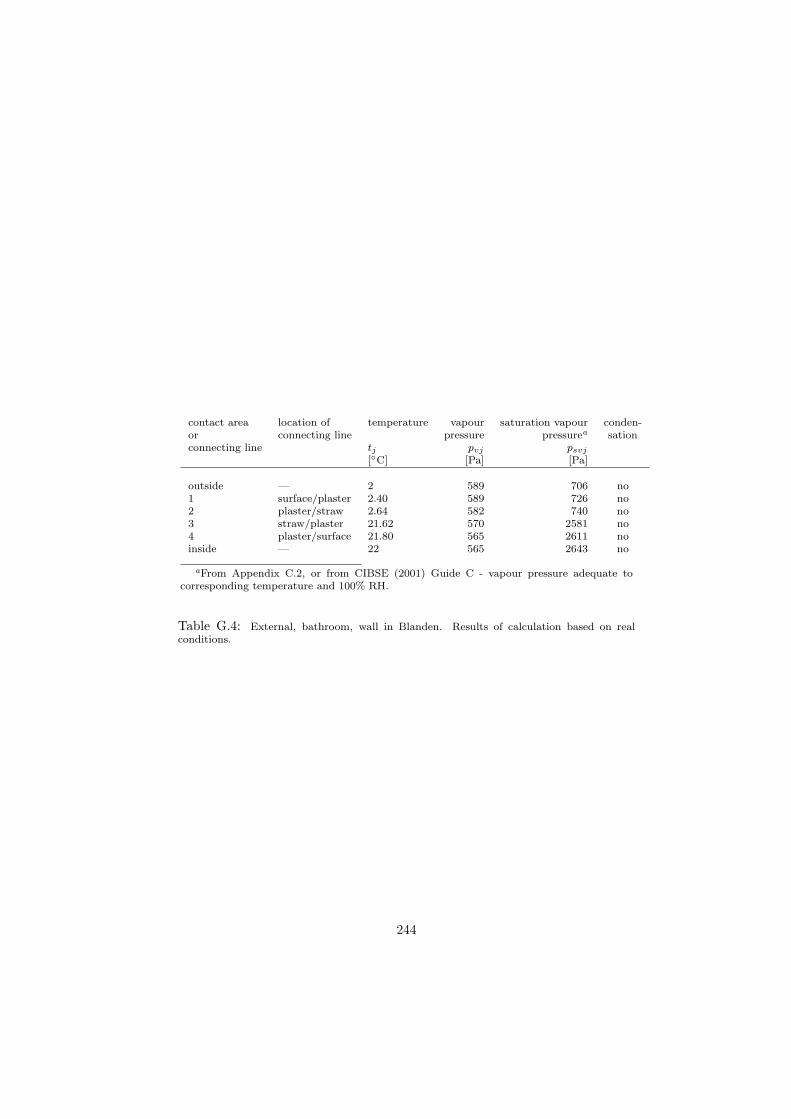
contact area location of temperature vapour saturation vapour conden-or connecting line pressure pressurea sationconnecting line tj pvj psvj
[◦C] [Pa] [Pa]
outside — 2 589 706 no1 surface/plaster 2.40 589 726 no2 plaster/straw 2.64 582 740 no3 straw/plaster 21.62 570 2581 no4 plaster/surface 21.80 565 2611 noinside — 22 565 2643 no
aFrom Appendix C.2, or from CIBSE (2001) Guide C - vapour pressure adequate tocorresponding temperature and 100% RH.
Table G.4: External, bathroom, wall in Blanden. Results of calculation based on realconditions.
244
Appendix H
Principles of WUFI model;Advanced moisture transfertheory
WUFI means ”Warme-und Feuchtetransport instationar” (Transient Heat andMoisture Transport) and it was developed as a computer model in spring 2000through a collaboration between Oak Ridge National Laboratory in USA and theFraunhofer Institute of Building Physics in Germany (Newport Partners, 2004).The WUFI model’s main advantage is, as one of the program’s designers Kunzel(p.4, 1995) says, that it works with ”relatively simple moisture transport andstorage functions largely derived from standard material parameters.” It takesinto consideration local climate influences such as driving rain, solar radiationand frost (see table 6.2 and Appendix H). The results of WUFI simulation canbe displayed either in an animated form that shows changes over time, or intime charts, or in data files which are ready for further analysis.
Discussion about principles of WUFI mathematical model will help to un-cover complicated theory behind moisture transfer in straw bale walls.
H.1 Moisture storage
The sorption isotherm is all WUFI needs to know in order to determine abilityof hygroscopic material to store the moisture. Sorption isotherm representsconnection between material’s moisture content and the ambient conditions,namely relative humidity surrounding the material (see Section 3.7).
As material gets increasingly more wet, the sorption isotherm can be di-vided into three moisture regions, with specific moisture storage characteristics(Kunzel, 1995, see fig. H.1).
245
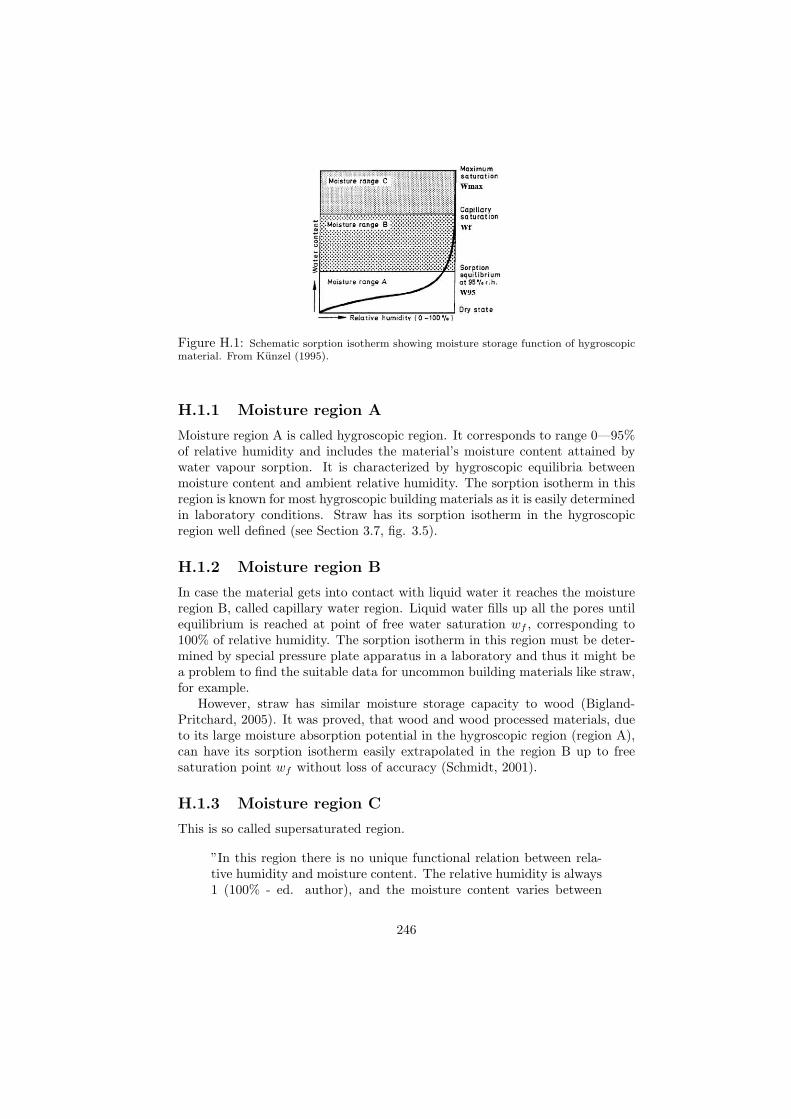
Figure H.1: Schematic sorption isotherm showing moisture storage function of hygroscopicmaterial. From Kunzel (1995).
H.1.1 Moisture region A
Moisture region A is called hygroscopic region. It corresponds to range 0—95%of relative humidity and includes the material’s moisture content attained bywater vapour sorption. It is characterized by hygroscopic equilibria betweenmoisture content and ambient relative humidity. The sorption isotherm in thisregion is known for most hygroscopic building materials as it is easily determinedin laboratory conditions. Straw has its sorption isotherm in the hygroscopicregion well defined (see Section 3.7, fig. 3.5).
H.1.2 Moisture region B
In case the material gets into contact with liquid water it reaches the moistureregion B, called capillary water region. Liquid water fills up all the pores untilequilibrium is reached at point of free water saturation wf , corresponding to100% of relative humidity. The sorption isotherm in this region must be deter-mined by special pressure plate apparatus in a laboratory and thus it might bea problem to find the suitable data for uncommon building materials like straw,for example.
However, straw has similar moisture storage capacity to wood (Bigland-Pritchard, 2005). It was proved, that wood and wood processed materials, dueto its large moisture absorption potential in the hygroscopic region (region A),can have its sorption isotherm easily extrapolated in the region B up to freesaturation point wf without loss of accuracy (Schmidt, 2001).
H.1.3 Moisture region C
This is so called supersaturated region.
”In this region there is no unique functional relation between rela-tive humidity and moisture content. The relative humidity is always1 (100% - ed. author), and the moisture content varies between
246
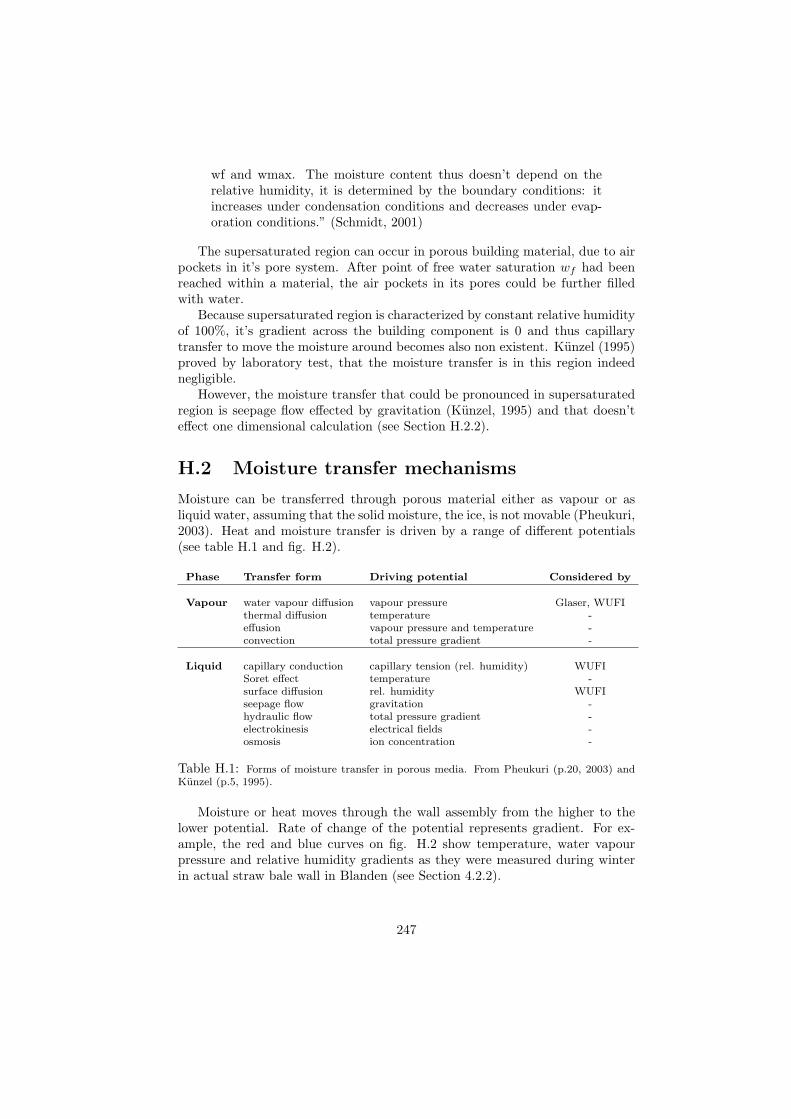
wf and wmax. The moisture content thus doesn’t depend on therelative humidity, it is determined by the boundary conditions: itincreases under condensation conditions and decreases under evap-oration conditions.” (Schmidt, 2001)
The supersaturated region can occur in porous building material, due to airpockets in it’s pore system. After point of free water saturation wf had beenreached within a material, the air pockets in its pores could be further filledwith water.
Because supersaturated region is characterized by constant relative humidityof 100%, it’s gradient across the building component is 0 and thus capillarytransfer to move the moisture around becomes also non existent. Kunzel (1995)proved by laboratory test, that the moisture transfer is in this region indeednegligible.
However, the moisture transfer that could be pronounced in supersaturatedregion is seepage flow effected by gravitation (Kunzel, 1995) and that doesn’teffect one dimensional calculation (see Section H.2.2).
H.2 Moisture transfer mechanisms
Moisture can be transferred through porous material either as vapour or asliquid water, assuming that the solid moisture, the ice, is not movable (Pheukuri,2003). Heat and moisture transfer is driven by a range of different potentials(see table H.1 and fig. H.2).
Phase Transfer form Driving potential Considered by
Vapour water vapour diffusion vapour pressure Glaser, WUFIthermal diffusion temperature -effusion vapour pressure and temperature -convection total pressure gradient -
Liquid capillary conduction capillary tension (rel. humidity) WUFISoret effect temperature -surface diffusion rel. humidity WUFIseepage flow gravitation -hydraulic flow total pressure gradient -electrokinesis electrical fields -osmosis ion concentration -
Table H.1: Forms of moisture transfer in porous media. From Pheukuri (p.20, 2003) andKunzel (p.5, 1995).
Moisture or heat moves through the wall assembly from the higher to thelower potential. Rate of change of the potential represents gradient. For ex-ample, the red and blue curves on fig. H.2 show temperature, water vapourpressure and relative humidity gradients as they were measured during winterin actual straw bale wall in Blanden (see Section 4.2.2).
247
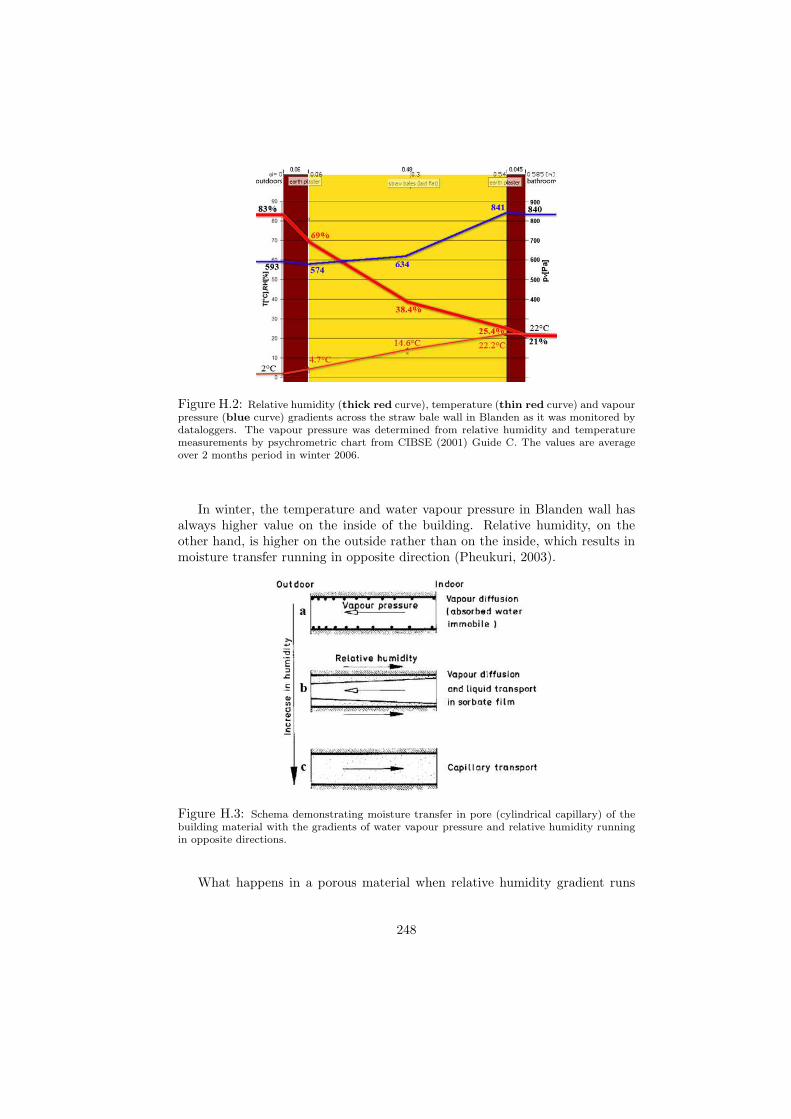
Figure H.2: Relative humidity (thick red curve), temperature (thin red curve) and vapourpressure (blue curve) gradients across the straw bale wall in Blanden as it was monitored bydataloggers. The vapour pressure was determined from relative humidity and temperaturemeasurements by psychrometric chart from CIBSE (2001) Guide C. The values are averageover 2 months period in winter 2006.
In winter, the temperature and water vapour pressure in Blanden wall hasalways higher value on the inside of the building. Relative humidity, on theother hand, is higher on the outside rather than on the inside, which results inmoisture transfer running in opposite direction (Pheukuri, 2003).
Figure H.3: Schema demonstrating moisture transfer in pore (cylindrical capillary) of thebuilding material with the gradients of water vapour pressure and relative humidity runningin opposite directions.
What happens in a porous material when relative humidity gradient runs
248
in opposite direction to gradient of water vapour pressure is demonstrated byschema of cylindrical capillary on fig. H.3. When dry, the building material hasit’s pores empty and the vapour diffusion predominates the moisture transfer(see fig. H.3, a).
When the level of humidity rises, the water vapour absorbs to the pores ofbuilding material. As soon as it starts to cover the pore surface in film morethan one molecule thick, water molecules become mobile. The film is thickeron the outside than on the inside, because there is in this case higher relativehumidity on the outside of the building component (see fig. H.3, b).
The thicker the film, the more mobile liquid water in pores become and moreeasily it moves from the thicker film sections to the thinner ones. This transferis called surface diffusion. Increasing surface diffusion reduces vapour diffusionso that at certain point surface diffusion starts to set in and the total moisturetransfer through building component is reversed.
In wet conditions, when the pore is filled with water (see fig. H.3, c), themoisture transfer is governed by another process, called capillary conduction(Kunzel, 1995).
The fig. H.3 shows an example, when the single gradients across the build-ing component don’t change direction. In reality, all gradients are ”naturallytransient and the direction of local heat and moisture transport can alternateglobally and/or locally. At the same time, the material is locally exposed toalternating processes of ab- and desorption.” (Pheukuri, p. 13, 2003).
Pheukuri (2003) further points out, that water vapour and liquid watertransfer can be combined in pores of building material. Kunzel (1995) arguesthat in the sorption moisture region of most building materials liquid and vapourtransfer don’t influence each other ”since vapour diffusion takes place mainly inthe larger pores, while liquid transfer - independent of vapour diffusion - takesplace via the micropores and on the pore walls” (Kunzel, p. 14, 1995).
H.2.1 Water vapour transfer
Water vapour diffusion
In theory, according to table H.1, the water vapour diffusion through buildingmaterial, assuming negligible total pressure gradients1, consists of:
• water vapour diffusion driven by temperature gradient
• water vapour diffusion driven by by gradient of water vapour pressure inthe air
Water vapour diffusion driven by temperature gradient
1Buildings in general are exposed to negligible total vapour pressure gradients
249
Due to negligible effect that temperature gradient has on the total vapourtransfer in building component (∼0.005% of total moisture transfer (Pheukuri,2003)), WUFI omits thermal diffusion in it’s calculation.
Water vapour diffusion driven by gradient of water vapour pressure
In case the vapour transfer through building component happens exclusivelythrough air, water vapour diffusion driven by gradient of water vapour concen-tration in the air gv can be described by Fick’s law:
gv = −δ∆p (H.1)
, where δ [kg·m−1·s−1·Pa−1] is water vapour diffusion coefficient in air andp [Pa] represents water vapour pressure gradient.
In reality the vapour diffusion through building component happens exclu-sively through air only in large pores (radius > 10−6m). Within much smallerpores (radius < 10−9m), the water vapour molecules start to collide with porewalls and the transfer is predominated by so called effusion (see table H.1). Inpore sizes between those two limits there is a mixed vapour transfer.
”Nevertheless as far as the building physics is concerned, the effectsof the microstructure and the interaction of effusion and Fick’s dif-fusion on the water vapour transport through porous media can beallowed for by simply introducing a water vapour diffusion resistancefactor (or water vapour diffusion coefficient, see 5.6 - ed. author),which is characteristic for each building material.” (Kunzel, 1995)
qv =δ∆p
µ(H.2)
2
, where µ is water vapour diffusion coefficient (see Section 5.2.1).
Equation H.2 could be easily obtained by combining two equations 5.1 and5.6 from Section 5.2.1 in previous Chapter, which indicates that WUFI takessimilar approach to water vapour transfer as Glaser’s model. The only differenceis that unlike in Glaser’s model, the equation H.2 and thus WUFI’s calculationis independent of temperature, as discussed in Section 5.2.1 (see equation 5.6).
2The equation H.2 is further modified to fit WUFI’s moisture balance equation (see fol-lowing Section 6.4.2).
250
Although water vapour diffusion coefficient µ is temperature independent,it is dependent on the relative humidity (or moisture content). This fact WUFImodel ignores:
”Since this is furthermore phenomenon that occurs only at higherwater contents when capillary conduction dominates over vapourdiffusion, it seems reasonable to remain with the concept that thevapour diffusion resistance (or water vapour diffusion coefficient -ed. author) does not depend on moisture” (Kunzel, 1995)
Air convection in straw bale walls
Another aspect of water vapour transfer is air convection and it is discussed indetail in sections 4.1.7 and AirInfiltration1.
WUFI’s major limitation relies in ignoring air convection within a wall as-sembly and its associated energy and moisture flow (Straube and Burnett, 2001).
H.2.2 Liquid water transfer
Surface diffusion
Liquid transfer begins with critical moisture content usually at relative humiditylevels above ca. 30% for paper and 60% for sandstone, when the adsorbed filmon materials pores becomes mobile (see fig. H.3b). This kind of liquid transferis called surface diffusion and it’s driving force is gradient of relative humidity(Kunzel, 1995).
Capillary conduction
Whenever the pores of hygroscopic material start to be saturated with liquidwater in capillary water region, the transfer becomes capillary conduction (seefig. H.3c) driven by surface tension of the water in the meniscus at the interfacebetween water and pore air. This potential is called capillary tension (Kunzel,1995).
”There exists a functional relation between the capillary tension andthe equilibrium humidity in the pore air above the meniscus, i.e. thedriving force in the liquid phase corresponds to a certain relativehumidity in the gas phase. Thus instead of capillary tension, relativehumidity can be used as driving potential for capillary conduction.”(Schmidt, 2001)
Each material has its surface diffusion and capillary conduction included insorption isotherm (see sections 3.7 and H.1), which is the material characteristicrequired for WUFIs calculation.
251
Liquid transfer caused by temperature gradient
Besides two main liquid transfer mechanisms mentioned above there is alsoliquid transfer due to temperature gradient. According to Pheukuri (2003) ithas two aspects:
• The transfer based on fact that the viscosity of a liquid decreases forincreasing temperatures. The result is increasing liquid transport for in-creasing temperatures.
• The transfer caused by soret effect
However, those two effects are minimal compared to the effects caused byrelative humidity gradient and WUFI doesn’t consider them in its calculation(Pheukuri, 2003; Kunzel, 1995).
Liquid transfer caused by gravitation
WUFI, as one dimensional model, deals with moisture transfer only in onepoint, horizontally through section of building component (see Section 6.2). Itmeans that the calculation doesn’t consider vertical moisture flow caused bygravitation, even though it seems to play an important role in straw bale wallmoisture performance (see Section 4.1.3).
When simulating the moisture transfer in mid-height of the straw bale wallfor example, it has to be taken into account that in the highest (or the lowest)portions of the wall, moisture content will considerably vary from the simulatedresults.
”Other” liquid transfer
Since building science still doesn’t completely understand the following influ-ences on moisture transfer through building materials and since they representthe values affecting only very special cases in the building practice, WUFI fur-thermore omits (Kunzel, 1995):
• hydraulic moisture flow driven by total pressure gradient
• moisture flow due to electrokinesis driven by electrical fields
• moisture flow caused by osmosis driven by ion concentration
H.3 Moisture transfer mechanisms, WUFI’s so-lution
The reasons why WUFI model considers only few out of numerous moisturetransfer mechanisms were discussed in previous Section. Except water vapourtransfer caused by air flow, WUFI takes into account all the essential moisture
252
movers: water vapour diffusion and liquid transfer caused by surface diffusionand capillary conduction (see table H.1).
Because vapour transfer can go against the transfer of liquid (see fig. H.3), itis necessary to assign to vapour and liquid transfer different driving potentials.The vapour diffusion is driven by vapour pressure, which could be easily derivedfrom values of temperature and relative humidity. The liquid transfer, on theother hand, is considered to be temperature independent and thus it’s drivingpotential becomes just relative humidity.
This way all main moisture transfer is driven by only two potentials: rela-tive humidity and temperature. In contrast to moisture content, for example,which is discontinuous between two different materials, relative humidity andtemperature have a great advantage of being continuous across the whole build-ing component. Furthermore the models input in form of material propertiesand boundary conditions can be easily defined in terms of these quantities (seeSection I).
H.4 Moisture transfer in straw
Moisture transfer through fibrous organic materials like hemp, reed or strawisn’t generally different from the moisture transfer in porous mineral materials(WUFI, 2005).
Although straw bales have preferred transport direction due to specific fibrefolding technique during baling, WUFI doesn’t consider the changes in directionsdue to its one dimensional character.
WUFIs manual (2005) mentions that determining liquid transfer coefficientfor organic fibrous materials might be difficult, or even impossible, because theycould change consistency in high moisture content levels (during caking, forexample). Nevertheless, liquid transfer coefficients could be ignored in normalconditions until capillary conduction becomes a major form of transfer. Thissimplification is adequate in the sorption moisture region which is anyway themain field of interest for the fibrous organic materials since they have to beprevented from getting saturated.
H.5 Moisture transfer below frost level
H.5.1 Vapour diffusion
According to Kunzel (1995) the vapour diffusion resistance becomes apparentlyobscured by frost formation only if the pores are filled with ice to 60% of theirvolume.
”For that reason, the influence of ice formation on vapour diffusioncan be disregarded in most cases.” (Kunzel, p.22, 1995)
253
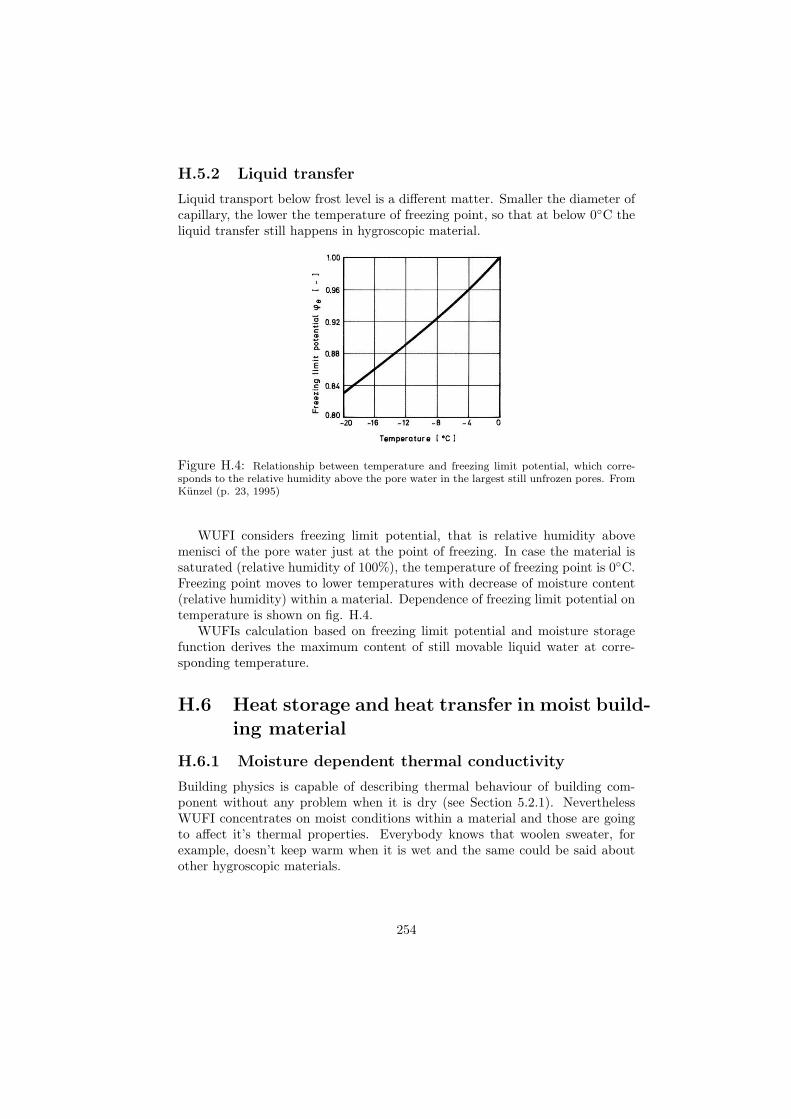
H.5.2 Liquid transfer
Liquid transport below frost level is a different matter. Smaller the diameter ofcapillary, the lower the temperature of freezing point, so that at below 0◦C theliquid transfer still happens in hygroscopic material.
Figure H.4: Relationship between temperature and freezing limit potential, which corre-sponds to the relative humidity above the pore water in the largest still unfrozen pores. FromKunzel (p. 23, 1995)
WUFI considers freezing limit potential, that is relative humidity abovemenisci of the pore water just at the point of freezing. In case the material issaturated (relative humidity of 100%), the temperature of freezing point is 0◦C.Freezing point moves to lower temperatures with decrease of moisture content(relative humidity) within a material. Dependence of freezing limit potential ontemperature is shown on fig. H.4.
WUFIs calculation based on freezing limit potential and moisture storagefunction derives the maximum content of still movable liquid water at corre-sponding temperature.
H.6 Heat storage and heat transfer in moist build-ing material
H.6.1 Moisture dependent thermal conductivity
Building physics is capable of describing thermal behaviour of building com-ponent without any problem when it is dry (see Section 5.2.1). NeverthelessWUFI concentrates on moist conditions within a material and those are goingto affect it’s thermal properties. Everybody knows that woolen sweater, forexample, doesn’t keep warm when it is wet and the same could be said aboutother hygroscopic materials.
254
Thermal conductivity λ depends on water content and WUFI needs to dealwith it. In many mineral materials, such stone or brick for example, thermalconductivity increases linearly with moisture content and their moisture depen-dent thermal conductivity can be easily calculated (Kunzel, 1995). However,insulation materials like mineral wool for example have unique and irregularrelation of thermal behaviour on moisture content and thus the moisture depen-dent thermal conductivity of many insulation materials needs to be determinedin the guarded hot plate apparatus (Schmidt, 2001).
Sufficient results for moisture dependent thermal conductivity of straw fromguarded hot plate test are not known to author. Although, many tests deter-mining thermal conductivity of straw bales had been done so far, the conclusionsregarding dependence of thermal conductivity of straw to its moisture contentcan’t be drawn, because many variables affecting the thermal efficiency of straw(type of straw, fibre orientation, density, moisture content) make independenttests on straw bales with different properties incomparable.
H.6.2 Heat content
Heat content of moist material H is a sum of heat content of a dry materialplus heat content of all the water in that material.
H = Hs + Hw (H.3)
To calculate heat content of a dry material is simple. In temperature rangetypical for building physics the heat content of dry material is linearly dependenton temperature:
Hs = ρs · cs · T (H.4)
, where Hs [J·m−3] is heat content of dry building material, ρs [kg·m−3] is itsdensity, cs [J·kg−1·K−1] is its specific heat capacity and T [◦C] is temperature(Kunzel, 1995).
To determine heat content of all moisture in a material is on the otherhand difficult, because the water exists within a building material in a variousphysical states, which are constantly changing, especially in micropores (Tulleret al. 1999).
”The exact determination of the enthalpy (heat content - ed. author)of a phase mixture is possible only when the pore radius distributionor the moisture storage function of the building material is known.”(Kunzel, p. 26, 1995)
255
Hw =[(w − we) · cw + we · ce − he · dwe
dT
]· T (H.5)
, where Hw [J·m−3] is heat content of moisture in dry building material, cw
[J·kg−1·K−1] is specific heat capacity of liquid water, ce [J·kg−1·K−1] is specificheat capacity of ice, he [J·kg−1·K−1] is specific melting heat, w is total watercontent, we is content of frozen water and T [◦C] is temperature (Kunzel, 1995).
The content of frozen water in moist building material we is possible to cal-culate from material moisture storage function and relationship between tem-perature and freezing limit potential (see fig. H.4)
H.6.3 Transfer of heat with a phase change
In order to explain WUFI’s approach to calculation of heat content in realambient conditions, Kunzel (1995) shows an example of heat balance in a wallexposed to driving rain under following specific conditions:
• outside air temperature = 2◦C
• solar radiation on the wall = 40 W·m−2
• total driving rain 200 kg·m−2
• room temperature 20◦C
• thermal resistance of the materials within the wall assembly = 2 m2·K·W−1
• short wave radiation absorption value of materials surface = 0.7
According to equation 5.1, the rate of heat transfer from the inside to theoutside is 9 W·m−2. The heat transfer by radiation is 40 · 0.7 = 28 W·m−2 (seefig. H.5).
With the given amount of driving rain, which is presumably completelyabsorbed by the material, the liquid heat transfer through the rain screen is lessthan 0.2 W·m−2 (Kunzel, 1995).
When the rain stops, drying of the liquid water absorbed by the rain screenresults in heat loss 32 W·m−2.
”This example shows that in practice the enthalpy (heat content -ed. author) flows as the result of liquid transport play a negligiblerole in comparison with other thermal flows, while vapour diffusionconnected with phase changes, such as drying processes can be ofgreat importance in terms of heat balance.” (Kunzel, 1995)
While heat content flows related to liquid transfer can be ommited by WUFI,model needs to calculate on the vapour diffusion connected with phase change:
256
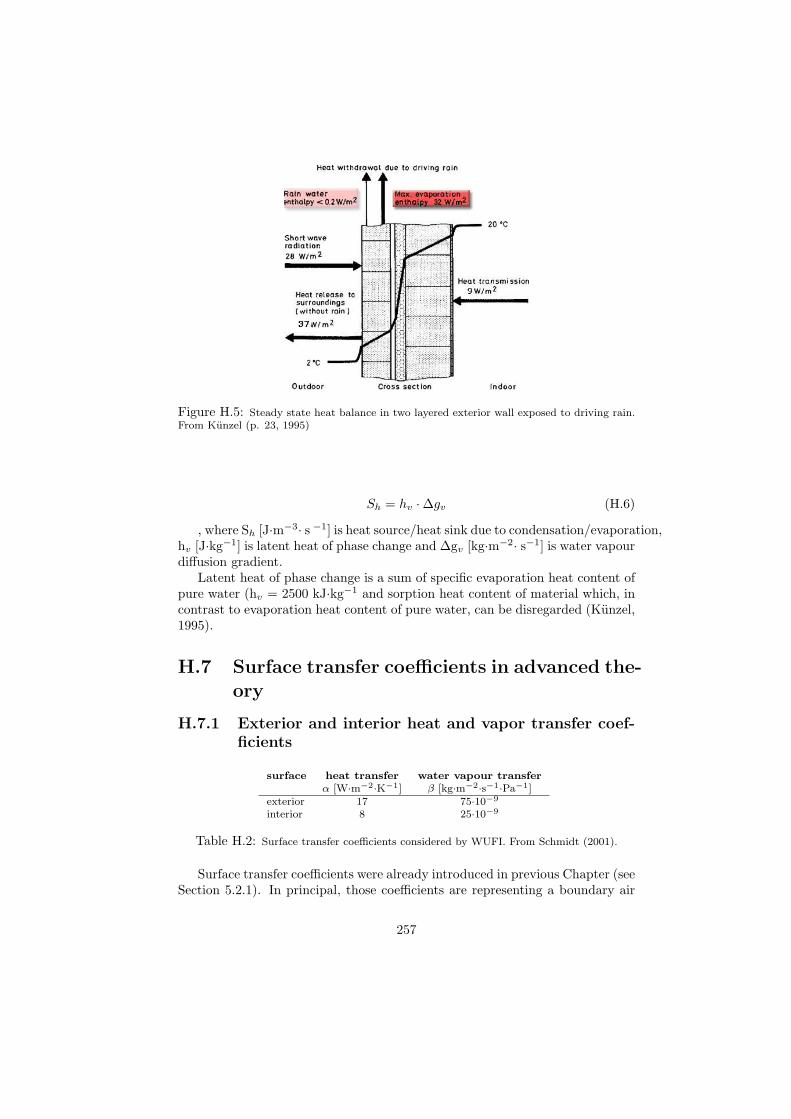
Figure H.5: Steady state heat balance in two layered exterior wall exposed to driving rain.From Kunzel (p. 23, 1995)
Sh = hv ·∆gv (H.6)
, where Sh [J·m−3· s −1] is heat source/heat sink due to condensation/evaporation,hv [J·kg−1] is latent heat of phase change and ∆gv [kg·m−2· s−1] is water vapourdiffusion gradient.
Latent heat of phase change is a sum of specific evaporation heat content ofpure water (hv = 2500 kJ·kg−1 and sorption heat content of material which, incontrast to evaporation heat content of pure water, can be disregarded (Kunzel,1995).
H.7 Surface transfer coefficients in advanced the-ory
H.7.1 Exterior and interior heat and vapor transfer coef-ficients
surface heat transfer water vapour transferα [W·m−2·K−1] β [kg·m−2·s−1·Pa−1]
exterior 17 75·10−9
interior 8 25·10−9
Table H.2: Surface transfer coefficients considered by WUFI. From Schmidt (2001).
Surface transfer coefficients were already introduced in previous Chapter (seeSection 5.2.1). In principal, those coefficients are representing a boundary air
257
layer right at the surface acting as an intermediary between exposed materialand the exterior or interior climate. In advanced theory of moisture and heattransfer those coefficients are dependent on wind and moisture content at thesurface level. However, because the transfer resistances at boundaries are in anycase very small compared to the resistances of the individual material layers(Schmidt, 2001), WUFI counts in all cases on average values (see table H.2).
H.7.2 Energy absorption factor and rain water absorptionfactor
Because WUFI considers effect of driving rain and solar radiation, there areother two surface transfer coefficients that needs to be kept in mind. These arean energy absorption factor and rain water absorption factor.
Energy absorption factor depends on colour of the surface and represents thefact that only a part of solar radiation is transmitted as a heat into material.Bright coloured surface has energy absorption factor of about 0.4 and darksurface about 0.6—0.8 (Schmidt, 2001).
Rain water absorption factor allows for the water, that splashes off the ma-terials surface and runs off due to gravity. It depends on angle under whichthe driving rain hits the surface and on precipitation absorptivity of a material(Kunzel, 1995). According to Schmidt (2001), the appropriate value of rainwater absorption factor for vertical material surface is 0.7.
258
Appendix I
Input data for WUFIsimulation in Chapter 6
Further reading in this Section was partially adapted from WUFI (2005) - pro4.01 Online Help file. Paragraphs dealing particularly with the case in Blandenare emphasized.
I.1 Time step
Time step is a time interval of input climate conditions. The output data arecalculated in accordance with the input climate conditions, so that they havethe same time step as input data. According to WUFI (2005) there is no limit tothe choice of time step. The choice of time step however influences calculationsaccuracy.
”...time steps between ca. 10 minutes and ca. 24 hours may beadequate, depending on the problem at hand. With smaller timesteps, computing time increases markedly, with larger time steps,the results may become inaccurate.” (WUFI, 2005)
In Blanden, the climate boundary conditions were monitored every 30 minutes,for that reason the time step was adjusted to 0.5h.
I.2 Climate data
For each time step WUFI needs following climate data:
• Rain load [l·m−2·h−1] vertically on the exterior surface.
• Solar radiation [W·m−2] vertically on the exterior surface.
• Temperature of the exterior and interior air [◦C]
259
• Relative humidity of the exterior and interior air [0...1] fraction.
• Barometric pressure [hPa] specification of a mean value over the calcula-tion period.
• Long wave atmospheric counterradiation [W·m−2] in case there is a sig-nificant radiative cooling influencing the construction during the night.
I.2.1 Exterior climate data
The exterior climate data need to be assigned to model as a climate file eitheras a file from WUFI’s database (WUFI offers weather data from number oflocations in the USA and in Europe), or from any other file containing datain proper order and magnitude. The data must be in .KLI format. They canbe completely artificial, describing laboratory conditions for example, or theycan be conventional weather data from meteorological station. WUFI is able toautomatically convert data from conventional weather data formats such are:.WET, .TRY, .DAT, .IWC and .AGD.
In case of monitoring in Blanden, the data were downloaded from monitorsin .txt format, adjusted into acceptable form in spread sheet of Microsoft Exceland then exported as data file to .txt format again. By simply overwriting .txtfor .KLI the data were converted into WUFI format.
The rain load and radiation obtained from conventional weather data areusually measured on horizontal surface. That is why WUFI needs to adjustthose loads according to orientation and inclination of the building component,which happens automatically.
Driving rain load is calculated from rain load on horizontal plane, windvelocity and direction.
The wall in Blanden was chosen to minimize requirements for extensiveweather data, which would be difficult to collect. Measured wall is north fac-ing. This fact completely eliminates the effect of solar radiation. Furthermore,due to almost non existent south blowing wind in the Blanden area, northernwall under investigation almost never receives driving rain and that eliminatesthe need for rain load data.
For the reasons mentioned in previous paragraph the exterior climate datafile in case of Blanden wall consists of temperature and relative humidity valuesmeasured every 30 minutes during period of monitoring. Barometric pressurewas estimated as an average value during the period of monitoring.
I.2.2 Interior climate data
Interior climate as an input for WUFI simulation can be specified the same wayas exterior climate (from measured data) or estimated by WUFI’s simplifiedoption (WUFI, 2005).
260
Simplified option is for the purpose of benchmarking the model irrelevant,because the interior relative humidity and temperature in Blanden were collectedduring period of monitoring every 30 minutes. Similarly to exterior data, inte-rior data were downloaded from monitors in .txt file and converted into accept-able format.
However, due to the unfortunate position of monitor #4 measuring the in-terior conditions in Blanden, the interior input data had to be adjusted (seeAppendix F).
I.3 Surface transfer coefficients
Those coefficients indicate into which extent the climate conditions affect heatand moisture transfer through the surface of a building component.
I.3.1 Vapour diffusion thickness [m]
So called sd value represents the air layer thickness with the same resistance towater vapour diffusion as has the coating on a surface of a material. It can beused in case the material has a paint, wallpaper, vapour barrier, or any otherimpregnation that influences pore space on the surface.
Earth plaster in Blanden wasn’t painted or impregnated by any means, thussd=0.
I.3.2 Short wave radiation absorptivity [-]
It characterizes surface property dependent on brightness and reflectivity ofmaterials surface. It represents a fraction of total incident solar radiation thatis absorbed by the component as a heat.
There isn’t any incident solar radiation on north facing wall in Blanden.Short wave radiation absorptivity is in this case irrelevant.
I.3.3 Long wave radiation emissivity [-]
It considers night time emission of radiative cooling from the materials surface.Due to radiative cooling temperature of the surface drops considerably duringa clear night.
According to WUFI (2005), long wave radiation emissivity can be neglected,because it has a very minor effect on the calculations results.
I.3.4 Rain water absorption factor [-]
It takes into account the fraction of the water that splashes off the surface.As was discussed earlier, the north wall in Blanden doesn’t receive any rain
load, so the rain water absorption factor becomes irrelevant.
261
I.4 Wall assembly
In this dialog researcher specifies all the components of a wall assembly underinvestigation. Specification is concerned with the thickness of a component aswell as with other parameters (see table 6.3) which are assigned to particularmaterials from preset database.
Fig. 6.1 presents the wall assembly in Blanden as it was set in programsdialog.
I.4.1 Monitor positions
WUFI will provide relative humidity and temperature data as a calculationoutput only in specific places—monitor positions.
Monitor positions were chosen to coincide with the positions of dataloggers(real monitors) in actual wall in Blanden (see fig. 4.22), so that real and calcu-lated data could be compared (see fig. 6.1).
I.4.2 Grid
WUFI offers a choice of coarse, medium or fine grid structure, that is set au-tomatically over each material of the component. In special cases, grid can beadjusted manually.
In case of Blanden wall component, ”medium” grid was set to allow forsatisfying accuracy (see fig. 6.1).
I.4.3 Orientation, inclination, height of the component
Those inputs need to be specified for calculation of solar radiation and drivingrain. The wall in Blanden doesn’t consider solar radiation nor diving rain, so itis irrelevant to consider those items.
262
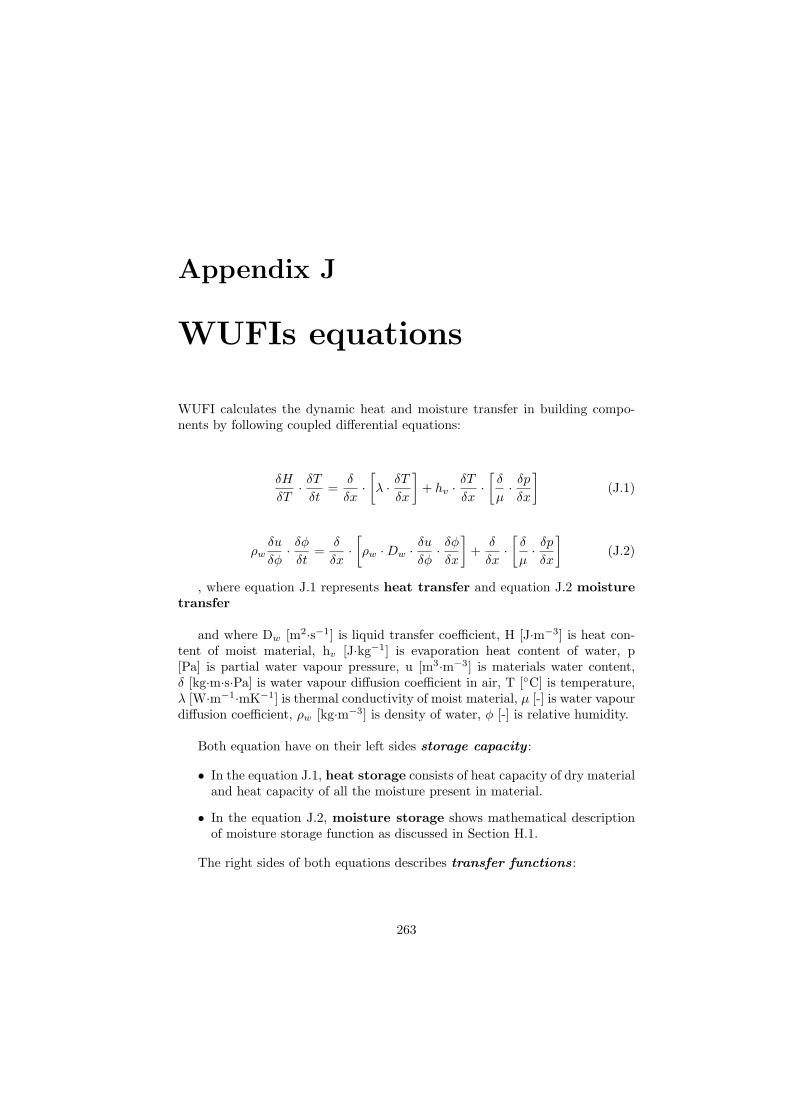
Appendix J
WUFIs equations
WUFI calculates the dynamic heat and moisture transfer in building compo-nents by following coupled differential equations:
δH
δT· δT
δt=
δ
δx·[λ · δT
δx
]+ hv · δT
δx·[
δ
µ· δp
δx
](J.1)
ρwδu
δφ· δφ
δt=
δ
δx·[ρw ·Dw · δu
δφ· δφ
δx
]+
δ
δx·[
δ
µ· δp
δx
](J.2)
, where equation J.1 represents heat transfer and equation J.2 moisturetransfer
and where Dw [m2·s−1] is liquid transfer coefficient, H [J·m−3] is heat con-tent of moist material, hv [J·kg−1] is evaporation heat content of water, p[Pa] is partial water vapour pressure, u [m3·m−3] is materials water content,δ [kg·m·s·Pa] is water vapour diffusion coefficient in air, T [◦C] is temperature,λ [W·m−1·mK−1] is thermal conductivity of moist material, µ [-] is water vapourdiffusion coefficient, ρw [kg·m−3] is density of water, φ [-] is relative humidity.
Both equation have on their left sides storage capacity :
• In the equation J.1, heat storage consists of heat capacity of dry materialand heat capacity of all the moisture present in material.
• In the equation J.2, moisture storage shows mathematical descriptionof moisture storage function as discussed in Section H.1.
The right sides of both equations describes transfer functions:
263
• In the equation J.1, heat transfer comprises moisture dependent ther-mal conductivity and heat transfer due to vapour flow of heat content.Vapour flow of heat content considers the latent heat absorption duringevaporation in one place, diffusion of this water vapour into another placewhere it releases latent heat during condensation.
• In the equation J.2, moisture transfer consists of liquid transfer andvapour diffusion.
- Liquid transfer, as was mentioned in Section H.2, happensthrough surface diffusion and capillary conduction, both drivenby gradient of relative humidity.- Water vapour diffusion is on the other hand dependent ontemperature (see Section H.2).
264

Appendix K
Letters
265
K.1 From: Martin Hammer, Saturday, April 08,2006 1:33 AM
Dear Jakub -
In any case, I send it to you now as an attachment. I also relate to you thefollowing anecdote regarding a small, unheated, straw bale storage building Idesigned and built on a College campus in 1999:
A moisture problem occurred that relates in part to the stack bond. Moisturecontent was monitored on all walls during the rainy season. Generally, the strawmoisture content was well under 16%, but the top half of the west wall hadalarmingly high readings of 18-39%. It was determined that the joints betweenbale stacks acted as chimneys, allowing the west sun to heat air in the bales,with whatever moisture it had wicked from the plaster or entered through smallcracks, and drive it up to the top of the wall where it was trapped by a layerof plastic which was unwittingly installed as a second line of defense under themetal flashing wall cap. Uncapping the wall, removing the plastic, and drillingventilation holes in the plywood top plate has apparently solved the problem.(I could send you photos of this building if you like.)
Also, I had recent experience with a single bale (rice straw) that has beenstored under my house sitting on 2 pieces of wood (approx. 4cm thick) on aconcrete slab. The face of the bale that faces the slab developed fungus andmoisture content within the first 2 cm of the surface of 20-35%. There may havebeen some contact of the bale with the slab in between the wood supports. Icould give you more detailed information and a photo if it would be useful. Thisdiscovery disturbs me some. To my knowledge the bale was never in contactwith liquid moisture. Of course there was no moisture barrier between the slaband the bale as there normally is with a straw bale wall. My discovery certainlysuggests that such a moisture barrier is necessary.
Thats all for now. Please let me know if this has reached you in time to beuseful, and if you require any more information from me. Thanks very muchfor doing this important work, and I look forward to seeing the results.
Sincerely,
Martin Hammer, Architect Berkeley, California, USA
266
K.2 From: Tim Padfield, Saturday, November12, 2005 10:55 AM
Dear Kuba
Thank you for your letter.I have not investigated straw bales but many other people have. I know that
a Danish company, I think it was Ramboll (ramboll.dk), has put measuringinstruments within straw bales in an experimental house. It was shown onDanish television, but not the scientific results - that rarely gets on TV.
I would expect the sorption isotherm to resemble that of wood, near enoughfor rough calculations. The water vapour diffusion coefficient must depend onthe state of compression, for diffusion through the voids. But diffusion into thefibres will not change. The vapour has to penetrate the cell walls of the parallelfibres. I would expect a similar diffusion rate to wood. It doesn’t matter thatmuch. If diffusion through the straw skin is not fast, the vapour will diffusedeeper into the mass through the air voids, so the buffering effect is still large,just delayed.
Whatever the details, straw bale with earth or lime plaster, unpainted musthave an enormous water vapour capacity. This will protect it against longperiods of locally high RH which would cause rotting.
I would expect a similar performance to the wood shaving insulation that isvery common in Swedish houses. That works ok for many years.
As for the compression ratio of the straw. The moisture buffering over thelong term can only be better, because there is more stuff per cubic metre. Shortterm buffering over the daily cycle may not be affected much. Indeed, 3cm oflime plaster is a formidable hindrance to propagation of the daily cycle of indoorairborne moisture. My thesis shows the movement of water into lime plaster ona daily RH cycle.
Best wishestim
267
K.3 From: Dirk Scharmer, Wednesday, April19, 2006 10:14 AM
Dear Kuba,
I’m happy that you do this work. We’re doing some moisture research too.
• Moisture/ temperature monitoring on 4 houses - one is being monitoredsince November, 2004.
• Dynamic moisture transport simulation with WUFI
• Mold analyzing of embedded straw
The goal is to find the best prevention against moisture failure of a strawbale construction and to get this in a buidling code.
In the next weeks we’ll start a comprehensive research project with moresimulations, monitoring and analyzing. Our work and your work would fittogether perfectly to describe the complex mold problem of straw bales. Yourway to come more from the practical side may be the more significant one forthe building site. The way of simulating and mold analyzing for me seems tobe a good way to fit the requirements of the german building authorities. Ourfirst general approval for straw bales as an insulation material is mainly basedon simulations. Unfortunately we were not able to prove the mold resistance ofdirectly earth plastered straw bales, but we hope to do this with the upcomingresearch. We are working together with the Fraunhofer Institut fuer Bauphysik,www.hoki.ibp.fraunhofer.de.
Greetings,Dirk———————————————–Fachverband Strohballenbau Deutschland e.V.Auf der Ruebekuhle 10D- 21335 LueneburgTel. 00 49 4131- 727804Fax. 00 49 4131- 727805Internet: www.fasba.deEmail: [email protected]
268
Appendix L
Questionnaires
269