Human Values and Consumer Preferences for Extrinsic...
19
Human Values and Consumer Preferences for Extrinsic Credence Attributes in the German and Italian Markets for New Potatoes Fitzsimmons, Jill Ann, University of Massachusetts, Amherst. [email protected] Colantuoni, Francesca. University of Massachusetts, Amherst. [email protected] Cicia, Gianni, University Frederico II, Naples, Italy. [email protected] Del Giudice, Teresa, University Frederico II, Naples, Italy. [email protected] Selected Paper prepared for presentation at the Agricultural & Applied Economics Association’s 2014 AAEA Annual Meeting, Minneapolis, MN, July 27-29, 2014. Copyright 2014 by Fitzsimmons, J.A., Colantuoni, F., Cicia, G., Del Giudice, T. All rights reserved. Readers may make verbatim copies of this document for non-commercial purposes by any means, provided that this copyright notice appears on all such copies.
Transcript of Human Values and Consumer Preferences for Extrinsic...
Human Values and Consumer Preferences for Extrinsic Credence Attributes in the
German and Italian Markets for New Potatoes
Fitzsimmons, Jill Ann, University of Massachusetts, Amherst. [email protected]
Colantuoni, Francesca. University of Massachusetts, Amherst. [email protected]
Cicia, Gianni, University Frederico II, Naples, Italy. [email protected]
Del Giudice, Teresa, University Frederico II, Naples, Italy. [email protected]
Selected Paper prepared for presentation at the Agricultural & Applied Economics Association’s
2014 AAEA Annual Meeting, Minneapolis, MN, July 27-29, 2014.
Copyright 2014 by Fitzsimmons, J.A., Colantuoni, F., Cicia, G., Del Giudice, T. All rights
reserved. Readers may make verbatim copies of this document for non-commercial purposes by
any means, provided that this copyright notice appears on all such copies.
2
Human Values and Consumer Preferences for Extrinsic Credence Attributes in the
German and Italian Markets for New Potatoes1
Abstract
In this research, we explore the relationship between observable socio-demographic consumer
characteristics, consumers’ unobservable human values as measured by Schwartz’ Portrait
Values Questionnaire, and consumers’ preferences for extrinsic credence attributes on their
purchases of new potatoes in two countries, Italy and Germany. Parallel marketing studies were
conducted in each of the two markets, with the intention of comparing the impact of human
values on purchases of new potatoes with several attributes (price, country of origin, carbon
footprint certification, ethical certification, method of production, and packaging). Motivation
for the study comes from the declining market share of the domestic early potato due to
international competition. Applied methods include Principal Component Analysis and Latent
Class Analysis.
1. Introduction
Consumer decision making is impacted by both the attributes of product choices, and consumer
preferences. Firms frequently analyze consumer demographic characteristics as a proxy for
consumer preferences to develop marketing strategies; nations seeking to promote an export
market also look to consumer demographics in their market research. Product attributes were
traditionally framed as intrinsic or physical attributes, such as color, firmness, taste or texture,
and extrinsic attributes such as price or brand; increasingly, new extrinsic credence attributes,
such as regional origin, method of production, or perceived impact of production have been used
by both producers and consumers to differentiate the value of products (Olson, 1972; Grunert,
1996; Verbeke & Ward, 2006;Zeithaml, 1988; Grunert, 2006; Ennekinga et al., 2007; Banović et. al,
2012).
In order for the economic value of these extrinsic attributes to be recognized, producers must
provide reliable information regarding the products’ extrinsic attributes, usually via labelling,
and consumers must be inclined to prefer the perceived products over those products with
otherwise comparable attributes. Unfortunately, market research based solely on consumer
1 ACKNOWLEDGMENT: This research was funded by the Italian Ministry of Agricultural and Forestry Policy in the
context of the TIPIPAPA project.

3
demographics is a blunt instrument when used to identify consumer inclinations to purchase
products with these extrinsic credence attributes. Information regarding gender, income,
profession, family characteristics and so on can only go so far in identifying a potential
consumer’s perception of the additional value that extrinsic attributes contribute to a product.
Instead, researchers have begun to explore how consumers’ human values might provide insight
into the economic valuation they place on extrinsic product attributes.
This paper seeks to compare how the human values of consumers in Italy and Germany impact a
decision to purchase new potatoes that are differentiated by extrinsic credence attributes.
Parallel marketing studies in these two countries asked consumers about their human values,
their preferences for new potatoes, and basic demographic information. Results from this paper
can inform the marketing strategies of firms and governments seeking to promote the sales of
new potatoes differentiated by their extrinsic credence attributes. Results will inform suppliers
about what product characteristics would be most valuable to consumers and provide them with
practical recommendations on how to better market their product. In addition, this study will
inform the debate on the relationship between consumers’ lifestyles and food choices, and will
enrich the discussion among agribusiness specialists and agro-food marketing researchers.
The paper is organized as follows: Section 2 describes the data collection methodology; Section
3 reviews the literature on the relationship between human values and consumer decision-
making; Section 4 describes the model applied to uncover the effect of human values on
consumer decision making in the two new potato markets; Section 5 presents the results of our
analysis, and Section 6 concludes.
2. Data
The survey instrument was designed by a team of Italian researchers, and administered in both
Italy and Germany by the research firm GfK Eurisko during the late summer of 2011. The
survey period overlapped with the end of the new potato season, which allowed surveyors to
identify both occasional and regular consumers of new potatoes.
The survey questionnaire briefly introduced the characteristics of the new potato. Respondents
were then offered a series of hypothetical new potato product labels with a combination of six
different extrinsic attributes, and were asked to choose the product that they preferred from the

4
series. Each extrinsic attribute was varied between two or three “levels” of attribute-specific
options. For example, one of the five extrinsic attributes was “Country of Origin,” and the
product label specified one of the three following levels: 1) that the product was an “Italian/
German product”; 2) that the product was not of Italian/ German origin, but was identified as
being a product of another country; or 3) there was no information provided about the product’s
country of origin. The remaining four extrinsic credence attributes studied in this research are
Production Method, Carbon Footprint certification, Ethical Certification, and Packaging. The
final extrinsic attribute is price. Attributes and Levels included in the randomized questionnaire
design are shown in Table 1.
Table 1. Attributes and Levels included in the randomized questionnaire design
Attributes Description† Levels
Price (€/kg) Base price: -25%; +25%; +75%
The country where early potato was
produced, if it appears on the label
a) Italian/German product
Country of Origin b) The product is not Italian/German, but the
origin appears on the label
c) No info on the country of origin
Modality of production for early
potato. Organic implies the
substitution of chemicals
(pesticides, weed killers) with
natural methods, while Env- friendly
implies a reduction in the use of
chemicals. If no labeling info, then
early potato is to be considered
neither organic nor environmentally
friendly
a) Organic product
Production Method b) Product from environmentally friendly
agriculture
c) No information
Carbon Footprint
Certification
Product with known
emissions of carbon dioxide
a) Carbon footprint logo
b) No Carbon footprint logo
5
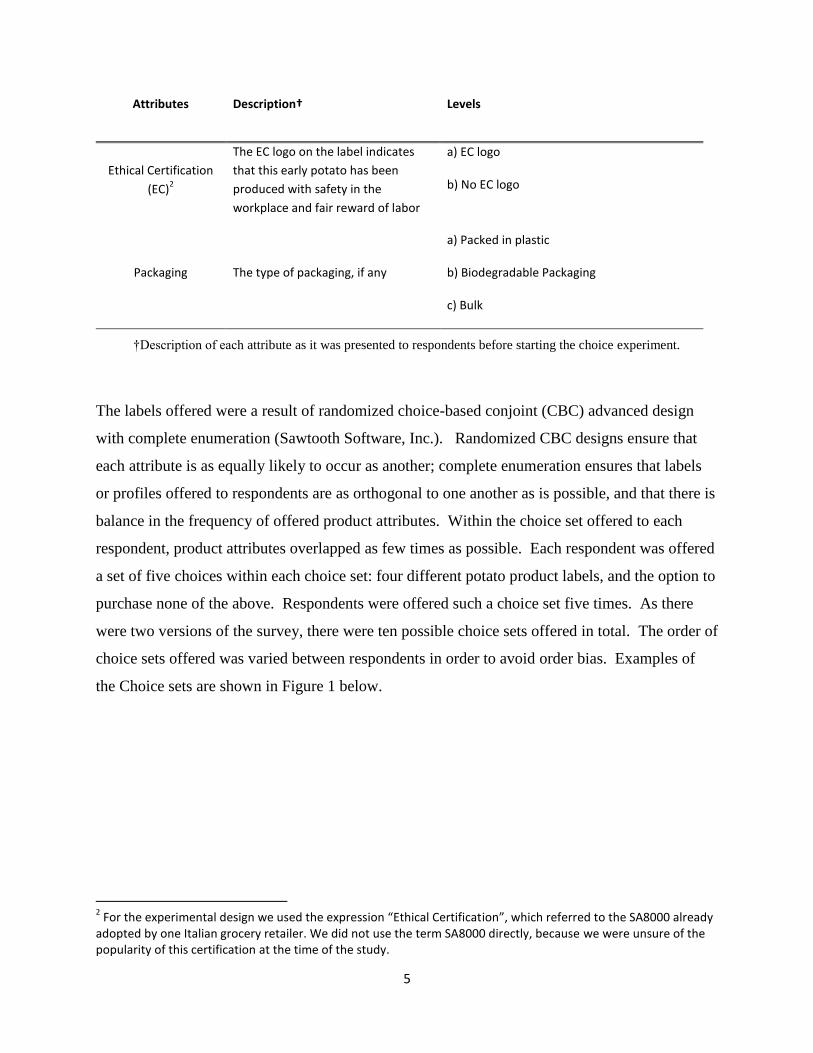
Attributes Description† Levels
Ethical Certification
(EC)2
The EC logo on the label indicates
that this early potato has been
produced with safety in the
workplace and fair reward of labor
a) EC logo
b) No EC logo
Packaging The type of packaging, if any
a) Packed in plastic
b) Biodegradable Packaging
c) Bulk
†Description of each attribute as it was presented to respondents before starting the choice experiment.
The labels offered were a result of randomized choice-based conjoint (CBC) advanced design
with complete enumeration (Sawtooth Software, Inc.). Randomized CBC designs ensure that
each attribute is as equally likely to occur as another; complete enumeration ensures that labels
or profiles offered to respondents are as orthogonal to one another as is possible, and that there is
balance in the frequency of offered product attributes. Within the choice set offered to each
respondent, product attributes overlapped as few times as possible. Each respondent was offered
a set of five choices within each choice set: four different potato product labels, and the option to
purchase none of the above. Respondents were offered such a choice set five times. As there
were two versions of the survey, there were ten possible choice sets offered in total. The order of
choice sets offered was varied between respondents in order to avoid order bias. Examples of
the Choice sets are shown in Figure 1 below.
2 For the experimental design we used the expression “Ethical Certification”, which referred to the SA8000 already
adopted by one Italian grocery retailer. We did not use the term SA8000 directly, because we were unsure of the popularity of this certification at the time of the study.
6
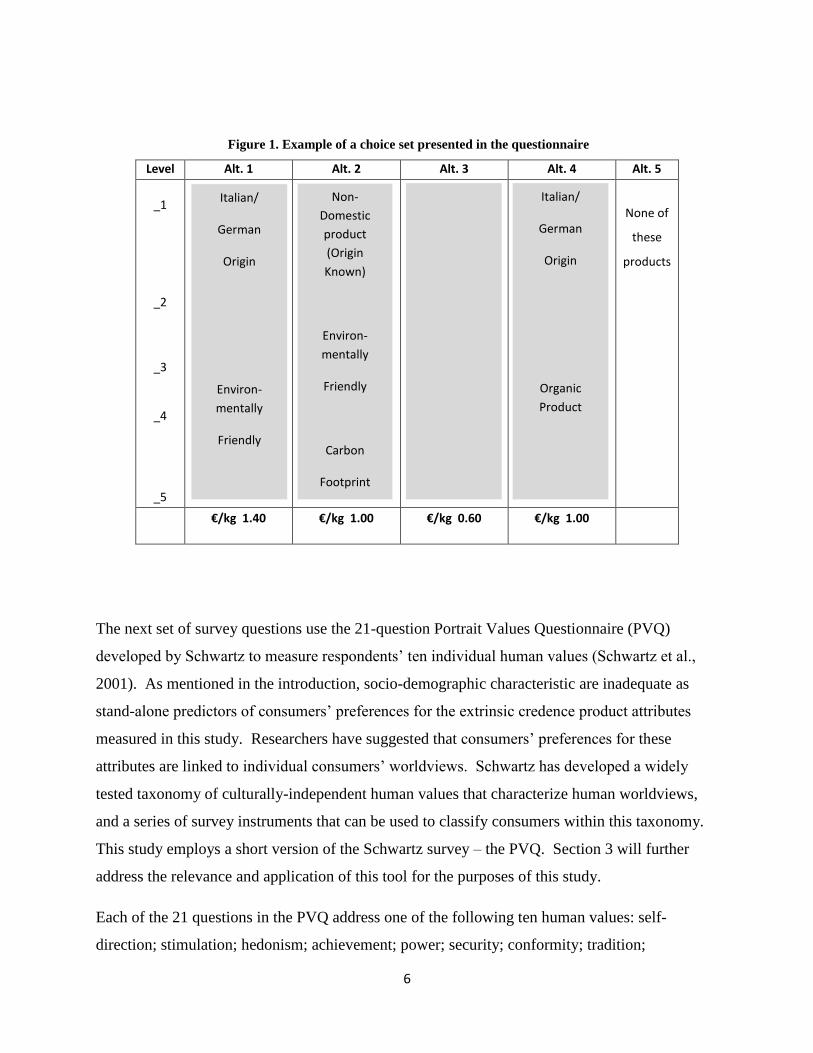
Figure 1. Example of a choice set presented in the questionnaire
Level
Alt. 1 Alt. 2 Alt. 3 Alt. 4 Alt. 5
_1
_2
_3
_4
_5
None of
these
products
€/kg 1.40 €/kg 1.00 €/kg 0.60 €/kg 1.00
The next set of survey questions use the 21-question Portrait Values Questionnaire (PVQ)
developed by Schwartz to measure respondents’ ten individual human values (Schwartz et al.,
2001). As mentioned in the introduction, socio-demographic characteristic are inadequate as
stand-alone predictors of consumers’ preferences for the extrinsic credence product attributes
measured in this study. Researchers have suggested that consumers’ preferences for these
attributes are linked to individual consumers’ worldviews. Schwartz has developed a widely
tested taxonomy of culturally-independent human values that characterize human worldviews,
and a series of survey instruments that can be used to classify consumers within this taxonomy.
This study employs a short version of the Schwartz survey – the PVQ. Section 3 will further
address the relevance and application of this tool for the purposes of this study.
Each of the 21 questions in the PVQ address one of the following ten human values: self-
direction; stimulation; hedonism; achievement; power; security; conformity; tradition;
Italian/
German
Origin
Environ-
mentally
Friendly
Carbon
Footprint
logo
Ethical Cert.
logo
Bio-
degradable
Packaging
Non-
Domestic
product
(Origin
Known)
Environ-
mentally
Friendly
Carbon
Footprint
logo
Bio-
degradable
Packaging
Packed in
plastic
Italian/
German
Origin
Organic
Product
Ethical Cert.
logo
Bulk

7
universalism; and benevolence. The survey provides respondents with statements that describe
an unknown person’s attitude, and asks respondents to rank the extent to which they identify
with this person, using a Likert scale of one to seven, where one indicates a low level of
identification and 7 ranks a high level of identification.
The final set of questions gathered socio-demographic information about the respondents and
their households. Descriptive Statistics are shown in Table 2 below.
Table 2. Socio-demographic characteristics by Country, variable name and type
Var. Name Var. Type Germany Italy
Gender (%)
Male 46 13
Female 54 87
Age(years): mean (st.dev) Age Continuous 42 (13.14) 52 (14.37)
Children<10 years old (%) Kids Dichotomous
Yes 79 81
No 21 19
Household (HH) Income (%)
<1500 Euro/month Low Income Dichotomous 38 26
1500-3050 Euro/month 39 37
>3050 Euro/month High Income Dichotomous 23 37
Education (%)
<High School 12 37
High School 54 41
Univ. Incomplete 3 7
Univ. Graduated 31 15
Geographical Region (%)
North North Dichotomous 49 50
Center 26 19
8
Var. Name Var. Type Germany Italy
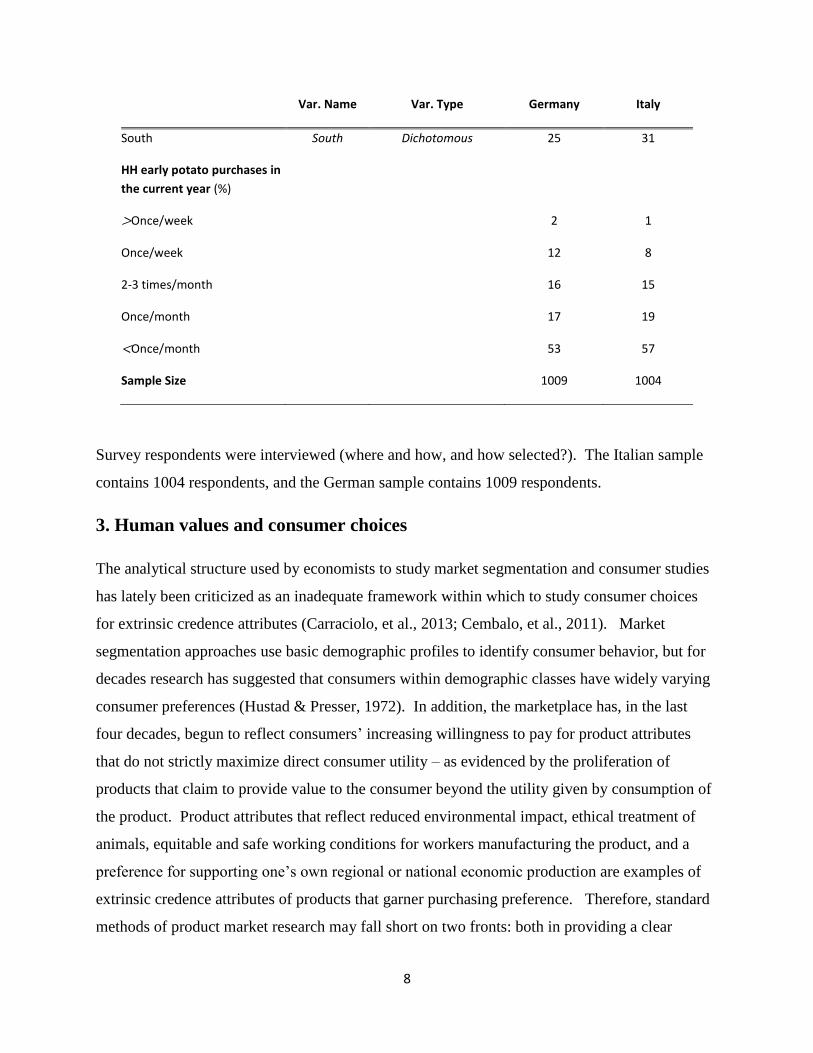
South South Dichotomous 25 31
HH early potato purchases in
the current year (%)
>Once/week 2 1
Once/week 12 8
2-3 times/month 16 15
Once/month 17 19
<Once/month 53 57
Sample Size 1009 1004
Survey respondents were interviewed (where and how, and how selected?). The Italian sample
contains 1004 respondents, and the German sample contains 1009 respondents.
3. Human values and consumer choices
The analytical structure used by economists to study market segmentation and consumer studies
has lately been criticized as an inadequate framework within which to study consumer choices
for extrinsic credence attributes (Carraciolo, et al., 2013; Cembalo, et al., 2011). Market
segmentation approaches use basic demographic profiles to identify consumer behavior, but for
decades research has suggested that consumers within demographic classes have widely varying
consumer preferences (Hustad & Presser, 1972). In addition, the marketplace has, in the last
four decades, begun to reflect consumers’ increasing willingness to pay for product attributes
that do not strictly maximize direct consumer utility – as evidenced by the proliferation of
products that claim to provide value to the consumer beyond the utility given by consumption of
the product. Product attributes that reflect reduced environmental impact, ethical treatment of
animals, equitable and safe working conditions for workers manufacturing the product, and a
preference for supporting one’s own regional or national economic production are examples of
extrinsic credence attributes of products that garner purchasing preference. Therefore, standard
methods of product market research may fall short on two fronts: both in providing a clear
9
picture of consumers’ motivations, and in defining a set of product attributes relevant to
consumers’ increasingly sophisticated tastes.
Market research, then, needs to evolve. This paper, along with a number of other recent papers,
suggests that market research must identify both the new dimensions of product information that
address extrinsic credence attributes, and a more refined method of analyzing consumer purchase
motivations with regards to these attributes. Consumers’ food shopping is determined by the
need to satisfy nutritional requirements, but food choices are driven by health and environmental
concerns. These concerns are related to current and future generations, and depend on
consumers’ lifestyles and values. Worsley and Lea (2008) suggest that personal values are
stronger predictors of consumers’ concerns about food and health than demographic
characteristics. While much work has been conducted to predict consumers’ choices based on
food attributes and observable consumers’ characteristics (discrete choice-models), less research
is available on the influence of personal values on consumer’s purchasing attitude, though values
and beliefs are likely pivotal predictors of food consumption. An example of how values and
beliefs dramatically affect consumers’ food choices is the practice of vegetarian diet (Allen and
Baines, 2002; Worsley et al., 2010), but also the search of nutrition information, the commitment
in buying organic produce, as well as the preference towards domestic products due to
ethnocentric reasons.
The objective of this study is to relate consumers’ preference towards food attributes like country
of origin, production method (i.e., organic, environmentally friendly, conventional), carbon
footprint label, fair-trade, and packaging, to their human values, and use the latter as predictors
for product choice. This analysis will be conducted by explicitly considering consumers’ values
and attitudes, using Schwartz Portrait Values (Schwartz et al., 2001): self-direction, stimulation,
hedonism, achievement, power, security, conformity, tradition, universalism and benevolence.
These values are unveiled throughout ad-hoc questionnaire, and then tested for statistical
robustness. They will be ultimately used as instruments to predict consumer’s behavior. This
method allows converting unobservable characteristics into observable market segments.
This research compares cross country differences in preferences and consumer values in two
European countries, Italy and Germany. Cross country comparisons are of paramount relevance
to obtain effective product design, and to establish different pricing strategies when export is
10
involved. We use two unique sets of cross-sectional data, collected in the two countries in 2011,
which comprise thousands of observations from representative samples of the Italian and
German population.
We ask how psychographic characteristics and marketing claims relate to product purchases.
This analysis is focused on a specific product, the early potato3. In Italy, early potato cultivation
is concentrated mainly in the southern regions, especially in small areas of the South, which have
become almost territorial districts that bind their agricultural economy to this crop. Likewise, in
Germany, early potatoes have been traditionally grown in distinctive areas, with Lower Saxony,
Pfalz and Rhineland being the most important. A crucial motivation for this study is that
consumption of domestic early potatoes has lately decreased due to competition with similar
products from Middle East and Northern African countries4.
The opportunity for Italian and German early potato producers to regain important market shares
in their respective markets depends on their ability to differentiate their product from early
potatoes supplied by other countries. In this context, the quality and the commercial identity of
the domestic product need to be well established. Improved characteristics of the product can be
signaled to consumers through labeling, which has acquired the broader role of influencing
product design, advertising, consumer confidence in food quality and consumer education on
health and environmental protection.
We would expect our model to generally show that consumers whose human values closely
correspond with humanistic tendencies, such as benevolence, security, universalism and perhaps
tradition would demonstrate preferences for ethical and carbon footprint certification and
packaging. Consumers who align with self-regarding values such as stimulation and hedonism
3 The UNECE defines “early potatoes” as potatoes harvested before they are completely mature, marketed
immediately after harvest and whose skin can be easily removed without peeling. Early potatoes from the EU and
non-EU Mediterranean area (Spain, Italy, Cyprus, Greece, Malta, Portugal, Morocco, Israel and Egypt) are
harvested and then commercialized in the first half of the calendar year. Within this group of countries, Israel and
Egypt are the main suppliers of early potatoes to the EU while, within Northern Europe, Germany is the main
producer. The season of early potatoes obtained in the Continental and Northern part of Europe starts in late May-
June and has its peak in July-August.
4 http://www.fao.org/publications/sofa/en/
11
might prefer products with potential benefits to the consumer, such as those accruing to products
with “safer” production methods, for example.
4. Methodology and Model
Our methodology follows that of Brunso et al. (2004), Cembalo et al. (2013), Kikulwe et al.
(2007), Hu, et al. (2004) and Schwartz (2001). We first evaluate the reliability of the Schwartz
Portrait Value results. Upon satisfactory reliability, we conduct a Principal Components
Analysis (PCA) with varimax rotation to reduce the number of variables and identify human
values factor loadings for both German and Italian respondents. We then use the factor loadings
along with standard demographic characteristics and extrinsic product attributes in a Latent Class
Analysis (LCA) to determine the comparative effects of these three aspects of consumer decision
making on new potato products.
4.1 Reliability
Cronbach’s alpha scores were computed for each of the 10 Schwartz Values to determine
reliability. For nine out of the ten Schwartz Values, each Value’s reliability was a function of
responses to two of the PVQ questions; for the Schwartz Value “Universalism,” the reliability
was calculated as a function of the responses to three questions (Brunso et a., 2004; Schwatz,
2001).
4.2 Principal Component Analysis
To reduce the number of variables and obtain factor loadings to be used in our LCA, we then
conducted a PCA of the Schwartz Values, using varimax rotation. The orthogonality conditions
of the varimax rotation are critical in this analysis because of the oppositional tension inherent in
the Schwartz value design (Cembalo et al., 2013). Kaiser-Meyer-Olkin tests (KMO) were
performed to verify the validity of the initial data applied to the model. Our analysis identified
four components, a significant reduction from the original 21 questions. These four components
represent the relative weight of each observation on the composition of factors.
4.3 Latent Class Analysis
12
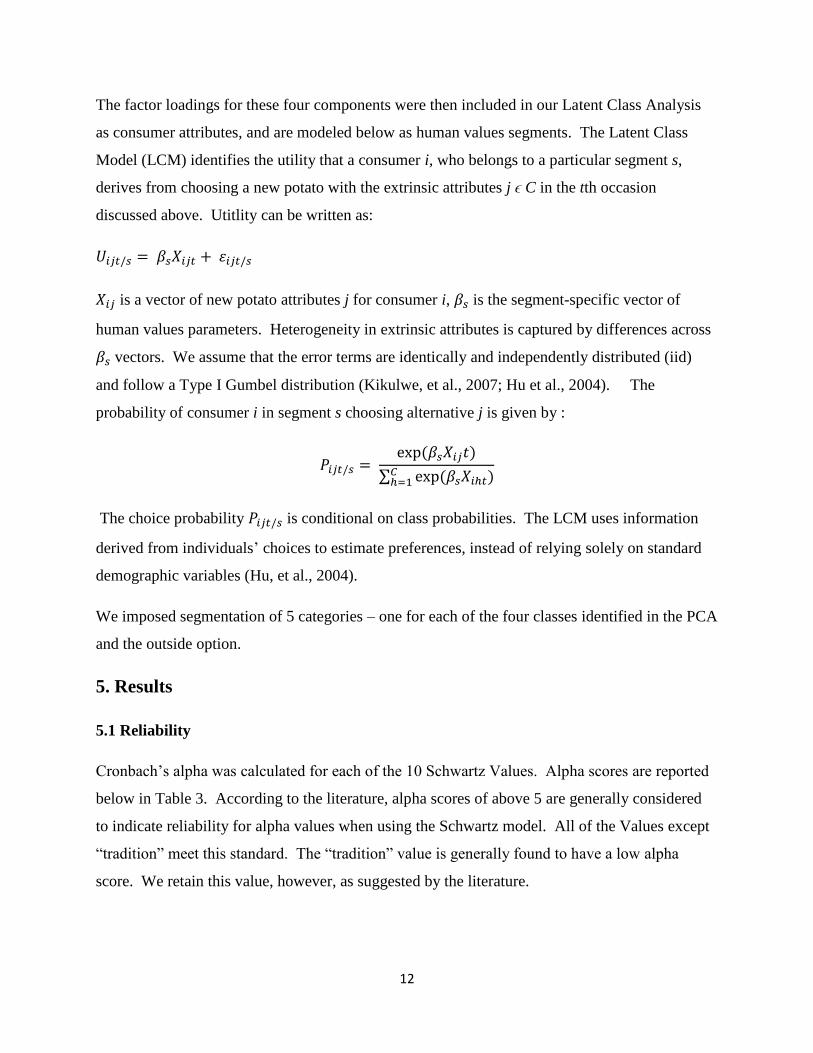
The factor loadings for these four components were then included in our Latent Class Analysis
as consumer attributes, and are modeled below as human values segments. The Latent Class
Model (LCM) identifies the utility that a consumer i, who belongs to a particular segment s,
derives from choosing a new potato with the extrinsic attributes j ϵ C in the tth occasion
discussed above. Utitlity can be written as:
is a vector of new potato attributes j for consumer i, is the segment-specific vector of
human values parameters. Heterogeneity in extrinsic attributes is captured by differences across
vectors. We assume that the error terms are identically and independently distributed (iid)
and follow a Type I Gumbel distribution (Kikulwe, et al., 2007; Hu et al., 2004). The
probability of consumer i in segment s choosing alternative j is given by :
∑
The choice probability is conditional on class probabilities. The LCM uses information
derived from individuals’ choices to estimate preferences, instead of relying solely on standard
demographic variables (Hu, et al., 2004).
We imposed segmentation of 5 categories – one for each of the four classes identified in the PCA
and the outside option.
5. Results
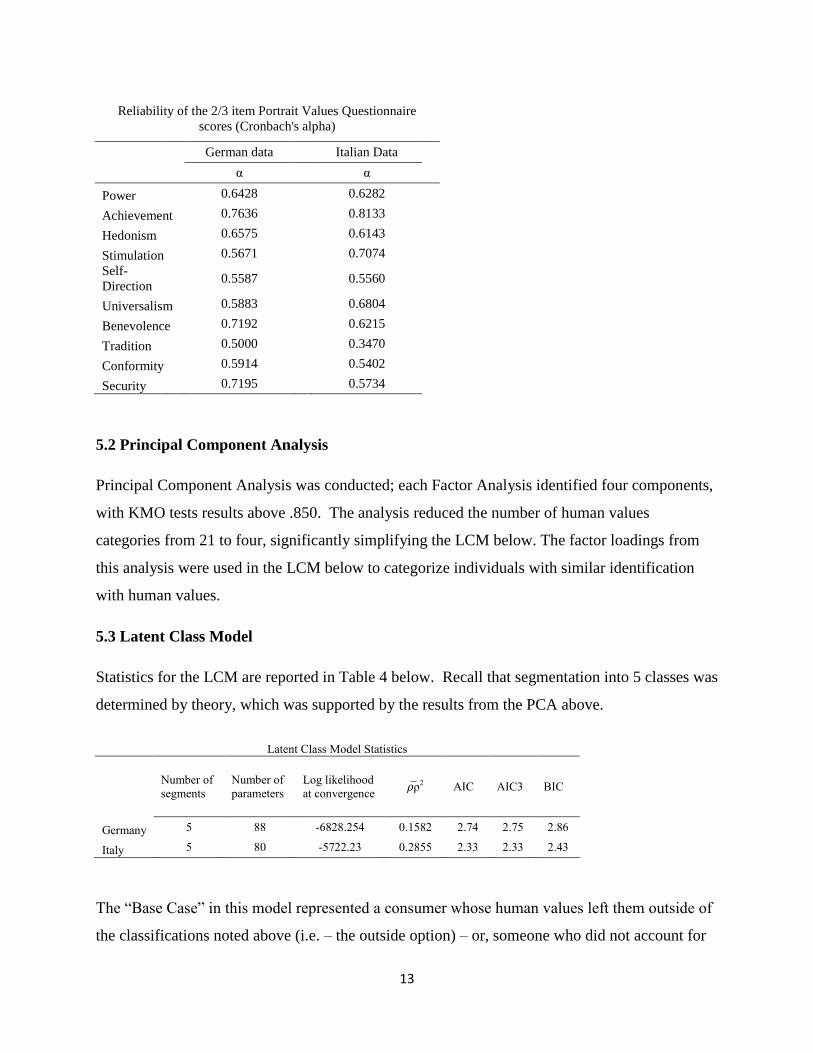
5.1 Reliability
Cronbach’s alpha was calculated for each of the 10 Schwartz Values. Alpha scores are reported
below in Table 3. According to the literature, alpha scores of above 5 are generally considered
to indicate reliability for alpha values when using the Schwartz model. All of the Values except
“tradition” meet this standard. The “tradition” value is generally found to have a low alpha
score. We retain this value, however, as suggested by the literature.
13
Reliability of the 2/3 item Portrait Values Questionnaire
scores (Cronbach's alpha)
German data Italian Data
α α
Power
0.6428
0.6282
Achievement 0.7636
0.8133
Hedonism
0.6575
0.6143
Stimulation 0.5671
0.7074
Self-
Direction 0.5587
0.5560
Universalism 0.5883
0.6804
Benevolence 0.7192
0.6215
Tradition
0.5000
0.3470
Conformity 0.5914
0.5402
Security 0.7195 0.5734
5.2 Principal Component Analysis
Principal Component Analysis was conducted; each Factor Analysis identified four components,
with KMO tests results above .850. The analysis reduced the number of human values
categories from 21 to four, significantly simplifying the LCM below. The factor loadings from
this analysis were used in the LCM below to categorize individuals with similar identification
with human values.
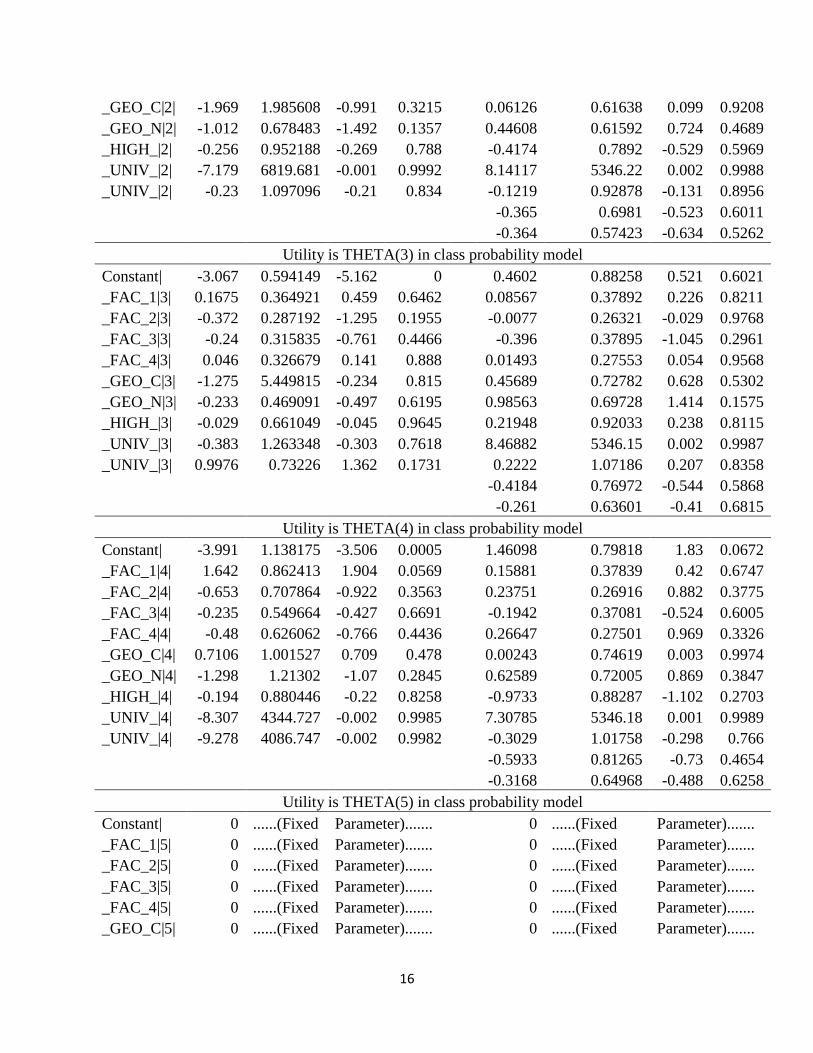
5.3 Latent Class Model
Statistics for the LCM are reported in Table 4 below. Recall that segmentation into 5 classes was
determined by theory, which was supported by the results from the PCA above.
Latent Class Model Statistics
Number of
segments
Number of
parameters
Log likelihood
at convergence 𝜌 ρ2 AIC AIC3 BIC
Germany 5 88 -6828.254 0.1582 2.74 2.75 2.86
Italy 5 80 -5722.23 0.2855 2.33 2.33 2.43
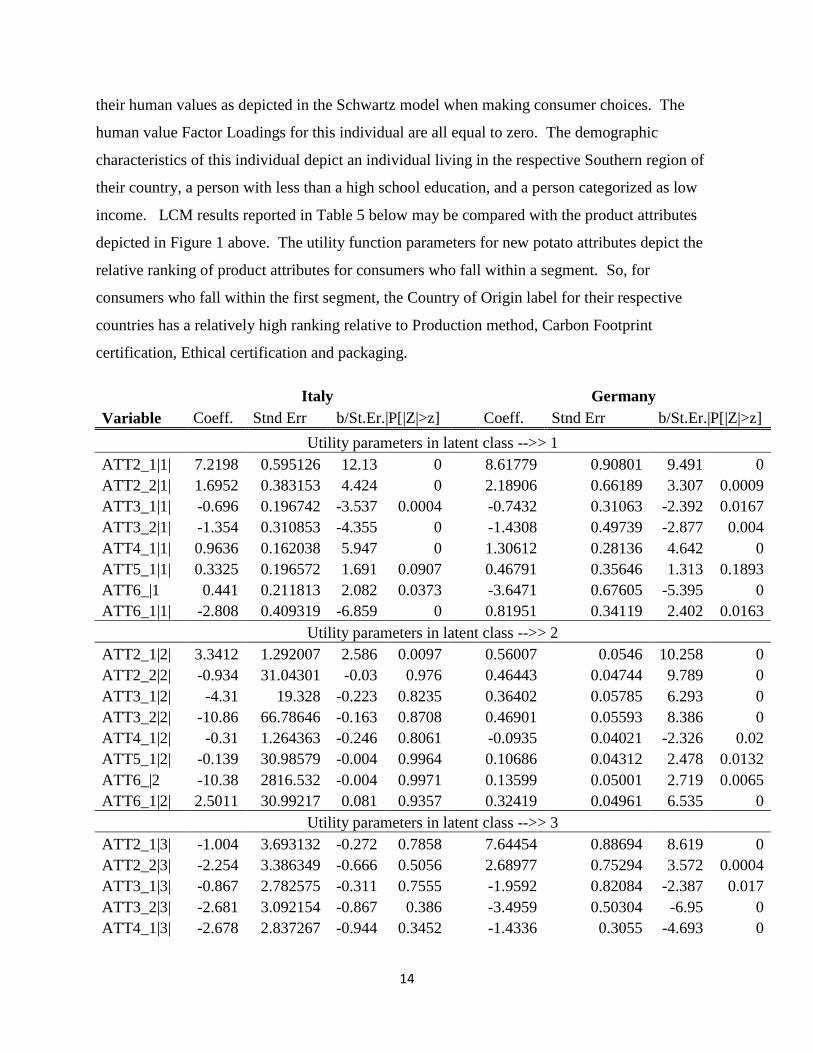
The “Base Case” in this model represented a consumer whose human values left them outside of
the classifications noted above (i.e. – the outside option) – or, someone who did not account for
14
their human values as depicted in the Schwartz model when making consumer choices. The
human value Factor Loadings for this individual are all equal to zero. The demographic
characteristics of this individual depict an individual living in the respective Southern region of
their country, a person with less than a high school education, and a person categorized as low
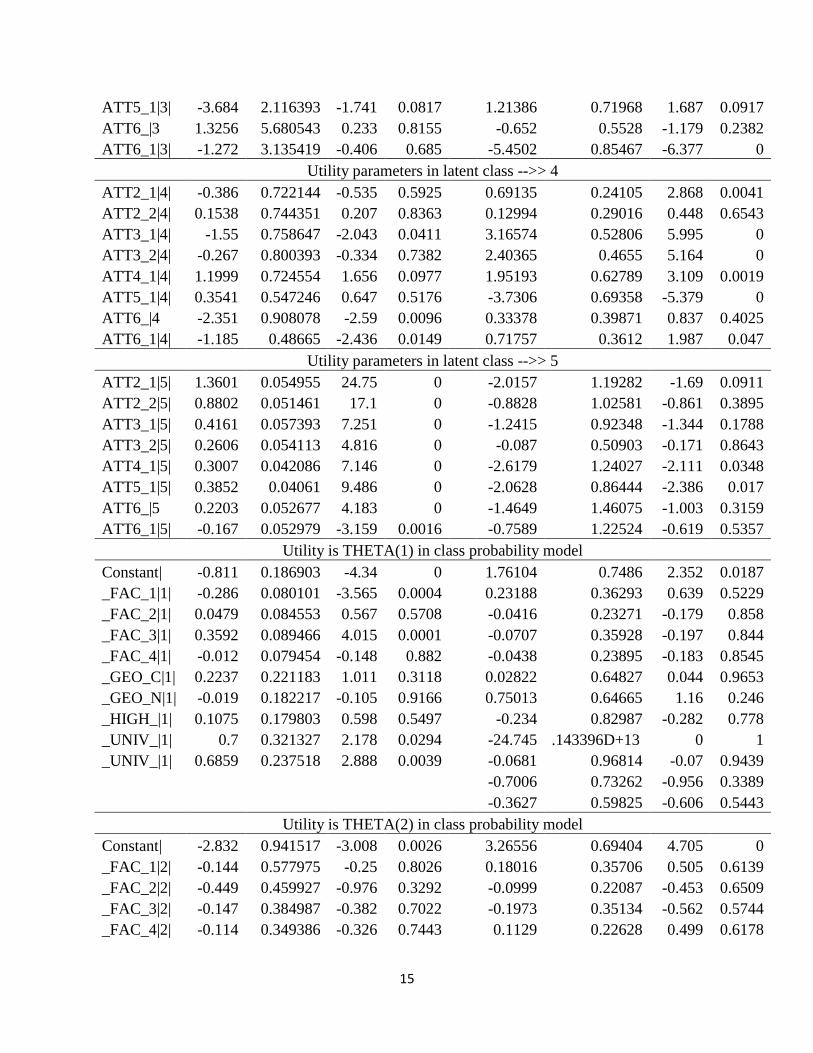
income. LCM results reported in Table 5 below may be compared with the product attributes
depicted in Figure 1 above. The utility function parameters for new potato attributes depict the
relative ranking of product attributes for consumers who fall within a segment. So, for
consumers who fall within the first segment, the Country of Origin label for their respective
countries has a relatively high ranking relative to Production method, Carbon Footprint
certification, Ethical certification and packaging.
Italy
Germany
Variable Coeff. Stnd Err b/St.Er.|P[|Z|>z] Coeff. Stnd Err b/St.Er.|P[|Z|>z]
Utility parameters in latent class -->> 1
ATT2_1|1| 7.2198 0.595126 12.13 0
8.61779 0.90801 9.491 0
ATT2_2|1| 1.6952 0.383153 4.424 0
2.18906 0.66189 3.307 0.0009
ATT3_1|1| -0.696 0.196742 -3.537 0.0004
-0.7432 0.31063 -2.392 0.0167
ATT3_2|1| -1.354 0.310853 -4.355 0
-1.4308 0.49739 -2.877 0.004
ATT4_1|1| 0.9636 0.162038 5.947 0
1.30612 0.28136 4.642 0
ATT5_1|1| 0.3325 0.196572 1.691 0.0907
0.46791 0.35646 1.313 0.1893
ATT6_|1 0.441 0.211813 2.082 0.0373
-3.6471 0.67605 -5.395 0
ATT6_1|1| -2.808 0.409319 -6.859 0 0.81951 0.34119 2.402 0.0163
Utility parameters in latent class -->> 2
ATT2_1|2| 3.3412 1.292007 2.586 0.0097
0.56007 0.0546 10.258 0
ATT2_2|2| -0.934 31.04301 -0.03 0.976
0.46443 0.04744 9.789 0
ATT3_1|2| -4.31 19.328 -0.223 0.8235
0.36402 0.05785 6.293 0
ATT3_2|2| -10.86 66.78646 -0.163 0.8708
0.46901 0.05593 8.386 0
ATT4_1|2| -0.31 1.264363 -0.246 0.8061
-0.0935 0.04021 -2.326 0.02
ATT5_1|2| -0.139 30.98579 -0.004 0.9964
0.10686 0.04312 2.478 0.0132
ATT6_|2 -10.38 2816.532 -0.004 0.9971
0.13599 0.05001 2.719 0.0065
ATT6_1|2| 2.5011 30.99217 0.081 0.9357 0.32419 0.04961 6.535 0
Utility parameters in latent class -->> 3
ATT2_1|3| -1.004 3.693132 -0.272 0.7858
7.64454 0.88694 8.619 0
ATT2_2|3| -2.254 3.386349 -0.666 0.5056
2.68977 0.75294 3.572 0.0004
ATT3_1|3| -0.867 2.782575 -0.311 0.7555
-1.9592 0.82084 -2.387 0.017
ATT3_2|3| -2.681 3.092154 -0.867 0.386
-3.4959 0.50304 -6.95 0
ATT4_1|3| -2.678 2.837267 -0.944 0.3452
-1.4336 0.3055 -4.693 0
15
ATT5_1|3| -3.684 2.116393 -1.741 0.0817
1.21386 0.71968 1.687 0.0917
ATT6_|3 1.3256 5.680543 0.233 0.8155
-0.652 0.5528 -1.179 0.2382
ATT6_1|3| -1.272 3.135419 -0.406 0.685 -5.4502 0.85467 -6.377 0
Utility parameters in latent class -->> 4
ATT2_1|4| -0.386 0.722144 -0.535 0.5925
0.69135 0.24105 2.868 0.0041
ATT2_2|4| 0.1538 0.744351 0.207 0.8363
0.12994 0.29016 0.448 0.6543
ATT3_1|4| -1.55 0.758647 -2.043 0.0411
3.16574 0.52806 5.995 0
ATT3_2|4| -0.267 0.800393 -0.334 0.7382
2.40365 0.4655 5.164 0
ATT4_1|4| 1.1999 0.724554 1.656 0.0977
1.95193 0.62789 3.109 0.0019
ATT5_1|4| 0.3541 0.547246 0.647 0.5176
-3.7306 0.69358 -5.379 0
ATT6_|4 -2.351 0.908078 -2.59 0.0096
0.33378 0.39871 0.837 0.4025
ATT6_1|4| -1.185 0.48665 -2.436 0.0149 0.71757 0.3612 1.987 0.047
Utility parameters in latent class -->> 5
ATT2_1|5| 1.3601 0.054955 24.75 0
-2.0157 1.19282 -1.69 0.0911
ATT2_2|5| 0.8802 0.051461 17.1 0
-0.8828 1.02581 -0.861 0.3895
ATT3_1|5| 0.4161 0.057393 7.251 0
-1.2415 0.92348 -1.344 0.1788
ATT3_2|5| 0.2606 0.054113 4.816 0
-0.087 0.50903 -0.171 0.8643
ATT4_1|5| 0.3007 0.042086 7.146 0
-2.6179 1.24027 -2.111 0.0348
ATT5_1|5| 0.3852 0.04061 9.486 0
-2.0628 0.86444 -2.386 0.017
ATT6_|5 0.2203 0.052677 4.183 0
-1.4649 1.46075 -1.003 0.3159
ATT6_1|5| -0.167 0.052979 -3.159 0.0016 -0.7589 1.22524 -0.619 0.5357
Utility is THETA(1) in class probability model
Constant| -0.811 0.186903 -4.34 0
1.76104 0.7486 2.352 0.0187
_FAC_1|1| -0.286 0.080101 -3.565 0.0004
0.23188 0.36293 0.639 0.5229
_FAC_2|1| 0.0479 0.084553 0.567 0.5708
-0.0416 0.23271 -0.179 0.858
_FAC_3|1| 0.3592 0.089466 4.015 0.0001
-0.0707 0.35928 -0.197 0.844
_FAC_4|1| -0.012 0.079454 -0.148 0.882
-0.0438 0.23895 -0.183 0.8545
_GEO_C|1| 0.2237 0.221183 1.011 0.3118
0.02822 0.64827 0.044 0.9653
_GEO_N|1| -0.019 0.182217 -0.105 0.9166
0.75013 0.64665 1.16 0.246
_HIGH_|1| 0.1075 0.179803 0.598 0.5497
-0.234 0.82987 -0.282 0.778
_UNIV_|1| 0.7 0.321327 2.178 0.0294
-24.745 .143396D+13 0 1
_UNIV_|1| 0.6859 0.237518 2.888 0.0039
-0.0681 0.96814 -0.07 0.9439
-0.7006 0.73262 -0.956 0.3389
-0.3627 0.59825 -0.606 0.5443
Utility is THETA(2) in class probability model
Constant| -2.832 0.941517 -3.008 0.0026
3.26556 0.69404 4.705 0
_FAC_1|2| -0.144 0.577975 -0.25 0.8026
0.18016 0.35706 0.505 0.6139
_FAC_2|2| -0.449 0.459927 -0.976 0.3292
-0.0999 0.22087 -0.453 0.6509
_FAC_3|2| -0.147 0.384987 -0.382 0.7022
-0.1973 0.35134 -0.562 0.5744
_FAC_4|2| -0.114 0.349386 -0.326 0.7443
0.1129 0.22628 0.499 0.6178
16
_GEO_C|2| -1.969 1.985608 -0.991 0.3215
0.06126 0.61638 0.099 0.9208
_GEO_N|2| -1.012 0.678483 -1.492 0.1357
0.44608 0.61592 0.724 0.4689
_HIGH_|2| -0.256 0.952188 -0.269 0.788
-0.4174 0.7892 -0.529 0.5969
_UNIV_|2| -7.179 6819.681 -0.001 0.9992
8.14117 5346.22 0.002 0.9988
_UNIV_|2| -0.23 1.097096 -0.21 0.834
-0.1219 0.92878 -0.131 0.8956
-0.365 0.6981 -0.523 0.6011
-0.364 0.57423 -0.634 0.5262
Utility is THETA(3) in class probability model
Constant| -3.067 0.594149 -5.162 0
0.4602 0.88258 0.521 0.6021
_FAC_1|3| 0.1675 0.364921 0.459 0.6462
0.08567 0.37892 0.226 0.8211
_FAC_2|3| -0.372 0.287192 -1.295 0.1955
-0.0077 0.26321 -0.029 0.9768
_FAC_3|3| -0.24 0.315835 -0.761 0.4466
-0.396 0.37895 -1.045 0.2961
_FAC_4|3| 0.046 0.326679 0.141 0.888
0.01493 0.27553 0.054 0.9568
_GEO_C|3| -1.275 5.449815 -0.234 0.815
0.45689 0.72782 0.628 0.5302
_GEO_N|3| -0.233 0.469091 -0.497 0.6195
0.98563 0.69728 1.414 0.1575
_HIGH_|3| -0.029 0.661049 -0.045 0.9645
0.21948 0.92033 0.238 0.8115
_UNIV_|3| -0.383 1.263348 -0.303 0.7618
8.46882 5346.15 0.002 0.9987
_UNIV_|3| 0.9976 0.73226 1.362 0.1731
0.2222 1.07186 0.207 0.8358
-0.4184 0.76972 -0.544 0.5868
-0.261 0.63601 -0.41 0.6815
Utility is THETA(4) in class probability model
Constant| -3.991 1.138175 -3.506 0.0005
1.46098 0.79818 1.83 0.0672
_FAC_1|4| 1.642 0.862413 1.904 0.0569
0.15881 0.37839 0.42 0.6747
_FAC_2|4| -0.653 0.707864 -0.922 0.3563
0.23751 0.26916 0.882 0.3775
_FAC_3|4| -0.235 0.549664 -0.427 0.6691
-0.1942 0.37081 -0.524 0.6005
_FAC_4|4| -0.48 0.626062 -0.766 0.4436
0.26647 0.27501 0.969 0.3326
_GEO_C|4| 0.7106 1.001527 0.709 0.478
0.00243 0.74619 0.003 0.9974
_GEO_N|4| -1.298 1.21302 -1.07 0.2845
0.62589 0.72005 0.869 0.3847
_HIGH_|4| -0.194 0.880446 -0.22 0.8258
-0.9733 0.88287 -1.102 0.2703
_UNIV_|4| -8.307 4344.727 -0.002 0.9985
7.30785 5346.18 0.001 0.9989
_UNIV_|4| -9.278 4086.747 -0.002 0.9982
-0.3029 1.01758 -0.298 0.766
-0.5933 0.81265 -0.73 0.4654
-0.3168 0.64968 -0.488 0.6258
Utility is THETA(5) in class probability model
Constant| 0 ......(Fixed Parameter).......
0 ......(Fixed Parameter).......
_FAC_1|5| 0 ......(Fixed Parameter).......
0 ......(Fixed Parameter).......
_FAC_2|5| 0 ......(Fixed Parameter).......
0 ......(Fixed Parameter).......
_FAC_3|5| 0 ......(Fixed Parameter).......
0 ......(Fixed Parameter).......
_FAC_4|5| 0 ......(Fixed Parameter).......
0 ......(Fixed Parameter).......
_GEO_C|5| 0 ......(Fixed Parameter).......
0 ......(Fixed Parameter).......
17
_GEO_N|5| 0 ......(Fixed Parameter).......
0 ......(Fixed Parameter).......
_HIGH_|5| 0 ......(Fixed Parameter).......
0 ......(Fixed Parameter).......
_UNIV_|5| 0 ......(Fixed Parameter).......
0 ......(Fixed Parameter).......
_UNIV_|5| 0 ......(Fixed Parameter).......
0 ......(Fixed Parameter).......
0 ......(Fixed Parameter).......
0 ......(Fixed Parameter).......
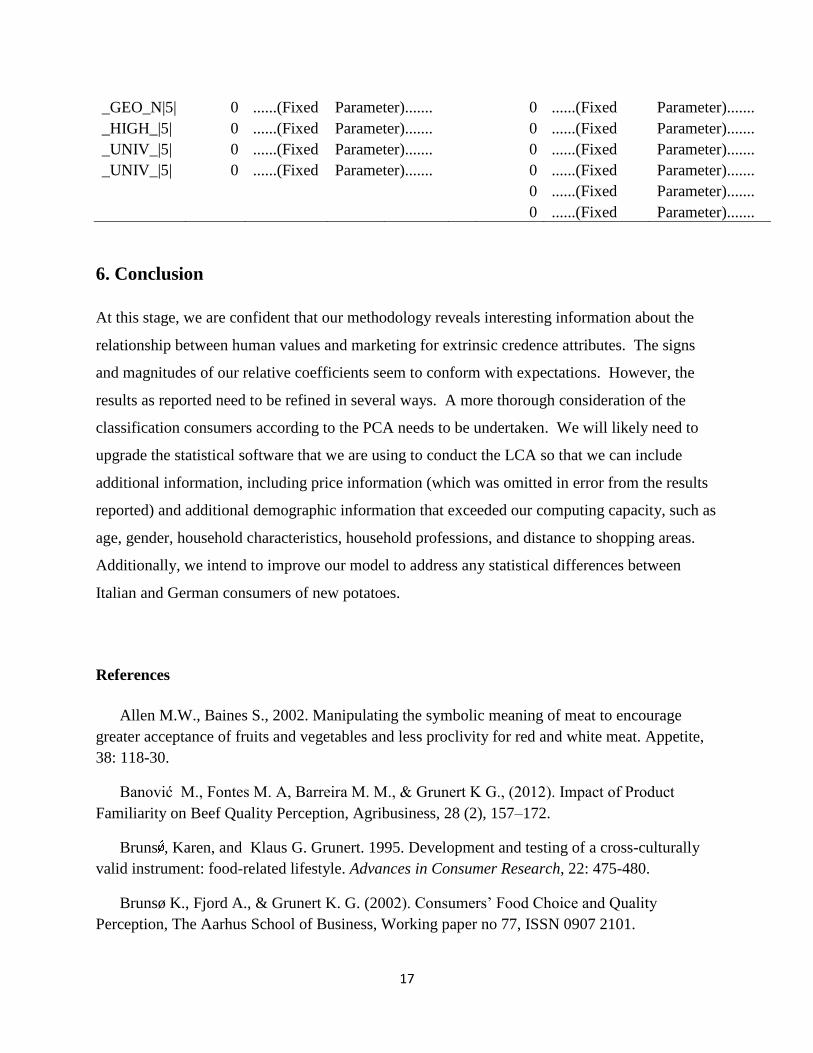
6. Conclusion
At this stage, we are confident that our methodology reveals interesting information about the
relationship between human values and marketing for extrinsic credence attributes. The signs
and magnitudes of our relative coefficients seem to conform with expectations. However, the
results as reported need to be refined in several ways. A more thorough consideration of the
classification consumers according to the PCA needs to be undertaken. We will likely need to
upgrade the statistical software that we are using to conduct the LCA so that we can include
additional information, including price information (which was omitted in error from the results
reported) and additional demographic information that exceeded our computing capacity, such as
age, gender, household characteristics, household professions, and distance to shopping areas.
Additionally, we intend to improve our model to address any statistical differences between
Italian and German consumers of new potatoes.
References
Allen M.W., Baines S., 2002. Manipulating the symbolic meaning of meat to encourage
greater acceptance of fruits and vegetables and less proclivity for red and white meat. Appetite,
38: 118-30.
Banović M., Fontes M. A, Barreira M. M., & Grunert K G., (2012). Impact of Product
Familiarity on Beef Quality Perception, Agribusiness, 28 (2), 157–172.
Bruns , Karen, and Klaus G. Grunert. 1995. Development and testing of a cross-culturally
valid instrument: food-related lifestyle. Advances in Consumer Research, 22: 475-480.
Brunsø K., Fjord A., & Grunert K. G. (2002). Consumers’ Food Choice and Quality
Perception, The Aarhus School of Business, Working paper no 77, ISSN 0907 2101.
18
Caracciolo, F., Cicia
G., Del Giudic T., Cembalo, L., Krystallis
. A., Lombari, A. and
Grunert, K.G. (2014). Human Values and Sustainability of Swine Production Systems. Working
paper, available upon request.
Caswell, J. A., & Mojduszka, E. M. (1996). Using informational labeling to influence the
market for quality in food products. American Journal of Agricultural Economics, 78 (5), 1248–
1253.
Caswell, J. A., & Padberg, D. I. (1992). Toward a more comprehensive theory of food labels.
American Journal of Agricultural Economics, 74 (2), 460–468.
Cembalo, Luigi, Giuseppina Migliore, Giorgio Schifani. 2013. Sustainability and New
Models of Consumption: The Solidarity Purchasing Groups in Sicily. Journal of Agricultural
and Environmental Ethics, 26(1): 281-303.
Cembalo, L., Lombardi, A., Pascucci, S., Dentoni, D., Migliore, G., Verneau, F., et al.
(2012). The beauty of the commons? consumers’ participation in food community
networks. 2012 AAEA/EAAE Food Environment Symposium, may 30-31, Boston, MA, (123531)
Ennekinga, U., Neumannb, C., & Hennebergc, S. (2007). How important intrinsic and
extrinsic product attributes affect purchase decision. Food Quality and Preference, 18 (1), 133–
138.
Grunert, K. G. (1993). Towards a concept of food-related life style. Appetite, 21(2), 151-155.
Grunert K.G. (1996), Market Orientation in Food and Agriculture, Kluwer, Boston, MA.
Grunert, K. G. (2005). Food quality and safety: consumer perception and demand. European
Review of Agricultural Economics, 32 (3), 369–391.
Grunert, K. G., Hieke, S., & Wills, J. (2014). Sustainability labels on food products:
Consumer motivation, understanding and use. Food Policy, 44(0), 177-189.
Hu, W., Hünnemeyer, A., Veeman, M., Adamowicz, W., & Srivastava, L. (2004). Trading
off health, environmental and genetic modification attributes in food. European Review of
Agricultural Economics, 31(3), 389-408.
Hustad, Thomas P. and Edgar A. Pessemier, ed. 1972. Industry's use of life style analysis:
Segmenting consumer market withactivity and attitude measures. Combined Proceedings, 296-
301. Chicago: American Marketing Asscoiation.
Kikulwe, E. M., Birol, E., Wesseler, J., & Falck‐Zepeda, J. (2011). A latent class approach to
investigating demand for genetically modified banana in Uganda. Agricultural Economics, 42(5),
547-560.
19
Olson J.C. (1972). Cue utilization of the quality perception process: a cognitive model and an
empirical test. PhD thesis, Purdue University, Purdue, IN.
Schwartz S.H., Melech G., Lehmann A., Burgess S., Harris M., Owens V., 2001. Extending
the cross-cultural validity of the theory of basic human values with a different method of
measurement. Cross-Cultural Psychology, 32: 519-422
Schwartz, S. H., & Boehnke, K. (2004). Evaluating the structure of human values with
confirmatory factor analysis. Journal of Research in Personality, 38(3), 230-255.
Schwartz, S. H. (2007). Universalism values and the inclusiveness of our moral
universe. Journal of Cross-Cultural Psychology, 38(6), 711-728.
Verbeke W., & Ward R.W. (2006), Consumer interest in information cues denoting quality,
traceability and origin: an application of ordered probit models to beef labels Food Quality and
Preference, 17 (6), 453-467.
Worsley A., Lea E., 2008. Consumer concerns about food and health. British Food Journal,
110: 1106-1118.
Worsley A., Wang W.C., Hunter W., 2010. Baby boomers' food shopping habits:
Relationships with demographics and personal values. Appetite, 55: 466-472.
Zeithaml, V.A., (1988). Consumer Perceptions of Price, Quality, and Value: A Means-End
Model and Synthesis of Evidence. Journal of Marketing, 52 (3), 2-22.