
Human Population Demographic Study. A population pyramid, also called age-sex pyramid and age...
35
Human Human Population Population Demographic Study
-
Upload
damian-porter -
Category
Documents
-
view
231 -
download
1
Transcript of Human Population Demographic Study. A population pyramid, also called age-sex pyramid and age...

Human PopulationHuman PopulationDemographic Study

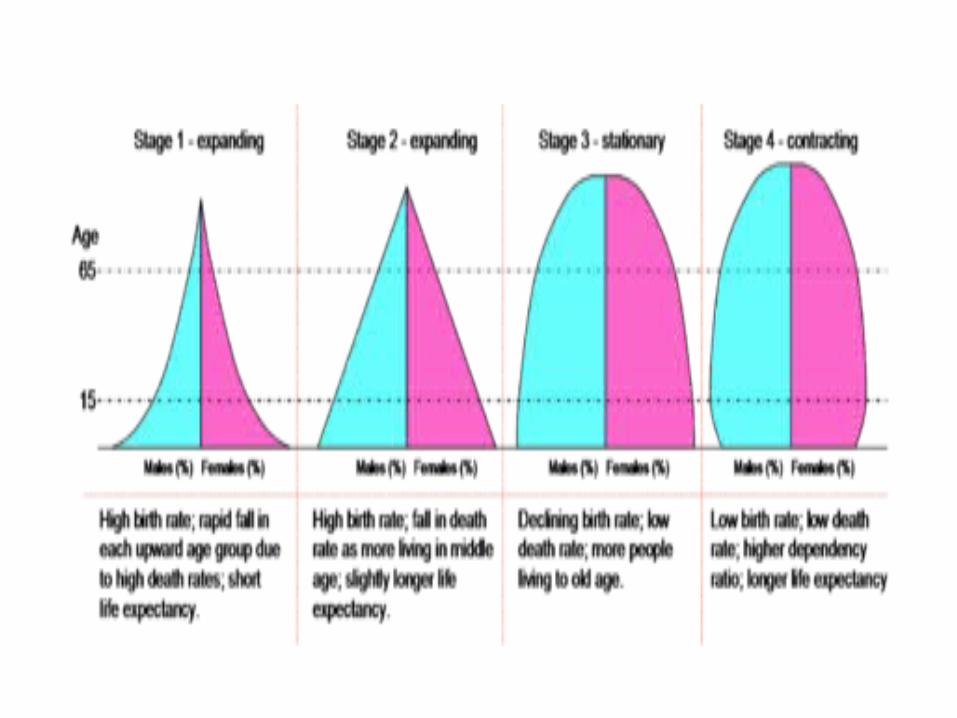
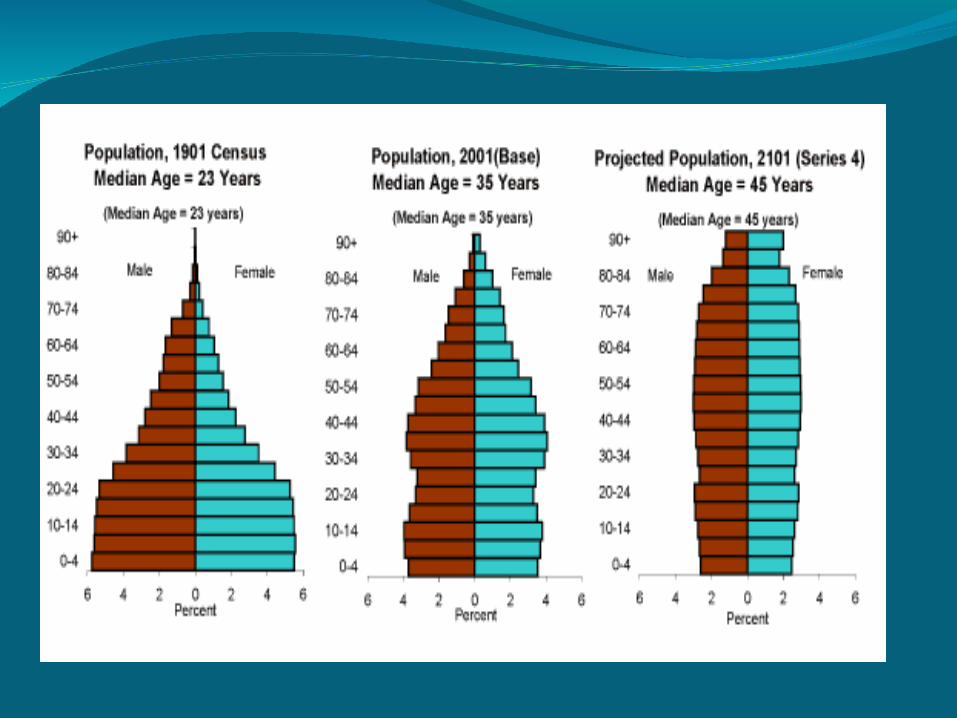
A population pyramid, also called age-sex pyramid and age structure diagram, is a graphical illustration that shows the distribution of various age groups in a population
Population PyramidPopulation Pyramid
Stationary pyramid - A population pyramid showing an unchanging pattern of fertility and mortality
Types of Population PyramidTypes of Population Pyramid
Constrictive pyramid - A population pyramid showing lower numbers or percentages of younger people. The country will have a greying population which means that people are generally older.

The age/sex structure is also called the population pyramid. This structure or pyramid is a graphic way to show the age and sex composition of a population. The sum of all age and sex groups equals 100 percent of the population.
Age/Sex StructureAge/Sex Structure

Developing CountryDeveloping Country

The developing countries have a population structure that resembles a pyramid with a broad base of young and a small apex of old. Sudan in
1995 is an example of a pyramid for a developing
country.

Developed CountryDeveloped Country
The developed countries are beginning to lose their "pyramidal" shape as they become more straight up and down with almost equal numbers of people in adjacent age groups until the ages of high death rates begin after age 65. United States in 1995 is an example of a pyramid for a developed country.
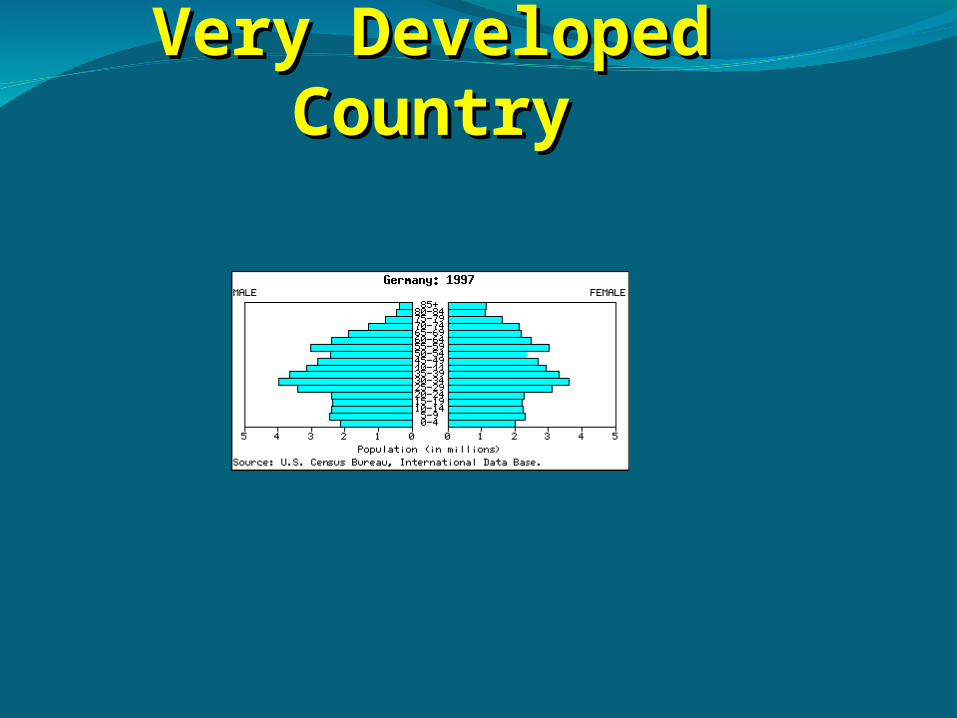
Very Developed CountryVery Developed Country
Germany is experiencing a period of negative growth (-0.1%). As negative growth in a country continues, the population is reduced. A population can shrink due to a low birth rate and a stable death rate. Increased emigration may also be a contributor to a declining population

Case StudyCase Study
Population pyramids can be used to find the number of economic dependents being supported in a particular population. Economic dependents are defined as those under 15 (children who are in full time education and therefore unable to work) and those over 65 (those who have the option of being retired).
Uses of population pyramidsUses of population pyramids
In many countries, the government plans the economy in such a way that the working population can support these dependents. Age pyramid has similar uses to population pyramid.
Population pyramids can be used to observe the natural increase, birth, and death rate.
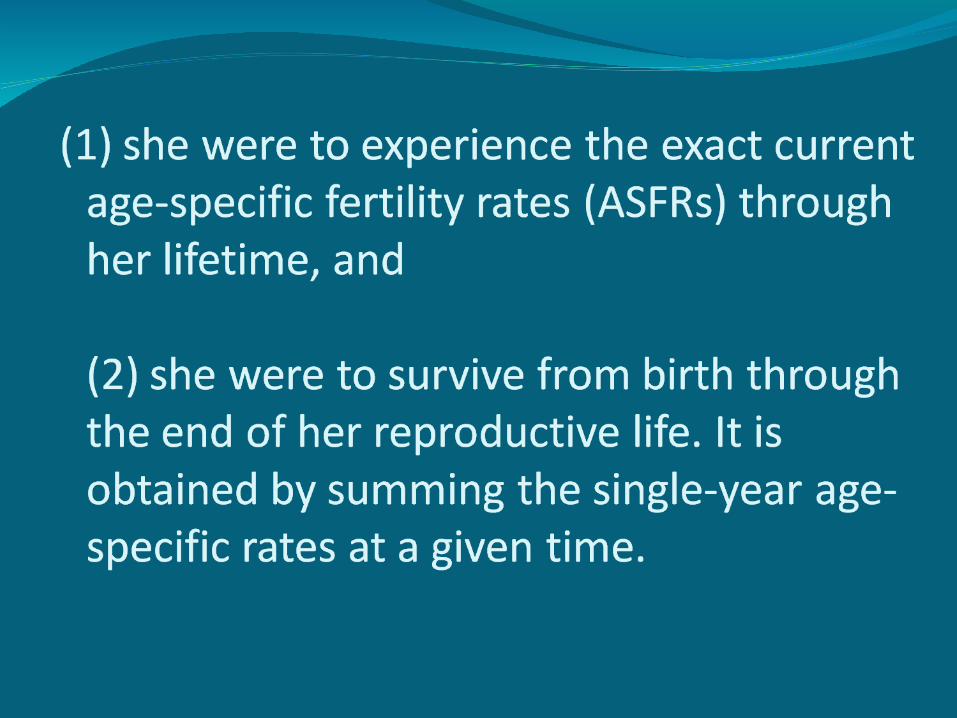
The total fertility rate (TFR, sometimes also called the fertility rate, period total fertility rate (PTFR) or total period fertility rate (TPFR)) of a population is the average number of children that would be born to a woman over her lifetime if
Total fertility rateTotal fertility rate
Replacement fertility is the total fertility rate at which newborn girls would have an average of exactly one daughter over their lifetimes. In more familiar terms, women have just enough babies to replace themselves.
Replacement ratesReplacement rates

Mortality rate is a measure of the number of deaths (in general, or due to a specific cause) in some population, scaled to the size of that population, per unit time. Mortality rate is typically expressed in units of deaths per 1000 individuals per year; thus, a mortality rate of 9.5 in a population of 100,000 would mean 950 deaths per year in that entire population.
Mortality rateMortality rate

The crude death rate, the total number of deaths per 1000 people. The crude death rate for the whole world is currently about 9.6 per 1000 per year (based on 62 million deaths in 2006, for a population of 6470 million).
The perinatal mortalityrate, the sum of neonatal deaths and fetal deaths (stillbirths) per 1,000 births.
The maternal mortality rate, the number of maternal deaths due to childbearing per 100,000 live births.

The ten countries with the highest infant mortality rate are:
Angola 192.50Afghanistan 165.96Sierra Leone 145.24Mozambique 137.08Liberia 130.51Niger 122.66Somalia 118.52Mali 117.99Tajikistan 112.10Guinea-Bissau 108.72
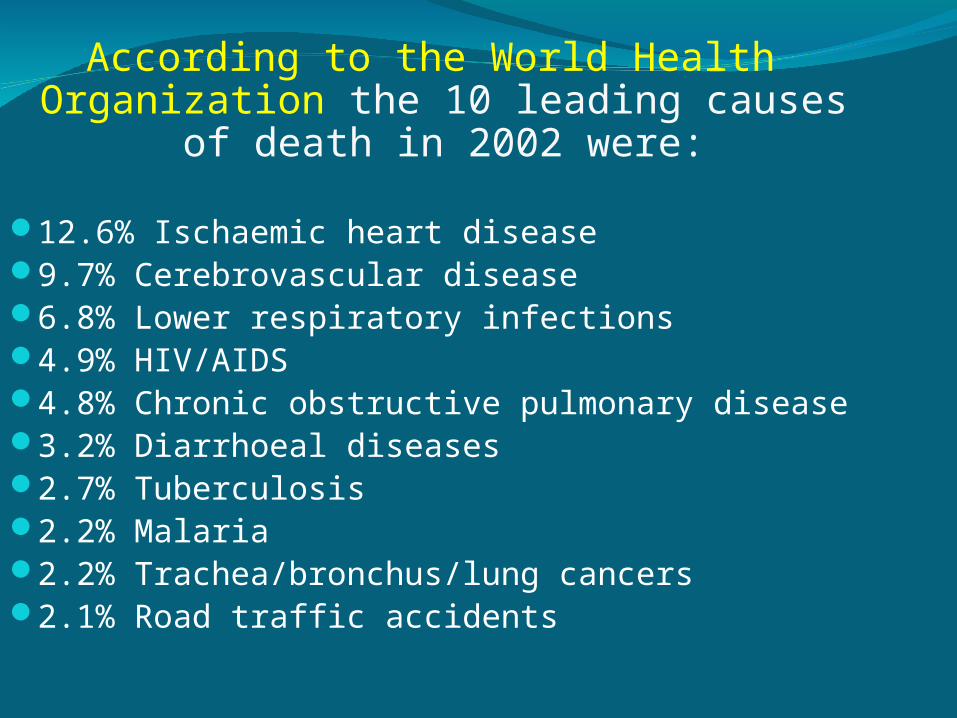
According to the World Health Organization the 10 leading causes
of death in 2002 were:
12.6% Ischaemic heart disease9.7% Cerebrovascular disease6.8% Lower respiratory infections4.9% HIV/AIDS4.8% Chronic obstructive pulmonary disease3.2% Diarrhoeal diseases2.7% Tuberculosis2.2% Malaria2.2% Trachea/bronchus/lung cancers2.1% Road traffic accidents
Age of country's populationNutrition levelsStandards of diet and housingAccess to clean drinking waterHygiene levelsLevels of infectious diseasesSocial factors such as conflicts and
levels of violent crimeAmount and quality of health care
available
Factors affecting a given death rateFactors affecting a given death rate
Life expectancy is the average number of years of life remaining at a given age. Life expectancy is heavily dependent on the criteria used to select the group.
In countries with high infant mortality rates, the life expectancy at birth is highly sensitive to the rate of death in the first few years of life.
In these cases, another measure such as life expectancy at age 5 (e5) can be used to exclude the effects of infant mortality to reveal the effects of causes of death other than early childhood causes.
Life ExpectancyLife Expectancy
If one does not consider the many women who die while giving birth or in pregnancy, the female human life expectancy is considerably higher than those of men, who, on average, consume more tobacco, alcohol and drugs than females in most societies.
Gender Differences In Life Gender Differences In Life ExpectancyExpectancy


Emigration is the act of leaving one's native country or region to settle in another.
It is the same as immigration but from the perspective of the country of origin.
Human movement before the establishment of state boundaries or within one state, is termed migration.
Immigration/EmigrationImmigration/Emigration

War or other armed conflict Famine or drought Disease Poverty Political corruption Disagreement with politics Religious fundamentalism / religious intolerance Natural disasters Discontent with the natives, such as frequent
harassment, bullying, and abuse Discontent with immigration rate, causing frequent
harassment, bullying, and abuse for home populations
Lack of employment opportunities Lack of various rights
Push factorsPush factors

Higher incomesLower taxesBetter weatherBetter availability of employmentBetter medical facilitiesBetter education facilitiesBetter behaviour among peopleFamily reasonsPolitical stabilityReligious toleranceRelative freedomNational prestige
Pull factorsPull factors
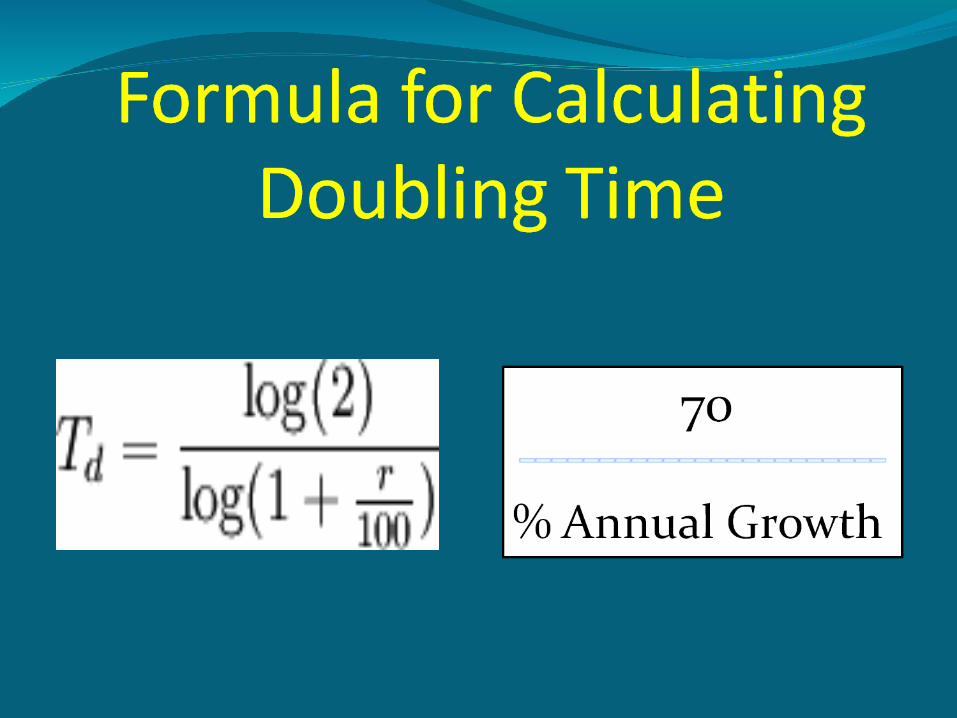
The doubling time is the period of time required for a quantity to double in size or value. It is applied to
population growth inflationresource extraction consumption of goods
Doubling timeDoubling time
Examining the doubling time can give a more intuitive sense of the long-term impact of growth than simply viewing the percentage growth rate.
For a constant growth rate of r%, the formula for the doubling time Td is given by