
Human Factors in Traffic Engineering - Prism Web … systems and cell phones, ... •Vehicle...
14
Human Factors in Traffic Engineering Ali Etezady Daejin Kim April 20, 2016 CEE 6603 – Traffic Engineering Final Presentation
Transcript of Human Factors in Traffic Engineering - Prism Web … systems and cell phones, ... •Vehicle...

Human Factors in
Traffic Engineering
Ali Etezady
Daejin Kim
April 20, 2016
CEE 6603 – Traffic Engineering Final Presentation

Introduction ConclusionLiterature Case Study
Introduction
• What is “Human Factors Engineering”
•Science that applies knowledge from psychology, physiology, and kinesiology to the
design of devices and systems for safe and effective human use
•Many applications across the diverse fields of science such as biomedical
engineering, industrial engineering, mechanical engineering, etc.
• Human Factors in Transportation engineering
•Human physical, perceptual, and cognitive limitations Potential causes of crashes
•Highway design and design of vehicles
2Introduction

Introduction ConclusionLiterature Case Study
Literature review
• There are numerous studies in literature on the application of human factors
principles in traffic engineering
• Intersections• Bellomo-McGee (2003): evaluating Intersection Collision Avoidance System concepts aimed at reducing the number of high-
crash intersections. Human factors important to the selection and design of infrastructure-based technology were identified as
driver age, vehicle gap acceptance, and response to emergency events
• Bonneson and McCoy (1994): driver understanding of protected and permitted left-turn signal displays. The results showed that
only 70 percent of respondents correctly understood the meaning of Protected and Permitted Left Turn (PPLT) signs, and this
understanding increased among the more educated, and decreased among the more experienced and older drivers.
• Gattis and Low (1997): intersection angle and drivers’ field of view. The results indicated that a minimum intersection angle of
70 to 75 degrees will provide for an improved line of sight and consequently decrease the probability of crashes
3Literature

Introduction ConclusionLiterature Case Study
Literature review
• Speed management• Feng (2001): presented an overview of the research on the relationship between speed and safety. The studies show that drivers
may not always accurately rate their driving behavior, so relying on subjective surveys may not be wise. In addition, weather
has a close relationship with speed and safety because it affects visibility, stability, and controllability of drivers and cars
• Pedestrian and bicyclists
• Nabors et al (2012): the behavior and movement patterns of both cyclists and pedestrians are important predictors in the
occurrence of crashes and should further be investigated
• DaSilva et al. (2003) showed the effect of age and time of day on the frequency of pedestrian crashes. Children and teenagers
tend to have more accidents and more accidents occur at night time when visibility is limited
• Visibility
• Barker et al. (1998) conducted a study on improving the conspicuity of trailblazing signs for incident management. Their results
indicated that using a color combination other than the traditional one will improve driver performance and safety
• Lewin et al. (2003) investigated the use of three different light sources for roadway lighting. The result showed the
interrelationship between lamp spectrum, visibility, and safety
4Literature

Introduction ConclusionLiterature Case Study
Case Study
5Case Study
• Relevant research done by US
government such as NHTSA,
• and some private automobile
companies
• Traffic safety, human’s comfort,
and productiveness of human users
and operators
• Traffic accidents are mainly related
to visibility and unsafe behaviors
Program areas Subcategory
Safety Problem
Identification
Early adopters of technology studies
Naturalistic driving studies
Metric development
Visibility and Lighting
Headlighting
Rear signaling
Vehicle conspicuity
Visibility
Driver Assistance
Warning systems (Forward collision, Lane departure,
Intersection violation warning)
Other driver assistance (ACC, Parking aids)
Reducing Unsafe
Behaviors
Alcohol impairment
Distraction
Teen drivers
Seatbelt and child seat use
Encouraging Fuel Efficient Driving
NHTSA (http://www.nhtsa.gov/Research/Human+Factors)

Introduction ConclusionLiterature Case Study
Case Study (Visibility and Lighting)
6Case Study
• Headlighting
• Public complaints about headlamp glare
• Increased risks: two-lane highways and over the age
of 50 (NHTSA 2001)
• Also, glare increases discomfort for drivers
• Rear signaling
• Rear-end crashes account for more than 29 percent
of all crashes (NHTSA 2007)
• Due to a failure to respond (or delays in responding)
to stopped or decelerating lead vehicles
• NHTSA (2010) tested enhanced break lights, and it
shows to somewhat increase drivers’ detection rates
Enhanced break light invented by NHTSA

Introduction ConclusionLiterature Case Study
Case Study (Visibility and Lighting)
7Case Study
• Daytime Running Lights (DRL)
• Arguments that high-intensity DRLs create
problems with glare and turn signal masking and
conspicuity of motorcycles
• Motorcycle rider fatalities increased from 2294 to
5290 between 1998 to 2008 (NHTSA 2010)
• NHTSA suggests enhancing the frontal conspicuity
of motorcycles with lighting treatments
• Backover crashes
• Due to vehicle blind zones, drivers’ inadequate
visual scanning behavior, and drivers’ expectation
that no obstacles are present behind the vehicle
• The victims are frequently young children
• Rearview video systems were invented to help
drivers to widen the rear visibility
Image from: http://news.motorbiker.org/blogs.nsf/dx/now-the-dutch-want-to-force-drl.htm
Images from: https://www.hoffmannpersonalinjury.com/rearview-video-systems-added-to-list-of-recommended-safety-
technologies/; http://www.gizmag.com/cadillac-video-rear-view-mirror/35302/pictures#4
Introduction ConclusionLiterature Case Study
Case Study (Unsafe Behaviors)
8Case Study
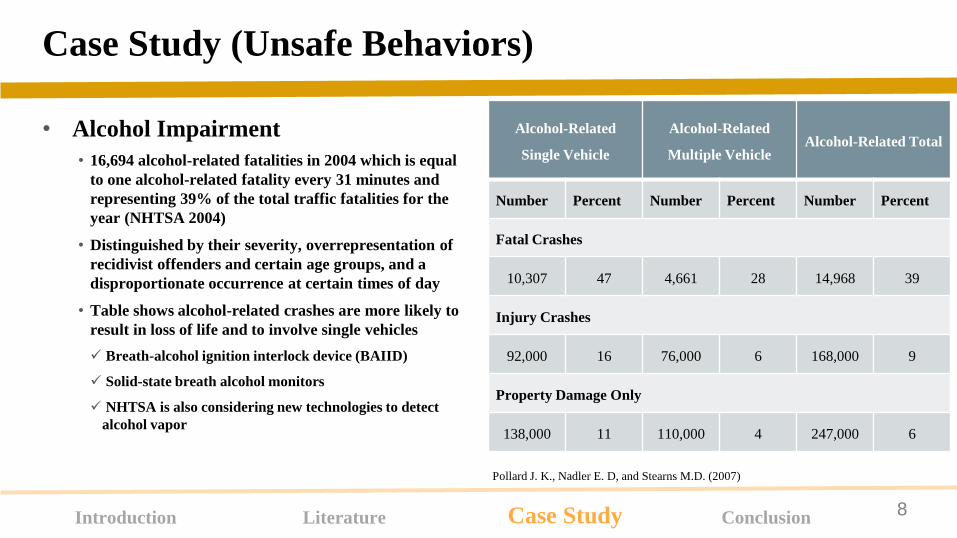
• Alcohol Impairment
• 16,694 alcohol-related fatalities in 2004 which is equal
to one alcohol-related fatality every 31 minutes and
representing 39% of the total traffic fatalities for the
year (NHTSA 2004)
• Distinguished by their severity, overrepresentation of
recidivist offenders and certain age groups, and a
disproportionate occurrence at certain times of day
• Table shows alcohol-related crashes are more likely to
result in loss of life and to involve single vehicles
Breath-alcohol ignition interlock device (BAIID)
Solid-state breath alcohol monitors
NHTSA is also considering new technologies to detect
alcohol vapor
Alcohol-Related
Single Vehicle
Alcohol-Related
Multiple VehicleAlcohol-Related Total
Number Percent Number Percent Number Percent
Fatal Crashes
10,307 47 4,661 28 14,968 39
Injury Crashes
92,000 16 76,000 6 168,000 9
Property Damage Only
138,000 11 110,000 4 247,000 6
Pollard J. K., Nadler E. D, and Stearns M.D. (2007)

Introduction ConclusionLiterature Case Study
Case Study (Unsafe Behaviors)
9Case Study
• Distraction
• Defined as “drivers divert their attention away from
the driving task to focus on another activity instead”
• Main causes: electronic distractions, such as
navigation systems and cell phones, or more
conventional distractions such as interacting with
passengers and eating
• Table shows the relative risk of crashes
The most influential factor is reaching for a moving
object
Looking at external object, reading, applying makeup,
dialing hand-held device, and passenger in adjacent seat
are significant factors
Type of Secondary Task Odds Ratio
Reaching for a moving object 8.82
Insect in vehicle 6.37
Looking at external object 3.70
Reading 3.38
Applying makeup 3.13
Dialing hand-held device 2.79
Inserting/retrieving CD 2.25
Eating 1.57
Reaching for non-moving object 1.38
Talking/listing to a hand-held device 1.29
Drinking from open container 1.03
Other personal hygiene 0.70
Adjusting the radio 0.50
Passenger in adjacent seat 0.50
Passenger in rear seat 0.39
Child in rear seat 0.33
Note: Statistically significant results are colored red
Klauer et al., 2006

Introduction ConclusionLiterature Case Study
Case Study (Unsafe Behaviors)
10Case Study
• Teen Drivers
• Novice teen drivers have exceptionally high rates of crash involvement (NHTSA 2010). In 2006, 5,658 young drivers
between the ages of 16 and 20 were killed in traffic crashes, and an additional 410,000 were injured (NHTSA, 2007)
• Traditional measurements: driver training, graduated licensing, enforcement, and safety education
• NHTSA is exploring new approach using advanced in-vehicle technologies to monitor novice teen driver’s behavior
• Vehicle Adaptations: Automatically prohibiting behaviors detected, e.g., safety belt interlocks;
• In-Vehicle Feedback: Providing drivers with real time information, e.g., speeding in curves;
• Reporting: Recording behaviors to transmit them at a later time to parents, insurance companies, driver educators, etc.
• Drowsy Driving
• Drowsy driving is a significant contributor to death and injury crashes, accounting for more than 80,000 crashes and 850
fatalities per year (NHTSA 2014)
• Successful detection of drowsiness is a crucial step
• NHTSA’s research showed the feasibility of detecting drowsiness with vehicle-based sensors

Introduction ConclusionLiterature Case Study
Case Study (Human factors in connected vehicle)
11Case Study
• Crash Warning Interfaces
• The human factors issues concern how to integrate
and display all of the information a driver may want
or need in a manner that is safe and usable
• The challenges are that the CV concept may provide
drivers with a large number of safety messages, many
sorts of non-safety information, and a variety of
different design and display concepts implemented by
various manufacturers and developers
Images from: http://www.continental-
corporation.com/www/pressportal_com_en/themes/press_releases/3_automotive_group/int
erior/press_releases/pr_2014_07_14_overview2014_en.html

Introduction ConclusionLiterature Case Study
Conclusion and Future research
• Human factors are widely used in developing vehicle equipment, transportation
facilities and relevant regulations to enhance traffic safety and drivers’ comfort
• The early stage of human factor engineering in the transportation field focused on
physical abilities (e.g. visualization ability) and unsafe behaviors of human
• Nowadays, the human factors engineering in the transportation field has broadened its
research area with the advent of new technologies such as connected vehicle program
• To sum up, this research recommends that engineers and researchers better understand
the impact of human factors on a variety of traffic situations.
• Also, engineers need to understand that many traffic situations are not only affected by
one specific human factor, but also by a combination of several human factors.
12Conclusion

QUESTIONS?
13

Introduction ConclusionLiterature Case Study
1. Barker, J.A., Neale, V.L., and Dingus, T.A. (1998). Improving the Conspicuity of Trailblazing Signs for Incident Management, VTRC 98-CR36.
2. Bellomo-McGee, Inc (2003). Intersection Collision Avoidance Study, Final Report.
3. Bonneson and McCoy (1994). Driver Understanding of Protected and Permitted Left-Turn Signal Displays, Transportation Research Record 1464, pp. 42-
50.
4. Bullough, J.D., Boyce, P.R., Bierman, A., Hunter, C.M., Conway, K.M., Nakata, A., and Figuerio, M.G. (2001). Transportation Research Record 1754,
pp. 42-47.
5. daSilva, M.P., Smith, J.D., and Najm, W.G (2003). Analysis of Pedestrian Crashes, DOT-HS-809-585.
6. Feng, C. (2001). Synthesis of Studies on Speed and Safety, Transportation Research Record 1779, p. 86-92.
7. Gattis, J.L., and Low, S.T. (1997). Intersection Angles and the Driver’s Field of View, Transportation Research Record 1612, pp. 56-72.
8. Holstein, W., Human-factors engineering, Encyclopedia Britannica, Retrieved from: http://www.britannica.com/topic/human-factors-engineering.
9. Highway Safety Manual 1st edition (2010). American Association of State Highway and Transportation Officials.
10. Lewin, I., Box, P., and Stark, R.E (2003). Roadway Lighting: An Investigation and Evaluation of Three Different Light Sources, Final report prepared for
Arizona Department of Transportation, GHWA-AZ-03-522.
11. NHTSA (2011) Effect of Daytime Running Lights On Left Turning Drivers’ Gap Acceptance
12. Pollard J. K., Nadler E. D, and Stearns M.D. (2007). Review of Technology to Prevent Alcohol-Impaired Crashes
13. Klauer, S. G., Dingus, T. A., Neale, V. L., Sudweeks, J. D., Ramsey, D. J. (2006). The Impact of Driver Inattention on Near-Crash/Crash Risk: An
Analysis Using the 100-Car Naturalistic Driving Study Data. DOT HS 810 594. Washington, DC: National Highway Traffic Safety Administration.
14. Nabors, D., Goughnour, E., Thomas, L., DeSantis, W., Sawyer, M. (2012). Bicycle Road Safety Audit Guidelines and Prompt Lists, FHWA-SA-12-018.
15. NHTSA (2010) An Exploration of Vehicle-Based Monitoring of Novice Teen Drivers: Final Report
16. NHTSA (2014) Human Factors for Connected Vehicles: Effective Warning Interface Research Findings
17. NHTSA (2014) Assessing the Feasibility of Vehicle-based Sensors to Detect Drowsy Driving
Resources
14


