Human Exposure Risk Assessment Due to Heavy Metals in ...€¦ · water Article Human Exposure Risk...
16
water Article Human Exposure Risk Assessment Due to Heavy Metals in Groundwater by Pollution Index and Multivariate Statistical Methods: A Case Study from South Africa Vetrimurugan Elumalai 1, *, K. Brindha 2 and Elango Lakshmanan 3 1 Department of Hydrology, University of Zululand, Kwa Dlangezwa 3886, South Africa 2 Department of Civil and Environmental Engineering, National University of Singapore, Singapore 117576, Singapore; [email protected] 3 Department of Geology, Anna University, Chennai 600025, India; [email protected] * Correspondence: [email protected] or [email protected]; Tel./Fax: +27-35-902-6404 Academic Editor: Athanasios Loukas Received: 13 December 2016; Accepted: 19 March 2017; Published: 11 April 2017 Abstract: Heavy metals in surface and groundwater were analysed and their sources were identified using multivariate statistical tools for two towns in South Africa. Human exposure risk through the drinking water pathway was also assessed. Electrical conductivity values showed that groundwater is desirable to permissible for drinking except for six locations. Concentration of aluminium, lead and nickel were above the permissible limit for drinking at all locations. Boron, cadmium, iron and manganese exceeded the limit at few locations. Heavy metal pollution index based on ten heavy metals indicated that 85% of the area had good quality water, but 15% was unsuitable. Human exposure dose through the drinking water pathway indicated no risk due to boron, nickel and zinc, moderate risk due to cadmium and lithium and high risk due to silver, copper, manganese and lead. Hazard quotients were high in all sampling locations for humans of all age groups, indicating that groundwater is unsuitable for drinking purposes. Highly polluted areas were located near the coast, close to industrial operations and at a landfill site representing human-induced pollution. Factor analysis identified the four major pollution sources as: (1) industries; (2) mining and related activities; (3) mixed sources- geogenic and anthropogenic and (4) fertilizer application. Keywords: human exposure risk; drinking water pathway; heavy metals; Mhlathuze Catchment; Empangeni; Richards Bay; South Africa 1. Introduction Human habitation and disposal of wastes affect the water supply sources and leads to new environmental issues. Metals enter into surface water and groundwater through weathering of rocks [1–3] or from human activities including mining, industrial wastes or airborne particulate matter [4,5]. Groundwater pollution due to heavy metals where it is used as a source of drinking water [6–8] and the possible risk to human health has been studied widely [9,10]. This is because certain heavy metals are required for normal functioning of the human body, but exposure to excess concentration of heavy metals may lead to health risks. World Health Organisation (WHO) lists four heavy metals (arsenic, lead, mercury and cadmium) in its list of ten chemicals as a major public health concern [11]. Arsenic is a much studied heavy metal in groundwater affecting larger parts of Asia [12–15] and is mainly geogenic in origin. Many industrial practices like combustion, extraction and processing use heavy metals for production. Wastewater from these industries will contain heavy metals that pollute soil, surface Water 2017, 9, 234; doi:10.3390/w9040234 www.mdpi.com/journal/water
Transcript of Human Exposure Risk Assessment Due to Heavy Metals in ...€¦ · water Article Human Exposure Risk...

water
Article
Human Exposure Risk Assessment Due to HeavyMetals in Groundwater by Pollution Index andMultivariate Statistical Methods: A Case Study fromSouth Africa
Vetrimurugan Elumalai 1,*, K. Brindha 2 and Elango Lakshmanan 3
1 Department of Hydrology, University of Zululand, Kwa Dlangezwa 3886, South Africa2 Department of Civil and Environmental Engineering, National University of Singapore, Singapore 117576,
Singapore; [email protected] Department of Geology, Anna University, Chennai 600025, India; [email protected]* Correspondence: [email protected] or [email protected]; Tel./Fax: +27-35-902-6404
Academic Editor: Athanasios LoukasReceived: 13 December 2016; Accepted: 19 March 2017; Published: 11 April 2017
Abstract: Heavy metals in surface and groundwater were analysed and their sources were identifiedusing multivariate statistical tools for two towns in South Africa. Human exposure risk through thedrinking water pathway was also assessed. Electrical conductivity values showed that groundwateris desirable to permissible for drinking except for six locations. Concentration of aluminium, leadand nickel were above the permissible limit for drinking at all locations. Boron, cadmium, iron andmanganese exceeded the limit at few locations. Heavy metal pollution index based on ten heavymetals indicated that 85% of the area had good quality water, but 15% was unsuitable. Humanexposure dose through the drinking water pathway indicated no risk due to boron, nickel and zinc,moderate risk due to cadmium and lithium and high risk due to silver, copper, manganese and lead.Hazard quotients were high in all sampling locations for humans of all age groups, indicating thatgroundwater is unsuitable for drinking purposes. Highly polluted areas were located near the coast,close to industrial operations and at a landfill site representing human-induced pollution. Factoranalysis identified the four major pollution sources as: (1) industries; (2) mining and related activities;(3) mixed sources- geogenic and anthropogenic and (4) fertilizer application.
Keywords: human exposure risk; drinking water pathway; heavy metals; Mhlathuze Catchment;Empangeni; Richards Bay; South Africa
1. Introduction
Human habitation and disposal of wastes affect the water supply sources and leads to newenvironmental issues. Metals enter into surface water and groundwater through weathering ofrocks [1–3] or from human activities including mining, industrial wastes or airborne particulatematter [4,5]. Groundwater pollution due to heavy metals where it is used as a source of drinkingwater [6–8] and the possible risk to human health has been studied widely [9,10]. This is becausecertain heavy metals are required for normal functioning of the human body, but exposure to excessconcentration of heavy metals may lead to health risks. World Health Organisation (WHO) listsfour heavy metals (arsenic, lead, mercury and cadmium) in its list of ten chemicals as a major publichealth concern [11]. Arsenic is a much studied heavy metal in groundwater affecting larger parts ofAsia [12–15] and is mainly geogenic in origin.
Many industrial practices like combustion, extraction and processing use heavy metals forproduction. Wastewater from these industries will contain heavy metals that pollute soil, surface
Water 2017, 9, 234; doi:10.3390/w9040234 www.mdpi.com/journal/water

Water 2017, 9, 234 2 of 16
water and groundwater if proper care is not taken in the disposal [16,17]. Tanneries causing chromiumpollution due to use of chromium sulphate during the tanning process is a major concern in Bangladeshand India [18–20]. Due to poor management, landfills [21,22] and municipal wastewater [23] havebeen the source of groundwater and soil pollution especially in developing countries. Occurrenceof metals in groundwater in areas possessing mineral deposits and associated mining activities arecommon [24–27]. Potential risk of heavy metal contamination due to application of fertilisers wasreported by many others [28–30].
South Africa is experiencing a water crisis and the problem is more aligned towards water qualitythan the quantity. Challenges to water shortage and access to water of desirable quality includepopulation increase, economic growth and climate change. Agricultural practices mostly depend ongroundwater in many parts of the country apart from public water supply. Almost two-thirds of thecountry’s population rely on groundwater for domestic needs [31]. Hence, there is increasing stress tomaintain the quality of water so that it does not have any negative impact on human health or floraand fauna. Deterioration of water quality will have wider economic implications on various sectorsincluding agriculture, industry and recreation [32]. The Department of Water Affairs and Forestry(DWAF) of the Republic of South Africa has reported that effluent discharge from industries had ledto salinisation and contamination due to heavy metals in groundwater, but the exact contaminantlevels are not available [32]. There are several studies on heavy metals in groundwater in severalparts of the world including some urban areas in South Africa. More studies on regional water qualitybased on heavy metals are essential to quantify the extent of pollution and plan for possible measuresof mitigation. Thus, in this study, water quality assessment was carried out in Richards Bay andEmpangeni towns of South Africa. The demand for water in these areas is increasing to satisfy theneeds of industries, mining, agriculture and urban water supply. Being a highly industrialised andcommercial region of South Africa, there is ample scope to study and improve the groundwater qualityof this region, which is considered a highly vulnerable area to pollution [32].
Studies that involve large datasets or involve assessment of many parameters rely on statisticaltechniques to interpret and group the common or independent source of the parameters [33]. Suchtechniques serve as a rapid and powerful tool for scientists and decision-makers to arrive at amanagement solution [34]. This study was carried out with an aim to quantify the heavy metalsin groundwater and to evaluate the impact of human-induced activities on groundwater in SouthAfrica using multivariate statistical analysis and human exposure risk analysis through the drinkingwater pathway.
2. Materials and Methods
2.1. Description of Study Area
The study area forms part of the Mhlathuze Catchment, which is centred around the two majortowns- Empangeni and Richards Bay. These two towns are located 160 km north of Durban, the capitalof the KwaZulu-Natal Province, South Africa. It covers an area of approximately 792 km2 (Figure 1).This region experiences a humid and wet climate, which is unique compared to the other Africanregions [35]. The average daily temperature varies between 21 ◦C and 29 ◦C during January–Marchand from 12 ◦C to 23 ◦C during June–August. Located in one of the highest rainfall regions in SouthAfrica [36], this catchment receives an annual rainfall ranging from 850 mm in the west to over 1200 mmalong the coastal belt [31]. Most of the rainfall occurs from October to March and winter rain is mostoften associated with frontal weather from the south. The Mhlathuze River is one of the largest riversthat originates from the Babanago hills and flows through Empangeni and Richards Bay where itdrains into the Indian Ocean. The study area is characterized by a fairly flat to undulating landformwith low hills and flat bottomed drainage features. Surface water flows in both natural and artificialdrainage channels. Soil in this area is highly permeable and a large portion of rainfall infiltrates intothe subsurface. The Zululand coastal plain was formed in recent Cenozoic time (post Cretaceous)
Water 2017, 9, 234 3 of 16
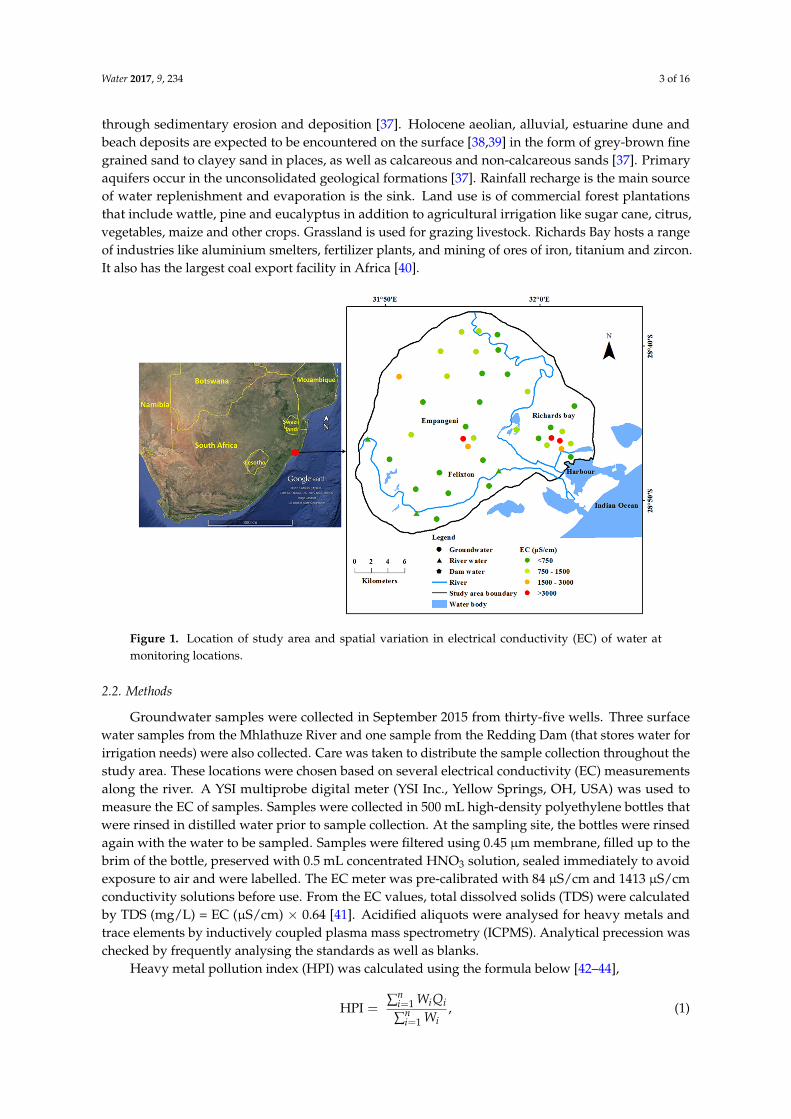
through sedimentary erosion and deposition [37]. Holocene aeolian, alluvial, estuarine dune andbeach deposits are expected to be encountered on the surface [38,39] in the form of grey-brown finegrained sand to clayey sand in places, as well as calcareous and non-calcareous sands [37]. Primaryaquifers occur in the unconsolidated geological formations [37]. Rainfall recharge is the main sourceof water replenishment and evaporation is the sink. Land use is of commercial forest plantationsthat include wattle, pine and eucalyptus in addition to agricultural irrigation like sugar cane, citrus,vegetables, maize and other crops. Grassland is used for grazing livestock. Richards Bay hosts a rangeof industries like aluminium smelters, fertilizer plants, and mining of ores of iron, titanium and zircon.It also has the largest coal export facility in Africa [40].
Water 2017, 9, 234 3 of 16
of grey-brown fine grained sand to clayey sand in places, as well as calcareous and non-calcareous sands [37]. Primary aquifers occur in the unconsolidated geological formations [37]. Rainfall recharge is the main source of water replenishment and evaporation is the sink. Land use is of commercial forest plantations that include wattle, pine and eucalyptus in addition to agricultural irrigation like sugar cane, citrus, vegetables, maize and other crops. Grassland is used for grazing livestock. Richards Bay hosts a range of industries like aluminium smelters, fertilizer plants, and mining of ores of iron, titanium and zircon. It also has the largest coal export facility in Africa [40].
Figure 1. Location of study area and spatial variation in electrical conductivity (EC) of water at monitoring locations.
2.2. Methods
Groundwater samples were collected in September 2015 from thirty-five wells. Three surface water samples from the Mhlathuze River and one sample from the Redding Dam (that stores water for irrigation needs) were also collected. Care was taken to distribute the sample collection throughout the study area. These locations were chosen based on several electrical conductivity (EC) measurements along the river. A YSI multiprobe digital meter (YSI Inc., Yellow Springs, OH, USA) was used to measure the EC of samples. Samples were collected in 500 mL high-density polyethylene bottles that were rinsed in distilled water prior to sample collection. At the sampling site, the bottles were rinsed again with the water to be sampled. Samples were filtered using 0.45 µm membrane, filled up to the brim of the bottle, preserved with 0.5 mL concentrated HNO3 solution, sealed immediately to avoid exposure to air and were labelled. The EC meter was pre-calibrated with 84 µS/cm and 1413 µS/cm conductivity solutions before use. From the EC values, total dissolved solids (TDS) were calculated by TDS (mg/L) = EC (µS/cm) × 0.64 [41]. Acidified aliquots were analysed for heavy metals and trace elements by inductively coupled plasma mass spectrometry (ICPMS). Analytical precession was checked by frequently analysing the standards as well as blanks.
Heavy metal pollution index (HPI) was calculated using the formula below [42–44],
HPI = ∑∑ , (1)
Figure 1. Location of study area and spatial variation in electrical conductivity (EC) of water atmonitoring locations.
2.2. Methods
Groundwater samples were collected in September 2015 from thirty-five wells. Three surfacewater samples from the Mhlathuze River and one sample from the Redding Dam (that stores water forirrigation needs) were also collected. Care was taken to distribute the sample collection throughout thestudy area. These locations were chosen based on several electrical conductivity (EC) measurementsalong the river. A YSI multiprobe digital meter (YSI Inc., Yellow Springs, OH, USA) was used tomeasure the EC of samples. Samples were collected in 500 mL high-density polyethylene bottles thatwere rinsed in distilled water prior to sample collection. At the sampling site, the bottles were rinsedagain with the water to be sampled. Samples were filtered using 0.45 µm membrane, filled up to thebrim of the bottle, preserved with 0.5 mL concentrated HNO3 solution, sealed immediately to avoidexposure to air and were labelled. The EC meter was pre-calibrated with 84 µS/cm and 1413 µS/cmconductivity solutions before use. From the EC values, total dissolved solids (TDS) were calculatedby TDS (mg/L) = EC (µS/cm) × 0.64 [41]. Acidified aliquots were analysed for heavy metals andtrace elements by inductively coupled plasma mass spectrometry (ICPMS). Analytical precession waschecked by frequently analysing the standards as well as blanks.
Heavy metal pollution index (HPI) was calculated using the formula below [42–44],
HPI =∑n
i=1 WiQi
∑ni=1 Wi
, (1)

Water 2017, 9, 234 4 of 16
where Wi and Qi are the unit weightage and sub-index of the i-th parameter, respectively, and n isnumber of parameters considered:
Wi = K/Si, (2)
K =1
∑ni=1
1Si
, (3)
where K and Si are the proportionality constant and the standard permissible limit in water for the i-thparameter, respectively,
Qi =n
∑i=1
|Mi − Ii|(Si − Ii)
× 100, (4)
where Mi, Ii and Si are the monitored value, ideal value and standard value of i-th parameter.Human exposure to heavy metals is through several pathways including oral, inhalation and
dermal. Due to the risk of using groundwater for drinking use, the human exposure risk throughthe drinking water pathway is calculated using the modified equation from the United StatesEnvironmental Protection Agency (US EPA) [45]:
HEDW = (C × IR)/(BW), (5)
where HEDW, C, IR and BW are the human exposure risk through drinking water pathway(mg/kg/day), concentration of the heavy metal in water (mg/L), ingestion rate of water (L/day) andbody weight (kg), respectively.
Hazard quotient (HQ) for non-carcinogenic risk for each heavy metal is calculated by
HQ = HEDW/RfD, (6)
where RfD is the oral toxicity reference dose for a heavy metal that an individual can be exposedto (mg/kg/day). HQ is calculated for each heavy metal and the sum of HQ of all metals is used todetermine the non-carcinogenic risk. HQ < 1 is considered safe for human health.
IBM SPSS Statistics 22.0 (IBM, Armonk, NY, USA) was used for correlation and factor analysis.Correlation matrix helps to identify the positive and negative relationship among the heavy metals.Factor analysis to group the samples based on similarity can be expressed as,
xj =n
∑r=1
ajr fr + ej, (7)
where xj is the measured variable, ajr is the factor loading for j-th variable on the r-th factor, fr is ther-th common factor, n is the number of factors and ej is the random variation unique to the measuredvariable, xj [46].
3. Results
EC is a good indicator of total salinity or total amount of dissolved solids in water. Though it doesnot provide detailed information about the ionic composition in water, this can be used to determinethe suitability of water for drinking and irrigation use. Desirable EC in drinking water is <750 µS/cmand the range between 750 and 1500 µS/cm is permissible. Groundwater quality at eighteen locationswas desirable and eleven locations was permissible for drinking (Figure 1). Three groundwatersamples were not permissible i.e., ranging from 1500 to 3000 µS/cm and three samples were hazardouswith high EC exceeding above 3000 µS/cm. Surface water samples from the Mhlathuze River haveEC < 750 µS/cm. Though this is suitable for drinking, it is not used for a domestic purpose in this area.Water stored in the dam for irrigation use had permissible EC.
TDS also helps to determine the suitability of water for drinking and irrigation. Groundwaterat twenty-nine locations was either desirable or permissible for drinking, whereas, at four locations,

Water 2017, 9, 234 5 of 16
the water could be used only for irrigation. As a worst case, at two locations, the TDS was higherthan 3000 mg/L (same locations as EC because TDS is calculated from EC) and unfit for any intendeduse [47]. Groundwater will require treatment if it has to be used for domestic water supply. If this waterwas used for irrigation, it will increase the salinity of the soil. Prolonged use of high TDS water willturn the soil unsuitable for plant growth and irrigation will have to shift to more salt-resistant crops.
The unsuitable groundwater samples based on TDS were located near the Richards Bay harbourand in the central part near Empangeni. River water samples were within 500 mg/L of TDS and donot pose threat to human health due to consumption. Dam water was also permissible for drinkingand not harmful for irrigation (Table 1). TDS indicates that surface water from the river and thedam are fresh [48]. Twenty-nine groundwater samples were fresh while five locations with TDSbetween 1000 and 10,000 mg/L were brackish. One groundwater sample having TDS of 16,806 mg/Lis classified as saline (Table 1). This sample is located close to the active landfill and the dumping ofwastes from the Empangeni town have increased the groundwater salinity.
Table 1. Water type classification based on total dissolved solids (TDS).
Parameter Range Classification
Number of Samples
Surface Water(N = 4)
Groundwater(N = 35)
TDS (mg/L) [47]
<500 Desirable for drinking 3 19500–1000 Permissible for drinking 1 10
1000–3000 Useful for irrigation 0 4
>3000 Unfit for drinking andirrigation 0 2
TDS (mg/L) [48]
<1000 Fresh 3 291000–10,000 Brackish 1 5
10,000–100,000 Saline 0 1>100,000 Brine 0 0
Range of heavy metals measured in the water samples is given in Figure 2. Concentration ofmetals in water was compared against the water quality standards for drinking and domestic use.South African water quality guidelines for domestic use proposes a target water quality range, whichis described as ‘what is considered good or ideal water quality’. Water quality outside of this rangemay, under certain circumstances, still be acceptable [49]. These ranges are available only for eight ofthe heavy metals studied and, of these, aluminium, cadmium and chromium (VI) have no standardrange, but has a no-effect range as the target guideline (Table 2). Comparison of the target water qualityrange of South Africa with the health based guidelines by the WHO [50] are given in Table 2.
Water 2017, 9, 234 5 of 16
TDS also helps to determine the suitability of water for drinking and irrigation. Groundwater at twenty-nine locations was either desirable or permissible for drinking, whereas, at four locations, the water could be used only for irrigation. As a worst case, at two locations, the TDS was higher than 3000 mg/L (same locations as EC because TDS is calculated from EC) and unfit for any intended use [47]. Groundwater will require treatment if it has to be used for domestic water supply. If this water was used for irrigation, it will increase the salinity of the soil. Prolonged use of high TDS water will turn the soil unsuitable for plant growth and irrigation will have to shift to more salt-resistant crops.
The unsuitable groundwater samples based on TDS were located near the Richards Bay harbour and in the central part near Empangeni. River water samples were within 500 mg/L of TDS and do not pose threat to human health due to consumption. Dam water was also permissible for drinking and not harmful for irrigation (Table 1). TDS indicates that surface water from the river and the dam are fresh [48]. Twenty-nine groundwater samples were fresh while five locations with TDS between 1000 and 10,000 mg/L were brackish. One groundwater sample having TDS of 16,806 mg/L is classified as saline (Table 1). This sample is located close to the active landfill and the dumping of wastes from the Empangeni town have increased the groundwater salinity.
Table 1. Water type classification based on total dissolved solids (TDS).
Parameter Range Classification Number of Samples
Surface Water (N = 4)
Groundwater (N = 35)
TDS (mg/L) [47]
<500 Desirable for drinking 3 19 500–1000 Permissible for drinking 1 10 1000–3000 Useful for irrigation 0 4
>3000 Unfit for drinking and irrigation 0 2
TDS (mg/L) [48]
<1000 Fresh 3 29 1000–10,000 Brackish 1 5
10,000–100,000 Saline 0 1 >100,000 Brine 0 0
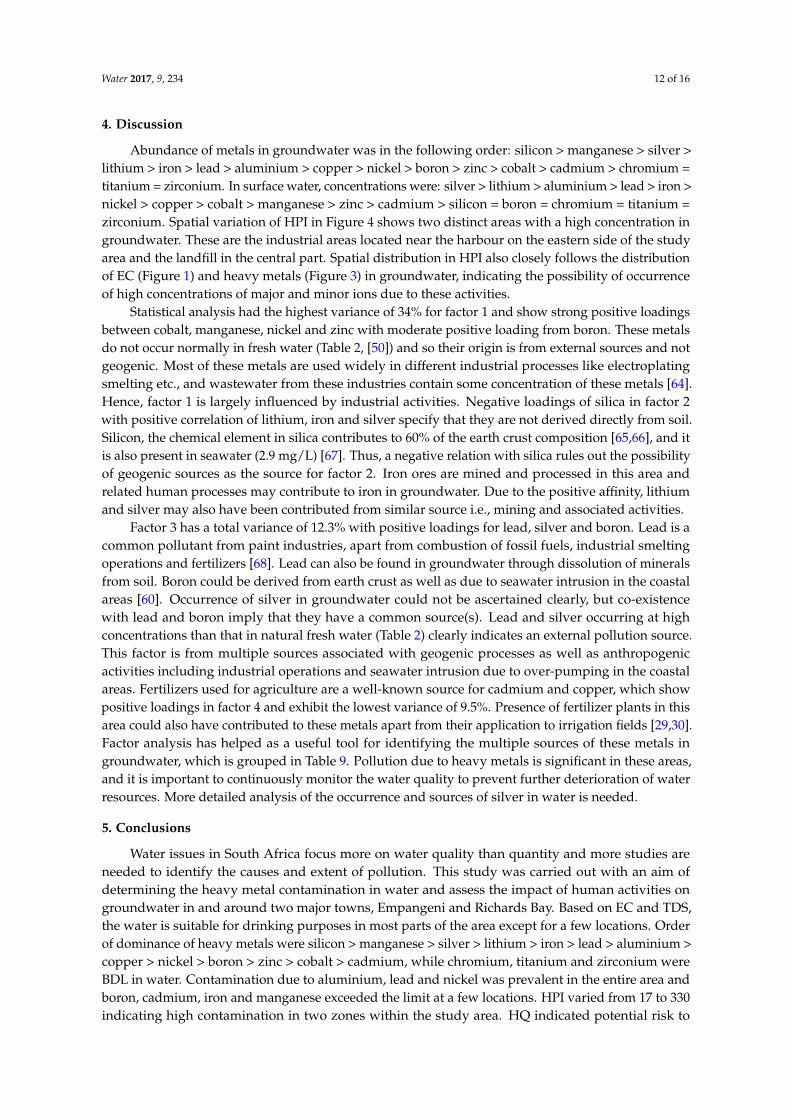
Range of heavy metals measured in the water samples is given in Figure 2. Concentration of metals in water was compared against the water quality standards for drinking and domestic use. South African water quality guidelines for domestic use proposes a target water quality range, which is described as ‘what is considered good or ideal water quality’. Water quality outside of this range may, under certain circumstances, still be acceptable [49]. These ranges are available only for eight of the heavy metals studied and, of these, aluminium, cadmium and chromium (VI) have no standard range, but has a no-effect range as the target guideline (Table 2). Comparison of the target water quality range of South Africa with the health based guidelines by the WHO [50] are given in Table 2.
Figure 2. Concentration of heavy metals in water. Figure 2. Concentration of heavy metals in water.

Water 2017, 9, 234 6 of 16
Table 2. Drinking water guidelines of South Africa and World Health Organization (WHO).
Heavy MetalTarget Water Quality Range(No Effect Range) of DWAF
(mg/L) [49]
Health BasedGuidelines of WHO
(mg/L) [50]
Normally Found inFresh/Ground/Surface
Water (mg/L) [50]
Aluminium 0 to 0.15 * 0.2 -Boron No guideline 0.3 <1
Cadmium 0 to 0.005 * 0.003 <0.001Chromium (total) 0 to 0.05 *,# 0.05 <0.001
Copper 0 to 1 2 -Iron 0 to 0.1 No guideline 0.5 to 50Lead 0 to 0.01 0.01 -
Manganese 0 to 0.05 0.5 -Nickel No guideline 0.02 <0.02Silver No guideline No guideline 0.005 to 0.05Zinc 0 to 3 3 -
Notes: * tentative guideline; # for chromium (VI). DWAF: Department of Water Affairs and Forestry of the Republicof South Africa.
Concentration of chromium, titanium and zirconium were below detection limits (BDL) in allthe groundwater samples. In addition to these metals, silicon was also BDL in surface water. Cobalt,lithium, silicon, titanium and zirconium do not have any health-based guidelines or standard limitsproposed by various organisations [49,51–53]. Copper and zinc were within WHO limits [50] in allsamples. Aluminium, nickel and lead were above the limits in all the surface and groundwater samples.In groundwater, boron and cadmium exceeded WHO health guidelines in two groundwater samplinglocations. Iron exceeds DWAF limits [49] of 0.1 mg/L in five groundwater and one surface watersample collected (Figure 3). Manganese was above WHO limits i.e., 0.5 mg/L in two groundwatersamples and above DWAF limits i.e., 0.05 in eight groundwater locations. Though limits are notproposed for silver, concentrations <0.05 mg/L normally occurs in fresh water [50] (Table 2) andconcentrations above this can be indicative of pollution. All the samples of this area had above0.05 mg/L of silver in groundwater as well as surface water. Spatial distribution of these heavy metalsin groundwater (Figure 3) showed a high concentration of most heavy metals in the eastern and centralparts of the study area.
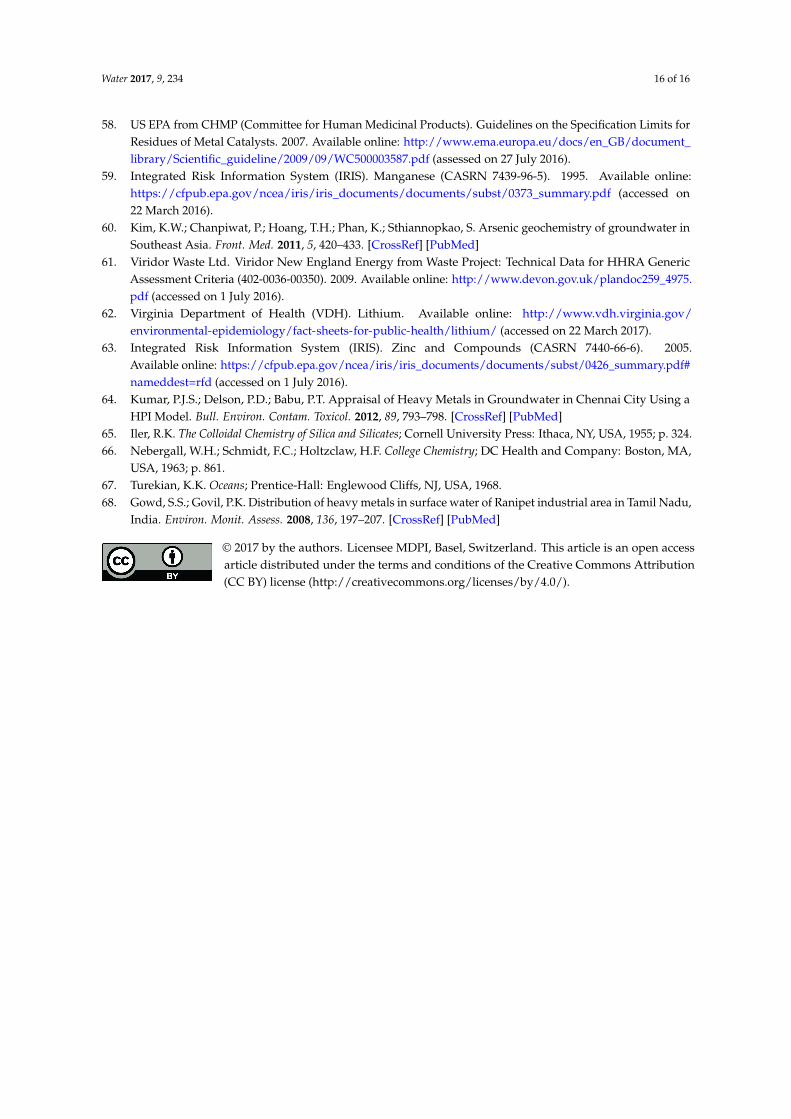
HPI was calculated for ten trace metals. Since chromium was BDL and five metals (cobalt, lithium,silicon, titanium and zirconium) do not have standard limits, they were not included in the HPIcalculation. Standard values in Equations (2) to (4) are based on the maximum permissible limits ofWHO prescribed in Table 2 for all heavy metals except for iron and silver. Concentration of 0.05 mg/Lwas considered as the standard limit for silver. DWAF [49] limit for iron (0.1 mg/L) was considered,as WHO has not suggested any guideline value for iron. Since the presence of these ions in drinkingwater is not desired, the ideal values for these ions is considered as 0 mg/L. HPI in groundwater variedfrom 17 to 330, river water was from 21 to 26 and dam water had the least HPI of 17. Classification ofwater samples based on HPI is given in Table 3. Groundwater is suitable in 68% of the area and thespatial variation in HPI shown in Figure 4.
Table 3. Classification of water based on heavy metal pollution index (HPI).
HPI Range QualityNumber of Samples
Groundwater(N = 35)
SurfaceWater (N = 3)
Dam Water(N = 1)
<25 Excellent 24 2 126 to 50 Good 6 1 -51 to 75 Poor 1 - -76 to 100 Very poor 2 - -
>100 Unsuitable 2 - -

Water 2017, 9, 234 7 of 16Water 2017, 9, 234 7 of 16
Figure 3. Cont.

Water 2017, 9, 234 8 of 16
Water 2017, 9, 234 8 of 16
Figure 3. Spatial variation in heavy metal concentration in groundwater, (a) aluminium, (b) boron, (c) copper, (d) cadmium, (e) iron, (f) lead, (g) manganese, (h) nickel, (i) zinc, (j) cobalt, (k) lithium, (l) silver, and (m) silicon
Figure 3. Spatial variation in heavy metal concentration in groundwater, (a) aluminium, (b) boron,(c) copper, (d) cadmium, (e) iron, (f) lead, (g) manganese, (h) nickel, (i) zinc, (j) cobalt, (k) lithium,(l) silver, and (m) silicon.
Human exposure risk due to heavy metals was calculated separately for infants (0 to 6 months),children and adults as the intake of water differs among different age range. IR was 250 mL/dayfor infants, 1.5 L/day for children and 3 L/day for adults and body weight was 6 kg, 20 kg [54]and 60.7 kg [55] for infants, children and adults, respectively. Exposure risk (HEDW) was above 1for manganese in children with the rest of the heavy metals being <1 for all human age groups.Statistical summary of HEDW for different metals are given in Table 4. The sum of HEDW also does not

Water 2017, 9, 234 9 of 16
exceed 1 for all metals except for manganese under the children age group. The results do not provideconclusive evidence for determining the potential risk due to exposure of these metals through thedrinking water pathway.Water 2017, 9, 234 9 of 16
Figure 4. Spatial variation in HPI of water.
Human exposure risk due to heavy metals was calculated separately for infants (0 to 6 months), children and adults as the intake of water differs among different age range. IR was 250 mL/day for infants, 1.5 L/day for children and 3 L/day for adults and body weight was 6 kg, 20 kg [54] and 60.7 kg [55] for infants, children and adults, respectively. Exposure risk (HEDW) was above 1 for manganese in children with the rest of the heavy metals being <1 for all human age groups. Statistical summary of HEDW for different metals are given in Table 4. The sum of HEDW also does not exceed 1 for all metals except for manganese under the children age group. The results do not provide conclusive evidence for determining the potential risk due to exposure of these metals through the drinking water pathway.
Table 4. Human exposure risk (mg/kg/day) due to heavy metals through the drinking water pathway.
Human Exposure Category
Statistical Parameter
Heavy Metal in Groundwater (N = 35)
Total Ag B Cd Cu Li Mn Ni Pb Zn
Infant
Min 1.8 × 10⁻² 0.0 0.0 4.6 × 10⁻⁴ 1.3 × 10⁻² 0.0 2.1 × 10⁻³ 1.3 × 10⁻³ 0.0 4.5 × 10−2 Max 2.1 × 10−2 6.9 × 10⁻² 4.6 × 10⁻⁴ 5.3 × 10⁻² 1.8 × 10⁻² 7.0 × 10⁻¹ 9.4 × 10⁻³ 2.4 × 10⁻² 3.0 × 10⁻² 8.4 × 10⁻¹
Mean 1.9 × 10⁻² 3.1 × 10⁻³ 4.9 × 10⁻⁵ 6.2 × 10⁻³ 1.6 × 10⁻² 2.5 × 10⁻² 3.7 × 10⁻³ 1.5 × 10⁻² 1.8 × 10⁻³ 9.0 × 10⁻² SD 4.5 × 10⁻⁴ 1.3 × 10⁻² 8.5 × 10⁻⁵ 1.1 × 10⁻² 1.1 × 10⁻³ 1.2 × 10⁻¹ 1.0 × 10⁻³ 3.7 × 10⁻³ 5.6 × 10⁻³ 1.3 × 10⁻¹
Children
Min 3.2 × 10⁻² 0.0 0.0 8.3 × 10⁻⁴ 2.3 × 10⁻² 0.0 3.8 × 10⁻³ 2.3 × 10⁻³ 0.0 8.1 × 10−2 Max 3.8 × 10−2 1.2 × 10⁻¹ 8.3 × 10⁻⁴ 9.5 × 10⁻² 3.2 × 10⁻² 1.3 1.7 × 10⁻² 4.4 × 10⁻² 5.5 × 10⁻² 1.5
Mean 3.5 × 10⁻² 5.7 × 10⁻³ 8.8 × 10⁻⁵ 1.1 × 10⁻² 2.8 × 10⁻² 4.6 × 10⁻² 6.7 × 10⁻³ 2.7 × 10⁻² 3.2 × 10⁻³ 1.6 × 10⁻¹ SD 8.1 × 10⁻⁴ 2.3 × 10⁻² 1.5 × 10⁻⁴ 2.1 × 10⁻² 1.9 × 10⁻³ 2.1 × 10⁻¹ 1.9 × 10⁻³ 6.6 × 10⁻³ 1.0 × 10⁻² 2.4 × 10⁻¹
Adult
Min 2.1 × 10⁻² 0.0 0.0 5.4 × 10⁻⁴ 1.5 × 10⁻² 0.0 2.5 × 10⁻³ 1.5 × 10⁻³ 0.0 5.4 × 10−2 Max 2.5 × 10−2 8.2 × 10⁻² 5.4 × 10⁻⁴ 6.3 × 10⁻² 2.1 × 10⁻² 8.3 × 10⁻¹ 1.1 × 10⁻² 2.9 × 10⁻² 3.6 × 10⁻² 9.9 × 10⁻¹
Mean 2.3 × 10⁻² 3.7 × 10⁻³ 5.8 × 10⁻⁵ 7.4 × 10⁻³ 1.9 × 10⁻² 3.0 × 10⁻² 4.4 × 10⁻³ 1.8 × 10⁻² 2.1 × 10⁻³ 1.1 × 10⁻¹ SD 5.3 × 10⁻⁴ 1.5 × 10⁻² 1.0 × 10⁻⁴ 1.4 × 10⁻² 1.3 × 10⁻³ 1.4 × 10⁻¹ 1.2 × 10⁻³ 4.3 × 10⁻³ 6.7 × 10⁻³ 1.6 × 10⁻¹
HQ takes into consideration the RfD specific to each metal and, based on the concentration level of the metal to cause acute or chronic disorders in humans, it can help to ascertain the risk in a better way. RfD values were available for most heavy metals (Table 5) except for aluminium, cobalt, iron, silver, titanium, zirconium and zinc. Though chromium has an RfD proposed by Integrated Risk Information System (IRIS) from US EPA [56], due to the low concentration (BDL) in the water samples, it was not included in the assessment of non-carcinogenic risk. Statistical details of the HQ for different metals are given in Table 6.
Figure 4. Spatial variation in HPI of water.
Table 4. Human exposure risk (mg/kg/day) due to heavy metals through the drinking water pathway.
Human ExposureCategory
StatisticalParameter
Heavy Metal in Groundwater (N = 35)Total
Ag B Cd Cu Li Mn Ni Pb Zn
Infant
Min 1.8 × 10⁻² 0.0 0.0 4.6 × 10⁻⁴ 1.3 × 10⁻² 0.0 2.1 × 10⁻³ 1.3 × 10⁻³ 0.0 4.5 × 10−2
Max 2.1 × 10−2 6.9 × 10⁻² 4.6 × 10⁻⁴ 5.3 × 10⁻² 1.8 × 10⁻² 7.0 × 10⁻¹ 9.4 × 10⁻³ 2.4 × 10⁻² 3.0 × 10⁻² 8.4 × 10⁻¹
Mean 1.9 × 10⁻² 3.1 × 10⁻³ 4.9 × 10⁻⁵ 6.2 × 10⁻³ 1.6 × 10⁻² 2.5 × 10⁻² 3.7 × 10⁻³ 1.5 × 10⁻² 1.8 × 10⁻³ 9.0 × 10⁻²
SD 4.5 × 10⁻⁴ 1.3 × 10⁻² 8.5 × 10⁻⁵ 1.1 × 10⁻² 1.1 × 10⁻³ 1.2 × 10⁻¹ 1.0 × 10⁻³ 3.7 × 10⁻³ 5.6 × 10⁻³ 1.3 × 10⁻¹
Children
Min 3.2 × 10⁻² 0.0 0.0 8.3 × 10⁻⁴ 2.3 × 10⁻² 0.0 3.8 × 10⁻³ 2.3 × 10⁻³ 0.0 8.1 × 10−2
Max 3.8 × 10−2 1.2 × 10⁻¹ 8.3 × 10⁻⁴ 9.5 × 10⁻² 3.2 × 10⁻² 1.3 1.7 × 10⁻² 4.4 × 10⁻² 5.5 × 10⁻² 1.5Mean 3.5 × 10⁻² 5.7 × 10⁻³ 8.8 × 10⁻⁵ 1.1 × 10⁻² 2.8 × 10⁻² 4.6 × 10⁻² 6.7 × 10⁻³ 2.7 × 10⁻² 3.2 × 10⁻³ 1.6 × 10⁻¹
SD 8.1 × 10⁻⁴ 2.3 × 10⁻² 1.5 × 10⁻⁴ 2.1 × 10⁻² 1.9 × 10⁻³ 2.1 × 10⁻¹ 1.9 × 10⁻³ 6.6 × 10⁻³ 1.0 × 10⁻² 2.4 × 10⁻¹
Adult
Min 2.1 × 10⁻² 0.0 0.0 5.4 × 10⁻⁴ 1.5 × 10⁻² 0.0 2.5 × 10⁻³ 1.5 × 10⁻³ 0.0 5.4 × 10−2
Max 2.5 × 10−2 8.2 × 10⁻² 5.4 × 10⁻⁴ 6.3 × 10⁻² 2.1 × 10⁻² 8.3 × 10⁻¹ 1.1 × 10⁻² 2.9 × 10⁻² 3.6 × 10⁻² 9.9 × 10⁻¹
Mean 2.3 × 10⁻² 3.7 × 10⁻³ 5.8 × 10⁻⁵ 7.4 × 10⁻³ 1.9 × 10⁻² 3.0 × 10⁻² 4.4 × 10⁻³ 1.8 × 10⁻² 2.1 × 10⁻³ 1.1 × 10⁻¹
SD 5.3 × 10⁻⁴ 1.5 × 10⁻² 1.0 × 10⁻⁴ 1.4 × 10⁻² 1.3 × 10⁻³ 1.4 × 10⁻¹ 1.2 × 10⁻³ 4.3 × 10⁻³ 6.7 × 10⁻³ 1.6 × 10⁻¹
HQ takes into consideration the RfD specific to each metal and, based on the concentration levelof the metal to cause acute or chronic disorders in humans, it can help to ascertain the risk in a betterway. RfD values were available for most heavy metals (Table 5) except for aluminium, cobalt, iron,silver, titanium, zirconium and zinc. Though chromium has an RfD proposed by Integrated RiskInformation System (IRIS) from US EPA [56], due to the low concentration (BDL) in the water samples,it was not included in the assessment of non-carcinogenic risk. Statistical details of the HQ for differentmetals are given in Table 6.
Considering the HQ of each heavy metal individually, boron, nickel and zinc do not pose anypotential risk to human health. Concentrations of silver, copper, manganese and lead imply a majorthreat with HQ above 1 (Table 6). Cadmium and lithium are at the border of high risk level (based onmaximum value in Table 6) for infants, but are potential risks to children and adults. Mean HQ ofheavy metals (Figure 5) indicate the low risk due to boron, cadmium, manganese, nickel and zinc.Figure 5 shows that greater health risk from heavy metals is for children than infants and adults.Due to high exposure risk from silver, copper and lead, the cumulative HQ in all locations sampledexceeds 1 with even the minimum values being 6.2, 11.2 and 7.4 mg/kg/day for infants, children and

Water 2017, 9, 234 10 of 16
adults, respectively (Table 6). Surface water also shows a high potential risk if consumed followingsimilar variation in the presence of heavy metals as in groundwater (Table 7).
Table 5. Oral reference dose for heavy metals.
Heavy Metal Reference Dose(RfD in mg/kg/day) References
Silver 5 × 10⁻³ [56]Boron 2 × 10⁻¹ [57]
Cadmium 5 × 10⁻⁴ [56]Chromium (total) 3 × 10⁻³ [56]
Copper 5 × 10⁻³ [58]Manganese 1.4 × 10⁻¹ [59]
Nickel 2 × 10⁻² [60]Lead 3.6 × 10⁻³ [61]
Lithium 2 × 10⁻² [62]Zinc 3 × 10⁻¹ [63]
Table 6. Non-carcinogenic risk (mg/kg/day) due to heavy metals through the drinking water pathway.
Human ExposureCategory
StatisticalParameter
Heavy Metal in Groundwater (N = 35)
Ag B Cd Cu Li Mn Ni Pb Zn
Infant
Min 3.5 0.0 0.0 0.1 0.6 0.0 0.1 0.4 0.0Max 4.2 0.3 0.9 10.5 0.9 5.0 0.5 6.7 0.1
Mean 3.9 0.0 0.1 1.2 0.8 0.2 0.2 4.2 0.0SD 0.1 0.1 0.2 2.3 0.1 0.8 0.1 1.0 0.0
Children
Min 6.3 0.0 0.0 0.2 1.2 0.0 0.2 0.6 0.0Max 7.6 0.6 1.7 19.0 1.6 9.0 0.8 12.1 0.2
Mean 6.9 0.0 0.2 2.2 1.4 0.3 0.3 7.5 0.0SD 0.2 0.1 0.3 4.1 0.1 1.5 0.1 1.8 0.0
Adult
Min 4.2 0.0 0.0 0.1 0.8 0.0 0.1 0.4 0.0Max 5.0 0.4 1.1 12.5 1.0 5.9 0.6 8.0 0.1
Mean 4.6 0.0 0.1 1.5 0.9 0.2 0.2 4.9 0.0SD 0.1 0.1 0.2 2.7 0.1 1.0 0.1 1.2 0.0
Table 7. Cumulative hazard quotient (mg/kg/day) in groundwater and surface water.
StatisticalParameter
Groundwater (N = 35) Surface Water (N = 4)
Infant Children Adult Infant Children Adult
Min 6.2 11.2 7.4 6.2 11.2 7.4Max 19.8 35.6 23.5 10.3 18.6 12.2
Mean 10.5 19.0 12.5 8.8 15.8 10.4Median 9.5 17.0 11.2 9.2 16.6 11.0
SD 2.8 5.1 3.3 1.5 2.8 1.8
Inter-metal relationship can help to identify the source and the pathway of these metals to theenvironment. Correlation and factor analysis were performed to recognise independent and multiplesources. Cobalt had significant positive correlation (r2 > 0.8) with manganese and nickel (Table 8). Zincalso showed significant correlation with cobalt, manganese and nickel. Though strong correlation wasnot observed i.e., r2 > 0.8, zinc and boron as well as silver and boron exhibit moderate association.Weak positive correlations were found between lithium–silver, boron–cobalt, boron–manganese,boron–nickel and cadmium–copper. To further support the co-existence of metals from similar sources,factor analysis was performed. Four significant factors with eigenvalues above 1 and cumulativevariance of 72% (Table 9) were attained, which are discussed in the next section.

Water 2017, 9, 234 11 of 16Water 2017, 9, 234 11 of 16
Figure 5. Non-carcinogenic risk (mean values) from drinking groundwater.
Inter-metal relationship can help to identify the source and the pathway of these metals to the environment. Correlation and factor analysis were performed to recognise independent and multiple sources. Cobalt had significant positive correlation (r2 > 0.8) with manganese and nickel (Table 8). Zinc also showed significant correlation with cobalt, manganese and nickel. Though strong correlation was not observed i.e., r2 > 0.8, zinc and boron as well as silver and boron exhibit moderate association. Weak positive correlations were found between lithium–silver, boron–cobalt, boron–manganese, boron–nickel and cadmium–copper. To further support the co-existence of metals from similar sources, factor analysis was performed. Four significant factors with eigenvalues above 1 and cumulative variance of 72% (Table 9) were attained, which are discussed in the next section.
Table 8. Correlation among metals in groundwater.
Ag Al B Cd Co Cu Fe Li Mn Ni Pb Si ZnAg 1
Al 0.08 1
B 0.69 * 0.22 1
Cd 0.03 −0.17 0.05 1
Co 0.14 0.27 0.47 0.23 1
Cu 0.07 −0.17 −0.02 0.43 −0.07 1
Fe 0.12 −0.09 0.15 0.07 −0.03 0.04 1
Li 0.48 −0.07 0.17 0.18 0.23 0.05 0.27 1
Mn 0.19 0.25 0.47 0.24 0.96 0.00 −0.01 0.23 1
Ni 0.34 0.20 0.59 0.33 0.90 0.04 0.00 0.33 0.91 1
Pb 0.21 0.09 0.31 −0.14 −0.10 0.04 −0.12 −0.15 0.00 0.00 1
Si −0.22 0.21 −0.18 −0.18 −0.04 −0.35 −0.29 −0.25 −0.06 −0.14 0.13 1 Zn 0.33 0.25 0.66 0.13 0.86 0.00 0.02 0.17 0.85 0.84 0.15 −0.08 1
Note: * Significant correlation is marked in bold.
Table 9. Factor analysis of heavy metals in groundwater.
Heavy Metals Factor 1 Factor 2 Factor 3 Factor 4 Ag 0.19 0.51 0.69 −0.01 Al 0.33 −0.19 0.17 −0.45 B 0.52 0.26 0.69 −0.06
Cd 0.29 0.04 −0.16 0.73 Co 0.98 0.04 −0.06 −0.03 Cu −0.04 −0.03 0.15 0.84 Fe −0.07 0.69 −0.04 0.01 Li 0.21 0.73 0.02 0.05
Mn 0.96 0.03 0.02 0.03 Ni 0.94 0.14 0.12 0.11
Figure 5. Non-carcinogenic risk (mean values) from drinking groundwater.
Table 8. Correlation among metals in groundwater.
Ag Al B Cd Co Cu Fe Li Mn Ni Pb Si Zn
Ag 1Al 0.08 1B 0.69 * 0.22 1
Cd 0.03 −0.17 0.05 1Co 0.14 0.27 0.47 0.23 1Cu 0.07 −0.17 −0.02 0.43 −0.07 1Fe 0.12 −0.09 0.15 0.07 −0.03 0.04 1Li 0.48 −0.07 0.17 0.18 0.23 0.05 0.27 1
Mn 0.19 0.25 0.47 0.24 0.96 0.00 −0.01 0.23 1Ni 0.34 0.20 0.59 0.33 0.90 0.04 0.00 0.33 0.91 1Pb 0.21 0.09 0.31 −0.14 −0.10 0.04 −0.12 −0.15 0.00 0.00 1Si −0.22 0.21 −0.18 −0.18 −0.04 −0.35 −0.29 −0.25 −0.06 −0.14 0.13 1Zn 0.33 0.25 0.66 0.13 0.86 0.00 0.02 0.17 0.85 0.84 0.15 −0.08 1
Note: * Significant correlation is marked in bold.
Table 9. Factor analysis of heavy metals in groundwater.
Heavy Metals Factor 1 Factor 2 Factor 3 Factor 4
Ag 0.19 0.51 0.69 −0.01Al 0.33 −0.19 0.17 −0.45B 0.52 0.26 0.69 −0.06
Cd 0.29 0.04 −0.16 0.73Co 0.98 0.04 −0.06 −0.03Cu −0.04 −0.03 0.15 0.84Fe −0.07 0.69 −0.04 0.01Li 0.21 0.73 0.02 0.05
Mn 0.96 0.03 0.02 0.03Ni 0.94 0.14 0.12 0.11Pb −0.07 −0.34 0.78 −0.01Si −0.01 −0.54 −0.09 −0.48Zn 0.89 0.04 0.27 −0.02
Eigenvalue 4.49 2.04 1.60 1.24Total variance (%) 34.52 15.70 12.33 9.50
Cumulative variance (%) 34.52 50.22 62.54 72.04
Source Industrialactivities
Mining andassociated activities
Geogenic andhuman-induced Fertilizers
Note: Significant correlation is marked in bold.
Water 2017, 9, 234 12 of 16
4. Discussion
Abundance of metals in groundwater was in the following order: silicon > manganese > silver >lithium > iron > lead > aluminium > copper > nickel > boron > zinc > cobalt > cadmium > chromium =titanium = zirconium. In surface water, concentrations were: silver > lithium > aluminium > lead > iron >nickel > copper > cobalt > manganese > zinc > cadmium > silicon = boron = chromium = titanium =zirconium. Spatial variation of HPI in Figure 4 shows two distinct areas with a high concentration ingroundwater. These are the industrial areas located near the harbour on the eastern side of the studyarea and the landfill in the central part. Spatial distribution in HPI also closely follows the distributionof EC (Figure 1) and heavy metals (Figure 3) in groundwater, indicating the possibility of occurrenceof high concentrations of major and minor ions due to these activities.
Statistical analysis had the highest variance of 34% for factor 1 and show strong positive loadingsbetween cobalt, manganese, nickel and zinc with moderate positive loading from boron. These metalsdo not occur normally in fresh water (Table 2, [50]) and so their origin is from external sources and notgeogenic. Most of these metals are used widely in different industrial processes like electroplatingsmelting etc., and wastewater from these industries contain some concentration of these metals [64].Hence, factor 1 is largely influenced by industrial activities. Negative loadings of silica in factor 2with positive correlation of lithium, iron and silver specify that they are not derived directly from soil.Silicon, the chemical element in silica contributes to 60% of the earth crust composition [65,66], and itis also present in seawater (2.9 mg/L) [67]. Thus, a negative relation with silica rules out the possibilityof geogenic sources as the source for factor 2. Iron ores are mined and processed in this area andrelated human processes may contribute to iron in groundwater. Due to the positive affinity, lithiumand silver may also have been contributed from similar source i.e., mining and associated activities.
Factor 3 has a total variance of 12.3% with positive loadings for lead, silver and boron. Lead is acommon pollutant from paint industries, apart from combustion of fossil fuels, industrial smeltingoperations and fertilizers [68]. Lead can also be found in groundwater through dissolution of mineralsfrom soil. Boron could be derived from earth crust as well as due to seawater intrusion in the coastalareas [60]. Occurrence of silver in groundwater could not be ascertained clearly, but co-existencewith lead and boron imply that they have a common source(s). Lead and silver occurring at highconcentrations than that in natural fresh water (Table 2) clearly indicates an external pollution source.This factor is from multiple sources associated with geogenic processes as well as anthropogenicactivities including industrial operations and seawater intrusion due to over-pumping in the coastalareas. Fertilizers used for agriculture are a well-known source for cadmium and copper, which showpositive loadings in factor 4 and exhibit the lowest variance of 9.5%. Presence of fertilizer plants in thisarea could also have contributed to these metals apart from their application to irrigation fields [29,30].Factor analysis has helped as a useful tool for identifying the multiple sources of these metals ingroundwater, which is grouped in Table 9. Pollution due to heavy metals is significant in these areas,and it is important to continuously monitor the water quality to prevent further deterioration of waterresources. More detailed analysis of the occurrence and sources of silver in water is needed.
5. Conclusions
Water issues in South Africa focus more on water quality than quantity and more studies areneeded to identify the causes and extent of pollution. This study was carried out with an aim ofdetermining the heavy metal contamination in water and assess the impact of human activities ongroundwater in and around two major towns, Empangeni and Richards Bay. Based on EC and TDS,the water is suitable for drinking purposes in most parts of the area except for a few locations. Orderof dominance of heavy metals were silicon > manganese > silver > lithium > iron > lead > aluminium >copper > nickel > boron > zinc > cobalt > cadmium, while chromium, titanium and zirconium wereBDL in water. Contamination due to aluminium, lead and nickel was prevalent in the entire area andboron, cadmium, iron and manganese exceeded the limit at a few locations. HPI varied from 17 to 330indicating high contamination in two zones within the study area. HQ indicated potential risk to

Water 2017, 9, 234 13 of 16
human health through the drinking water pathway due to consumption of groundwater for all agegroups i.e., infants, children and adults.
Statistical examination indicated four factors both as independent and a combination of multiplesources for the presence of these heavy metals in groundwater. The inter-metal relationship betweencobalt, manganese, nickel, zinc and boron were indicative of industrial activities. Lithium, ironand silver in groundwater were related to mining influenced operations and processes. Applicationof fertilizers is likely to have contributed to the presence of cadmium and copper in groundwater.Multiple sources including geogenic industries and seawater intrusion have contributed to lead, silverand boron. This study located the two zones of pollution: (1) the industrial site near the coast in theeastern part and (2) a landfill site at the central part of the study area. It is important to prevent furtherpollution from these sites by adopting proper management measures that include treatment of wastesfrom industries and should comply with wastewater disposal standards before dumping. Landfillsite should be monitored for leachate percolation, and measures to reduce this must be implemented.Consumption of groundwater by the public may result in health issues and hence proper treatment ofwater is necessary to make it suitable for public water supply.
Acknowledgments: The first author thanks the University of Zululand’s Department of Research and Innovationfor the financial assistance (Grant S721/15), the Department of Agriculture for assistance in chemical analysis andthe Department of Hydrology for their extended support in successful completion of this work.
Author Contributions: Vetrimurugan Elumalai designed the study, carried out the field investigation, collectedand analysed the samples, interpreted the data and brought out the water quality issues. K. Brindha performedthe statistical analysis, prepared the figures and drafted the manuscript with inputs from Elango Lakshmanan.All authors read and approved the final manuscript.
Conflicts of Interest: The authors declare no conflicts of interest.
References
1. Leung, C.M.; Jiao, J.J. Heavy metal and trace element distributions in groundwater in natural slopes andhighly urbanized spaces in Mid-Levels area, Hong Kong. Water Res. 2006, 40, 753–767. [CrossRef] [PubMed]
2. Buschmann, J.; Berg, M.; Stengel, C.; Winkel, L.; Sampson, M.L.; Trang, P.T.K.; Viet, P.H. Contaminationof drinking water resources in the Mekong delta floodplains: Arsenic and other trace metals pose serioushealth risks to population. Environ. Int. 2008, 34, 756–764. [CrossRef] [PubMed]
3. He, J.; Charlet, L. A review of arsenic presence in China drinking water. J. Hydrol. 2013, 492, 79–88. [CrossRef]4. Mohanraj, R.; Azeez, P.A.; Priscilla, T. Heavy metals in airborne particulate matter of urban Coimbatore.
Arch. Environ. Contam. Toxicol. 2004, 47, 162–167. [CrossRef] [PubMed]5. Zereini, F.; Alt, F.; Messerschmidt, J.; Wiseman, C.; Feldmann, I.; von Bohlen, A.; Müller, J.; Liebl, K.;
Püttmann, W. Concentration and distribution of heavy metals in urban airborne particulate matter inFrankfurt am Main, Germany. Environ. Sci. Technol. 2005, 39, 2983–2989. [CrossRef] [PubMed]
6. Xu, P.; Huang, S.; Wang, Z.A.; Lagos, G. Daily intakes of copper, zinc and arsenic in drinking water bypopulation of Shanghai, China. Sci. Total Environ. 2006, 362, 50–55. [CrossRef] [PubMed]
7. Razak, N.H.A.; Praveena, S.M.; Aris, A.Z.; Hashim, Z. Drinking water studies: A review on heavy metal,application of biomarker and health risk assessment (a special focus in Malaysia). J. Epidemiol. Glob. Health2015, 5, 297–310. [CrossRef] [PubMed]
8. Li, P.; Qian, H. Human Health Risk Assessment for Chemical Pollutants in Drinking Water Source inShizuishan City, Northwest China. Iran. J. Environ. Health Sci. Eng. 2011, 8, 41–48.
9. Badr, E.A.E.; Agrama, A.A.E.; Badr, S.A.E. Heavy metals in drinking water and human health, Egypt.Nutr. Food Sci. 2011, 41, 210–217. [CrossRef]
10. Demir, V.; Dere, T.; Ergin, S.; Cakιr, Y.; Celik, F. Determination and Health Risk Assessment of Heavy Metalsin Drinking Water of Tunceli, Turkey. Water Resour. 2015, 42, 508–516. [CrossRef]
11. World Health Organization (WHO). Ten Chemicals of Major Public Health Concern. Available online:http://www.who.int/ipcs/assessment/public_health/chemicals_phc/en/ (assessed on 21 June 2016).

Water 2017, 9, 234 14 of 16
12. Berg, M.; Tran, H.C.; Nguyen, T.C.; Pham, H.V.; Schertenleib, R.; Giger, W. Arsenic contamination ofgroundwater and drinking water in Vietnam: A human health threat. Environ. Sci. Technol. 2001, 35,2621–2626. [CrossRef] [PubMed]
13. Ahmed, K.M.; Bhattacharya, P.; Hasan, M.A.; Akhter, S.H.; Alam, S.M.M.; Bhuyian, M.A.H.; Imam, M.B.;Khan, A.A.; Sracek, O. Arsenic enrichment in groundwater of the alluvial aquifers in Bangladesh:An overview. Appl. Geochem. 2004, 19, 181–200. [CrossRef]
14. Saha, D.; Sarangam, S.S.; Dwivedi, S.N.; Bhartariya, K.G. Evaluation of hydrogeochemical processes inarsenic-contaminated alluvial aquifers in parts of Mid-Ganga Basin, Bihar, Eastern India. Environ. Earth Sci.2010, 61, 799–811. [CrossRef]
15. Chanpiwat, P.; Sthiannopkao, S.; Cho, K.H.; Kim, K.-W.; San, V.; Suvanthong, B.; Vongthavady, C.Contamination by arsenic and other trace elements of tube-well water along the Mekong River in LaoPDR. Environ. Pollut. 2011, 159, 567–576. [CrossRef] [PubMed]
16. Krishna, A.K.; Satyanarayanan, M.; Govil, P.K. Assessment of heavy metal pollution in water usingmultivariate statistical techniques in an industrial area: A case study from Patancheru, Medak District,Andhra Pradesh, India. J. Hazard. Mater. 2009, 167, 366–373. [CrossRef] [PubMed]
17. Li, P.; Qian, H.; Wu, J. Origin and assessment of groundwater pollution and associated health risk: A casestudy in an industrial park, northwest China. Environ. Geochem. Health 2014, 36, 693–712. [CrossRef][PubMed]
18. Zahid, A.; Balke, A.D.; Hassan, M.Q.; Flegr, M. Evaluation of aquifer environment under Hazaribagh leatherprocessing zone of Dhaka city. Environ. Geol. 2006, 50, 495–504. [CrossRef]
19. Soyaslan, I.I.; Karagüzel, R. Investigation of water pollution in the Yalvac basin into Egirdir Lake, Turkey.Environ. Geol. 2008, 55, 1263–1268. [CrossRef]
20. Brindha, K.; Elango, L. Impact of tanning industries on groundwater quality near a metropolitan city inIndia. Water Resour. Manag. 2012, 26, 1747–1761. [CrossRef]
21. Bakis, R.; Tuncan, A. An investigation of heavy metal and migration through groundwater from the landfillarea of Eskisehir in Turkey. Environ. Monit. Assess. 2011, 176, 87–98. [CrossRef] [PubMed]
22. El-Salam, M.M.A.; Abu-Zuid, G.I. Impact of landfill leachate on the groundwater quality: A case study inEgypt. J. Adv. Res. 2015, 6, 579–586. [CrossRef] [PubMed]
23. El Khatib, R.; Lartiges, B.S.; El Samrani, A.; Faure, P.; Houhou, J.; Ghanbaja, J. Speciation of Organic Matterand Heavy Metals in Urban Wastewaters from an Emerging Country. Water Air Soil Pollut. 2012, 223,4695–4708. [CrossRef]
24. Carrillo-Chávez, A.; González-Partida, E.; Morton-Bermea, O.; Hernandez, E.; Levresse, G.; Soto, P.; Tritlla, J.;Camprubi, A. Heavy Metal Distributionin Rocks, Sediments, Mine Tailings, Leaching Experiments, andGroundwater from the Mineralde Pozos Historical Mining Site, North-Central Mexico. Int. Geol. Rev. 2006,48, 466–478. [CrossRef]
25. Brindha, K.; Elango, L.; Nair, R.N. Spatial and temporal variation of uranium in a shallow weathered rockaquifer in southern India. J. Earth Syst. Sci. 2011, 120, 911–920. [CrossRef]
26. Mahato, M.K.; Singh, P.K.; Tiwari, A.K.; Singh, A.K. Risk Assessment Due to Intake of Metals in Groundwaterof East Bokaro Coalfield, Jharkhand, India. Expo. Health 2016, 8, 265–275.
27. Naz, A.; Mishra, B.K.; Gupta, S.K. Human Health Risk Assessment of Chromium in Drinking Water: A CaseStudy of Sukinda Chromite Mine, Odisha, India. Expo Health 2016, 8, 253–264. [CrossRef]
28. Nouri, J.; Mahvi, A.H.; Jahed, G.R.; Babaei, A.A. Regional distribution pattern of groundwater heavy metalsresulting from agricultural activities. Environ. Geol. 2008, 55, 1337–1343. [CrossRef]
29. Wu, J.; Sun, Z. Evaluation of Shallow Groundwater Contamination and Associated Human Health Risk inan Alluvial Plain Impacted by Agricultural and Industrial Activities, Mid-west China. Expo. Health 2016, 8,311–329. [CrossRef]
30. Brindha, K.; Elango, L. Occurrence of uranium in groundwater of a shallow granitic aquifer and its suitabilityfor domestic use in southern India. J. Radioanal. Nuclear Chem. 2013, 295, 357–367. [CrossRef]
31. Department of Water Affairs and Forestry (DWAF). Strategic Environmental Assessment for Water Use MhlathuzeCatchment—KZN; Report No. SEA-01/2000; DWAF: Pretoria, South Africa, 2000.
32. Department of Water Affairs and Forestry (DWAF). Water Quality Issues in the Usutu-Mhlathuze: Review ofWater Quality Status and Issues in the WMA; DWAF: Pretoria, South Africa, 2002; p. 27.

Water 2017, 9, 234 15 of 16
33. Muhammad, S.; Shah, M.T.; Khan, S. Health Risk Assessment of Heavy Metals and Their SourceApportionment in Drinking Water of Kohistan Region, Northern Pakistan. Microchem. J. 2011, 98, 334–343.[CrossRef]
34. Alberto, W.D.; Pilar, D.M.D.; Valeria, A.M.; Fabiana, P.S.; Cecilia, H.A.; de Los Angeles, B.M. Patternrecognition techniques for the evaluation of spatial and temporal variations in water quality. A case study:Suquía River Basin (Cordoba-Argentina). Water Res. 2001, 35, 81–94. [CrossRef]
35. Money, D.C. Climate and Environmental Systems; Unwin Hyman: London, UK, 1988.36. Schulze, R.E. Agrohydrology and Climatology of Natal; Water Research Commission: Pretoria, South Africa, 1982.37. Kelbe, B.; Germishuyse, T.; Snyman, N.; Fourie, I. Geohydrological Studies of the Primary Coastal Aquifer in
Zululand; WRC Report No. 720/1/01; Water Research Commission: Pretoria, South Africa, 2001.38. Hobday, D.K. Geological Evolution and Geomorphology of the Zululand Coastal Plain in Lake Sibaya Monographae
Biologica; Allanson: East York, ON, Canada, 1976.39. Tinley, K.L. Coastal Dunes of South Africa; Council for Scientific and Industrial Research; Foundation for
Research Development: Pretoria, South Africa, 1985.40. Germishuyse, T.A. Geohydrological Study of the Richards Bay Area. Master’s Thesis, University of Zululand,
Mhlathuze, South Africa, 1999; p. 119.41. Lloyd, J.W.; Heathcote, J.A. Natural Inorganic Hydrochemistry in Relation to Groundwater; Clarendon Press:
Oxford, UK, 1985.42. Horton, R.K. An index number system for rating water quality. J. Water Pollut. Control Fed. 1965, 37, 300–306.43. Brown, R.M.; McClelland, N.I.; Deininger, R.A.; Tozer, R.G. A water quality index—Do we dare?
Water Sew. Works 1960, 117, 339–343.44. Mohan, S.V.; Nithila, P.; Reddy, S.J. Estimation of heavy metal in drinking water and development of heavy
metal pollution index. J. Environ. Sci. Health A 1996, 31, 283–289. [CrossRef]45. United States Environmental Protection Agency (US EPA). Risk Assessment Guidance for Superfund, Volume 1:
Human Health Evaluation Manual (Part A); EPA/540/1-89/002: Interim Final; Office of Emergency andRemedial Response: Washington, DC, USA, 1989.
46. Davis, J.C. Statistics and Data Analysis in Geology, 3rd ed.; Wiley: Hoboken, NJ, USA, 2002.47. Davis, S.N.; DeWiest, R.J.M. Hydrogeology; John Wiley and Sons Inc.: Hoboken, NJ, USA, 1966.48. Freeze, R.A.; Cherry, J.A. Groundwater; Prentice Hall Inc.: Upper Saddle River, NJ, USA, 1979.49. Department of Water Affairs and Forestry (DWAF). South African Water Quality Guidelines, Domestic Use,
2nd ed.; DWAF: Pretoria, South Africa, 1996; Volume 1, p. 214.50. World Health Organisation (WHO). WHO’s Guidelines for Drinking-Water Quality; WHO: Geneva,
Switzerland, 1993.51. World Health Organisation (WHO). Guidelines for Drinking Water Quality, 4th ed.; WHO: Geneva,
Switzerland, 2011.52. United States Environmental Protection Agency (US EPA). Drinking Water Contaminants. 2014.
Available online: https://www.epa.gov/ground-water-and-drinking-water/table-regulated-drinking-water-contaminants (accessed on 1 July 2016).
53. Health Canada. Guidelines for Canadian Drinking Water Quality—Summary Table; Water and Air QualityBureau, Healthy Environments and Consumer Safety Branch, Health Canada: Ottawa, ON, Canada, 2017;Available online: http://www.hc-sc.gc.ca/ewh-semt/alt_formats/pdf/pubs/water-eau/sum_guide-res_recom/sum_guide-res_recom-eng.pdf (accessed on 22 March 2017).
54. Brindha, K.; Jagadeshan, G.; Kalpana, L.; Elango, L. Fluoride in weathered rock aquifers of southern India:Managed Aquifer recharge for mitigation. Environ. Sci. Pollut. Res. 2016, 23, 8302–8316. [CrossRef] [PubMed]
55. Walpole, S.C.; Prieto-Merino, D.; Edwards, P.; Cleland, J.; Stevens, G.; Roberts, I. The weight of nations:An estimation of adult human biomass. BMC Public Health 2012, 12, 439. [PubMed]
56. IRIS from US EPA (US Environmental Protection Agency). Drinking Water Standards and Health AdvisoriesTable. 2009. Available online: https://www3.epa.gov/region9/water/drinking/files/dwshat-v09.pdf(assessed on 27 July 2016).
57. Integrated Risk Information System (IRIS). Boron and Compounds (CASRN 7440-42-8). 2011.Available online: https://cfpub.epa.gov/ncea/iris/iris_documents/documents/subst/0410_summary.pdf(accessed on 22 March 2017).
Water 2017, 9, 234 16 of 16
58. US EPA from CHMP (Committee for Human Medicinal Products). Guidelines on the Specification Limits forResidues of Metal Catalysts. 2007. Available online: http://www.ema.europa.eu/docs/en_GB/document_library/Scientific_guideline/2009/09/WC500003587.pdf (assessed on 27 July 2016).
59. Integrated Risk Information System (IRIS). Manganese (CASRN 7439-96-5). 1995. Available online:https://cfpub.epa.gov/ncea/iris/iris_documents/documents/subst/0373_summary.pdf (accessed on22 March 2016).
60. Kim, K.W.; Chanpiwat, P.; Hoang, T.H.; Phan, K.; Sthiannopkao, S. Arsenic geochemistry of groundwater inSoutheast Asia. Front. Med. 2011, 5, 420–433. [CrossRef] [PubMed]
61. Viridor Waste Ltd. Viridor New England Energy from Waste Project: Technical Data for HHRA GenericAssessment Criteria (402-0036-00350). 2009. Available online: http://www.devon.gov.uk/plandoc259_4975.pdf (accessed on 1 July 2016).
62. Virginia Department of Health (VDH). Lithium. Available online: http://www.vdh.virginia.gov/environmental-epidemiology/fact-sheets-for-public-health/lithium/ (accessed on 22 March 2017).
63. Integrated Risk Information System (IRIS). Zinc and Compounds (CASRN 7440-66-6). 2005.Available online: https://cfpub.epa.gov/ncea/iris/iris_documents/documents/subst/0426_summary.pdf#nameddest=rfd (accessed on 1 July 2016).
64. Kumar, P.J.S.; Delson, P.D.; Babu, P.T. Appraisal of Heavy Metals in Groundwater in Chennai City Using aHPI Model. Bull. Environ. Contam. Toxicol. 2012, 89, 793–798. [CrossRef] [PubMed]
65. Iler, R.K. The Colloidal Chemistry of Silica and Silicates; Cornell University Press: Ithaca, NY, USA, 1955; p. 324.66. Nebergall, W.H.; Schmidt, F.C.; Holtzclaw, H.F. College Chemistry; DC Health and Company: Boston, MA,
USA, 1963; p. 861.67. Turekian, K.K. Oceans; Prentice-Hall: Englewood Cliffs, NJ, USA, 1968.68. Gowd, S.S.; Govil, P.K. Distribution of heavy metals in surface water of Ranipet industrial area in Tamil Nadu,
India. Environ. Monit. Assess. 2008, 136, 197–207. [CrossRef] [PubMed]
© 2017 by the authors. Licensee MDPI, Basel, Switzerland. This article is an open accessarticle distributed under the terms and conditions of the Creative Commons Attribution(CC BY) license (http://creativecommons.org/licenses/by/4.0/).