What are the interactions between Food Security and Planetary Boundaries?
Prag27th April 2010
Prof. Johan RockströmStockholm Resilience Centre
Stockholm Environment Institute
Human development within the Planetary Boundaries
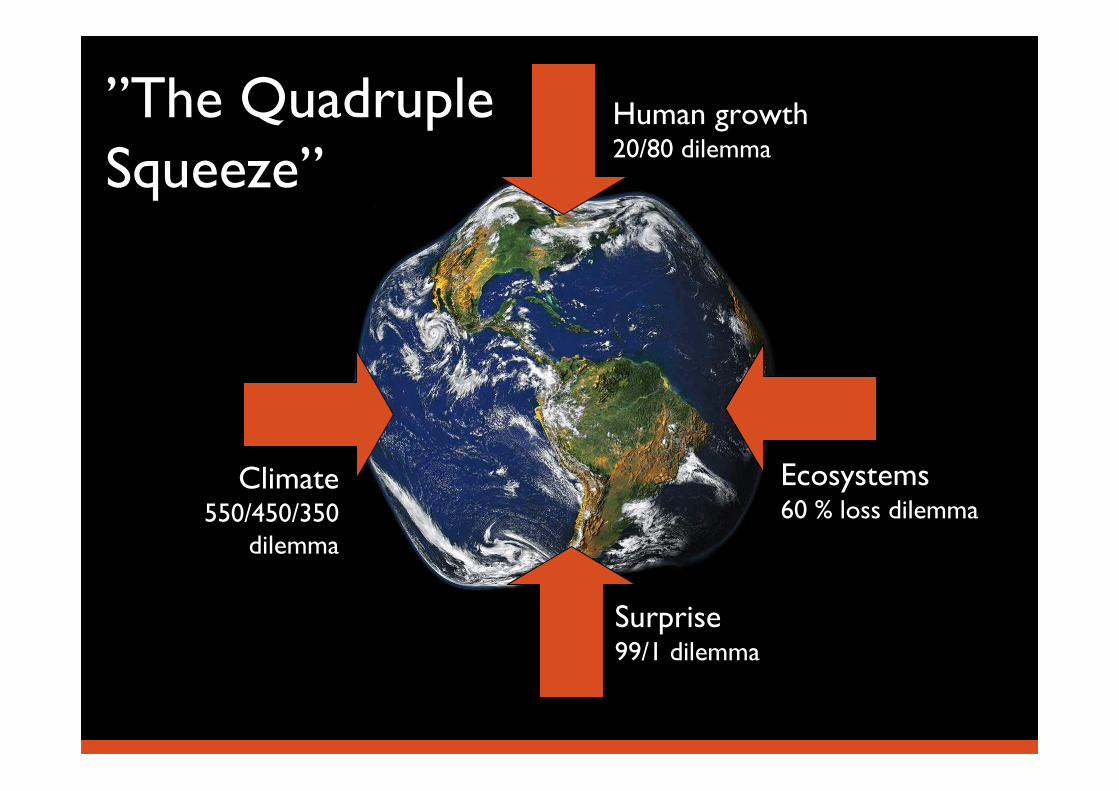
Human growth20/80 dilemma
Ecosystems60 % loss dilemma
Climate550/450/350
dilemma
Surprise99/1 dilemma
”The Quadruple Squeeze”
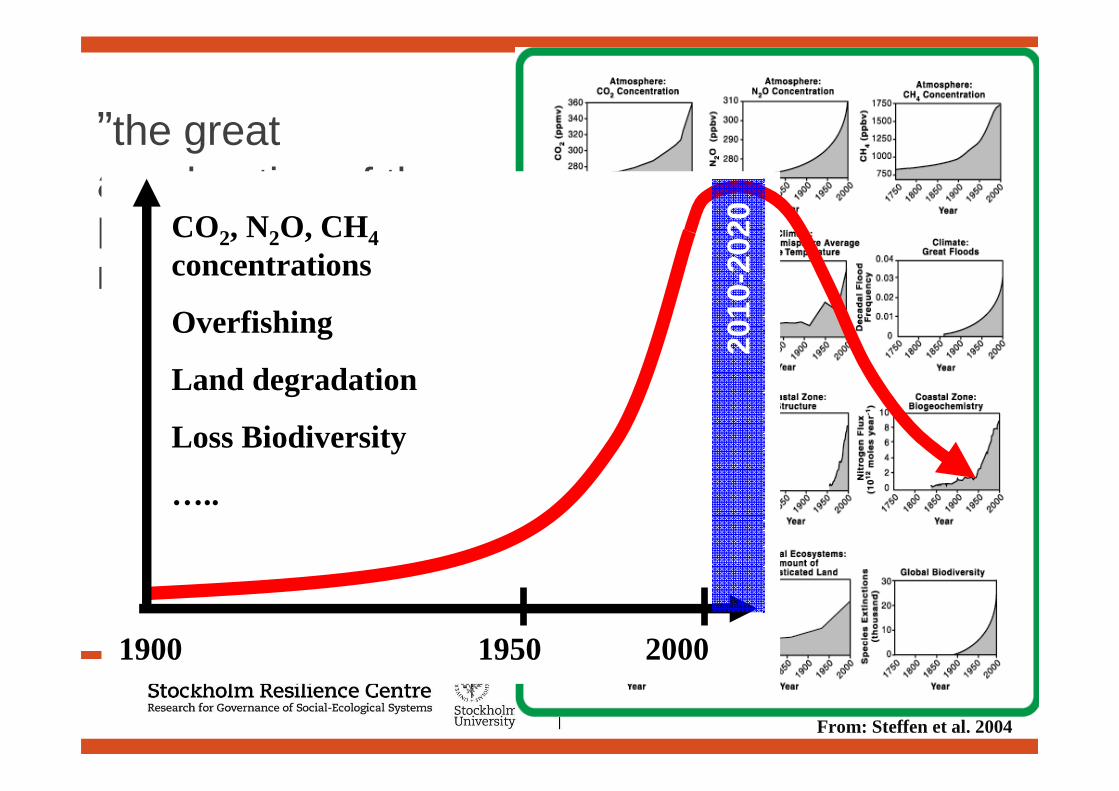
The Planetary Response to the drivers of the Anthropocene
From: Steffen et al. 2004
”the great acceleration of the human entreprise”,Professor Will Steffen
1900 1950 2000
CO2, N2O, CH4concentrations
Overfishing
Land degradation
Loss Biodiversity
…..
2010
-202
0
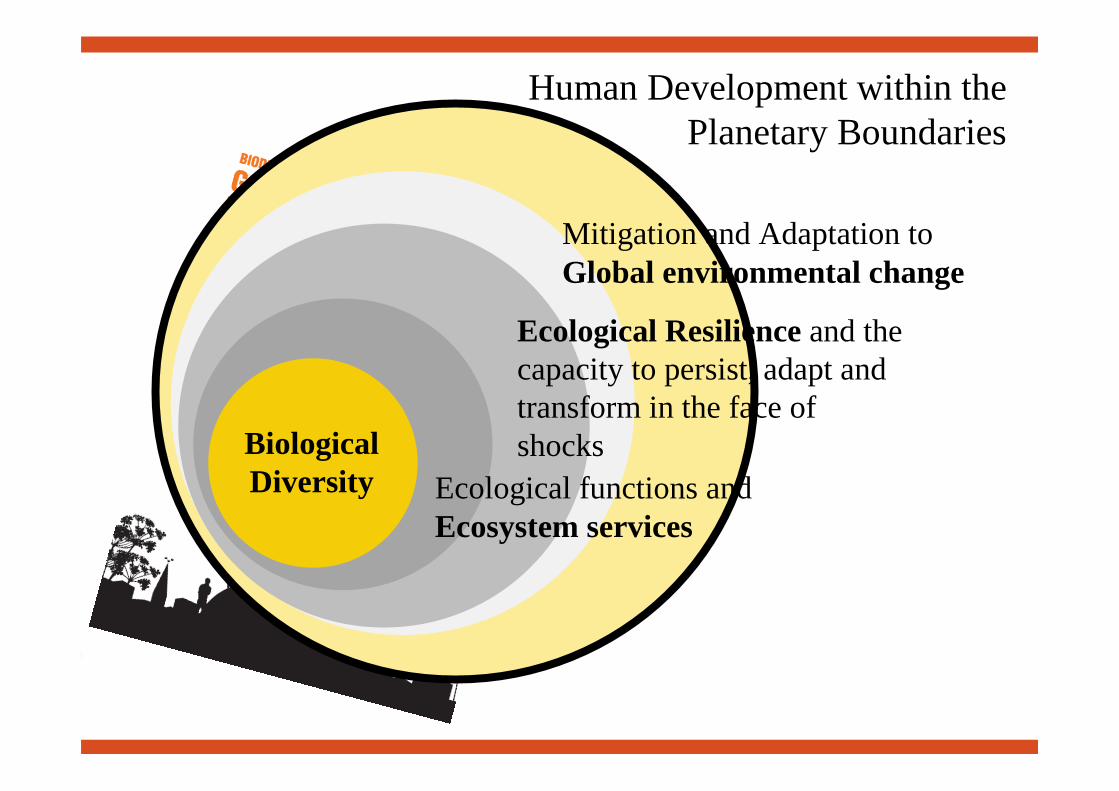
Human Development within the Planetary Boundaries
Mitigation and Adaptation to Global environmental change
Ecological Resilience and the capacity to persist, adapt and transform in the face of shocks
Ecological functions and Ecosystem services
Biological Diversity
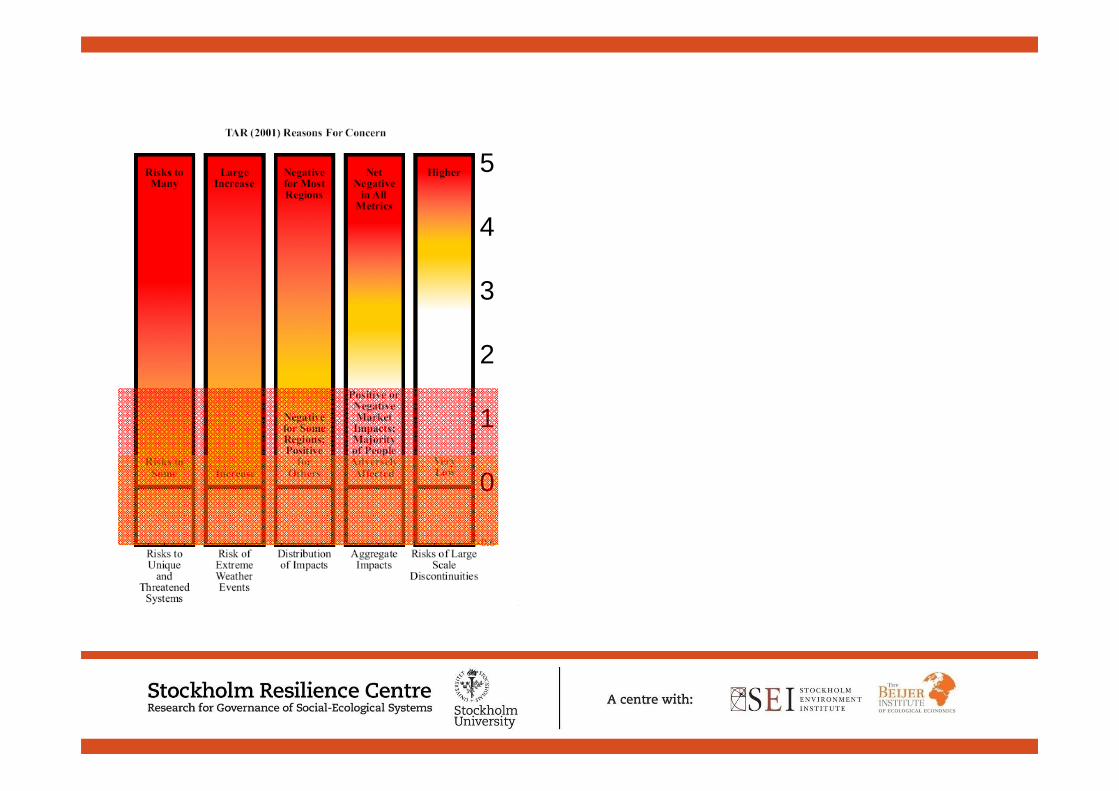
5
4
3
2
1
0
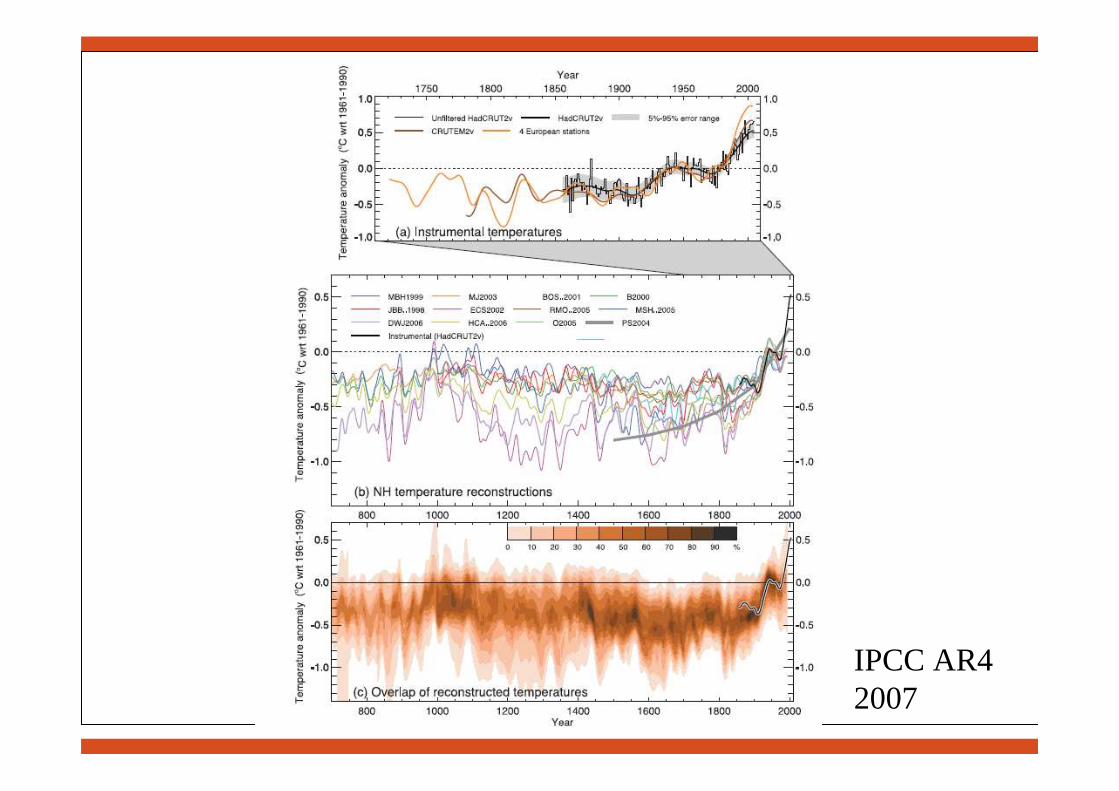
IPCC AR4 2007
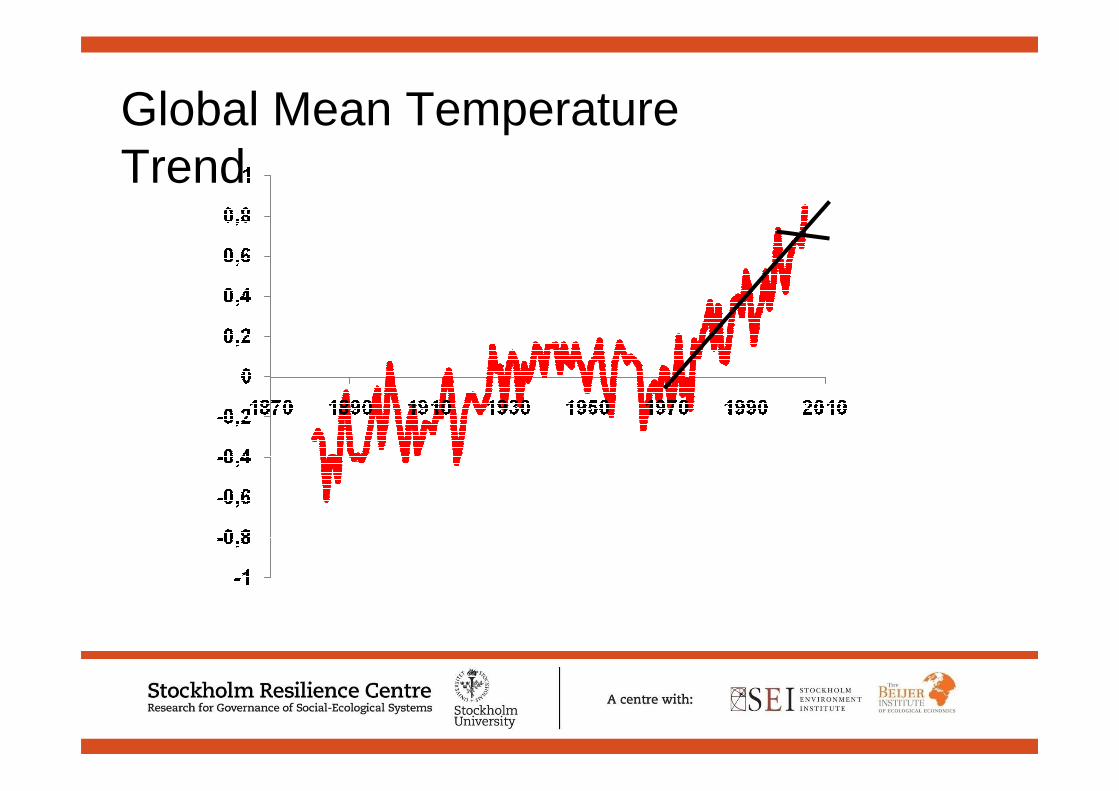
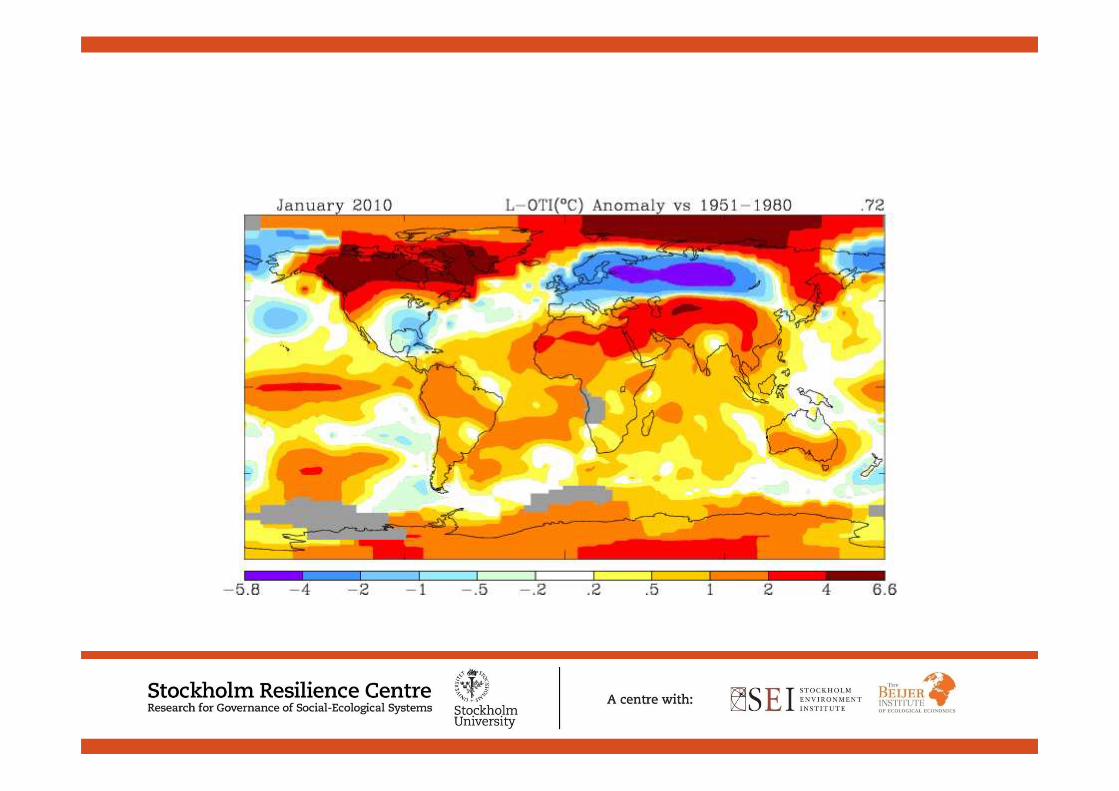
Global Mean Temperature Trend
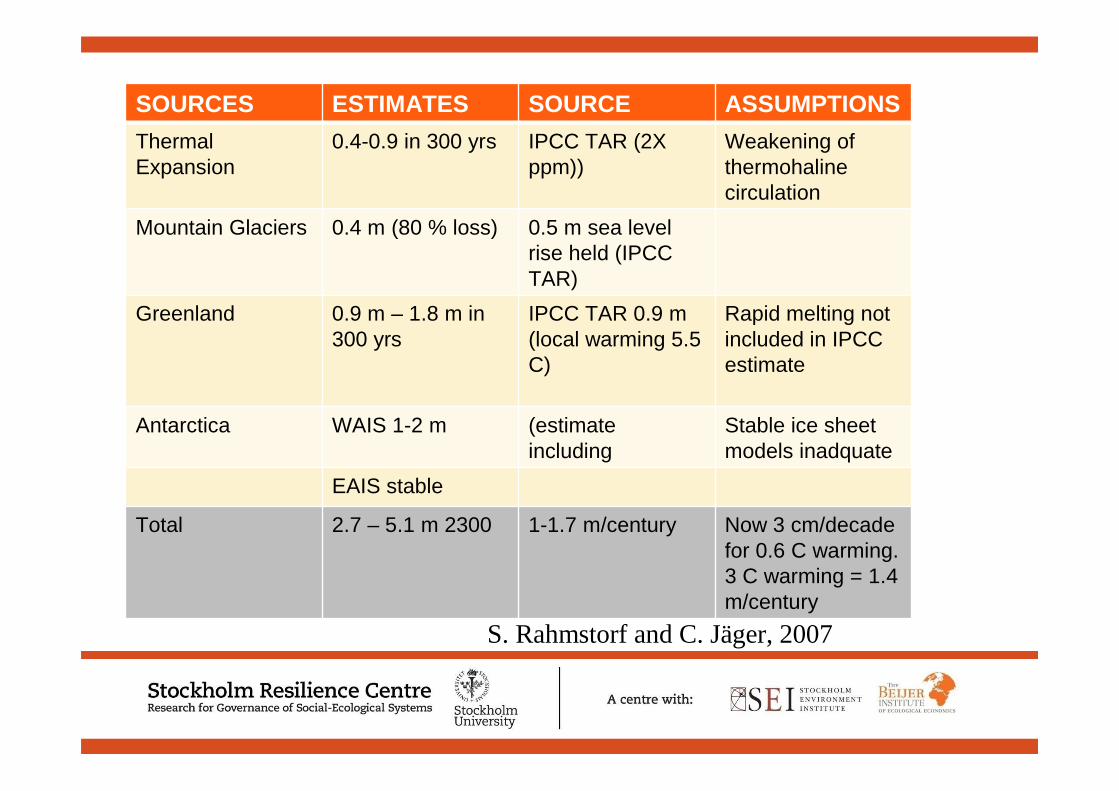
Thermal ExpansionGreenlandArticAntarctica
SOURCES ESTIMATES SOURCE ASSUMPTIONS
Thermal Expansion
0.4-0.9 in 300 yrs IPCC TAR (2X ppm))
Weakening of thermohaline circulation
Mountain Glaciers 0.4 m (80 % loss) 0.5 m sea level rise held (IPCC TAR)
Greenland 0.9 m – 1.8 m in 300 yrs
IPCC TAR 0.9 m (local warming 5.5 C)
Rapid melting not included in IPCC estimate
Antarctica WAIS 1-2 m (estimate including disintegration)
Stable ice sheet models inadquate
EAIS stable
Total 2.7 – 5.1 m 2300 1-1.7 m/century Now 3 cm/decade for 0.6 C warming. 3 C warming = 1.4 m/century
S. Rahmstorf and C. Jäger, 2007
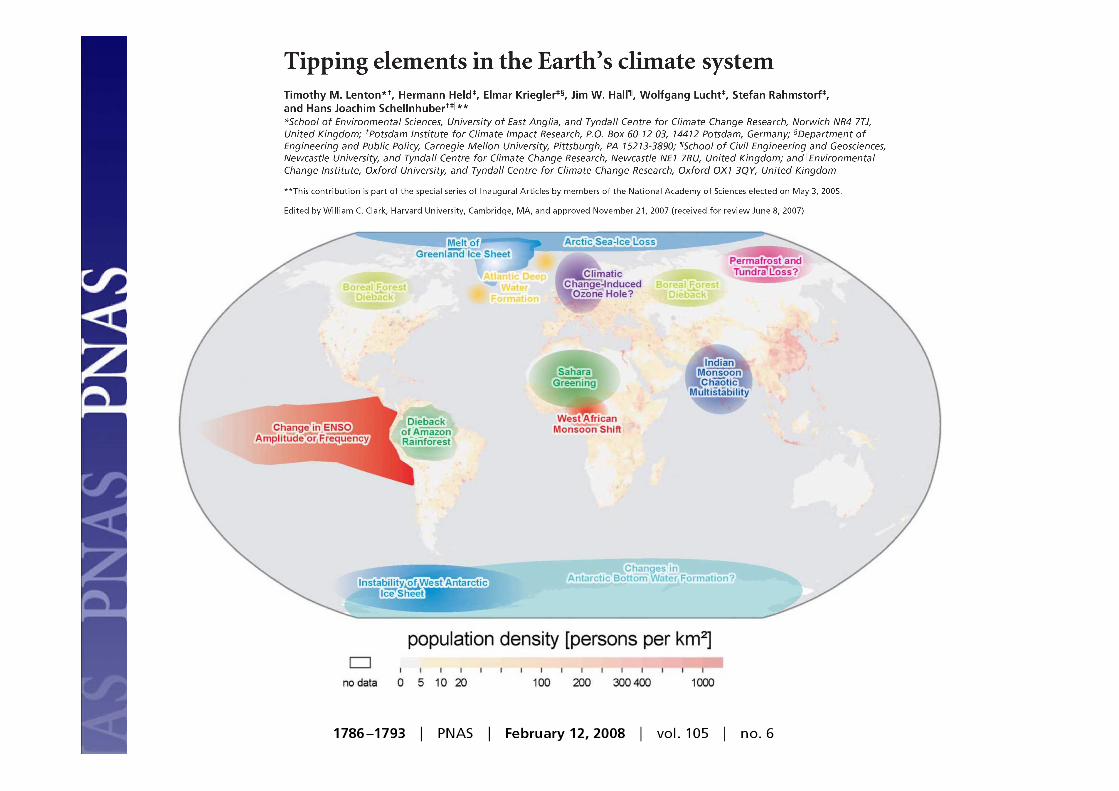
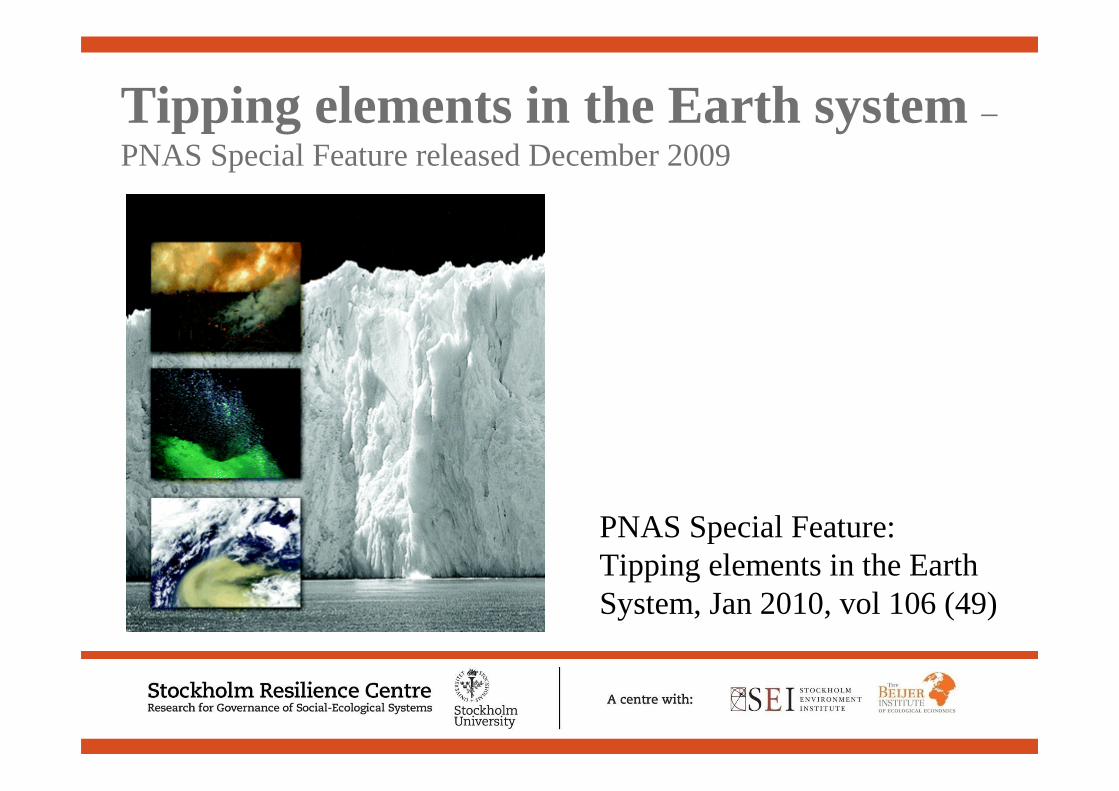
PNAS Special Feature: Tipping elements in the Earth System, Jan 2010, vol 106 (49)
Tipping elements in the Earth system –PNAS Special Feature released December 2009
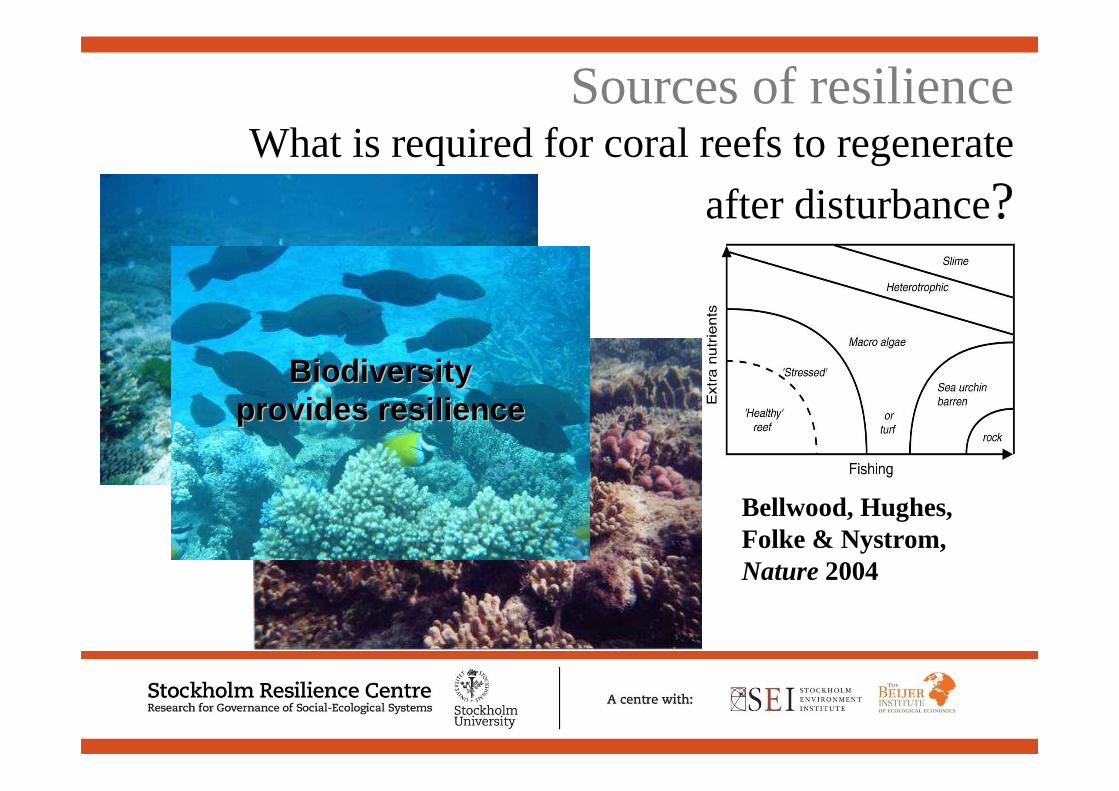
Sources of resilienceWhat is required for coral reefs to regenerate
after disturbance?
Biodiversity Biodiversity provides resilienceprovides resilience
Bellwood, Hughes, Folke & Nystrom, Nature 2004
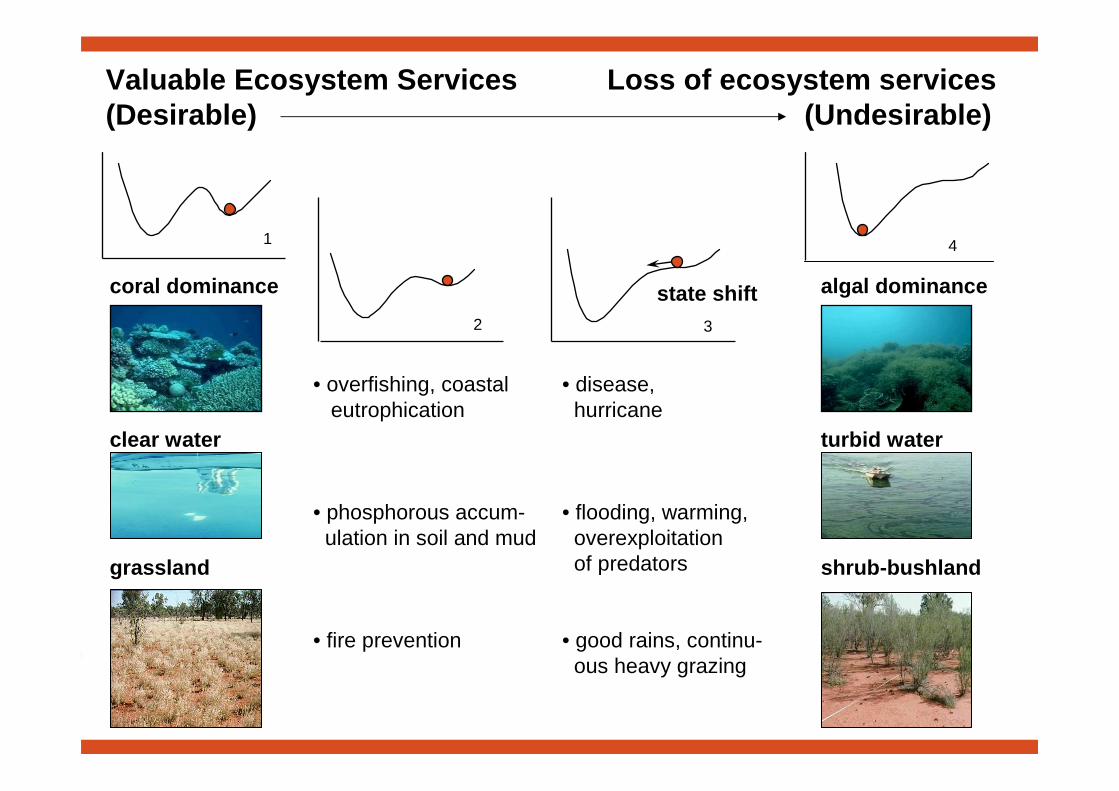
1
2
• overfishing, coastal eutrophication
• phosphorous accum-ulation in soil and mud
• fire prevention
3
state shift
• disease,hurricane
• flooding, warming,overexploitationof predators
• good rains, continu-ous heavy grazing
coral dominance
clear water
grassland
4
algal dominance
turbid water
shrub-bushland
Valuable Ecosystem Services Loss of ecosy stem services(Desirable) (Undesirable)
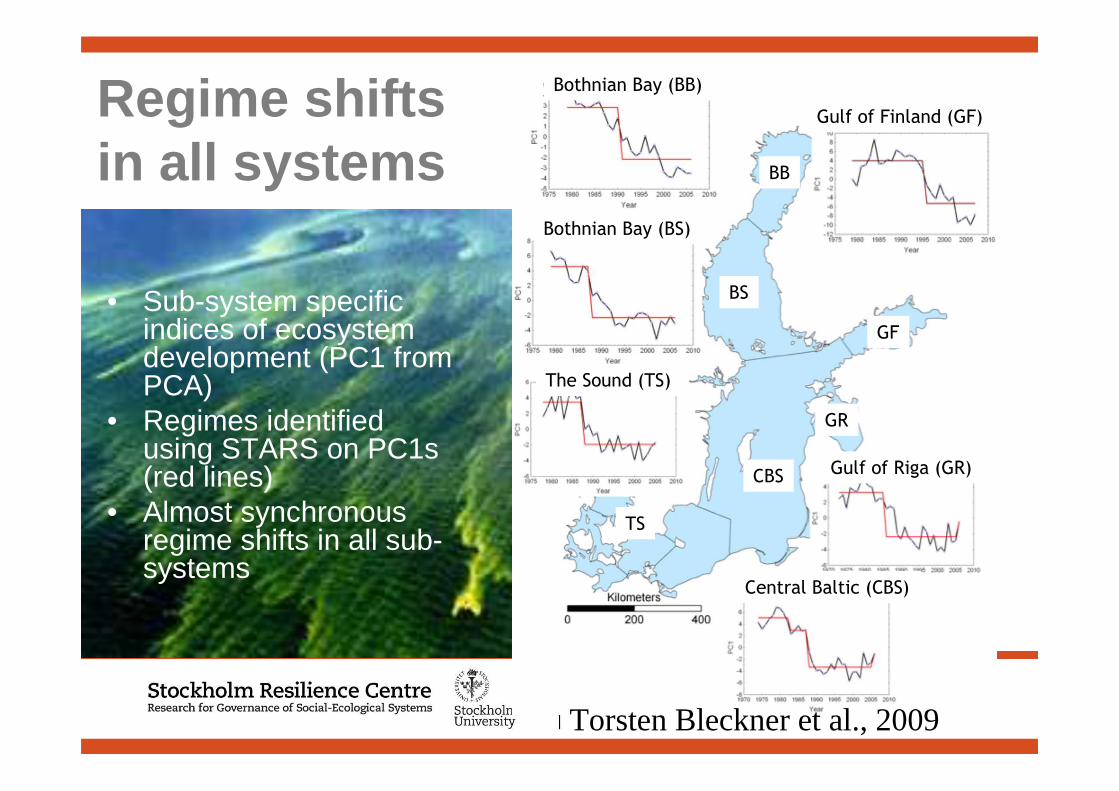
Regime shifts in all systems
• Sub-system specific indices of ecosystem development (PC1 from PCA)
• Regimes identified using STARS on PC1s (red lines)
• Almost synchronous regime shifts in all sub-systems
Bothnian Bay (BB)
BB
BS
GF
GR
CBS
TS
Bothnian Bay (BS)
Gulf of Finland (GF)
Gulf of Riga (GR)
Central Baltic (CBS)
The Sound (TS)
Torsten Bleckner et al., 2009
The Resilience of the Earth System
Our precarious predicament
”We have our foot on the accelerator driving towards the Abyss...”
Ban Ki-moon Secretary General of the UNSept 2009
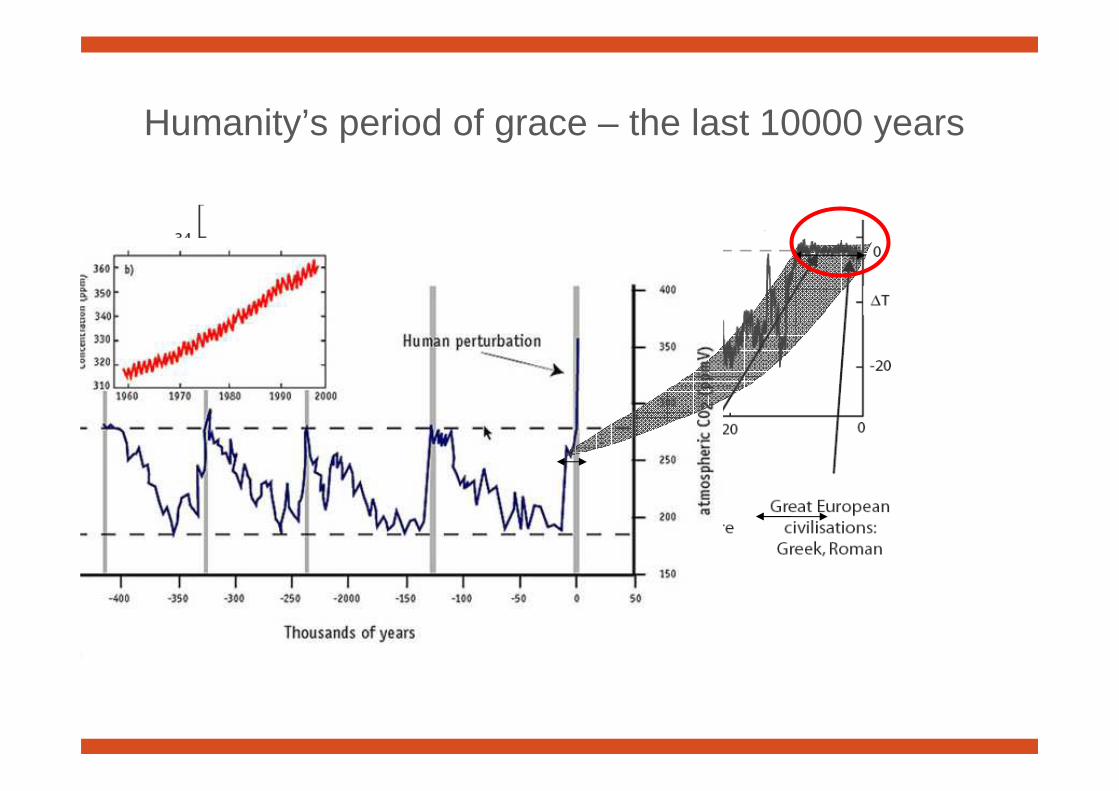
Humanity’s period of grace – the last 10000 years
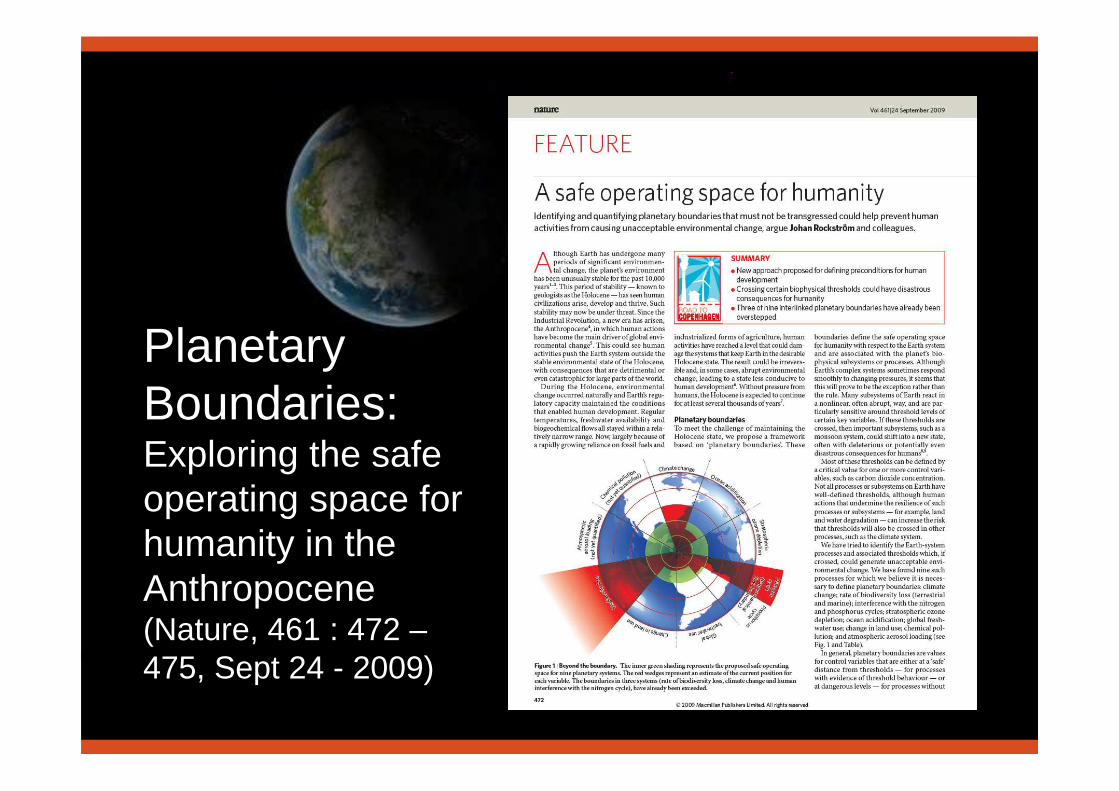
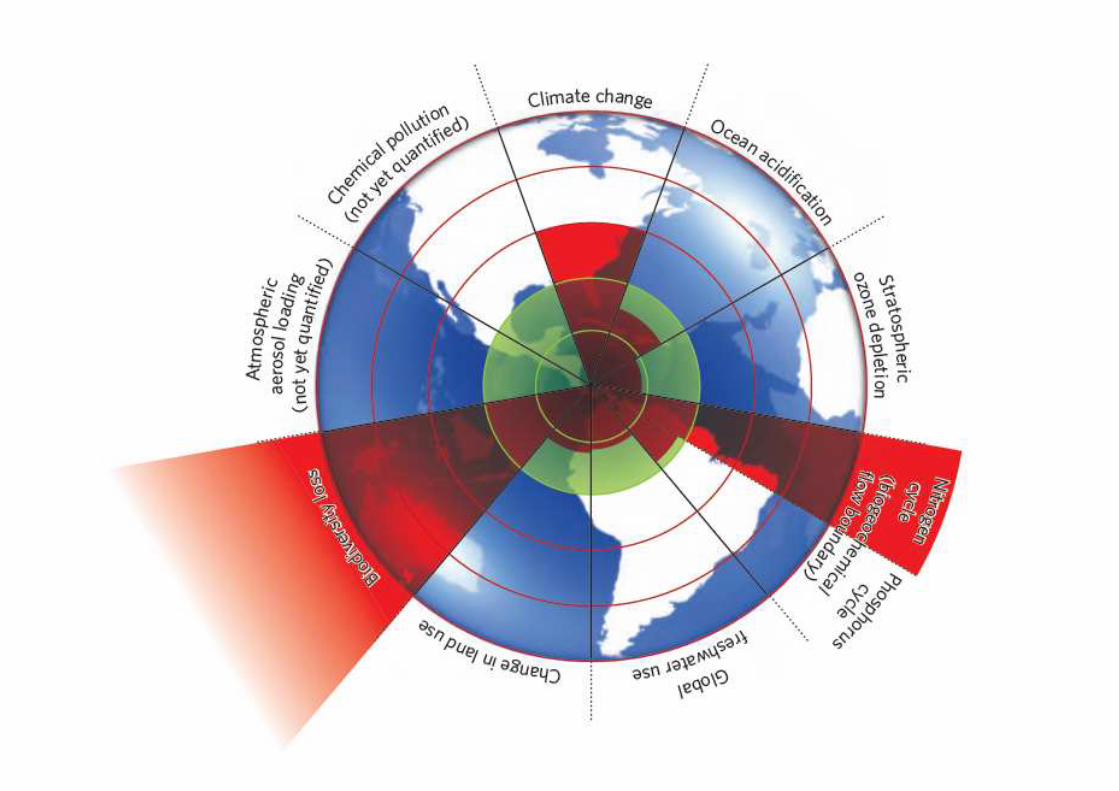
Planetary Boundaries: Exploring the safe operating space for humanity in the Anthropocene (Nature, 461 : 472 –475, Sept 24 - 2009)
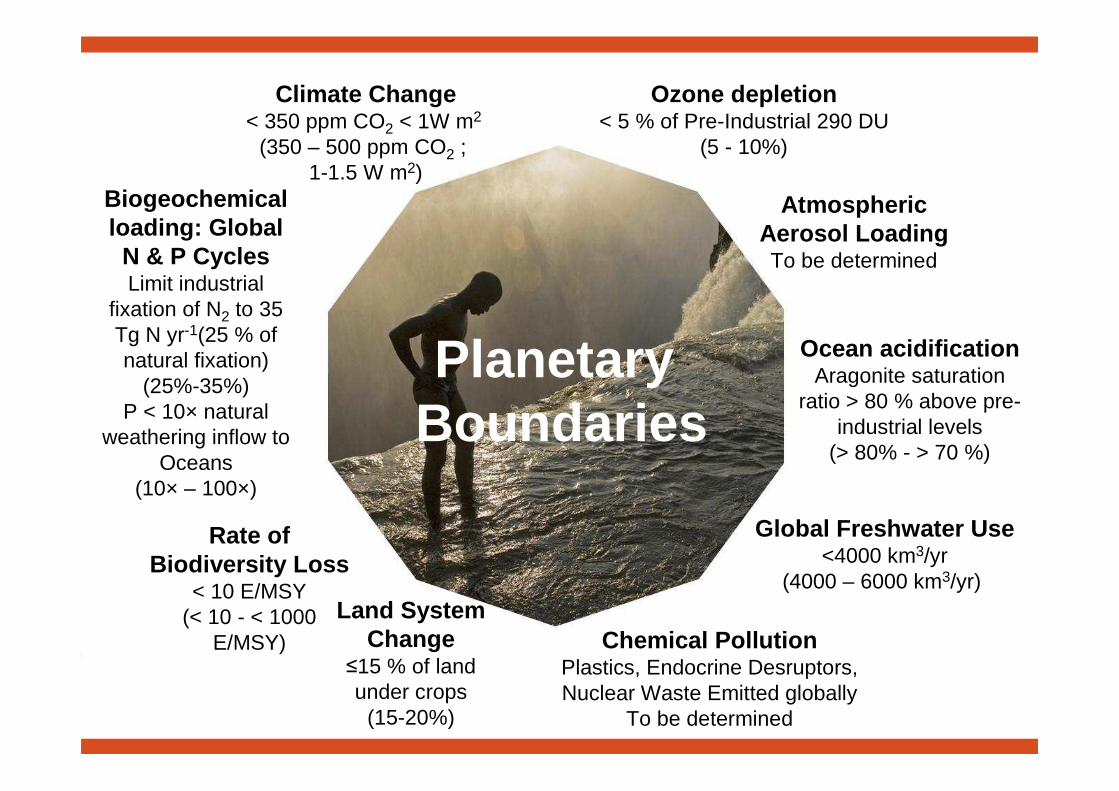
Climate Change< 350 ppm CO2 < 1W m2
(350 – 500 ppm CO2 ; 1-1.5 W m2)
Ocean acidificationAragonite saturation
ratio > 80 % above pre-industrial levels
(> 80% - > 70 %)
Ozone depletion< 5 % of Pre-Industrial 290 DU
(5 - 10%)
Global Freshwater Use<4000 km3/yr
(4000 – 6000 km3/yr)
Rate of Biodiversity Loss
< 10 E/MSY(< 10 - < 1000
E/MSY)
Biogeochemical loading: Global
N & P CyclesLimit industrial
fixation of N2 to 35 Tg N yr-1(25 % of natural fixation)
(25%-35%)P < 10× natural
weathering inflow to Oceans
(10× – 100×)
Atmospheric Aerosol LoadingTo be determined
Land System Change
≤15 % of land under crops
(15-20%)
Chemical Pollution Plastics, Endocrine Desruptors, Nuclear Waste Emitted globally
To be determined
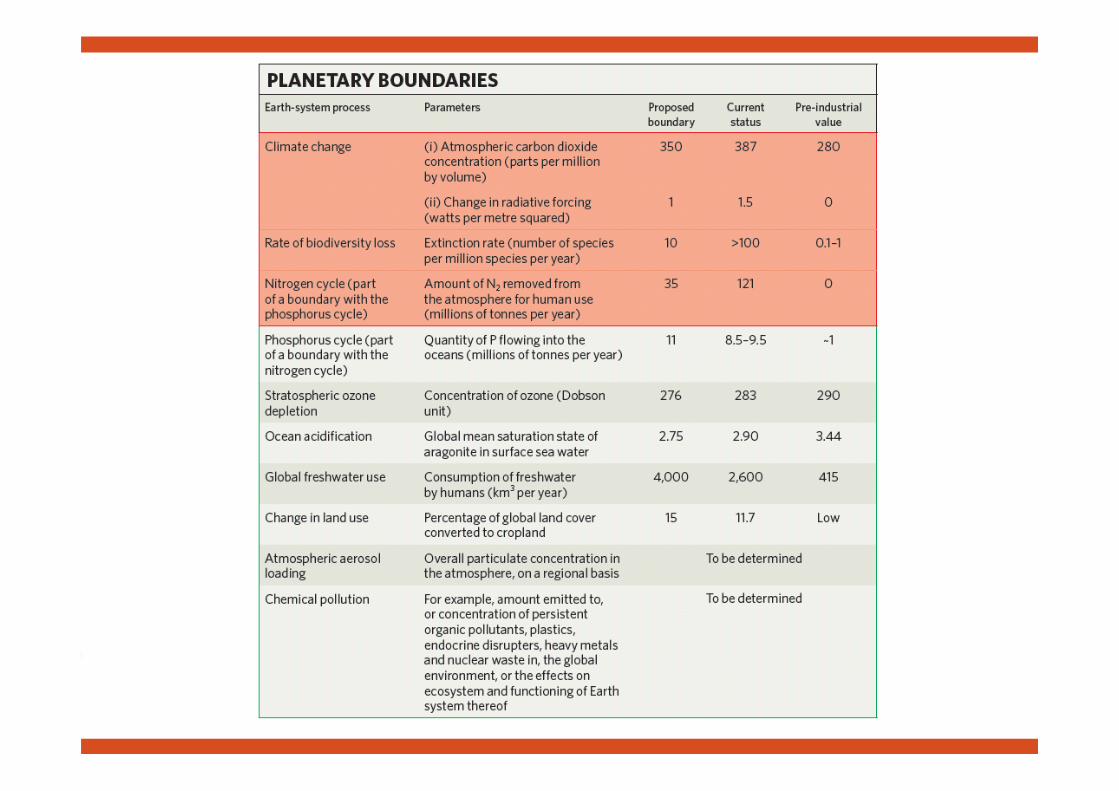
Planetary Boundaries
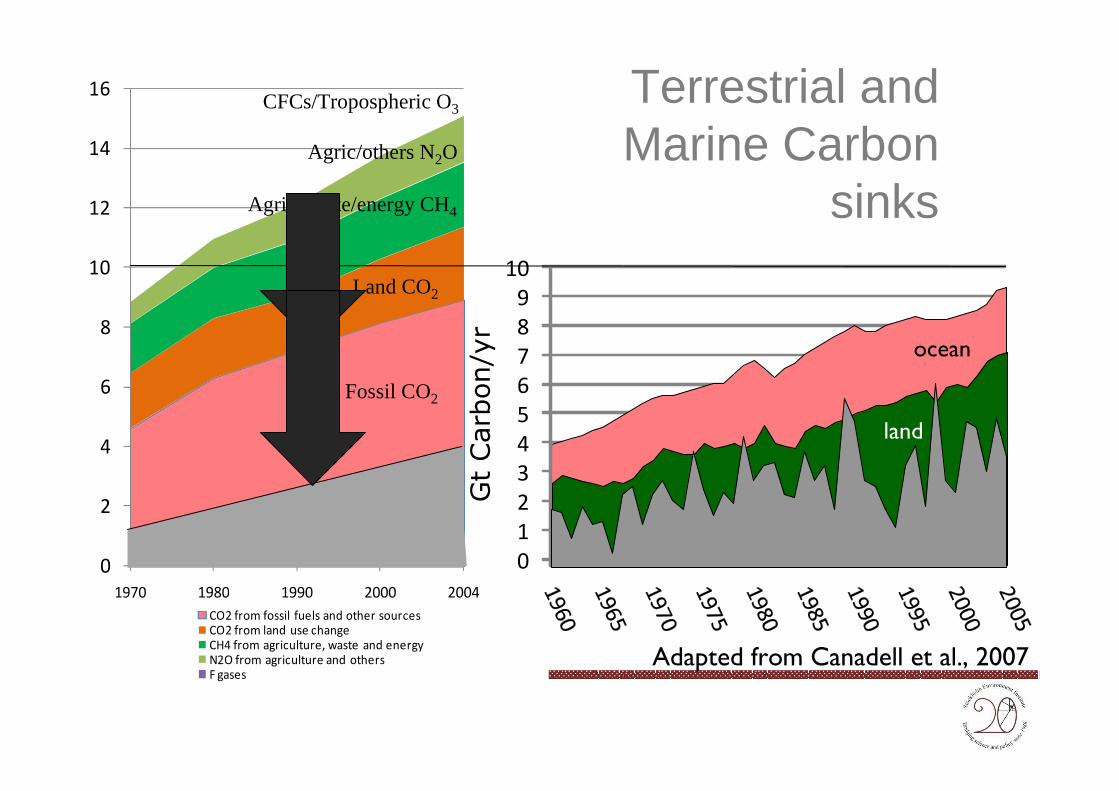
0
2
4
6
8
10
12
14
16
1970 1980 1990 2000 2004
CO2 from fossil fuels and other sources
CO2 from land use change
CH4 from agriculture, waste and energy
N2O from agriculture and others
F gasesAdapted from Canadell et al., 2007
Terrestrial and Marine Carbon
sinks
0
1
2
3
4
5
6
7
8
9
10
Gt Carbon/yr
ocean
land
Fossil CO2
Land CO2
Agric/waste/energy CH4
Agric/others N2O
CFCs/Tropospheric O3
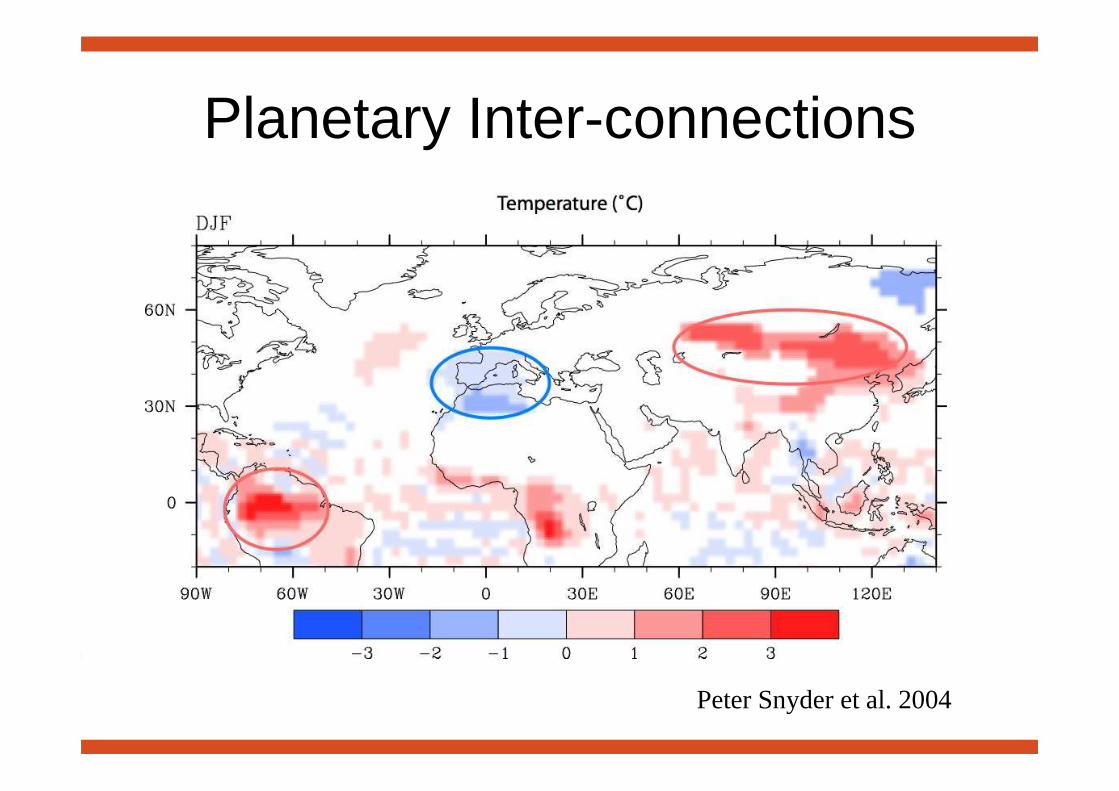
Peter Snyder et al. 2004
Planetary Inter-connections
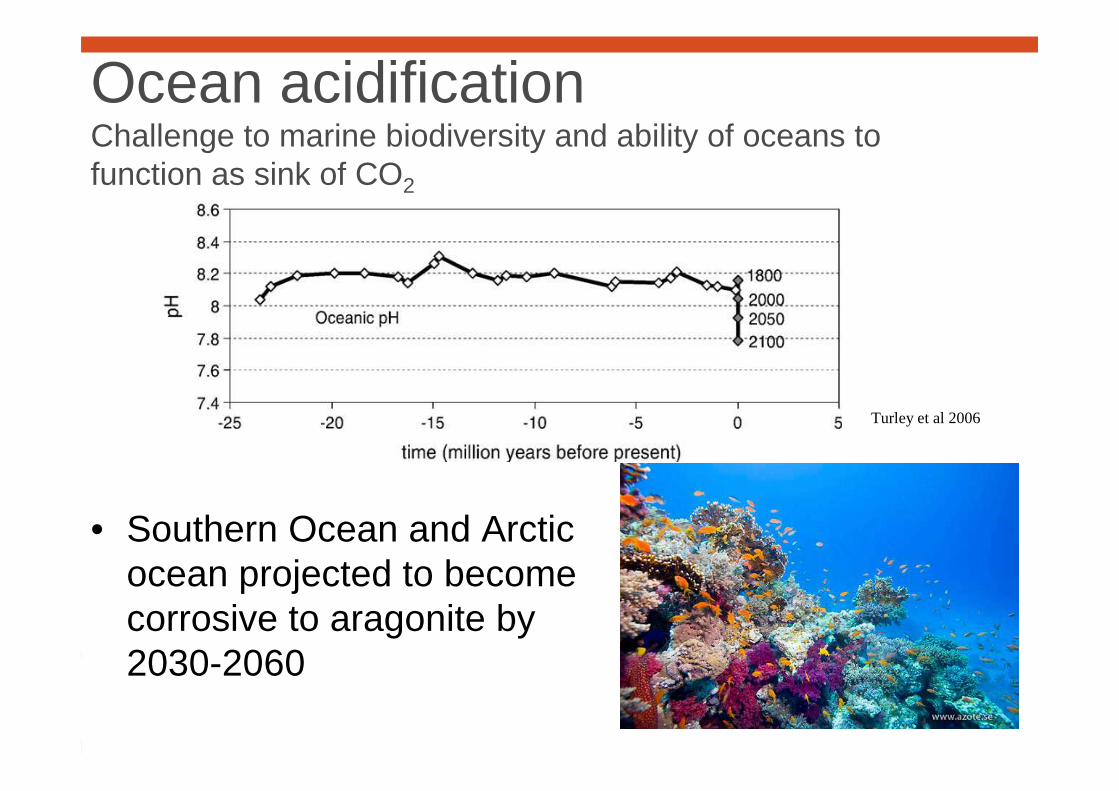
Ocean acidificationChallenge to marine biodiversity and ability of oceans to function as sink of CO2
• Southern Ocean and Arctic ocean projected to become corrosive to aragonite by 2030-2060
Turley et al 2006
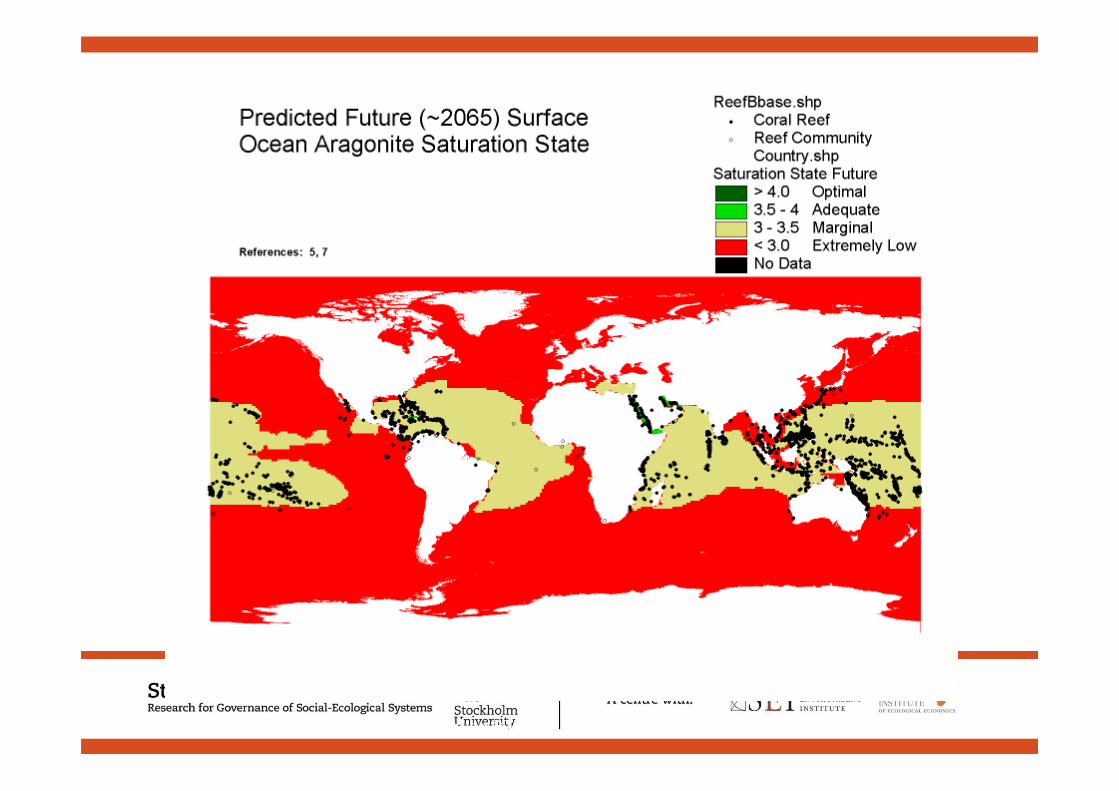
From R. Buddemeier, based on Kleypas et al. 1999
Planetary Boundaries:
Exploring the safe operating space for
humanity in the Anthropocene
(Nature, 461 : 472 –475, Sept 24 - 2009)
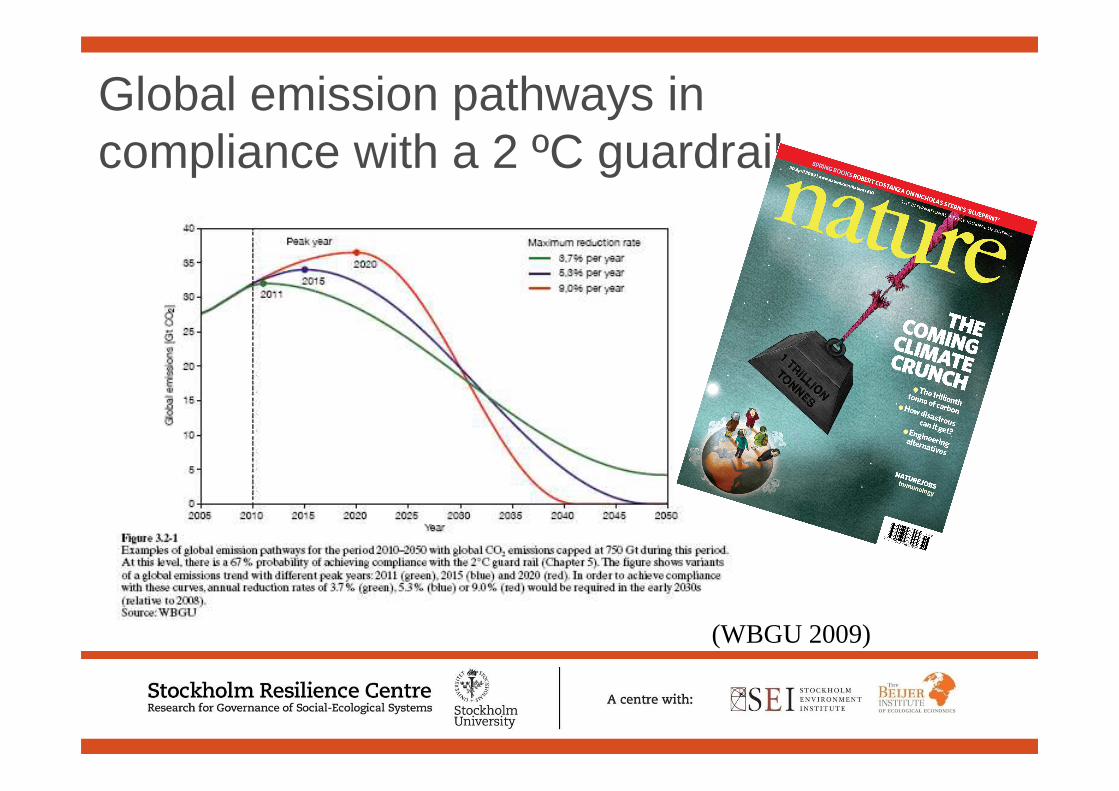
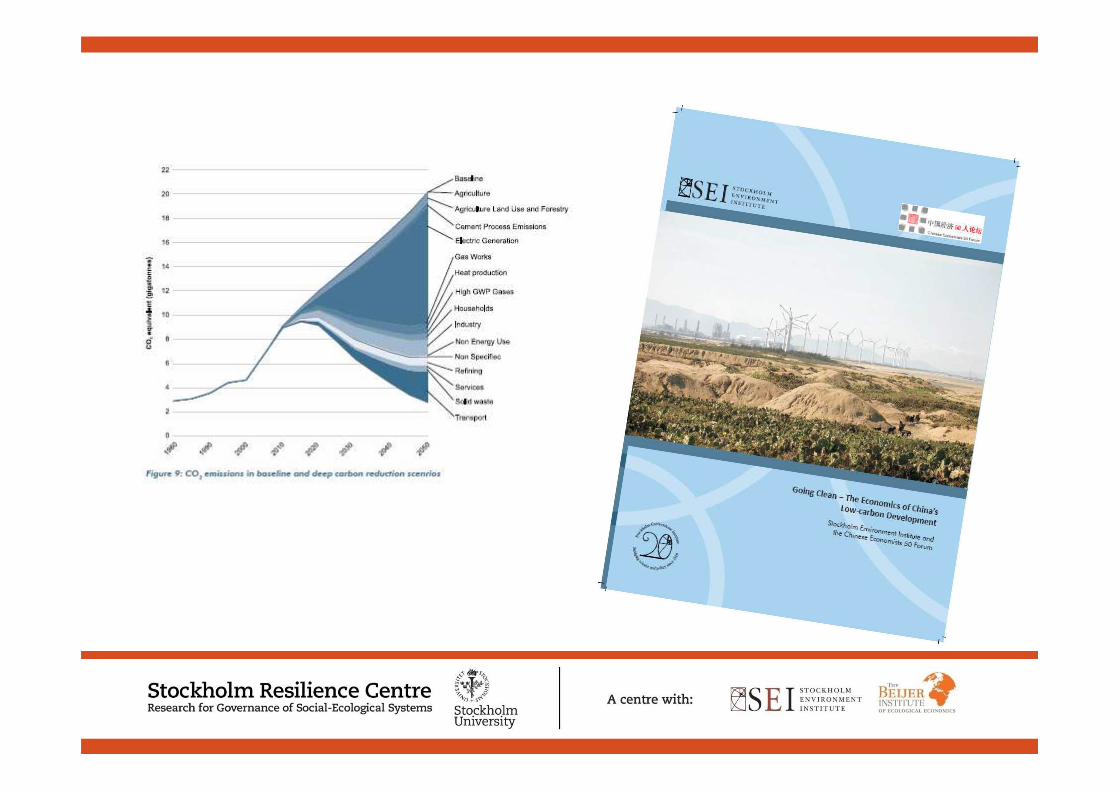
Global emission pathways in compliance with a 2 ºC guardrail
(WBGU 2009)
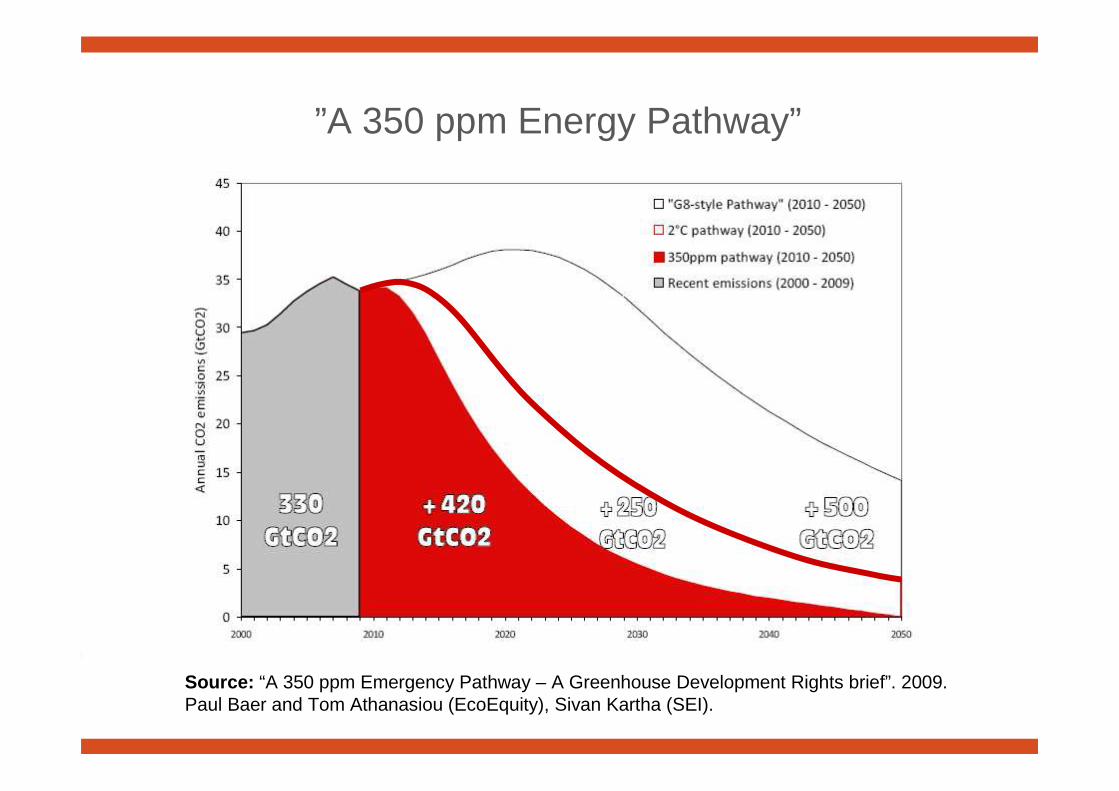
”A 350 ppm Energy Pathway”
Source: “A 350 ppm Emergency Pathway – A Greenhouse Development Rights brief”. 2009. Paul Baer and Tom Athanasiou (EcoEquity), Sivan Kartha (SEI).
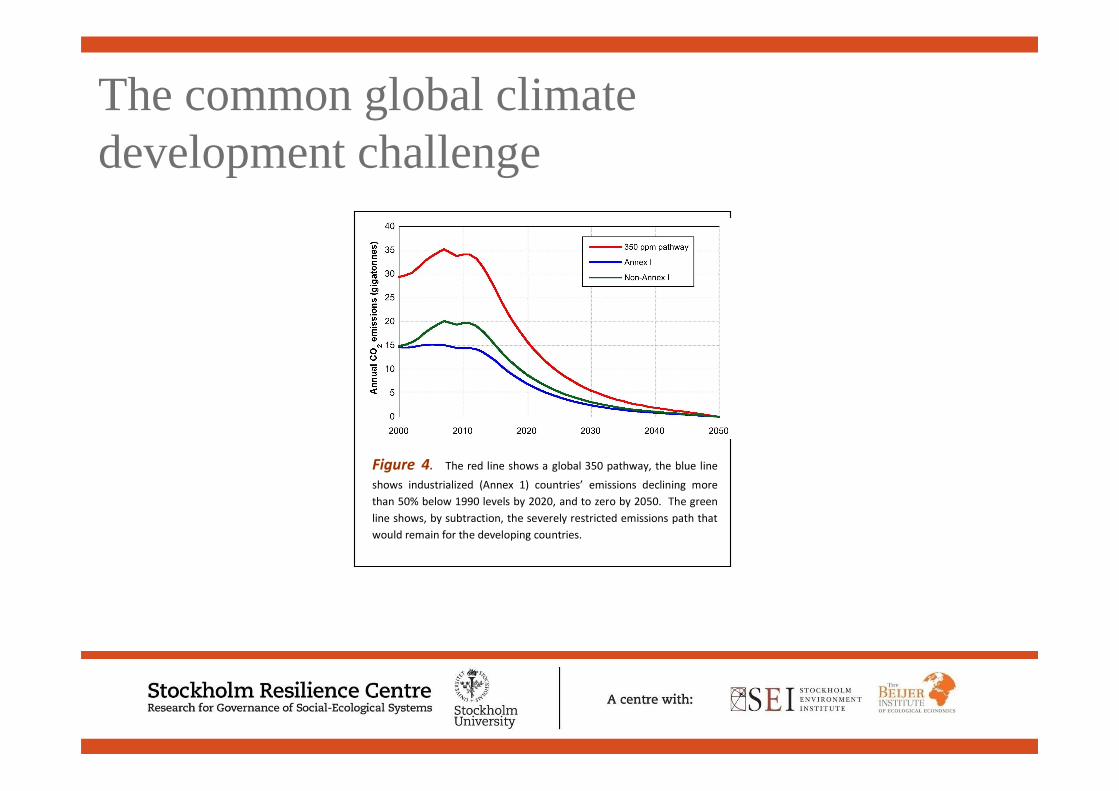
Figure 4. The red line shows a global 350 pathway, the blue line
shows industrialized (Annex 1) countries’ emissions declining more
than 50% below 1990 levels by 2020, and to zero by 2050. The green
line shows, by subtraction, the severely restricted emissions path that
would remain for the developing countries.
The common global climate development challenge
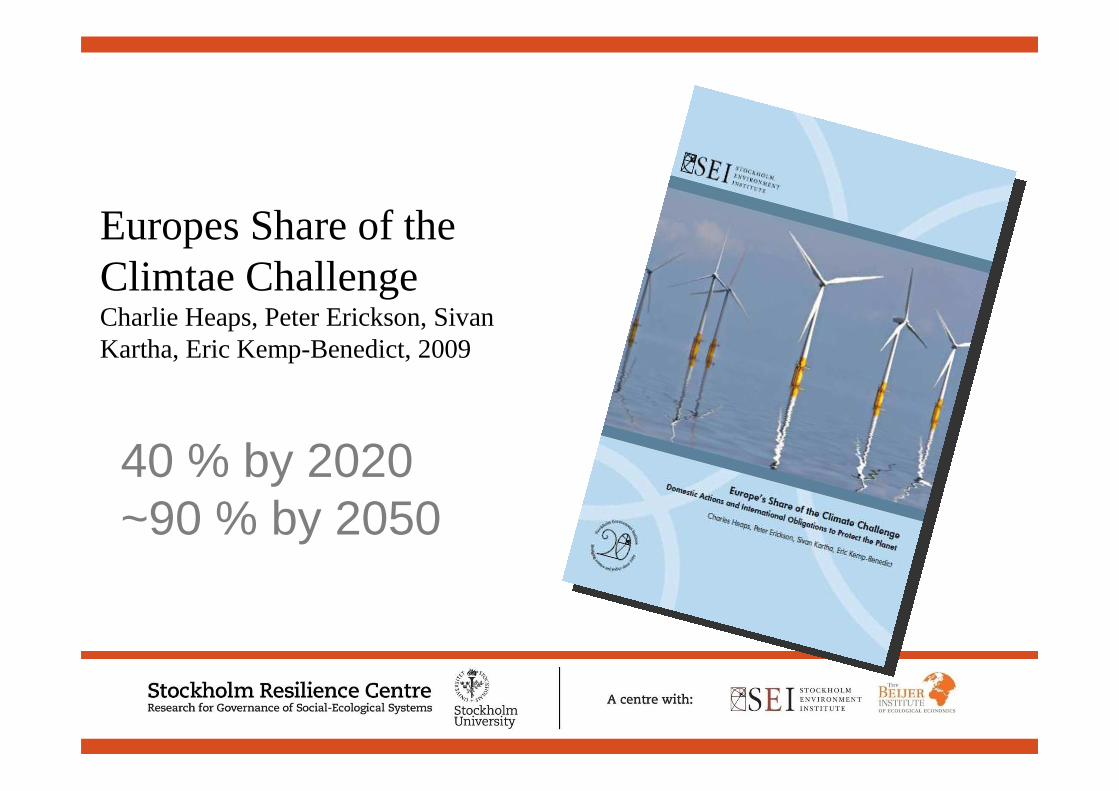
Europes Share of the Climtae ChallengeCharlie Heaps, Peter Erickson, Sivan Kartha, Eric Kemp-Benedict, 2009
40 % by 2020~90 % by 2050
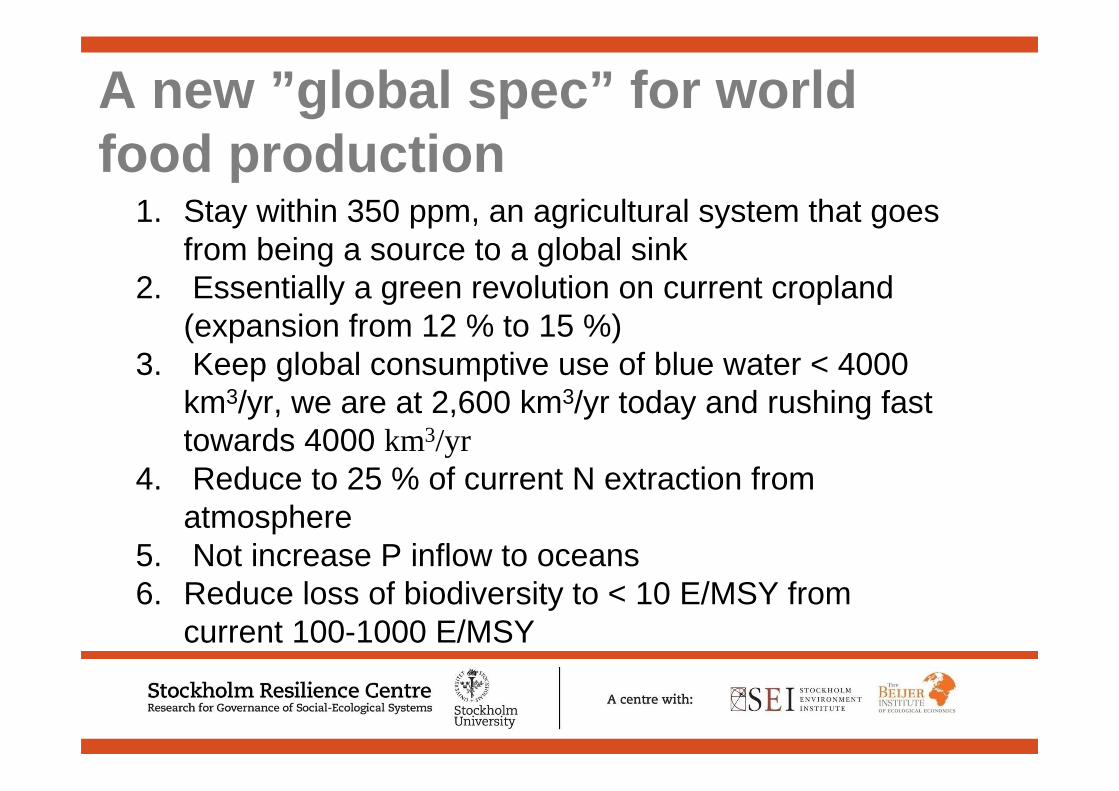
1. Stay within 350 ppm, an agricultural system that goes from being a source to a global sink
2. Essentially a green revolution on current cropland (expansion from 12 % to 15 %)
3. Keep global consumptive use of blue water < 4000 km3/yr, we are at 2,600 km3/yr today and rushing fast towards 4000 km3/yr
4. Reduce to 25 % of current N extraction from atmosphere
5. Not increase P inflow to oceans 6. Reduce loss of biodiversity to < 10 E/MSY from
current 100-1000 E/MSY
A new ”global spec” for world food production
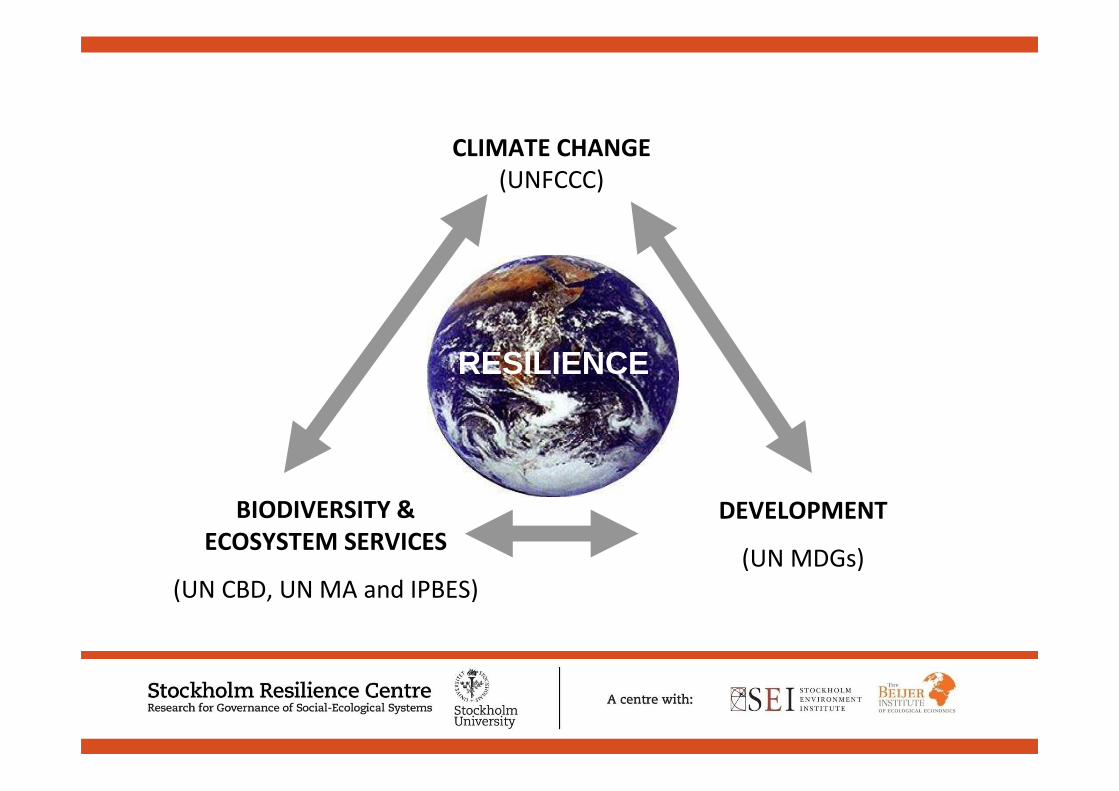
CLIMATE CHANGE
(UNFCCC)
BIODIVERSITY &
ECOSYSTEM SERVICES
(UN CBD, UN MA and IPBES)
DEVELOPMENT
(UN MDGs)
RESILIENCE
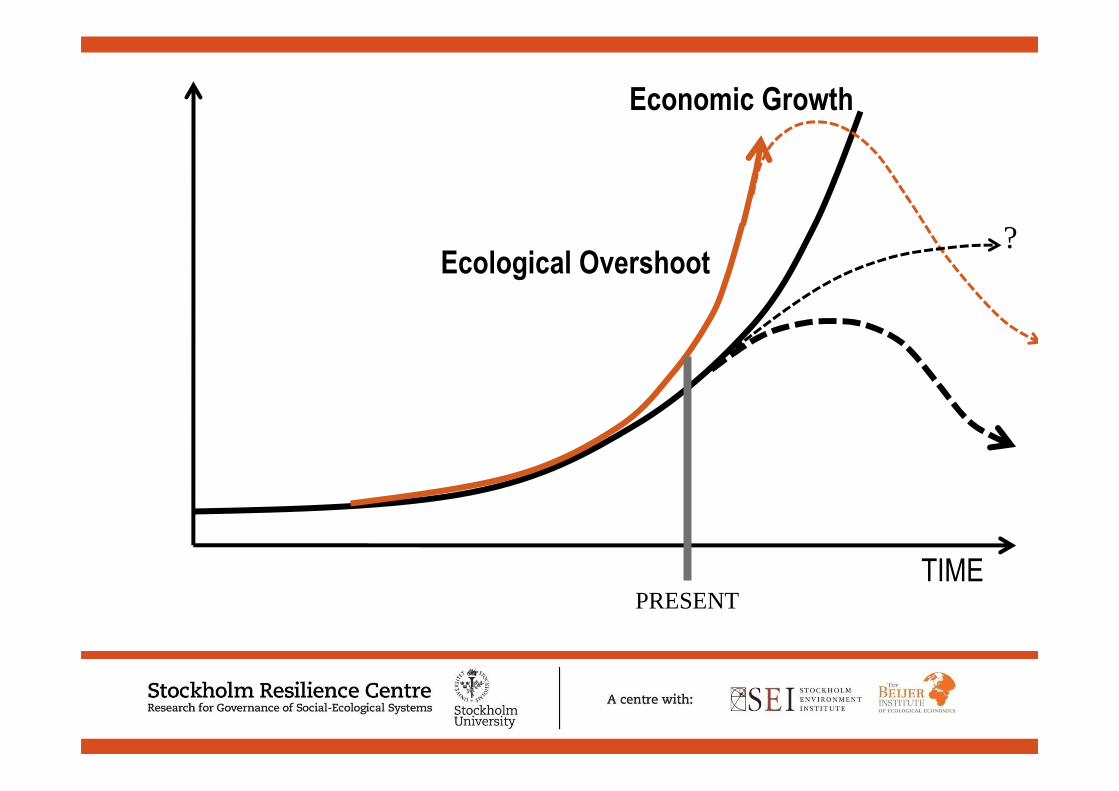
TIME
Ecological Overshoot
Economic Growth
PRESENT
?
Biodiversity provides resilience for humanity in
an era of rapid global change
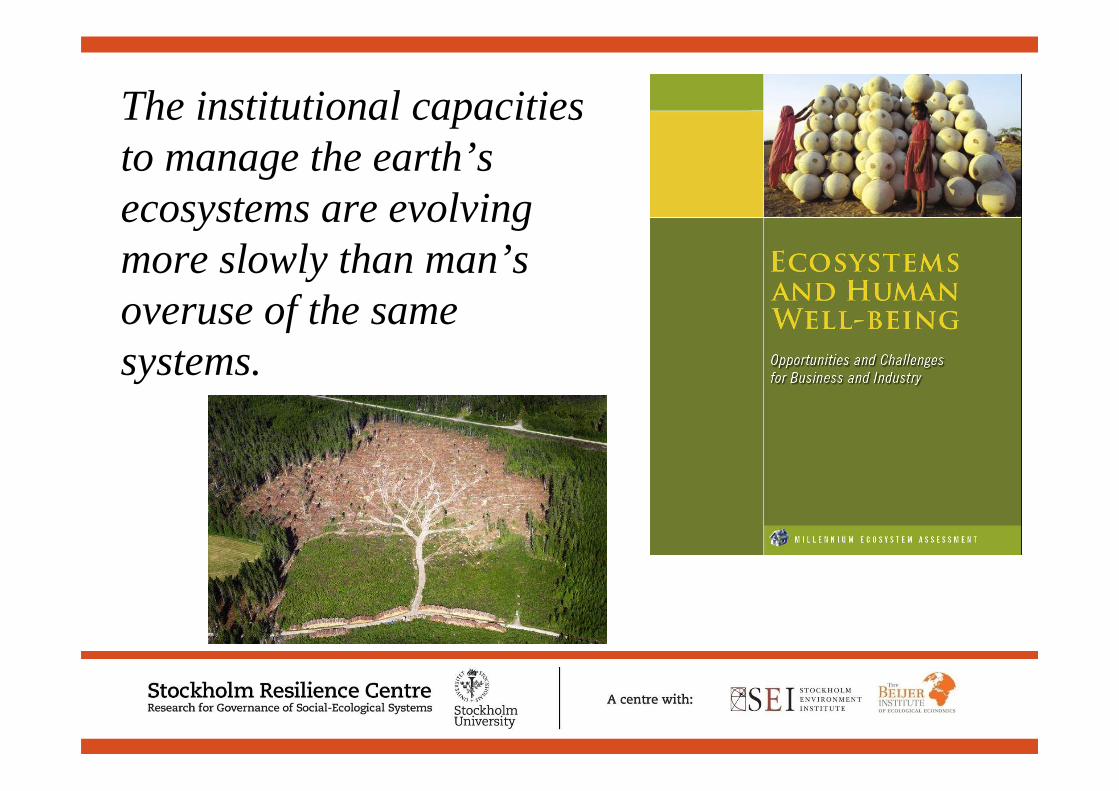
The institutional capacities to manage the earth’s ecosystems are evolving more slowly than man’s overuse of the same systems.
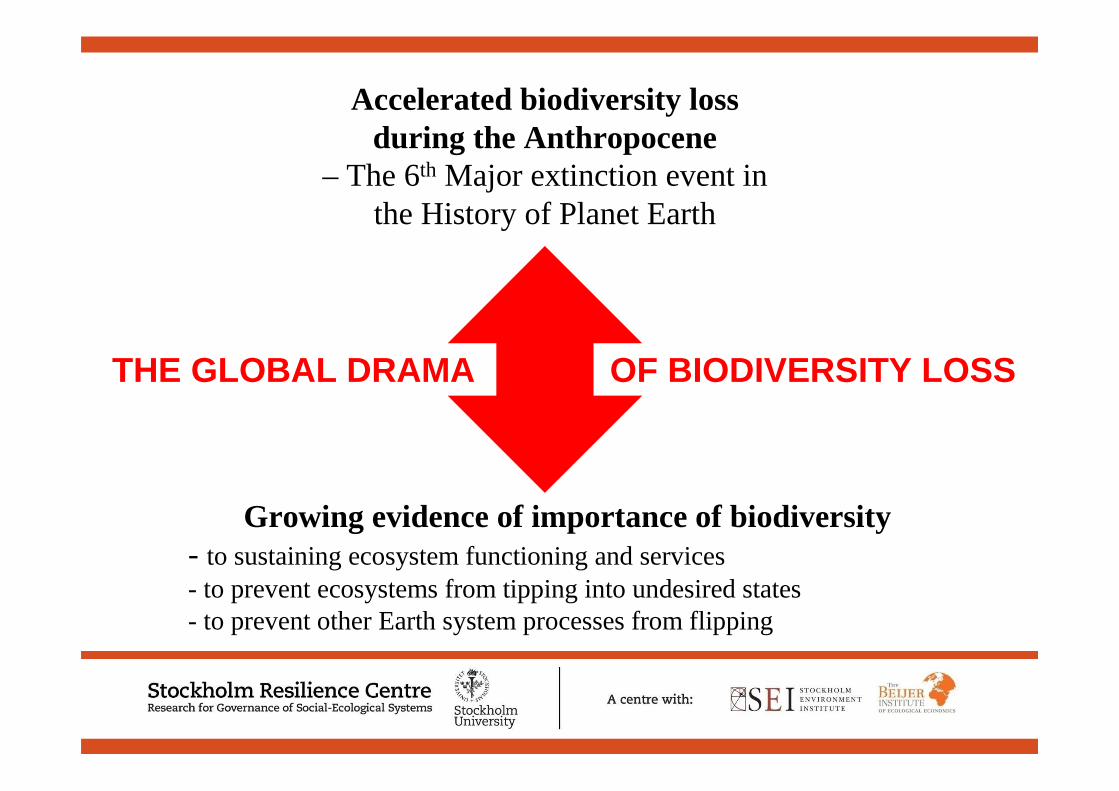
Accelerated biodiversity loss during the Anthropocene
– The 6th Major extinction event in the History of Planet Earth
Growing evidence of importance of biodiversity - to sustaining ecosystem functioning and services- to prevent ecosystems from tipping into undesired states- to prevent other Earth system processes from flipping
THE GLOBAL DRAMA OF BIODIVERSITY LOSS
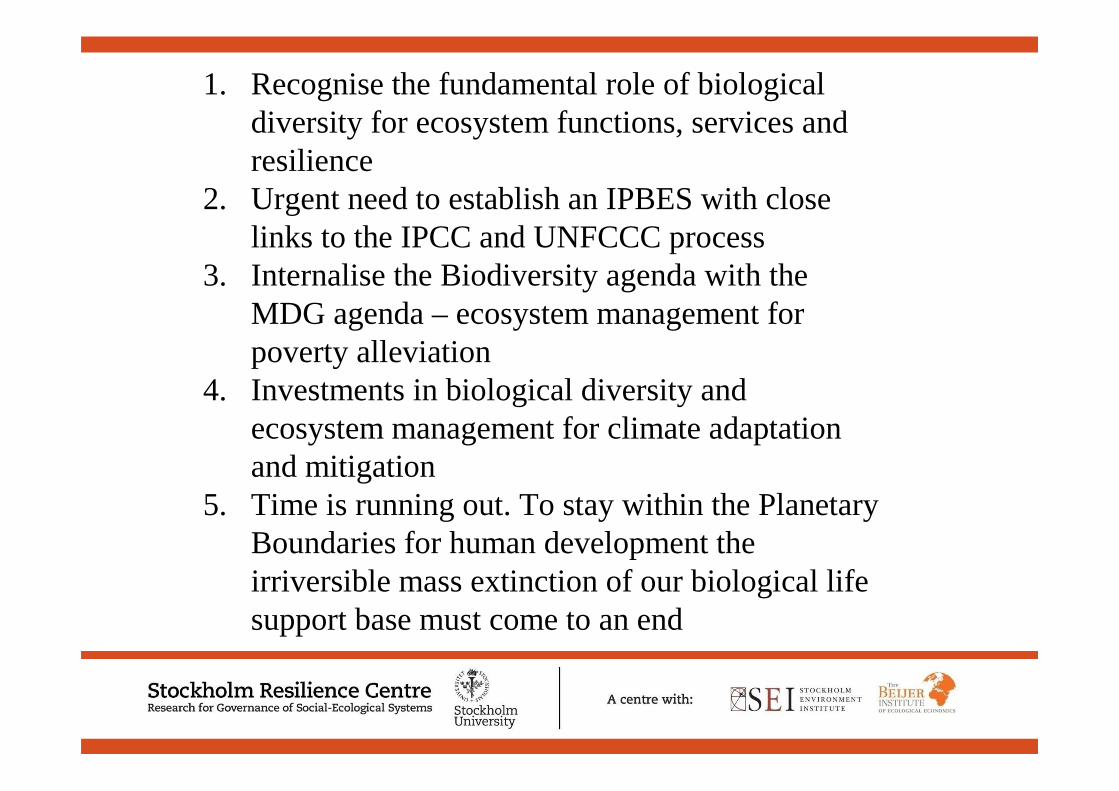
1. Recognise the fundamental role of biological diversity for ecosystem functions, services and resilience
2. Urgent need to establish an IPBES with close links to the IPCC and UNFCCC process
3. Internalise the Biodiversity agenda with the MDG agenda – ecosystem management for poverty alleviation
4. Investments in biological diversity and ecosystem management for climate adaptation and mitigation
5. Time is running out. To stay within the Planetary Boundaries for human development the irriversible mass extinction of our biological life support base must come to an end
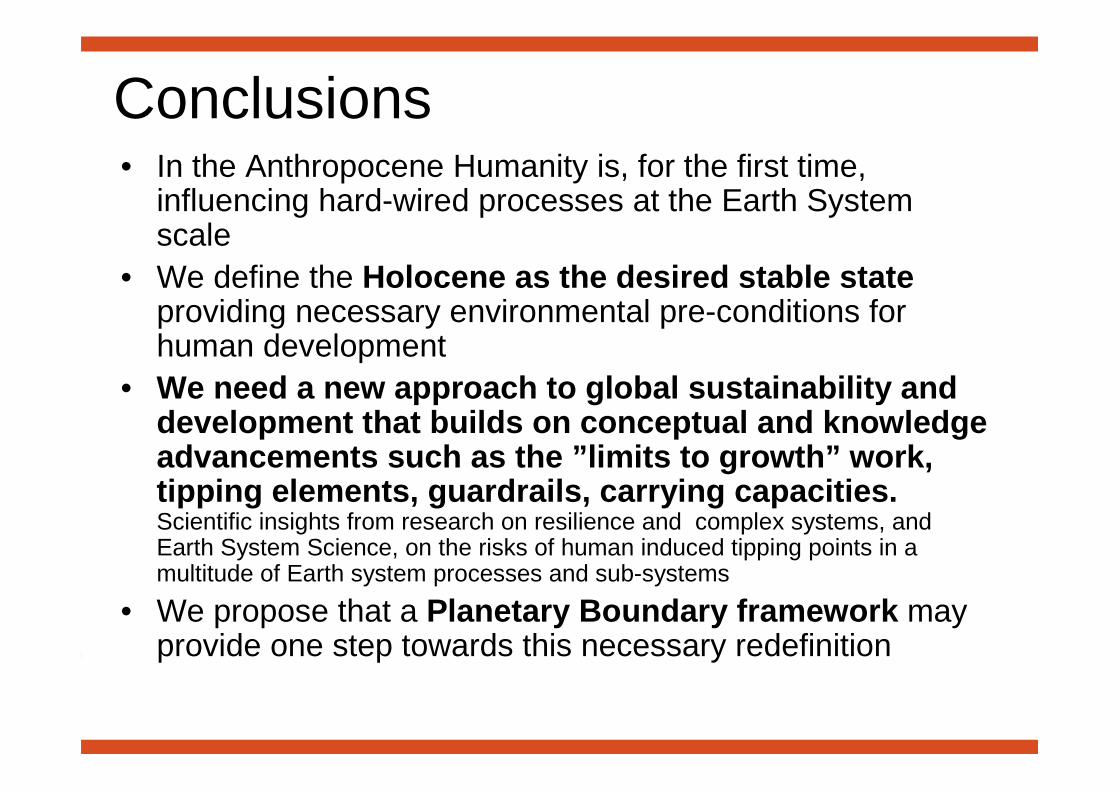
Conclusions• In the Anthropocene Humanity is, for the first time,
influencing hard-wired processes at the Earth System scale
• We define the Holocene as the desired stable state providing necessary environmental pre-conditions for human development
• We need a new approach to global sustainability and development that builds on conceptual and knowledge advancements such as the ”limits to growth” work, tipping elements, guardrails, carrying capacities. Scientific insights from research on resilience and complex systems, and Earth System Science, on the risks of human induced tipping points in a multitude of Earth system processes and sub-systems
• We propose that a Planetary Boundary framework may provide one step towards this necessary redefinition
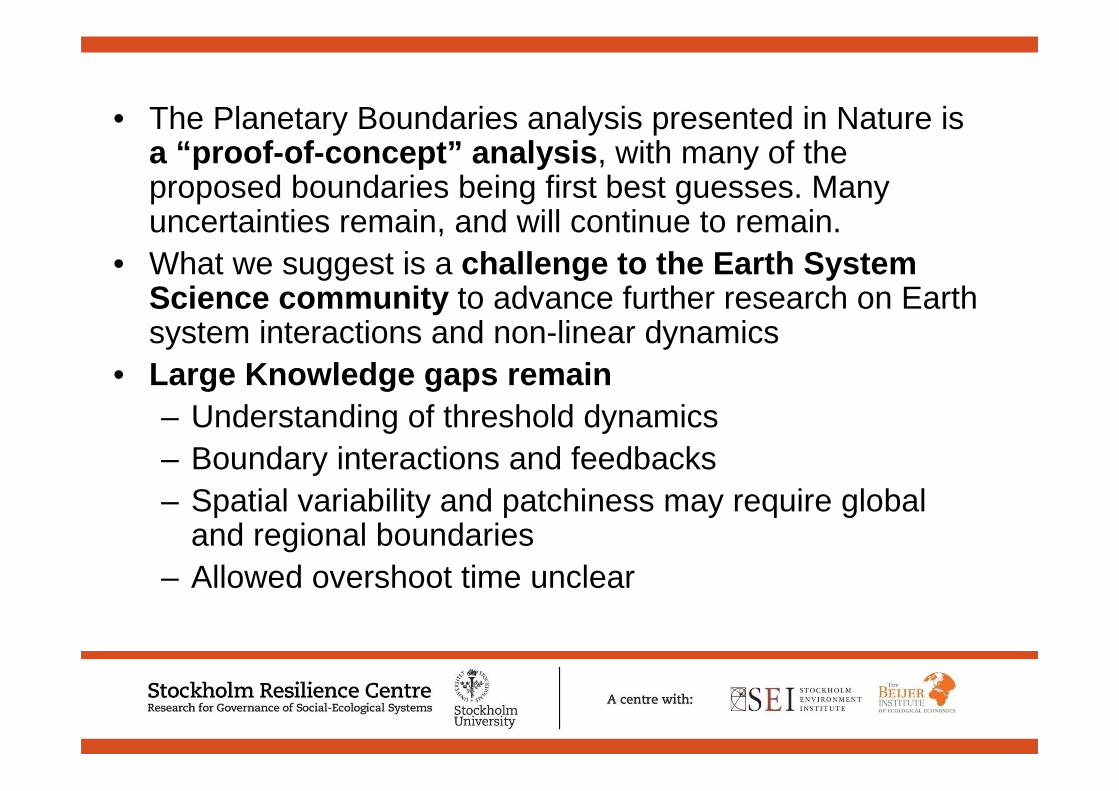
• The Planetary Boundaries analysis presented in Nature is a “proof-of-concept” analysis , with many of the proposed boundaries being first best guesses. Many uncertainties remain, and will continue to remain.
• What we suggest is a challenge to the Earth System Science community to advance further research on Earth system interactions and non-linear dynamics
• Large Knowledge gaps remain– Understanding of threshold dynamics – Boundary interactions and feedbacks– Spatial variability and patchiness may require global
and regional boundaries– Allowed overshoot time unclear
• No doubt, a Planetary Boundaries approach to sustainable development would have profound implications for governance and policy across scales . Large scientific challenges to address the human dimensions and governance implications of development within Planetary Boundaries
• Despite uncertainties on allowed overshoot before large discontinuities, we have enough evidence to act now . Time is running out on several of the Planetary Boundaries, and the momentum of driving forces tremendous. This is a first attempt to define the safe space for human development, which may prove critical in turbulent times ahead.
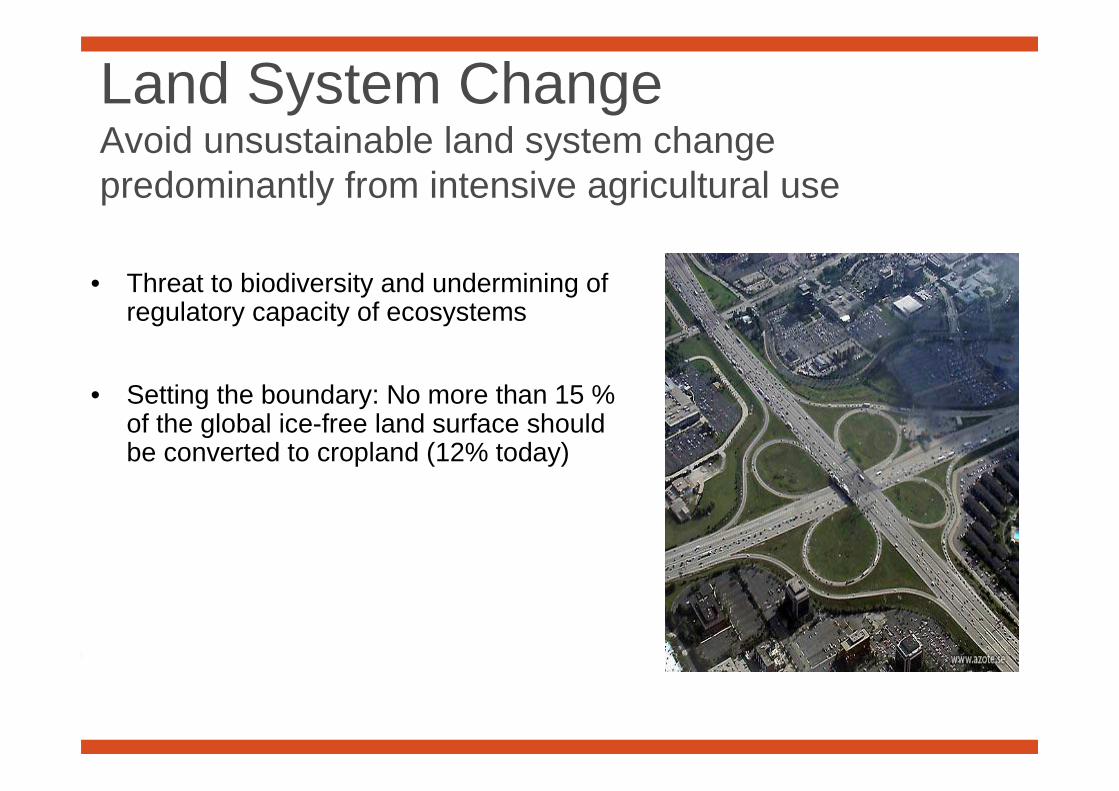
Land System ChangeAvoid unsustainable land system change predominantly from intensive agricultural use
• Threat to biodiversity and undermining of regulatory capacity of ecosystems
• Setting the boundary: No more than 15 % of the global ice-free land surface should be converted to cropland (12% today)
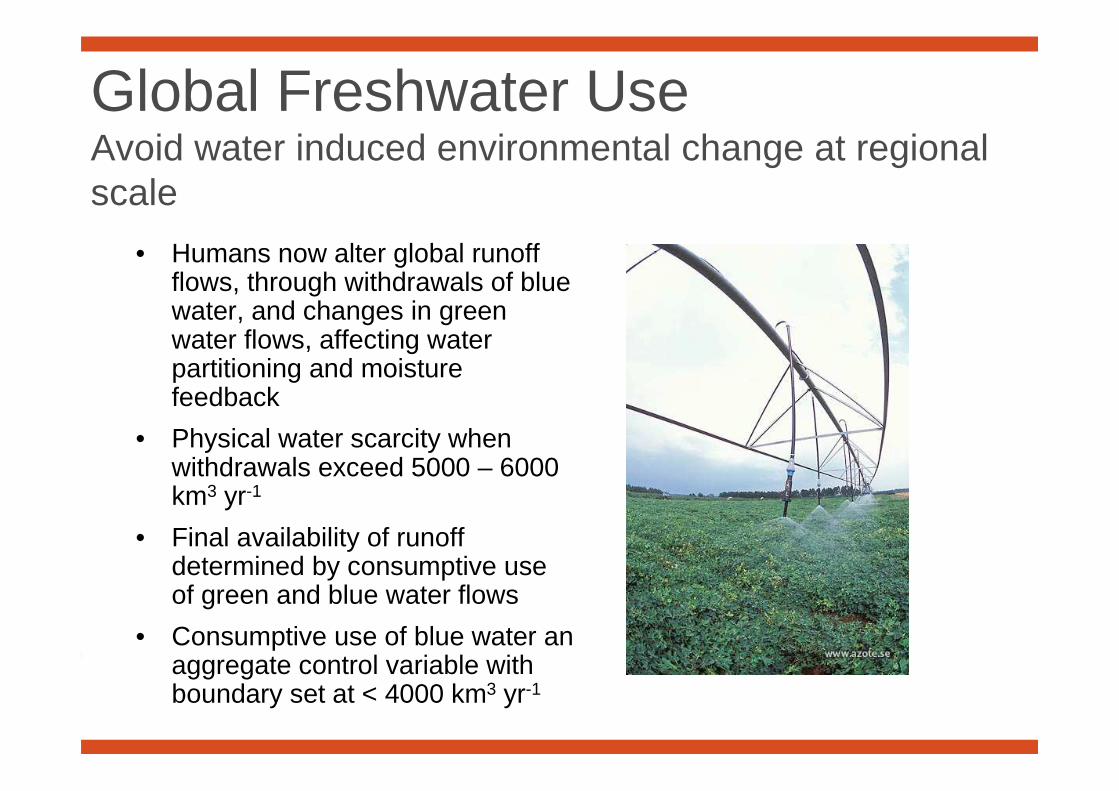
Global Freshwater UseAvoid water induced environmental change at regional scale
• Humans now alter global runoff flows, through withdrawals of blue water, and changes in green water flows, affecting water partitioning and moisture feedback
• Physical water scarcity when withdrawals exceed 5000 – 6000 km3 yr-1
• Final availability of runoff determined by consumptive use of green and blue water flows
• Consumptive use of blue water an aggregate control variable with boundary set at < 4000 km3 yr-1

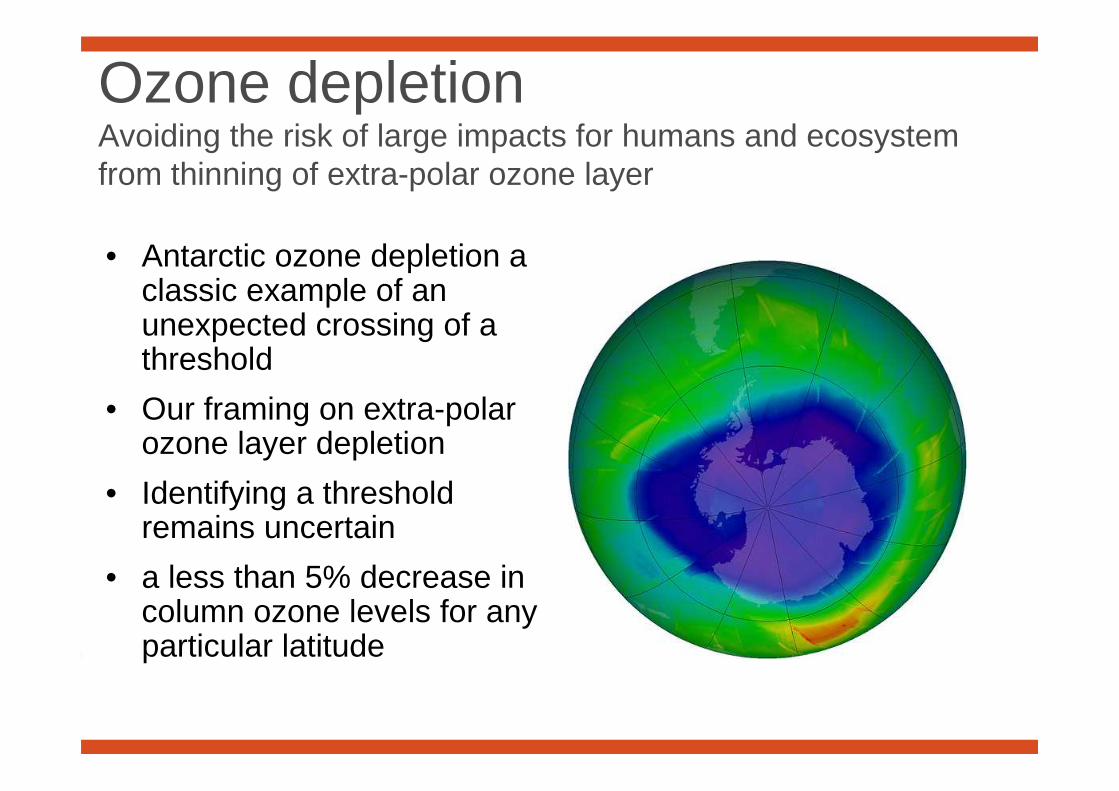
Ozone depletionAvoiding the risk of large impacts for humans and ecosystem from thinning of extra-polar ozone layer
• Antarctic ozone depletion a classic example of an unexpected crossing of a threshold
• Our framing on extra-polar ozone layer depletion
• Identifying a threshold remains uncertain
• a less than 5% decrease in column ozone levels for any particular latitude
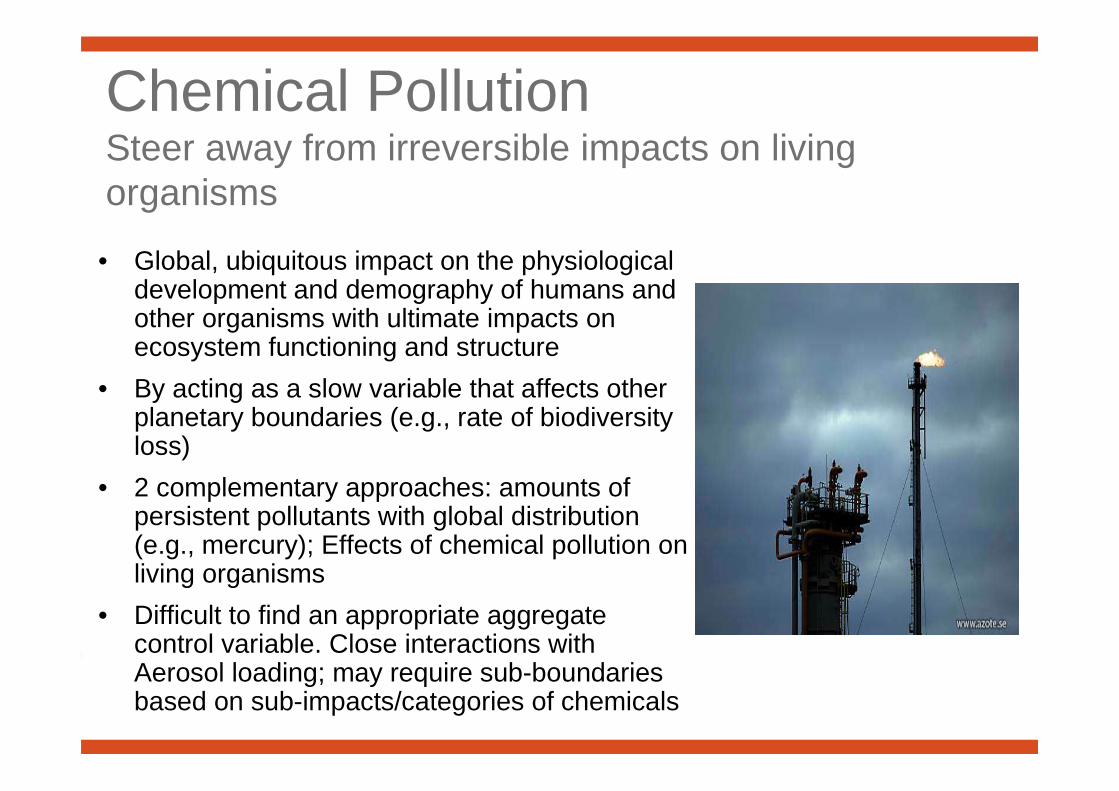
Chemical PollutionSteer away from irreversible impacts on living organisms
• Global, ubiquitous impact on the physiological development and demography of humans and other organisms with ultimate impacts on ecosystem functioning and structure
• By acting as a slow variable that affects other planetary boundaries (e.g., rate of biodiversity loss)
• 2 complementary approaches: amounts of persistent pollutants with global distribution (e.g., mercury); Effects of chemical pollution on living organisms
• Difficult to find an appropriate aggregate control variable. Close interactions with Aerosol loading; may require sub-boundaries based on sub-impacts/categories of chemicals

Peter Snyder et al. 2004
Planetary Inter-connections
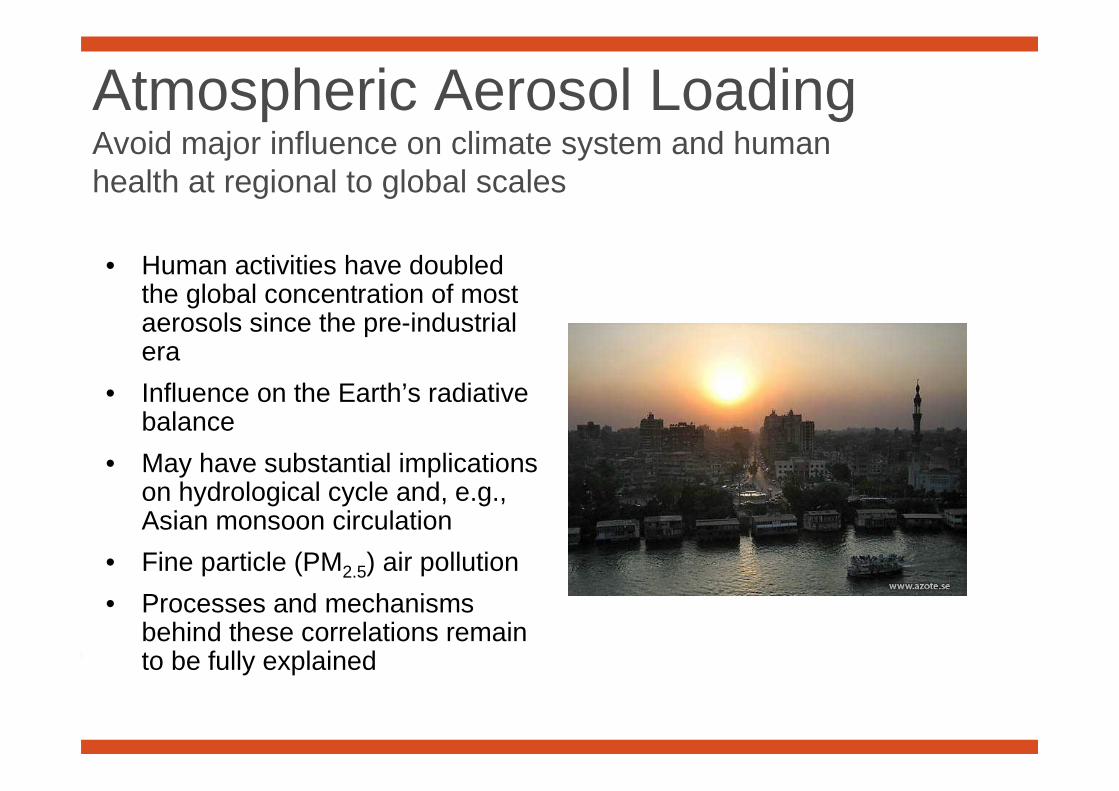
Atmospheric Aerosol LoadingAvoid major influence on climate system and human health at regional to global scales
• Human activities have doubled the global concentration of most aerosols since the pre-industrial era
• Influence on the Earth’s radiative balance
• May have substantial implications on hydrological cycle and, e.g., Asian monsoon circulation
• Fine particle (PM2.5) air pollution
• Processes and mechanisms behind these correlations remain to be fully explained