HUMAN CASUALTY AND DAMAGE DISTRIBUTION IN RELATION …
8
The 14 th World Conference on Earthquake Engineering October 12-17, 2008, Beijing, China HUMAN CASUALTY AND DAMAGE DISTRIBUTION IN RELATION TO SEISMIC INTENSITY IN THE 2006 CENTRAL JAVA EARTHQUAKE IN INDONESIA H. Murakami 1 , D. Pramitasari 2 , and R. Ohno 3 1 Associate Professor, Division of. of Environmental Science and Engr., Graduate School of Sci. and Engr., Yamaguchi University, Ube, Japan 2 Lecturer, Department of Architecture and Planning, Faculty of Engineering, Gadjah Mada University, Yogyakarta, 55281, Indonesia 3 Professor, Dept. of Architecture, Tokyo Institute of Technology, Yokohama, Japan Email: [email protected], [email protected] , [email protected] ABSTRACT : The 2006 Central Java (Jogyakarta) earthquake occurred on May 27, and caused 140 thousand dwellings collapsed 190 thousand dwellings heavily damaged, and 5,800 human lives lost. The authors made reconnaissance field survey in June, 2006, collected damage statistics and examined GIS distribution. The seismic intensities were estimated by means of questionnaire survey. Obtained results are as follows. (1) Dwelling collapse rate reached 60% and human loss rate exceeded 1.6% along 20km in NNE direction around epicenter. Human loss rates tend to be smaller for the similar levels of dwelling collapse rates in Java where single story dwellings are common, than in the 1995 Kobe earthquake region. (2) Maximum MSK intensity of 8 or larger is estimated in the epicenter area, while it decreases toward the west direction. Probability of human casualty increases while dwelling damage levels worsened and human loss occurred in approximately 12% of households, when a single wall collapsed or two or more walls totally collapsed. (3) Comparison of building types in damage levels indicated that brick houses are more vulnerable than RC buildings and wooden houses. At MSK intensity 8, responses of many brick houses collapsed reaches 0.77 and the highest, while that of RC buildings is 0.44 and that of wooden houses is 0.11. KEYWORDS: seismic intensity, building vulnerability, human loss, Java earthquake 1. INTRODUCTION The 2006 Central Java Earthquake with magnitude 6.3 occurred on Saturday May 27th at 5:53 a.m., local time, or Friday, May 26, 2006 at 22:53:58 (UTC) in Bantul district of Yogyakarta Special State, Indonesia (USGS, 2006). Dwelling damages and human casualty were very severe affecting densely populated farming villages and towns in the State and also urban area of Yogyakarta city. The authors conducted field reconnaissance survey joining a team of Kyushu University in June, 2006. This study aims to elucidate dwelling damages vulnerability and human casualty in relation with seismic intensity and other factors. 2. GIS DISTRIBUTION OF DAMAGE BASED ON STATISTICS 2.1. GIS Distribution of Damage and Human Loss According to the report by the Indonesian Government Disaster Management Center, total human casualty numbered 5,778 people killed and 37,883 people injured, while dwelling damage numbered 139,859 dwellings totally collapsed and 190,025 dwellings heavily damaged. The area affected by this earthquake is the special state of Yogyakarta and Klaten district, which belongs to Central Java State. GIS files for the affected area, which contains ARC-GIS shape file layers of polygons are used to map damage distribution. We collected damage statistics of dwelling damage and human casualty in sub-district or village levels by visiting district or sub-district offices. Dwelling damage and human casualty were investigated officially at
Transcript of HUMAN CASUALTY AND DAMAGE DISTRIBUTION IN RELATION …
The 14th
World Conference on Earthquake Engineering October 12-17, 2008, Beijing, China
HUMAN CASUALTY AND DAMAGE DISTRIBUTION IN RELATION TO SEISMIC INTENSITY IN THE 2006 CENTRAL JAVA
EARTHQUAKE IN INDONESIA H. Murakami
1 , D. Pramitasari
2, and R. Ohno
3
1 Associate Professor, Division of. of Environmental Science and Engr., Graduate School of Sci. and Engr.,
Yamaguchi University, Ube, Japan 2 Lecturer, Department of Architecture and Planning, Faculty of Engineering,
Gadjah Mada University, Yogyakarta, 55281, Indonesia 3 Professor, Dept. of Architecture, Tokyo Institute of Technology, Yokohama, Japan
Email: [email protected], [email protected] , [email protected]
ABSTRACT :
The 2006 Central Java (Jogyakarta) earthquake occurred on May 27, and caused 140 thousand dwellingscollapsed 190 thousand dwellings heavily damaged, and 5,800 human lives lost. The authors made reconnaissance field survey in June, 2006, collected damage statistics and examined GIS distribution. Theseismic intensities were estimated by means of questionnaire survey. Obtained results are as follows. (1) Dwelling collapse rate reached 60% and human loss rate exceeded 1.6% along 20km in NNE directionaround epicenter. Human loss rates tend to be smaller for the similar levels of dwelling collapse rates in Javawhere single story dwellings are common, than in the 1995 Kobe earthquake region. (2) Maximum MSK intensity of 8 or larger is estimated in the epicenter area, while it decreases toward the westdirection. Probability of human casualty increases while dwelling damage levels worsened and human lossoccurred in approximately 12% of households, when a single wall collapsed or two or more walls totally collapsed. (3) Comparison of building types in damage levels indicated that brick houses are more vulnerable than RC buildings and wooden houses. At MSK intensity 8, responses of many brick houses collapsed reaches 0.77 and the highest, while that of RC buildings is 0.44 and that of wooden houses is 0.11. KEYWORDS: seismic intensity, building vulnerability, human loss, Java earthquake 1. INTRODUCTION The 2006 Central Java Earthquake with magnitude 6.3 occurred on Saturday May 27th at 5:53 a.m., local time,or Friday, May 26, 2006 at 22:53:58 (UTC) in Bantul district of Yogyakarta Special State, Indonesia (USGS,2006). Dwelling damages and human casualty were very severe affecting densely populated farming villagesand towns in the State and also urban area of Yogyakarta city. The authors conducted field reconnaissance survey joining a team of Kyushu University in June, 2006. This study aims to elucidate dwelling damagesvulnerability and human casualty in relation with seismic intensity and other factors. 2. GIS DISTRIBUTION OF DAMAGE BASED ON STATISTICS 2.1. GIS Distribution of Damage and Human Loss According to the report by the Indonesian Government Disaster Management Center, total human casualtynumbered 5,778 people killed and 37,883 people injured, while dwelling damage numbered 139,859 dwellings totally collapsed and 190,025 dwellings heavily damaged. The area affected by this earthquake is the specialstate of Yogyakarta and Klaten district, which belongs to Central Java State. GIS files for the affected area,which contains ARC-GIS shape file layers of polygons are used to map damage distribution. We collected damage statistics of dwelling damage and human casualty in sub-district or village levels byvisiting district or sub-district offices. Dwelling damage and human casualty were investigated officially at
The 14th
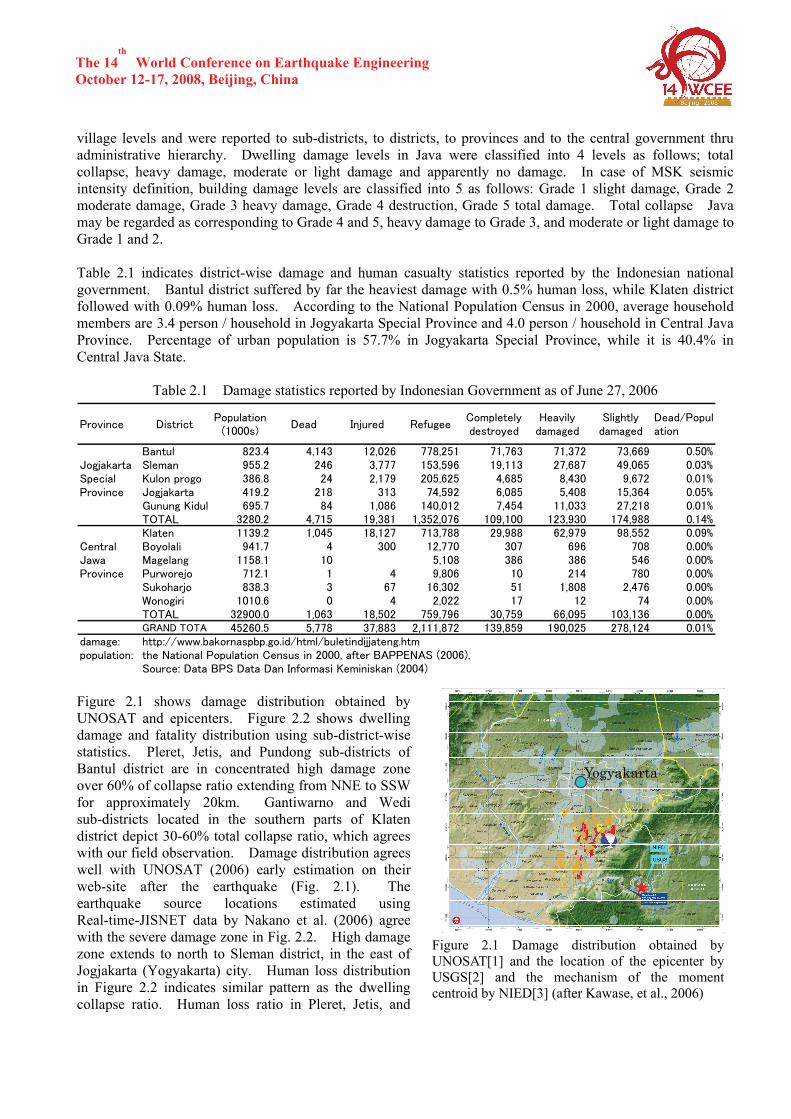
World Conference on Earthquake Engineering October 12-17, 2008, Beijing, China village levels and were reported to sub-districts, to districts, to provinces and to the central government thruadministrative hierarchy. Dwelling damage levels in Java were classified into 4 levels as follows; totalcollapse, heavy damage, moderate or light damage and apparently no damage. In case of MSK seismicintensity definition, building damage levels are classified into 5 as follows: Grade 1 slight damage, Grade 2moderate damage, Grade 3 heavy damage, Grade 4 destruction, Grade 5 total damage. Total collapse Java may be regarded as corresponding to Grade 4 and 5, heavy damage to Grade 3, and moderate or light damage toGrade 1 and 2. Table 2.1 indicates district-wise damage and human casualty statistics reported by the Indonesian national government. Bantul district suffered by far the heaviest damage with 0.5% human loss, while Klaten districtfollowed with 0.09% human loss. According to the National Population Census in 2000, average household members are 3.4 person / household in Jogyakarta Special Province and 4.0 person / household in Central JavaProvince. Percentage of urban population is 57.7% in Jogyakarta Special Province, while it is 40.4% inCentral Java State.
Table 2.1 Damage statistics reported by Indonesian Government as of June 27, 2006
Province DistrictPopulation
(1000s)Dead Injured Refugee
Completelydestroyed
Heavilydamaged
Slightlydamaged
Dead/Population
Bantul 823.4 4,143 12,026 778,251 71,763 71,372 73,669 0.50%Jogjakarta Sleman 955.2 246 3,777 153,596 19,113 27,687 49,065 0.03%Special Kulon progo 386.8 24 2,179 205,625 4,685 8,430 9,672 0.01%Province Jogjakarta 419.2 218 313 74,592 6,085 5,408 15,364 0.05%
Gunung Kidul 695.7 84 1,086 140,012 7,454 11,033 27,218 0.01%TOTAL 3280.2 4,715 19,381 1,352,076 109,100 123,930 174,988 0.14%Klaten 1139.2 1,045 18,127 713,788 29,988 62,979 98,552 0.09%
Central Boyolali 941.7 4 300 12,770 307 696 708 0.00%Jawa Magelang 1158.1 10 5,108 386 386 546 0.00%Province Purworejo 712.1 1 4 9,806 10 214 780 0.00%
Sukoharjo 838.3 3 67 16,302 51 1,808 2,476 0.00%Wonogiri 1010.6 0 4 2,022 17 12 74 0.00%TOTAL 32900.0 1,063 18,502 759,796 30,759 66,095 103,136 0.00%GRAND TOTA 45260.5 5,778 37,883 2,111,872 139,859 190,025 278,124 0.01%
damage: http://www.bakornaspbp.go.id/html/buletindijjateng.htmpopulation: the National Population Census in 2000, after BAPPENAS (2006),
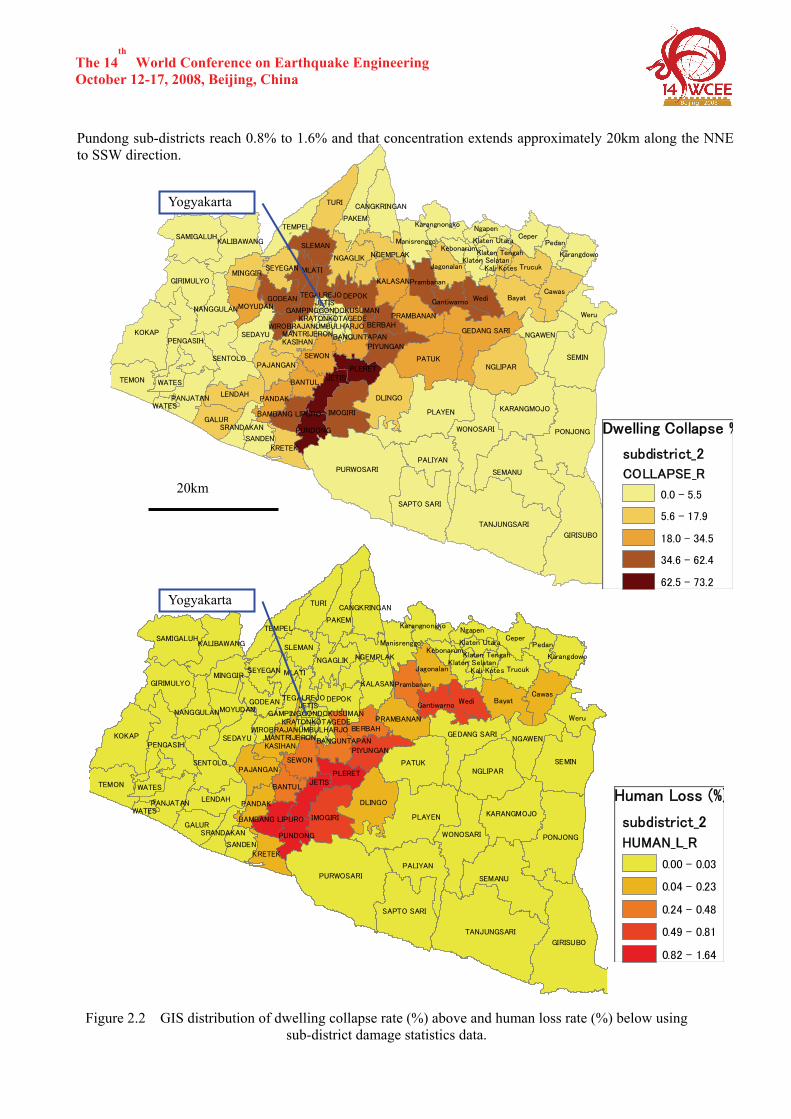
Source: Data BPS Data Dan Informasi Keminiskan (2004) Figure 2.1 shows damage distribution obtained by UNOSAT and epicenters. Figure 2.2 shows dwelling damage and fatality distribution using sub-district-wise statistics. Pleret, Jetis, and Pundong sub-districts of Bantul district are in concentrated high damage zone over 60% of collapse ratio extending from NNE to SSW for approximately 20km. Gantiwarno and Wedi sub-districts located in the southern parts of Klaten district depict 30-60% total collapse ratio, which agrees with our field observation. Damage distribution agrees well with UNOSAT (2006) early estimation on their web-site after the earthquake (Fig. 2.1). The earthquake source locations estimated using Real-time-JISNET data by Nakano et al. (2006) agree with the severe damage zone in Fig. 2.2. High damage zone extends to north to Sleman district, in the east of Jogjakarta (Yogyakarta) city. Human loss distribution in Figure 2.2 indicates similar pattern as the dwelling collapse ratio. Human loss ratio in Pleret, Jetis, and
Yogyakarta
Figure 2.1 Damage distribution obtained by UNOSAT[1] and the location of the epicenter by USGS[2] and the mechanism of the moment centroid by NIED[3] (after Kawase, et al., 2006)
The 14th
World Conference on Earthquake Engineering October 12-17, 2008, Beijing, China Pundong sub-districts reach 0.8% to 1.6% and that concentration extends approximately 20km along the NNE to SSW direction.
GIRISUBO
PURWOSARI
PLAYEN
SEMIN
TANJUNGSARI
SEMANU
PONJONG
PATUK
KOKAP
TURI
NGLIPAR
DLINGO
Bayat
Weru
PAKEM
SAPTO SARI
PALIYAN
WONOSARI
IMOGIRI
CawasWedi
NGAWEN
KARANGMOJO
TEMON
SAMIGALUH
Trucuk
GEDANG SARI
GIRIMULYO
DEPOK
Ceper
LENDAH
GALUR
SEDAYU
NGAGLIK
JETIS
SEWON
SLEMAN
KASIHAN
Pedan
GODEAN
PLERETPAJANGAN
WATES
BERBAH
Ngapen
PENGASIH
SENTOLO
MLATI
TEMPEL
KALIBAWANG
KALASAN
PANJATAN
KRETEK
MINGGIRJagonalan
NGEMPLAK
PIYUNGAN
NANGGULAN GAMPINGPRAMBANAN
PANDAK
CANGKRINGAN
SANDEN
SEYEGAN
Karangdowo
MOYUDAN
Manisrenggo
Prambanan
BANTUL
Gantiwarno
Karangnongko
PUNDONG
BANGUNTAPAN
SRANDAKAN
Kali Kotes
BAMBANG LIPURO
Klaten Selatan
KebonarumKlaten Utara
WATES
Klaten Tengah
UMBULHARJO
JETIS
KOTAGEDE
TEGALREJO
GONDOKUSUMAN
MANTRIJERON
KRATONWIROBRAJAN
20km
Dwelling Collapse %
subdistrict_2
COLLAPSE_R
0.0 - 5.5
5.6 - 17.9
18.0 - 34.5
34.6 - 62.4
62.5 - 73.2
Human Loss (%)
subdistrict_2
HUMAN_L_R
0.00 - 0.03
0.04 - 0.23
0.24 - 0.48
0.49 - 0.81
0.82 - 1.64GIRISUBO
PURWOSARI
PLAYEN
SEMIN
TANJUNGSARI
SEMANU
PONJONG
PATUK
KOKAP
TURI
NGLIPAR
DLINGO
Bayat
Weru
PAKEM
SAPTO SARI
PALIYAN
WONOSARI
IMOGIRI
CawasWedi
NGAWEN
KARANGMOJO
SAMIGALUH
TEMON
Trucuk
GEDANG SARI
GIRIMULYO
DEPOK
Ceper
LENDAH
GALUR
SEDAYU
NGAGLIK
JETIS
SEWON
SLEMAN
KASIHAN
Pedan
GODEAN
PLERETPAJANGAN
WATES
BERBAH
Ngapen
PENGASIH
SENTOLO
MLATI
TEMPEL
KALIBAWANG
KALASAN
PANJATAN
KRETEK
MINGGIRJagonalan
NGEMPLAK
PIYUNGAN
NANGGULAN GAMPINGPRAMBANAN
PANDAK
CANGKRINGAN
SANDEN
SEYEGAN
Karangdowo
MOYUDAN
Manisrenggo
Prambanan
BANTUL
Gantiwarno
Karangnongko
PUNDONG
BANGUNTAPAN
SRANDAKAN
Kali Kotes
BAMBANG LIPURO
Klaten Selatan
KebonarumKlaten Utara
WATES
Klaten Tengah
UMBULHARJO
JETIS
KOTAGEDE
TEGALREJO
GONDOKUSUMAN
MANTRIJERON
KRATONWIROBRAJAN
Figure 2.2 GIS distribution of dwelling collapse rate (%) above and human loss rate (%) below using sub-district damage statistics data.
Yogyakarta
Yogyakarta
The 14th
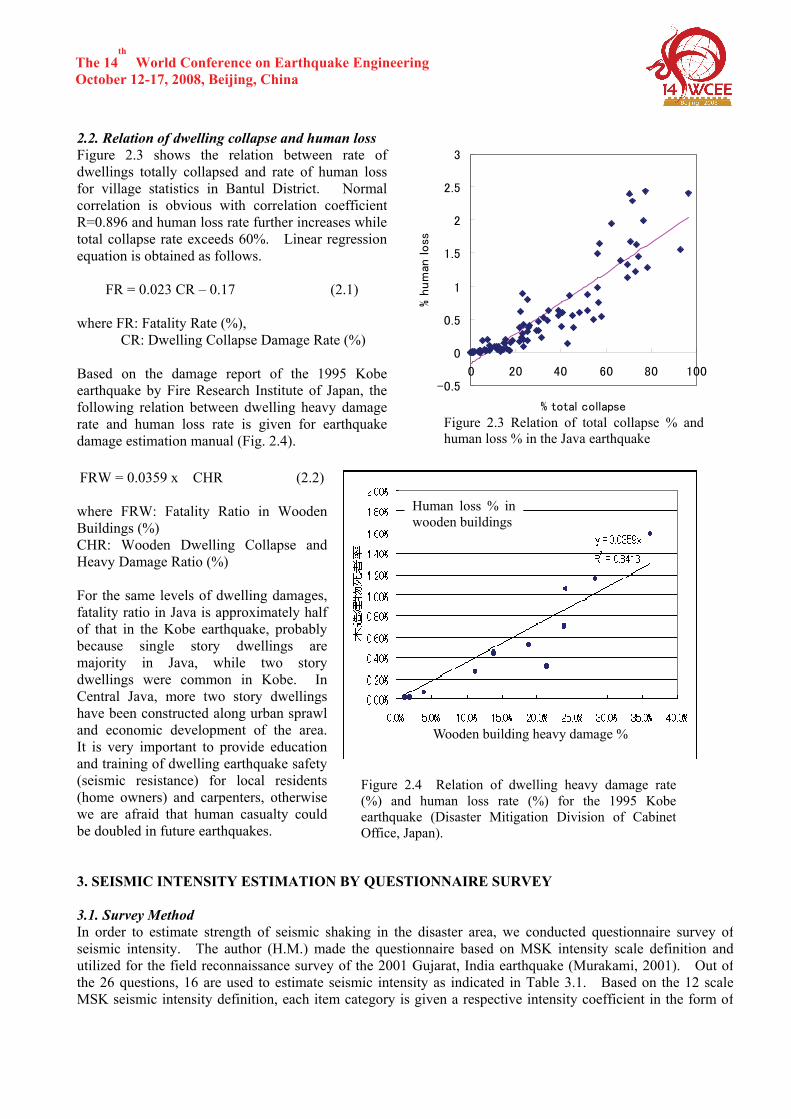
World Conference on Earthquake Engineering October 12-17, 2008, Beijing, China 2.2. Relation of dwelling collapse and human loss Figure 2.3 shows the relation between rate of dwellings totally collapsed and rate of human loss for village statistics in Bantul District. Normal correlation is obvious with correlation coefficient R=0.896 and human loss rate further increases while total collapse rate exceeds 60%. Linear regression equation is obtained as follows.
FR = 0.023 CR – 0.17 (2.1) where FR: Fatality Rate (%), CR: Dwelling Collapse Damage Rate (%) Based on the damage report of the 1995 Kobe earthquake by Fire Research Institute of Japan, the following relation between dwelling heavy damage rate and human loss rate is given for earthquake damage estimation manual (Fig. 2.4). FRW = 0.0359 x CHR (2.2) where FRW: Fatality Ratio in Wooden Buildings (%) CHR: Wooden Dwelling Collapse and Heavy Damage Ratio (%) For the same levels of dwelling damages, fatality ratio in Java is approximately half of that in the Kobe earthquake, probably because single story dwellings are majority in Java, while two story dwellings were common in Kobe. In Central Java, more two story dwellings have been constructed along urban sprawl and economic development of the area. It is very important to provide education and training of dwelling earthquake safety (seismic resistance) for local residents (home owners) and carpenters, otherwise we are afraid that human casualty could be doubled in future earthquakes. 3. SEISMIC INTENSITY ESTIMATION BY QUESTIONNAIRE SURVEY 3.1. Survey Method In order to estimate strength of seismic shaking in the disaster area, we conducted questionnaire survey ofseismic intensity. The author (H.M.) made the questionnaire based on MSK intensity scale definition andutilized for the field reconnaissance survey of the 2001 Gujarat, India earthquake (Murakami, 2001). Out of the 26 questions, 16 are used to estimate seismic intensity as indicated in Table 3.1. Based on the 12 scale MSK seismic intensity definition, each item category is given a respective intensity coefficient in the form of
-0.5
0
0.5
1
1.5
2
2.5
3
0 20 40 60 80 100
% total collapse
% h
um
an loss
Figure 2.3 Relation of total collapse % and human loss % in the Java earthquake
Figure 2.4 Relation of dwelling heavy damage rate (%) and human loss rate (%) for the 1995 Kobe earthquake (Disaster Mitigation Division of Cabinet Office, Japan).
Human loss % in wooden buildings
Wooden building heavy damage %
The 14th
World Conference on Earthquake Engineering October 12-17, 2008, Beijing, China fuzzy membership functions, corresponding to likelihood of seismic intensity.
The previous questionnaire was revised considering common dwelling types and living environment in the Central Java region and was translated to Indonesian and Javanese language. The questionnaire of 4 page long contains 26 questions, in which 6 ask location and dwelling type at the time of earthquake occurrence, 8 ask intensity of shaking by observation of people, hanging objects and furniture, 6 ask building damages, 2 ask road damage and ground failure, 2 ask entrapment and human casualty of oneself or family members, 2 ask personal attributes. In the field reconnaissance, four senior students in the Department of Architecture and Planning, Gadjah Mada University worked as interviewers for three days. The students met villagers and local people evacuating and asked questions of the seismic intensity form. Prof. Kawase made microtremor observation on the ground of elementary schools along Prelet, Imogiri, and Klaten observation lines that is EW direction and transverse to the fault line. The intensity questionnaire survey was conducted at the same locations.Altogether, 150 questionnaire responses were obtained covering 17 locations as indicated in Table 3.2.
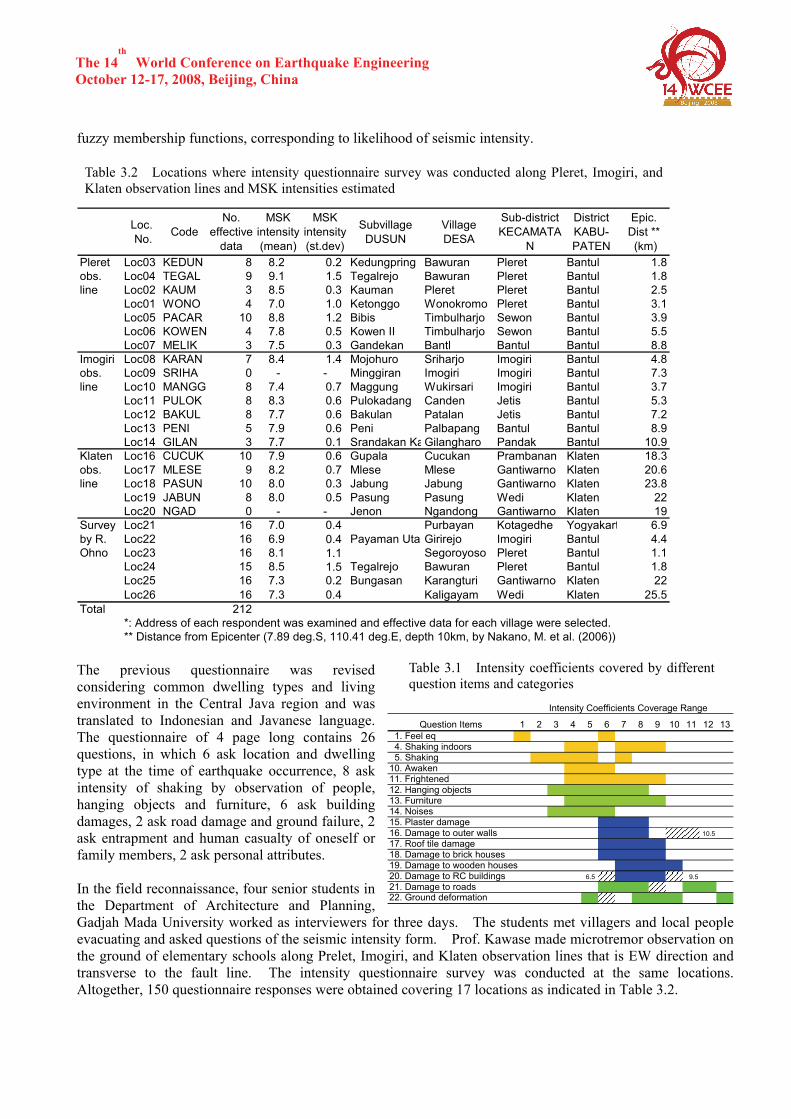
Table 3.2 Locations where intensity questionnaire survey was conducted along Pleret, Imogiri, and Klaten observation lines and MSK intensities estimated
Loc. No. Code
No.effective
data
MSKintensity(mean)
MSKintensity(st.dev)
SubvillageDUSUN
VillageDESA
Sub-districtKECAMATA
N
DistrictKABU-PATEN
Epic.Dist ** (km)
Pleret Loc03 KEDUN 8 8.2 0.2 Kedungpring Bawuran Pleret Bantul 1.8obs. Loc04 TEGAL 9 9.1 1.5 Tegalrejo Bawuran Pleret Bantul 1.8line Loc02 KAUM 3 8.5 0.3 Kauman Pleret Pleret Bantul 2.5
Loc01 WONO 4 7.0 1.0 Ketonggo Wonokromo Pleret Bantul 3.1Loc05 PACAR 10 8.8 1.2 Bibis Timbulharjo Sewon Bantul 3.9Loc06 KOWEN 4 7.8 0.5 Kowen II Timbulharjo Sewon Bantul 5.5Loc07 MELIK 3 7.5 0.3 Gandekan Bantl Bantul Bantul 8.8
Imogiri Loc08 KARAN 7 8.4 1.4 Mojohuro Sriharjo Imogiri Bantul 4.8obs. Loc09 SRIHA 0 - - Minggiran Imogiri Imogiri Bantul 7.3line Loc10 MANGG 8 7.4 0.7 Maggung Wukirsari Imogiri Bantul 3.7
Loc11 PULOK 8 8.3 0.6 Pulokadang Canden Jetis Bantul 5.3Loc12 BAKUL 8 7.7 0.6 Bakulan Patalan Jetis Bantul 7.2Loc13 PENI 5 7.9 0.6 Peni Palbapang Bantul Bantul 8.9Loc14 GILAN 3 7.7 0.1 Srandakan KaGilangharo Pandak Bantul 10.9
Klaten Loc16 CUCUK 10 7.9 0.6 Gupala Cucukan Prambanan Klaten 18.3obs. Loc17 MLESE 9 8.2 0.7 Mlese Mlese Gantiwarno Klaten 20.6line Loc18 PASUN 10 8.0 0.3 Jabung Jabung Gantiwarno Klaten 23.8
Loc19 JABUN 8 8.0 0.5 Pasung Pasung Wedi Klaten 22Loc20 NGAD 0 - - Jenon Ngandong Gantiwarno Klaten 19
Survey Loc21 16 7.0 0.4 Purbayan Kotagedhe Yogyakart 6.9by R. Loc22 16 6.9 0.4 Payaman UtarGirirejo Imogiri Bantul 4.4Ohno Loc23 16 8.1 1.1 Segoroyoso Pleret Bantul 1.1
Loc24 15 8.5 1.5 Tegalrejo Bawuran Pleret Bantul 1.8Loc25 16 7.3 0.2 Bungasan Karangturi Gantiwarno Klaten 22Loc26 16 7.3 0.4 Kaligayam Wedi Klaten 25.5
Total 212*: Address of each respondent was examined and effective data for each village were selected.** Distance from Epicenter (7.89 deg.S, 110.41 deg.E, depth 10km, by Nakano, M. et al. (2006))
Intensity Coefficients Coverage Range
Question Items 1 2 3 4 5 6 7 8 9 10 11 12 13 1. Feel eq 4. Shaking indoors 5. Shaking
10. Awaken11. Frightened12. Hanging objects13. Furniture14. Noises15. Plaster damage16. Damage to outer walls 10.517. Roof tile damage18. Damage to brick houses19. Damage to wooden houses20. Damage to RC buildings 6.5 9.521. Damage to roads22. Ground deformation
Table 3.1 Intensity coefficients covered by different question items and categories
The 14th
World Conference on Earthquake Engineering October 12-17, 2008, Beijing, China Ohno, R. et al. (2007) conducted interview survey for human response during and after the earthquake and recovery and reconstruction process of the affected people in November and December, 2006. They made seismic intensity survey using the same questionnaire. Table 3.2 includes their survey results. The effective intensity questionnaire data collected are 212 cases from 23 locations. 32. MSK Seismic Intensity Estimated Seismic intensity for each questionnaire is estimated using fuzzy set intensity coefficients and mean value for each location is obtained (Table3.2). Standard deviation is 0.7 or less for 17 locations, while it exceeds 1.0 for 6 other locations. The table indicates also epicentral distances measured using epicenter decided by Nakano et al (2006), that is, Latitude 7.89 deg S, and Longitude 110.41 deg E. For Pleret and Imogiri observation lines, estimated seismic intensities are around 8.6 and are largest at the far east village of Bawuran, which seems to be the nearest to the epicenter. The seismic intensities decrease from east to west and are 7.5 to 7.7 around Bantul city in the western most location. Seismic intensities of Gantiwarno and Wedi in Klaten district are around 7.9 to 8.2, where dwelling damages were severe. MSK intensity vs. epicentral distance is plotted in Fig. 3.1. Intensities attenuate from the epicenter to 10km distance, though they are largely scattered, probably due to the effects of source and local soil conditions. Villages at around 20km epicentral distance are located in Klaten district and they show high intensities. 3.3. Building types and seismic vulnerability Structural types of buildings one was located at the time of the earthquake, that is, mostly dwellings (Q6) are brick masonry (21%), half timber and masonry (37%), wood (15%), and RC frame (27%). It seems that not many respondents actually live in traditional typeof timber frame dwellings. As for the number of stories, 97% answered single story, while 3% answered two stories. Locations at the time of earthquake occurrence are inside (71%), outside (28%), and in a vehicle(1%). Those who were awake before the earthquake occurrence are 66%. Movement of furniture in rooms indicates that most fell (39%), many moved and some fell (24%). Wall damages of a building one was locatedsuggest severe damage levels as a single wall collapsed (19%), and two or more walls collapsed (41%). Figure 3.2 shows comparison of the damage levels of different types of dwellings or buildings in theneibourhood (Q18, Q19, and Q20). Damage categories in Fig. 3.1 may correspond to official damage statistics as follows; 2. little damage corresponds to slightly or moderately damaged, 3. large cracks of walls and 4. some collapsed correspond to heavily damaged, and 5. many collapsed corresponds to completelydestroyed. It clearly indicates that brick masonry suffered heaviest level of damage with most collapsed,followed by RC dwellings and by wooden dwellings. In case of wooden dwellings, responses of large cracks
6.0
6.5
7.0
7.5
8.0
8.5
9.0
9.5
0 10 20 30
Epicentral Distance, km
MSK Inte
nsity
Figure 3.1 MSK intensity vs. epicentral distance.
0%
20%
40%
60%
80%
100%
brick houses RC buildings wooden
houses
1 no damage 2 little damage
3 large cracks of walls 4 some collapsed
5 many collapsed
Figure 3.2 Comparison of damage levels of dwellings in your neighborhood among brick houses (Q18), wooden houses (Q19), and RC buildings
The 14th
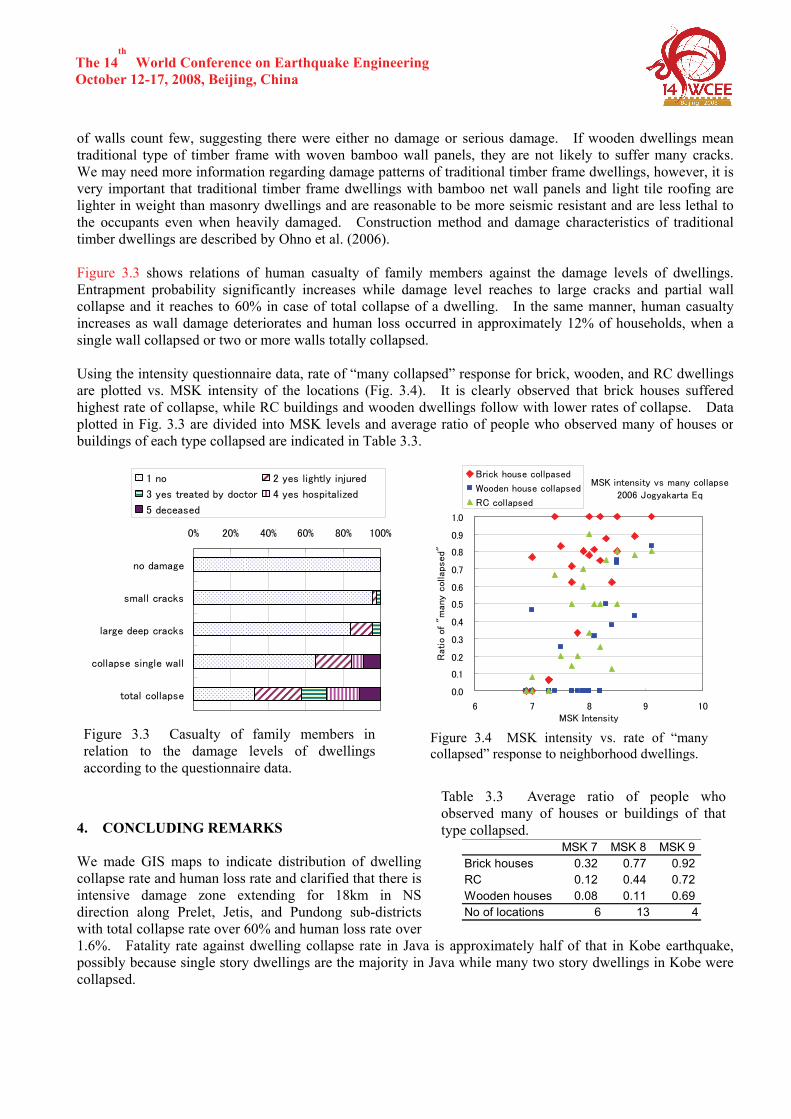
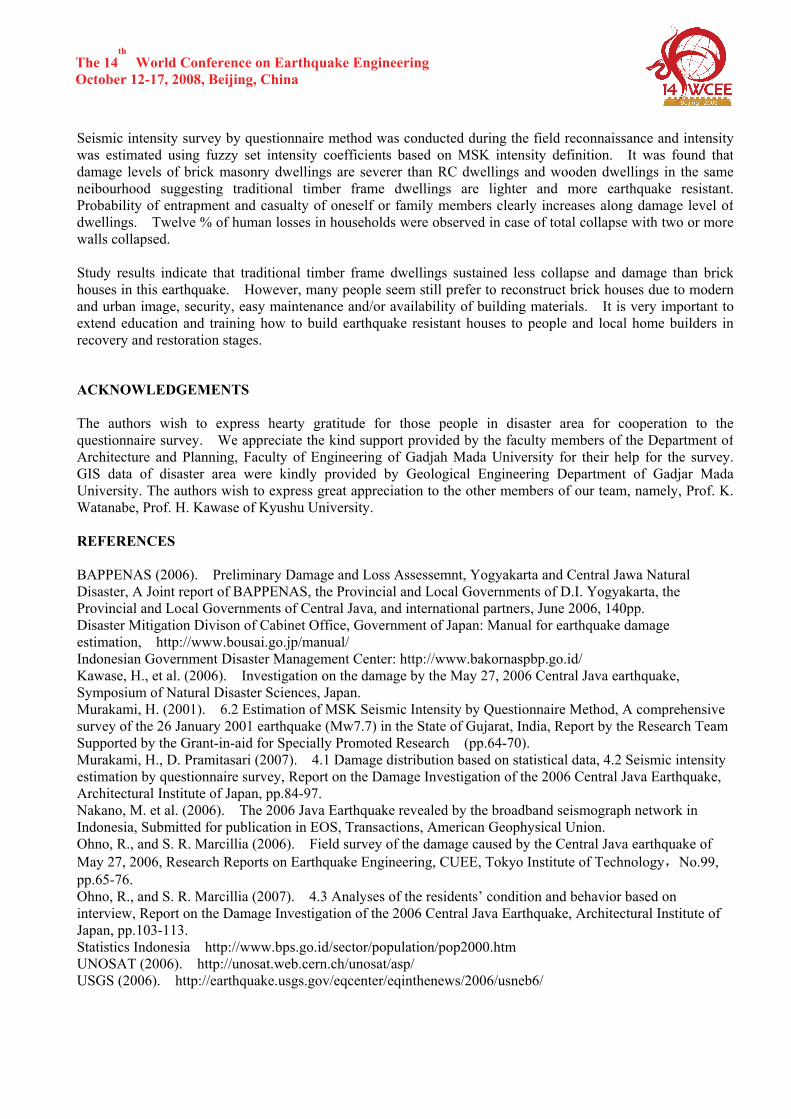
World Conference on Earthquake Engineering October 12-17, 2008, Beijing, China of walls count few, suggesting there were either no damage or serious damage. If wooden dwellings meantraditional type of timber frame with woven bamboo wall panels, they are not likely to suffer many cracks. We may need more information regarding damage patterns of traditional timber frame dwellings, however, it isvery important that traditional timber frame dwellings with bamboo net wall panels and light tile roofing arelighter in weight than masonry dwellings and are reasonable to be more seismic resistant and are less lethal tothe occupants even when heavily damaged. Construction method and damage characteristics of traditionaltimber dwellings are described by Ohno et al. (2006). Figure 3.3 shows relations of human casualty of family members against the damage levels of dwellings. Entrapment probability significantly increases while damage level reaches to large cracks and partial wallcollapse and it reaches to 60% in case of total collapse of a dwelling. In the same manner, human casualtyincreases as wall damage deteriorates and human loss occurred in approximately 12% of households, when asingle wall collapsed or two or more walls totally collapsed. Using the intensity questionnaire data, rate of “many collapsed” response for brick, wooden, and RC dwellingsare plotted vs. MSK intensity of the locations (Fig. 3.4). It is clearly observed that brick houses suffered highest rate of collapse, while RC buildings and wooden dwellings follow with lower rates of collapse. Data plotted in Fig. 3.3 are divided into MSK levels and average ratio of people who observed many of houses orbuildings of each type collapsed are indicated in Table 3.3. 4. CONCLUDING REMARKS We made GIS maps to indicate distribution of dwelling collapse rate and human loss rate and clarified that there is intensive damage zone extending for 18km in NS direction along Prelet, Jetis, and Pundong sub-districts with total collapse rate over 60% and human loss rate over 1.6%. Fatality rate against dwelling collapse rate in Java is approximately half of that in Kobe earthquake,possibly because single story dwellings are the majority in Java while many two story dwellings in Kobe were collapsed.
0% 20% 40% 60% 80% 100%
no damage
small cracks
large deep cracks
collapse single wall
total collapse
1 no 2 yes lightly injured
3 yes treated by doctor 4 yes hospitalized
5 deceased
Figure 3.3 Casualty of family members in relation to the damage levels of dwellings according to the questionnaire data.
MSK intensity vs many collapse
2006 Jogyakarta Eq
0.0
0.1
0.2
0.3
0.4
0.5
0.6
0.7
0.8
0.9
1.0
6 7 8 9 10MSK Intensity
Rat
io o
f "m
any
colla
psed"
Brick house collpased
Wooden house collapsed
RC collapsed
Figure 3.4 MSK intensity vs. rate of “many collapsed” response to neighborhood dwellings.
MSK 7 MSK 8 MSK 9Brick houses 0.32 0.77 0.92RC 0.12 0.44 0.72Wooden houses 0.08 0.11 0.69No of locations 6 13 4
Table 3.3 Average ratio of people who observed many of houses or buildings of that type collapsed.
The 14th
World Conference on Earthquake Engineering October 12-17, 2008, Beijing, China Seismic intensity survey by questionnaire method was conducted during the field reconnaissance and intensitywas estimated using fuzzy set intensity coefficients based on MSK intensity definition. It was found thatdamage levels of brick masonry dwellings are severer than RC dwellings and wooden dwellings in the same neibourhood suggesting traditional timber frame dwellings are lighter and more earthquake resistant.Probability of entrapment and casualty of oneself or family members clearly increases along damage level ofdwellings. Twelve % of human losses in households were observed in case of total collapse with two or morewalls collapsed. Study results indicate that traditional timber frame dwellings sustained less collapse and damage than brick houses in this earthquake. However, many people seem still prefer to reconstruct brick houses due to modernand urban image, security, easy maintenance and/or availability of building materials. It is very important to extend education and training how to build earthquake resistant houses to people and local home builders in recovery and restoration stages.
ACKNOWLEDGEMENTS The authors wish to express hearty gratitude for those people in disaster area for cooperation to the questionnaire survey. We appreciate the kind support provided by the faculty members of the Department ofArchitecture and Planning, Faculty of Engineering of Gadjah Mada University for their help for the survey.GIS data of disaster area were kindly provided by Geological Engineering Department of Gadjar MadaUniversity. The authors wish to express great appreciation to the other members of our team, namely, Prof. K.Watanabe, Prof. H. Kawase of Kyushu University. REFERENCES BAPPENAS (2006). Preliminary Damage and Loss Assessemnt, Yogyakarta and Central Jawa Natural Disaster, A Joint report of BAPPENAS, the Provincial and Local Governments of D.I. Yogyakarta, the Provincial and Local Governments of Central Java, and international partners, June 2006, 140pp. Disaster Mitigation Divison of Cabinet Office, Government of Japan: Manual for earthquake damage estimation, http://www.bousai.go.jp/manual/ Indonesian Government Disaster Management Center: http://www.bakornaspbp.go.id/ Kawase, H., et al. (2006). Investigation on the damage by the May 27, 2006 Central Java earthquake, Symposium of Natural Disaster Sciences, Japan. Murakami, H. (2001). 6.2 Estimation of MSK Seismic Intensity by Questionnaire Method, A comprehensive survey of the 26 January 2001 earthquake (Mw7.7) in the State of Gujarat, India, Report by the Research Team Supported by the Grant-in-aid for Specially Promoted Research (pp.64-70). Murakami, H., D. Pramitasari (2007). 4.1 Damage distribution based on statistical data, 4.2 Seismic intensity estimation by questionnaire survey, Report on the Damage Investigation of the 2006 Central Java Earthquake, Architectural Institute of Japan, pp.84-97. Nakano, M. et al. (2006). The 2006 Java Earthquake revealed by the broadband seismograph network in Indonesia, Submitted for publication in EOS, Transactions, American Geophysical Union. Ohno, R., and S. R. Marcillia (2006). Field survey of the damage caused by the Central Java earthquake of May 27, 2006, Research Reports on Earthquake Engineering, CUEE, Tokyo Institute of Technology,No.99, pp.65-76. Ohno, R., and S. R. Marcillia (2007). 4.3 Analyses of the residents’ condition and behavior based on interview, Report on the Damage Investigation of the 2006 Central Java Earthquake, Architectural Institute of Japan, pp.103-113. Statistics Indonesia http://www.bps.go.id/sector/population/pop2000.htm UNOSAT (2006). http://unosat.web.cern.ch/unosat/asp/ USGS (2006). http://earthquake.usgs.gov/eqcenter/eqinthenews/2006/usneb6/