Human Capital Disclosure Statement - HCMI
29
Free Information Toolkit Human Capital Disclosure Statement - HCMI Create a Transparent Human Capital Report For More Information about HCMI’s Products and Services, Visit Our Website: www.hcminst.com Email: [email protected] | Phone: +1 (323) 522-HCMI 4264 By Jeff Higgins Significant contributions made by Grant Cooperstein, Andrew Jacobus, Moun Peterson, Harish Reddy Sidda, Anh Tuan Tran and Stephen Weltz
Transcript of Human Capital Disclosure Statement - HCMI

Free Information Toolkit Human Capital Disclosure Statement - HCMI
Create a Transparent Human Capital Report
For More Information about HCMI’s Products and Services, Visit Our Website: www.hcminst.com
Email: [email protected] | Phone: +1 (323) 522-HCMI 4264
By Jeff Higgins
Significant contributions made by Grant Cooperstein, Andrew Jacobus, Moun Peterson,
Harish Reddy Sidda, Anh Tuan Tran and Stephen Weltz

Human Capital Management Institute 1
Table of Contents
I. The Human Capital Disclosure Statement ............................................................................ 1
II. The Disclosure Statement Template Sample ...................................................................... 4
III. The Statement Interpretation & Use ....................................................................................... 6
IV. Literature Review Matrix ......................................................................................................... 14
V. References ....................................................................................................................................... 15
VI. Appendix .......................................................................................................................................... 16
Part 1: Metric Definitions and Descriptions ......................................................................... 16
Part 2: Workforce by Job Category Definitions and Descriptions ............................... 24
Part 3: Frequently Asked Questions ........................................................................................ 26
Copyright 2012 Human Capital Management Institute
All rights reserved
No part of this publication may be reproduced, stored in or introduced into a retrieval system, or transmitted, in any form, or by any means (electronic, mechanical, photo-copying, recording, or otherwise), without the prior written permission of the publisher. Requests for permission should be directed to [email protected]. Confidentiality
This document contains confidential and proprietary information owned under trademark and copyright laws to the Human Capital Management Institute. Any unauthorized use or reproduction of this work is expressly prohibited. Contact Human Capital Management Institute at [email protected] for more information and specific questions regarding metrics measurement, as well as other materials and concepts included in this work.

Human Capital Management Institute 2
I. The Human Capital Disclosure Statement
Introduction
What if human capital could be valued and its contribution quantified in the form of productivity or return? What if the return on human capital could be definitively linked to business results? Now it can. There is near universal clarity and agreement that human capital has an impact on organizational success. On this broad strategic point the investment community, Boards of Directors, CEOs, CFOs, management, governments, Human Resources and workers themselves agree. There is also significant evidence supported by research showing the significance (i.e. materiality) of human capital upon financial performance. The research is echoed by CEOs of leading global organizations who often say people are their most valuable assets and source of competitive advantage. All agreement ends however, when questions of how to properly reflect the importance of human capital, typically in terms of reporting and disclosure, come up. In an environment of increasing concern by policy makers, investors, and other stakeholders on how organizations are managed from a governance and sustainability perspective, one of the most obvious gaps emerges around workforce reporting and disclosure, talent and leadership, collectively known as human capital. Yet shockingly today, on a global basis, very little human capital information is disclosed in public reporting by listed or private companies. This gap in reporting makes it impossible for investors and other groups to fairly assess true workforce productivity and the effectiveness of management with human capital.
Why Disclosure on Human Capital Matters
Reasons why human capital drives organizational success and failure are many but a few of the most critical include:
Companies need smart, effective employees to compete, so understanding and quantifying human capital is critical for success and future growth internally within the organization.
A lack of disclosure obscures talent management effectiveness and material human capital risks to investors. With no visibility into the efficient utilization of a typical firm’s single largest expense, investors must rely on historical financial performance and management’s qualitative discussion to voluntarily disclose information. Organizations must provide metrics to justify any statements regarding the quality, training, succession, career growth, effectiveness, engagement, retention, benefits, productivity and more on human capital.
Organizations have a fiduciary duty to communicate existing and potential future risks deemed material to their business. Human Capital clearly is clearly material to virtually any organization’s current and future success, therefore a fiduciary responsibility exists to provide a greater information to shareholders, creditors and others.
Regulatory securities commissions, require extensive disclosure of all major assets including financial assets, physical assets, and technological assets such as patents. However, there is minimal disclosure of human capital which is, for most organizations, is their largest annual operating expense.
What gets measured gets managed. For most organizations, human capital is not well measured except as a cost. Does that mean it is relatively unmanaged except as a cost?
“The people who constitute a company’s workforce are in many cases a firm’s most valuable asset - indeed this view is ascribed to regularly by many companies.
However, all too commonly they are viewed and reported as a cost.”
The National Association of Pension Funds UK Limited© (NAPF) Discussion Paper, June 2015
Human Capital Management Institute 3
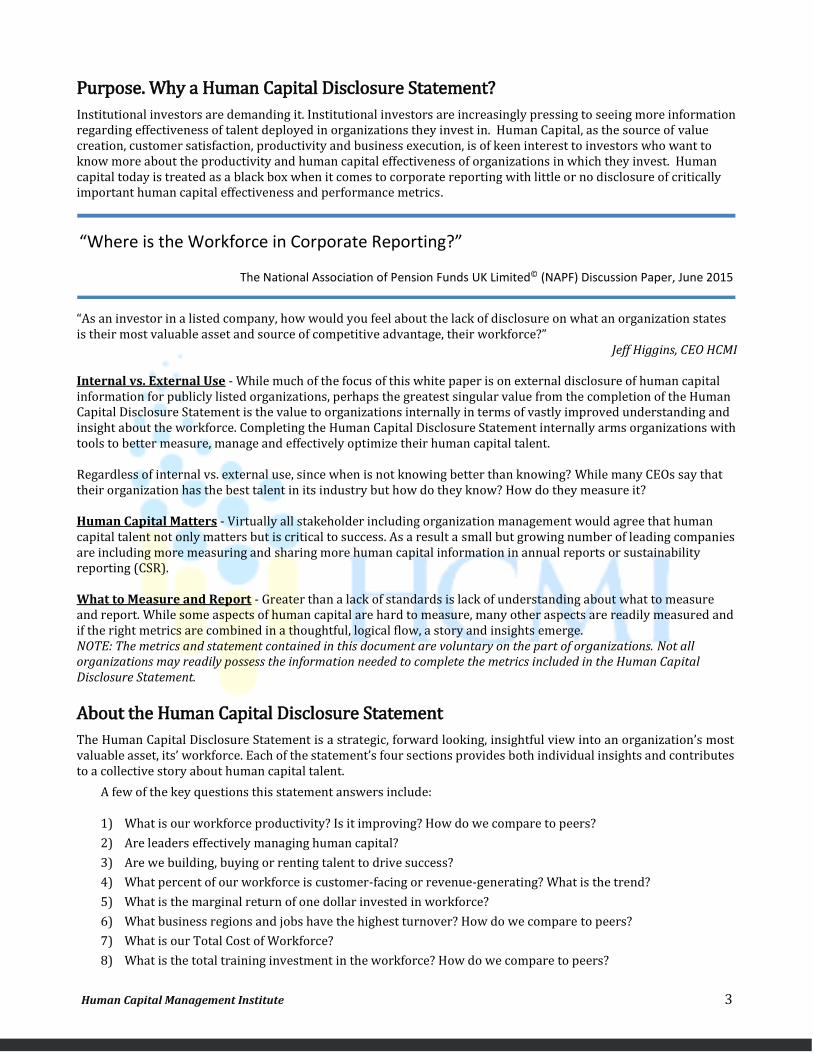
Purpose. Why a Human Capital Disclosure Statement?
Institutional investors are demanding it. Institutional investors are increasingly pressing to seeing more information regarding effectiveness of talent deployed in organizations they invest in. Human Capital, as the source of value creation, customer satisfaction, productivity and business execution, is of keen interest to investors who want to know more about the productivity and human capital effectiveness of organizations in which they invest. Human capital today is treated as a black box when it comes to corporate reporting with little or no disclosure of critically important human capital effectiveness and performance metrics.
“As an investor in a listed company, how would you feel about the lack of disclosure on what an organization states is their most valuable asset and source of competitive advantage, their workforce?”
Jeff Higgins, CEO HCMI Internal vs. External Use - While much of the focus of this white paper is on external disclosure of human capital information for publicly listed organizations, perhaps the greatest singular value from the completion of the Human Capital Disclosure Statement is the value to organizations internally in terms of vastly improved understanding and insight about the workforce. Completing the Human Capital Disclosure Statement internally arms organizations with tools to better measure, manage and effectively optimize their human capital talent. Regardless of internal vs. external use, since when is not knowing better than knowing? While many CEOs say that their organization has the best talent in its industry but how do they know? How do they measure it? Human Capital Matters - Virtually all stakeholder including organization management would agree that human capital talent not only matters but is critical to success. As a result a small but growing number of leading companies are including more measuring and sharing more human capital information in annual reports or sustainability reporting (CSR). What to Measure and Report - Greater than a lack of standards is lack of understanding about what to measure and report. While some aspects of human capital are hard to measure, many other aspects are readily measured and if the right metrics are combined in a thoughtful, logical flow, a story and insights emerge. NOTE: The metrics and statement contained in this document are voluntary on the part of organizations. Not all organizations may readily possess the information needed to complete the metrics included in the Human Capital Disclosure Statement.
About the Human Capital Disclosure Statement
The Human Capital Disclosure Statement is a strategic, forward looking, insightful view into an organization’s most valuable asset, its’ workforce. Each of the statement’s four sections provides both individual insights and contributes to a collective story about human capital talent.
A few of the key questions this statement answers include:
1) What is our workforce productivity? Is it improving? How do we compare to peers?
2) Are leaders effectively managing human capital?
3) Are we building, buying or renting talent to drive success?
4) What percent of our workforce is customer-facing or revenue-generating? What is the trend?
5) What is the marginal return of one dollar invested in workforce?
6) What business regions and jobs have the highest turnover? How do we compare to peers?
7) What is our Total Cost of Workforce?
8) What is the total training investment in the workforce? How do we compare to peers?
“Where is the Workforce in Corporate Reporting?”
The National Association of Pension Funds UK Limited© (NAPF) Discussion Paper, June 2015

Human Capital Management Institute 4
II. The Disclosure Statement Template Sample
The Human Capital Disclosure Statement is a strategic, forward looking, insightful view into an organization’s most valuable asset, its’ workforce. The statement contains four sections: (1) Human Capital Impact for return on human capital and workforce productivity changes; (2) Human Capital Flow showing employee and contingent workforce changes; (3) Human Capital Cost showing a total cost of workforce (TCOW) and HR cost breakdown; (4) Management Discussion of material changes in talent performance metrics and strategic direction.
A) HUMAN CAPITAL IMPACT
This section quantifies workforce productivity and return on human capital from a financial impact standpoint. The return on human capital metrics show the rate of return to the organization of $1 invested in the workforce.
*See appendix metric definitions for Total Operating Expenses
B) HUMAN CAPITAL FLOW
The Human Capital Flow details workforce changes by job category and geography over a specified period (typically 1 year) in hiring,
terminations, internal mobility (e.g. succession), and other metrics.
Key Productivity Metrics
1. Total Headcount FTE = Total employees + contingent staff on a full time equivalent (FTE) basis.
2. Revenue and Profit per FTE = Total net revenue or operating profit, divided by Total Headcount FTE
3. Total Cost of Workforce (TCOW) = Total labor cost for employees and contingent workers (see appendix for definition)
4. Human Capital ROI Ratio = Revenue linked productivity as the human capital return ratio per dollar invested in the workforce (see appendix for definition)
5. Return on Human Capital Investment = Profit linked productivity as the return on human capital cost (TCOW) as a percent of Net Operating Profit
Additional Current Year Metrics
Annual Work Hours:-
North America = 2,080__ Europe = 1,872__
Asia Pacific = 2,080__
Average Absence Rate:-- North America = 11%__
Europe = 18%__ Asia Pacific = 14%__
Percent
Part-time % Chg
Employees 15.0% 2.6%
Contingent Staff 60.0% 1.0%
Total 20.1% 2.4%
Engagement
Score % Chg
Employees 56.5% 1.0%
Management 73.0% 5.0%
Overall Average 58.0% 1.0%
Prior Year Current Year % Chg
Revenue
Net Operating Revenue 1,400,000,000$ 1,540,000,000$ 10.0%
Total Headcount (FTE) 15,000 16,400 9.3%
Revenue per FTE 93,333$ 93,902$ 0.6%
Costs
Total Operating Expenses* 1,170,000,000$ 1,285,000,000$ 9.8%
Total Cost of Workforce (TCOW) 779,950,000$ 861,000,000$ 10.4%
TCOW per FTE 51,997$ 52,500$ 1.0%
TCOW % of Revenue 55.7% 55.9% 0.4%
Profit
Net Operating Profit 143,750,000$ 159,375,000$ 10.9%
Profit per FTE 9,583$ 9,718$ 1.4%
Workforce Productivity
Hunan Capital ROI Ratio 1.29 1.30 0.1%
Return on Human Capital Investment 18.4% 18.5% 0.4%
Human Capital ROI per FTE 15,333$ 15,549$ %1.4%
Prior Year
Headcount New Hires % Chg Terms % Chg
Internal
Mobility % Chg
Current Year
Headcount % Chg
Workforce by Job Category
Total FTE* Employees 13,300 2,500 18.8% (1,400) (10.5%) 150 1.1% 14,550 9.4%
Management, Senior Leadership 1,250 115 (90) 75 1,350
Scientific, Technical Staff (STEM) 550 120 (60) (10) 600
Sales Staff 3,000 860 (450) (10) 3,400
Professional Staff 2,000 290 (130) 40 2,200
Operations Staff 1,450 225 (110) 85 1,650
Service Staff 2,750 640 (465) (25) 2,900
Other Support Staff 900 105 (50) 45 1,000
Administrative Staff 1,400 145 (45) (50) 1,450
FTE Contingent Staff 1,700 850 50.0% (550) (32.4%) (150) (8.8%) 1,850 8.8%
Contractor 600 300 (110) (60) 730
Temporary 1,100 550 (440) (90) 1,120
Total FTE Workforce 15,000$ 3,350 22.3% (1,950) (13.0%) 0 0.0% 16,400 9.3%
Workforce by Geography
North America 12,500 2,550 (1,590) (60) 13,400 7.2%
Europe 1,500 180 (90) 10 1,600 6.7%
Asia Pacific 1,000 620 (270) 50 1,400 40.0%

Human Capital Management Institute 5
C) HUMAN CAPITAL COST
The Human Capital Cost highlights the total cost of human capital by major accounting cost element for all employees and contingent workers as well as total HR costs, at a specified date and shown on a full year actual or annualized basis.
D) MANAGEMENT DISCUSSION
Workforce Growth, Productivity, Labor Hour Worked and Cost
The Scofield Financial workforce grew by 9.3% from prior year driven by continued steady growth in North America and by aggressive expansion into Asian markets particularly Hong Kong, Singapore and China.
Scofield workforce productivity grew slightly to $1.30 from $1.29 year over year for in Human Capital ROI Ratio and 18.5% from 18.4% for Return on Human Capital Investment, creating approximately $1,000,000 in workforce productivity impact. Strong workforce cost controls coupled with improvements in talent selection, retention and technical as well as service focused training are starting to increase workforce productivity. We forecast 3.0% to 5.0% annual in productivity gains over the next five years.
Core vs. Non-Core, Critical vs Non-Critical Job Roles and their Impact
Scofield’s talent strategy of rewarding business execution and outstanding customer service via pay for performance as well as rapid career growth, is starting to yield measurable results in terms of reduced turnover rates (declining 2%) and an increasing number of internally filled management positions, (75 of 180, 42% of positions) via succession and performance promotions.
Key to Scofield’s strategy of in talent selecting top quality external talent cost effectively, with the right competencies and potential to grow and succeed in our performance culture supported by Scofield’s training academy (see below).
Training and Other Talent Investment
Scofield’s highly regarded leadership development training, customer service excellence training and process improvement programs and employee education reimbursements will enable Scofield to increasing fill its most critical and core positions internally, particularly in management and leadership roles.
Significant Talent Risks
See Management discussion of risks in the Scofield Annual Report.
Significant Workforce Changes
Growth in Asia and Europe is continuing, and the international relocation program for high potential retail, commercial and operations management is on-going, relocating 60 managers from North America to Asia (50) and Europe (10). As growth continues, particularly in Asia, top talent will be increasingly mobile, operating as shared service best practice centers of expertise in operations, customer service and core banking and investment operations.
Additional Current Year Metrics
Avg. Employee Salary:-- $32,000 USD--
Avg. Actual Incentive Paid:-- $4,600 USD--
Avg. Benefits Cost per FTE:-- $10,320 USD-- Benefits Cost = 32.2% of Salary--
Avg. Contingent Worker Cost per FTE-- $24,500 USD--
Avg. Training Cost per FTE:-- $1,900 USD--
Avg. Training Hours per FTE:-- 88 Hours or 11 days--
Avg. Recruiting Cost per Hire:-- $3,600 USD--
Prior Year Current Year % Chg
Workforce Costs
Employee Salary Cost 465,710,000$ 510,940,000$ 9.7%
Bonus and Incentives Cost 70,000,000$ 75,140,000$ 7.3%
Benefits Cost 146,000,000$ 164,230,000$ 12.5%
Absence (Lost Days) Cost 4,000,000$ 5,000,000$ 25.0%
Contingent Workforce Cost 45,290,000$ 51,690,000$ 14.1%
Other Compensation -$ -$ 0.0%
Total Workforce Cost 731,000,000$ 807,000,000$ 10.4%
HR Costs
Training & Development Cost 27,800,000$ 31,250,000$ 12.4%
Recruiting & Onboarding Cost 8,000,000$ 9,000,000$ 12.5%
Labor Relations, Talent Management 5,000,000$ 5,100,000$ 2.0%
HR Administration Cost (e.g. payroll) 7,150,000$ 7,650,000$ 7.0%
Total HR Expenses 47,950,000$ 53,000,000$ 10.5%
HR Cost % of Total Workforce Cost 6.6% 6.6% 1.0%
Other Workforce Costs 1,000,000$ 1,000,000$ 0.0%
Total Cost of Workforce 779,950,000$ 861,000,000$ 10.4%
Human Capital Management Institute 6
III. The Statement Interpretation & Use
Each section of the Disclosure Statement, like traditional financial statements, has a specific form, flow and function, telling a story about human capital that links to business and operational results. More importantly, this form includes a significant number of metrics enabling organizations and investors alike to gain tremendous insight into an organization’s productivity, effectiveness and sustainability in managing human capital. The following are some of the insights that can be achieved with the Human Capital Disclosure Statement:
1. Workforce productivity quantified, trended and linked to financial performance
2. Human Capital ROI metrics integrated with commonly accepted financial metrics
3. Total Cost of Workforce showing effectiveness controlling workforce cost
4. Insight into organizational talent strategy such as how much talent is being built versus hired outside
5. Clarity on use of contingent workers such as changes in size and cost contingent workforce
6. Workforce flow changes by period including staff additions, terminations and internal moves by job category
7. Benchmark comparison and insight into management’s and HR’s effectiveness in managing the workforce
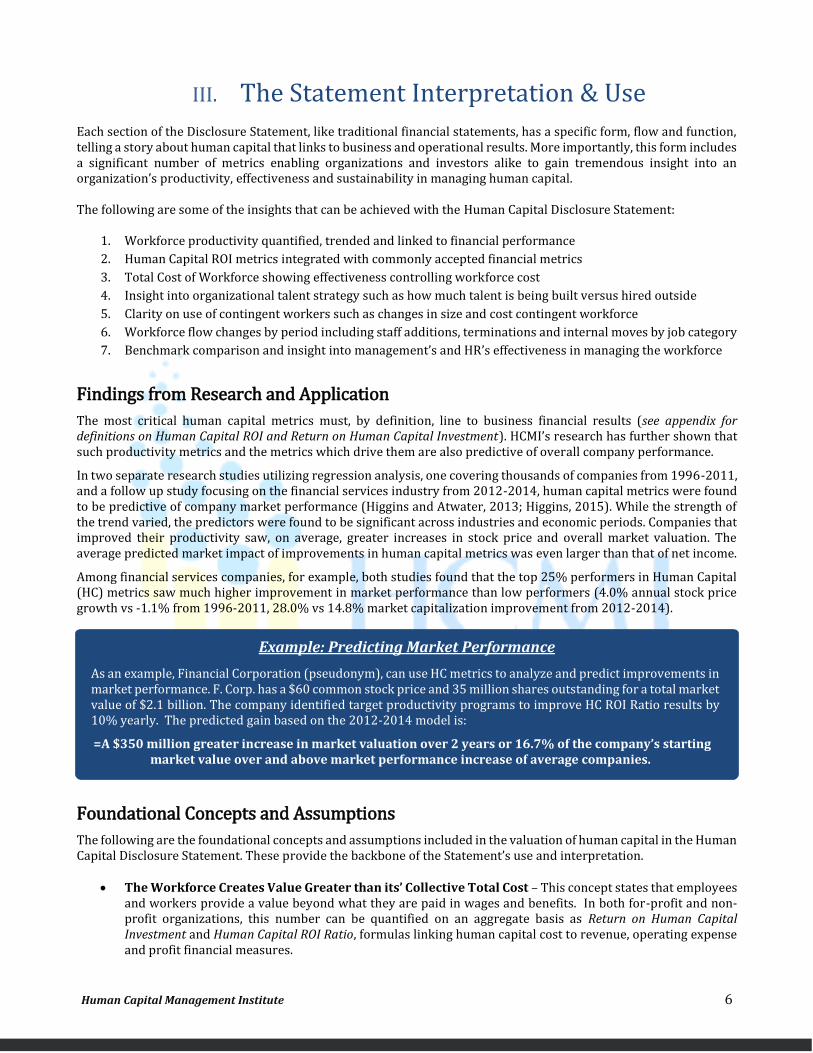
Findings from Research and Application
The most critical human capital metrics must, by definition, line to business financial results (see appendix for definitions on Human Capital ROI and Return on Human Capital Investment). HCMI’s research has further shown that such productivity metrics and the metrics which drive them are also predictive of overall company performance.
In two separate research studies utilizing regression analysis, one covering thousands of companies from 1996-2011, and a follow up study focusing on the financial services industry from 2012-2014, human capital metrics were found to be predictive of company market performance (Higgins and Atwater, 2013; Higgins, 2015). While the strength of the trend varied, the predictors were found to be significant across industries and economic periods. Companies that improved their productivity saw, on average, greater increases in stock price and overall market valuation. The average predicted market impact of improvements in human capital metrics was even larger than that of net income.
Among financial services companies, for example, both studies found that the top 25% performers in Human Capital (HC) metrics saw much higher improvement in market performance than low performers (4.0% annual stock price growth vs -1.1% from 1996-2011, 28.0% vs 14.8% market capitalization improvement from 2012-2014).
Foundational Concepts and Assumptions
The following are the foundational concepts and assumptions included in the valuation of human capital in the Human Capital Disclosure Statement. These provide the backbone of the Statement’s use and interpretation.
The Workforce Creates Value Greater than its’ Collective Total Cost – This concept states that employees and workers provide a value beyond what they are paid in wages and benefits. In both for-profit and non-profit organizations, this number can be quantified on an aggregate basis as Return on Human Capital Investment and Human Capital ROI Ratio, formulas linking human capital cost to revenue, operating expense and profit financial measures.
Example: Predicting Market Performance
As an example, Financial Corporation (pseudonym), can use HC metrics to analyze and predict improvements in market performance. F. Corp. has a $60 common stock price and 35 million shares outstanding for a total market value of $2.1 billion. The company identified target productivity programs to improve HC ROI Ratio results by 10% yearly. The predicted gain based on the 2012-2014 model is:
=A $350 million greater increase in market valuation over 2 years or 16.7% of the company’s starting market value over and above market performance increase of average companies.
Human Capital Management Institute 7
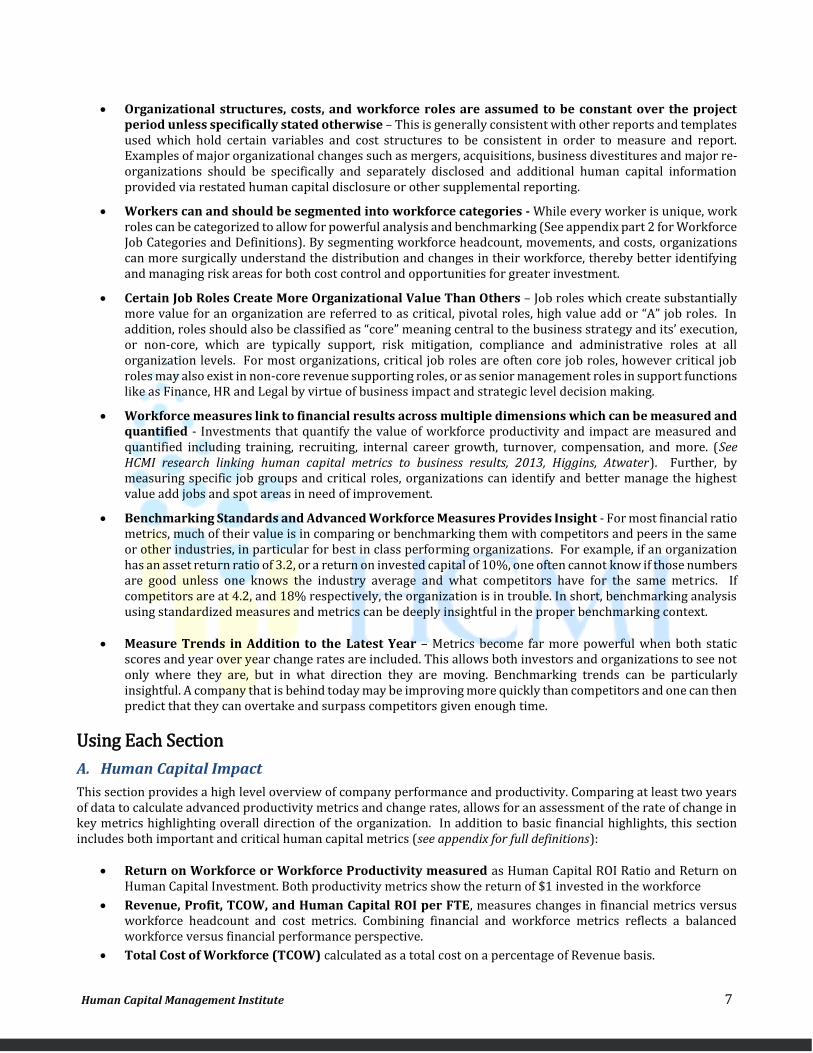
Organizational structures, costs, and workforce roles are assumed to be constant over the project period unless specifically stated otherwise – This is generally consistent with other reports and templates used which hold certain variables and cost structures to be consistent in order to measure and report. Examples of major organizational changes such as mergers, acquisitions, business divestitures and major re-organizations should be specifically and separately disclosed and additional human capital information provided via restated human capital disclosure or other supplemental reporting.
Workers can and should be segmented into workforce categories - While every worker is unique, work roles can be categorized to allow for powerful analysis and benchmarking (See appendix part 2 for Workforce Job Categories and Definitions). By segmenting workforce headcount, movements, and costs, organizations can more surgically understand the distribution and changes in their workforce, thereby better identifying and managing risk areas for both cost control and opportunities for greater investment.
Certain Job Roles Create More Organizational Value Than Others – Job roles which create substantially more value for an organization are referred to as critical, pivotal roles, high value add or “A” job roles. In addition, roles should also be classified as “core” meaning central to the business strategy and its’ execution, or non-core, which are typically support, risk mitigation, compliance and administrative roles at all organization levels. For most organizations, critical job roles are often core job roles, however critical job roles may also exist in non-core revenue supporting roles, or as senior management roles in support functions like as Finance, HR and Legal by virtue of business impact and strategic level decision making.
Workforce measures link to financial results across multiple dimensions which can be measured and quantified - Investments that quantify the value of workforce productivity and impact are measured and quantified including training, recruiting, internal career growth, turnover, compensation, and more. (See HCMI research linking human capital metrics to business results, 2013, Higgins, Atwater). Further, by measuring specific job groups and critical roles, organizations can identify and better manage the highest value add jobs and spot areas in need of improvement.
Benchmarking Standards and Advanced Workforce Measures Provides Insight - For most financial ratio metrics, much of their value is in comparing or benchmarking them with competitors and peers in the same or other industries, in particular for best in class performing organizations. For example, if an organization has an asset return ratio of 3.2, or a return on invested capital of 10%, one often cannot know if those numbers are good unless one knows the industry average and what competitors have for the same metrics. If competitors are at 4.2, and 18% respectively, the organization is in trouble. In short, benchmarking analysis using standardized measures and metrics can be deeply insightful in the proper benchmarking context.
Measure Trends in Addition to the Latest Year – Metrics become far more powerful when both static scores and year over year change rates are included. This allows both investors and organizations to see not only where they are, but in what direction they are moving. Benchmarking trends can be particularly insightful. A company that is behind today may be improving more quickly than competitors and one can then predict that they can overtake and surpass competitors given enough time.
Using Each Section
A. Human Capital Impact
This section provides a high level overview of company performance and productivity. Comparing at least two years of data to calculate advanced productivity metrics and change rates, allows for an assessment of the rate of change in key metrics highlighting overall direction of the organization. In addition to basic financial highlights, this section includes both important and critical human capital metrics (see appendix for full definitions):
Return on Workforce or Workforce Productivity measured as Human Capital ROI Ratio and Return on Human Capital Investment. Both productivity metrics show the return of $1 invested in the workforce
Revenue, Profit, TCOW, and Human Capital ROI per FTE, measures changes in financial metrics versus workforce headcount and cost metrics. Combining financial and workforce metrics reflects a balanced workforce versus financial performance perspective.
Total Cost of Workforce (TCOW) calculated as a total cost on a percentage of Revenue basis.

Human Capital Management Institute 8
The Human Capital Impact section of the Disclosure Statement includes a blend of both workforce and financial metrics, however is relatively simple to prepare. This section compares basic financial results to both workforce headcount and Total Cost of Workforce (TCOW) enabling comparison of combined metric trends to that of the underlying input metrics. For example, comparing the change rates of TCOW vs. headcount will quickly identify which is the greater driver of increases or decreases in TCOW per FTE. Valuable comparisons include:
TCOW growth rate vs. Headcount growth rate or TCOW growth rate vs. Revenue growth rate TCOW per FTE growth rate vs. Revenue per FTE growth rate Revenue and Profit per FTE change rate vs. Human Capital ROI and Return on Human Capital Investment
Growth Rate Human Capital ROI growth rate vs. Return on Human Capital Investment Growth Rate
This section is especially useful for benchmarking, as only five input metrics (across two years) are required to complete it for any individual company or competitor. The resulting competitive landscape can indicate whether a company should change course or continue forward and the same direction.
*See appendix metric definitions for Total Operating Expenses
Human Capital Impact Metrics
1. Human Capital Impact Metrics 2. Total Workforce Headcount (FTE) 3. Total Workforce Headcount (FTE) change rate 4. Total Revenue per FTE 5. Revenue per FTE change rate 6. Cost of Workforce (TCOW) 7. TCOW change rate 8. TCOW per FTE 9. TCOW per FTE change rate 10. TCOW % of Revenue 11. TCOW % of Revenue change rate 12. TCOW % of Operating Expenses 13. TCOW % of Operating Expenses change rate
14. TCOW Percent of Profit 15. TCOW Percent of Profit change rate 16. Profit per FTE 17. Profit per FTE change rate 18. Human Capital ROI Ratio 19. Human Capital ROI Ratio change rate 20. Return on Human Capital Investment 21. Return on Human Capital Investment change rate 22. Workforce Productivity Impact 23. Workforce Productivity Impact change rate 24. Workforce Productivity Impact per FTE 25. Workforce Productivity Impact per FTE change rate
As shown above, the Human Capital Impact section enables calculation of at least twenty two different metrics, many of which are defined in detail in Appendix Part I.
Key Productivity Metrics
1. Total Headcount FTE = Total employees + contingent staff on a full time equivalent (FTE) basis.
2. Revenue and Profit per FTE = Total net revenue or operating profit, divided by Total Headcount FTE
3. Total Cost of Workforce (TCOW) = Total labor cost for employees and contingent workers (see appendix for definition)
4. Human Capital ROI Ratio = Revenue linked productivity as the human capital return ratio per dollar invested in the workforce (see appendix for definition)
5. Return on Human Capital Investment = Profit linked productivity as the return on human capital cost (TCOW) as a percent of Net Operating Profit
Prior Year Current Year % Chg
Revenue
Net Operating Revenue 1,400,000,000$ 1,540,000,000$ 10.0%
Total Headcount (FTE) 15,000 16,400 9.3%
Revenue per FTE 93,333$ 93,902$ 0.6%
Costs
Total Operating Expenses* 1,170,000,000$ 1,285,000,000$ 9.8%
Total Cost of Workforce (TCOW) 779,950,000$ 861,000,000$ 10.4%
TCOW per FTE 51,997$ 52,500$ 1.0%
TCOW % of Revenue 55.7% 55.9% 0.4%
Profit
Net Operating Profit 143,750,000$ 159,375,000$ 10.9%
Profit per FTE 9,583$ 9,718$ 1.4%
Workforce Productivity
Hunan Capital ROI Ratio 1.29 1.30 0.1%
Return on Human Capital Investment 18.4% 18.5% 0.4%
Human Capital ROI per FTE 15,333$ 15,549$ %1.4%
Human Capital Management Institute 9
B. Human Capital Flow
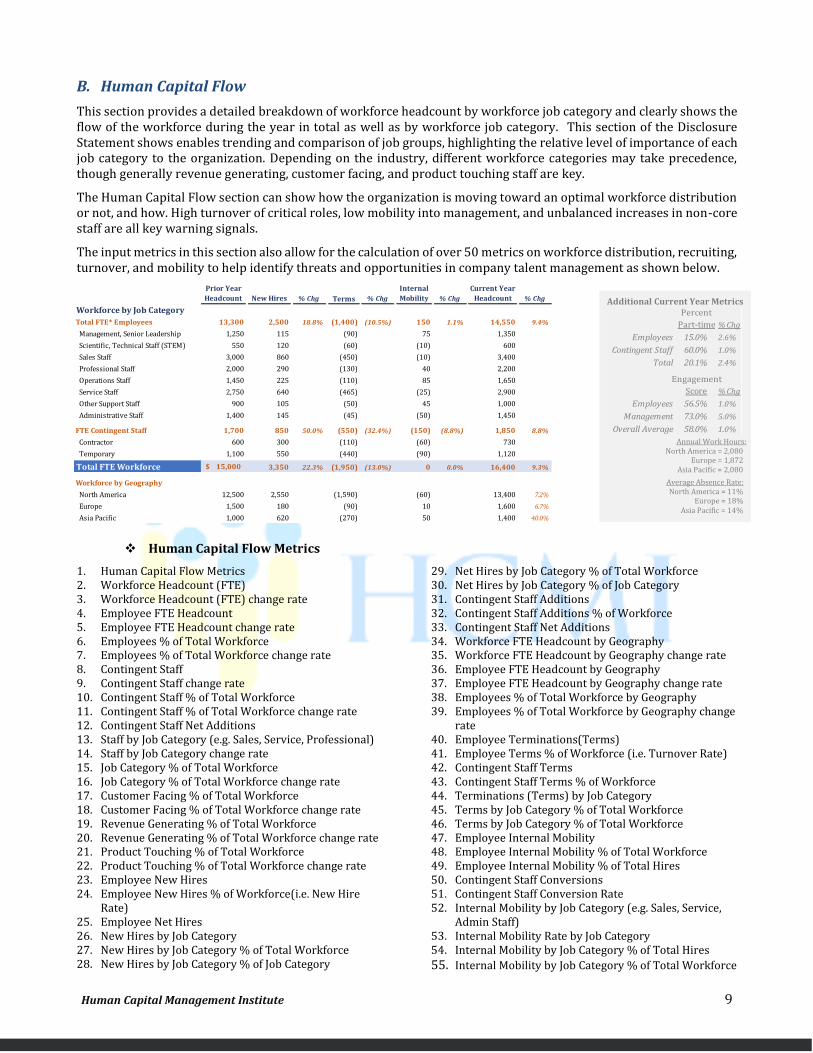
This section provides a detailed breakdown of workforce headcount by workforce job category and clearly shows the flow of the workforce during the year in total as well as by workforce job category. This section of the Disclosure Statement shows enables trending and comparison of job groups, highlighting the relative level of importance of each job category to the organization. Depending on the industry, different workforce categories may take precedence, though generally revenue generating, customer facing, and product touching staff are key.
The Human Capital Flow section can show how the organization is moving toward an optimal workforce distribution or not, and how. High turnover of critical roles, low mobility into management, and unbalanced increases in non-core staff are all key warning signals.
The input metrics in this section also allow for the calculation of over 50 metrics on workforce distribution, recruiting, turnover, and mobility to help identify threats and opportunities in company talent management as shown below.
Human Capital Flow Metrics
1. Human Capital Flow Metrics 2. Workforce Headcount (FTE) 3. Workforce Headcount (FTE) change rate 4. Employee FTE Headcount 5. Employee FTE Headcount change rate 6. Employees % of Total Workforce 7. Employees % of Total Workforce change rate 8. Contingent Staff 9. Contingent Staff change rate 10. Contingent Staff % of Total Workforce 11. Contingent Staff % of Total Workforce change rate 12. Contingent Staff Net Additions 13. Staff by Job Category (e.g. Sales, Service, Professional) 14. Staff by Job Category change rate 15. Job Category % of Total Workforce 16. Job Category % of Total Workforce change rate 17. Customer Facing % of Total Workforce 18. Customer Facing % of Total Workforce change rate 19. Revenue Generating % of Total Workforce 20. Revenue Generating % of Total Workforce change rate 21. Product Touching % of Total Workforce 22. Product Touching % of Total Workforce change rate 23. Employee New Hires 24. Employee New Hires % of Workforce(i.e. New Hire
Rate) 25. Employee Net Hires 26. New Hires by Job Category 27. New Hires by Job Category % of Total Workforce 28. New Hires by Job Category % of Job Category
29. Net Hires by Job Category % of Total Workforce 30. Net Hires by Job Category % of Job Category 31. Contingent Staff Additions 32. Contingent Staff Additions % of Workforce 33. Contingent Staff Net Additions 34. Workforce FTE Headcount by Geography 35. Workforce FTE Headcount by Geography change rate 36. Employee FTE Headcount by Geography 37. Employee FTE Headcount by Geography change rate 38. Employees % of Total Workforce by Geography 39. Employees % of Total Workforce by Geography change
rate 40. Employee Terminations(Terms) 41. Employee Terms % of Workforce (i.e. Turnover Rate) 42. Contingent Staff Terms 43. Contingent Staff Terms % of Workforce 44. Terminations (Terms) by Job Category 45. Terms by Job Category % of Total Workforce 46. Terms by Job Category % of Total Workforce 47. Employee Internal Mobility 48. Employee Internal Mobility % of Total Workforce 49. Employee Internal Mobility % of Total Hires 50. Contingent Staff Conversions 51. Contingent Staff Conversion Rate 52. Internal Mobility by Job Category (e.g. Sales, Service,
Admin Staff) 53. Internal Mobility Rate by Job Category 54. Internal Mobility by Job Category % of Total Hires
55. Internal Mobility by Job Category % of Total Workforce
Additional Current Year Metrics
Annual Work Hours:-
North America = 2,080__ Europe = 1,872__
Asia Pacific = 2,080__
Average Absence Rate:-- North America = 11%__
Europe = 18%__ Asia Pacific = 14%__
Percent
Part-time % Chg
Employees 15.0% 2.6%
Contingent Staff 60.0% 1.0%
Total 20.1% 2.4%
Engagement
Score % Chg
Employees 56.5% 1.0%
Management 73.0% 5.0%
Overall Average 58.0% 1.0%
Prior Year
Headcount New Hires % Chg Terms % Chg
Internal
Mobility % Chg
Current Year
Headcount % Chg
Workforce by Job Category
Total FTE* Employees 13,300 2,500 18.8% (1,400) (10.5%) 150 1.1% 14,550 9.4%
Management, Senior Leadership 1,250 115 (90) 75 1,350
Scientific, Technical Staff (STEM) 550 120 (60) (10) 600
Sales Staff 3,000 860 (450) (10) 3,400
Professional Staff 2,000 290 (130) 40 2,200
Operations Staff 1,450 225 (110) 85 1,650
Service Staff 2,750 640 (465) (25) 2,900
Other Support Staff 900 105 (50) 45 1,000
Administrative Staff 1,400 145 (45) (50) 1,450
FTE Contingent Staff 1,700 850 50.0% (550) (32.4%) (150) (8.8%) 1,850 8.8%
Contractor 600 300 (110) (60) 730
Temporary 1,100 550 (440) (90) 1,120
Total FTE Workforce 15,000$ 3,350 22.3% (1,950) (13.0%) 0 0.0% 16,400 9.3%
Workforce by Geography
North America 12,500 2,550 (1,590) (60) 13,400 7.2%
Europe 1,500 180 (90) 10 1,600 6.7%
Asia Pacific 1,000 620 (270) 50 1,400 40.0%

Human Capital Management Institute 10
C. Human Capital Cost
Total Cost of Workforce can be provided as a simple summary number, but is far more valuable when broken down as it is here. While the Human Capital Impact section can indicate that TCOW is increasing rapidly, the Human Capital Cost section, in tandem with Human Capital Flow, show where, how and why. Excessive costs can be found in any individual or combination of workforce categories and workforce costs. The 11 inputs required to fill this section allow for the calculation of nearly 90 workforce cost related metrics, including many that provide insight into company investments in Recruiting, Training, and Compensation.
Human Capital Cost 1. Employee Salary Cost 2. Employee Salary Cost change rate 3. Average Salary Cost per FTE Employee 4. Average Salary Cost per FTE Employee change rate 5. Employee Salaries Cost % of TCOW 6. Employee Salaries Cost % of TCOW change rate 7. Employee Salaries Cost % of Operating Expenses 8. Employee Salaries Cost % of Operating Expenses
change rate 9. Employee Salaries Cost % of Revenue 10. Employee Salaries Cost % of Revenue change rate 11. Employee Salaries Cost % of HR Cost 12. Employee Salaries Cost % of HR Cost change rate 13. Bonus & Incentives Cost 14. Bonus & Incentives Cost change rate 15. Bonus & Incentives Cost % of Total Salaries 16. Bonus & Incentives Cost % of Total Salaries change rate 17. Bonus & Incentives Cost % of TCOW 18. Bonus & Incentives Cost % of TCOW change rate 19. Bonus & Incentives Cost % of Operating Expenses 20. Bonus & Incentives Cost % of Operating Expenses
change rate 21. Bonus & Incentives Cost % of Revenue 22. Bonus & Incentives Cost % of Revenue change rate 23. Bonus & Incentive Cost per FTE 24. Bonus & Incentive Cost per FTE change rate 25. Employee Benefits Cost 26. Employee Benefits Cost change rate 27. Benefits Cost % of Total Salaries 28. Benefits Cost % of Total Salaries change rate 29. Benefits Cost % of TCOW
30. Benefits Cost % of TCOW change rate 31. Benefits Cost % of Operating Expenses 32. Benefits Cost % of Operating Expenses change rate 33. Benefits Cost % of Revenue 34. Benefits Cost % of Revenue change rate 35. Benefits Cost per FTE 36. Benefits Cost per FTE change rate 37. Absence Cost 38. Absence Cost change rate 39. Lost Days due to Absence 40. Lost Days due to Absence change rate 41. Absence Cost % of TCOW 42. Absence Cost % of TCOW change 43. Average Lost Days per FTE Worker 44. Average Lost Days per FTE Worker change rate 45. Contingent Workforce Cost 46. Benefits Cost % of Revenue 47. Benefits Cost % of HR Cost 48. Average Change in Benefit Costs 49. Benefits Cost per FTE 50. Contingent workforce Cost change rate 51. Contingent Workforce Cost % of TCOW 52. Contingent Workforce Cost % of TCOW change rate 53. Contingent Workforce Cost % of Revenue 54. Contingent Workforce Cost % of Revenue change rate 55. Contingent Workforce Cost % of Operating Expenses 56. Contingent Workforce Cost % of Operating Expenses
change rate 57. Contingent cost per Worker 58. Contingent cost per Worker change rate 59. Other Compensation Cost
Additional Current Year Metrics
Avg. Employee Salary:-- $32,000 USD--
Avg. Actual Incentive Paid:-- $4,600 USD--
Avg. Benefits Cost per FTE:-- $10,320 USD-- Benefits Cost = 32.2% of Salary--
Avg. Contingent Worker Cost per FTE-- $24,500 USD--
Avg. Training Cost per FTE:-- $1,900 USD--
Avg. Training Hours per FTE:-- 88 Hours or 11 days--
Avg. Recruiting Cost per Hire:-- $3,600 USD--
Prior Year Current Year % Chg
Workforce Costs
Employee Salary Cost 465,710,000$ 510,940,000$ 9.7%
Bonus and Incentives Cost 70,000,000$ 75,140,000$ 7.3%
Benefits Cost 146,000,000$ 164,230,000$ 12.5%
Absence (Lost Days) Cost 4,000,000$ 5,000,000$ 25.0%
Contingent Workforce Cost 45,290,000$ 51,690,000$ 14.1%
Other Compensation -$ -$ 0.0%
Total Workforce Cost 731,000,000$ 807,000,000$ 10.4%
HR Costs
Training & Development Cost 27,800,000$ 31,250,000$ 12.4%
Recruiting & Onboarding Cost 8,000,000$ 9,000,000$ 12.5%
Labor Relations, Talent Management 5,000,000$ 5,100,000$ 2.0%
HR Administration Cost (e.g. payroll) 7,150,000$ 7,650,000$ 7.0%
Total HR Expenses 47,950,000$ 53,000,000$ 10.5%
HR Cost % of Total Workforce Cost 6.6% 6.6% 1.0%
Other Workforce Costs 1,000,000$ 1,000,000$ 0.0%
Total Cost of Workforce 779,950,000$ 861,000,000$ 10.4%
Human Capital Management Institute 11
60. Other Compensation Cost change rate 61. Other Compensation Cost % of TCOW 62. Other Compensation Cost % of TCOW change rate 63. Recruiting Cost 64. Recruiting Cost change rate 65. Recruiting Cost per Employee (aka Cost per Hire) 66. Recruiting Cost per Employee change rate 67. Recruiting Cost % of Total HR Costs 68. Recruiting Cost % of Total HR Costs change rate 69. Recruiting Cost % of TCOW 70. Recruiting Cost % of TCOW change rate 71. Training & Development Cost 72. Training & Development Cost change rate 73. Training Cost % of Total HR Costs 74. Training Cost % of Total HR Costs change rate 75. Training Cost % of TCOW 76. Training Cost % of TCOW change rate 77. Training Cost per Employee (aka training investment
per FTE)
78. Training Cost per Employee change rate 79. HR Cost 80. HR Cost change rate 81. HR Cost % of TCOW 82. HR Cost % of TCOW change rate 83. HR Cost % of Total Operating Expenses 84. HR Cost % of Total Operating Expenses change rate 85. HR Cost % of Revenue 86. HR Cost % of Revenue change rate 87. HR Cost per Employee 88. HR Cost per Employee change rate 89. HR Cost per Worker (Employees + Contingent Workers) 90. HR Cost per Worker change rate 91. Other Workforce Costs 92. Other Workforce Costs change rate 93. Other Workforce Costs % of TCOW 94. Other Workforce Costs % of TCOW change rate
Understanding the Metrics: Example Disclosure Statement Analysis
The following example data in a disclosure statement shows how a company might use these metrics to gain key strategic insights into their human capital talent.
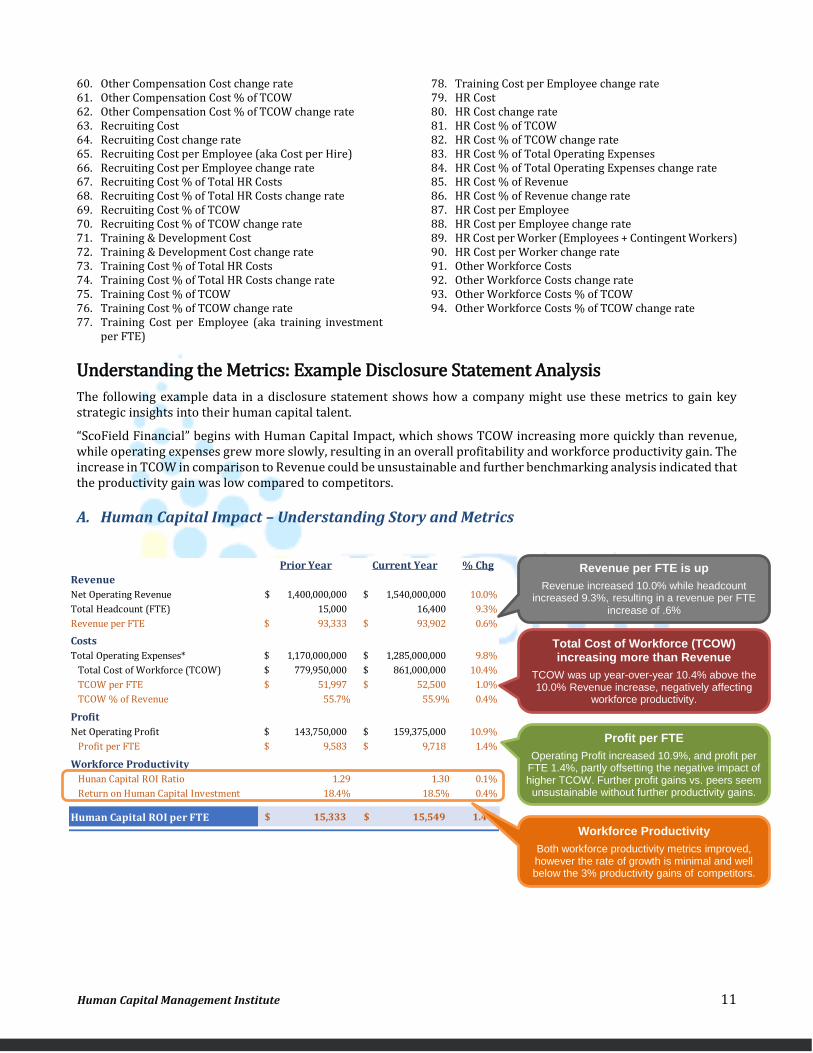
“ScoField Financial” begins with Human Capital Impact, which shows TCOW increasing more quickly than revenue, while operating expenses grew more slowly, resulting in an overall profitability and workforce productivity gain. The increase in TCOW in comparison to Revenue could be unsustainable and further benchmarking analysis indicated that the productivity gain was low compared to competitors.
A. Human Capital Impact – Understanding Story and Metrics
Prior Year Current Year % Chg
Revenue
Net Operating Revenue 1,400,000,000$ 1,540,000,000$ 10.0%
Total Headcount (FTE) 15,000 16,400 9.3%
Revenue per FTE 93,333$ 93,902$ 0.6%
Costs
Total Operating Expenses* 1,170,000,000$ 1,285,000,000$ 9.8%
Total Cost of Workforce (TCOW) 779,950,000$ 861,000,000$ 10.4%
TCOW per FTE 51,997$ 52,500$ 1.0%
TCOW % of Revenue 55.7% 55.9% 0.4%
Profit
Net Operating Profit 143,750,000$ 159,375,000$ 10.9%
Profit per FTE 9,583$ 9,718$ 1.4%
Workforce Productivity
Hunan Capital ROI Ratio 1.29 1.30 0.1%
Return on Human Capital Investment 18.4% 18.5% 0.4%
Human Capital ROI per FTE 15,333$ 15,549$ % 1.4%
Total Cost of Workforce (TCOW) increasing more than Revenue
TCOW was up year-over-year 10.4% above the 10.0% Revenue increase, negatively affecting
workforce productivity.
Revenue per FTE is up
Revenue increased 10.0% while headcount increased 9.3%, resulting in a revenue per FTE
increase of .6%
Profit per FTE
Operating Profit increased 10.9%, and profit per FTE 1.4%, partly offsetting the negative impact of higher TCOW. Further profit gains vs. peers seem unsustainable without further productivity gains.
Workforce Productivity
Both workforce productivity metrics improved, however the rate of growth is minimal and well below the 3% productivity gains of competitors.

Human Capital Management Institute 12
B. Human Capital Flow– Understanding Story and Metrics
ScoField Financial then analyzed its Human Capital Flow. Its’ strategy includes a combination of building talent internally, buying new talent externally, and renting talent through Contingent staff, some of which is later hired.
Several issues stand out in the human capital flow. First, 61% of new management staff were hired externally rather than promoted internally. This could not only indicate higher costs as external hires are often more expensive (helping explain the rise in TCOW), but suggest a lack of internal talent development or need for increased leadership training if there are not enough staff considered ready for leadership roles.
Second, Sales and Service staff had particularly high turnover rates. As Sales staff generates revenue and service staff is customer facing, it was key that these groups be further analyzed. Turnover is not necessarily bad, if low performers are leaving. However, even if the turnover is composed low performers, it suggests a flawed sales recruiting or onboarding process. If high performers or high potential new hires are leaving, however, this may be behind the slower revenue growth and could cripple ScoField Financial in the long term.
Third, this period ScoField Financial saw an increase in Support and Administrative Staff. Since these positions are usually neither revenue generating, customer facing, nor in high strategic positions, this can mean unnecessary increases in workforce costs.
These insights should, ideally enable ScoField to further investigate the drivers behind these trends and strategically direct its future workforce investments to improve productivity in the future, thereby addressing investor concerns and improving competitiveness while surgically investing in the workforce where it matters most.
Buy Build
Ren
t
Management Internal Hire Rate
75 Internal Staff were promoted into management however 115 were hired externally or only 39% of
internal staff was considered ready for management
Increases in Support Staff
What is driving increased support staff? Is this why TCOW is increasing faster than revenue?
Contingent Workforce
Is contingent workforce a feeder group for critical roles? A low cost workforce strategy or a gap filler? How does contingent
workforce fit in the strategic company direction?
Critical Job Roles – Sales
While 860 sales people were hired, (450) departed. Why? Are they high or low performers, new hires or veterans? Co. Growth and success is heavily reliant on this group.
Human Capital Management Institute 13
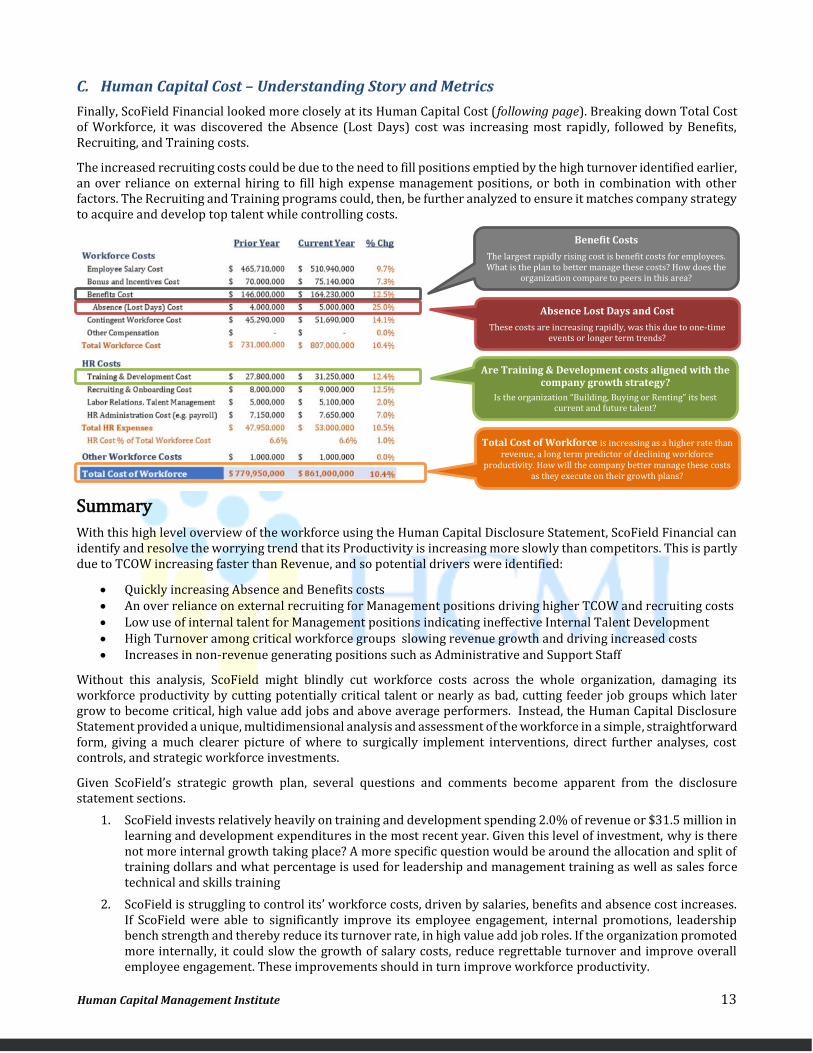
C. Human Capital Cost – Understanding Story and Metrics
Finally, ScoField Financial looked more closely at its Human Capital Cost (following page). Breaking down Total Cost of Workforce, it was discovered the Absence (Lost Days) cost was increasing most rapidly, followed by Benefits, Recruiting, and Training costs.
The increased recruiting costs could be due to the need to fill positions emptied by the high turnover identified earlier, an over reliance on external hiring to fill high expense management positions, or both in combination with other factors. The Recruiting and Training programs could, then, be further analyzed to ensure it matches company strategy to acquire and develop top talent while controlling costs.
Summary
With this high level overview of the workforce using the Human Capital Disclosure Statement, ScoField Financial can identify and resolve the worrying trend that its Productivity is increasing more slowly than competitors. This is partly due to TCOW increasing faster than Revenue, and so potential drivers were identified:
Quickly increasing Absence and Benefits costs An over reliance on external recruiting for Management positions driving higher TCOW and recruiting costs Low use of internal talent for Management positions indicating ineffective Internal Talent Development High Turnover among critical workforce groups slowing revenue growth and driving increased costs Increases in non-revenue generating positions such as Administrative and Support Staff
Without this analysis, ScoField might blindly cut workforce costs across the whole organization, damaging its workforce productivity by cutting potentially critical talent or nearly as bad, cutting feeder job groups which later grow to become critical, high value add jobs and above average performers. Instead, the Human Capital Disclosure Statement provided a unique, multidimensional analysis and assessment of the workforce in a simple, straightforward form, giving a much clearer picture of where to surgically implement interventions, direct further analyses, cost controls, and strategic workforce investments.
Given ScoField’s strategic growth plan, several questions and comments become apparent from the disclosure statement sections.
1. ScoField invests relatively heavily on training and development spending 2.0% of revenue or $31.5 million in learning and development expenditures in the most recent year. Given this level of investment, why is there not more internal growth taking place? A more specific question would be around the allocation and split of training dollars and what percentage is used for leadership and management training as well as sales force technical and skills training
2. ScoField is struggling to control its’ workforce costs, driven by salaries, benefits and absence cost increases. If ScoField were able to significantly improve its employee engagement, internal promotions, leadership bench strength and thereby reduce its turnover rate, in high value add job roles. If the organization promoted more internally, it could slow the growth of salary costs, reduce regrettable turnover and improve overall employee engagement. These improvements should in turn improve workforce productivity.
Benefit Costs
The largest rapidly rising cost is benefit costs for employees. What is the plan to better manage these costs? How does the
organization compare to peers in this area?
Absence Lost Days and Cost
These costs are increasing rapidly, was this due to one-time events or longer term trends?
Are Training & Development costs aligned with the company growth strategy?
Is the organization “Building, Buying or Renting” its best current and future talent?
Total Cost of Workforce is increasing as a higher rate than revenue, a long term predictor of declining workforce
productivity. How will the company better manage these costs as they execute on their growth plans?

Human Capital Management Institute 14
IV. Literature Review Matrix
Human Capital Disclosure Requirements MatrixI = Included in Management's Human Capital Discussion
Inte
rnat
iona
l Int
egra
ted
Rep
orti
ng C
ounc
il
OM
ER
S O
ntar
io
Mun
icip
al E
mpl
oyee
s
Ret
irem
ent
Syst
em
Sust
aina
ble
Acc
ount
ing
Stan
dard
s B
oard
, SA
SB
IRR
C I
nsti
tute
-HB
S,
Mat
eria
lity
of H
uman
Cap
ital
to
Fin.
Per
f.
GR
I –
Glo
bal R
epor
ting
Init
iati
ve
Acc
ount
ing
for
Peo
ple
Tas
k Fo
rce
2003
Smar
ter
Ann
ual R
epor
t
2015
, Cre
elm
an, B
assi
Dow
Jon
es S
usta
inab
ility
Inde
x 20
14-2
015
AN
SI-S
HR
M I
nves
tor
Gui
delin
es f
or R
epor
ting
HC
201
2
CIP
D V
alui
ng Y
our
Tal
ent
2014
- 20
15
NA
PF
– N
atio
nal
Ass
ocia
tion
of
Pen
sion
Fund
s
ISO
:NW
IP N
-141
, HC
Rep
orti
ng f
or I
nt. &
Ext
.
stak
ehol
ders
TO
TA
L
HC
Dis
clo
sure
Sta
tem
ent
Workforce Composition
Workforce Headcount 10
Workforce Cost 9
Workforce Productivity 9
Return on Workforce or People 9
Workforce Composition-Breakdown 9
- Contingent Labor Cost 6
- Contingent Labor Force Size 6
- Benefits (i.e. full-time v part-time) 6
- Geographic-Global Workforce Distribution 5
- Revenue per Employee or FTE 4
- Demographics, Diversity (i.e. Age, Gender) 3 I
- EBITDA per employee or FTE 3
- Full-time v part-time 3
- Job Level 3
- Talent Efficiency/Effectiveness 2
- Proportion Professional qualified employees 2
- Work Hours 1
Workforce Skills and Capabilities
- Total Training Investment 9
- Leadership Depth/Career devpmt/Succession 8
- Talent Management 6
- Competencies and Skills 6
- Internal Hire Rate 6
- Average training hours per employee 3
- Leadership Quality/ Effectiveness 3
- Training Types (formal/informal, technical, apprentice) 2 I
- Training by Job Group 2 I
- Number of Courses Taken 1 I
- Number of PhD's (or total # of Patents) 1 I
Overarching HC Disclosure Objectives
Human Capital Performance, Productivity 11
Comparable across entities/industries 11
Transparancy (clear, complete, reliable, simple) 10
Validity (Useful, link to financial results) 10
Consistency over time (measure over time) 9
Material, Auditable Information 9
Sustainabiltiy of Human Capital 8
Business and Management Governance 8
Comprehensive (Complete/Talent lifecycle) 8
Human Capital Risks 7
Strategic, Future Directional Focus 7
Connectivity of Information 6
Superior Human Capital Talent Decisions 5
Workforce Stability
Workforce Turnover (i.e. terminations) 8
- Regrettable or Voluntary turnover 7
- Pay policies & ratios (mgmt, gender equiity) 7
- Turnover by Category or level (EEO) 2
- Recruitment Costs 2
- Applicants per position/ Brand Awareness 2 I
- Offer/acceptance statistics 2 I
- Retention rates (demographic) 2 I
- Levels of skill shortages 2 I
- Pension/Retirement program (cost, % eligible) 1 I
- Industrial relations issues 1 I
- New Hire Retention Rate (12 month retention) 1 I
Workforce Culture
- Employee Engagement Score 6
- Absentee Rates, (i.e. % or Cost) 5
- Lost Days, Accident Rates, Fatalities 5 I
Other
- Human capital discussion & analysis 2
- HR Cost or Investment 1
- HR Return on Investment 1
TOTAL RECOMMENDATIONS 12 12 14 15 20 20 25 25 31 31 48 50 59 46
% of Requirements Met 78%
Category, Element, Metric or Dimension
Human Capital Management Institute 15
V. References
ANSI-SHRM(2012) Guidelines for reporting Human Capital Metrics to Investors.
NAPF – “Where is the Workforce in Corporate Reporting?” National Association of Pension Funds – June 2015 www. NAPF.co.uk
Accounting for People Task Force 2003 (Accounting for People: Report of the Task Force on Human Capital Management, October 2003)
IRRC The Materiality of Human Capital to Corporate Financial Performance, April 2015
Abeysekera, I. (2008). Motivations behind human capital disclosure in annual reports. Discipline of Accounting, Economics & Business Building.
American National Standard for Human Resource Management. (2012). Guidelines for reporting human capital metrics to investors. Society for Human Resource Management.
Atwater, D. M., & Jorgensen, B. (2008). Best practices for headcount reporting. Graziadio Business Review.
Bassi, L., & McMurrer, D. (2004, March). How’s your return on people. Harvard Business Review.
Beattie, V., & Smith, S. (2010). Human capital, value creation and disclosure. Journal of Human Resource Costing & Accounting.
Bontis, N., & Fitz-enz, J. (2002). Intellectual capital ROI: a causal map of human capital antecedents and consequents. Journal of Intellectual Capital.
Cappelli, P. (2005, January). Blind investment. HR Magazine.
Collins, J. (2001). Good to great. New York, NY: HarperCollins Publishers Inc.
Cormier, D., Aerts, W., Ledoux, M., & Magnan, M. (2009). Attributes of social and human capital disclosure and information asymmetry between managers and investors. Canadian Journal of Administrative Sciences.
Davenport, T. H., Harris, J., & Shapiro, J. (2010, October). Competing on analytics. Harvard Business Review.
Dela Torre, K. (N.D.). Human capital metrics: To disclose or not to disclose? C-Central Information for Executives by Oracle.
Higgins, J., & Cooperstein, G. (2010). Managing an organization’s biggest cost: The workforce. Retrieved from http://www.hcminst.com/files/OrgPlus_Total_Cost_Workforce_.pdf.
Huselid, M. A., Becker, B. E., & Beatty, R. W., (2005). The workforce scorecard. Boston, MA: Harvard Business School Press.
Jarboe, K. (2013). Motivation for voluntary corporate disclosure about human capital. The Intangible Economy.
Lowell, B. L. (2007). The new metrics of corporate performance: Profit per employee. The McKinsey Quarterly.
McCann, D. (2012). Proposed standard calls for human capital disclosure. CFO Magazine.
McCann, D. (2012). Outcry over proposed human capital metrics disclosure. CFO Magazine.
Micah, L., Ofurum, C., Ihendinihu, J. (2012). Firm’s financial performance and human resource accounting disclosure in Nigeria. International Journal of Business and Management.
Nagar, V. (1999). The role of the manager’s human capital in discretionary disclosure. Journal of Accounting Research.
Petkov, R. (N.D.). Perspectives on disclosing human capital into the notes of the financial statements.
Sullivan, J. (2010, November). Game-changing: financial analysts begin assessing talent management effectiveness. Retrieved from ERE.net.
What happened to Apple Shares when Steve Jobs took medical leaves in 2009 and 2004? (2011, January). International Business Times.
Human Capital Management Institute 16
VI. Appendix
Part 1: Metric Definitions and Descriptions A. Human Capital Impact
Revenue
Net Operating Revenue
Net Operating Revenue (Current Annual or Prior Annual) is the primary measure or factor representing sales performance for the organization and is a key growth or change variable that the organization must compare and contrast with the workforce. Common practice in financial analysis has been that many costs are compared and measured as a percentage of total revenue or total operating revenue in order to gauge their relative size and impact in terms of revenue or sales coming into the organization.
Net sales plus other regular income sources related to the normal business operations. Specifically excludes revenue from extraordinary items such as asset sales, business divestitures, sales of investments or revenue recognition due to accounting policy changes.
Formula: Sum of Net Operating Revenue from all individual lines of business net of returns and losses, and excluding extraordinary items
Description: Net operating revenue also referred to as net sales includes regular operational revenue, sales or in the case of governments and non-profits the total allocated budget income sources related to the normal organization or business operations. Specifically excludes revenue from extraordinary items such as asset sales, business divestitures, sales of investments, or revenue recognition due to accounting policy changes
Total Headcount (FTE)
Total Headcount (FTE) or full time equivalent workers, is the measure of the total size of the workforce at a specific period of time and is used as a measuring point in calculating various workforce measures such as revenue per FTE and profit per FTE. Total Headcount FTE includes all contingent workers.
Formula: Total Employee FTE Period End + Total Contingent FTE Period End
Description: The total employee and contingent FTE for a given period defined as all regular employees and contingent workers on a full time equivalent basis at the end of the reporting period
Revenue per FTE
Revenue per FTE is a commonly used high level average productivity and performance metric which can be used by organizations as a simple measure that compares two critical variables for most organizations, which are total operating revenue and total workforce FTE. When total revenue is growing faster than total workforce FTE, the average Revenue per FTE will increase indicating that the organization is achieving its’ revenue growth without a correspondingly equal level of growth in the size of the workforce. This metric does not however, take into account outsourced labor or other work done by suppliers which may include considerable labor costs. This metric also does not include the impact of the total costs of the workforce which may change at different rates than the size of the overall workforce FTE (see Total Cost of Workforce).
Formula: Total Net Revenue / Average Employee FTE or Average Workforce FTE
Description: Average amount of net revenue generated for each full time equivalent employee (FTE) as measured either for all employee FTE or total workforce FTE which includes employees, temporary workers and contractors
Human Capital Management Institute 17
Costs
Total Operating Expenses or Total Operational Expenses
Total Operating Expenses is the total of all accounting classified expenses in running and operating the organization or business. Such expenses incurred in providing specific work in support of the business. Examples of operating expenses include cost of services provided, cost of goods sold, sales force and sales organization costs, marketing, research and development (non-capitalized), finance and accounting, human resources, legal, information technology and administrative costs or expenses. Such costs represent the total cost of operating the organization’s business for a given period of time. It is useful to measure and compare total workforce costs or expenses to the total level of operating expenses for the organization as a means of understanding the relative size, impact and importance of workforce costs to total expenses for the organization. Total operating expenses varies considerably versus total costs of the workforce based on industry, geography, business model and organizational structure.
Formula: Cost of Goods or Services Provided + Total G&A Expenses + Total R&D Expenses + Total Selling & Marketing Expenses + Other Operating Expenses
Description: Total Operating Expense is the sum of business operating expense for a period of time, and a subset of Total Expenses, as operating expenses do not include organization expenses classified as cost of goods sold (COGS) or cost of services (COS). Operating Expenses typically include selling, marketing, research and development, general and administrative expenses which includes legal, accounting and finance, human resources (HR), information technology (IT) as well as other operating expenses
NOTE - Certain industries may exclude material and inventory costs normally reflected in Total Cost of Goods sold in the calculation of Total Operating Expenses (i.e. Retail, Manufacturing).
Total Cost of Workforce (TCOW)
Total Cost of Workforce (TCOW) links directly the total costs of employing all elements of the workforce and is a particularly useful measure when compared as a percentage of total operating revenue, total operating expenses or total expenses. Expressed as a percentage in such a form, TCOW can be trended as a metric specifically focused on the workforce. For example, in any organization where the total cost of workforce grows faster than revenues , over time the organization will lose profitability in addition to efficiency and be forced to retrench, restructure or layoff some of its’ workforce.
Total cost of workforce is defined as the total costs of all salaries, wages direct and indirect cash or equity compensation for all employees. TCOW includes all costs for contingent temporary or contract workers whenever the organization primarily directs the work of such labor. For example, offshore employees who work in a separate legal entity that is 50% or greater controlled by the organization should be included in the total cost of workforce. TCOW includes all company provided or paid employee benefits, perks and rewards. Such costs also include all company retirement related costs for both current and former employees. TCOW includes all enterprise HR costs such as training costs provided to employees and or contingent labor. All recruiting costs not already included incurred as workforce acquisition costs. All employee relations, severance and legal settlements paid to current and former employees or contingent labor.
Formula: (Total Employee Compensation Costs + Contingent Workforce Costs + Benefits Costs + HR Costs + Other Workforce Costs)
Description: The sum of the total costs of the workforce includes all compensation costs, benefits costs and other employee costs. Total cost of employees includes all employee related costs for the organization for a given period of time. Workforce is defined as employees plus contingent (contract and temporary) workers
Total Cost of Workforce is optimized when analyzed by relative position value add, performance level, profitability, productivity, employee engagement, tenure and mobility. When used with such measures, Total Cost of Workforce is a predictor of increasing or decreasing trends in employee performance and productivity, turnover and engagement correlated between certain job roles and workforce groups
Human Capital Management Institute 18
Total Cost of Workforce (TCOW) per FTE
Total Cost of Workforce (TCOW) calculated is the same as the previously defined TCOW divided by Total Headcount (FTE) previously calculated to arrive at the Total Cost of Workforce Expressed on an FTE worker basis for the organization or division being measured. Such a measure links directly the total costs of employing all elements of the workforce on a per worker basis and is a particularly useful when trended over time and compared to the workforce mix as well as revenue, inflation rate, and total cost changes to name a few comparative options. For example, in any organization where the total cost of workforce grows faster than revenues, over time the organization will lose profitability in addition to efficiency and be forced to eventually retrench, restructure or layoff some of its’ workforce.
Formula: Total Cost of Workforce / Total Headcount FTE
Description: Total cost of the workforce expressed on a per FTE or Full Time Equivalent worker basis. The workforce is defined as employees plus contingent (contract and temporary) workers. Total cost of workforce is defined as the total costs of all salaries, wages direct and indirect cash or equity compensation for all employees. TCOW includes all costs for contingent temporary or contract workers whenever the organization primarily directs the work of such labor. For example, offshore employees who work in a separate legal entity that is 50% or greater controlled by the organization should be included in the total cost of workforce. TCOW includes all company provided or paid employee benefits, perks and rewards. Such costs also include all company retirement related costs for both current employees. TCOW includes all enterprise HR costs such as training costs provided to employees and or contingent labor. It also includes all recruiting costs not already included incurred as workforce acquisition costs and all employee relations, severance and legal settlements paid to current and former employees or contingent labor
Total Cost of Workforce Percent of Revenue
Total Cost of Workforce (TCOW) calculated is the same as the previously defined TCOW divided by Total Headcount (FTE) previously calculated to arrive at the Total Cost of Workforce Expressed on an FTE worker basis for the organization or division being measured. Such a measure links directly the total costs of employing all elements of the workforce on a per worker basis and is a particularly useful when trended over time and compared to the workforce mix as well as revenue, inflation rate, and total cost changes to name a few comparative options. For example, in any organization where the total cost of workforce grows faster than revenues, over time the organization will lose profitability in addition to efficiency and be forced to eventually retrench, restructure or layoff some of its’ workforce.
Formula: Total Cost of Workforce / Total Headcount FTE
Description: Total cost of the workforce expressed on a per FTE or Full Time Equivalent worker basis. The workforce is defined as employees plus contingent (contract and temporary) workers. Total cost of workforce is defined as the total costs of all salaries, wages direct and indirect cash or equity compensation for all employees. TCOW includes all costs for contingent temporary or contract workers whenever the organization primarily directs the work of such labor. For example, offshore employees who work in a separate legal entity that is 50% or greater controlled by the organization should be included in the total cost of workforce. TCOW includes all company provided or paid employee benefits, perks and rewards. Such costs also include all company retirement related costs for both current employees. TCOW includes all enterprise HR costs such as training costs provided to employees and or contingent labor. It also includes all recruiting costs not already included incurred as workforce acquisition costs and all employee relations, severance and legal settlements paid to current and former employees or contingent labor
Human Capital Management Institute 19
Profit
Net Operating Profit
Operating Profit is a measure of a company's earning power from ongoing operations, equal to earnings before deduction of interest payments and income taxes. also called EBIT (earnings before interest and taxes) or operating income. Therefore Net Operating Profit is a commonly used financial profitability performance measure that differs from Operating Profit in that it includes the impact of taxes, attempting to measure to level of profit contribution from business operational activities on an after tax basis and to align organizational profit performance to the organizational bottom line.
Simply put, Net Operating Profit is a measure for the organization that measures bottom line operational performance and thereby when blended or contrasted with workforce metrics, provides a representative comparison with which to judge the alignment, impact and performance of such workforce metrics that may compare against it. Such a metric as used in the human capital impact statement is a preferred profit measurement or comparison metric upon which to compare workforce and other performance metrics.
Formula: Total Operating Revenue - Total Operating Expenses - Total Taxes
Description: Total earnings after costs of goods and services, expenses, interest and taxes. See your organization’s accounting or finance department for a more detailed calculation of your organization’s applicable Net Operating Profit
Profit per FTE
Proft per FTE or full time equivalent employee is a measure or ratio that compares the profit generated by an organization with the total number of employees or the total number of the workforce. The workforce is defined as employees plus contingent (contract and temporary) workers. This metric is commonly used as a high level productivity measure which is trended over time or benchmarked with peers in the same industry or region. It is also used a simple relative measure of the profit contribution potential and result from a single employee or worker at the organization. Profit per FTE is a measure for the organization that measures bottom line operational performance compared against the total size of the employee or workforce base. Such a measure provides a representative comparison with which to judge the alignment, impact and performance of the workforce. Such a metric as used in the human capital impact statement is a preferred profit measurement or comparison metric upon which to compare workforce and other performance metrics.
Formula: Total Net Operating Profit / Average Employee FTE or Average Workforce FTE
Description: Net operating profit generated for each full time equivalent employee (FTE) as well as workforce FTE which includes employees, temporary workers and contractors
Workforce Productivity
Human Capital ROI Ratio
Human Capital ROI Ratio is often used as a definitive profit or productivity contribution by the workforce that essentially shows the return, expressed as a ratio, that one dollar invested in the organization’s workforce provides as a return on investment. For example, an organization with a calculated Human Capital ROI Ratio of 1.2, indicates that for every $1.00 dollar invested in the cost of the workforce, that $1.20 dollars will be returned by the organization.
Formula: [Total Operating Revenue - (Total Operating Expenses - Total Cost of Workforce)] / Total Cost of Workforce
Description: Net operating profit impact of each dollar invested in human capital or the total cost of workforce.
NOTE - It is recommended that the metric Total Cost of Workforce, which includes the total costs of employees plus all contingent headcount (contract and temporary workers), be used in calculating Human Capital ROI
Human Capital Management Institute 20
Ratio. If Total Cost of Workforce detailed information is not available, this metric may also be calculated using the total costs of employees as an alternate
NOTE - This metric is optimally used for long term strategic predictions rather than short term measurement since organizational market values can fluctuate dramatically due to uncontrollable events as well as industry and market changes
Return on Human Capital Investment
Return on Human Capital Investment is a measure of the calculated return to the organization of an additional unit or dollar invested in the workforce. For profitable organizations in wich human capital is a significant part of the value creation process, it is generally a number greater than 1.00. Assuming that operating profit is a result of a companys’s workforce, this metric shows the returns brought about by the workforce. This metric trended over time can show the effectiveness of using workforce measures such as total cost of workforce TCOW on returns. This analysis provides more clarity when TCOW is tracked by high performers in critical roles, vs, all others to show the segmented returns
Formula: Total Operating Profit / Total Cost of Workforce
Description: Return on investment in terms of net operating profit, expressed as a percentage of the total dollar amount invested in human capital workforce costs
Human Capital ROI per FTE
The Human Capital ROI per FTE metric is simply the human capital ROI for the workforce for a given period expressed on a per FTE basis. The metric clearly shows the value add or productivity contribution over and above cost made by the workforce on an average basis for a given period. This metric shows in a clear easily comparable way the level of value creation, productivity gain, cost efficiency and profit enhancement be generated from a typical worker in the organization. An organization's actual quantifiable workforce productivity impact as calculated by other methods such as return on human capital investment (profit driven productivity) may differ. The Human Capital ROI per FTE metric is defined and calculated as follows:
Formula: (Human Capital ROI Ratio -1)* Total Cost of Workforce/Total Headcount FTE
Description: The Human Capital ROI per FTE is the overall average productive contribution or value add over and above Total Cost of Workforce (TCOW) for a given organization for a given period. The metric can be readily benchmarked and trended over time and has the added advantage of being reported on an average FTE basis, making it relatively easy to understand. This metric is a variation of Human Capital ROI ratio and show the overall productivity, return on people, value add contribution made by an average worker. See definition of Total Headcount FTE for more information on headcount included
B. Human Capital Flow
Costs
Prior Year Headcount
Description: Total Headcount (FTE) or full time equivalent workers, is the measure of the total size of the workforce at prior year period and is used as a measuring point in calculating various workforce measures such as revenue per FTE and profit per FTE. Total Headcount FTE includes all contingent workers.
Formula: Total Employee FTE Prior Period End + Total Contingent FTE Prior Period End
New Hires
Description: The total number of employees hired into new positions at the organization externally both regular full-time, or part-time. This also include new temporary and contract staff added. This number is used as a denominator input into full-time equivalent (FTE) and headcount formulas, as well as in calculations for recruiting or new hires.

Human Capital Management Institute 21
New Hires Percent of Prior Year Headcount
Formula: Total New Hires / Prior Year Employee Headcount
Description: The total number of employees hired into new positions at the organization externally both regular full-time, or part-time, expressed as a percent of prior year headcount. This number is used as a denominator input into full-time equivalent (FTE) and headcount formulas, as well as in calculations for recruiting or new hires.
Terms or Terminations
Description: Total number of terminations from the organization, including employee or workforce retirements, voluntary, involuntary and any other form of termination. This metric may exclude interns hired on a temporary employee basis. This metric also includes seasonal, temporary and contractor terminations for the organization. Such total terminations enable the organization to effectively plan and anticipate resource needs for future periods.
Terms or Terminations Percent of Prior Year Headcount
Formula: Total Terminations / Prior Year Employee Headcount
Description: Total number of terminations from the organization, including employee or workforce
retirements expressed as a percentage of prior year headcount. This metric counts total turnover and retirements. This metric may exclude interns hired on a temporary employee basis. This metric also includes seasonal, temporary and contractor terminations for the organization. Such total terminations enable the organization to effectively plan and anticipate in a given period.
Internal Mobility
Formula: Total Internal Movement / Prior Year Employee Headcount
Description: The total number of movements (defined as transfers, promotions, demotions and other moves in which the workers move from one workforce job classification category to another. Such moves inside an organization are often listed as major promotions from professional to management status, or major career changes such as moving from accounting into sales.
Internal Mobility Percent of Prior Year Headcount
Formula: Total Internal Movement / Prior Year Employee Headcount
Description: The total number of movements (defined as transfers, promotions, demotions and other moves in which the workers move from one workforce job classification category to another expressed as a percentage of the Prior Year Workforce headcount (sometimes referred to as the Base Year Headcount). Such moves inside an organization are often listed as major promotions from professional to management status, or major career changes such as moving from accounting into sales.
Workforce Headcount by Geography
Description: Workforce by Geography is reported by geographic regions such as North America, Europe, and Asia Pacific, in which the organization has a workforce presence.
Current year Headcount
Description: Total Headcount (FTE) or full time equivalent workers, is the measure of the total size of the workforce at prior year period and is used as a measuring point in calculating various workforce measures such as revenue per FTE and profit per FTE. Total Headcount FTE includes all contingent workers. This total also includes the contingent workforce which is reflected in a separate category.
Formula: Total Employee FTE Prior Period End + New Hires – Terms + Internal Mobility
Human Capital Management Institute 22
C. Human Capital Cost
Workforce Cost
Employee Salary Cost includes the total cost of salaries for all employee in the organization, including contingent workforce and hourly workers, (e.g., annualize wages for hourly workers). Employee salary cost is a key component of the total cost of workforce.
Bonus and Incentives Cost includes total bonus/incentive, and other compensation awarded as a bonus or incentive including equity and special award compensation. This field is typically reflected as a full year actual value or is annualized to full year value for forecast and planning purposes. Total bonus and incentives cost is a key component of the total cost of workforce.
Benefits Cost includes paid healthcare such as medical and dental costs, retirement, subsidized meals, transportation, clothes or other equipment, paid time off vacation, paid holidays, paid sick days, and other company paid benefits. This field is typically reflected as a full year actual value or is annualized to full year value for forecast and planning purposes. Total cost of benefits is a key component of the total cost of workforce.
Absence Cost includes the total number of lost work days at an average cost per hour or day whether for paid or unpaid, scheduled or unscheduled, due to absence of all types. Absence Cost includes but is not limited to paid and unpaid vacation days, paid and unpaid sick days, paid and unpaid holidays, paid and unpaid medical, personal, emergency, bereavement or other leaves of absence, paid as well as unscheduled absences or the initial days of job abandonment up to days included in any termination pay. Leaves of absence for training or sabbaticals are excluded from total lost work days and the total cost of absences.
Contingent Workforce Cost includes the total cost of all amounts including compensation paid to non-employees such as temporary workers and contracted workers in the organization. Contracted workers includes all workers whose work is directly controlled by the organization and who work either full time or part time dedicated to the organization.
For example, outsourced IT workers who spend 100% of their time working for a given organization would be considered contracted workers and their total cost (including external vendor fees and markups) would be considered part of contingent worker costs. Outside auditors working with a particular organization would be excluded from contingent worker costs as their work is not directed or controlled by the organization. This field is typically reflected as a full year actual value or is annualized to full year value for forecast and planning purposes. This cost is a key component of the Total Cost of Workforce.
Other Compensation includes all cash based compensation not included in salaries, wages, bonuses, incentives or benefits costs. For example, retention pay, special pay and pay corrections are included in total other compensation. This field is typically reflected as a full year actual value or is annualized to full year value for forecast and planning purposes. Total other compensation cost is a key component of the total cost of workforce.
Total Workforce Cost is a summary total field and typically the largest component of the total cost of workforce and is a total that includes all of the following;
Total Workforce Salary Cost Total Bonus and Incentives Cost Total Benefits Cost Total Cost of Promotions and Salary Increases
Total Other Compensation
HR Costs
Training and Development Cost includes total annual training related costs directly in support of organization training programs anywhere in the organization regardless of whether training is included or controlled in HR cost centers or not. Training costs include all entity training costs except new hire specific on-boarding training.

Human Capital Management Institute 23
Recruiting and On-boarding Cost includes the sum of all direct recruiting costs for the organization in addition to on-boarding or one-time costs associated with orienting and starting new hires with the organization (e.g., orientation and initiation). Such costs may include total or allocated equipment costs such as a new computer, office supplies, etc. Recruiting costs include indirect recruiting costs from any recruiting or talent acquisition departments such as, advertising, testing-assessments, recruiting agency fees, employee recruiting team costs, candidate travel and reimbursements, employee referral awards, relocation and moving costs, and transactional costs.
Employee Relations and Talent Management is defined as the total cost of all employees and related costs, regardless of where they are located in the organization, involved in employee counseling, relations, negotiations, dispute resolution, severance and legal settlements in addition to preventative costs, services and programs to minimize or prevent adverse workforce events. Union relations and company representation to union costs would be included. In some organizations, HR generalists spending a significant amount of time working on employee and union relations issues may be included in this cost.
HR Administration Cost (e.g. Payroll) refers to all costs associated with providing HR services to the organization that may not be split out in separate HR cost centers. Such costs may include project, program and process costs for the following areas within HR; Total Management Cost Total Benefits Program Cost Total Payroll Cost Total HR Information Systems Cost Total Other HR Cost
HR management, compensation and benefits management and administration, payroll services and administration costs, HR personnel transaction processing costs such as internal mobility, HR systems administration as well as other HR costs not included in any other group but which directly relate to providing HR services to the organization.
Total HR Expenses sum of all HR costs listed above, including Training and Development Costs, Recruiting and Onboarding Costs, Employee Relations and Risk Mitigation Costs, and HR Transaction and Administration Costs.
Other Workforce Costs includes all HR costs not included in any other group but which may directly or indirectly relate to providing HR services to the organization. Examples of such costs include costs associated certain aspects of re-organization, acquisition or divestiture as well as certain administrative costs not directly incurred in support of providing HR services such as safety, medical, security, facilities and other costs which may be included in HR controlled cost centers and which indirectly support providing HR services to the workforce.
Total Cost of Workforce (TCOW) is defined as the total of all HR costs, plus salaries, wages direct and indirect cash or equity compensation and benefits for all employees plus all costs for contingent temporary or contract workers when the organization primarily directs the work of such labor. For example, offshore employees who work in a separate legal entity that is 50% or greater controlled by the organization should be included in the total cost of workforce.
TCOW includes all company provided or paid employee benefits, perks and rewards. Such costs may also include all company retirement related costs for both current and former employees. TCOW includes all enterprise HR recruiting, administration, program, employee relations, training and other direct HR costs as part of HR services provided to employees and or contingent labor. All employee relations, severance and legal settlements paid to current and former employees or contingent labor is also includes in TCOW.
In many organizations, the total cost of the workforce is the largest expense and expenditure in the organization but most organizations do not calculate, track, or report this critically important number. Calculating and projecting the total cost of the workforce is a significant step toward truly controlling workforce costs in the organization.

Human Capital Management Institute 24
Part 2: Workforce by Job Category Definitions and Descriptions
This section includes basic information about the total breakdown of the organization’s headcount by the primary workforce categories. In order to achieve consistency in reporting the workforce categories across the organization, it is critical that the proper framework for job and titles are in place. Below is an example of the recommended decision based broad band system provided as part of the HCMI’s job classification structure and system.
Primary Workforce Job Category Descriptions:
Managers and Senior Leadership: Managers include those who oversee and direct the delivery of products, services or functions at group, regional or divisional levels of organizations. They serve at functional, line of business segment or branch levels and are responsible for directing and executing the day-to-day operational objectives of enterprises/organizations, conveying the directions of higher level leadership and managers to subordinate personnel and, in some instances, directly supervising the activities of exempt and non-exempt personnel. Examples of these kinds of managers are vice presidents, directors, regional or divisional controllers, treasurers, human resources, information systems, marketing, and operations managers and includes those who report directly to middle managers. Managers also include first-line managers, team managers, unit managers, operations and production mangers, branch managers, administrative services managers, purchasing and transportation managers, storage and distribution managers, call center or customer service managers, technical support managers and brand or product mangers.
Senior Leadership includes individuals who plan, direct and formulate policies, set strategy and provide the overall direction of enterprises and organizations for the development and delivery of products or services, within the parameters approved by boards of directors or other governing bodies. Residing in the highest levels of organizations, these leaders plan, direct or coordinate activities with the support of subordinate executives and staff managers. They include, in larger organizations, typically those positions within two reporting levels of the CEO, whose responsibilities require frequent interaction with the CEO. Examples of these kinds of managers are: chief executive officers, chief operating officers, chief financial officers, managing directors, line of business heads, presidents or executive vice presidents of functional areas or operating groups, chief information officers, chief human resources officers, chief marketing officers, chief legal officers, management directors and managing partners.
Scientific and Technical Staff (STEM): Most jobs in this category require university bachelor and post-secondary graduate degrees within STEM (Science, Technology, Engineering and Math), and may also require some form of professional certification. In some instances, comparable experience may establish qualifications. Examples of Scientific and Technical Staff positions include but are not limited to research scientists, chemists, computer programmers-developers, information security analysts, engineers, physical scientists, physicians, mathematical scientists, natural scientists, pharmacists, system software developers, database administrators, data architects, data scientists, psychologists, statisticians, dieticians, doctors, and surgeons.
Professional Staff: Most jobs in this category require university bachelor and may require post-secondary graduate degrees outside of STEM (Science, Technology, Engineering and Math), and may also require some form of professional certification. In some instances, comparable experience may establish qualifications. Examples of these kinds of positions include but is not limited to accountants and auditors, attorneys, designers, financial analysts, airplane pilots, architects, artists, designers, dieticians, editors, health professionals, judges, librarians, registered nurses, recruiters, HR professionals, social scientists, teachers, social workers, surveyors and trainers.
Sales Staff: These jobs include non-managerial activities that wholly and primarily involve direct sales. Examples of these types of positions include advertising sales agents, insurance sales agents, real estate brokers and sales agents, wholesale sales representatives, securities, commodities, and financial services sales agents, telemarketers, demonstrators, retail salespersons, counter and rental clerks and cashiers.
Human Capital Management Institute 25
Service Staff: Jobs in this category provide service to and on behalf of with customers whose primary job responsibilities are to provide services to customers. Direct interaction with customers is a secondary responsibility for jobs in this category. Skills may be acquired through formal training, job-related training or direct experience. Examples of these positions include food service workers, call center representatives, technical support representatives, customer facing leisure and hotel workers, membership services representatives, bill and account collectors, cooks, bartenders, hosts, service clerks, hairdressers, ushers, porters, transportation attendants, transit and railroad police, fire fighters, guards, private detectives and investigators.
Specialists and Technicians: Jobs in this category include activities that require specialized knowledge, training and or applied scientific skills, usually obtained by post-secondary education of varying lengths but typically less than a full university bachelor or graduate degree, depending on the particular occupation. In many instances additional training, certification, or comparable experience is required. Examples of these types of positions include drafters, laboratory technicians, emergency medical technicians, chemical technicians, and engineering technicians, financial services lending specialists and broadcast and sound engineering technicians.
Operations Staff: Most jobs in this category include skilled and semi-skilled occupations that touch or make products, typically working in manufacturing or factory setting and operate machines and equipment. Most of these occupations do not usually require more than several months of training. Examples include textile machine workers, laundry and dry cleaning workers, photographic process workers, weaving machine operators, electrical and electronic equipment assemblers, semiconductor processors, testers, graders and sorters, bakers, food processing workers and hand packers and packagers. This category also includes occupations of generally intermediate skill levels that are concerned with operating and controlling equipment and/or documents to facilitate the movement of capital, materials and people such as loan processors, underwriters, quality assurance, document control, sailors, conveyor operators bridge and lock tenders, truck, bus or taxi drivers, industrial truck and tractor (forklift) operators.
Administrative Support Staff: These jobs involve non-managerial tasks providing administrative and support assistance, primarily in office settings. Examples of these types of positions include office and administrative support workers, bookkeeping, accounting clerks, cargo and freight agents, dispatchers, couriers, data entry, computer operators, shipping, receiving and traffic clerks, word processors and typists, proofreaders, desktop publishers and general office clerks.
Laborers and Helpers: Jobs in this category include workers with more limited skills who require only brief training to perform tasks that require little or no independent judgment. Examples include production and construction worker helpers, vehicle and equipment cleaners, laborers, freight, stock and material movers, service station attendants, construction laborers, refuse and recyclable materials collectors, septic tank servicers, cleaners and janitors.
Contingent Staff: A provisional group of workers who work for an organization on a non-permanent basis, also known as freelancers, independent professionals, temporary contract workers, independent contractors or consultants.

Human Capital Management Institute 26
Part 3: Frequently Asked Questions
The Human Capital Disclosure Statement, based on HCMI’s industry-leading Human Capital Financial Statements or HCF$™ framework, is the perfect tool for analyzing and publicly reporting the value and impact of your company’s human capital at little or no cost. Not only does it produce highly insightful key workforce metrics, it proves the ROI of investments its people and human capital management practices and programs using advanced productivity metrics that can drive up a business’s market value.
The Human Capital Disclosure Statement combines measures that show the value created over and above the cost of the workforce - human capital as an asset, not simply a cost - as well as metrics that calculate workforce value creation link to business outcomes in a way that supports and drives your company’s business strategy and results. With metrics required for Sustainability certification*, which are quantifiable links between your workforce and traditional financial measures, the Human Capital Disclosure Statement enables your company to conduct and report on true predictive and prescriptive human capital analytics.
Value Proposition/FAQs
1) What insights does the Human Capital Disclosure Statement deliver to organizations?
Answer: It quantifies and trends shifts in workforce productivity, costs and areas of value creation in the talent management and employee life cycles. They allow organizations to make evidence-based strategic workforce decisions.
2) How can HR use the Human Capital Disclosure Statement as a solution to make data-driven workforce strategy decisions?
Answer: HR can use the Human Capital Disclosure Statement to integrate financials with workforce metrics and quantify the overall bottom line impact of their recruiting, mobility, training, productivity, and retention programs and more. For more on the talent management and employee life cycles listed above, please refer to our Human Capital Financial Statements or HCF$™ framework.
3) Why is the Human Capital Disclosure Statement a critical addition to traditional public financial reporting?
Answer: Human Capital Disclosure Statement quantifies a critical component that traditional financial reporting excludes almost completely: the workforce. In most organizations, the workforce is the largest expense, while at the same time, the greatest asset. The Human Capital Disclosure Statement will provide you with the metrics and methodologies you need to quantify the value and ROI/impact of your human capital.
4) How does the Human Capital Disclosure Statement incorporate and build upon traditional financial measures and metrics?
Answer: The Human Capital Disclosure Statement includes traditional metrics such as Revenue, Profit and Total Expenses. It then calculates those measures on a per FTE basis. In addition, critical workforce metrics that link to financial impact and costs are included, such as Total Cost of Workforce, Human Capital ROI Ratio, and Return on Human Capital Investment.
5) How are the reporting periods in the Human Capital Disclosure Statement defined? How do organizations account for different financial calendars or partial year data?
Answer: Reporting periods can be monthly, quarterly or annually. Typically, organizations report data on an annual basis according to their financial reporting standards. Data for partial periods should always be annualized.

Human Capital Management Institute 27
6) What key human capital metrics are included as part of the Human Capital Disclosure Statement?
Answer: While nearly 170 metrics can be calculated from the Human Capital Disclosure Statement, only a select few metrics might be considered key human capital metrics or Key Performance Indicators (KPIs). While the criticality of metrics varies widely across industries and organizations, a few of the most universal key metrics included in the Human Capital Disclosure Statement are:
Total Cost of Workforce (TCOW), and Total Cost of Workforce per FTE Human Capital ROI Ratio and Human Capital ROI per FTE Return on Human Capital Investment Total Terms or Terminations Total Hires Total Training and Development Cost
7) How is Total Cost of Workforce (TCOW) calculated? What workforce costs are included?
Answer: Total Cost of Workforce is defined as the total of all HR costs, plus salaries, wages direct and indirect, cash or equity compensation and benefits for all employees, plus all costs for contingent temporary or contract workers when the organization primarily directs the work of such labor.
For example, offshore employees who work in a separate legal entity that is 50% or more controlled by the organization should be included in the total cost of workforce. TCOW includes all company provided or paid employee benefits, perks and rewards. Such costs may also include all company retirement related costs for both current and former employees. TCOW includes all enterprise HR recruiting, administration, program, employee relations, training and other direct HR costs as part of HR services provided to employees and or contingent labor.
All employee relations, severance and legal settlements paid to current and former employees or contingent labor is also includes in TCOW. In many organizations, the total cost of the workforce is the largest expense and expenditure in the organization but most organizations do not calculate, track, or report this critically important number. Calculating and projecting the total cost of the workforce is a significant step toward truly controlling workforce costs in the organization.
8) How does training add value? How is the value of training calculated?
Answer: Training and Development costs produce benefits and productivity gains in the future and thus are a source of human capital productivity gain. While training is not capitalized on a balance sheet, it is in many ways similar to certain capitalization-ready assets in financial reporting, the assets are cumulative year-over-year. In fact, training that enables career development is arguably an investment in an appreciating asset, human capital talent. Top performing organizations across many industries invest significantly more in training that average performing organizations.
The value of training is calculated by measuring the total training investment, the number of employees with productivity gains from training, and the total performance differential of employees after training.
9) What is Human Capital ROI Ratio and Return on Human Capital Investment? How are they calculated and how should organizations interpret the results?
Answer: Human Capital ROI Ratio is often used as a definitive profit or productivity contribution by the workforce that essentially shows the return, expressed as a ratio, that one dollar invested in the organization’s workforce provides as a return on investment. For example, an organization with a calculated Human Capital ROI Ratio of 1.2 indicates that, for every $1.00 invested in the cost of the workforce, that $1.20 will be returned by the organization.
Return on Human Capital Investment is a measure of the calculated return to the organization of an additional unit or dollar invested in the workforce. For profitable organizations in which human capital is a significant part of the value creation process, it is generally a number greater than 1.00. Assuming that operating profit is a result of a company’s workforce, this metric shows the return brought about by

Human Capital Management Institute 28
the workforce. This metric trended over time can show the effectiveness of using workforce measures such as total cost of workforce.
10) How does the Human Capital Disclosure Statement account for workforce complexity, such as different job groups and performance levels?
Answer: Besides the headcount figure, the Human Capital Disclosure Statement calculates the overall productivity impact and total cost of workforce (TCOW). To account for workforce complexity, please refer to HCMI’s Human Capital Financial Statements (HCF$™). HCF$™ segments the workforce by primary workforce category, and calculates high performer differentials and a Human Capital ROI ratio for each workforce segment.
11) How does the Human Capital Disclosure Statement show impact across the elements of the employee life cycle?
Answer: The Human Capital Disclosure Statement shows the overall impact of human capital in a Human Capital ROI per FTE metric. To derive the total amount, simply multiply the metric with the Total Headcount (FTE) figure. However, if impact across the elements of the employee life cycle is what you are looking for, HCMI’s Human Capital Financial Statements or HCF$™ framework can link performance across all areas to quantify savings and value creation. These linkages are imputed opportunity costs or actual savings, and provide insight that can drive productivity, performance and workforce optimization.
12) How do organizations complete the Human Capital Disclosure Statement if not all the required data is available?
Answer: Typically, organizations are able to use proxy data to complete certain data elements of the Human Capital Disclosure Statement for which the actual data is unavailable. Please refer to our Statement Advisory and Rapid Implementation Package if you need additional assistance to complete your statement. HCMI is experienced in working with organizations to suggest, identify and calculate proxy data and metrics.