
Human Activity and Forest Degradation Threaten Populations ...
25
Human Activity and Forest Degradation Threaten Populations of the Nigeria–Cameroon Chimpanzee (Pan troglodytes ellioti) in Western Cameroon Chefor Fotang, et al. [full author details at the end of the article] Received: 18 May 2020 /Accepted: 26 November 2020 # The Author(s) 2021 Abstract Increased human activities such as commodity-led deforestation, extension of agricul- ture, urbanization, and wildfires are major drivers of forest loss worldwide. In Camer- oon, these activities cause a loss of suitable primate habitat and could ultimately threaten the survival of chimpanzees (Pan troglodytes). We derived independent estimates of the population size of the Endangered Nigeria–Cameroon chimpanzee (Pan troglodytes ellioti) in Kom-Wum Forest Reserve, Cameroon, and surrounding unprotected forest areas through 1) direct observations, 2) camera trapping, 3) distance sampling, 4) marked nest counts, and 5) standing crop nest counts. In addition, we georeferenced signs of chimpanzee and human activity along line transects. We used a generalized linear mixed model to predict the occurrence of chimpanzees in response to edge length (measured as the perimeter of core forest patches), core area of forest patches (measured as area of forest patches beyond an edge width of 100 m), habitat perforation (measured as the perimeter of nonforested landscape within core forest patches), patch size(measured as area of forest patches), and forest cover. Chimpanzee density estimates ranged from 0.1 (direct observation) to 0.9 (distance sampling) individuals km −2 depending on estimation method with a mean nest group size of 7 ± 5.4 (SD). The mean encounter rate for signs of chimpanzee activity was significantly higher in mature forests (2.3 signs km −1 ) than in secondary forests (0.3 signs km −1 ) and above 1000 m elevation (4.0 signs km −1 ) than below 1000 m (1.0 signs km −1 ). The mean encounter rate for signs of human activity was significantly higher in secondary (8.0 signs km −1 ) than in mature forests (0.9 signs km −1 ). Secondary forests, habitat perforation, and edge length had a significant negative effect on the occurrence of chimpanzee signs. Overall, human activity and forest degradation affected the number of observed chimpanzee signs negatively. Regular antipoaching patrols and reforestation programs in degraded areas could potentially reduce threats to populations of endangered species and may increase suitable habitat area. Keywords Bushmeat hunting . Core areas . Edge length . Forest fragmentation . Forest perforation . Nest counts . Mature forest . Pan troglodytes ellioti . Secondary forest https://doi.org/10.1007/s10764-020-00191-2 Handling Editor: Joanna Setchell /Published online: 19 February 2021 International Journal of Primatology (2021) 42:105–129
Transcript of Human Activity and Forest Degradation Threaten Populations ...

Human Activity and Forest Degradation ThreatenPopulations of the Nigeria–CameroonChimpanzee (Pan troglodytes ellioti) in WesternCameroon
Chefor Fotang, et al. [full author details at the end of the article]
Received: 18 May 2020 /Accepted: 26 November 2020# The Author(s) 2021
AbstractIncreased human activities such as commodity-led deforestation, extension of agricul-ture, urbanization, and wildfires are major drivers of forest loss worldwide. In Camer-oon, these activities cause a loss of suitable primate habitat and could ultimatelythreaten the survival of chimpanzees (Pan troglodytes). We derived independentestimates of the population size of the Endangered Nigeria–Cameroon chimpanzee(Pan troglodytes ellioti) in Kom-Wum Forest Reserve, Cameroon, and surroundingunprotected forest areas through 1) direct observations, 2) camera trapping, 3) distancesampling, 4) marked nest counts, and 5) standing crop nest counts. In addition, wegeoreferenced signs of chimpanzee and human activity along line transects. We used ageneralized linear mixed model to predict the occurrence of chimpanzees in response toedge length (measured as the perimeter of core forest patches), core area of forestpatches (measured as area of forest patches beyond an edge width of 100 m), habitatperforation (measured as the perimeter of nonforested landscape within core forestpatches), patch size(measured as area of forest patches), and forest cover. Chimpanzeedensity estimates ranged from 0.1 (direct observation) to 0.9 (distance sampling)individuals km−2 depending on estimation method with a mean nest group size of 7± 5.4 (SD). The mean encounter rate for signs of chimpanzee activity was significantlyhigher in mature forests (2.3 signs km−1) than in secondary forests (0.3 signs km−1) andabove 1000 m elevation (4.0 signs km−1) than below 1000 m (1.0 signs km−1). Themean encounter rate for signs of human activity was significantly higher in secondary(8.0 signs km−1) than in mature forests (0.9 signs km−1). Secondary forests, habitatperforation, and edge length had a significant negative effect on the occurrence ofchimpanzee signs. Overall, human activity and forest degradation affected the numberof observed chimpanzee signs negatively. Regular antipoaching patrols andreforestation programs in degraded areas could potentially reduce threats topopulations of endangered species and may increase suitable habitat area.
Keywords Bushmeat hunting . Core areas . Edge length . Forest fragmentation . Forestperforation . Nest counts . Mature forest . Pan troglodytes ellioti . Secondary forest
https://doi.org/10.1007/s10764-020-00191-2
Handling Editor: Joanna Setchell
/Published online: 19 February 2021
International Journal of Primatology (2021) 42:105–129

Introduction
Increasing human activities such as commodity-led deforestation, extension of agricul-ture, urbanization, and wildfires are major drivers of forest loss worldwide (Curtis et al.2018). These activities cause habitat loss, fragmentation, and destruction of naturalecosystems (Estrada et al. 2017; Haddad et al. 2015). The effects of forest fragmenta-tion include decreasing patch sizes (larger number of smaller patches), increased edgeeffects (more fragmented landscapes contain more edge for a given amount of habitat),and patch isolation (distance from a patch to its neighbouring habitats; Fahrig 2003).The loss of forest area and isolation of forest fragments can lead to a decrease in theabundance of animal and plant species (Arroyo-Rodríguez and Mandujano 2006;Estrada et al. 1999). Forest mammals and primates in particular are vulnerable to theeffects of forest fragmentation (Arroyo-Rodríguez and Mandujano 2006; Chapman andPeres 2001). While some studies have reported a negative effect of habitat fragmenta-tion on primates (Arroyo-Rodríguez and Dias 2010; Estrada and Coates-Estrada 1996;Estrada et al. 1999), others have reported higher densities of primates in small forestfragments (González-Solís et al. 2001), and some have indicated no changes in primatedensity between forest edge and interior (Bolt et al. 2018). Although some primatesshow flexibility in human dominated landscapes (McLennan et al. 2017), habitat lossand degradation have resulted in a decline of about 75% of the world’s primate species,of which 60% are endangered (Estrada et al. 2017, 2019). This situation makes itcrucial to measure threats to primate populations by determining the population statusand trends in density and distribution (Kühl et al. 2008).
Like populations of many other primate species, populations of chimpanzees (Pantroglodytes) throughout Africa have declined due to habitat loss, habitat degradation,poaching, and disease (Humle et al. 2016; Walsh et al. 2003). These activities aremajor threats to the rarest and least studied chimpanzee subspecies (Morgan et al.2011), the Nigeria–Cameroon chimpanzee, of which ca. 3500 individuals remain in thewild (Morgan et al. 2011). In southwestern Nigeria, agricultural activity, timberextraction, and hunting are major threats to populations of chimpanzees (Ogunjemiteand Dansu 2014). In the Littoral and Southwest regions of Cameroon, the expansion ofoil palm plantation and human population density is associated with permanent de-struction of chimpanzee habitat (Morgan et al. 2011). The loss of chimpanzee habitat incentral Cameroon is driven by uncontrolled burning by cattle grazing herdsmen(Morgan et al. 2011). Illegal timber exploitation, farming, hunting, bush fires, andadvancing pastures are major threats to chimpanzee survival in northwest Cameroon(Doumbé 2014; Morgan et al. 2011). Unlike in the Congo Basin south of the SanagaRiver, which is characterized by lowland rainforests, the range of chimpanzees in theGulf of Guinea is characterized by mountainous rainforest habitat (Abwe et al. 2019;Sesink Clee et al. 2015). Forest type and anthropogenic disturbance influence nest sitelocation (Koops et al. 2012; Last and Muh 2013). Chimpanzees tend to build their nestsin mature forest vegetation (Kamgang et al. 2018), in areas with a low degree of humanpressure (Last and Muh 2013; Njukang et al. 2019) and at high elevations (Njukanget al. 2019).
The current population estimates for the Nigeria–Cameroon chimpanzee are prob-lematic (Hughes et al. 2011), but suggest 1500 chimpanzees survive in Nigeria(Hughes et al. 2011), with the largest population of 900–1000 individuals found in
Fotang C. et al.106

Gashaka–Gumti National Park, Nigeria (Sommer et al. 2004). Ngel Nyaki ForestReserve is home to 12–16 chimpanzees (Beck and Chapman 2008; Dutton 2012)and ca. 400 chimpanzees may survive in Okwango Division of Cross River NationalPark (McManus 2005). From 3000 to 4000 individuals remain in Cameroon (Morganet al. 2011), split into two distinct genetic pools that occupy ecologically and environ-mentally distinct habitats in mountainous rainforest in western Cameroon and forest–woodland–savanna mosaic in central Cameroon (Abwe et al. 2019; Mitchell et al.2015; Sesink Clee et al. 2015). Strongholds for chimpanzees in Cameroon include Eboforest, with 626–1480 individuals (Ndimbe et al. 2016), Mbam and Djerem NationalPark with more than 500 individuals (Greengrass and Maisels 2007; Kamgang et al.2018; Maisels et al. 2009), and Banyang-Mbo Wildlife Sanctuary with 800–1450individuals (Greengrass and Maisels 2007). Tubah-Awing Forest and Kom-WumForest Reserve in the Northwest Region also harbor chimpanzees and have beenproposed as a multisite protected area, affording appropriate legal status for theremaining wildlife and forest resources (Morgan et al. 2011). As indicated by thepublication dates, several of these estimates may be outdated.
In the past two decades, research and conservation efforts for chimpanzeeshave focused on populations in continuous forests such as Gashaka GumtiNational Park (Fowler and Sommer 2007; Sommer et al. 2004), Ebo forest(Abwe et al. 2019, 2020; Abwe and Morgan 2008), Lebialem complex–Banyang Mbo (Greengrass and Maisels 2007), Mbam & Djerem National Park(Abwe et al. 2019, 2020; Kamgang et al. 2018), and forests northwest of theSanaga River and Takamanda–Mone–Mbulu (Funwi-Gabga et al. 2014). Onlyrecently have some populations in fragmented habitats received attention in NgelNyaki Forest Reserve in Nigeria (Beck and Chapman 2008; Dutton 2012; Duttonand Chapman 2015a, b; Dutton et al. 2016; Knight et al. 2016), Babanki–FingeForest (Doumbé 2014), Fungom Forest Reserve, and Kom-Wum Forest Reservein Cameroon (Chuo et al. 2017; Doumbé 2015; Fotang 2018).
The IUCN-endorsed regional conservation action plan for chimpanzees outlinedmeasures and strategies to prevent further population decline (Morgan et al. 2011).Kom-Wum Forest Reserve is described as a priority conservation site in the plan with afocus on surveys to confirm chimpanzee presence and estimate population size(Morgan et al. 2011). An initial survey in Kom-Wum Forest Reserve used trails madeby local people to access the reserve and found 458 chimpanzee nests (Doumbé 2015).A subsequent survey used the reconnaissance method to estimate chimpanzee abun-dance and anthropogenic activities and found 11.3 chimpanzee signs per km and 1.19anthropogenic signs per km (Chuo et al. 2017). The main objectives of our study wereto 1) determine the population size of chimpanzees in Kom-Wum Forest Reserve andsurrounding forests using five independent methods, 2) understand habitat preferencesin relation to forest type (mature vs. secondary forest) and elevation (above and below1000 m, following Koops et al. 2012 and close to midpoint for the study area) in thestudy area, and 3) investigate the effect of human activity on the relative density ofchimpanzees in the study area. We hypothesized that human activities and forestdegradation reduce chimpanzee abundance (Bryson-Morrison et al. 2017; Morganet al. 2018). Thus, we predicted that the encounter rate of chimpanzee signs is lowerin secondary than in mature forests, that the encounter rate for chimpanzee signs ishigher in the reserve than surrounding forest that are subject to more anthropogenic
Human Activity and Forest Degradation Threaten Populations of the... 107

pressure, and that parts of the reserve with higher elevation would have more chim-panzee signs compared to those with lower elevation.
Methods
Study Area
Kom-Wum Forest Reserve was created in 1951 and spans two administrative units:Boyo and Menchum Divisions in the northwest of Cameroon (Fig. 1a; latitude 6° 9'39.47"N and longitude 10° 13' 9.16"E to latitude 6° 19' 39.42"N and longitude 10° 13'3.93"). Extending to 565–1640 m above sea level in elevation (Fig. 1c), the 80 km2
Kom-Wum Forest Reserve is covered by submontane tropical forest that spreads overan undulating and picturesque landscape (Sunderland and Mannaseh 2003). Thetemperature ranges from 15°C to 38°C with a mean yearly rainfall of ca. 2400 mmand humidity of 82% (PNDP 2011). The area has two distinct seasons, a wet season(mid-March to mid-October) and a dry season (mid-October to mid-March).
In addition to chimpanzees, Kom-Wum Forest Reserve harbours six diurnal and sixnocturnal primate species (Chuo et al. 2017; Doumbé 2015; Fotang 2018). Amongthese species, two are endangered (EN) and 11 are least concern (LC). The diurnalmonkey species include putty-nosed monkey (Cercopithecus nictitans ludio, LC),mona monkey (Cercopithecus mona, LC), olive baboon (Papio anubis, LC), tantalusmonkey (Chlorocebus tantalus, LC), patas monkey (Erythrocebus patas, LC), andPreuss’s monkey (Allochrocebus preussi, EN). The nocturnal primate species areThomas's dwarf galago (Galagoides thomasi, LC), Demidoff’s dwarf galago(Galagoides demidoff, LC), Northern needleclawed galago (Euoticus pallidus, LC)and Allen’s galago (Sciurocheirus alleni, LC), Milne-Edward’s potto (Perodicticusedwardsi, LC), and Calibar angwantibo (Arctocebus calabarensis, LC), which areprotected entirely in Cameroon and restricted to West Cameroon and East Nigeria(Doumbé 2015). The presence of some mammals (red duiker [Cephalophus dorsalis,LC], bushbuck [Tragelaphus scriptus, LC], red river hogs [Potamochoerus porcus,LC], and white-bellied pangolin [Phataginus tricuspis, EN]) and birds (Bannerman’sturaco [Tauraco bannermani, EN], blue turaco [Corythaeola cristata, LC], andblackcasqued wattled hornbill [Ceratogymna atrata, LC)]) have been verified(Fotang 2018).
Kom-Wum Forest Reserve encompasses the village communities of Mughom andBueni in the south and borders the village communities of Bu, Mbengkas, Baiso, andMbongkissu (Fig. 1b and c). These local communities rely on forest resources for theirlivelihood (Kah 2015).
Sampling
Satellite Images and Digital Elevation Models We obtained a satellite image (Landsat8, 30 m pixel) for February 9, 2017 from the United States Geological Survey toproduce a land cover map of the study area. We derived the elevation of the study zonefrom a Shuttle Radar Topography Mission 30 m resolution Digital Elevation Modeland superimposed this on the land cover map (Fig. 1c). We classified land cover as
Fotang C. et al.108

mature forest, secondary forest, grassland, and water bodies using supervised classifi-cation and the maximum likelihood algorithm in ArcGIS version 10.6 (Ganasri andDwarakish 2015) as recommended in Enoguanbhor et al. (2019). We imported the landcover types to the Landscape Fragmentation Tool in ArcGis (Vogt et al. 2007). Weincluded mature and secondary forests in the forest class and grassland and waterbodies in the nonforest class (Vogt et al. 2007). We used an edge-width of 100 m tofurther classify forest into edge, core, perforated, and patch (Vogt et al. 2007). Wegenerated georeferenced square plots 2 km × 2 km in ArcGIS 10.6.1 and superimposedthem on satellite images of the study zone (Fig. 1b). For each square we calculatedpercentage forest cover, edge length, core area of forest patches, patch size, and forestperforation using the geometric landscape tool in ArcGIS. We measured edge length asthe perimeter of core forest patches, core area of forest patches as forest area beyond theedge width of 100 m, perforated as the perimeter of nonforested landscape within coreforest patches, and patch size as area of forest patches. We used data collected during
Fig. 1 Maps of (a) Cameroon and the study location Kom-Wum Forest Reserve in northwest Cameroon (redpoint), (b) Kom-Wum Forest Reserve including major villages with line transects for surveys (1–23) andlocation of camera traps, and (c) line transects and elevation (May 15 to September 23, 2018).
Human Activity and Forest Degradation Threaten Populations of the... 109

the survey (May–September 2018) to confirm the Geographical Information SystemClassification as recommended by Congalton (1991).
Survey Techniques and Design We conducted fieldwork between 15 May and 23September 2018 using 1) direct observation, 2) camera trapping, 3) distance sampling,4) marked nest count, and 5) standing crop nest count. We chose this integratedapproach to overcome the known limitations of single methods (Howe et al. 2017).We selected the nest count method based on the fact that chimpanzees in Kom-WumForest Reserve were not habituated and thus were extremely difficult to observe in thewild (Plumptre and Reynolds 1996). We used camera trapping to increase the proba-bility of detecting chimpanzees (Rovero and de Luca 2007; Rovero et al. 2010). Weestablished line transects following a recce-transect survey conducted in this area (Chuoet al. 2017). We sampled the georeferenced square grids of 2 km × 2 km with transects.In total, we superimposed 23 systematic, equally spaced (1000 m) line transects (each2 km long with a random start) across 23 grids (92 km2) in the study zone (Bucklandet al. 2001). We generated the starting point of each transect using a random numbertable. We oriented line transects in the northwest–southeast direction perpendicular tothree rivers that flow through the reserve. We considered transects in grids at the borderas inside the reserve if the surface area of the grid within the reserve boundaries was>50% of the surface area of a full grid cell. We surveyed all transects assuming that wedetected chimpanzee nests on the transect line with certainty, and that we measureddistances from the center of the nest to the line transect correctly (Buckland et al. 2001).
In the field, we identified the starting point of each predetermined line transect fromthe land cover map and the position of wildlife cameras using a GARMIN GPSMAP64s device. We installed one LTL-5310A Acorn wildlife camera in each of 10 gridsthat contained at least one chimpanzee nest group along frequently used chimpanzeepaths and feeding or tool use sites (Fig. 1b). We programmed cameras to operate 24 h aday and to take one photograph and then continue taking a video for 60 s at a resolutionof 1080 pixels at a height 30–80 cm above the ground. The survey team checkedcamera traps to replace SD cards and batteries during transect visits. We left cameratraps at their locations if a chimpanzee was photographed and moved them to a newposition if no images of a chimpanzee were obtained (Rovero et al. 2010). We replaceddefective cameras that contained pictures of chimpanzees in two grids with functionalcameras from two grids that did not photograph chimpanzees.
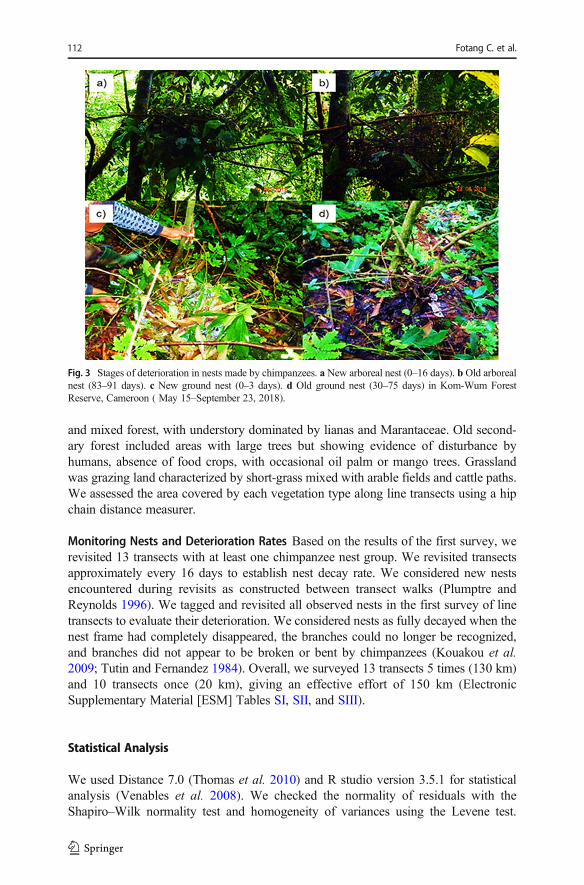
We recorded signs of chimpanzee presence during transect surveys, including nests,sightings, vocalizations, feeding signs, footprints, feces, and tool use sites (Fig. 2a). Werecorded signs of human-related activity including hunting, farming, logging, livestockgrazing, and collection of nontimber forest products (Fig. 2b). In the survey, we defineda nest as a structure with visible twigs that appear to be broken or bent inwards bychimpanzees (Tutin and Fernandez 1984). We distinguished arboreal (night or day) andground (night or day) nests (Fig. 3). We considered a nest as “arboreal night” if it waselaborately constructed, with a circular thick cushion-like support, and sometimes withfeces beneath and as “arboreal day” if it was poorly constructed, with weak-cushioningsupport (Fruth and Hohmann 1996). We considered nests as “ground night” if theywere well constructed, contained chimpanzee hair, and were in the vicinity of otherarboreal nests (Furuichi and Hashimoto 2000; Koops et al. 2007). Ground day nestswere simple weak cushion-like constructions made up of an assemblage of leaves that
Fotang C. et al.110

contained chimpanzee hair (Boesch 1995). We assumed all nests we encounteredduring the survey were constructed by chimpanzees because gorillas do not occur inthis forest (Chuo et al. 2017; Doumbé 2015).
We defined nest age following Tutin and Fernandez (1984). We considered nests ofthe same age class within a radius of 50 m of each other as belonging to the same group(White and Edwards 2000). We recorded the GPS location, nest group size, perpen-dicular distance to the transect, and age class of nest for all nests. We classifiedvegetation type as mature forest, old secondary forest, or grassland (White andEdwards 2000). Mature forest consisted of mixed forest with many large trees, highcanopy cover, and sparse vegetation cover on the ground, consisting mostly of shrubs
Fig. 2 Encounter rate classes for signs of (a) chimpanzee and (b) human activity during a survey in Kom-Wum Forest Reserve, Cameroon (May 15–September 23, 2018).
Human Activity and Forest Degradation Threaten Populations of the... 111
and mixed forest, with understory dominated by lianas and Marantaceae. Old second-ary forest included areas with large trees but showing evidence of disturbance byhumans, absence of food crops, with occasional oil palm or mango trees. Grasslandwas grazing land characterized by short-grass mixed with arable fields and cattle paths.We assessed the area covered by each vegetation type along line transects using a hipchain distance measurer.
Monitoring Nests and Deterioration Rates Based on the results of the first survey, werevisited 13 transects with at least one chimpanzee nest group. We revisited transectsapproximately every 16 days to establish nest decay rate. We considered new nestsencountered during revisits as constructed between transect walks (Plumptre andReynolds 1996). We tagged and revisited all observed nests in the first survey of linetransects to evaluate their deterioration. We considered nests as fully decayed when thenest frame had completely disappeared, the branches could no longer be recognized,and branches did not appear to be broken or bent by chimpanzees (Kouakou et al.2009; Tutin and Fernandez 1984). Overall, we surveyed 13 transects 5 times (130 km)and 10 transects once (20 km), giving an effective effort of 150 km (ElectronicSupplementary Material [ESM] Tables SI, SII, and SIII).
Statistical Analysis
We used Distance 7.0 (Thomas et al. 2010) and R studio version 3.5.1 for statisticalanalysis (Venables et al. 2008). We checked the normality of residuals with theShapiro–Wilk normality test and homogeneity of variances using the Levene test.
Fig. 3 Stages of deterioration in nests made by chimpanzees. a New arboreal nest (0–16 days). b Old arborealnest (83–91 days). c New ground nest (0–3 days). d Old ground nest (30–75 days) in Kom-Wum ForestReserve, Cameroon ( May 15–September 23, 2018).
Fotang C. et al.112

We compared encounter rates of chimpanzee and human activity signs between foresttype (mature versus secondary forest), elevation (above vs. below 1000 m), andlocation of transects (inside vs. outside reserve boundaries) based on Cohen’s d as ameasure of effect size and the Wilcoxon rank-sum test (Ho et al. 2019). We usedmultiple regression (Kim 2019) to test the effect of human activity (logging, farming,grazing, and harvesting of nontimber forest products) on the encounter rate of chim-panzee signs in the reserve. We used a generalized linear mixed-effect regression model(Baayen et al. 2008), with binomial family to predict the effect of edge length, habitatperforation, patch size, and forest covers (mature and secondary forests) on theprobability of chimpanzee occurrence. We used locations with signs of chimpanzeepresence (direct sightings, nests, dung, or tool use sites) to extract presence pixelvalues. We produced chimpanzee absence points (background pixel values) using100 randomly generated points from each grid containing a chimpanzee point. Weused Pearson correlation to test the correlation between predictors in regressionanalyses.
Direct Observations and Camera Trapping
We based direct observation of chimpanzees on groups, not individuals (Kühl et al.2008). We estimated the relative abundance index (RAI, Eq. 1) from camera trap dataas the number of photographs per 100 trap days (O'Brien et al. 2003). We consideredphotographs of chimpanzees as independent if the time between two consecutivephotographs was longer than 30 min (O'Brien et al. 2003). We considered photographswith one or more chimpanzee individuals as single independent photographs (Jenkset al. 2011). We defined a trap day as a camera trap installed at a single location for24 h and the total number of trap days as the sum of trap days for all camera traps minusthe days that cameras were defective or ran out of batteries. We noted the date, time,and number of individuals for each camera event.
The equation for the Relative Abundance Index (RAI) is
RAI ¼ Sum of all independent photographs of chimpanzees for all cameras � 100
Total number of camera trap days Number of cameras� number of days cameras are operationalð Þ� �
RAI ¼ 9 � 100
5� 126ð Þ� �
¼ 1:4 per 100 days of camera trapping
ð1Þ
Density, Distance Sampling, Standing Crop Nest Count, and Marked Nest Count
We considered all nests (N = 271) in standing crop nest count (SCNC) analysis, as itidentifies nest decay rate (Plumptre and Reynolds 1996) but only nests encounteredduring the first transect survey (N = 158) for distance sampling analysis. Weselected this approach to allow comparison of distance sampling results to previousstudies that used the same approach. We used only new nests encountered duringthe intersurvey period (N = 113) for marked nest count (MNC) analysis (Plumptreand Reynolds 1996). We tested several models in distance analyses and considered
Human Activity and Forest Degradation Threaten Populations of the... 113

the model with the lowest Akaike information criterion (AIC) as the best model(Buckland et al. 2001). We based the analysis on single nest observations becausewe encountered fewer nest groups (N = 59) than required to provide a reliableestimate in Distance (N = 60). We used the effective strip width of all transects (ascalculated in distance sampling) to estimate nest density in the SCNC and MNCmethods. We converted nest density estimates to density of chimpanzees by apply-ing the formula: Dind = Nall nests /2Lw (prt), for SCNC, where Dind is the number ofindividual, N is the number of nests observed along transect, w is effective stripwidth of transect, L is the transect length (in km), p is the proportion of nest buildersin the population, r is the rate of nest production per individual per day, and t is thenest decay time (Ghiglieri 1984). When using the marked nest count method, theformula becomes Dind = Nnewnest/2Lw (pri), where Nnewnest is the number of newnests (fresh and recent nests) constructed during the intersurvey period, i is theintersurvey period, and the other parameters remain the same as in the SCNCformula (Buckland et al. 2001; Hashimoto 1995; Plumptre and Reynolds 1996).We obtained densities by correcting for factors such as nest decay rate (estimated inthis study) for distance sampling and SCNC, the proportion of nest builders in thepopulation (0.83) following Plumptre and Cox (2006) and the nest production rateper individual per day (1.09) following Morgan et al. (2006) and Plumptre andReynolds (1996). We obtained population sizes by extrapolating chimpanzee den-sity estimates to the total forest area of 92 km2.
Chimpanzee and Human Activity Signs
We calculated encounter rates (number of observations/km) as the total number of signsencountered (N) divided by the total length of the transect (L) in km (Mathot andDoucet 2005). We calculated encounter rates for signs of chimpanzee and humanactivity. We defined encounter rate classes and assigned values for each transect. Weimported the encounter rate classes into ArcGIS software (ArcMap 10.6.1, ESRI) andassigned different colour bands to different encounter rate classes (no observation =0.0; few observations = 0.1–2.9; many observations >3). Finally, we created spatialdistribution maps with different colour bands representing the relative density ofchimpanzee and human activity.
Ethical Note
This research respected the principles for research on nonhuman primates outlined inthe American Society of Primatologists manual for the ethical handling of primates.The research permits to conduct this research were obtained from the Ministry ofScientific Research and Innovation in Cameroon. The authors declare that they have noconflict of interest.
Data availability The datasets generated and/or analyzed during the current studyare not publicly available in an attempt to protect the species in the study area;however, these can be made available from the corresponding author byreasonable request.
Fotang C. et al.114

Results
Density, Direct Observations, and Camera Trapping
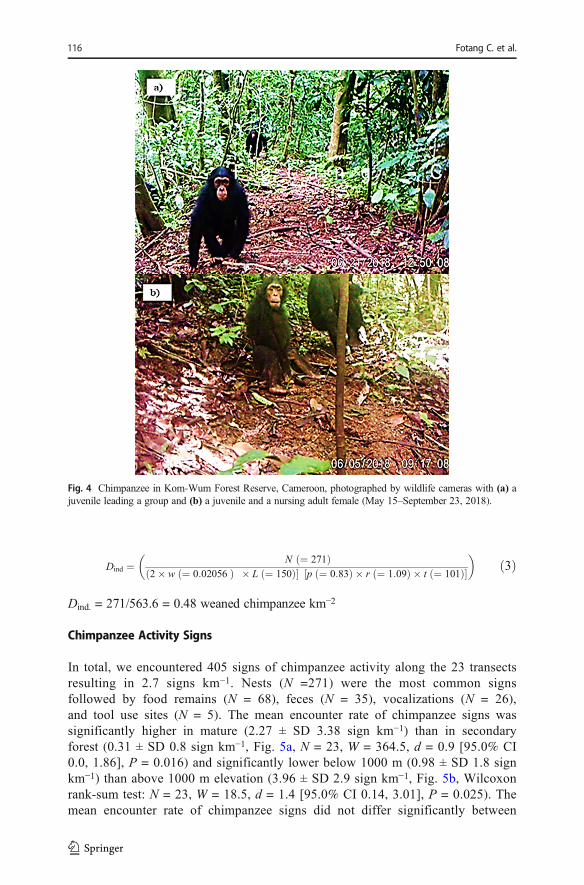
In total, we counted 271 nests along 23 transects that we surveyed repeatedlyover 131 days, for a total survey effort of 150 km. The mean nest group size was7.0 ± 5.4 (SD, range 2–22). We found 22 fresh nests and fresh chimpanzee fecesat a single location, suggesting that the chimpanzee group left the site a fewminutes prior to the visit and slept in the nests overnight. We sighted chimpan-zees five times (5 groups, 0.03 groups km−1) during the survey and themaximum group size we observed directly was ≥10 individuals. We estimatedchimpanzee density at 0.1 individuals km−2 through direct observation, with amaximum group size of 10 chimpanzees in 92 km2 of the forested area. Cameratraps obtained nine independent photographs of chimpanzees (Fig. 4). Thenumber of individuals in independent photographs or videos ranged from 2 to9. The relative abundance index of chimpanzees was 1.4 individuals for 100 daysof camera trapping (Eq. 1). The largest photographed group of nine chimpanzeeswas two adult females each carrying offspring, two weaned juveniles, one adultmale, and two adults whose sex we could not determine.
Nest Decay Rates
We obtained a mean decay time of 101.0 ± 25.5 (SD) days and an intersurveyperiod of 64 days by monitoring 7 ground nests and 28 arboreal nests from thebeginning of the study until all nests decayed completely. All 7 ground nests haddecayed completely within 75 days while the 28 arboreal nests decayedcompletely after 126 days (Fig. 3).
Density, Distance Sampling, SCNC, and MNC
The half-normal + cosine adjustment model gave the best fit in distance sam-pling with the lowest AIC value. Chimpanzee densities were 0.9 individualskm−2 using distance sampling (Table I). Mean nest densities were 21.1 km−2 forMNC and 44.0 km-2 SCNC analysis. When corrected for an intersurvey period of64 days and nest decay rate of 101 days, chimpanzee densities were 0.4 km−2 forMNC and 0.5 individuals km−2 for SCNC methods (Eqs. 2 and 3). Distancesampling produced the largest nest density per km−2 while MNC produced thelowest, resulting in large variability in estimated population sizes in Kom-WumForest Reserve (Table I).
The MNC equation for transects 1, 2, 3, 5, 6, 9, 10, 16, 18, and 19 is
N newnest ¼ 113ð Þ2� w 0:02056ð Þ � L 130ð Þð �= p ¼ 0:83ð Þ � r ¼ 1:09ð Þ � i ¼ 64ð Þ½ �
� �ð2Þ
Dind. = 113/309.5 = 0.37 weaned chimpanzee km−2
The equation for SCNC for all transects is
Human Activity and Forest Degradation Threaten Populations of the... 115
Dind ¼ N ¼ 271ð Þ2� w ¼ 0:02056ð Þ � L ¼ 150ð Þð � p ¼ 0:83ð Þ � r ¼ 1:09ð Þ � t ¼ 101ð Þ½ �
� �ð3Þ
Dind. = 271/563.6 = 0.48 weaned chimpanzee km−2
Chimpanzee Activity Signs
In total, we encountered 405 signs of chimpanzee activity along the 23 transectsresulting in 2.7 signs km−1. Nests (N =271) were the most common signsfollowed by food remains (N = 68), feces (N = 35), vocalizations (N = 26),and tool use sites (N = 5). The mean encounter rate of chimpanzee signs wassignificantly higher in mature (2.27 ± SD 3.38 sign km−1) than in secondaryforest (0.31 ± SD 0.8 sign km−1, Fig. 5a, N = 23, W = 364.5, d = 0.9 [95.0% CI0.0, 1.86], P = 0.016) and significantly lower below 1000 m (0.98 ± SD 1.8 signkm−1) than above 1000 m elevation (3.96 ± SD 2.9 sign km−1, Fig. 5b, Wilcoxonrank-sum test: N = 23, W = 18.5, d = 1.4 [95.0% CI 0.14, 3.01], P = 0.025). Themean encounter rate of chimpanzee signs did not differ significantly between
Fig. 4 Chimpanzee in Kom-Wum Forest Reserve, Cameroon, photographed by wildlife cameras with (a) ajuvenile leading a group and (b) a juvenile and a nursing adult female (May 15–September 23, 2018).
Fotang C. et al.116

areas outside (3.31 ± SD 3.0 sign km−1) and inside the reserve boundaries (1.08± SD 1.8 sign km−1, Fig. 5c, Wilcoxon rank-sum test: N = 23, W = 28.5, d =−0.97 [95.0% CI −2.37, 0.13], P = 0.060).
Table I Density estimates for chimpanzees in Kom-Wum Forest Reserve, Cameroon, using three methods(May 15–September 23, 2018)
Parameters Distance sampling Marked nest count Standing crop nest count
Number of nests 158 113 271
Distance (km) 46 130 150
Strip width (km) 0.02 0.02 0.02
Decay time/intersurvey period (days)a 101 64 101
Proportion of nest buildersa NA 0.83 0.83
Nest density (km−2 ) 80.4 24.9 43.9
Chimpanzee density (km−2 ) 0.94 0.37 0.48
Chimpanzee 83 37 46
a Proportion of nest builders in the population from Plumptre and Cox (2006) and nest construction rate perday from Plumptre and Reynolds (1996).
Fig. 5 Gardner–Altman estimation plots for mean encounter rates of chimpanzee signs in (a) secondary andmature forest, (b) low and high elevation, and (c) outside and inside Kom-Wum Forest Reserve, Cameroon(May 15–September 23, 2018). In each panel, empirical data for both groups are plotted on the left axis; meanCohen’s d is represented as a dot and horizontal line on the right axis; vertical error bars represent bootstrap95% confidence interval together with the resampling distribution from 5000 resamples.
Human Activity and Forest Degradation Threaten Populations of the... 117

Encounter Rates of Human Signs Overall, we encountered 271 human signs along the23 transects. Hunting (N =142) was the most common sign, followed by farming (N =52), logging (N = 41), grazing (N = 22), and collection of nontimber forest products (N= 14). The encounter rate of human activities was 1.81 signs km−1. Common signs ofhunting included snares, cartridge cases, hunting camps, and traps. The mean encounterrate of human signs was significantly lower in mature (0.94 ± SD 2.14 sign km−1) thanin secondary forest (8.02 ± SD 13.55 sign km−1, Fig. 6a, Wilcoxon rank-sum test: N =23, W = 358, d = −7.09 [95.0% CI −15.3, −3.2], P = 0.029). The mean encounter ratesof human signs did not differ significantly between elevations (above 1000 m: 1.4 ± SD1.61 signs km−1; below 1000 m: 5.58 ± SD 5.39 signs km−1, Fig. 6b, Wilcoxon rank-sum test: N = 23, W = 27.5, d = −0.901 [95.0% CI −1.53, −0.364], P = 0.204) orbetween areas outside (1.54 ± SD 2.5 sign km−1) and inside the reserve (5.28 ± SD 5.4sign km−1, Fig. 6c, Wilcoxon rank-sum test: N = 23, W = 80, d = 0.79 [95.0% CI0.0732, 1.38], P = 0.057).
Human activity significantly affected the encounter rate of chimpanzee signs (N =23, R2 = 0.21, df = 20, d = −0.65 [95.0% CI −1.15, −0.07], P = 0.036). Hunting had asignificant negative effect on the encounter rate for signs of chimpanzees, whileharvesting of nontimber forest products had no significant effect (Table II). Theoccurrence of chimpanzee signs was negatively related to secondary forest (P <0.001), habitat perforation (P < 0.001), and the edge length (P < 0.001) and positivelyrelated to core areas (P < 0.001).
Discussion
We estimated 10 (direct observation) to 83 (distance sampling) chimpanzees in thestudy area using the different methods. Signs of chimpanzee activity were significantlymore common in mature forests than in secondary forest and at an elevation >1000 mthan at <1000 m. The frequency of chimpanzee signs decreased with increasing humanactivity, particularly hunting. Secondary forest cover, habitat perforation, and edgelength negatively affected the occurrence of chimpanzee signs while core area had apositive effect. Using several methods to estimate chimpanzee density facilitated theassessment of the state of chimpanzee populations. The results are alarming, as mostdensity estimates from this study are the lowest in the published literature (Table III;with the exception of distance sampling). This estimate of the population size of thechimpanzees in Kom-Wum Forest Reserve, coupled with previous integrated assess-ments in Ngel Nyaki Forest Reserve in Nigeria (Dutton 2012), highlight the urgentneed to take action to conserve this subspecies in fragmented habitats.
Chimpanzee Density
In contrast to the five chimpanzee groups seen during the present study, previoussurveys encountered one or two groups in Kom-Wum Forest Reserve (Chuo et al.2017; Doumbé 2015). Our sampling effort (150 km) was higher than in previoussurveys (46 km), but our encounter rate of chimpanzee groups (0.03 groups km−1)was similar to that in previous studies (0.02 groups km−1). This suggests that the group
Fotang C. et al.118

sizes of chimpanzees observed directly are similar across studies and that thepopulation may be stable since the first survey in 2015. Sampling effort couldtherefore be reduced in future studies.
The number of independent photographs captured by camera traps (N = 9) washigher than the number of direct observations of chimpanzees (N = 5). We could alsoidentify the sex of a few chimpanzee individuals from camera trap footage. The relativeabundance of chimpanzees estimated in our study was close to estimates for the centralchimpanzee (Pan troglodytes troglodytes) in the northern sector of Dja Faunal Reservein Cameroon (Bruce et al. 2018). A similarity in the habitat of both reserves (rainforest)can explain the closeness of these results: lowland montane rainforest for Kom-Wum
Fig. 6 Gardner–Altman estimation plots of mean encounter rates of human signs in (a) secondary and matureforest, (b) low and high elevation, and (c) outside and inside Kom-Wum Forest Reserve, Cameroon (May 15–September 23, 2018). In each panel, empirical data for both groups are plotted on the left axis; mean Cohen’s dis represented as a dot and horizontal line on the right axis; vertical error bars represent bootstrap 95%confidence interval together with the resampling distribution from 5000 resamples.
Table II Estimated coefficients and standard errors for a model using human activity signs to predictchimpanzee activity in Kom-Wum Forest Reserve, Cameroon (May 15– September 23, 2018)
Coefficients Estimate Standard error t P
(Intercept) 3.00 0.64 4.69 <0.001
Hunting −0.56 0.24 −2.29 0.033
Nontimber forest product collection −0.65 0.80 −0.81 0.425
Human Activity and Forest Degradation Threaten Populations of the... 119

Forest Reserve (Sunderland and Mannaseh 2003) and lowland rainforest for Dja FaunalReserve (Abwe et al. 2019; Sesink Clee et al. 2015).
Estimates of nest decay time needed for additional density methods indicated 101days for total decay, which is lower than estimates from Ngel Nyaki Forest Reserve inNigeria (Dutton 2012). Ground nests decayed considerably faster than arboreal nests.Ground nests are often poorly constructed, since they are usually used temporarilyduring the day for resting (Brownlow et al. 2001; Koops et al. 2007). Site-specificdifferences are not surprising given that nest decay times vary over space and time andwith sample period, tree species, forest type, nest height and position, soil pH, andaverage rainfall (Ancrenaz et al. 2004; Buij et al. 2003; Johnson et al. 2005; Kouakouet al. 2009; Marshall et al. 2007; Mathewson et al. 2008; van Schaik et al. 1995; Walshand White 2005).
The density estimate for chimpanzees based on distance sampling was the onlyestimate that was higher than previously derived densities for chimpanzees (Kamganget al. 2018). Density estimates based on the SCNC and MNC methods were lower thanall previously published results. The higher densities of chimpanzees in Ngel NyakiForest Reserve could be a result of the reserve’s small size (7 km2) (Beck and Chapman2008; Dutton 2012) compared to Kom-Wum Forest Reserve (80 km2). The higherestimated densities for the Western chimpanzee (Pan troglodytes verus) in Taï NationalPark is probably due to the presence of large undisturbed remnants of primary tropicalforest (Boesch and Boesch-Achermann 2000; Kouakou et al. 2009). Generally, densityestimates of 0.1–0.9 chimpanzee km−2 in this study fall within the ranges for sites ofcentral chimpanzees in Cameroon (0.1–1.2 km−2) (Ngalla et al. 2005) and of otherpopulations of chimpanzees across West Africa (0.2–2.0 km−2) (Kormos et al. 2003).
Table III Densities of chimpanzees across study sites (May 15 to September 23, 2018, for this study only)
Study site Country Decay Method Density Reference
rates (days) (km−2, RAI) ± 95% CI
KWFR Cameroon — CT 1.43 This study
DFR Cameroon — CT 1.61(0.77–2.9) Bruce et al. (2018)
KWFR Cameroon — DO 0.12 This study
GGNP Nigeria — DO 1.3 Sommer et al. (2004)
NNFR Nigeria — DO 1.5 Dutton (2012)
KWFR Cameroon 101 DS 0.94 (0.50–1.77) This study
NNFR Nigeria 168.48 DS 0.33 Dutton (2012)
KWFR Cameroon — MNC 0.37 This study
NNFR Nigeria — MNC 1.67 Beck and Chapman (2008)
NNFR Nigeria — MNC 0.69 Dutton (2012)
KWFR Cameroon 101 SCNC 0.48 This study
MDNP Cameroon 88 SCNC 0.88 (0.55–1.41) Kamgang et al. (2018)
NNFR Nigeria 168.48 SCNC 1.5 Dutton (2012)
Camera trapping, Direct observation, Distance sampling, Dja Faunal Reserve, Kom-Wum Forest Reserve,Gashaka–Gumti National Park, Mbam Djerem National Park, Ngel Nyaki Forest Reserve
Fotang C. et al.120

Nest decay time and season may have influenced the results of the SCNC (0.5chimpanzee km−2 , 43 individuals) and distance sampling approaches (0.9 chimpanzeekm−2, 83 individuals) as both rely on nest decay time to estimate chimpanzee density(Mathewson et al. 2008; Tutin et al. 1995). The result of the MNC technique (0.4chimpanzee km–2, 37 individuals) was comparable to the 10 chimpanzees directlyobserved and the largest nest group size (22 nests) encountered during our survey.Subsequent surveys in Kom-Wum Forest Reserve should consider using the MNCtechnique, since it is not biased by estimated nest decay rates and is sensitive indetecting changes in density, movement, and seasonal habitat use (Buij et al. 2003;Devos et al. 2008). The survey period should include data from the dry season forSCNC and distance sampling methods to accurately estimate average nest decay timesin the dry season. The SCNC method is cheaper, requires less labour, and will produceaccurate estimates if the nest decay time is properly calculated (Kouakou et al. 2009).However, other parameters such as elevation, wood density, and soil pH should beconsidered when employing the SCNC method (Buij et al. 2003; van Schaik et al.1995). Each method has strengths and weaknesses and is applicable under certainconditions (Vink et al. 2020). Overall, 10–83 chimpanzees live in the study areadepending on the estimation method.
Chimpanzee Activity
The observed encounter rate for chimpanzee signs (2.7 signs km−1) wasconsiderably lower than rates previously reported for this study area (Chuoet al. 2017), but there were differences in activity signs between habitat types.We found higher encounter rates in mature forest at higher elevation. At TofalaHill Wildlife Sanctuary, chimpanzees also nest more frequently in mature veg-etation at higher elevations (800–1000 m; Njukang et al. 2019). At Babanki–Finge forest in Cameroon, a majority of nests were recorded in dense vegetationat 500–2300 m (Doumbé 2014). At Mbam and Djerem National Park in Cam-eroon, chimpanzees preferred dense habitats at higher elevation (Kamgang et al.2018). Similar results were recorded from Seringbara, Nimba Mountains in theRepublic of Guinea, where chimpanzee nests were more abundant in matureforest and above 1000 m than in secondary forest and below 1000 m (Koopset al. 2012). More recent research in the Nimba Mountains revealed that chim-panzees preferred old-growth over secondary forest for nesting (Granier et al.2014). Higher encounter rates of human activity in the secondary forests in Kom-Wum Forest Reserve may be linked to the low encounter rates for chimpanzeesigns compared to those in mature forest areas. Higher encounter rates forchimpanzee signs in mature forests in Tofala Hill Wildlife Sanctuary andBabanki–Finge Forest in Cameroon were also associated with lower encounterrates for hunting, logging, and farming. A review of 52 chimpanzee nest surveysacross West Africa showed that chimpanzees prefer rainforests with a low degreeof human impact (Heinicke et al. 2019). In the southeastern forest region ofBossou, Guinea, chimpanzees preferred mature forest with abundant supply ofwild fruits over disturbed habitats for traveling and resting (Bryson-Morrisonet al. 2017). Similarly to other chimpanzee subspecies, the chimpanzees of Kom-Wum prefer mature forest compared to secondary forest. Primary forest tend to
Human Activity and Forest Degradation Threaten Populations of the... 121

provide suitable conditions (habitat with enough food and shelter) for theNigeria–Cameroon chimpanzee (Carvalho et al. 2020) and other great apesspecies (Junker et al. 2012).
After controlling for the effect of forest cover, habitat perforation, edge length, andsecondary forest had a significant negative effect on chimpanzee occurrence in Kom-Wum Forest Reserve. In contrast, core areas had a significant positive effect. The lowoccurrence of chimpanzees in perforated forest, at forest edges, and in secondary forestis probably best explained by higher human activity in these areas, as previouslyreported (Morgan et al. 2011). This interpretation is supported by results from Guinea,where chimpanzees were more likely to feed away from cultivated areas than awayfrommature forest (Bryson-Morrison et al. 2017). Other primates respond negatively tohabitat degradation (Arroyo-Rodríguez and Dias 2010). For example, in Los Tuxtlasand the lowlands of Tabasco, Mexico, the mantled howler (Alouatta palliata) preferedinterior forest with high-quality habitat (feeding trees with larger diameter at breastheight) to edge forest (Arroyo-Rodriguez and Mandujano 2006; Muñoz et al. 2006).Although we did not assess food availability of chimpanzees in forest edges andinterior forest in this study, the positive relationship between chimpanzee occurrenceand core areas in Kom-Wum Forest Reserve could be explained by resource availabil-ity (e.g., food and nest sites). At Goualougo Triangle in the Republic of Congo,transects that traversed the core area of the community range had higher encounterrates of chimpanzee nests and nests sites compared to more peripheral areas (Morganet al. 2006).
The results we obtained for Kom-Wum Forest Reserve contrast with those fromNyungwe National Park, Rwanda, where chimpanzees used forest edges for feeding,nesting, and traveling (Hasabwamariya 2018). This difference may be a consequence ofthe behavioral flexibility of primates living in human-dominated landscape (McCarthyet al. 2017). The persistence of primates in human disturbed landscapes can be relatedto their flexibility in diet selection (Marsh et al. 2016). For example, in MagdalenaValley, Colombia, white-fronted capuchins (Cebus albifrons) (a more diet generalistspecies) were encountered in a majority of fragments irrespective of high humandisturbance. In contrast, the brown spider monkey (Ateles hybridus) (a species with amore selective diet) was absent or less abundant in highly disturbed forest fragments.At La Suerte Biological Research Station, Costa Rica, there was no difference in theencounter rates of mantled howler (Alouatta palliata), white-faced capuchins (Cebuscapucinus), and Central American spider monkeys (Ateles geoffroyi) in forest edgeswith high human disturbance and interior forest (Bolt et al. 2018).
Conclusion
This study shows that forest degradation resulting from human activity had a significantnegative impact on the encounter rate of chimpanzee signs in Kom-Wum ForestReserve, Cameroon. Chimpanzee signs were mostly found in mature forest comparedto secondary forest, at higher elevation than lower elevation, and were less frequentlyobserved with increasing human activities. This study supports previous work showingthat sampling effort and methodological approach can yield variable estimates ofpopulation size (Vink et al. 2020). The MNC technique is sensitive in detecting
Fotang C. et al.122

changes in density (Buij et al. 2003; Devos et al. 2008) and is therefore recommendedin combination with camera trapping to monitor the population status of chimpanzees.Our results reveal the importance of undisturbed mature forests as core habitats forchimpanzee populations in Kom-Wum Forest Reserve and surrounding forests. Sec-ondary forests may provide essential habitats for chimpanzees (Basabose 2005), butchimpanzees in this study tended to avoid secondary forest, most likely due to highhuman activity. Future effort focusing on the conservation of chimpanzees in Kom-Wum Forest Reserve should be directed toward reducing human activities andreforestating degraded areas. Local human communities need to be actively involvedin monitoring programs and law enforcement activities, such as regular antipoachingpatrols within and around the reserve, to prevent hunting. Providing incentives to localcommunity members to generate alternative livelihood activities such as piggeries andpoultry farms has the potential to reduce the pressure on forest resources (Van Vliet2011). The promotion of conservation education is essential to discourage bushmeathunting and to maintain continuous forest through the reforestation of degraded areas.
Supplementary Information The online version contains supplementary material available at https://doi.org/10.1007/s10764-020-00191-2.
Acknowledgments This research was supported by the International Foundation for Science, Stockholm,Sweden, the Organisation of Islamic Cooperation’s Standing Committee on Scientific and TechnologicalCooperation (COMSTECH), and the Rufford Foundation through grants to C. Fotang. We thank the fieldassistants, Mr. Akou Emmanuel Mbeng and Ambe Godwill Akou, for their assistance in data collection. Wethank Dr. Serge Alexis Kamgang, Mr. Yisa Ginath Yuh, and Mr. Ejike Richard Ugba for their assistance indata analyses. We acknowledge the contribution of Prof. Mary Katherine Gonder, Dr. Eileen Bogweh Nchanji,Mr. Kenneth KumechaTah, Osiris Doumbé, Dr. Mercy Nambu Diangha, and Dr. Mvo Denis Chou for theirhelpful comments and contributions to an earlier version of the manuscript. We are grateful to Prof. ManfredWanner, Dr. Birte Seffert, and Dr. Enrique Garcia de la Riva for their invaluable support and guidance as wellas the technical staff of the Department of Ecology BTU Cottbus-Senftenberg for logistic support. We thankthe editors (Prof. Joanna Setchell, Dr. Songtao Guo) and two anonymous reviewers for their valuablecomments on the manuscript.
Author contributions CF, CR, EEA, KB, PS, TEA, and UB conceived and designed the experiments; CFconducted fieldwork; CF and PD developed methodology; CF, ECE, and KB performed statistical analyses;and CF and KB wrote the manuscript.
Funding Open Access funding enabled and organized by Projekt DEAL.
Open Access This article is licensed under a Creative Commons Attribution 4.0 International License, whichpermits use, sharing, adaptation, distribution and reproduction in any medium or format, as long as you giveappropriate credit to the original author(s) and the source, provide a link to the Creative Commons licence, andindicate if changes were made. The images or other third party material in this article are included in thearticle's Creative Commons licence, unless indicated otherwise in a credit line to the material. If material is notincluded in the article's Creative Commons licence and your intended use is not permitted by statutoryregulation or exceeds the permitted use, you will need to obtain permission directly from the copyright holder.To view a copy of this licence, visit http://creativecommons.org/licenses/by/4.0/.
Human Activity and Forest Degradation Threaten Populations of the... 123

References
Abwe, E. E., & Morgan, B. J. (2008). The Ebo forest: Four years of preliminary research and conservation ofthe Nigeria-Cameroon chimpanzee (Pan troglodytes vellerosus). Pan Africa News, 15(2), 26–29.
Abwe, E. E., Morgan, B. J., Doudja, R., Kentatchime, F., Mba, F., et al (2020). Dietary ecology of the Nigeria-Cameroon chimpanzee (Pan troglodytes ellioti). International Journal of Primatology, 41(1), 81–104.https://doi.org/10.1007/s10764-020-00138-7.
Abwe, E. E., Morgan, B. J., Tchiengue, B., Kentatchime, F., Doudja, R., et al (2019). Habitat differentiationamong three Nigeria-Cameroon chimpanzee (Pan troglodytes ellioti) populations. Ecology and Evolution,9(3), 1489–1500. https://doi.org/10.1002/ece3.4871.
Ancrenaz, M., Gimenez, O., Ambu, L., Ancrenaz, K., Andau, P., et al (2004). Aerial surveys give newestimates for orangutans in Sabah, Malaysia. PLoS Biology, 3(1), e3. https://doi.org/10.1371/journal.pbio.0030003.
Arroyo-Rodríguez, V., & Dias, P. A. D. (2010). Effects of habitat fragmentation and disturbance on howlermonkeys: A review. American Journal of Primatology, 72(1), 1–16. https://doi.org/10.1002/ajp.20753.
Arroyo-Rodríguez, V., & Mandujano, S. (2006). Forest fragmentation modifies habitat quality for Alouattapalliata. International Journal of Primatology, 27(4), 1079–1096. https://doi.org/10.1007/s10764-006-9061-0.
Baayen, R. H., Davidson, D. J., & Bates, D. M. (2008). Mixed-effects modeling with crossed random effectsfor subjects and items. Journal of Memory and Language, 59(4), 390–412. https://doi.org/10.1016/j.jml.2007.12.005.
Basabose, A. K. (2005). Ranging patterns of chimpanzees in a montane forest of Kahuzi, Democratic Republicof Congo. International Journal of Primatology, 26(1), 33. https://doi.org/10.1007/s10764-005-0722-1.
Beck, J., & Chapman, H. (2008). A population estimate of the endangered chimpanzee Pan troglodytesvellerosus in a Nigerian montane forest: Implications for conservation. Oryx, 42(3), 448–451. https://doi.org/10.1017/S0030605308001397.
Boesch, C. (1995). Innovation in wild chimpanzees (Pan troglodytes). International Journal of Primatology,16(1), 1–16. https://doi.org/10.1007/BF02700150.
Boesch, C., & Boesch-Achermann, H. (2000). The chimpanzees of the Täi Forest: Behavioural ecology andevolution. New York: Oxford University Press.
Bolt, L. M., Schreier, A. L., Voss, K. A., Sheehan, E. A., Barrickman, N. L., et al (2018). The influence ofanthropogenic edge effects on primate populations and their habitat in a fragmented rainforest in CostaRica. Primates, 59(3), 301–311. https://doi.org/10.1007/s10329-018-0652-0.
Brownlow, A. R., Plumptre, A. J., Reynolds, V., & Ward, R. (2001). Sources of variation in the nestingbehavior of chimpanzees (Pan troglodytes schweinfurthii) in the Budongo Forest, Uganda. AmericanJournal of Primatology, 55(1), 49–55. https://doi.org/10.1002/ajp.1038.
Bruce, T., Amin, R., Wacher, T., Fankem, O., Ndjassi, C., et al (2018). Using camera trap data to characterizeterrestrial larger-bodied mammal communities in different management sectors of the Dja FaunalReserve, Cameroon. African Journal of Ecology, 56(4), 759–776. https://doi.org/10.1111/aje.12574.
Bryson-Morrison, N., Tzanopoulos, J., Matsuzawa, T., & Humle, T. (2017). Activity and habitat use ofchimpanzees (Pan troglodytes verus) in the anthropogenic landscape of Bossou, Guinea, West Africa.International Journal of Primatology, 38(2), 282–302. https://doi.org/10.1007/s10764-016-9947-4.
Buckland, S. T., Anderson, D. R., Burnham, K. P., Laake, J. L., Borchers, D. L., & Thomas, L. (2001).Introduction to distance sampling estimating abundance of biological populations. Oxford: OxfordUniversity Press.
Buij, R., Singleton, I., Krakauer, E., & van Schaik, C. P. (2003). Rapid assessment of orangutan density.Biological Conservation, 114(1), 103–113. https://doi.org/10.1016/S0006-3207(03)00015-6.
Carvalho, J., Graham, B., Bocksberger, G., Maisels, F., Williamson, E. A., Wich, S., et al. (2020). Predictingrange shifts of African apes under global change scenarios. BioRxiv. https://doi.org/10.1101/2020.06.25.168815.
Chapman, C. A., & Peres, C. A. (2001). Primate conservation in the new millennium: the role of scientists.Evolutionary Anthropology: Issues, News, and Reviews, 10(1), 16–33. https://doi.org/10.1002/1520-6505(2001)10:1<16::AID-EVAN1010>3.0.CO;2-O.
Chuo, M. D., Tsi, E. A., Chefor, F., & Fru, B. S. (2017). Estimation of chimpanzee’s (Pan troglodytes ellioti)abundance in the Kimbi-Fungum National Park and Kom-Wum Forest Reserve, Nw, Cameroon. Journalof Biodiversity Management & Forestry, 6, 3. https://doi.org/10.4172/2327-4417.1000185.
Congalton, R. G. (1991). A review of assessing the accuracy of classifications of remotely sensed data. RemoteSensing of Environment, 37(1), 35–46. https://doi.org/10.1016/0034-4257(91)90048-B.
Fotang C. et al.124

Curtis, P. G., Slay, C. M., Harris, N. L., Tyukavina, A., & Hansen, M. C. (2018). Classifying drivers of globalforest loss. Science, 361(6407), 1108–1111. https://doi.org/10.1126/science.aau3445.
Devos, C., Sanz, C., Morgan, D., Onononga, J.-R., Laporte, N., & Huynen, M.-C. (2008). Comparing apedensities and habitats in northern Congo: Surveys of sympatric gorillas and chimpanzees in the Odzalaand Ndoki regions. American Journal of Primatology, 70(5), 439–451. https://doi.org/10.1002/ajp.20514.
Doumbé, O. A. (2014). Habitat mapping of the Babanki-Finge Forest, and survey on the rarest chimpanzee(Pan troglodytes ellioti) in the Bamenda Highlands, North-West Cameroon. Master’s thesis, TheUniversity of Roehampton, London.
Doumbé, O. A. (2015). Conservation of the Nigeria-Cameroon chimpanzee (Pan troglodytes ellioti) in theNorthwest Region of Cameroon. https://www.rufford.org/projects/osiris_doumbe. Accessed 18 Oct 2019.
Dutton, P., & Chapman, H. (2015a). Dietary preferences of a submontane population of the rare Nigerian-Cameroon chimpanzee (Pan troglodytes ellioti) in Ngel Nyaki Forest Reserve, Nigeria. American Journalof Primatology, 77(1), 86–97. https://doi.org/10.1002/ajp.22313.
Dutton, P., & Chapman, H. (2015b). New tools suggest local variation in tool use by a montane community ofthe rare Nigeria-Cameroon chimpanzee, Pan troglodytes ellioti, in Nigeria. Primates, 56(1), 89–100.https://doi.org/10.1007/s10329-014-0451-1.
Dutton, P., Moltchanova, E., & Chapman, H. (2016). Nesting ecology of a small montane population of theNigerian/Cameroon chimpanzee (Pan troglodytes ellioti) in Nigeria. Folia Primatologica, 87(6), 361–374. https://doi.org/10.1159/000454921.
Dutton, P. E. (2012). Chimpanzee (Pan troglodytes ellioti) ecology in a Nigerian montane forest. PhD thesis,Biological Sciences, University of Canterbury, New Zealand.
Enoguanbhor, E. C., Gollnow, F., Nielsen, J. O., Lakes, T., & Walker, B. B. (2019). Land cover change in theAbuja City-Region, Nigeria: Integrating GIS and remotely sensed data to support land use planning.Sustainability, 11(5), 1313. https://doi.org/10.3390/su11051313.
Estrada, A., & Coates-Estrada, R. (1996). Tropical rain forest fragmentation and wild populations of primatesat Los Tuxtlas, Mexico. International Journal of Primatology, 17(5), 759–783. https://doi.org/10.1007/BF02735263.
Estrada, A., Anzures D, A., & Coates-Estrada, R. (1999). Tropical rain forest fragmentation, howler monkeys(Alouatta palliata), and dung beetles at Los Tuxtlas, Mexico. American Journal of Primatology, 48(4),253–262. https://doi.org/10.1002/(SICI)1098-2345(1999)48:4<253::AID-AJP1>3.0.CO;2-D.
Estrada, A., Garber, P. A., & Chaudhary, A. (2019). Expanding global commodities trade and consumptionplace the world’s primates at risk of extinction. PeerJ, 7, e7068. https://doi.org/10.7717/peerj.7068.
Estrada, A., Garber, P. A., Rylands, A. B., Roos, C., Fernandez-Duque, E., et al (2017). Impending extinctioncrisis of the world’s primates: Why primates matter. Science Advances, 3(1), e1600946. https://doi.org/10.1126/sciadv.1600946.
Fahrig, L. (2003). Effects of habitat fragmentation on biodiversity. Annual Review of Ecology, Evolution, andSystematics, 34(1), 487–515. https://doi.org/10.1146/annurev.ecolsys.34.011802.132419.
Fotang, C. (2018). Ecology and behaviour of the Nigeria-Cameroon Chimpanzee in Kom-Wum ForestReserve and Mbi Crater Kefem Landscape in the North-West Region of Cameroon. https://www.rufford.org/projects/chefor_fotang. Accessed 29 Oct 2019.
Fowler, A., & Sommer, V. (2007). Subsistence technology of Nigerian chimpanzees. International Journal ofPrimatology, 28(5), 997–1023. https://doi.org/10.1007/s10764-007-9166-0.
Fruth, B., & Hohmann, G. (1996). Nest building behavior in the great apes: The great leap forward? In W. C.MGrew, L. F. Marchant, & T. Nishida (Eds.), Great ape societies (pp. 225–240). Cambridge: CambridgeUniversity Press.
Funwi-Gabga, N., Kuehl, H., Maisels, F., Cheyne, S. M., Wich, S. A., et al (2014). The status of apes acrossAfrica and Asia. In H. Rainer, A. White, & A. Lanjouw (Eds.), State of the apes 2013: Extractiveindustries and ape conservation (pp. 253–277). Cambridge: Cambridge University Press.
Furuichi, T., & Hashimoto, C. (2000). Ground beds of chimpanzees in the Kalinzu Forest, Uganda. Pan AfricaNews, 7(2), 26–28.
Ganasri, B. P., & Dwarakish, G. S. (2015). Study of land use/land cover dynamics through classificationalgorithms for Harangi catchment area, Karnataka State, INDIA. Aquatic Procedia, 4, 1413–1420. https://doi.org/10.1016/j.aqpro.2015.02.183.
Ghiglieri, M. P. (1984). Feeding ecology and sociality of chimpanzees in the Kibale Forest, Uganda. In P. S.Rodman & J. G. H. Cant (Eds.), Adaptations for foraging in non-human primates (pp. 161–194). NewYork: Columbia University Press.
Gonder, M. K., Oates, J. F., Disotell, T. R., Forstner, M. R. J., Morales, J. C., & Melnick, D. J. (1997). A newwest African chimpanzee subspecies? Nature, 388(6640), 337. https://doi.org/10.1038/41005.
Human Activity and Forest Degradation Threaten Populations of the... 125

González-Solís, J., Guix, J. C., Mateos, E., & Llorens, L. (2001). Population density of primates in a largefragment of the Brazilian Atlantic rainforest. Biodiversity & Conservation, 10(8), 1267–1282. https://doi.org/10.1023/A:1016678126099.
Granier, N., Hambuckers, A., Matsuzawa, T., & Huynen, M.-C. (2014). Density estimates and nesting-siteselection in chimpanzees of the Nimba Mountains, Côte d’Ivoire, and Guinea. American Journal ofPrimatology, 76(11), 999–1010. https://doi.org/10.1002/ajp.22278.
Greengrass, E. J., & Maisels, F. (2007). Conservation of the Nigerian-Cameroon chimpanzee P. t. vellerosus(and other mammals) in and around the Banyang-Mbo Wildlife Sanctuary, South-west Province,Cameroon. Yaoundé, Cameroon: Wildlife Conservation Society.
Haddad, N. M., Brudvig, L. A., Clobert, J., Davies, K. F., Gonzalez, A., et al (2015). Habitat fragmentationand its lasting impact on Earth’s ecosystems. Science Advances, 1(2), e1500052. https://doi.org/10.1126/sciadv.1500052.
Hasabwamariya, E. (2018). Influences of forest edges and human activities on the dry season ranging patternsof chimpanzees (Pan troglodytes schweinfurthii) in Nyungwe National Park, Rwanda. Master’s thesis,Antioch University, New England, Yellow Springs, OH.
Hashimoto, C. (1995). Population census of the chimpanzees in the Kalinzu Forest, Uganda: Comparisonbetween methods with nest counts. Primates, 36(4), 477–488. https://doi.org/10.1007/BF02382870.
Heinicke, S., Mundry, R., Boesch, C., Amarasekaran, B., Barrie, A., et al. (2019). Characteristics of positivedeviants in western chimpanzee populations Frontiers in Ecology and Evolution, 7, 16. https://doi.org/10.3389/fevo.2019.00016.
Ho, J., Tumkaya, T., Aryal, S., Choi, H., & Claridge-Chang, A. (2019). Moving beyond P values: Dataanalysis with estimation graphics. Nature Methods, 16(7), 565–566. https://doi.org/10.1038/s41592-019-0470-3.
Howe, E. J., Buckland, S. T., Després-Einspenner, M.-L., & Kühl, H. S. (2017). Distance sampling withcamera traps. Methods in Ecology and Evolution, 8(11), 1558–1565. https://doi.org/10.1111/2041-210X.12790.
Hughes, N., Rosen, N., Gretsky, N., & Sommer, V. (2011). Will the Nigeria-Cameroon chimpanzee goextinct? Models derived from intake rates of ape sanctuaries. In V. Sommer & C. Ross (Eds.), Primates ofGashaka: Socioecology and conservation in Nigeria's biodiversity hotspot (pp. 493–523). New York:Springer Science+Business Media.
Humle, T., Maisels, F., Oates, J. F., Plumptre, A., & Williamson, E. A. (2016). Pan troglodytes. The IUCNRed List of Threatened Species 2016. https://doi.org/10.2305/IUCN.UK.2016-2.RLTS.T15933A17964454.en. Accessed 11 Oct 2020.
Jenks, K. E., Chanteap, P., Kanda, D., Peter, C., Cutter, P., et al. (2011). Using relative abundance indicesfrom camera-trapping to test wildlife conservation hypotheses: An example from Khao Yai National Park,Thailand. Tropical Conservation Science, 4(2), 113–131. https://doi.org/10.1177/194008291100400203.
Johnson, A. E., Knott, C. D., Pamungkas, B., Pasaribu, M., & Marshall, A. J. (2005). A survey of theorangutan (Pongo pygmaeus wurmbii) population in and around Gunung Palung National Park, WestKalimantan, Indonesia based on nest counts. Biological Conservation, 121(4), 495–507. https://doi.org/10.1016/j.biocon.2004.06.002.
Junker, J., Blake, S., Boesch, C., Campbell, G., Du Toit, L., Duvall, C., et al. (2012). Recent decline insuitable environmental conditions for African great apes. Diversity and Distributions, 18(11), 1077–1091.https://doi.org/10.1111/ddi.12005.
Kah, H. (2015). “Wuai, Kesiazheh, Nyengui:” History and livelihood challenges in a Cameroon’s montaneforest reserve. Economic- and Ecohistory, 11(11), 93–104.
Kamgang, S. A., Bobo, K. S., Maisels, F., Ambahe, R. D. D., Ongono, D. E. A., et al (2018). The relationshipbetween the abundance of the Nigeria-Cameroon chimpanzee (Pan troglodytes ellioti) and its habitat: Aconservation concern in Mbam-Djerem National Park, Cameroon. BMC Ecology, 18(1), 40. https://doi.org/10.1186/s12898-018-0199-3.
Kim, S. (2019). Jeju Island climate modeling using multiple linear regression analysis. Journal of Analysis ofApplied Mathematics, 13, 118–136.
Knight, A., Chapman, H. M., & Hale, M. (2016). Habitat fragmentation and its implications for Endangeredchimpanzee Pan troglodytes conservation. Oryx, 50(3), 533–536. https://doi.org/10.1017/S0030605315000332.
Fotang C. et al.126

Koops, K., Humle, T., Sterck, E. H. M., & Matsuzawa, T. (2007). Ground-nesting by the chimpanzees of theNimba Mountains, Guinea: Environmentally or socially determined? American Journal of Primatology,69(4), 407–419. https://doi.org/10.1002/ajp.20358.
Koops, K., McGrew, W. C., de Vries, H., & Matsuzawa, T. (2012). Nest-building by chimpanzees (Pantroglodytes verus) at Seringbara, Nimba Mountains: Antipredation, thermoregulation, and antivectorhypotheses. International Journal of Primatology, 33(2), 356–380. https://doi.org/10.1007/s10764-012-9585-4.
Kormos, R., Boesch, C., Bakarr, M. I., & Butynski, T. M. (2003). West African chimpanzees. Status surveyand conservation action plan. Gland, Cambridge: IUCN/SSC Primate Specialist Group.
Kouakou, C. Y., Boesch, C., & Kuehl, H. (2009). Estimating chimpanzee population size with nest counts:Validating methods in Taï National Park. American Journal of Primatology, 71(6), 447–457. https://doi.org/10.1002/ajp.20673.
Kühl, H., Maisels, F., Ancrenaz, M., & Williamson, E. A. (2008). Best practice guidelines for the surveys andmonitoring of great ape populations. Gland, Switzerland: IUCN/SSC Primate Specialist Group.
Last, C., & Muh, B. (2013). Effects of human presence on chimpanzee nest location in the Lebialem MonéForest landscape, south-west region, Cameroon. Folia Primatologica, 84(1), 51–63. https://doi.org/10.1159/000346305.
Maisels, F., Ambahe, E., Ambassa, R., Nvemgah Yara, C., & Fosso, B. (2009). Great ape and human impactmonitoring in the Mbam et Djerem National Park, Cameroon. In Final report to USFWS-GACFAgreement 98210-7-G290. New York: Wildlife Conservation Society.
Marsh, C., Link, A., King-Bailey, G., & Donati, G. (2016). Effects of fragment and vegetation structure on thepopulation abundance of Ateles hybridus, Alouatta seniculus and Cebus albifrons in Magdalena Valley,Colombia. Folia Primatologica, 87(1), 17–30. https://doi.org/10.1159/000443929.
Marshall, A. J., Salas, L. A., Stephens, S., Engström, L., Meijaard, E., & Stanley, S. A. (2007). Use oflimestone karst forests by Bornean orangutans (Pongo pygmaeus morio) in the Sangkulirang Peninsula,East Kalimantan, Indonesia. American Journal of Primatology, 69(2), 212–219. https://doi.org/10.1002/ajp.20341.
Mathewson, P. D., Spehar, S. N., Meijaard, E., Sasmirul, A., & Marshall, A. J. (2008). Evaluating orangutancensus techniques using nest decay rates: Implications for population estimates. Ecological Applications,18(1), 208–221. https://doi.org/10.1890/07-0385.1.
Mathot, L., & Doucet, J. L. (2005). Wildlife surveys in rainforest concessions in order to identify protectedareas. In M. De Dapper (Ed.), Tropical forest in a changing global context (pp. 241–254). RoyalAcademy of Overseas Sciences. Belgium: UNESCO.
McCarthy, M. S., Lester, J. D., & Stanford, C. B. (2017). Chimpanzees (Pan troglodytes) flexibly useintroduced species for nesting and bark feeding in a human-dominated habitat. International Journal ofPrimatology, 38(2), 321–337. https://doi.org/10.1007/s10764-016-9916-y.
McLennan, M. R., Spagnoletti, N., & Hockings, K. J. (2017). The implications of primate behavioralflexibility for sustainable human–primate coexistence in anthropogenic habitats. International Journalof Primatology, 38(2), 105–121. https://doi.org/10.1007/s10764-017-9962-0.
McManus, E. (2005). Federal Republic of Nigeria. In J. Caldecott & L. Miles (Eds.),World atlas of great apesand their conservation (pp. 378–383). Los Angeles: University of California Press.
Mitchell, M. W., Locatelli, S., Clee, P. R. S., Thomassen, H. A., & Gonder, M. K. (2015). Environmentalvariation and rivers govern the structure of chimpanzee genetic diversity in a biodiversity hotspot. BMCEvolutionary Biology, 15(1), 1–13. https://doi.org/10.1186/s12862-014-0274-0.
Morgan, B., Adeleke, A., Bassey, T., Bergl, R., Dunn, A., et al (2011). Regional action plan for theconservation of the Nigeria-Cameroon chimpanzee (Pan troglodytes ellioti). In Gland. Switzerland andSan Diego, CA: IUCN/SSC Primate Specialist Group and Zoological Society of San Diego.
Morgan, D., Mundry, R., Sanz, C., Ayina, C. E., Strindberg, S., Lonsdorf, E., & Kühl, H. S. (2018). Africanapes coexisting with logging: Comparing chimpanzee (Pan troglodytes troglodytes) and gorilla (Gorillagorilla gorilla) resource needs and responses to forestry activities. Biological Conservation, 218, 277–286. https://doi.org/10.1016/j.biocon.2017.10.026.
Morgan, D., Sanz, C., Onononga, J. R., & Strindberg, S. (2006). Ape abundance and habitat use in theGoualougo Triangle, Republic of Congo. International Journal of Primatology, 27(1), 147–179. https://doi.org/10.1007/s10764-005-9013-0.
Human Activity and Forest Degradation Threaten Populations of the... 127

Muñoz, D., Estrada, A., Naranjo, E., & Ochoa, S. (2006). Foraging ecology of howler monkeys in a cacao(Theobroma cacao) plantation in Comalcalco, Mexico. American Journal of Primatology, 68(2), 127–142. https://doi.org/10.1002/ajp.20211.
Ndimbe, M. S., Morgan, B. J., Marino, J., & Abwe, E. E. (2016). Population density estimate of the Nigeria-Cameroon chimpanzee (Pan troglodytes ellioti) in the Ebo forest. Cameroon: Unpublished report.
Ngalla, P.T., Miles, L. & Caldecott, J. (2005). Republic of Cameroon. In J. Caldecott, & L. Miles (Eds.),World atlas of great apes and their conservation (pp. 305–314). Los Angeles: University of CaliforniaPress.
Njukang, A. P., Angwafor, T. E. I., Akwanjoh, S. R., Lebga, A. K., & Chuo, M. D. O. (2019). Effects ofanthropogenic activities on chimpanzee nest location in the Tofala Hill Wildlife Sanctuary (THWS),South West Region, Cameroon. International Journal of Forest, Animal and Fisheries Research, 3(1).https://doi.org/10.22161/ijfaf.3.6.1.
O’Brien, T. G., Kinnaird, M. F., &Wibisono, H. T. (2003). Crouching tigers, hidden prey: Sumatran tiger andprey populations in a tropical forest landscape. Animal Conservation, 6(2), 131–139. https://doi.org/10.1017/S1367943003003172.
Ogunjemite, B. G., & Dansu, E. L. (2014). Relationship between anthropogenic activities and occurrence ofthe chimpanzees (Pan troglodytes) in Oluwa Forest Reserve, Nigeria. Ethiopian Journal ofEnvironmental Studies and Management, 7(4), 402–410. https://doi.org/10.4314/ejesm.v7i4.7.
Plumptre, A. J., & Cox, D. (2006). Counting primates for conservation: Primate surveys in Uganda. Primates,47(1), 65–73. https://doi.org/10.1007/s10329-005-0146-8.
Plumptre, A. J., & Reynolds, V. (1996). Censusing chimpanzees in the Budongo forest, Uganda. InternationalJournal of Primatology, 17(1), 85–99. https://doi.org/10.1007/BF02696160.
PNDP (2011). National community driven development program, Wum council development plan. Bamenda:Republic of Cameroon https://www.pndp.org/documents/23_CDP_Wum.pdf. Accessed 29 Oct 2019.
Rovero, F., & de Luca, D. W. (2007). Checklist of mammals of the Udzungwa Mountains of Tanzania.Mammalia, 71(1–2), 47–55. https://doi.org/10.1515/MAMM.2007.015.
Rovero, F., Tobler, M., & Sanderson, J. (2010). Camera trapping for inventorying terrestrial vertebrates. In J.Eymann, J. Degreef, C. Hauser, J. C. Monje, Y. Samyn, & D. Vandenspiegel (Eds.), Manual on fieldrecording techniques and protocols for all taxa biodiversity inventories and monitoring (pp. 100–128).Brussels: The Belgian National Focal Point to the Global Taxonomy Initiative.
Sesink Clee, P. R., Abwe, E. E., Ambahe, R. D., Anthony, N. M., Fotso, R., et al (2015). Chimpanzeepopulation structure in Cameroon and Nigeria is associated with habitat variation that may be lost underclimate change. BMC Evolutionary Biology, 15(1), 2. https://doi.org/10.1186/s12862-014-0275-z.
Sommer, V., Adanu, J., Faucher, I., & Fowler, A. (2004). Nigerian chimpanzees (Pan troglodytes vellerosus)at Gashaka: Two years of habituation efforts. Folia Primatologica, 75(5), 295–316. https://doi.org/10.1159/000080208.
Sunderland, T. C. H., & Mannaseh, E. N. (2003). The Wildlife Conservation Society’s Cameroon-Nigeriatransboundary surveys project. Cameroon: Wildlife Conservation Society.
Thomas, L., Buckland, S. T., Rexstad, E. A., Laake, J. L., Strindberg, S., et al (2010). Distance software:Design and analysis of distance sampling surveys for estimating population size. Journal of AppliedEcology, 47(1), 5–14. https://doi.org/10.1111/j.1365-2664.2009.01737.x.
Tutin, C. E. G., & Fernandez, M. (1984). Nationwide census of gorilla (Gorilla g. gorilla) and chimpanzee(Pan t. troglodytes) populations in Gabon. American Journal of Primatology, 6(4), 313–336. https://doi.org/10.1002/ajp.1350060403.
Tutin, C. E. G., Parnell, R. J., White, L. J. T., & Fernandez, M. (1995). Nest building by lowland gorillas in theLopé Reserve, Gabon: Environmental influences and implications for censusing. International Journal ofPrimatology, 16(1), 53. https://doi.org/10.1007/BF02700153.
Van Schaik, C. P., Priatna, A., & Priatna, D. (1995). Population estimates and habitat preferences oforangutans based on line transects of nests. In R. D. Nadler, B. M. F. Galdikas, L. K. Sheeran, & N.Rosen (Eds.), The neglected ape (pp. 129–147). New York: Plenum Press.
Van Vliet, N. (2011). Livelihood alternatives for the unsustainable use of bushmeat. Report prepared for theCBD Bushmeat Liaison Group. Technical Serices No. 60. InMontreal: Secretariat of the Convention onBiological Diversity.
Venables, W. N., Smith, D. M., & Team, R. C. (2008). An introduction to R: Notes on R, a programmingenvironment for data analysis and graphics. http://cran.r-project.org/doc/manuals/R-intro.pdf. Accessed12 Oct 2020.
Fotang C. et al.128

Vink, D. N., Stewart, F. A., & Piel, A. K. (2020). Comparing methods for assessing chimpanzee (Pantroglodytes schweinfurthii) party size: Observations, camera traps, and bed counts from a savanna-woodland mosaic in the Issa Valley, Tanzania. International Journal of Primatology, 1–15. https://doi.org/10.1007/s10764-020-00142-x.
Vogt, P., Riitters, K. H., Estreguil, C., Kozak, J., Wade, T. G., & Wickham, J. D. (2007). Mapping spatialpatterns with morphological image processing. Landscape Ecology, 22(2), 171–177. https://doi.org/10.1007/s10980-006-9013-2.
Walsh, P. D., Abernethy, K. A., Bermejo, M., Beyers, R., de Wachter, P., et al (2003). Catastrophic apedecline in western equatorial Africa. Nature, 422(6932), 611. https://doi.org/10.1038/nature01566.
Walsh, P. D., & White, L. J. T. (2005). Evaluating the steady state assumption: Simulations of gorilla nestdecay. Ecological Applications, 15(4), 1342–1350. https://doi.org/10.1890/03-5283.
White, L., & Edwards, A. (2000). Conservation research in the African rainforests: A technical handbook.New York: Wildlife Conservation Society.
Affiliations
Chefor Fotang1& Udo Bröring1
& Christian Roos2 & Evidence ChineduEnoguanbhor3 & Ekwoge E. Abwe4,5 & Paul Dutton6
& Peter Schierack7 & TsiEvaristus Angwafo8
& Klaus Birkhofer1
* Chefor [email protected]
1 Department of Ecology, Brandenburg University of Technology Cottbus-Senftenberg, Cottbus, Germany
2 German Primate Center, Gene Bank of Primates and Primate Genetics Laboratory, Leibniz Institute forPrimate Research, Göttingen, Germany
3 Geoinformation Science Laboratory, Department of Geography, Humboldt University of Berlin, Berlin,Germany
4 Institute for Conservation Research, Zoological Society of San Diego, Escondido, CA 92027, USA
5 Ebo Forest Research Project, Messa, Yaoundé, Cameroon
6 Waikato Regional Council, Science and Strategy Directorate, Hamilton, New Zealand
7 Department of Multiparameter Diagnostics, Brandenburg University of Technology Cottbus-Senftenberg,Senftenberg, Germany
8 Faculty of Agronomy and Agricultural Sciences, University of Dschang, Dschang, Cameroon
Human Activity and Forest Degradation Threaten Populations of the... 129