Hudson River PCBs Site - United States … · ii The Louis Berger Group, Inc. Revised EPS for Phase...
124
The Louis Berger Group, Inc. Revised EPS for Phase 2 Hudson River PCBs Site December 2010 Hudson River PCBs Site Revised Engineering Performance Standards For Phase 2 Prepared for: US Environmental Protection Agency, Region 2 and US Army Corps of Engineers, Kansas City District Prepared by: The Louis Berger Group, Inc. December 2010
Transcript of Hudson River PCBs Site - United States … · ii The Louis Berger Group, Inc. Revised EPS for Phase...

The Louis Berger Group, Inc. Revised EPS for Phase 2 Hudson River PCBs Site December 2010
Hudson River PCBs Site
Revised Engineering Performance Standards
For Phase 2
Prepared for:
US Environmental Protection Agency, Region 2
and
US Army Corps of Engineers, Kansas City District
Prepared by:
The Louis Berger Group, Inc.
December 2010
i
The Louis Berger Group, Inc. Revised EPS for Phase 2 Hudson River PCBs Site December 2010
Table of Contents
List of Tables ............................................................................................................................................. iii
List of Figures ............................................................................................................................................ iv
1. Introduction ......................................................................................................................................... 1-1
1.1 Overview ....................................................................................................................................... 1-1
1.2 Document Organization ................................................................................................................ 1-1
1.3 Summary of Rationale for Changes to the Standards ................................................................... 1-2
1.3.1 Observations from Phase 1 Dredging ...................................................................................... 1-2 1.3.2 Need to Address DoC Issue ..................................................................................................... 1-9
1.4 Interaction amongst Performance Standards for Phase 2 .............................................................. 1-9
2. Statement of the Revised Engineering Performance Standards for Phase 2 ....................................... 2-1
2.1 Development of the Phase 2 Engineering Performance Standards ............................................... 2-1
2.1.1 Fundamental Principles for Development of the Phase 2 Residuals Standard ........................ 2-1 2.1.2 Fundamental Principles for Development of the Phase 2 Resuspension Standard .................. 2-3 2.1.3 Fundamental Principles for Development of the Phase 2 Productivity Standard .................... 2-4
2.2 The Phase 2 Engineering Performance Standards ........................................................................ 2-4
2.2.1 Residuals Standard ................................................................................................................... 2-4 2.2.2 The Resuspension Standard ................................................................................................... 2-13 2.2.3 The Productivity Standard ..................................................................................................... 2-18
2.3 Data Quality for the Performance Standards Monitoring Programs ........................................... 2-20
2.4 Summary of Special Studies during Phase 2 Dredging .............................................................. 2-20
2.5 Ongoing Evaluation of Dredging and Possible Refinements during Phase 2 ............................. 2-20
3. Residuals Performance Standard ......................................................................................................... 3-1
3.1 Overview of Phase 2 Residuals Standard ..................................................................................... 3-1
3.2 Phase 1 Observations and Additional Data Needs in Support of the Residuals Standard for Phase 2 ................................................................................................................................................. 3-1
3.3 Implementation of the Residuals Standard ................................................................................... 3-2
3.3.1 Verification of Design Dredge Elevations ............................................................................... 3-3 3.3.2 Sample Collection and Analysis .............................................................................................. 3-4 3.3.3 Evaluation of Sample Data ...................................................................................................... 3-7 3.3.4 Initial Cover Placement ............................................................................................................ 3-9 3.3.5 Required Response Actions ..................................................................................................... 3-9
3.4 Limits on Capping ...................................................................................................................... 3-17
3.5 Reporting and Notifications ........................................................................................................ 3-21
3.5.1 Routine Reporting .................................................................................................................. 3-22 3.5.2 Contingency Reporting .......................................................................................................... 3-22
3.6 Special Studies ............................................................................................................................ 3-22

ii
The Louis Berger Group, Inc. Revised EPS for Phase 2 Hudson River PCBs Site December 2010
4. Overview of Resuspension Standard for Phase 2 ................................................................................ 4-1
4.1 Phase 1 Observations and Additional Data Needs in Support of the Resuspension Standard for Phase 2 ....................................................................................................................................... 4-1
4.1.1 Technical Background and Approach ...................................................................................... 4-2 4.2 Implementation of the Phase 2 Resuspension Standard ................................................................ 4-3
4.2.1 Far-Field TPCB Concentration Action Levels ......................................................................... 4-3 4.2.2 Far-Field Tri+ PCB Numerical Load Criteria .......................................................................... 4-5 4.2.3 Monitoring Plan ....................................................................................................................... 4-7
4.3 Estimating Baseline Loads and Loads due to Dredging ............................................................. 4-10
4.4 Reporting and Notifications ........................................................................................................ 4-12
4.5 Special Studies ............................................................................................................................ 4-13
5. Productivity Performance Standard ..................................................................................................... 5-1
5.1 Overview of Phase 2 Productivity Standard ................................................................................. 5-1
5.2 Basis for Changes to the Productivity Standard ............................................................................ 5-2
5.2.1 Technical Background and Approach ...................................................................................... 5-2 5.2.2 Supporting Analysis ................................................................................................................. 5-3
5.3 Implementation of the Phase 2 Productivity Standard .................................................................. 5-4
5.4 Reporting and Notification ........................................................................................................... 5-4
5.5 Special Studies .............................................................................................................................. 5-5
6. Water Quality Requirements for In-River Releases of Constituents Not Subject to Performance Standards ............................................................................................................................................. 6-1
6.1 Substantive Water Quality Requirements ..................................................................................... 6-1
6.1.1 Aquatic Acute Water Quality and Health (Water Source) Standards ...................................... 6-1 6.1.2 Discharges to Surface Water .................................................................................................... 6-3
7. Estimation of PCB Mass in Phase 2 Remediation Areas .................................................................... 7-1
7.1 Guiding Principles ........................................................................................................................ 7-1
7.2 Discussion of Methods .................................................................................................................. 7-2
7.3 Method for Dredged Inventory ..................................................................................................... 7-2
7.3.1 Mathematical Description ........................................................................................................ 7-2 7.3.2 Variance Estimation and Confidence Intervals (Known Volume Removed) .......................... 7-4 7.3.3 Variance When Volume is Uncertain but Measured by Bathymetry ....................................... 7-5
7.4 Application to Undredged Inventory (Mass and Volume Both Estimated From Core Samples) . 7-5
7.5 Confidence Limits for the Mass of PCB ....................................................................................... 7-6
8. References ........................................................................................................................................... 8-1
iii
The Louis Berger Group, Inc. Revised EPS for Phase 2 Hudson River PCBs Site December 2010
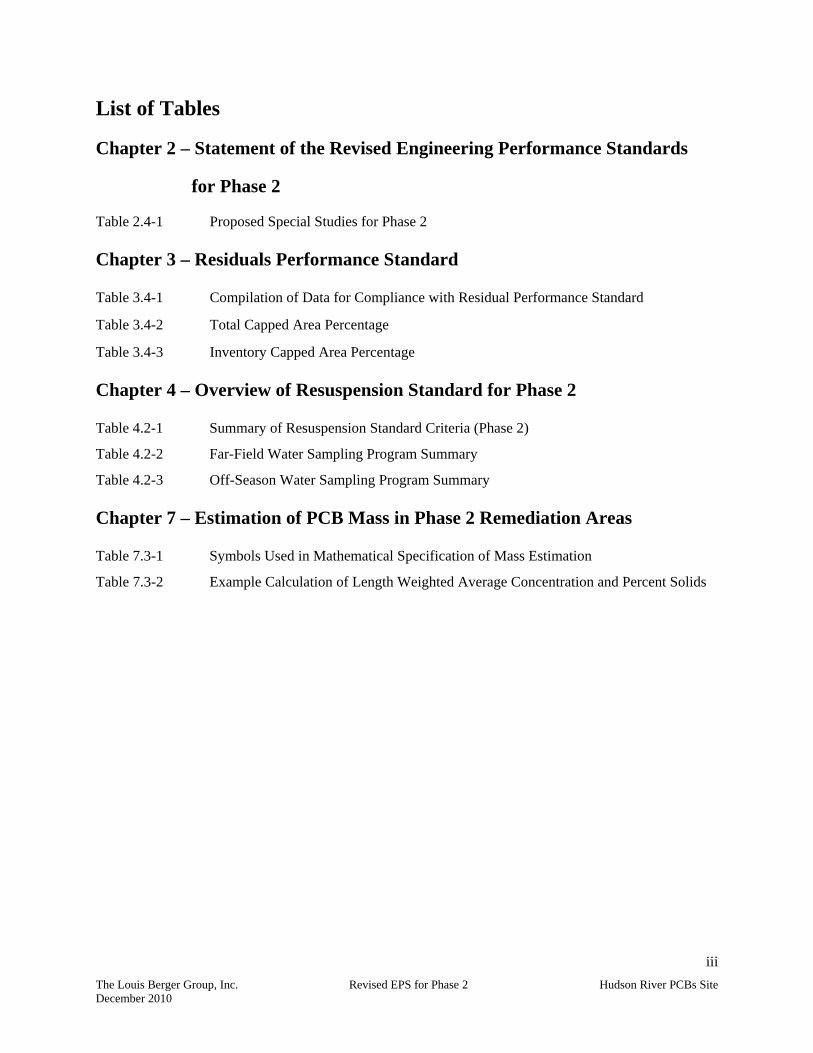
List of Tables
Chapter 2 – Statement of the Revised Engineering Performance Standards
for Phase 2
Table 2.4-1 Proposed Special Studies for Phase 2
Chapter 3 – Residuals Performance Standard
Table 3.4-1 Compilation of Data for Compliance with Residual Performance Standard
Table 3.4-2 Total Capped Area Percentage
Table 3.4-3 Inventory Capped Area Percentage
Chapter 4 – Overview of Resuspension Standard for Phase 2
Table 4.2-1 Summary of Resuspension Standard Criteria (Phase 2)
Table 4.2-2 Far-Field Water Sampling Program Summary
Table 4.2-3 Off-Season Water Sampling Program Summary
Chapter 7 – Estimation of PCB Mass in Phase 2 Remediation Areas
Table 7.3-1 Symbols Used in Mathematical Specification of Mass Estimation
Table 7.3-2 Example Calculation of Length Weighted Average Concentration and Percent Solids
iv
The Louis Berger Group, Inc. Revised EPS for Phase 2 Hudson River PCBs Site December 2010
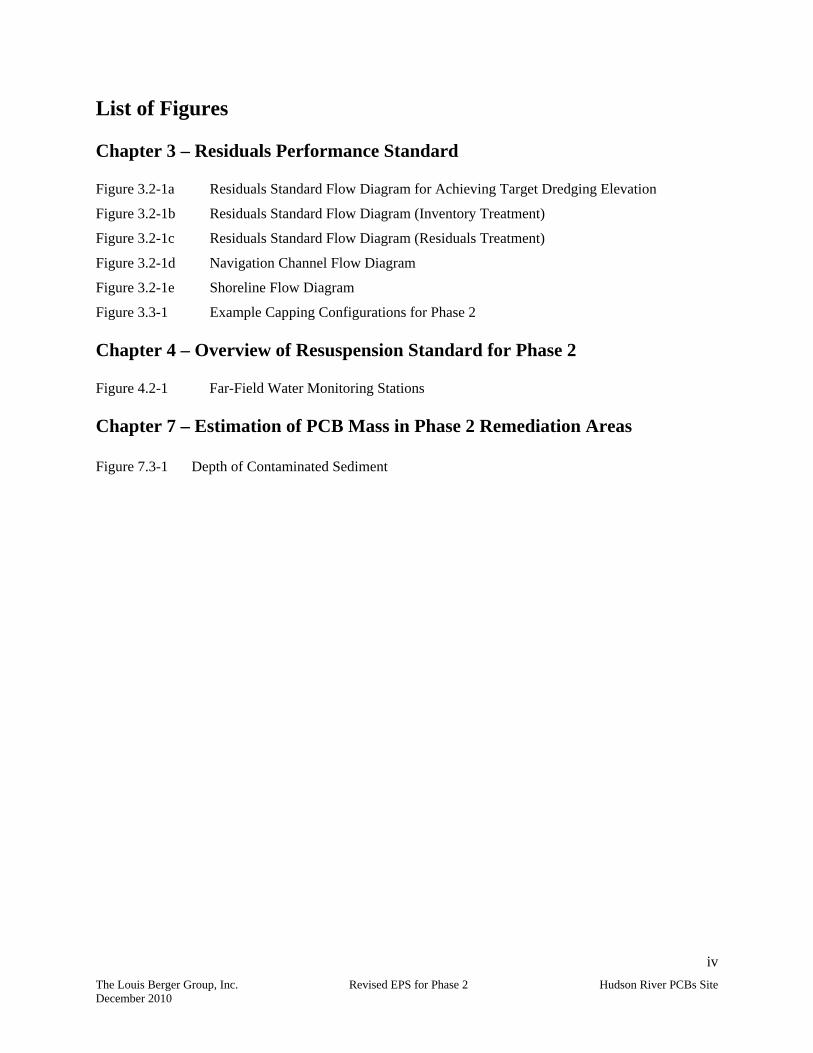
List of Figures
Chapter 3 – Residuals Performance Standard
Figure 3.2-1a Residuals Standard Flow Diagram for Achieving Target Dredging Elevation
Figure 3.2-1b Residuals Standard Flow Diagram (Inventory Treatment)
Figure 3.2-1c Residuals Standard Flow Diagram (Residuals Treatment)
Figure 3.2-1d Navigation Channel Flow Diagram
Figure 3.2-1e Shoreline Flow Diagram
Figure 3.3-1 Example Capping Configurations for Phase 2
Chapter 4 – Overview of Resuspension Standard for Phase 2
Figure 4.2-1 Far-Field Water Monitoring Stations
Chapter 7 – Estimation of PCB Mass in Phase 2 Remediation Areas
Figure 7.3-1 Depth of Contaminated Sediment
1-1
The Louis Berger Group, Inc. Revised EPS for Phase 2 Hudson River PCBs Site December 2010
1. Introduction
1.1 Overview
In April, 2004, EPA issued engineering performance standards (EPS) for Phase 1 of the Hudson River PCBs Site dredging project. These standards were published in a document entitled, Hudson River PCBs Superfund Site, Engineering Performance Standards, Statement of the Engineering Performance Standards for Dredging (USEPA, 2004). The document was printed in five volumes, as follows:
Volume 1 – Statement of the Engineering Performance Standards for Dredging
Volume 2 – Technical Basis and Implementation of the Resuspension Standard
Volume 3 – Technical Basis and Implementation of the Residuals Standard
Volume 4 – Technical Basis and Implementation of the Productivity Standard
Volume 5 – Appendix – Case Studies of Environmental Dredging Projects
In accordance with the Record of Decision (ROD) issued by EPA for the Site, the project is being implemented in two phases. Phase 1 dredging, which was completed during 2009, consisted of dredging initially at a reduced production rate to test the effectiveness of the Performance Standards and of the Phase 1 design, implementation of sediment dredging, sediment processing and disposal. Phase 2 is to be completed at full production rates and is expected to begin in the spring of 2011.
Upon completion of Phase 1 dredging in the fall of 2009, an evaluation was made to identify what, if any, changes should be made to the Performance Standards for Phase 2 of the project. Separate Phase 1 Evaluation Reports were prepared by EPA and GE which proposed changes to the Standards, and a peer review panel was convened to assist EPA in deciding which of the proposed changes should be made. The report by the Peer Review Panel was published on September 10, 2010 (Bridges, et. al., 2010) and contained recommendations for a number of changes to the performance standards for the Phase 2 work. Copies of the Panel’s report are available online at EPA’s web site for the Hudson River PCBs Site (www.epa.gov/Hudson) or by calling the EPA’s Hudson River Field Office at 518-747-4789 or toll free at 866-615-6490.
Following receipt of the Peer Review Panel’s report, EPA has adopted a number of revisions, as described herein, to the original Engineering Performance Standards published in 2004 (USEPA, 2004), which are to be implemented during Phase 2 of the Project.
1.2 Document Organization
This document presents the Phase 2 EPS and gives explanations for changes from the Phase 1 EPS. The structure of this document is similar to that of the original 2004 documents. To assure that the original text can be compared directly with the revised standards, volume, section, and page numbers are provided where references are made back to the 2004 document.
1-2
The Louis Berger Group, Inc. Revised EPS for Phase 2 Hudson River PCBs Site December 2010
This document is divided into the following sections:
1.0 Introduction
2.0 Statement of the Revised Engineering Performance Standards for Phase 2
3.0 Residuals Performance Standard for Phase 2
4.0 Resuspension Performance Standard for Phase 2
5.0 Productivity Performance Standard for Phase 2
6.0 Water Quality Requirements for In-River Releases of Constituents Not Subject to Performance Standards
7.0 Estimation of PCB Mass in Phase 2 Remediation Areas
8.0 References
Appendices
1.3 Summary of Rationale for Changes to the Standards
The first phase of the dredging program was undertaken between May and December 2009. During this time, measurements, analyses, and observations were made and recorded regarding the ability of the dredging program to adhere to the Engineering Performance Standards. Other influences on the program were noted that were not necessarily anticipated during the design of dredging or the development of the standards. This record of lessons learned during Phase 1 helps lay the basis for the changes to the Engineering Performance Standards. The standards have been modified based on the findings of EPA and GE as reported in their respective Phase 1 evaluation reports, the recommendations and observations of the Peer Review Panel, and additional analyses by EPA. Further, the standards have been simplified and streamlined to more directly reflect the conditions that were observed during the day-to-day operations of the dredging project.
As recommended by the Peer Reviewers, an adaptive management approach shall be implemented as well to assure that the Engineering Performance Standards have the ability to conform to the conditions being observed in the river as the project progresses. As such, additional studies are planned that will continue to inform the adaptive management process. These studies will allow modifications to the standards and the operations from year to year based on the experience of the previous year and knowledge of the upcoming year’s geographic scope and production targets. Much of the EPS and the approaches identified herein are predicated on the development of accurate Depth of Contamination (DoC) lines. If the DoC is not accurately identified, portions of the EPS and the dredging approach may need to be modified, as discussed below.
1.3.1 Observations from Phase 1 Dredging
Phase 1 was intended as an initial working period where production goals would be relaxed so that unanticipated conditions could be evaluated and lessons learned, providing guidance to the future and laying the groundwork for more accelerated dredging during Phase 2. The pause in production between Phase 1 and Phase 2 was planned as a time to adjust the performance standards, as needed, to be aligned
1-3
The Louis Berger Group, Inc. Revised EPS for Phase 2 Hudson River PCBs Site December 2010
with the lessons learned during the Phase 1 dredging program, and provide EPA the opportunity to reassess the dredging design and operations. The following describe some of EPA’s more salient observations from Phase 1 that have direct bearing on the Engineering Performance Standards.
Observations Concerning Residuals Based on Phase 1 Dredging Experience
As was discussed in EPA’s Phase 1 Evaluation Report, some of the elements of the original Residuals Standard were not used and proved not to be needed.
o A streamlined process was recommended by the Peer Review Panel that is based on a better characterization of DoC and a single dredging pass.1 This is discussed further in Section 2 below.
For many post-dredging cores, only the top 6-inch segments were analyzed, consistent with the Phase 1 Residuals Standard, but missing an opportunity to re-characterize the DoC where multiple dredging passes had already indicated that the DoC was not well-known. In cases where post-dredging cores indicate non-compliant levels of PCB contamination with respect to the standard, the use of the data to re-characterize DoC, in addition to characterizing the surface concentration after the dredging pass to meet the design cut line, is essential, as borne out by the Phase 1 experience with incomplete post-dredging cores.
The majority of the dredging passes after the initial pass conducted during Phase 1 were targeting inventory that was not adequately characterized prior to design, rather than addressing a true, post-dredging layer of residual sediments. The Phase 1 design cut lines were set too shallow in general; many times even post-dredging cores did not fully penetrate the depth of the contaminant inventory. Thus, the application of the Residuals Standard served to detect inventory rather than to sample and manage comparatively thin layers of dredging residuals. The number of dredging passes could have been reduced had the depth of contamination been robustly re-characterized following the initial dredging pass.
During Phase 1, the final dredging depth was more than 6 inches beyond the original design surface for nearly 70 percent of the original Sediment Sampling and Analysis Program (SSAP) locations. Of the remaining 30 percent, only 16 percent (about half of the 30 percent) had a final dredging depth within ± 3 inches of the original design cut lines. The final dredging depth was greater than 12 inches beyond the original design cut lines for 55 percent of the SSAP locations.
o The DoC for Phase 2 areas must be better defined and uncertainty in the DoC estimate must be accounted for in setting the Phase 2 design elevations. The Peer Review Panel recommended that locations of incomplete cores and missing cores from the SSAP program be fully characterized and that 20 percent of the complete cores be re-sampled.
1 For the purposes of this document, all references to a dredging “pass” mean a pass which achieves the required elevation of contamination (EoC) in at least 95 percent of a given subunit; if this elevation is not achieved, the additional dredging that must be done to bring at least 95 percent of the area at or below the EoC is still part of the same “pass.”
1-4
The Louis Berger Group, Inc. Revised EPS for Phase 2 Hudson River PCBs Site December 2010
The new and existing data should be combined as appropriate to design new dredging prisms based on elevation. EPA and GE are engaged in the effort to better define the DoC as of the time of preparation of this document.
Too many passes were required to dredge to the DoC in most certification units (CUs) and the number of passes could have been reduced had the depth of contamination been robustly re-characterized following the initial dredging pass. Despite the underestimated DoC and inaccurate dredging cut lines, three dredging passes were adequate to get most CUs close to compliance.
The inaccurate estimate of the depth of contaminated sediment was due, in part, to the presence of wood debris. Improvement needs to be made in the collection of cores, especially after dredging, including actions to re-confirm the depth of contamination. PCB-contaminated wood debris is present throughout the river and was observed in essentially all Phase 1 CUs. CUs at the northern end of the Thompson Island Pool had more debris than those in the southern end of the Pool, but it is anticipated that wood debris will be found throughout the Pool in the Phase 2 areas.
o Deposits of wood debris shall be removed entirely, where encountered, as a component of the dredging project management unless it can be shown that the wood and sediment beneath are not contaminated. Complete removal of wood debris to depth is necessary because the Phase 1 experience showed that wood debris was contaminated with PCBs to its complete depth and sediment beneath the wood debris was also contaminated.
Observations Concerning Resuspension Based on Phase 1 Dredging Experience
Based on the Resuspension Standard, monitoring data collected were used to temporarily halt dredging operations when the 500 ng/L water column Total PCB (TPCB) criterion was exceeded on three occasions. When all dredging-related activities ended, water column concentrations returned to baseline levels at all far-field stations within a month.
o Far-field monitoring shall be required throughout the Phase 2 period and the 500 ng/L TPCB threshold (along with other thresholds discussed in Section 2.2.2 below) shall still be used to help ensure that the dredging process does not cause excessive resuspension. As discussed below, exceedances, if any, of the 500 ng/L TPCB level will not necessarily lead EPA to require a shutdown, however. EPA will supply the towns of Waterford and Halfmoon with an alternate water source during the dredging period, eliminating direct withdrawals by municipal water systems in the Upper Hudson River for consumption during dredging. GE must inventory the direct use of river water by private and agricultural users from Fort Edward to Waterford. As a result, the strict requirement of shutdown at 500 ng/L TPCB has been revised to allow for operational changes or shutdown, as discussed in Section 2.2.2 below.
PCBs in the vicinity of the dredge operations were dominated by the dissolved phase, and non aqueous phase liquids (NAPL) were observed during dredging at many locations. Although PCB daily loads decreased down river significantly, a concurrent decrease was not observed in solids transport. This discrepancy suggests that PCB transport was not controlled by solids transport,

1-5
The Louis Berger Group, Inc. Revised EPS for Phase 2 Hudson River PCBs Site December 2010
especially given the significance of non-particulate PCB in the near-field. Other mechanisms that were not measured, including volatilization and dilution, likely significantly affect the transport of PCB downriver.
o As discussed in Section 4.5 below, special studies shall be undertaken by GE to assess the contributions and effects of NAPL and dissolved phase PCBs and to assess the mechanisms controlling PCB transport.
Turbidity was not a reliable surrogate for suspended solids concentrations observed in daily transect samples and suspended solids concentrations were not a good predictor for TPCB transport downstream of the dredging operations.
o Turbidity will not be used as a surrogate for suspended solids and will not be a required measurement during Phase 2. Near-field monitoring requirements for suspended solids may also be reduced as Phase 2 progresses if monitoring continues to show that suspended solids do not yield useful information. Suspended solids measurements at a reduced scope can still be used as a guide to potential adverse impacts attributable to dredging but alternative means for determining sampling locations should be evaluated. PCB shall be analyzed in all suspended solid samples so that comparability between PCB concentrations and suspended solids concentration may be assessed.
There was no significant increase in the transport of solids during dredging beyond the immediate vicinity of the dredging operation as indicated by suspended solids data, and average suspended solids concentrations in the near field were well below the suspended solids evaluation criteria for Phase 1.
o The suspended solids criteria should continue to be evaluated during Phase 2 and adjusted in accordance with the adaptive management process (hereinafter, the “Adaptive Management Process”) described in Section 7 of the revised Statement of Work that is being issued by EPA together with this EPS document.
At the Thompson Island, Lock 5, and Waterford monitoring stations, the 7-day running average net loadings for the Resuspension Standard performance targets for cumulative load for both TPCBs and Tri+ PCBs were exceeded. However, EPA’s goal of not exceeding a 1 percent loss rate to the Lower Hudson River was achieved at Waterford. The estimated rate of loss at the Thompson Island (TI) station was slightly more than 2 percent.
o The Peer Review Panel recommended that EPA set PCB load standards for Year 1 of Phase 2 equal to 2 percent and 1 percent (as measured at the TI and Waterford monitoring stations, respectively) of the Tri+ PCB mass removed. This recommendation is discussed in Section 2 below.
Several processes contributed to the PCB transport to the far-field at Thompson Island including, but not limited to: PCB mass and volume removal, velocity, vessel traffic, and disturbance of exposed contaminated surface sediments.

1-6
The Louis Berger Group, Inc. Revised EPS for Phase 2 Hudson River PCBs Site December 2010
o Improvements to various aspects of the dredging operations will be made which EPA expects will reduce the rate of PCB release in Phase 2.
It is not apparent from the available data that the dredging led to significant redistribution of contaminated sediments to non-dredged areas. Baseline water concentrations in the Upper Hudson have returned to normal, 2010 fish tissue data show no appreciable difference from baseline, and samples of sediments collected on the floodplain from 2010 spring floods immediately downstream of the areas dredged during Phase1 were found not to contain PCBs, lending further support to this finding.
o The Peer Review Panel recommended that a special study of redeposition be undertaken to assure that PCBs released during dredging are not causing significant increases in the surface sediment concentrations outside of the dredge prisms.
The monitoring data on PCB concentrations in the river water show no dredging impacts to water quality in the Lower Hudson River.
o Anticipated dredging impacts to water quality are temporally and spatially limited.
Fish tissue impact was limited to the vicinity of dredging. Dredging had no significant effect on PCB levels in fish more than 2-3 miles downstream of the Thompson Island Pool. Furthermore, 2010 fish tissue data, collected less than a year after dredging in both the Upper and Lower Hudson, show no appreciable difference from baseline.
o The overall improvement to the aquatic ecosystem health attainable by the proposed PCB mass removal outweighs temporary increases in fish PCB levels. Any increases appear to be localized and transient.
The estimate of PCB inventory and the rate of PCB release are both larger than originally estimated in the ROD and the 2004 EPS calculations, although the increased rate of PCB release showed little downstream impact to fish tissue concentrations.
o The total project cumulative PCB load criterion will be eliminated due to insufficient information to estimate the total mass to be removed, and the limited value of a total project cumulative PCB load criterion. The load standard shall instead be based on daily and annual net loads. See Section 2 below.
Observations Concerning Productivity Based on Phase 1 Dredging Experience
During Phase 1, approximately 1.8 times more sediment was removed from the CUs dredged than shown on the design drawings. The poor definition of the actual depth of contamination in those CUs calls into question the associated estimate of the total volume of sediment to be dredged during Phase 2 of the project. As a result, in spite of the extensive sampling and analysis program conducted prior to Phase 1, the actual volume of sediment cannot be estimated with any great degree of certainty and it is not currently possible to accurately define the yearly production rate needed to complete the project over any specified time period.

1-7
The Louis Berger Group, Inc. Revised EPS for Phase 2 Hudson River PCBs Site December 2010
o The current estimates of the total volume to be dredged during both phases of the project range from about 2.3 to 3 million CY. The uncertainty in defining DoC precludes making a rigorous engineering estimate, at this time, of the amount of contamination remaining to be dredged. The Peer Review Panel recommended that the target for each year be about 350,000 CY, based on the Panel members’ understanding of the process’ capacity. EPA agrees that dredging of 350,000 CY/year is achievable, but maintains that this should be the minimum volume expected and that changes to the process should result in greater capacity.
The original Engineering Performance Standards did not establish a hierarchy for compliance with the Resuspension, Residuals, and Productivity Standards, but gave equal weight to each Standard. Thus, the dredging contractor was required to achieve a given rate of productivity while, at the same time, attempting to meet the Residuals Standard and Resuspension Standard. The operational imbalance resulting primarily from poorly defined DoC, proved difficult to manage during Phase 1. The application of best management practices aimed at reducing resuspension caused some reduction in productivity, and the difficulties experienced in meeting the Residuals Standard reduced dredging productivity significantly.
o During Phase 2, the Productivity Standard will be subordinated to the Resuspension and Residuals Standards, as the Peer Review Panel recommended. As discussed in Section 2, the annual “required” dredging volumes in the original Productivity Standard are being eliminated and only target volumes are being specified. These volume targets will be revisited on an annual basis, as new information is obtained. In addition, an adaptive management approach will be applied to address the incomplete understanding of the sediment regime that will exist even when additional cores are collected.
The system intended to unload scows at the dewatering site failed to meet the EPA approved design capacity of approximately 4300 CY per day. Scow unloading could not keep up with dredge production and significant losses of productivity were experienced due to a lack of empty scows at the dredge platforms. Of a total available Phase 1 dredging time of 18,100 hours, approximately 4,800 hours, or 26 percent, were lost as dredges waited for empty scows to return from the dewatering site.
o Improvements to the sediment unloading system will be required if the unloading facility fails to have sufficient operational redundancy and to be operated in a manner that can process and ship out a minimum of 350,000 cy/year of sediment.
The failure to accurately predict DoC resulted in more dredge passes than anticipated and resulted in significant delays in dredging while additional rounds of residuals sampling were conducted, additional bathymetric maps were prepared, and new dredge cut lines were developed.
o Dredging productivity will increase if DoC is better defined in Phase 2.
GE’s specifications for the Phase 1 project required the dredging contractor to dredge to the design cut line with a precision tolerance of plus-or-minus 3 inches, measured as the average cut
1-8
The Louis Berger Group, Inc. Revised EPS for Phase 2 Hudson River PCBs Site December 2010
over a 10 foot by 10 foot square area, and to remove the total volume of sediment called for in the design as measured over any 1-acre area. The subsequent bathymetric survey frequently indicated that some 10-foot by 10-foot squares had not been dredged to a sufficient depth, and the dredging contractor was required to return to those spots and remove additional sediment to meet the 3-inch precision tolerance. Residual samples were not collected until it was confirmed that the design cut lines had been met within the 3-inch tolerance only to find from the subsequent sampling that the design cut lines had been drawn above the actual DoC.
o The Peer Review Panel recommended a shift to a “single-pass” dredging approach which requires the contractor to reach the elevation of contamination (EoC)2 in 95 percent of the CU area during the first pass. The Panel further recommended that the Residuals Standard specify setting “the Design Dredge Elevation initially to 4 inches below the modeled DoC Elevation [i.e., EoC] to account for the vertical accuracy of the dredge, referred to as dredge tolerance” (Bridges, el al., 2010). These recommendations are discussed in Section 2 below.
During Phase 1, small barges, referred to as “mini-hopper scows,” were used when dredging in shallow areas of the river. Once filled, the scows were moved to a transfer station where the sediment was unloaded and placed in a large barge for transport to the dewatering site. If an empty mini-scow was not immediately available, the dredge operator was unable to work until the filled scow was unloaded and returned to the dredge. The mini-hopper scows had 2 foot high walls, but one foot of freeboard was required to prevent water from overflowing the walls when the scow was moved. This reduced the capacity of these scows considerably. In an effort to increase the volume of sediment that could be placed in a mini-scow as well as the stability of the scow, the dredge operators were allowed to drain free water from a closed bucket before emptying it into the scow.
o During Phase 2, use of ‘mini-hopper scows” shall be minimized and bucket decanting will be prohibited. Alternate methods should be considered to dredge efficiently in shallow areas. Shallow areas shall be addressed by GE in its Remedial Action Work Plan (RAWP) submittals.
The performance standards and design specifications for Phase 1 limited inventory dredging to a maximum of two contiguous CUs. During Phase 1 operations, GE requested a revision to this requirement to permit opening a third CU when inventory targeted by the design had been completed in the upstream CU, and only clean-up dredging remained. This request was approved by EPA with the stipulation that closure occur sequentially from upstream to downstream.
2 For the purposes of Phase 2, the depth of contamination (DoC) is the depth within a core corresponding to the top of the first segment (typically six inches thick) whose TPCB concentration is less than 1.0 mg/kg. The term DoC is also used in a generic sense to refer to the thickness of contaminated sediment at a given location. The elevation of contamination (EoC) is the absolute elevation corresponding to the top of the first segment less than 1.0 mg/kg TPCB. For an individual core, the EoC is determined by measuring the absolute elevation of the sediment-water interface and then subtracting from it the DoC of the core. The EoC between cores is estimated by interpolating both the DoC and bathymetric survey data to create a continuous estimate of the EoC.
1-9
The Louis Berger Group, Inc. Revised EPS for Phase 2 Hudson River PCBs Site December 2010
o Permitting dredging in more than two contiguous CUs simultaneously may be necessary during Phase 2 to meet productivity targets. This consideration will be important when all dredging is occurring in the main stem of the River.
During Phase 1, backfilling and capping operations didn’t begin until late in the season. Backfilling and capping operations produced a visible plume of turbidity as fine-grained soil incorporated in the backfill and capping materials washed downstream during installation.
1.3.2 Need to Address DoC Issue
Observations made and obstacles encountered during Phase 1 raise some questions that need to be addressed during Phase 2, including the following major concerns:
The depth of contamination encountered during Phase 1 was underestimated by the pre-dredging investigations and hence the design of the dredging program. This underestimation resulted in several additional dredging passes to remove inventory at many locations dredged. DoC for the Phase 2 area was characterized by the SSAP coring program, which is the same investigation that characterized the DoC for Phase 1. The same coring methods were used for the Phase 2 areas, yielding similarly large areas that are characterized by incomplete cores. Because of this, the uncertainty of the DoC must be addressed in the Phase 2 design so that the Residuals Performance Standard can be achieved in an efficient manner.
o A coring program, as recommended by the Peer Review Panel, began in the fall of 2010 to address the uncertainty in the DoC. This program involves re-collecting cores at the SSAP locations where incomplete cores were originally collected and at 20 percent of the SSAP locations where complete cores were collected. Additionally, the program will collect cores from sparsely sampled areas to match the sampling density in most areas identified for dredging. The 2010 effort collected cores from the areas slated for remediation in Year 1 of Phase 2. Similar sampling surveys shall be conducted by GE prior to the start of each subsequent year of dredging. Statistical analyses of the DoC found in these cores shall be tied to elevation and used to evaluate the inherent uncertainty in measuring and interpolating the elevation of contamination (EoC), which in turn will be used to develop the Phase 2 design dredge elevations.
1.4 Interaction amongst Performance Standards for Phase 2
The Phase 1 Engineering Performance Standards were designed to balance each other, with each standard setting the requirements that potentially impacted those required by the other two standards. However, the difficulties that were encountered showed that it would be necessary to make achievement of the Productivity Standard subordinate to the other two standards, as discussed below.
1. The Residuals Performance Standard – meeting this standard is critical to achieving the long-term remedial goals of the dredging program. The Productivity Performance Standard shall not be achieved at the expense of this standard;
1-10
The Louis Berger Group, Inc. Revised EPS for Phase 2 Hudson River PCBs Site December 2010
2. The Resuspension Performance Standard – meeting this standard will prevent short-term releases from affecting the long-term remedial goals of the dredging program. The Productivity Performance Standard shall not be achieved at the expense of this standard;
3. The Productivity Performance Standard – meeting this standard is desirable to reduce costs and short term impacts to the river and adjacent communities. However, adherence shall not come at the expense of the Residuals or Resuspension Performance Standards.
2-1
The Louis Berger Group, Inc. Revised EPS for Phase 2 Hudson River PCBs Site December 2010
2. Statement of the Revised Engineering Performance Standards for Phase 2
2.1 Development of the Phase 2 Engineering Performance Standards
The fundamental principles that have guided the development of the Phase 2 EPS are described below. These principles have been developed to create a flexible set of revisions to the Phase 1 EPS to guide the Phase 2 remediation and to ensure that the cleanup meets the human health and environmental objectives of the ROD.
The principles include the following:
The standards have been developed to protect human health and the environment, while offering as much flexibility as practicable in the Phase 2 final design and implementation.
The standards have been developed to be performance-oriented rather than prescriptive in regard to means and methods.
The standards have been developed to include goals to be achieved in Phase 2 and incorporate new management practices based on the lessons learned from Phase 1.
The standards have been designed to work both together and individually to achieve the overall goals of the project.
More specific principles applicable to the three EPS are discussed in the following subsections.
2.1.1 Fundamental Principles for Development of the Phase 2 Residuals Standard
Principles for development of the Phase 2 Residuals Standard were developed to take account of the Peer Review Panel’s recommendations as well as EPA’s responses to the Panel. These principles include the following:
The primary measure of compliance with the ROD’s cleanup objective at the CU level shall be the arithmetic mean at 1 mg/kg Tri+ PCB concentration from the top six inches of post-dredging cores in a dredged area within a 5-acre CU or a 1-acre sub-unit (a sub-unit is defined as a 1-acre portion of a CU that may be treated as a single entity under certain conditions) with no underlying inventory.
Sediment sampling following dredging, but prior to placement of backfill, is necessary to verify the effectiveness of the remediation. The inclusion in the ROD of a target of approximately 1 mg/kg Tri+ PCBs concentration for sediment residuals contains an implicit directive to conduct verification sampling.
The post-dredging sampling should allow investigation of both dredging-related residuals (e.g., sediments that escaped the dredge during removal and resettled or re-deposited) and potential “missed inventory” (i.e., the original “inventory” of contaminated sediment targeted for removal by the ROD).
Using a DoC that has been better defined, and an appropriate allowance for uncertainty in the setting of the design dredge elevation, the dredging program can and should be more efficient than the

2-2
The Louis Berger Group, Inc. Revised EPS for Phase 2 Hudson River PCBs Site December 2010
program proved to be in Phase 1. As discussed in Section 2.2.1, no more than two dredging passes will be required in any dredge area, except in those rare instances, if any, where very high levels of PCBs remain after the second pass. The program includes a set of procedures that specify backfilling or capping as the completion method based on post-dredging sediment sample analyses. These procedures will facilitate the comparison of residual sediment concentrations to the ROD’s objective of approximately 1 mg/kg Tri+ PCBs.
Over the course of Year 1 of Phase 2, as discussed below, the effectiveness of the modified dredging program and the associated procedures will be evaluated relative to the objectives of the ROD and the capping limits set forth below. As needed, the program and procedures will be subject to modification, consistent with the Adaptive Management Process, to better achieve those objectives and capping limits. It is anticipated that the success of the dredging program design will largely be dependent on whether the design dredge elevation captures the true EoC. While the ROD selected a remedy focused on removal of PCBs, consistent with provisions in the 2004 EPS, capping of a small fraction of the bottom is expected. For Phase 2, an extent of capping specified as certain percentages of the area dredged (described below) shall be allowed. As discussed below, if it is found that excessive capping is occurring during Phase 2, GE will have to make changes to the design dredge elevation in the remaining CUs and/or make other changes to ensure that the limits on capping, set forth below, are not exceeded.
o The portion of each 5-acre CU or 1-acre sub-unit to be capped shall be based on the results of the post-dredge sampling nodes. Identification of nodes for capping shall consider both the presence of inventory3 and the occurrence of elevated residual contamination.
EPA has chosen to leave the cap or backfill decision threshold at 1 mg/kg Tri+ PCB rather than accepting the Peer Review Panel’s recommendation to raise it to 3 mg/kg Tri+ PCB. This choice is based on the following. In selecting the threshold of 1 mg/kg Tri+ PCB as an average for each CU based on the individual nodes, the end result is to cap (or redredge) individual nodes that largely exceed 3 mg/kg Tri+ PCB.4 The application of the 1 mg/kg Tri+ PCB criterion in Phase 1 resulted in no nodes below 3 mg/kg Tri+ PCB being identified for capping. Additionally, as part of the supporting analysis for the ROD, EPA conducted extensive model simulations based on remedies that utilized the 1 mg/kg cap or backfill threshold. Given expectations at the time of the ROD and the preparation of the original peer-reviewed EPS (USEPA, 2004), EPA did not conduct any analysis to examine the impacts of capping at a 3 mg/kg Tri+ PCB threshold. In particular, raising the threshold
3 For this purpose, “inventory” after the first dredging pass shall mean sediments having a Tri+ PCB concentration at or above 6.0 mg/kg in any 6-inch segment of a post-dredging core below the top 6-inch segment. The presence of PCBs below the top 6-inch segment indicates the dredge design elevation was inaccurate. As a result, the primary reason for the remaining contamination is inventory that was missed on the first pass and not dredging residuals, which are expected to occur only within the upper few inches of sediment of the post-dredge surface. The selection of 6 mg/kg Tri+ PCBs as a numeric threshold reflects the calculations done for the original EPS which characterized this concentration as likely indicative of inventory and not residual levels. 4 This condition occurs because of the averaging process. That is, with an average at or below 1 mg/kg Tri+ PCB, it is likely that the upper range of acceptable uncapped individual values will exceed 1 mg/kg Tri+ PCB. In fact, uncapped values above 3 mg/kg Tri+ PCB were fairly common in Phase 1 while no CU required the capping of nodes below 3 mg/kg Tri+ PCB in order to meet the Phase 1 EPS requirements.

2-3
The Louis Berger Group, Inc. Revised EPS for Phase 2 Hudson River PCBs Site December 2010
to 3 mg/kg Tri+ PCBs raises the residuals concentration and associated PCB mass essentially three-fold in areas whose cover (i.e., the backfill) is considered sacrificial and will not be maintained through time. Thus, these areas have the potential to release about 3 times as much Tri+ PCB when the sacrificial layer is lost, relative to what was originally simulated in the modeling analysis. Without further modeling analysis, the importance of this change in conditions is not known. The Panel’s assertion is correct that much of the surrounding areas are more contaminated than 3 mg/kg (e.g., up to 10 mg/kg Tri+ PCBs in River Section 1 and up to 30 mg/kg in River Sections 2 and 3). However, this perspective may not have evaluated the importance of having large areas of low concentration to effectively “dilute” the impact of the unremediated areas. This is of greatest importance in River Section 1, where more than 60 percent of the river bottom is to be remediated. It is EPA’s intention to reexamine the possibility of raising the cap or backfill threshold through the use of the model currently being developed by GE and EPA, once it has been validated and peer-reviewed.
The lateral extent of residuals or inventory capping will be defined by the edge of the CU and by the perimeter of acceptable (i.e., compliant) nodes adjacent to the area required to be capped. The boundaries of 1-acre sub-units will not be used to limit the extent of capping unless they coincide with the CU boundary. This is an approach that is protective of the environment since it serves to cap more area than strictly dictated by the sampling results.
For the purposes of evaluating and tracking the extent of capping in real time, an index of the area capped based on the number of noncompliant sampling locations has been developed. This metric will be used as the basis of compliance to facilitate field decisions while also enabling rapid assessment of the success of the remedial operations.
The ROD requires that backfill be applied where appropriate. Backfill is not appropriate for use in the navigation channel when the residual surface concentrations are equal to or less than the residual requirement of 1 mg/kg Tri+ PCBs but the water depth is such that there would be less than 14 feet of draft above the backfill at mean low water. (It was noted in the Responsiveness Summary in the ROD that backfill may not be required in the navigation channel.) Additionally there may be certain areas where habitat requirements restrict the placement of backfill. The backfill design, the cap design and the development of design criteria for backfill and cap selection have been intentionally left to the final Phase 2 design of the project.
2.1.2 Fundamental Principles for Development of the Phase 2 Resuspension Standard
Principles for development of the Phase 2 Resuspension Standard are as follows:
Concentration criteria are needed to maintain water column PCB levels below the Maximum Contaminant Level (MCL) under the Safe Drinking Water Act at Lower Hudson public water supplies5 and at the intakes of private users in the Upper Hudson.
Operations shall be conducted to minimize long-term downstream transport and redistribution of PCBs.
5 It is expected that no public water supplies in the Upper Hudson portion of the Site will use the river as their source of drinking water while Phase 2 is occurring.
2-4
The Louis Berger Group, Inc. Revised EPS for Phase 2 Hudson River PCBs Site December 2010
Short-term impacts to the water column resulting from the remediation are acceptable provided that the goals of the remediation defined in the ROD are met.
Along with the lessons learned during Phase 1, EPA is currently working with GE to develop a model for the Upper Hudson River that will aid, in conjunction with actual data (including fish tissue and sediment data), in assessing any potential impacts of dredging-related PCB releases.
Water column monitoring is needed outside the immediate vicinity of the dredging operations, to establish upstream baseline values, to address potential impacts of the full range of remedial operations, and to document water quality in the Lower River throughout the remediation.
Water column monitoring is needed in the near-field to assess the impacts of various dredging-related operations as well as to understand the nature of PCB release and subsequent fate.
The primary means of contaminant release (PCBs) is believed to be in either dissolved or NAPL form, based on the limited number of near-field measurements that show high “dissolved” or “aqueous” phase concentrations of PCBs and low suspended solids concentrations. As such, the Phase 2 standard cannot rely on measurements of suspended solids concentrations or a real-time surrogate as an early indication of TPCB release.
2.1.3 Fundamental Principles for Development of the Phase 2 Productivity Standard
Principles for the development of the Phase 2 Productivity Standard are as follows:
The Productivity Standard targets 350,000 CY of sediments to be removed per year during Phase 2, inferring but not requiring a seven to nine year time frame for the completion of dredging. Allowing this flexibility to the Productivity Standard is recommended by the Peer Review Panel, based on a variable estimate of the volume necessary to be removed. The volume and spatial extent of Phase 2 are sufficient to allow compliance with the other two standards as well as the Productivity Standard itself.
In addition, as the Peer Review Panel recommended, an area-based element to the Productivity Standard will be useful in assessing the progress of the operation, since reduction of surface concentration is one of the ROD goals.
Faster dredging does not necessarily equate to a higher resuspension rate. Based on experience gained during Phase 1 and from other environmental dredging projects, dredging slower as well as faster than an optimal operating range, may increase resuspension.
While it is desirable to meet the Productivity Standard, satisfaction of this standard must not come at the expense of the long term goals of the project.
2.2 The Phase 2 Engineering Performance Standards
This section provides a brief statement of the standards. Additional details on the implementation and supporting discussion for each of the standards can be found in Sections 3 through 5.
2.2.1 Residuals Standard
The Performance Standard for Dredging Residuals for Phase 2 (referred to as the Phase 2 Residuals Standard) is designed to detect and manage contaminated sediments that may remain after initial dredging
2-5
The Louis Berger Group, Inc. Revised EPS for Phase 2 Hudson River PCBs Site December 2010
in the Upper Hudson River. It is also designed to confirm that the EoC has been accurately identified and interpolated. The residual sediments may consist of:
Contaminated sediments that were disturbed but escaped capture by the dredge. Resuspended sediments that were redeposited (settled). Contaminated sediments remaining below the design dredging cut elevations (e.g., due to
uncertainties associated with interpolations between pre-design sampling nodes or insufficient core recovery).
Residual Standard Objectives
EPA’s 2002 ROD (USEPA , 2002) states that the selected remedy includes the “removal of all PCB-contaminated sediments within areas targeted for remediation, with an anticipated residual of approximately 1 mg/kg Tri+ PCBs (prior to backfilling).” The primary objectives of the revised Residuals Standard for Phase 2 dredging are:
Achieving the design DoC elevation (also known as the EoC).
Achieving a residual concentration of no more than 1 mg/kg Tri+ PCBs, with subsequent backfilling, while minimizing the need for capping.
Identifying areas where capping or a second pass is needed because the residual sediment arithmetic average Tri+ PCBs concentration is greater than 1 mg/kg in the top six inches.
Identifying areas where a second pass is needed because PCB inventory remains at depth or PCB concentrations of greater than or equal to 27 mg/kg Tri+ PCBs are present in surface sediments after the first pass is complete.
Identifying areas where post-dredging concentrations are greater than or equal to 500 mg/kg TPCB so these can be removed in an additional pass.
Discerning and mapping the extent to which the EoC has been accurately identified and interpolated as a basis to revise the Residuals Performance Standard criteria and/or the Phase 2 design in the event that the extent of capping exceeds the limits on capping that are set forth below.
Providing data to evaluate the success of the remediation in attaining the true EoC and to provide a basis to adjust the design dredge elevation in subsequent CUs so as to minimize the number of passes and amount of non-target sediment removed.
Response to Peer Review Panel’s Recommendation of Single Pass Dredging Approach
In its report, the Peer Review Panel recommended that to reduce PCB resuspension and increase overall project productivity, a single-pass dredging program be employed in Phase 2. The Panel emphasized, however, that “[t]he only way to reduce the number of passes while satisfying the goals of the Residuals EPS is to more precisely establish Design Dredge Elevations prior to dredging.” (Peer Review Report, p. 51. (Bridges, et al., 2010)) The Panel therefore recommended that re-coring be conducted in all locations where the Sediment Sampling and Analysis Program (SSAP) yielded low-confidence samples, areas of missing data, and in 20 percent of the high-confidence core locations, and that the dredge prisms be

2-6
The Louis Berger Group, Inc. Revised EPS for Phase 2 Hudson River PCBs Site December 2010
updated on the basis of these new sampling data. The Panel also recommended that the design dredge elevation include “an allowance to compensate for the vertical tolerance in dredge bucket positioning.” (Peer Review Report, p. 52.)
EPA has carefully considered these recommendations. EPA agrees that the DoC must be better defined than it was prior to Phase 1 and that accordingly, re-sampling must be performed in all of the SSAP low-confidence core locations, areas of missing data and in 20 percent of the high-confidence core locations. GE began such a resampling effort in 2010, and the resampling must be continued in the coming years, such that before the dredging occurs in any certification unit during Phase 2, the dredge prisms for that CU have been redrawn, as needed, in light of the new sampling data. EPA further agrees with the Peer Review Panel that these new cores should “attain at least 80 percent recoveries of soft sediments and must be cored either to bedrock or [glacial Lake Albany clay].” (Bridges, et al., 2010)
EPA further agrees with the goal of increasing the efficiency of the dredging program, relative to the way in which it was carried out in Phase 1, as well as the goal of constraining the resuspension that occurs. Nevertheless, certain factors must be taken into account in considering the Panel’s recommendation of a one-pass approach. These include:
There is significant variability in the depth of contamination in the Phase 2 dredge areas, even among co-located cores. The mean difference between closely spaced paired cores is 9 inches, based on the SSAP program. Sampling conducted in 2010 to examine this issue confirmed this level of variability between closely spaced cores. This variability, together with the fact that the sampling nodes are generally spaced 80 feet apart, means that even if the sediment re-coring efforts succeed in achieving high-confidence complete cores in all locations, there will always be substantive uncertainty regarding the DoC between core locations.
While GE must use its best efforts during the sediment re-coring program to attain at least 80 percent recoveries, meeting this goal may not always be possible due to river bottom conditions. GE made significant strides in improving its core recoveries in 2010, but 40 percent of locations occupied yielded cores with less than 80 percent recovery. (As stated in Section 3.3.2 below, if post-dredging sampling by Vibracore does not yield core recoveries of 80 percent or greater, then an alternative sampling method that will produce sufficient core length must be employed, unless EPA, in its sole discretion, allows otherwise.)
During Phase 1, even in the high-confidence core areas, PCB inventory was often found to have been left behind after the first pass. On some occasions, such remaining contamination was in the hundreds of parts per million total PCBs.
The ROD (USEPA, 2002) specifies a goal of “[r]emoval of all PCB-contaminated sediments within areas targeted for remediation, with an anticipated residual of approximately 1 mg/kg Tri+ PCBs (prior to backfilling).”
Shoreline areas and the navigation channel present special challenges that hinder a pure one-pass approach. (See Statement of the Residuals Performance Standard below.)

2-7
The Louis Berger Group, Inc. Revised EPS for Phase 2 Hudson River PCBs Site December 2010
After considering these factors and the Peer Review Panel’s recommendations, EPA has decided to adopt a modified approach for Phase 2. The success of this approach will be evaluated as Phase 2 progresses, and as needed, the approach will be modified, consistent with the Adaptive Management Process.
The key features of this approach are, in summary:
Establishment of new design dredge elevations that take into account the results of the sediment re-coring efforts and uncertainty regarding the DoC;
Achievement of the design dredge elevation in at least 95 percent of each dredging sub-unit;
Once the greater than or equal to 95 percent requirement has been met, sampling to determine what PCB levels remain, both at the surface and at depth;
A second dredging pass to a newly defined dredge elevation at all nodes where inventory or elevated concentration residuals are found after the first pass (with “inventory”, for this purpose, meaning greater than or equal to 6.0 mg/kg Tri+ PCBs present in any 6-inch segment of the post-dredging core other than the upper-most 6-inch segment, and “elevated concentration residuals” meaning sediments with 27 mg/kg Tri+ PCBs or greater present in the 0-6 inch segment);
Backfilling of those CU’s or 1-acre sub-units with an average surface concentration, after dredging, of less than or equal to 1 mg/kg Tri+ PCBs;
Exclusive of the nodes identified with inventory or elevated concentration residuals (as defined above), if after the first dredging pass, one or more nodes in a CU or 1-acre sub-unit have PCB concentrations in the top 6 inches which drive the average surface concentration of the CU or sub-unit above 1 mg/kg Tri+ PCBs, that node(s) shall either be capped or redredged, at GE’s discretion, subject to the capping limits described in Section 3.4 below;
Where a second dredging pass is done, an initial 3- to 6-inch layer of sand or backfill shall promptly be placed over the dredged CU or sub-unit after the design dredge elevation has been met in greater than or equal to 95 percent of the area and post-dredging samples have been collected. Depending on the sample results, the location shall then either be capped or backfilled (except as further provided below). Capping, rather than backfill, is required in the event that: 1) the Tri+ PCB concentration in surface sediment (i.e., in the top 6 inches) at that node causes the average Tri+ PCB concentration for the CU or sub-unit to exceed 1 mg/kg, 2) the Tri+ PCB concentration in surface sediment at that node is greater than or equal 27 mg/kg, or 3) inventory is found to exist at that node (i.e., concentrations of Tri+ PCB are greater than or equal to 6 mg/kg in segments deeper than 6 inches). However, if the sample results show that TPCB concentrations of greater than or equal to 500 mg/kg are present at any depth in that location after a second pass, a third dredging pass shall be performed there to a newly defined dredge elevation;
Final cap delineation of noncompliant locations are subject to EPA approval;
Special procedures, described below, shall be followed in those dredging areas which exist in the navigation channel, to take account of the navigation requirements and maintenance dredging of the New York State Canal Corporation;
Special procedures, described below, shall also be followed in shoreline dredging areas, to take account of shoreline stability considerations.

2-8
The Louis Berger Group, Inc. Revised EPS for Phase 2 Hudson River PCBs Site December 2010
These summary elements are all explained in greater detail below in this section and in Section 3. Based on the currently available information, EPA believes that this approach is consistent with the ROD while at the same time ensuring that the project is conducted in an efficient manner that constrains resuspension. The approach will be evaluated on an ongoing basis and will be modified as needed to ensure that the objectives of the ROD and the capping limits set forth in Section 3.4 are met.
The requirements of the Phase 2 Residuals Standard are listed below along with an explanation of how the Residuals Standard will be used to accomplish the objectives given previously. As indicated below, the approach to dredging requires an accurately defined EoC that also reflects the uncertainty of the DoC measurement and the EoC interpolation process. Without accounting for the uncertainty in the sampling and interpolation process, the ROD’s objective of “removal of all PCB-contaminated sediments within areas targeted for remediation, with an anticipated residual of approximately 1 mg/kg Tri+ PCBs (prior to backfilling)” will not be met.
Statement of the Residuals Performance Standard
General Dredge Area Procedure
1. Upon completion of the first dredging pass to a previously determined design dredge elevation and achievement of this elevation in 95.0 percent or more of the dredged area within an 1-acre sub-unit, post-dredging cores will be collected 80-ft on center offset 46 feet (at the midpoint between nodes) from the original sampling grid (SSAP grid) for a minimum of 40 core sites per CU (8 core sites per 1-acre sub-unit). Post-dredging cores will be collected to 4 feet or bedrock, whichever is encountered first. Cores will be analyzed for PCBs (both TPCB and Tri+ PCB) down the entire length of the core, or to the occurrence of glacial Lake Albany clay, except in locations where the original DoC was 18 inches or less; then only the first two feet of core must be analyzed, while preserving the remaining core for analyses if the DoC is not found in the first 2 feet. Post-dredging cores will also be collected in shoreline areas to sample the wedge left behind due to engineering constraints as well as to characterize residual contamination in the shoreline in general; sampling density of these cores will be the same as in Phase 1 (80 feet on-center). The collection of data on the EoC in the CU after dredging will allow the evaluation of the success of the EoC interpolation and the Phase 2 dredging prism design. These analyses are necessary to calculate the inventory volume remaining and to assess the success of the design and its implementation in capturing the EoC.
2. Post dredging cores will be segmented into 6-inch intervals. Each 6-inch interval of the post-dredging cores will be analyzed for TPCBs and Tri+ PCBs until 2 consecutive 6-inch intervals have TPCB concentrations below 1 mg/kg. If two consecutive segments that have TPCB concentrations below 1 mg/kg are not found, a second 8-foot core will be collected and the bottom 4 feet will be segmented into 6-inch intervals and analyzed. This process will continue until two consecutive 6-inch segments with TPCB concentrations below 1 mg/kg are identified or glacial Lake Albany clay or bedrock is encountered. All core segments in the initial 4-foot cores will be analyzed for locations where the original DoC was greater than 18 inches unless glacial Lake Albany clay is found. For locations where the original DoC was 18 inches or less, only the top 2 feet need to be submitted initially. In any event, all post-dredging cores must be analyzed to depth until 2 consecutive 6-inch intervals have TPCB concentrations below 1 mg/kg .
2-9
The Louis Berger Group, Inc. Revised EPS for Phase 2 Hudson River PCBs Site December 2010
3. After the first and any subsequent dredging pass, the post-dredge sampling results will be documented and used to characterize the nodes of the CU (or 1-acre sub-unit) into one of five categories:
a. Inventory is present in one or more nodes (i.e., sediment below 6 inches contains Tri+ PCB concentrations greater than or equal to 6.0 mg/kg).
b. Tri+ PCB concentrations in the 0-6 inch segment at any node are 27 mg/kg or above, i.e., elevated concentration residuals.
c. Elevated TPCB concentrations greater than or equal to 50 mg/kg are present at a shoreline node.
d. Elevated (noncompliant) residual concentrations are present such that the average surface concentration of all nodes, exclusive of those with inventory or “elevated concentration residuals” (as defined above), is greater than 1 mg/kg Tri+ PCB (1.49 mg/kg, allowing for rounding).
e. Compliant residual concentrations are present such that the average surface concentration of all nodes, exclusive of those with inventory or elevated concentration residuals, is less than or equal to 1 mg/kg Tri+ PCB (i.e., less than or equal to 1.49 mg/kg, allowing for rounding)
All nodes are considered in this evaluation but special consideration is given to nodes at the shoreline and in the navigational channel, as described later in this statement of the standard.
4. Nodes in categories a., b., and c. shall be redredged as part of a second dredging pass for the CU.
5. Nodes that do not fall into categories a., b., or c. are by definition residual nodes and must be evaluated as a group for the CU or subunit. The decision to treat individual residual nodes by backfilling, capping or a second dredging pass will depend on whether the mathematically averaged surface Tri+ PCB concentration in the sub-unit or CU is equal to or less than 1 mg/kg, exclusive of those nodes in categories a., b., and c.. If the average surface concentration of residual nodes in the sub-unit or CU exceeds 1 mg/kg Tri+ PCBs, a subset of the residual nodes shall be selected for capping or redredging such that the average of the remaining area is no more than 1 mg/kg Tri+ PCB. Detailed instructions for backfilling or capping the sub-unit are provided in a flow diagram (presented as Figure 3.2-1). Cap or redredging boundaries shall extend to the perimeter of compliant nodes or to the edge of the CU. Further details on capping and redredging design are provided in Section 3. There must be at least 2, and more typically 3, adjacent nodes at or below the 1 mg/kg Tri+ PCB level to define a backfill area.
6. For nodes in categories a., b., and c. above, the EoC at each location must be reestablished and the area re-dredged. A second round of sampling will be necessary to confirm that dredging has captured the true EoC.
7. For nodes in category d., GE may choose to redredge these locations to their revised EoCs based on the respective residual cores or simply cap them (subject to the capping limits set forth below). Capping should wait until after any subsequent dredging passes, if needed for other reasons, are completed for the CU. In the event that a sub-unit average is less than or equal to 1 mg/kg Tri+ PCB,
2-10
The Louis Berger Group, Inc. Revised EPS for Phase 2 Hudson River PCBs Site December 2010
GE can propose to backfill the sub-unit in the event it is upstream and isolated from the areas being redredged.
8. Upon completion of a second dredging pass to the revised EoC and achievement of this elevation in 95.0 percent or more of the dredged area, all redredged locations must be resampled to a depth of 4 feet. The analysis of core segments in each core follows the same guidance as in Step 2, based on the revised EoC. A 3 to 6-inch layer of cover material (e.g., Type 2 backfill) shall then be placed over the dredged CU (or sub-unit) immediately after the post-dredging sampling. EPA anticipates that the initial cover will be amended with organic carbon but the final selection of material for the initial cover will be completed as part of the Phase 2 Final Design.
9. Steps 2 through 7 are then repeated for the CU with the following exceptions:
a. After the second pass, nodes falling into categories a., b., c., and d. will be addressed by capping. A third dredging pass to address these nodes is not permitted; subject to item b. below.
b. Nodes with any segment containing TPCB concentrations greater than or equal to 500 mg/kg require a third pass unless otherwise directed by EPA.
10. Based on the results of step 9, define the areas of the CU for capping and backfilling, after allowing for the shoreline and navigational channel treatments.
Considerations for Navigational Channel Areas
Many CU’s contain portions of the navigational channel within their boundaries. Due to the draft requirements to operate and maintain these areas, several additional rules apply in these areas in addition to the rules listed above.
1. If a CU contains navigational channel area, residual core(s) must be obtained from the channel area at the rate of approximately one core per eighth of an acre of channel area. In the event that a node in the navigation channel is not compliant and requires treatment and the water depth after the first pass is less than 15 feet below mean low water, additional dredging must be done at the node to a depth that will allow the placement of a high velocity cap or to the re-defined EoC, whichever is greater. Note that a cap cannot be placed in the channel unless the water depth prior to placement is at least 15 feet below mean low water or greater, thus if a navigational node is noncompliant after the first pass, it will require a second pass.
2. Redredging boundaries for channel areas are defined as for the general case, by CU boundary or perimeter of compliant cores. To the extent that the dredge prism associated with a channel node extends beyond the channel, the area outside the channel need only be dredged to the revised EoC, with additional removal to create stable slopes to the required dredging in the channel area, as needed. To the extent that a node external to the channel requires redredging and has an associated area that extends into the channel area, the area of the channel influenced by the node must be dredged to a depth that will allow the placement of a high velocity cap or to the re-defined EoC, whichever is greater, with additional removal to create stable slopes to the required dredging in the channel area, as needed.
2-11
The Louis Berger Group, Inc. Revised EPS for Phase 2 Hudson River PCBs Site December 2010
3. No backfill will be placed in the navigation channel resulting in less than 14 ft of draft at mean low water after placement. If capping is necessary in the navigation channel, its design and implementation must be such that the top of the cap allows for a minimum of 14 feet of draft at mean low water to allow for future maintenance dredging by the NYSCC.
Considerations for Shoreline Areas6
Many CUs border the shoreline where engineering considerations for bank stability may limit the amount of sediment that can be dredged without risking bank failure. These considerations address these areas.
1. For shoreline areas, if TPCB concentrations in sediments below the design dredge elevation (typically equivalent to an initial 2-ft removal) are equal to or greater than 50 mg/kg, these sediments must be removed. If TPCB concentrations in sediments below the design dredge elevation are less than 50 mg/kg, the node is evaluated as part of the CU average on a Tri+ PCB basis and treated accordingly. The node is treated similarly after the second pass when a second pass is required. The shoreline area will be evaluated as part of the CU and not as a separate area for residual calculations and capping purposes. Only two dredging passes will be permitted in the shoreline areas unless sediments over 500 mg/kg TPCB are found after the second pass.
2. In the event that shoreline cores are not available prior to dredging in a shoreline area, the initial removal at the shoreline shall be 2 feet, following the stable slope requirements out to the area bounded by dredging design cores (existing SSAP and newly collected cores) or to the intersection of the stable slope surface and the DoC as directly measured by the bounding cores adjusted for uncertainty, whichever is closer to shore.
Compliance with the Residual Standard: Assessment of Capping
The following criteria address the extent of capping and its basis for measurement.
The total area capped shall not exceed 11 percent of the total area dredged during Phase 2. In addition, the total area capped that has inventory present (i.e., Tri+ PCB contamination greater than or equal to 6.0 mg/kg in any 6-inch segment below the top 6-inch segment) shall not exceed 3 percent of the total area dredged during Phase 2.
1. Where capping in the following types of areas is allowed by EPA, those caps shall not count against the capping limits set forth immediately above:
a) locations capped due to structural offsets;
6 The shoreline area in RS-1 is defined as the region between the Ft Edward 5,000 cfs shoreline (approximately 119 ft NGVD in RS-1) and 117.5 contour, consistent with the observation of a natural break in bottom slope as described in EPA’s November 9, 2006 letter Final Decision Regarding General Electric Company’s Disputes Regarding EPA’s June 23, 2006 Comments on Phase 1 Final Design Report.(USEPA,2006) and is generally just above the mean low water level (117.2 ft NGVD in RS-1). The shoreline area is defined in a similar fashion for the subsequent river sections, using the shoreline defined at a 5,000 cfs flow at Ft Edward and the natural offshore break in slope, typically around the mean low water level.
2-12
The Louis Berger Group, Inc. Revised EPS for Phase 2 Hudson River PCBs Site December 2010
b) locations capped due to the presence of cultural resources; c) locations capped within the shoreline area; d) locations capped due to the presence of exposed bedrock; e) locations capped due to the presence of exposed glacial Lake Albany clay.
2. The extent of capping is measured as a proportion of each CU and is directly proportional to the number of nodes capped, based on an area weighted nodal tally referred to as the Nodal Capping Index. In this manner, this metric measures the proportion of locations where the goals of mass removal and surface concentration reduction were not entirely met by dredging and capping was required. The actual complex geometry of cap layout is avoided in this formulation to simplify the calculation and permit easy tracking of the metric by GE and EPA during the actual operations. It also avoids the complicated geometry introduced by the conservative approach in cap layout resulting from capping to the perimeter of compliant cores. Nodes placed in structural set-back areas, and cultural resource areas, are also not included because they generally represent very small areas compared to the 80-ft-on-center gridded sampling nodes (i.e., field nodes) and their inclusion would serve to exaggerate their importance. The formula to determine the Nodal Capping Index is given in Section 3.4. This same formula is used to determine the extent of capping of inventory by substituting the tally of capped inventory nodes in place of the tally of capped nodes.
3. As explained in more detail in Section 3.4, the two capping monitoring levels, the Evaluation Levels and Control Levels, shall be used to evaluate, on an ongoing basis, the degree of success of the dredging design – in particular, the design DoC – in ensuring that the percentage capping limits set forth above and measured by the Nodal Capping Index are not exceeded in Phase 2, taken as a whole, and to help enable adjustments to be made, as needed, to the design dredge elevation and the dredging process to ensure that those capping limits will not be exceeded. Note that compliance with the capping limits requires regular review, with the first review point each year being the point in time when post-dredging sampling has occurred in 100 nodes. Further information regarding the timing of the reviews is set forth in Section 3.4. Failure to remain below the Evaluation Level capping percentages at each evaluation point will require GE to prepare and implement a plan to reduce the extent of capping through modification to the design and operation. If GE does not remain below the Control Level capping percentages, EPA may, at its discretion, direct GE to make specific modifications to the design and its implementation. See Section 3.4 for more information.
4. In addition to these monitoring requirements, GE shall also monitor and report to EPA the following information for each CU within two weeks following each CU closure:
a) locations and actual area capped due to structural offsets; b) locations and actual area capped due to the presence of cultural resources; c) locations and actual area capped in the shoreline area; d) locations and actual area capped due to the presence of bedrock; e) locations and actual area capped due to the presence of glacial Lake Albany clay; f) locations and actual area capped due to residual level exceedance;
2-13
The Louis Berger Group, Inc. Revised EPS for Phase 2 Hudson River PCBs Site December 2010
g) locations and actual area capped due to the presence of inventory; h) locations and actual area with compliant nodes i) Nodal Capping Index and cumulative totals of all areas and locations listed
above.
In addition to the discussion of the Phase 2 Residuals Standard in this subsection, Section 3, Technical Basis and Implementation of the Residuals Standard, provides the technical background and approach, supporting analyses, and rationale for the development of the standard.
2.2.2 The Resuspension Standard
The Performance Standard for Dredging Resuspension during Phase 2, hereafter referred to as the Phase 2 Resuspension Standard, is designed to limit the export of PCBs from sediment during remedial dredging and to protect downstream water quality. The Phase 2 Resuspension Standard addresses both long-term and short-term impacts in terms of long-term and short-term criteria. In general, short term criteria are intended to aid in setting operational controls for resuspension so that long term impacts can be minimized. Long-term criteria are intended to help secure the long-term recovery of the river and its biota. The Phase 2 Resuspension Standard is primarily comprised of a series of control levels at the far-field stations, the exceedance of which will trigger, at EPA’s discretion, monitoring contingencies, engineering evaluations, engineering solutions, operational changes, and/or, as a last resort, temporary shutdown of dredging operations. In addition, the standard includes an advisory level TSS concentration at the near field stations that can be used at EPA’s discretion to recommend engineering evaluations of resuspension performance.
Statement of the Resuspension Performance Standard Control Level for Total PCB Concentration
The Phase 2 Resuspension Standard for water column PCB concentrations is the control level concentration of 500 ng/L TPCBs, which shall be applied as follows:
1. When dredging is being performed in River Section 1:
a. If and when there is a confirmed exceedance of 500 ng/L TPCBs at the Thompson Island or Lock 5 monitoring stations, EPA may require GE to conduct evaluations of the dredging operations and/or implement best management practices (BMPs) that do not require GE to slow down or shut down the dredging operations.
b. If and when concentrations exceed 500 ng/L TPCBs at the Lock 5 monitoring station for five days out of any seven-day period, EPA may require GE to conduct evaluations of the dredging operations and/or implement operational changes which include slowdown or shutdown of dredging operations. In general, a slowdown and evaluation of operations would be required before shutdown, with shutdown being the operational change of last resort. If EPA does require a slowdown or shutdown, normal operations shall not resume

2-14
The Louis Berger Group, Inc. Revised EPS for Phase 2 Hudson River PCBs Site December 2010
until the concentration at the Lock 5 monitoring station is confirmed to be below 500 ng/L Total PCBs for 2 consecutive days, unless EPA allows otherwise.
2. When dredging is being performed in River Section 2 between the Thompson Island Dam and one mile upstream of the Lock 5 monitoring station:
a. If and when there is a confirmed exceedance of 500 ng/L TPCBs at the Lock 5 monitoring station, EPA may require GE to conduct evaluations of the dredging operations and/or implement BMPs that do not require GE to slow down or shut down the dredging operations.
b. If and when concentrations exceed 500 ng/L TPCBs at the Lock 5 monitoring station for five days out of any seven-day period, EPA may require GE to conduct evaluations of the dredging operations and/or implement operational changes which may include slowdown or shutdown of dredging operations. In general, a slowdown and evaluation of operations would be required before shutdown, with shutdown being the operational change of last resort. If EPA does require a slowdown or shutdown, normal operations shall not resume until the concentration at the Lock 5 monitoring station is confirmed to be below 500 ng/L TPCBs for 2 consecutive days, unless EPA allows otherwise. EPA recognizes that higher concentrations might be observed at Lock 5 when dredging is being conducted at Hot Spot 28, particularly during higher river flows. EPA will evaluate the concentration standard during this time and consider changes through adaptive management, if appropriate.
3. When dredging is being performed between less than one mile upstream of the Lock 5 monitoring station and one mile upstream of a new monitoring station that GE shall install at Stillwater:
a. If and when there is a confirmed exceedance of 500 ng/L TPCBs at the Stillwater monitoring station, EPA may require GE to conduct evaluations of the dredging operations and/or implement BMPs that do not require GE to slow down or shut down the dredging operations.
b. If and when concentrations exceed 500 ng/L TPCBs at the Stillwater monitoring station for five days out of any seven-day period, EPA may require GE to conduct evaluations of the dredging operations and/or implement operational changes which include slowdown or shutdown of dredging operations. In general, a slowdown and evaluation of operations would be required before shutdown, with shutdown being the operational change of last resort. If EPA does require a slowdown or shutdown, normal operations shall not resume until the concentration at the Stillwater monitoring station is confirmed to be below 500 ng/L TPCBs for 2 consecutive days, unless EPA allows otherwise.
4. During dredging in any river section, if there is a confirmed exceedance of 500 ng/L TPCBs at the Waterford monitoring station, EPA may require GE to conduct evaluations of the dredging operations and/or implement operational changes which include slowdown or shutdown of dredging operations. In general, a slowdown and evaluation of operations would be required before shutdown, with shutdown being the operational change of last resort. If EPA does require a slowdown or shutdown, normal operations shall not resume until the concentration at the

2-15
The Louis Berger Group, Inc. Revised EPS for Phase 2 Hudson River PCBs Site December 2010
Waterford monitoring station is confirmed to be below 500 ng/L TPCBs for 2 consecutive days, unless EPA allows otherwise.
5. Any evaluation of operations resulting from an exceedance of 500 ng/L TPCBs for five days out of any seven-day period at the Lock 5 or Stillwater monitoring stations, or from a confirmed exceedance of 500 ng/L Total PCBs at the Waterford monitoring station, shall, if directed by EPA, include an evaluation of all upstream operations, and not only of the operations immediately upstream of the monitoring station where the exceedance was detected.
6. At any time that either Halfmoon or Waterford are unable to obtain water from Troy, EPA may at its discretion require a slowdown or shutdown of dredging based on a single exceedance or multiple exceedances of 500 ng/L Total PCBs at Lock 5, Stillwater or Waterford. Unless EPA allows otherwise, the slowdown or shutdown would continue until PCB levels return below a confirmed level of 500 ng/L Total PCBs, or until both Waterford and Halfmoon are once again obtaining water from Troy.
7. EPA may, at its discretion, through adaptive management, increase the minimum one-mile distance between dredging operations in River Sections 2 and 3 and the far-field station to be used.
Control Level for Water Column Tri+ PCB Load
The far-field numerical net Tri+ load criteria consist of a seasonal or cumulative net load that will be tracked via a daily net load. As recommended by the Peer Review Panel and described below, the cumulative net load criteria for each dredging season are 2 percent (at the first far field station which is at least 1 mile downstream of the dredging) and 1 percent (as monitored at the Waterford station) of the Tri+ PCB mass to be removed during the dredging season, regardless of stream flow rates. The criteria will be applied on a daily basis as follows:
1. When dredging is being performed only in River Section 1, the daily Tri+ PCB load standards shall be 2 percent and 1 percent (as measured at the Thompson Island Dam and Waterford monitoring stations, respectively) of the Tri+ PCB mass removed, if concurrent streamflows measured at Fort Edward are under 5,000 cfs. If flows are greater than 5,000 cfs, the specified percentages are increased to 3 percent and 2 percent at Thompson Island Dam and Waterford stations, respectively. When dredging operations are being performed concurrently in more than one river section, the daily 3 percent or 2 percent (depending on whether flows are higher or lower than 5,000 cfs, respectively) Tri+ PCB load standard shall apply at the closest far-field monitoring station, other than Waterford, that is at least one mile downstream of the southernmost dredging operation in each river section. The daily PCB load standard at Waterford shall continue to be 2 percent or 1 percent (depending on whether flows are higher or lower than 5,000 cfs, respectively) of the Tri+ PCB mass removed unless, in the future, EPA decides to modify or eliminate the load standard that applies at Waterford during times that dredging operations are being performed downstream of River Section 1.
2. Compliance with the daily PCB load standards shall be determined based on a 7-day running average of the measured Tri+ PCB net load.
2-16
The Louis Berger Group, Inc. Revised EPS for Phase 2 Hudson River PCBs Site December 2010
a. For all far-field stations excluding Waterford, if the 7-day running average Tri+ PCB net load exceeds the 2 percent load standard for 14 or more consecutive days when the average flow during the same period, as measured at Fort Edward, is under 5,000 cfs, or exceeds the 3 percent load standard when the average flow during the same period is above 5,000 cfs, EPA may require GE to conduct evaluations of the dredging operations and/or implement operational changes which include slowdown of dredging operations.
b. For the Waterford station, if the 7-day running average Tri+ PCB net load exceeds the 1 percent load standard for 21 or more consecutive days when the average flow during the same period, as measured at Fort Edward, is under 5,000 cfs, or exceeds the 2 percent load standard when the average flow during the same period is above 5,000 cfs, EPA may require GE to conduct evaluations of the dredging operations and/or implement operational changes which include slowdown of dredging operations.
c. If EPA requires a slowdown, normal operations shall not resume until the Tri+ PCB load is below the 3 percent, 2 percent or 1 percent load standard, as the case may be, for 2 consecutive days, unless EPA allows otherwise.
3. Through adaptive management, EPA will consider adjustments to the 7 day running average period for the load standards if high flow conditions in the river and the effect of time of travel on export rates are coincident with high frequency of exceedences at the far field stations. EPA will also consider, through adaptive management, whether an evaluation and a control level are appropriate for the load standards.
4. If one or more of the annual PCB load standards is/are exceeded, EPA may require GE to conduct evaluations of the dredging operations and/or implement operational changes in the subsequent seasons.
On a day-to-day basis, the seasonal or cumulative load criteria will be tracked by comparing the net daily numerical load criteria, which represent a proration of the 3 percent, 2 percent and 1 percent load standards based on the anticipated number of dredging days in the season and the planned mass removal, to the measured daily Tri+ PCB water column net load at the applicable monitoring stations. The following equation shall be used for the daily numerical net load criteria calculations unless EPA approves an alternative formulation using day-to-day estimates of the mass to be removed:
Net Daily Load T PCB M %
Where % allowable release = 2% at Thompson Island or Lock 5 or Stillwater for flows less than
5,000 cfs at Ft Edward = 3% at Thompson Island or Lock 5 or Stillwater for flows greater than 5,000 cfs = 1% at Waterford for flows less than 5,000 cfs at Ft Edward = 2% at Waterford for flows greater than 5,000 cfs at Ft Edward

2-17
The Louis Berger Group, Inc. Revised EPS for Phase 2 Hudson River PCBs Site December 2010
The actual net load at each monitoring station is obtained by subtracting the estimated baseline load from the gross PCB load at each far field station. Baseline load is estimated in the same manner as in Phase 1 and is described in Section 4 of this document.
Detailed definitions of the near field and far field are presented in Section 4. Additional monitoring requirements for the Lower Hudson are described in Section 4 as well.
Consistent with the Adaptive Management Process, the Phase 2 Resuspension Standard will be revised by EPA, if and as necessary, at the end of each Phase 2 dredging season for application to the remainder of Phase 2, based upon cumulative site-specific knowledge gained from each successive dredging season of the remediation, including monitoring of surface sediments and fish tissue, and taking into account the results of a validated, peer-reviewed model of the Upper Hudson River. PCB export, as it applies to this Phase 2 standard, is defined as the downstream transport of PCB contamination directly resulting from activities associated with the removal of PCB-contaminated sediments from the river bottom. This includes PCBs released by:
Dredging
Debris removal
Resuspension control equipment removal
Cap placement
Backfill placement
Installation of containment devices other than silt curtains, such as sheet piling and other structural devices requiring heavy equipment operation and disturbance of the river bottom
Boat traffic
Like the Phase 1 Standard, the Phase 2 Resuspension Standard does not regulate resuspension within control barriers, except where such resuspension results in unacceptable downstream PCB transport beyond the barriers.
Advisory Level for Near-Field TSS
The Near-Field Advisory Level is a net increase in TSS concentration of 100 mg/L above ambient (upstream) conditions at the near-field monitoring transect 300 m downstream of the dredging operation.
2.2.2.1 Application of the Resuspension Standard
The Phase 2 Resuspension Standard specifies criteria for both formulations of PCBs used throughout the Reassessment RI/FS: TPCBs and Tri+ PCBs. TPCBs refer to the sum of all measurable PCB congeners in a sample, whereas Tri+ PCBs refers to the sum of PCB congeners containing three or more chlorine atoms. To date, this has been defined by GE’s modified Green Bay Method (mGBM). However, to further the understanding, a subset of the samples shall be routinely analyzed by Method 1668c to more fully and accurately quantify the PCB concentrations and loads on a congener basis, specifically 5 percent of all routine far-field monitoring samples. This is expected to yield one 1668c sample per week of dredging operation. EPA’s review of the results of mGBM for 2009 has raised a concern with quantitation for some of the co-eluting peaks representing substantive fraction of the mass. As a result, the correction factor used to modify the peak 5 mass for BZ4 plus BZ10 is being eliminated from the mGBM (please see

2-18
The Louis Berger Group, Inc. Revised EPS for Phase 2 Hudson River PCBs Site December 2010
October 12, 2010 letter to GE). The water quality requirements for non-PCB parameters such as metals, dissolved oxygen (DO), and pH are addressed in the Clean Water Act §401 Water Quality Certification that was developed by the NYSDEC and as will be outlined in the Remedial Action Monitoring Quality Assurance Project Plan (RAM QAPP) to be developed for Phase 2.
Monitoring requirements for protection of public health in the event that PCB concentrations exceed water quality criteria will be provided in a Community Health and Safety Plan developed for Phase 2. The ROD requires development of a Community Health and Safety Plan to protect the community, including persons in residences and businesses, from potential exposures as a direct result of remedial work activities. The Community Health and Safety Plan will provide for community notification of ongoing health and safety issues, monitoring of contaminants and protection of the community from physical and other hazards.
2.2.3 The Productivity Standard
Phase 1 consisted of initial dredging during 2009 at a reduced scale with extensive monitoring to evaluate compliance with the 2004 performance standards. The Performance Standard for Dredging Productivity for Phase 2 includes a target of dredging at 350,000 cubic yards per year, as recommended by the Peer Review Panel. EPA is hopeful that this level of production can be exceeded each year. The Panel also recommended the following:
“In addition to an annual volume productivity standard, the Panel advances an additional EPS metric: annual areas to be remediated. Area remediated reflects a substantial measure of environmental benefit and could be expressed as a specified number of CUs to close each year. Tracking of total volume and mass of PCBs removed should continue, but the environmental benefit accrued should be based both on mass removal and area remediated. Eventually, an area‐based standard could supplant the volume‐based productivity standard, if appropriately tied to the elevation‐based design.” (Peer Review Report, page iv (Bridges, et al., 2010))
Because the ROD prescribes the removal of mass as well as the reduction of surface sediment concentrations, it is unlikely that an area-based metric would supplant the volume based metric for productivity since the former metric does not address mass removed. Nonetheless, the area of the river bottom that has been remediated, the area that was capped versus what was backfilled, and the area that has undergone ecological restoration are all important metrics to assess the overall success of the remediation and will be tracked throughout Phase 2.
While the Panel did not recommend a completion date for the project, it is currently estimated that the dredging operation will require 7 to 9 years to remove the remainder of the contaminated sediments that are targeted for removal. As more information is gathered regarding the volume of contaminated sediments to be removed and the annual rate of productivity achieved, EPA will be able to refine its prediction of the total duration of Phase 2.
2.2.3.1 Productivity Standard Criteria and Reporting
The Phase 2 Productivity Standard establishes a target sediment dredging volume of 350,000 CY for each year of an assumed seven to nine-season dredging schedule to complete the work. This rate results in

2-19
The Louis Berger Group, Inc. Revised EPS for Phase 2 Hudson River PCBs Site December 2010
approximately 70 acres of remediation (14 CUs) per year for the first 4 years of Phase 2, followed by a rate of about 40 acres per year (8 CUs) for the remainder of the project. This change in area per year reflects the deeper deposits of RS-2 and 3 relative to RS-1. Habitat replacement and reconstruction work for areas dredged during the final season will be done in the spring of the following year.
The target dredging volumes have been developed on the basis of the experience gained during Phase 1 and the Peer Review Panel’s recommendations, as described in Section 5.2.2, and the assumption that the total volume of contaminated sediments remaining to be dredged is approximately 2.3 to 3 million CY. The target volumes and areas are to be used for planning and design purposes, and a serious attempt should be made to achieve them. However, they are not firm requirements which must be met in any given year. It is expected that the Phase 2 design will establish a separate target volume and area for each year based on the location of the sediment to be dredged and the difficulty of dredging. It is also likely that adjustments will be required as the project progresses and more data become available to firm up the estimate of the total volume remaining to be dredged.
The term “dredging,” as used in this Phase 2 Productivity Standard, includes removal of the contaminated sediment, dewatering and disposing of the dredged sediments, backfilling dredged areas with one foot of clean fill as appropriate, and stabilizing shoreline areas disturbed by the work. The volume of dredged sediment to be credited toward meeting each year’s target dredging volume includes all inventory, residual and access dredging required to complete the work, including side slopes and any overcut.
Stabilization of shorelines and backfilling or capping, where appropriate, of areas dredged during Phase 2 must be completed by the end of the work season (i.e. typically late November or early December).
All dredged material shall be processed and shipped off-site for disposal by the end of each calendar year. Processed sediment shall not be stockpiled for disposal the following dredging season. In the event there is an issue at the disposal site or with rail transport, EPA may grant an extension to the dredged material disposal schedule.
Planting of riverine fringing wetlands and subaqueous vegetation shall be done in the spring following each year’s dredging work unless otherwise agreed to by EPA.
Monthly and annual productivity progress reports shall be submitted to EPA for use in determining compliance with the Productivity Standard. Monthly progress reports will be compared to the production schedule submitted by the construction manager and will be the primary tool for demonstrating whether the project is meeting the target dredging schedule and for keeping an account of any differences in the areas and volumes of contaminated sediment dredged versus those shown in the design drawings.
In addition to the progress reports described above, GE shall provide the electronic files tracking bucket movement, including records of buckets of sediment removed, counting both closed and partially closed buckets. These files shall be delivered to EPA weekly, one week after the actual work is completed.
At the close of each dredging season, but no later than two weeks after the end of dredging (backfilling and capping may still be in progress), an annual summary report on the total volume and area dredged during the year, with a comparison of that volume and area to the volume and area anticipated in the
2-20
The Louis Berger Group, Inc. Revised EPS for Phase 2 Hudson River PCBs Site December 2010
design, shall be submitted to EPA. Any material that was targeted but not dredged in a given year will be targeted in the next year.
By February 1 of each year of dredging, the construction manager shall provide EPA with a production schedule showing anticipated monthly sediment production for the upcoming dredging season. The schedule shall meet or exceed the target dredging volumes defined in the final design unless they have been revised by agreement of EPA and GE (or, if EPA and GE cannot agree, then as determined by EPA).
2.3 Data Quality for the Performance Standards Monitoring Programs
Data Quality Objectives for the Residuals and Resuspension Standards are provided in Sections 3 and 4. Laboratory analytical requirements for monitoring programs required by the Phase 2 EPS will be similar to or more stringent than those in Phase 1 due to the analytical issues observed, particularly in the water column, and these are described in the Phase 2 RAM QAPP. On-site laboratory audits and performance evaluation sample analysis programs will be required to evaluate laboratory data quality and facilitate field decisions in advance of full data validation.
2.4 Summary of Special Studies during Phase 2 Dredging
The special studies that shall be conducted during Phase 2 are summarized in Table 2.4-1 and described in greater detail in Sections 3, 4 and 5. The following is a summary of the special studies. More details on special studies are provided in Chapters 3, 4, and 5 as well as Attachment B to the Phase 2 SOW:
Diagnostics and pre-dredging sampling of the water column and sediment;
Near-field array-based monitoring (accounting for vertical variation of TSS and PCBs in the water column);
Water column sampling with vertical integration techniques in the vicinity of dams between far-field stations;
PCB fate and transport in the far field studies
Evaluation of missed inventory, residuals and EoC, and the effectiveness of the EoC/DoC interpolation process in the estimation of uncertainty in the DoC;
Evaluation of PCB contamination outside the dredge prisms resulting from the redistribution of PCBs via dredging-related activities.
Evaluation of Pumpkinseed Age on Monitoring Results
2.5 Ongoing Evaluation of Dredging and Possible Refinements during Phase 2
In order to ensure the successful completion of the ROD remedy, EPA believes, as the Peer Review Panel recommended, that the Phase 2 remediation efforts in the Upper Hudson River must follow an adaptive management approach that continually relies on the site-specific observations and data from Phase 1 and

2-21
The Louis Berger Group, Inc. Revised EPS for Phase 2 Hudson River PCBs Site December 2010
from the first and each succeeding year of Phase 2 and seeks to improve operational practices as appropriate. If and when there is a validated, peer-reviewed model describing Upper Hudson hydrodynamics, sediment transport, PCB fate and transport and PCB bioaccumulation available, the model should inform the adaptive management approach as well. Following an adaptive management approach will enable the attainment of the benefits of the remedy in the shortest practicable time and help avoid or minimize any adverse short-term and long-term impacts of implementing the dredging and related efforts. The adaptive management approach to be followed is summarized in Section 7 (Adaptive Management) of the Statement of Work being issued by EPA together with these Phase 2 EPS. As discussed there, adaptive management may involve adjustments to the performance standards, operational practices, and/or other project aspects. Adaptive management with regard to the Residuals Standard may include, for example, adjustments in the incorporation of uncertainty in the DoC/EoC determination process.
Subject to the limitations set forth in Section 3 below regarding the percentage limits on capping, and the limitations set forth in Section 7 (Adaptive Management) of the Statement of Work being issued by EPA together with these EPS, EPA may, at its discretion, adjust the requirements of the Residuals Standard during the dredging season and/or between seasons in response to information gathered during the dredging operation. Data on resuspension and water column loads during each year of Phase 2 will be considered in possible revisions to the Resuspension Standard at the end of each dredging season for use in the following year. Changes to the Resuspension Standard are not anticipated in mid-year.
Information collected during the Phase 1 experience and Phase 2 design will be used to improve the monitoring and engineering design for Phase 2. Prior to commencement of the 2011 Phase 2 dredging, the off-season monitoring program water column sampling will be conducted. The additional data from the water column sampling and sediment cores collected during the fall of 2010 will improve the ability to estimate cumulative PCB loads due to dredging, but are not expected to change the main criteria of the Resuspension Standard. The acceptable rate of PCB loss and the acceptable water column concentrations are not expected to change unless and until Phase 2 provides additional data to form a basis to revise the criteria. These criteria will also be informed by a validated, peer reviewed model when it becomes available.
Diagnostic studies of the far-field automated sampling stations (to be conducted initially in 2011) are expected to enhance and improve the ongoing water column monitoring program and provide critical information for the ongoing model development.
As a part of the Phase 2 final design, GE is collecting sediment samples throughout the Upper River to more precisely define the vertical extent of contamination, as per the Panel’s recommendations. Given the scale of this effort, the sampling will continue for several seasons, while ensuring that all new data required for each upcoming dredge season are available in time to prepare the final design dredge elevations. These data will also be used to revise the estimate of mass to be removed during the remediation. Because this recharacterization is not complete, the mass of PCB to be removed in each year of Phase 2 has not been finalized.
The daily and annual load-based criteria in the Phase 2 Resuspension Standard will be adjusted to reflect the revised mass of PCBs to be removed each year based on the results from the Phase 2 remedial design

2-22
The Louis Berger Group, Inc. Revised EPS for Phase 2 Hudson River PCBs Site December 2010
sediment sampling. Adjustments to the daily and annual load criteria may also be made if the length of the dredging season differs greatly from what is anticipated. Prior to the start of Year 1 of Phase 2, the daily and annual PCB load criteria will be adjusted according to the final production schedule and estimated mass of PCBs to be removed in 2011 (see the calculation in Section 4.2 to see how the length of dredging and estimated mass are related to determine daily and annual loads). The allowable daily and annual loads and the associated allowable concentrations will be prepared along with the dredging design for each year of Phase 2. While these adjustments represent changes to the absolute values for loads, it is anticipated that the percentage criteria of 1 and 2 percent of the mass removed will remain roughly the same throughout the remediation (subject to possible changes based on new data and a validated, peer reviewed model). Thus the anticipated adjustments referenced above in this paragraph are merely to prorate these percentage criteria to reflect the actual mass and rate of removal. The formulas to incorporate these data and revise the criteria are given in Section 4.
In addition to development of the estimates of mass removal and associated loads due to dredging, several tasks to be performed prior to Phase 2 to determine best estimates of the new updated baseline water column levels and the dredging-related load criteria are provided below:
1. Review the 2004 through 2008 Baseline Monitoring Program data and off-season monitoring data through 2010.
2. Calculate the mean concentration and upper 95th percentile confidence limit (UCL) of the mean for all far-field stations to establish baseline concentrations by month, corrected for flow variation as appropriate.
3. Revise the Tri+ PCB daily load criteria to reflect 1, 2 and 3 percent, and the Tri+ PCB annual load criteria to reflect 1 and 2 percent, of the revised inventory estimates, incorporating the additional sampling completed in response to the Panel’s recommendations, beginning with the 2010 program. This information shall be available in the Phase 2 final design reports.
4. Revise the PCB load limits to adjust for differences in the length of the dredging season and incorporate the information from the Baseline Monitoring Program data, the Phase 1 monitoring data, the offseason monitoring data through 2010 and the anticipated rate of PCB mass removal based on the Phase 2 Year 1 design.
As discussed previously, the results of the Phase 2 final design sediment sampling (SEDC) program will be used to finalize the delineation of Phase 2 target dredging areas for the first year of Phase 2. This program will be continued annually in subsequent years, sampling areas during the year prior to the planned year of dredging for that area. This subsequent sampling will be used to finalize the volume and mass estimates for later years of Phase 2. These results will also be used with existing data to facilitate adjusting the forecast of an overall project dredging estimate in terms of cubic yards of contaminated sediment to be removed. As additional refinements to the forecast of overall cubic yards of sediment to be dredged are made, the Phase 2 forecast will also be updated to allow for the additional volume by extending the schedule and adjusting for efficiencies achieved during in Phase 2. The revised Phase 2 volumes shall be prepared as part of the design addendum to be submitted prior to each dredging season. That is, a revised estimate of the total mass and volume of sediment and PCBs (both Total and Tri+ PCBs) to be removed will be prepared with each design addendum, reflecting the data available at the time of the addendum.

3-1
The Louis Berger Group, Inc. Revised EPS for Phase 2 Hudson River PCBs Site December 2010
3. Residuals Performance Standard
3.1 Overview of Phase 2 Residuals Standard
As noted in Section 2, the primary objectives of the Phase 2 Residuals Standard are:
Achieving the design DoC elevation (also known as the EoC);
Achieving a residual concentration of no more than 1 mg/kg Tri+ PCBs, with subsequent backfilling, while minimizing the need for capping;
Identifying areas where capping is needed because the residual sediment arithmetic average Tri+ PCBs concentration is greater than 1 mg/ kg in the top six inches;
Identifying areas where a second pass is needed because PCB inventory remains at depth or PCB concentrations of greater than or equal to 27 mg/kg Tri+ PCBs are present in surface sediments after the first pass is complete;
Identifying areas where post-dredging concentrations exceed 500 mg/kg TPCB so these can be removed in a subsequent pass.
Discerning and mapping the extent to which EoC has been accurately identified and interpolated as a basis to revise the Residuals Performance Standard criteria and/or the Phase 2 design in the event that the extent of capping exceeds the limits on capping that are set forth below.
Providing data to evaluate the success of the remediation in attaining the true EoC and to provide a basis to adjust the design dredge elevation in subsequent CUs so as to minimize the number of passes and amount of non-target sediment removed.
The performance of the dredging program will be evaluated in accordance with the Adaptive Management Process and modifications will be made as needed (including in-season, if necessary). The issue of contaminant redistribution to areas outside the CU boundaries is not strictly part of this standard but is examined as part of a special study described in Section 3.6.
See Section 2.2.1 for a description of the Phase 2 Residuals Standard.
3.2 Phase 1 Observations and Additional Data Needs in Support of the Residuals Standard for Phase 2
The Phase 1 effort had many successes; however, the information gathered during Phase 1 also provides a basis to improve and streamline the performance standards specific to Hudson River conditions. As described in the Phase 1 Engineering Performance Standards document (EPA, 2004), it was anticipated that changes to each of the performance standards would be facilitated and guided by the observations, successes and problems that arose in Phase 1.

3-2
The Louis Berger Group, Inc. Revised EPS for Phase 2 Hudson River PCBs Site December 2010
The Phase 1 Residuals Performance Standard was developed with the expectation that the DoC would be accurately defined by the remedial design sampling program (i.e., the SSAP cores) and that the designed dredging cut lines would be sufficient to target existing PCB inventory for removal. Additionally, there was provision in the Phase 1 Residuals Standard for multiple dredging passes to address unacceptable residual concentrations or the presence of unanticipated inventory below the estimated DoC used in design. The dredge design elevations were also expected to address uncertainty and thus minimize ‘missed’ inventory (and the number of dredging passes); however, this was not implemented in the final Phase 1 design.
During Phase 1, the majority of the re-dredging passes conducted in the CUs removed inventory that was not adequately characterized prior to design. The Phase 1 design dredge elevations were set too shallow in many locations; many times even post-dredging cores did not fully penetrate the depth of the contaminated sediments. It is concluded from the Phase 1 data that the Residuals Standard can be appropriately implemented and readily achieved during Phase 2 if the DoC is better characterized and appropriate measures to address uncertainty are incorporated in the design DoC elevations (i.e., EoC).
To reflect the lessons learned during Phase 1, and in keeping with the recommendations of the Peer Review Panel, the Residuals Standard has been simplified for Phase 2 to accelerate CU closure.
To support this approach, the data on which the Phase 2 design is developed must be improved, including the following (this work has begun):
1. Resample all the incomplete design cores to more accurately define the DoC and EoC for all the CUs in Phase 2 to reduce statistical uncertainty.
2. Resample 20 percent of the Level 1A (complete) cores to assess uncertainty in the DoC estimates derived from these cores.
3. Augment the existing design core data set to achieve a sampling density in all areas to be dredged of 80 feet on center by collection of additional cores.
4. Core collection shall target a recovery of 80 percent or higher and adjust the sampled interval depths and associated DoC estimates for existing SSAP core data to compensate for core recoveries.
5. Use the results from the uncertainty analysis to adjust the design DoC elevations (EoC).
3.3 Implementation of the Residuals Standard
The Residuals Standard covers the collection and analysis of sediment samples representing dredging residuals in all Phase 2 target areas and describes the procedures by which the sediment sampling data will be used to characterize residuals, evaluate the effectiveness of the dredging remedy, and plan post-dredging construction actions.
Implementation of the Residuals Standard shall include the following tasks (refer to Figure 3.2-1a through e for the flow diagrams):
I. Verification that the design dredge elevation has been achieved in 95 percent or more of the 1-acre sub-unit of the CU.
3-3
The Louis Berger Group, Inc. Revised EPS for Phase 2 Hudson River PCBs Site December 2010
II. Sample Collection and Analysis III. Evaluation of Sample Data IV. Initial Required Actions V. Verification that the revised design dredge elevation has been achieved in 95 percent or
more of redredged areas. VI. Sample Collection and Analysis VII. Initial Cover Placement VIII. Evaluation of Sample Data IX. Final Required Actions
Given the nature of the dredging approach called for by the Phase 2 Residuals Standard, several of the tasks are repeated when a second dredge pass is required or opted for. Each time a task is conducted, the individual subtasks are largely the same, although the outcome may differ depending on where the operation is in the process. Each of these tasks is described in detail below.
3.3.1 Verification of Design Dredge Elevations
Verification of design dredge elevations shall be completed subsequent to all dredging passes. The primary sediment removal task is conducted as part of the first dredging pass, which involves sediment removal based on the Phase 2 design. The Phase 2 dredge elevation design shall incorporate the new data collected in 2010 and include a revised DoC, an associated elevation of contamination, and a design dredge elevation comprised of the elevation of contamination plus a design dredge tolerance selected by GE. The Phase 2 dredge elevation design shall similarly be updated in the future to incorporate the new sediment data collected in 2011 and later years.
Per the Peer Review Panel’s recommendation, “[a] dredging pass will be deemed to be successfully completed in a given sub-unit once 95% or more of the subunit is at or below the DoC elevation,” (Bridges, et al., 2010, page 59). Also per the Panel, “individual small contiguous areas of less than 3 sq ft each that protrude above the DoC Elevation [will not be included] in the calculation of achieving 95% of the post‐dredge surface below the DoC Elevation”. In order to perform the verification with the recommended exclusion, comparisons will be performed as measured on a 10-foot by 10-foot grid (or other grid as approved by EPA). Figure 3.2-1a presents the flow logic diagram for the verification of the design dredging elevation and placement of the initial cover layer.
The process to establish that dredging has removed sediment to below the design dredge elevation in 95 percent of the CU or 1 acre sub-unit will be based on comparing the post-dredge average elevation within each 10-foot by 10-foot grid cell with the corresponding design dredging average elevation within the same 10-foot by 10-foot grid cell. Grid cells with post-dredge average elevations at or below the required design dredge elevations will be deemed compliant and grid cells with post-dredge average elevations above the required design dredge elevations will be deemed non-compliant. Non-compliant grid cells can only comprise 5 percent of the CU or sub-unit. If more than 5 percent of the grid cells within a CU or sub-unit are non-compliant GE shall conduct a single additional dredge pass over those areas necessary to achieve the 95 percent requirement.
3-4
The Louis Berger Group, Inc. Revised EPS for Phase 2 Hudson River PCBs Site December 2010
As part of the completion of this task for each CU, post-dredging bathymetry maps and grid electronic files must be provided to EPA for verification purposes as soon as they are completed, and they should consist of the following:
Maps and electronic figures of target and post-dredging elevation. The maps should be submitted in 10x10 foot grid spacing, but separate electronic XYZ files should be submitted of the average elevations within 1-foot by 1-foot and 10-foot by 10-foot spaced grid cells as well as the original compiled raw data.
Maps and electronic files of the dredging removal thickness. The maps and electronic files should be submitted for both the average elevations within 1-foot by 1-foot and 10-foot by 10-foot spaced grid cells.
High resolution (Multibeam) bathymetric data shall be used to establish the average elevations whenever practically possible. In locations where obtaining high resolution bathymetric data is not practically possible, e.g. in very shallow areas, other survey methods (such as land survey techniques) acceptable to EPA can be used. The alternate measurement techniques will be developed as part of the approved RAWP.
It is important that dredging be done in an efficient manner. As discussed by the Peer Review Panel, sufficient overdredge amount must be specified so that the above removal requirements can be met as quickly as practicable. While EPA will not specify the magnitude of the target used by the dredging contractor to ensure the required elevation is met over 95 percent of the area, GE must require the dredging contractor to inform GE of how the target is set in a CU or sub-unit and communicate those amounts to EPA.
3.3.2 Sample Collection and Analysis
Post-dredging cores will be collected upon completion of each dredging pass. To meet the Phase 2 Residuals Standard, the post-dredging cores will be analyzed in 6-inch intervals to a depth of 4 feet, bedrock or glacial Lake Albany clay, whichever occurs first. In general, the results of the entire core will be used to determine the response action. In the event that the estimated depth of contamination at the post-dredging coring location is 18 inches or less, GE may opt to initially analyze just the top two feet of the core in 6-inch increments while archiving the remainder of the core. The remaining sections shall be archived. At locations where the DOC is greater than 18 inches, all sections of the full 4-foot cores of sediments shall be sent to the laboratory for analysis, for at least the first 50 to 100 confirmation nodes. GE may petition EPA to modify this scheme at milestones for evaluation as stated in the revised EPS. While the top 6-inch segment is used to characterize residual sediment contamination, the results of the segments below 6 inches will be used to quantify the amount of PCB inventory (if any) left behind and the remaining DoC. In all cases, the DoC must be well-defined by a minimum of two contiguous 6-inch core segments with less than 1.0 mg/kg TPCB, as recommended by the peer reviewers. If two contiguous 6-inch segments less than 1.0 mg/kg TPCB are not found within the initial 4-foot core, an additional 8 foot core will be collected at that node location, and the bottom eight 6-inch segments analyzed, while archiving the upper portion of the core. This process will be repeated by collection of still deeper cores until two consecutive segments at less than 1.0 mg/kg TPCB are found.

3-5
The Louis Berger Group, Inc. Revised EPS for Phase 2 Hudson River PCBs Site December 2010
If post-dredging sampling by Vibracore does not: a) reach a sufficient depth to produce two consecutive core segments with less than 1.0 mg/kg TPCB, needed to confirm the DoC, and b) yield core recoveries greater than or equal to 80 percent, then an alternative sampling method that will produce sufficient core length must be employed, unless EPA, in its sole discretion, allows otherwise. This alternative method may include test pitting using a dredge; collecting cores using other drilling methods, such as geoprobe, roto-sonic, or rotary drilling rigs; conventional split spoon sampling; or other method approved by EPA. The 2010 sediment sampling program conducted by GE tested the use of sonic coring methods.
3.3.2.1 Sample Collection
Post-dredging sediment sample collection will take place promptly once the design DoC elevation (EoC) has been achieved in 95 percent or more of a 1-acre sub-unit but prior to the placement of any cover layer, consistent with Figure 3.2-1a.
Post-Dredging Sampling Grid
The post-dredging sampling grid will follow the same design as used in Phase 1. Sampling at 80-foot centers, as required for Phase 1, represents the absolute minimum acceptable sampling density; a wider spacing of core samples would not be acceptable.
The post-dredging cores will be collected at a minimum of 40 locations in each 5-acre CU. The cores will be collected on a regular triangular grid developed to maximize the spatial distribution of samples within each dredged area. This grid shall be offset from the design support sampling grid so that the average distance between the design grid nodes and the residuals grid nodes is roughly 46 feet. Essentially, each post-dredging sampling location is placed in the center of the triangle formed by three pre-dredging sampling locations. In the event an obstruction is encountered (e.g., a grid node “falls” on exposed bedrock), the sample is to be relocated within a 20-ft radius of the original location.
The following guidelines remain unchanged from Phase 1 and will be used for implementation of a sampling grid on certification units other than 5 acres in size:
Isolated dredging areas smaller than 5 acres in size are to be designated single certification units and 40 residual sediment cores must be collected on a triangular grid with a proportionate spacing.
Noncontiguous dredging areas smaller than 5 acres in size and within 0.5 miles of one another can be “corralled” into a single certification unit; the sum of the grouped dredging areas must be less than 7.5 acres. If the sum of the grouped areas is still less than 5 acres, the sampling grid is to be proportionally sized so that a minimum of 40 cores is collected from within the dredging areas. Otherwise, within areas grouped into a single certification unit with a total dredged area of 7.5 acres, up to 60 cores are to be collected by applying the 80-ft grid spacing.
If a number of noncontiguous dredging areas smaller than 5 acres in size are contained within a common resuspension containment barrier during dredging, the construction manager must submit a proposal to EPA that explains how the dredging project will be managed to minimize the spread of significant contamination to the interstitial, non-targeted areas, or propose additional sampling to investigate those areas during the residuals sampling in the CU (see Special Studies,

3-6
The Louis Berger Group, Inc. Revised EPS for Phase 2 Hudson River PCBs Site December 2010
Section 3.6).
For dredging areas between 7.5 and 10 acres in size, the dredging area is to be divided into two CUs with approximately equivalent areas and 40 samples collected from each using proportionally sized grids.
Dredging areas larger than 10 acres in size are to be divided equally into approximately 5-acre certification units and a triangular grid with 80-ft spacing established in each certification unit. (For example, a 32-acre dredging area would be divided into six certification units, each 5.33 acres in size.)
If a residual node is sampled a second time, (i.e., subsequent to a second pass) care shall be taken to relocate on the site at least 5 feet from the original post-dredge sampling location.
For shoreline areas, the Phase 1 approach is revised to reflect some of the Phase 1 observations and in recognition of the poor agreement between extrapolated DoC surface and the actual DoC as sampled and dredged in the near-shore areas.
For CUs containing a shoreline area, that shoreline area will be sampled at 80-ft. intervals along a transect parallel to shore. The transect is to be located approximately midway between the shoreline (119 ft in RS-1) and the edge of the near-shore area. For RS-1, this is defined as the 117.5 ft contour. Like other residual cores, cores shall be advanced to recover a minimum of 4 feet and segmented in 6-in. increments to the bottom of the core using the methods discussed below.
Sample Collection Method
The sediment samples will be collected via coring, using Vibracoring or other methods approved by EPA. Core samples will be retrieved in clear Lexan® (or other appropriate) sleeves or liners. Where Vibracoring techniques are used, the Vibracoring rig will be activated at the sediment water interface and used throughout the depth of the core. Where difficult conditions preclude collection of core samples, for example shallow bedrock, sediment samples will be collected using small grab samplers (e.g., ponar dredge). The core sampling locations are to be located using GPS and referenced to an appropriate horizontal coordinate system and vertical datum at the time of collection. The core sampling location data is to be recorded with the other information collected in the field. Core collection will target a recovery of 80 percent or higher. Cores may require an adjustment to the measured contamination depths to account for the recovery.
Prior to core collection, sediment probing will be conducted in an area adjacent to the target location (so as not to disturb the sediments in the target area) to identify the approximate depth and the texture of the sediments. The information will be used to guide core collection and whether a grab sampler should be deployed after the initial coring attempts. If sediment probing indicates a sediment depth of less than 6 inches over bedrock, at least one attempt will be made to collect a core. If a sediment sample cannot be retrieved via coring, a grab sample will be collected. For all locations where a thin layer of sediment is suspected to overly shallow bedrock, sampling is to continue, either by coring, a grab sampler, unless exposed bedrock can be demonstrated within the entire 20-foot radius circle around the sampling node. A minimum of 3 attempts must be made in these instances. If the sample is not collected in three attempts,
3-7
The Louis Berger Group, Inc. Revised EPS for Phase 2 Hudson River PCBs Site December 2010
EPA approval is needed before abandoning the location. In each location within the target circle, a core must be attempted prior to deployment of a grab sampler. If a Ponar grab sampler is deployed, it must be of sufficient size to penetrate at least 6 inches or the thickness of sediment believed present on the river bottom, whichever is less.
Core recovery in clear Lexan® (or other appropriate) tubes will be measured directly though visual inspection of the sample. The actual sample recovery will be calculated by dividing the length of the sediment recovered by the Total penetration depth of the core. The sampler will then document the sediment recovery and visually classify the sediment sample, including the thickness of the residual veneer. The elevation of a known point on the coring apparatus will be identified so that the absolute elevation of the core tube bottom can be determined.
3.3.2.2 Sample Analyses
Each sample will be extracted and analyzed for TPCB and Tri+ PCB via an analytical method approved by EPA and that provides at least equivalent sensitivity and accuracy to the analytical method used during the design support sediment sampling. Grain size distribution, moisture content and bulk density analyses will also be required for selected core sample analyses. Samples submitted for grain size distribution, bulk density and percent moisture measurements will be evenly distributed, spatially, within each CU. A performance evaluation sample analysis program will be required as part of the residual sediment sample analytical program.
3.3.3 Evaluation of Sample Data
The evaluation of sample data shall take place after every dredging pass and incorporate all data collected up to that point in time. For example, if 10 nodes are redredged in a second dredging pass, after collection of 10 new cores at the 10 redredged locations, the results of the 10 new cores are combined with the remaining post-dredging core results (typically 30 additional cores in this example) in evaluating the data. As in the Phase 1Performance Standard, the results of the sediment sample analyses will be used to evaluate the CU by converting the validated results to Tri+ PCB equivalents, identifying locations with remaining PCB inventory or “elevated concentration residuals” (27 mg/kg Tri+ PCBs or greater present in the 0-6 inch segment) and comparing the arithmetic average Tri+ PCB concentration in the surface (0-6 inches) sediment to the action levels in the standard. The procedures to identify inventory or elevated concentration residuals and calculate the arithmetic average of the Tri+ PCB concentration in each sub-unit or CU are as follows:
Identify those nodes where PCB inventory is present at depth (i.e., where the Tri+ PCB concentration is equal to or greater than 6 mg/kg 6 inches or more below the surface). The logic for this process is described in Figure 3.2-1b. Exclude these nodes from subsequent calculations of the mean for the CU or sub-unit since GE shall redredge or cap these nodes as inventory areas depending on whether this is the first dredging pass or the second dredging pass, respectively. For these locations perform the following tasks:
o Analyze the 6" segments of the 4-foot post dredging cores to find the DoC as defined by the occurrence of two contiguous segments with less than 1.0 mg/kg TPCB. The results
3-8
The Louis Berger Group, Inc. Revised EPS for Phase 2 Hudson River PCBs Site December 2010
of the overlying six inch samples will be used to quantify the amount of inventory left behind.
o If two contiguous clean (i.e., with less than 1.0 mg/kg TPCB) 6" segments are not found within 4 feet of the surface, an additional 8 foot core shall be collected at the node location and the bottom eight 6" segments shall be analyzed. This process is repeated until two consecutive clean segments are found.
For each CU, evaluate both the 1-acre sub-units and the entire 5-acre CU according to the logic described in Figure 3.2-1c.
If one dredging pass has been performed, identify all surface concentrations greater than or equal to 27 mg/kg Tri+ PCB since a second pass to remove the contamination at these locations is mandatory.7 High concentrations at depth after the first pass are addressed as part of the mandatory requirement to dredge inventory after the first pass described just above.
If two dredging passes have been performed, identify all locations that contain a concentration of 500 mg/kg TPCB or greater at any depth, since a third dredging pass to remove such contaminated sediments is mandatory.
In shoreline areas after the first pass, identify nodes where the TPCB concentration exceeds 50 mg/kg at any depth, since a second pass to remove these sediments is mandatory.
For the remainder of the CU or sub-unit, target an average value of 1 mg/kg Tri+ PCB or less8 in the top 6" segments, using only the ranked, measured nodal values in a simple accumulating average. Identify the post-dredging sampling locations whose concentrations cause the average for the CU or sub-unit to exceed 1 mg/kg Tri+ PCB in sequential decreasing order. These nodes must be addressed (e.g., redredged, capped) from highest to lowest unless otherwise approved by EPA. The logic for this process is outlined in Figure 3.2-1c.
o If only one dredging pass has been completed, GE may opt to redredge some or all of the residual nodes in order to reduce the residual concentrations for the sub-unit or CU and avoid capping.
o If a second dredging pass has been completed, these locations will be capped as having unacceptable residual concentrations.
Non-detect sample results are to be included in the calculation of the mean at a value of one-half the detection limit.
If no sample is available from a grid node due to field difficulties that cannot be resolved, the mean shall be calculated based on the reduced total of data points (e.g., 39 data points instead of 40, or 7 instead of 8 cores for a sub-unit). The missing node shall be considered as no information and excluded from the process to delineate areas for capping and backfilling. Essentially the surrounding nodes determine the treatment at the missing location.
If in a 1-acre sub-unit, more than 2 locations are not available due to field difficulties, the arithmetic average shall be calculated jointly with at least one adjacent 1-acre sub-unit.
7 This value was derived as part of the original EPS. It is considered an outlier value for a sediment surface whose mean concentration is at or close to 1 mg/kg Tri+ PCB. The requirement to redredge this node is the same as that used in Phase 1. 8 In the original EPS, the average residual was evaluated on a whole number basis, and this approach will be continued for Phase 2. Thus, an average of up to 1.49 mg/kg Tri+ PCB, which rounds to 1, will be acceptable to meet this criterion.
3-9
The Louis Berger Group, Inc. Revised EPS for Phase 2 Hudson River PCBs Site December 2010
Evaluate the amount of area identified for capping based on the integration of the five 1-acre sub-units and the 5-acre CU. Subject to EPA approval, select the result that yields the least amount of capped area. Obtain EPA approval for all capping designs.
3.3.4 Initial Cover Placement
Cover placement shall be done upon completion of a second dredging pass, immediately following sample collection. An initial 3-6 inch layer of sand or backfill cover shall promptly be placed over each 1-acre CU sub-unit after the second pass design dredge elevation has been achieved in 95 percent or more of the dredging sub-unit and post-dredging samples have been collected. Thus each CU will be initially treated as up to five sub-units, assuming dredging operations and CU geometry permit. Since the purpose of this initial cover is to prevent resuspension of the dredging residuals, verification of the placement thickness of this initial cover layer is not required. This placement is represented as part of the process outlined in Figure 3.2-1c. The exception to this is where dredging has occurred in the navigation channel. In the navigation channel, no initial cover should be placed unless a minimum of 15 feet of draft below the mean low water level is available after cover placement. Specifications for the initial cover layer shall be CU-specific and possibly sub-unit-specific, and shall be developed as part of the Phase 2 design.
3.3.5 Required Response Actions
The following actions are required by the revised Residuals Standard, based on the sediment sample analytical results obtained (refer to Figure 3.2-1 for the flow diagram). These responses can be applied after the first dredging pass as well as after a second dredging pass if needed. In all cases, if a second pass has been attempted, place an initial backfill cover immediately after sample collection and do not wait for the results of the sample analyses. Note that in all references to the DoC below, the DoC values must also account for uncertainty and anticipated local variability in the DoC estimate.
Response 1: Apply backfill within the sub-unit or the CU
If assessed after the first pass, the subunit or CU must have no exceedances for inventory nor residual surface concentrations greater than or equal to 27 mg/kg Tri+ PCB. To be applied after the second pass, the subunit or CU must have no nodes exceeding 500 mg/kg TPCB. Nodes that cause the average surface concentration to exceed 1 mg/kg Tri+ PCB must be already identified by Response 2. Assess the average of the top 6" segments of the post-dredging cores in the 1-acre sub-unit and the 5-acre CU. If inventory considerations yield fewer than 5 post-dredging cores in a 1-acre sub-unit, combine with the adjacent sub-unit and calculate the arithmetic average.
To warrant this response, the arithmetic average of the top 6" segments of the 1-acre sub-unit or the 5-acre CU must be less than or equal to 1 mg/kg Tri+ PCB.
There must be at least 3 adjacent locations at or below the 1 mg/kg Tri+ PCB level to define a backfill area and at least 5 nodes in all in the 1-acre sub-unit to support evaluation of the sub-unit as a single entity. Otherwise it must be combined with at least one adjacent sub-unit.
The ideal outcome for dredging falls under this category, wherein the average for the whole CU is less than or equal to 1 mg/kg Tri+ PCB, in which case the whole CU is to be backfilled.

3-10
The Louis Berger Group, Inc. Revised EPS for Phase 2 Hudson River PCBs Site December 2010
Response 2: Cap the node(s) that cause(s) the arithmetic average of the sub-unit or CU to be greater than 1 mg/kg Tri+ PCB
If assessed after the first pass, the subunit or CU must have no exceedances for inventory nor for residual surface concentrations greater than or equal to 27 mg/kg Tri+ PCB. To be applied after the second pass, the subunit or CU must have no nodes exceeding 500 mg/kg TPCB. To warrant this response after the second or later passes, the arithmetic average of the top 6" segments of the 1-acre sub-unit (or the joint sub-units) is greater than 1 mg/kg Tri+ PCB after exclusion of the nodes with identified inventory or nodes with residual surface concentrations greater than or equal to 27 mg/kg Tri+ PCB. The exclusion of nodes with inventory or a surface concentration greater than or equal to 27 mg/kg Tri+ PCBs is necessary here since these nodes must be capped regardless of the results for the remainder of the CU. This response is concerned with identifying additional nodes that must be capped in order to achieve an average surface concentration that is less than or equal to 1mg/kg Tri+ PCB.
Identify those nodes whose values cause the average to exceed 1 mg/kg Tri+ PCB, as described in Section 3.3.4.
Design the area to be capped, bounded by the edges of the CU or a perimeter line connecting the compliant node locations. A compliant node is simply defined as a location whose sample concentration does not cause the average of the remaining nodes to exceed 1 mg/kg Tri+ PCB (see Section 3.3.5.1).
If different caps are required for adjacent high and low concentration noncompliant residual nodes, the cap design for the high concentration residual nodes shall extend to the perimeter defined by the low residual nodes.9
Obtain EPA approval for the cap design.
Construct a subaqueous cap at the nodes causing the arithmetic average to be greater than 1 mg/kg Tri+ PCB, leaving the remaining area with an average concentration equal to or less than 1 mg/kg Tri+ PCB. The type of cap will be based on the location in the river (high velocity/ low velocity area), the resulting average concentration, and the individual node concentrations.
A typical scenario under this response involves the case where the average for the whole CU is greater than 1 mg/kg Tri+ PCB but there are multiple 1-acre sub-units or adjacent post-dredging sampling nodes within the CU that have an average of 1 mg/kg Tri+ PCB or less, in which case those particular areas shall be backfilled.
Response 3: Redredge missed inventory, residual surface concentrations greater than or equal to 27 mg/kg Tri+ PCB, and/or discretionary residual concentrations after the first dredging pass
This response addresses three mandatory and one discretionary condition in a sub-unit or a CU after the first dredging pass:
9 All noncompliant residuals are tracked as a group. The designation of high concentration and low concentration residual nodes will be based on engineering considerations regarding cap break-through. That is, some higher residual concentrations may warrant a greater level of chemical isolation than others. In this instance when high and low concentration nodes are adjacent, the more protective cap is extended out from the high concentration node to the perimeter of low residual nodes.

3-11
The Louis Berger Group, Inc. Revised EPS for Phase 2 Hudson River PCBs Site December 2010
o Missed PCB inventory; i.e., the Tri+ PCB concentration in samples below 6 inches is greater than or equal to 6.0 mg/kg (mandatory removal).
o Elevated residual sediment contamination; i.e., the Tri+ PCB concentration at one or more residual locations is greater than or equal to 27 mg/kg Tri+ in the top 6 inches but PCB contamination below 6 inches is less than 6.0 mg/kg Tri+ PCB (mandatory removal).
o Shoreline contamination; i.e., the TPCB concentration is greater than or equal to 50 mg/kg at one or more shoreline locations (mandatory removal).
o Noncompliant residual nodes; excluding nodes with identified inventory or residual surface concentrations greater than or equal to 27 mg/kg Tri+ PCBs, these nodes cause the arithmetic average of the top 6" segments of the 1-acre sub-unit or the CU to exceed 1 mg/kg Tri+ PCB. Selection of these nodes for a second dredging pass is at GE’s discretion (discretionary removal).
Identify the nodes to be redredged.
Design the area and prism to be redredged, bounded by the edges of the CU or a perimeter line connecting the surrounding node locations not slated for dredging. Set the DoC for removal at each location based on the depth of contamination in each core. Use Thiessen polygons to extrapolate the DoC outward between adjacent nodes to be dredged,. When a node to be dredged is adjacent to nodes not slated for removal, extend the dredge prism to the periphery of nodes not being dredged.
Dredge the prism, confirm the new bathymetry at a 95 percent level of compliance (as was done for the first pass), resample the dredged locations. Evaluate the data set for the entire CU or subunit according to the Residuals Standard
The anticipated case under this response is likely to be one in which a CU has a deep DoC, wherein variability in the DoC is potentially significant.
Response 4: Redredge missed inventory or residual concentrations in the navigational channel after the first dredging pass
This response addresses the mandatory redredging in the navigation channel after the first dredging pass:
o Missed PCB inventory; i.e., the Tri+ PCB concentration in samples below 6 inches is greater than or equal to 6.0 mg/kg (mandatory removal).
o Elevated residual sediment contamination; i.e., the Tri+ PCB concentration at one or more residual locations is greater than or equal to 27 mg/kg Tri+ in the top 6 inches but PCB contamination below 6 inches is less than 6.0 mg/kg Tri+ PCB (mandatory removal).
o Neither of the above two conditions is met but one or more nodes in the navigation channel cause the average Tri+ PCB concentration in the CU to exceed 1 mg/kg Tri+ PCB and the water depth in the channel is less than 15 ft below mean low water (mandatory removal).
If nodes in an area of the navigation channel meet either of the first two conditions above, a second dredging pass shall be required at the non-compliant nodes to a depth that will allow the

3-12
The Louis Berger Group, Inc. Revised EPS for Phase 2 Hudson River PCBs Site December 2010
placement of a high velocity cap (that is, a depth such that there will be at least 14 feet of draft above the cap at mean low water) or to the re-defined DoC, whichever is greater.
If the water depth after the first pass in an area of the navigation channel is less than 15 feet below mean low water and nodes in the channel meet the third condition, GE may be required to perform a second dredging pass of those nodes to a depth that will allow the placement of a high velocity cap or to the re-defined EoC, whichever is greater.
If the water depth after the first pass in an area of the navigation channel is greater than or equal to 15 feet below mean low water, post-dredging results for the navigation channel shall be handled according to the same rules that apply elsewhere in the CU.
Redredging boundaries for channel areas are defined by CU boundary or perimeter of compliant cores. To the extent that the dredge prism associated with a channel node extends beyond the channel, the area outside the channel need only be dredged to the revised EoC, with additional removal to create stable slopes to the required dredging in the channel area, as needed.
No backfill will be placed in the navigation channel resulting in less than 14 ft of draft at mean low water after placement. If capping is necessary in the navigation channel, its design and implementation must be such that the top of the cap allows for a minimum of 14 feet of draft at mean low water to allow for future maintenance dredging by the NYSCC. Identify the nodes to be redredged.
Set the DoC for removal at each location based on the depth of contamination in each core. Use Thiessen polygons to extrapolate the DoC outward between adjacent nodes to be dredged. When a node to be dredged is adjacent to nodes not slated for removal, extend the dredge prism to the periphery of nodes not being dredged.
Dredge the prism, confirm the new bathymetry at a 95 percent level of compliance (as was done for the first pass), resample the dredged locations. Place initial 3 to 6 inches of cover over dredged channel areas if instructed by EPA. Evaluate the data set for the entire CU or subunit according to the Residuals Standard.
The anticipated case under this response is strictly in the channel, where historical maintenance has created unique conditions for rapid contaminated sediment build up, similar to what was observed in CUs 1 through 4 in Phase 1.
Response 5: Redredge shoreline concentrations greater than or equal to 50 mg/kg TPCB
This response addresses the mandatory redredging condition after the first pass wherein elevated shoreline contamination exists such that the TPCB concentration is greater than or equal 50 mg/kg at one or more shoreline locations at any depth.
Identify the nodes to be redredged.
Design the area and prism to be redredged, bounded by the shoreline or edge of the CU, a perimeter line running perpendicular to shore at the adjacent upstream and downstream compliant node locations. The water side boundary is defined as the offshore limit of the near-shore area (117.5 ft contour line in RS-1) the 117.5 ft contour line or the distance offshore at which the stable slope surface developed for the first pass intersected the DoC as directly measured by the bounding cores adjusted for uncertainty whichever is further from shore. If compliant residual nodes exist offshore, these can be used as a perimeter if that serves to reduce the extent of
3-13
The Louis Berger Group, Inc. Revised EPS for Phase 2 Hudson River PCBs Site December 2010
redredging. Set the DoC for removal at each location based on the depth of contamination in each core while also accounting for uncertainty and anticipated local variability in the DoC estimate, unless otherwise approved by EPA. Use Thiessen polygons to extrapolate the DoC outward between adjacent nodes to be dredged. When a node to be dredged is adjacent to nodes not slated for removal, extend the dredge prism to the periphery of nodes not being dredged.
Dredge the prism, confirm the new bathymetry at a 95 percent level of compliance (as was done for the first pass), resample the dredged locations. Evaluate the data set for the entire CU or subunit according to the Residuals Standard.
The anticipated case under this response is likely to occur along shoreline areas where no prior coring was conducted or where contamination is deep but the first dredging pass was less than the measured DoC under the Phase 1 agreement to limit dredging to 2 feet in shoreline areas over concern for bank stability.
Response 6: Cap nodes where inventory was found after two dredging passes
This response addresses those locations in a subunit or CU shown to have missed PCB inventory (i.e., the Tri+ PCB concentration in samples below 6 inches is greater than or equal to 6.0 mg/kg) after a second dredging pass (but not where TPCB concentrations equal or exceed 500 mg/kg at any depth; that scenario is covered by Response 8 below).
Design the area to be capped, bounded by the edges of the CU or a perimeter line connecting the surrounding compliant node locations. A compliant node is simply defined as a location whose residual sample concentration (i.e., in the top 6-inch segment) does not cause the average of the remaining nodes to exceed 1 mg/kg Tri+ PCB (see Section 3.3.5.1).
If the area to be capped for inventory is adjacent to areas to be capped due to non-compliant residual contamination (i.e., in the top 6 inches), the more rigorous cap design, whether for residuals or inventory, shall extend to the perimeter defined by the nodes requiring the less rigorous cap.
Obtain EPA approval for the cap design.
Construct subaqueous cap at the nodes containing inventory, leaving the remaining area to be addressed as part of Response 1 or Response 2. The types of caps will be based on the location in the river (high velocity/ low velocity area) and peak concentrations at depth.
The anticipated case under this response (which should be rare if the DoC has been determined with an adequate level of statistical confidence) is likely to be one in which a CU has a deep DoC, wherein variability in the DoC is potentially significant.
Response 7: Debris layer, bedrock and glacial Lake Albany clay encountered
If a debris layer is encountered, continue dredging to 6 inches below the bottom of the debris layer. Then test the underlying sediments for PCB contamination following the prescribed approach given in Section 3.3.2. Treat these nodes according to the responses above. This requirement is based on the observations of Phase 1 wherein debris fields, when encountered, were consistently contaminated through their thickness and sometimes beyond.
If bedrock or a rocky area is encountered at or above the target dredging depth, notify EPA, complete the dredging in the area to the design dredge elevation or to the bedrock surface.
3-14
The Louis Berger Group, Inc. Revised EPS for Phase 2 Hudson River PCBs Site December 2010
Document the extent of bedrock using the procedures developed in Phase 1. The choice of cap or backfill will be based on the concentrations found in the bedrock area in conjunction with the rest of the data from the CU according to the responses above, or as directed by EPA if samples cannot be obtained.
If a native (glacial Lake Albany) clay layer is encountered at or above the target dredging depth, notify EPA, complete the dredging in the area to the design dredge elevation or to the clay surface. Document the extent of clay using the procedures developed in Phase 1 and collect core samples to define its extent and its surface elevation. Analyze core segments to the top of the clay surface in the core. The choice of cap or backfill will be based on the concentrations found in the clay area in conjunction with the rest of the data from the CU according to the responses above, or as directed by EPA if samples cannot be obtained.
For areas where GE has uncovered either bedrock or glacial Lake Albany clay, EPA shall be notified as soon as possible after discovery, preferably while the dredging is still on-going. The procedures developed as part of Phase 1 to identify these conditions will be used by EPA to confirm that bedrock or glacial Lake Albany clay is present. GE will be responsible for the collection of the data to describe the nature of the river bottom, based on the techniques used in Phase 1 unless otherwise directed by EPA, EPA in its sole discretion shall determine the final extent of exposed bedrock or exposed glacial Lake Albany clay.
Response 8: Redredge high concentrations after two passes
This response addresses the mandatory redredge condition wherein two dredging passes have been completed but TPCB concentrations at one or more locations still equal or exceed 500 mg/kg at any depth.
Identify the nodes to be redredged.
Design the area and prism to be redredged, bounded by the edges of the CU or a perimeter line connecting the surrounding node locations not slated for dredging. Set the DoC for removal at each location based on the depth of contamination in each core. Use Thiessen polygons to extrapolate the DoC outward between adjacent nodes to be dredged. When a node to be dredged is adjacent to nodes not slated for removal, extend the dredge prism to the periphery of nodes not being dredged.
Since the CU or sub-unit has already had an initial cover, dredge the prism with added concern toward sediment resuspension. Confirm the new bathymetry at a 95 percent level of compliance (as was done for the earlier passes), resample the dredged locations. Evaluate the data set according to the Residuals Standard
The anticipated case under this response (which should be rare) is one in which a CU has a deep DoC, wherein variability in the DoC is potentially significant.
Response 9: Dredging in Cultural Resources and Structural Offset Areas
This response addresses those areas where the ability to dredge may be significantly limited or entirely inaccessible.
These areas must be addressed and evaluated individually. EPA will work with GE to decide the best means of treatment.
3-15
The Louis Berger Group, Inc. Revised EPS for Phase 2 Hudson River PCBs Site December 2010
3.3.5.1 Extent of Area to be Capped
Locations to be capped will be identified as described above, based on the presence of PCB inventory or elevated residual concentrations in the 0-6 inch sample. Both types of locations are considered non-compliant. The area associated with non-compliant nodes shall extend to the periphery of surrounding compliant nodes or to the edge of the CU. The handling of adjacent residual and inventory non-compliant nodes is described in the responses in Section 3.3.5 above.
Where a compliant node is surrounded by non-compliant nodes, the area associated with the compliant node shall be capped as well. Generally, three compliant nodes arranged in a triangle are required to define an area that does not require capping. Two adjacent compliant nodes can also define an area not needing capping if they are both adjacent to the CU boundary.
For locations where a single non-compliant node is surrounded by compliant nodes, the non-compliant node shall be capped to a perimeter line formed by connecting the surrounding compliant nodes. See Figure 3.3-1 for examples of these capping and backfill configurations. These steps will eliminate the more complex algorithm developed for Phase 1 that was a source of much discussion and often resulted in intricate geometries for response actions.
Any capped areas in the navigation channel must have a minimum of 14 feet of draft above the cap based on mean low water elevation in the pool and all caps in the channel shall be high velocity caps. Backfill will not be allowed in the navigation channel unless a minimum of 14 feet of draft relative to mean low water will exist after any backfill placement and the other criteria for backfilling in the navigation channel have been met. See further discussion in Section 3.3.5.2
The type of cap selection depends on the Tri+ PCB concentration of the non-compliant nodes, the velocity of the river, and other considerations. The cap specification will be developed during Phase 2 design period.
3.3.5.2 Shoreline Areas and the Navigation Channel
As noted above, the shoreline areas and navigation channel may require special treatment after the first dredging pass is completed. In both areas, it is possible that a second dredging pass will be required. Specifically, for shoreline areas, bank stability concerns may preempt contaminated sediment removal below 2 ft. In these cases, capping is often required, but in cases where the remaining contamination levels exceed 50 mg/kg TPCB, additional dredging to remove these sediments shall be required. In the case of the navigation channel, cap or backfill placement cannot take place if the placement will interfere with navigational use. Decisions to conduct a second dredging pass, cap, or backfill in shoreline areas and the navigation channel must consider:
For both the shoreline areas and navigation channel, post dredging samples must be collected in these areas to assure that they are adequately characterized regardless of the geometry of the post sampling grid. For shoreline areas, the sampling density will be the same as during Phase 1, with 1 sample per 80 feet of shoreline approximately parallel to flow. Perpendicular to flow, the shoreline sampling locations will be collected midway between the shoreline and the near-shore boundary elevation (117.5 ft elevation in RS-1). For the navigation channel, the post-dredging sampling grid shall be

3-16
The Louis Berger Group, Inc. Revised EPS for Phase 2 Hudson River PCBs Site December 2010
arranged to obtain approximately 1 sample for every 1/8 acre of channel area in every CU that includes the navigation channel.
If the water depth (based on mean low water) after the first pass in an area of the navigation channel is less than 15 feet (the originally defined DoC was found to be less than 15 feet below mean low water) and a second dredging pass is required, the dredging in the second pass must be to a depth that will allow the placement of a high velocity cap with 14 feet of draft at mean low water, or to the actual EoC, whichever is deeper. Additional post dredging sampling will then be necessary to characterize the remaining sediment. In general, no backfill will be placed on the dredged surface in the navigation channel unless there is 15 ft of draft available, based on mean low water, unless otherwise directed by EPA. Capping in the navigation channel shall be avoided whenever possible. If capping is necessary, its design and implementation must be such that the top of the cap allows for a minimum of 14 feet of draft to allow for future maintenance dredging by the NYS Canal Corporation (NYSCC). This is consistent with the recommendation of the Peer Review Panel and the maintenance requirements of the canal. Specifically, canal maintenance extends to 14 ft below mean low water and any contaminated sediment above that elevation prevents routine canal maintenance and instead requires special handling by the NYSCC.
For shoreline areas, if TPCB concentrations in post dredging sediments are equal to or greater than 50 mg/kg, these sediments must be removed. If TPCB concentrations in sediments below the design dredge elevation are less than 50 mg/kg, either additional dredging shall be performed or a cap shall be placed based on the capping criteria. Nodes used for shoreline areas will also be considered as part of the 1-acre subunit and 5-acre CU averaging. This approach for the shoreline area is similar to what was required in Phase 1, except that there are no individual criteria other than the 50 mg/kg TPCB and the 27 mg/kg Tri+ PCB thresholds. (The 27 mg/kg Tri+ PCB concentration is effectively less stringent that the TPCB criteria, and so is not expected to yield additional nodes for redredging in the shoreline area.) Treatment of shoreline areas shall also include the requirement to dredge sediment with 500 mg/kg or greater concentration of TPCB. If capping or redredging is required for shoreline nodes, the area and prism to be treated is defined as follows. For the shore-side, upstream, and downstream boundaries, the 19,000 cfs shoreline or edge of the CU and a perimeter line running perpendicular to shore at the adjacent upstream and downstream compliant node locations. Additionally, the water side boundary is defined as the offshore limit of the near-shore area (117.5 ft contour line in RS-1) or the distance offshore at which the stable slope surface developed for the first pass intersected the DoC surface offshore, as defined by the offshore nodes, whichever is further from shore. If compliant residual nodes exist offshore, these can be used as a perimeter if that serves to reduce the extent of redredging. Shoreline nodes will be treated for backfill or capping in the same fashion as regular post-dredging nodes. In the event that shoreline cores are not available prior to dredging in a shoreline area, the initial removal at the shoreline shall be 2 feet, following the stable slope requirements out to the area bounded by dredging design cores (existing SSAP and newly collected cores) or to the intersection of the stable slope surface and the DoC as directly measured by the bounding cores adjusted for uncertainty, whichever is closer to shore, but at a minimum, the area must extend to the 117.5 ft contour

3-17
The Louis Berger Group, Inc. Revised EPS for Phase 2 Hudson River PCBs Site December 2010
3.4 Limits on Capping
Tracking the Extent of Capping
As part of the evaluation and closure of each CU and sub-unit, GE shall track the amount of area and the number of nodes subject to the various treatments by CU and sub-unit. In order to facilitate the timely tracking of the extent of backfilling and capping in the field, the post-dredging sampling locations (referred to here as nodes) shall be used in an area-weighted nodal index (referred to hereafter as the Nodal Capping Index) as a surrogate for the exact extent of capping and backfilling. The Nodal Capping Index forms the measurement basis for compliance with the capping criteria of the residuals standard.
For tracking purposes, the post-dredging surfaces will be categorized first as to their level of compliance with the standard and then as to the areas of the river in which they fall. The level of compliance is defined by the categories below:
A. Inventory capped in place (i.e., the node contained sediment below 6 inches containing Tri+ PCB concentrations equal to or greater than 6 mg/kg).
B. Elevated residuals capped (i.e. the node caused the average surface concentration in the CU or sub-unit to exceed 1 mg/kg Tri+ PCB or had a surface concentration of 27 mg/kg Tri+ PCB or greater).
C. Compliant areas backfilled (i.e., the node was part of a CU or sub-unit area whose average Tri+ PCB concentration was 1 mg/kg or less).
For the following categories, define the classes of river bottom areas that will be tracked as part of the standard. Note that the first three categories represent specific geographic settings whereas the latter three represent river bottom types.
1) Structural offsets; 2) Cultural resource areas; 3) Shoreline areas; 4) Exposed bedrock areas; 5) Exposed glacial Lake Albany clay areas 6) River bottom not falling into any of the above categories typically silt, sand and gravel
areas For the purposes of the area-based reporting, the remedial area that falls into each of the six river bottom classes upon completion of dredging must then be compiled into the three compliance levels. The data shall be compiled by CU and then summarized to document the cumulative disposition of the remediated areas. This information will be used in the adaptive management of the implementation of the standard, including an evaluation of the Nodal Capping Index as a measure of success.
Nodal Classification
In addition to the area compilation, the outcome of the individual nodes is also tracked for use in the calculation of the Nodal Capping Index. The nodes are classified according to the same categories for the area tabulation given above. Nodes located within cultural off-set, structural offset and shoreline areas are
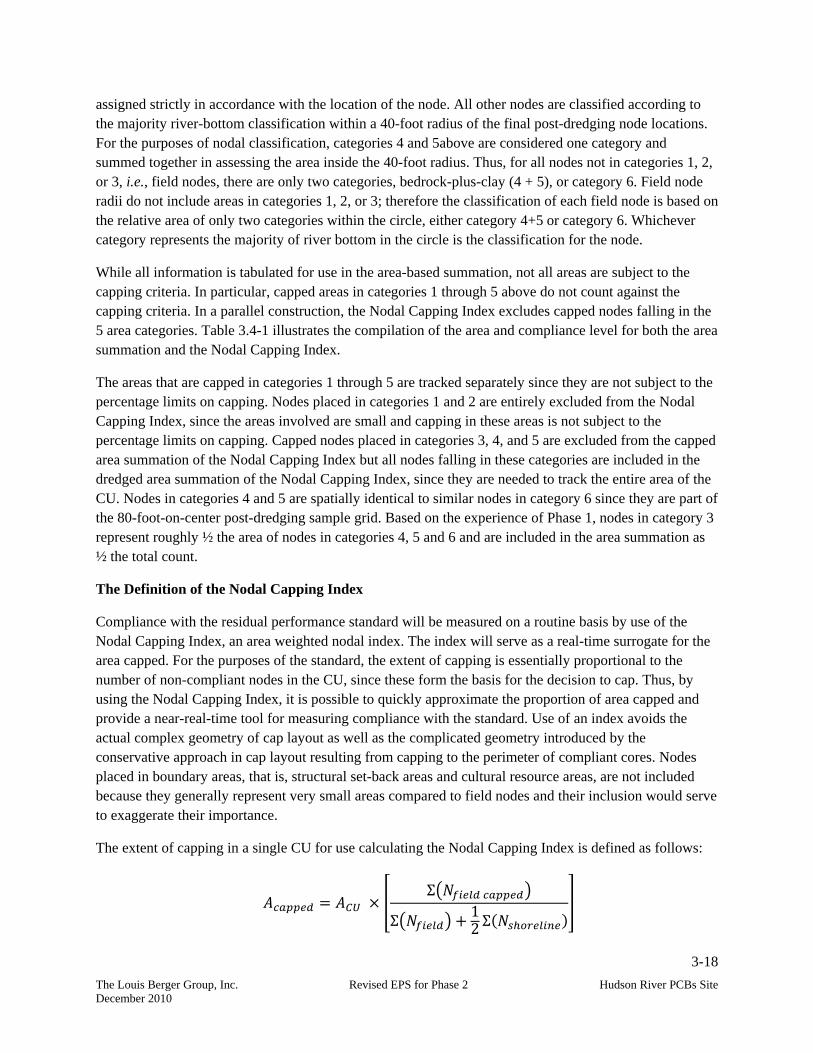
3-18
The Louis Berger Group, Inc. Revised EPS for Phase 2 Hudson River PCBs Site December 2010
assigned strictly in accordance with the location of the node. All other nodes are classified according to the majority river-bottom classification within a 40-foot radius of the final post-dredging node locations. For the purposes of nodal classification, categories 4 and 5above are considered one category and summed together in assessing the area inside the 40-foot radius. Thus, for all nodes not in categories 1, 2, or 3, i.e., field nodes, there are only two categories, bedrock-plus-clay (4 + 5), or category 6. Field node radii do not include areas in categories 1, 2, or 3; therefore the classification of each field node is based on the relative area of only two categories within the circle, either category 4+5 or category 6. Whichever category represents the majority of river bottom in the circle is the classification for the node.
While all information is tabulated for use in the area-based summation, not all areas are subject to the capping criteria. In particular, capped areas in categories 1 through 5 above do not count against the capping criteria. In a parallel construction, the Nodal Capping Index excludes capped nodes falling in the 5 area categories. Table 3.4-1 illustrates the compilation of the area and compliance level for both the area summation and the Nodal Capping Index.
The areas that are capped in categories 1 through 5 are tracked separately since they are not subject to the percentage limits on capping. Nodes placed in categories 1 and 2 are entirely excluded from the Nodal Capping Index, since the areas involved are small and capping in these areas is not subject to the percentage limits on capping. Capped nodes placed in categories 3, 4, and 5 are excluded from the capped area summation of the Nodal Capping Index but all nodes falling in these categories are included in the dredged area summation of the Nodal Capping Index, since they are needed to track the entire area of the CU. Nodes in categories 4 and 5 are spatially identical to similar nodes in category 6 since they are part of the 80-foot-on-center post-dredging sample grid. Based on the experience of Phase 1, nodes in category 3 represent roughly ½ the area of nodes in categories 4, 5 and 6 and are included in the area summation as ½ the total count.
The Definition of the Nodal Capping Index
Compliance with the residual performance standard will be measured on a routine basis by use of the Nodal Capping Index, an area weighted nodal index. The index will serve as a real-time surrogate for the area capped. For the purposes of the standard, the extent of capping is essentially proportional to the number of non-compliant nodes in the CU, since these form the basis for the decision to cap. Thus, by using the Nodal Capping Index, it is possible to quickly approximate the proportion of area capped and provide a near-real-time tool for measuring compliance with the standard. Use of an index avoids the actual complex geometry of cap layout as well as the complicated geometry introduced by the conservative approach in cap layout resulting from capping to the perimeter of compliant cores. Nodes placed in boundary areas, that is, structural set-back areas and cultural resource areas, are not included because they generally represent very small areas compared to field nodes and their inclusion would serve to exaggerate their importance.
The extent of capping in a single CU for use calculating the Nodal Capping Index is defined as follows:
Σ
Σ 12 Σ
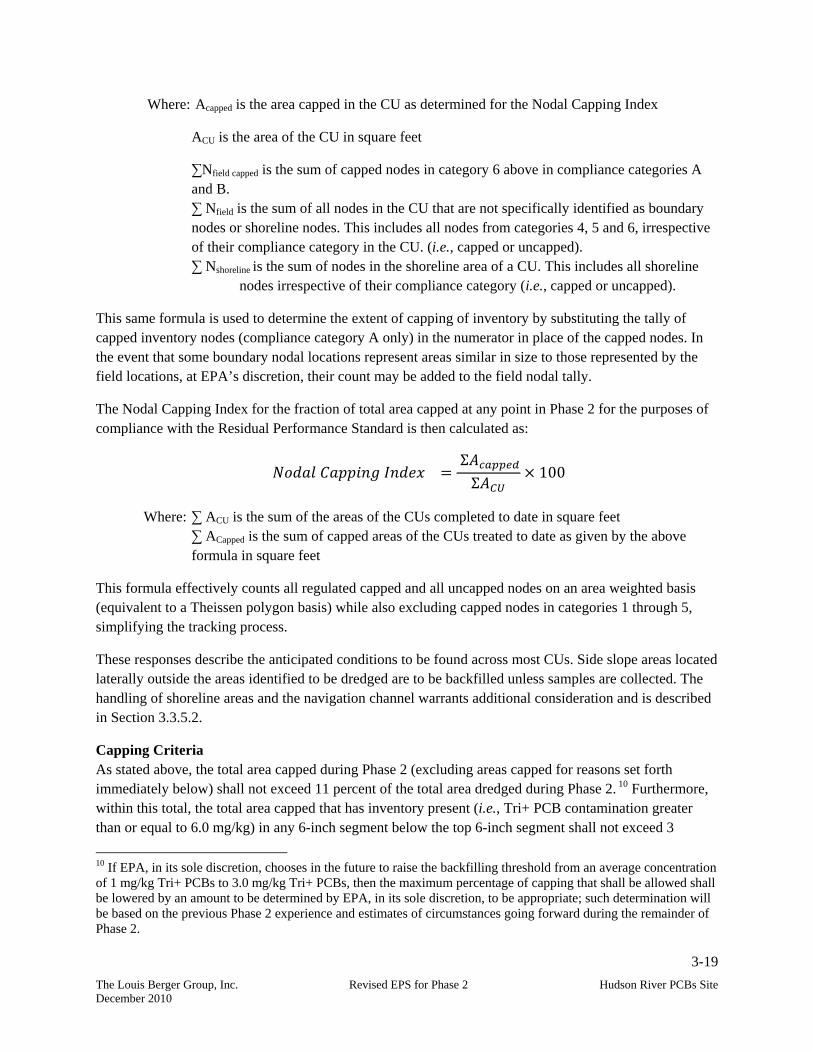
3-19
The Louis Berger Group, Inc. Revised EPS for Phase 2 Hudson River PCBs Site December 2010
Where: Acapped is the area capped in the CU as determined for the Nodal Capping Index
ACU is the area of the CU in square feet
∑Nfield capped is the sum of capped nodes in category 6 above in compliance categories A and B.
∑ Nfield is the sum of all nodes in the CU that are not specifically identified as boundary nodes or shoreline nodes. This includes all nodes from categories 4, 5 and 6, irrespective of their compliance category in the CU. (i.e., capped or uncapped). ∑ Nshoreline is the sum of nodes in the shoreline area of a CU. This includes all shoreline
nodes irrespective of their compliance category (i.e., capped or uncapped).
This same formula is used to determine the extent of capping of inventory by substituting the tally of capped inventory nodes (compliance category A only) in the numerator in place of the capped nodes. In the event that some boundary nodal locations represent areas similar in size to those represented by the field locations, at EPA’s discretion, their count may be added to the field nodal tally.
The Nodal Capping Index for the fraction of total area capped at any point in Phase 2 for the purposes of compliance with the Residual Performance Standard is then calculated as:
Σ
Σ100
Where: ∑ ACU is the sum of the areas of the CUs completed to date in square feet ∑ ACapped is the sum of capped areas of the CUs treated to date as given by the above
formula in square feet
This formula effectively counts all regulated capped and all uncapped nodes on an area weighted basis (equivalent to a Theissen polygon basis) while also excluding capped nodes in categories 1 through 5, simplifying the tracking process.
These responses describe the anticipated conditions to be found across most CUs. Side slope areas located laterally outside the areas identified to be dredged are to be backfilled unless samples are collected. The handling of shoreline areas and the navigation channel warrants additional consideration and is described in Section 3.3.5.2.
Capping Criteria As stated above, the total area capped during Phase 2 (excluding areas capped for reasons set forth immediately below) shall not exceed 11 percent of the total area dredged during Phase 2. 10 Furthermore, within this total, the total area capped that has inventory present (i.e., Tri+ PCB contamination greater than or equal to 6.0 mg/kg) in any 6-inch segment below the top 6-inch segment shall not exceed 3
10 If EPA, in its sole discretion, chooses in the future to raise the backfilling threshold from an average concentration of 1 mg/kg Tri+ PCBs to 3.0 mg/kg Tri+ PCBs, then the maximum percentage of capping that shall be allowed shall be lowered by an amount to be determined by EPA, in its sole discretion, to be appropriate; such determination will be based on the previous Phase 2 experience and estimates of circumstances going forward during the remainder of Phase 2.
3-20
The Louis Berger Group, Inc. Revised EPS for Phase 2 Hudson River PCBs Site December 2010
percent of the total area dredged during Phase 2.11 (These two percentage limits are hereinafter referred to as the “Percentage Capping Limits.”) Capping in the following types of areas (hereinafter, the “non-counted capping areas”), where such capping is allowed by EPA, shall not count against the Percentage Capping Limits:
i. locations capped due to structural offsets; ii. locations capped due to the presence of cultural resources; iii. locations capped in the shoreline area; iv. locations capped due to the presence of exposed bedrock; and v. locations capped due to the presence of exposed glacial Lake Albany clay.
In the identification of locations capped due to the presence of exposed bedrock and exposed glacial Lake Albany clay, EPA in its sole discretion shall determine the final categorization of any specific node.
The capping Evaluation Levels and Control Levels presented in the attached Tables 3.4-2 and 3.4-3 shall be used to evaluate, on an ongoing basis, the degree of success of the dredging design – in particular, the design DoC – in ensuring that the Percentage Capping Limits, as measured by the Nodal Capping Index, are not exceeded in Phase 2, taken as a whole.12 This evaluation will be the basis for adjustments to be made, as needed, to the EoC, the design dredge elevation and/or the dredging approach in the remaining dredge areas to ensure that the Percentage Capping Limits will not be exceeded. The sliding scale of compliance set forth in the tables is intended to allow GE sufficient time to hone the dredging process into compliance with the Percentage Capping Limits while also recognizing that some of the more difficult CUs are expected early in the dredging program based on the extensive amount of debris encountered in Phase 1 in the Rogers Island area, where Year 1 of Phase 2 will begin.
Percent area capped shall be calculated based on the Nodal Capping Index as described above. This index simplifies the tracking process and avoids the complexities introduced by the specific capping requirements at the edges of capped areas During each year of Phase 2, at each of the following times (hereinafter, the “Capping Review Dates”), GE shall determine the percentage of the total area dredged, since Phase 2 began, that has been capped (other than capping in the non-counted capping areas) and also the percentage of the total area dredged, since Phase 2 began, that has been capped with inventory present (again, not counting capping in the non-counted capping areas), and shall compare those percentages to the appropriate capping Evaluation Level and Control Level as set forth in Tables 3.4-2 and 3.4-3, respectively13:
11 The 3 percent maximum for capping over inventory is a sub-category within the 11 percent overall maximum. 12 The tables have been prepared with fine increments so that on any given Capping Review Date (as defined in this section), EPA and GE will be able to identify the appropriate Evaluation Level and Control Level percentages that correspond to the number of acres that have been dredged. See also the next footnote. 13 If the total number of acres that has been dredged in Phase 2 as of a given Capping Review Date falls between two numbers shown on the far left-hand column (Acres Dredged) of Tables 3.4-2 and 3.4-3, then the applicable Evaluation Level and Control Level percentages for that Capping Review Date shall be those percentages which correspond to the smaller acreage number. Thus, for example, if as of a given Capping Review Date, the total number of acres that have been dredged in Phase 2 is 105, then the applicable Evaluation Level percentage on Table 3.4-2 will be 12.8 percent and the applicable Control Level percentage will be 14.0 percent
3-21
The Louis Berger Group, Inc. Revised EPS for Phase 2 Hudson River PCBs Site December 2010
As soon as post-dredging sampling has occurred, that year, in 100 nodes;
On July 31 of each year; and
On December 1 of each year At each of those times, after making the aforesaid comparison, GE shall proceed as follows:
A. If neither the capping Evaluation Level nor the capping Control Level has been exceeded, GE need not make adjustments to the EoC and the design dredge elevation in remaining CU’s, or more widely employ a 2-pass dredging approach, in order to reduce the cumulative amount of capping. However, GE shall indicate, in its next monthly progress report under the Consent Decree, the percentage of the total area dredged, since Phase 2 began, that has been capped (both in general and over inventory) in the non-counted capping areas as well as in other areas.
B. If the applicable capping Control Level has been exceeded, then within 5 days of the applicable Capping Review Date, GE shall submit to EPA, for review and approval, a report that sets forth the specific adjustments that GE proposes to make to the EoC and the design dredge elevation in the remaining dredge areas, and/or a specific plan for a wider usage of a 2-pass dredging approach, in order to reduce the cumulative amount of capping below the capping Evaluation Level. Such report shall include GE’s rationale for the proposed adjustments and, if it proposes to more widely use a 2-pass dredging approach, shall explain how that approach will be implemented. For the dredging that occurs between the time that GE submits this report to EPA and the time that EPA approves the report or directs GE to make adjustments other than those proposed in GE’s report, GE may implement its proposed adjustments. Within 5 days after EPA approves the report or directs GE to make adjustments other than those proposed in GE’s report, GE shall implement the approved or required measures. If after making the adjustments approved or required by EPA, the cumulative amount of capping in Phase 2 (other than capping in the non-counted capping areas) falls below the applicable capping Evaluation Level, GE may, at its discretion, readjust the design dredge elevation in the remaining dredge areas, provided GE remains below the applicable capping Evaluation Level.
C. If the applicable capping Evaluation Level has been exceeded but the applicable Control Level has not been exceeded, then within 5 days of the applicable Capping Review Date, GE shall submit to EPA, for EPA’s information, a report identifying measures GE will take to reduce the cumulative amount of capping below the capping Evaluation Level. GE shall implement such measures by no later than 5 days after submitting said report to EPA.
3.5 Reporting and Notifications
EPA and GE will work together to simplify data management and transfer. A streamlined data exchange process, such as internet data sharing, shall provide additional time for EPA review while actually shortening the calendar time in the review process. It is imperative that EPA receive both draft and final versions of the data as it is delivered to GE by the analytical laboratories.
3-22
The Louis Berger Group, Inc. Revised EPS for Phase 2 Hudson River PCBs Site December 2010
3.5.1 Routine Reporting
Data sets such as post dredging elevations, sample analysis results, non-compliant boundaries etc. shall be provided to EPA digitally as soon as practicable before the daily meetings with GE. A consistent distribution list shall be maintained. Bathymetric surveys shall be provided upon completion of the surveys in electronic form, and as soon as practicable prior to any presentation to EPA at the daily meetings.
3.5.2 Contingency Reporting
Weekly progress reports shall be prepared by the construction manager and submitted to the EPA site manager, as soon as practicable, for EPA’s use in evaluating compliance with the Residuals Standard. The reports will need to summarize, at a minimum, the results of residual sediment sampling, exceedances of the Residuals Standard criteria by CU, the courses of action taken or proposed to be taken, and rationale. Laboratory data must be made available to EPA immediately upon receipt from the laboratory and in a useable database format to be agreed to by EPA.
Following the completion of remedial activities in each CU, the construction manager shall prepare individual CU reports and submit them to the EPA Hudson River Field Office director, according to a schedule to be defined by the EPA, for the EPA’s use in evaluating compliance with the Residuals Standard. Each CU report must include, at a minimum, the following information:
CU identification
Description of type(s) of dredging equipment used
Description of sediment type(s) encountered
Residual sediment sampling results
The Nodal Capping Index and supporting data
An attestation that the sampling data was validated, including a discussion of any data qualifiers applied
Discussion of any contingency actions taken
3.6 Special Studies
There will be two special studies for the Residuals Performance Standard:
1. Evaluation of missed inventory and effectiveness of the EoC/DoC interpolation process in the estimation of uncertainty in the DoC.
2. Evaluation of PCB contamination outside the dredge prisms resulting from the redistribution of PCBs via dredging-related activities and surface sediment recovery rates.
The first special study shall be conducted by GE to evaluate the amount of missed inventory and residual contamination remaining after the first dredging pass, and how addressing measurement/estimation of uncertainty in determining dredging cut line elevations may reduce the amount. This special study will serve to assess the potential effectiveness of both the modified dredging approach described in this EPS, and the application of uncertainty estimates in describing the thickness and elevation of sediment

3-23
The Louis Berger Group, Inc. Revised EPS for Phase 2 Hudson River PCBs Site December 2010
removal. The process of estimating the mass remaining after dredging is described in Section 7 of this Phase 2 EPS document.
The second special study shall be conducted by GE to examine the impact of PCB release due to dredging-related activities on areas that will not be subject to dredging. This study will entail the collection of surface sediments throughout the Upper Hudson. EPA has begun a study which will serve to describe the baseline conditions for Phase 2, by obtaining samples from over 300 locations in the Upper Hudson. Over 100 locations were sampled by EPA in River Section 1 in 2010. The remaining locations, predominately in River Sections 2 and 3, shall be collected by GE in Year 1 of Phase 2 (2011) with similar methodologies as employed by EPA. These locations shall be resampled by GE in the spring prior to the onset of dredging for at least the first three years of dredging (i.e., prior to Year 2, Year 3 and Year 4 of Phase 2, at a minimum). The results of these annual spring sampling events will be compared with the baseline data obtained in 2010 and 2011to examine the change in surface concentrations with time during dredging. The need to re-occupy these areas in future years will be dependent on evaluation of the initial results. If after any sampling event, it is evident that redeposition will not have any long term impacts, GE may request that the sampling be discontinued subject to EPA’s approval.
4-1
The Louis Berger Group, Inc. Revised EPS for Phase 2 Hudson River PCBs Site December 2010
4. Overview of Resuspension Standard for Phase 2
EPA’s 2002 ROD (USEPA, 2002) requires the development of a Resuspension Standard but does not set forth any framework or numerical value for such a standard. The Resuspension Standard provides that framework and is designed to limit the concentration of PCBs in river water, such that downstream transport of PCB-contaminated dredged material is appropriately constrained and potential users of Hudson River water are protected.
The Phase 2 Resuspension Standard consists of a control level TPCB concentration in the water column of 500 nanograms per liter (ng/L) (i.e., 500 parts per trillion) and numerical Tri+ PCB net load criteria developed based on observations during Phase 1, sampling data and analyses obtained since completion of Phase 1, updated modeling results, and the recommendations of the Peer Review Panel. Specifically, the numerical net load criteria will be equal to specified percentages of the Tri+ PCB mass to be dredged during each season. These numerical net load criteria will be adjusted as needed in accordance with the Adaptive Management Process, consistent with the recommendations of the Panel. Among the factors to be considered by EPA in the adaptive management of the PCB load standards are the estimates of the mass of PCB remaining for removal, the rates of PCB mass loss observed, the observations of PCB impacts to fish and downstream sediments, and the projected impacts (if any) of the PCB resuspension and redeposition on the long-term rates of recovery, based on evaluation of data trends and simulation by an acceptable, peer-reviewed model.
For each dredging season, the specified numerical net load criteria will consist of the following: 1) seasonal load criteria which are based on certain percentages of the estimate of the targeted Tri+ PCB mass to be dredged that season, and 2) daily net load criteria which represent proration of the cumulative net loads for the season, based on the anticipated number of dredging days in the season.
Further details on the calculation of the resuspension numerical seasonal net load, and the daily average net load criteria are provided in Section 4.2. In addition, the methodology for calculating the Tri+ PCB mass to be dredged is described in Section 7.
The Resuspension Standard calls for the implementation of a routine water quality monitoring program at both near and far-field stations to evaluate compliance with the standard and specifies that engineering evaluations and corrective actions may be required if the criteria are exceeded. The standard further outlines monitoring contingencies that can be required when the control level TPCB concentration is exceeded, consisting of increased sampling frequency and more rapid laboratory turn-around of analytical data from sampling stations, to better characterize developing changes and trends in water quality.
4.1 Phase 1 Observations and Additional Data Needs in Support of the Resuspension Standard for Phase 2
The original Resuspension Standard anticipated refinements to the load-based criteria (USEPA, 2004; Vol.1, Section 4.0). Specifically, the criteria in the Resuspension Standard were to be reviewed and refined if the estimate of PCB mass to be removed is significantly different from previous estimates. It has been clearly documented based on Phase 1 that the mass to be removed is indeed significantly higher

4-2
The Louis Berger Group, Inc. Revised EPS for Phase 2 Hudson River PCBs Site December 2010
than anticipated at the time the standard was originally developed. Besides increased PCB mass, other experiences/lessons learned from Phase 1 underscore the need for additional changes to the Resuspension Standard. Information will continue to be collected and evaluated.
The revised release estimates must account for updated baseline load estimates and the new, significantly larger estimates of the amount of PCB mass to be removed.
The ROD originally estimated the PCB mass to be removed as approximately 70,000 kg, and the total project cumulative load standard was set at just below 1 percent of this total, or 650 kg. Based on the Phase 1 experience and additional sampling results, the estimated PCB mass for the entire project has been revised to the range 140,000 to 200,000 kg. The Peer Review Panel recommended that for Year 1 of Phase 2, seasonal cumulative numerical net load criteria be set at 2 percent and 1 percent (as measured at the Thompson Island Dam and Waterford monitoring stations, respectively) of the projected annual Tri+ PCB mass removal, regardless of streamflow rates. The Panel said these targets should help guide Best Management Practices, but should not lead to shutting down operations.
The projected mass to be removed in Year 1 of Phase 2 is currently unknown (investigations are currently underway and will inform the estimates of mass removal for 2011 and shall be provided in the Phase 2, Year 1 RAWP). When that information becomes available, the load calculation formula provided in Section 4.2 below will be used to determine the daily numerical net load criteria for the Thomson Island and Waterford monitoring stations for Phase 2, Year 1. The seasonal and daily net load criteria will be updated each year for the coming season’s dredging, based on the estimate of PCB mass to be removed in that season and the percent release rates referred to above. The seasonal net load criteria, including the 2 percent and 1 percent levels, are also subject to adjustment based on additional information, in accordance with the Adaptive Management Process.
It should be noted that the observed baseline loads to the Lower Hudson prior to the Phase 1 dredging were substantially greater than the previous model forecast under Monitored Natural Attenuation (MNA) and show very little decline (from 2004 to 2008). Hence, the anticipated loads to the Lower Hudson River under baseline conditions will be significantly greater than those forecast by the HUDTOX model. Also the surface sediment concentrations in the Upper Hudson River remain elevated despite the passage of time and continue to provide a greater reservoir of contaminated sediments for transport to the Lower Hudson than was envisioned when the remedy was selected. These observations provide further impetus for the remedy and highlight the need for revising the PCB net load criteria to account for the greater PCB mass and higher baseline loads.
4.1.1 Technical Background and Approach
The Hudson River ROD requires Engineering Performance Standards that address specified dredge-related issues, including resuspension rates during dredging. It was recognized in the ROD that there is a likelihood of localized temporary increases in water column and potentially fish tissue PCB concentrations as a result of dredging activities. In compliance with the requirements of the ROD, EPA developed the Phase 1 Resuspension Standard, which included several Action Levels for suspended solids, TPCB and Tri+ PCB that were established for near-field and far-field locations to ensure that dredging-related problems could be quickly identified and corrected before criteria are exceeded that
4-3
The Louis Berger Group, Inc. Revised EPS for Phase 2 Hudson River PCBs Site December 2010
might require temporarily halting the dredging operations. The ROD further anticipated the need for refinement and revisions of the Performance Standards to reflect lessons learned during Phase 1 dredging.
The Phase 2 Resuspension Standard incorporates the recommendations of the Peer Review Panel, and experiences gained from Phase 1 in terms of actual PCB mass to be removed, projected PCB loss rates during dredging, and dredge-related release and transport of suspended solids, among other issues. Compliance with the criteria will be tested through monitoring, which comprises routine monitoring when the dredging operations are in compliance and contingency monitoring that can be required, as discussed below, when the 500 ng/L TPCB concentration criteria are exceeded. Exceedance of the criteria may require engineering evaluations and review of the dredging operations to identify potential causes and implement corrective measures as necessary. In addition to compliance monitoring, there are sampling requirements in the form of special studies to gather information that can be used to further refine operations or elements of the Resuspension Standard.
4.2 Implementation of the Phase 2 Resuspension Standard
This section describes the Resuspension Standard criteria in terms of TPCB concentrations and Tri+ PCB numerical net loads, as applicable at near-field and far-field locations. Table 4.2-1 presents the requirements of the Resuspension Standard.
4.2.1 Far-Field TPCB Concentration Action Levels
Control Level Total PCB Concentration
The Phase 2 Resuspension Standard for water column PCB concentrations is the control level concentration of 500 ng/L TPCBs, which shall be applied as follows:
1. When dredging is being performed in River Section 1:
a. If and when there is a confirmed exceedance of 500 ng/L TPCBs at the Thompson Island or Lock 5 monitoring stations, EPA may require GE to conduct evaluations of the dredging operations and/or implement best management practices (BMPs) that do not require GE to slow down or shut down the dredging operations.
b. If and when concentrations exceed 500 ng/L TPCBs at the Lock 5 monitoring station for five days out of any seven-day period, EPA may require GE to conduct evaluations of the dredging operations and/or implement operational changes which include slowdown or shutdown of dredging operations. In general, a slowdown and evaluation of operations would be required before shutdown, with shutdown being the operational change of last resort. If EPA does require a slowdown or shutdown, normal operations shall not resume until the concentration at the Lock 5 monitoring station is confirmed to be below 500 ng/L Total PCBs for 2 consecutive days, unless EPA allows otherwise.
2. When dredging is being performed in River Section 2 between the Thompson Island Dam and one mile upstream of the Lock 5 monitoring station:
a. If and when there is a confirmed exceedance of 500 ng/L TPCBs at the Lock 5 monitoring station, EPA may require GE to conduct evaluations of the dredging
4-4
The Louis Berger Group, Inc. Revised EPS for Phase 2 Hudson River PCBs Site December 2010
operations and/or implement BMPs that do not require GE to slow down or shut down the dredging operations.
b. If and when concentrations exceed 500 ng/L TPCBs at the Lock 5 monitoring station for five days out of any seven-day period, EPA may require GE to conduct evaluations of the dredging operations and/or implement operational changes which may include slowdown or shutdown of dredging operations. In general, a slowdown and evaluation of operations would be required before shutdown, with shutdown being the operational change of last resort. If EPA does require a slowdown or shutdown, normal operations shall not resume until the concentration at the Lock 5 monitoring station is confirmed to be below 500 ng/L TPCBs for 2 consecutive days, unless EPA allows otherwise. EPA recognizes that higher concentrations might be observed at the Lock 5 monitoring station when dredging is being conducted at “Hot Spot 28” near River Mile 186, especially if river velocities are high. EPA will consider, through adaptive management, the applicability of the concentration standard at the Lock 5 monitoring station during this period and may use the Stillwater monitoring station (which GE shall install) as the point of compliance for the concentration standard.
3. When dredging is being performed between less than one mile upstream of the Lock 5 monitoring station and one mile upstream of a new monitoring station that GE shall install at Stillwater:
a. If and when there is a confirmed exceedance of 500 ng/L TPCBs at the Stillwater monitoring station, EPA may require GE to conduct evaluations of the dredging operations and/or implement BMPs that do not require GE to slow down or shut down the dredging operations.
b. If and when concentrations exceed 500 ng/L TPCBs at the Stillwater monitoring station for five days out of any seven-day period, EPA may require GE to conduct evaluations of the dredging operations and/or implement operational changes which include slowdown or shutdown of dredging operations. In general, a slowdown and evaluation of operations would be required before shutdown, with shutdown being the operational change of last resort. If EPA does require a slowdown or shutdown, normal operations shall not resume until the concentration at the Stillwater monitoring station is confirmed to be below 500 ng/L TPCBs for 2 consecutive days, unless EPA allows otherwise.
4. During dredging in any river section, if there is a confirmed exceedance of 500 ng/L TPCBs at the Waterford monitoring station, EPA may require GE to conduct evaluations of the dredging operations and/or implement operational changes which include slowdown or shutdown of dredging operations. In general, a slowdown and evaluation of operations would be required before shutdown, with shutdown being the operational change of last resort. If EPA does require a slowdown or shutdown, normal operations shall not resume until the concentration at the Waterford monitoring station is confirmed to be below 500 ng/L TPCBs for 2 consecutive days, unless EPA allows otherwise.
5. Any evaluation of operations resulting from an exceedance of 500 ng/L TPCBs for five days out of any seven-day period at the Lock 5 or Stillwater monitoring stations, or from a confirmed exceedance of 500 ng/L Total PCBs at the Waterford monitoring station, shall, if directed by
4-5
The Louis Berger Group, Inc. Revised EPS for Phase 2 Hudson River PCBs Site December 2010
EPA, include an evaluation of all upstream operations, and not only of the operations immediately upstream of the monitoring station where the exceedance was detected.
6. At any time that either Halfmoon or Waterford are unable to obtain water from Troy, EPA may at its discretion require a slowdown or shutdown of dredging based on a single exceedance or multiple exceedances of 500 ng/L Total PCBs at Lock 5, Stillwater or Waterford. Unless EPA allows otherwise, the slowdown or shutdown would continue until PCB levels return below a confirmed level of 500 ng/L Total PCBs, or until both Waterford and Halfmoon are once again obtaining water from Troy.
7. EPA may, at its discretion, through adaptive management, increase the minimum one-mile distance between dredging operations in River Sections 2 and 3 and the far-field station to be used.
4.2.2 Far-Field Tri+ PCB Numerical Load Criteria
The far-field numerical net Tri+ PCB load criteria consist of a seasonal net load that will be tracked via a daily net load. As recommended by the Peer Review Panel and described below, the cumulative net load criteria for each dredging season are based on 2 percent (at the first far field station which is at least 1 mile downstream of the dredging) and 1 percent (as monitored at the Waterford station) of the Tri + PCB mass to be removed during the dredging season. These criteria will be applied on a daily basis as follows:
1. When dredging is being performed only in River Section 1, the daily Tri+ PCB load standards shall be 2 percent and 1 percent (as measured at the Thompson Island Dam and Waterford monitoring stations, respectively) of the Tri+ PCB mass removed, if concurrent streamflows measured at Fort Edward are under 5,000 cfs. If flows are greater than 5,000 cfs, the specified percentages are increased to 3 percent and 2 percent at Thompson Island Dam and Waterford stations, respectively. When dredging operations are being performed concurrently in more than one river section, the daily 3 percent or 2 percent (depending on whether flows are higher or lower than 5,000 cfs, respectively) Tri+ PCB load standard shall apply at the closest far-field monitoring station, other than Waterford, that is at least one mile downstream of the southernmost dredging operation in each river section. The daily PCB load standard at Waterford shall continue to be 2 percent or 1 percent (depending on whether flows are higher or lower than 5,000 cfs, respectively) of the Tri+ PCB mass removed unless, in the future, EPA decides to modify or eliminate the load standard that applies at Waterford during times that dredging operations are being performed downstream of River Section 1.
2. Compliance with the daily PCB load standards shall be determined based on a 7-day running average of the measured Tri+ PCB net load as follows:
a. For all far-field stations excluding Waterford, if the 7-day running average Tri+ PCB net load exceeds the 2 percent load standard for 14 or more consecutive days when the average flow during the same period, as measured at Fort Edward, is under 5,000 cfs, or exceeds 3 percent when the average flow during the same period is above 5,000 cfs, EPA may require GE to conduct evaluations of the dredging operations and/or implement operational changes which include slowdown of dredging operations.

4-6
The Louis Berger Group, Inc. Revised EPS for Phase 2 Hudson River PCBs Site December 2010
b. For the Waterford station, if the 7-day running average Tri+ PCB net load exceeds the 1 percent load standard for 21 or more consecutive days when the average flow during the same period, as measured at Fort Edward, is under 5,000 cfs, or exceeds 2 percent when the average flow during the same period is above 5,000 cfs, EPA may require GE to conduct evaluations of the dredging operations and/or implement operational changes which include slowdown of dredging operations.
c. If EPA requires a slowdown, normal operations shall not resume until the Tri+ PCB load is below the 3 percent, 2 percent or 1 percent load standard, as the case may be, for 2 consecutive days, unless EPA allows otherwise.
3. If one or more of the annual PCB load standards is/are exceeded, EPA may require GE to conduct evaluations of the dredging operations and/or implement operational changes in the subsequent seasons.
EPA will calculate the 3 percent, 2 percent and 1 percent load standards and the net load using the formula below. On a day-to-day basis, the seasonal load criteria will be tracked by comparing the net daily numerical load criteria, which represent a proration of the 3 percent, 2 percent and 1 percent load standards based on the anticipated number of dredging days in the season and the planned mass removal, to the measured daily Tri+ PCB water column net load at the applicable monitoring stations. The following equation may be used for the daily numerical net load criteria calculations unless EPA approves an alternative formulation using day-to-day estimates of the mass to be removed
Net Daily Load T PCB M %
Where
% allowable release = 2% at Thompson Island or Lock 5 or Stillwater for flows less than 5,000 cfs at Ft Edward
= 3% at Thompson Island or Lock 5 or Stillwater for flows greater than 5,000 cfs at Ft Edward
= 1% at Waterford for flows less than 5,000 cfs at Ft Edward = 2% at Waterford for flows greater than 5,000 cfs at Ft Edward
As an example application of the above equation, assume that 11,000 kg Tri+ PCB will be removed in Year 1. The cumulative net load criterion for Year 1 at Thompson Island monitoring station is calculated as 220 kg Tri+ PCB (i.e., 2 percent of 11,000 kg), while the cumulative net load criterion at Waterford monitoring station is 110 kg (i.e., 1 percent of 11,000 kg). Applying the above equation and assuming 150 dredging days in the season and typical flows less than 5,000 cfs yield allowable daily numerical net load criteria of 1,500 g/day Tri+ PCB and 750 g/day Tri+ PCB for Year 1 at the Thompson Island monitoring station and Waterford monitoring station, respectively. Adjustment to the numerical net daily load criteria will be made during the dredging season as data becomes available on the actual PCB mass removed during the season.
4-7
The Louis Berger Group, Inc. Revised EPS for Phase 2 Hudson River PCBs Site December 2010
For Year 1 of Phase 2, the actual cumulative net load and associated daily net load criteria will be calculated when the target Tri+ PCB mass to be removed during the dredging season becomes available. The methodology for calculating the Tri+ PCB mass to be removed is described in Section 7. For comparison with the cumulative and daily net load criteria, the net resuspension loads caused by dredging and other in-river activities will be calculated as described in Section 4.3. For subsequent years of Phase 2, the far- field numerical net load criteria will be adjusted after each year of Phase 2 in accordance with the Adaptive Management Process, and as informed by a peer reviewed updated model for the Upper Hudson River (if available) and the sampling data collected. The numeric daily net load criteria for the remaining years of Phase 2 will be calculated as outlined above, using data gathered during the previous year and an estimate of Tri+ PCB mass to be removed in the upcoming year, a specified percentage of that mass, and number of dredging days in the season.
As an alternative to the above simple proration method, GE may estimate the net daily load using the daily mass targeted each day as simulated by its logistics model. This will result in a variable net daily load standard that will be dependent on how GE plans to perform the dredging.
Near-Field TSS Concentration Action Levels
The criteria for the two action levels (Evaluation Level and Control Level) from Phase 1 have been combined into a single Advisory Level for TSS concentration. Real-time turbidity monitoring as a TSS surrogate, however, will no longer be required. The TSS Advisory Level for the near-field is as follows:
Advisory Level for the Near-Field
The Near-Field Advisory Level is a net increase in TSS concentration of 100 mg/L above ambient (upstream) conditions at the 300 m near-field monitoring station downstream of the dredging operation.
4.2.3 Monitoring Plan
The Phase 2 dredging water column monitoring program will be performed to assess achievement of the Resuspension Standard criteria presented in Section 4.2. The monitoring will be performed during dredging and associated operations that can potentially result in resuspension of significant amounts of sediment. These include, but are not necessarily limited to:
Dredging
Debris removal
Resuspension control equipment removal
Cap placement
Backfill placement
Installation of containment devices other than silt curtains, such as sheet piling and other structural devices requiring heavy equipment operation and disturbance of the river bottom
Boat traffic
4-8
The Louis Berger Group, Inc. Revised EPS for Phase 2 Hudson River PCBs Site December 2010
The monitoring program consists of routine monitoring conducted to evaluate compliance with the Resuspension Standard, and contingency monitoring that will be performed in the event that exceedances of the control level TPCB concentration are observed. Details of the planned routine and contingency monitoring programs are presented in the Phase 2 RAM Scope:
Near-field sampling
Far-field sampling
Off-season water column monitoring performed to provide a continuation of baseline data
A summary of the near-field, far-field and off season monitoring programs to be performed for Phase 2 is described below.
4.2.3.1 Routine Monitoring
Analytical Considerations
The Phase 2 Resuspension Standard specifies criteria for both formulations of PCBs used throughout the Reassessment RI/FS: TPCBs and Tri+ PCBs. TPCBs refers to the sum of all measurable PCB congeners in a sample, whereas Tri+ PCBs refers to the sum of PCB congeners containing three or more chlorine atoms. To date, this has been defined by GE’s modified Green Bay Method (mGBM). However, to further the understanding and address concerns identified below, a subset of the samples shall be routinely analyzed by Method 1668c to more fully and accurately quantify the PCB concentrations and loads on a congener basis, specifically 5 percent of all routine far-field monitoring samples. This is expected to yield one 1668c sample per week of dredging operation. EPA’s review of the results of mGBM for 2009 has raised a concern with quantitation for some of the co-eluting peaks representing substantive fraction of the mass. As a result, the correction factor used to modify the peak 5 mass for BZ4 plus BZ10 is being eliminated from the mGBM (please see October 13, 2010 letter to GE). The water quality requirements for non-PCB parameters such as metals, dissolved oxygen (DO), and pH are addressed in the Clean Water Act §401 Water Quality Certification that was developed by the NYSDEC and as will be outlined in the Remedial Action Monitoring Quality Assurance Project Plan to be developed for Phase 2.
Near-Field Water Column Monitoring - General
The Resuspension Standard defines the near-field monitoring area as the immediate vicinity of remedial operations, typically extending from 100 feet upstream to one mile downstream. The objective of the near-field monitoring is to evaluate whether dredging activities are causing near-field elevated releases of dissolved and particulate PCBs, as well as TSS, and to relate the fate and transport of these near-field releases to observations in the far-field. During Phase 1, high TSS concentrations were not observed, and TSS levels did not correspond to PCB levels as expected. It was originally anticipated that a relationship between TSS and turbidity could be established, and that turbidity could be used as a surrogate for PCBs. This relationship was not borne out by the Phase 1 results, thus making turbidity a less-important field parameter. The near-field monitoring program needs to be reconfigured to better study the expected relationship among PCB and TSS discerned in Phase 1 as recommended by the Peer Review Panel. During Year 1 of Phase 2, it is important to identify appropriate near-field water column sampling locations upstream and downstream of areas targeted for dredging (e.g., a near-field array-based

4-9
The Louis Berger Group, Inc. Revised EPS for Phase 2 Hudson River PCBs Site December 2010
monitoring) as part of the special studies. The TSS and PCB monitoring will be performed by vertically integrated samplers. In addition, analysis of split-phase PCB homologs (dissolved, NAPL and suspended matter) to quantify releases to the water column during dredging will be added. LISST samplers must be deployed at all near-field stations to capture grain size data and describe the different grain size distributions for natural and dredging-related resuspension. This information is critical to support the modeling effort. Based on the Phase 1 experience, the collection of turbidity data could be reduced or eliminated.
Additionally, continuous reading water quality meters will be used to collect DO, pH, temperature, and conductivity data on a continuous basis.
The Phase 2 RAM Scope details the planned sampling methodology, collection frequencies, analytical methods and monitoring contingencies.
Because the concentrations of metals were substantially lower than the water quality standards during Phase 1, sampling for metals during Phase 2 will be done at reduced scope compared to Phase 1. Further details on near-field monitoring will be refined, as necessary. Additionally, a mid-field array-based monitoring program will be included approximately half a mile downstream of dredging activities.
Far-Field Water Column Monitoring - General
The Resuspension Standard defined the far-field monitoring area as that portion of the Hudson River that is greater than one mile downstream from an active dredging operation. The purpose of far-field monitoring is to obtain the information needed to verify that PCBs exported to the Hudson River downstream of Waterford are minimized and that water column PCB concentrations do not exceed the levels specified in Section 4.2. Far-field monitoring will start two weeks before Phase 2 dredging operations are initiated in order to provide a baseline for evaluating subsequent PCB transport and water quality conditions, and continue after all dredging and associated remedial operations have terminated for the season or until water quality returns to average baseline conditions, but no later than two weeks after all dredging and associated remedial operations have ceased. Baseline PCB concentrations and loading from upstream of dredging operations will be assessed at upstream stations. Far-field monitoring stations located at Thompson Island, Schuylerville (at Lock 5), Stillwater, and Waterford will be used to monitor the water quality impact of the dredging activities (the possibility of monitoring at other locations is to be discussed). In addition, the far-field monitoring station at Waterford will be used to measure loading to the Lower Hudson River. A summary of the planned far-field sample collection requirements is presented in Table 4.2-2. Figure 4.2-1 shows the planned far-field monitoring locations. The Phase 2 RAM Scope details the planned sampling methodology, collection frequencies, analytical methods and monitoring contingencies. Further details on far-field monitoring will be refined, as necessary.
Off-Season Water Column Monitoring
As specified in the Resuspension Standard, after all dredging and associated remedial operations have terminated for the season, the far-field monitoring program is to continue until water quality returns to average baseline conditions, but no later than two weeks after all dredging and associated remedial operations have ceased. At that time, the off-season monitoring program will be initiated. As summarized in Table 4.2-3, the off-season water column sampling will be performed weekly at Rogers Island,

4-10
The Louis Berger Group, Inc. Revised EPS for Phase 2 Hudson River PCBs Site December 2010
Thompson Island, Schuylerville and Waterford (to the extent that weather and river conditions allow), monthly at Bakers Falls and at the Lower Hudson River stations at Albany and Poughkeepsie, and once every other month at the Mohawk River. If PCB loading at Thompson Island is significantly above baseline levels, weekly sampling will be added at Schuylerville. High flow monitoring shall be conducted at Thompson Island, Schuylerville and Waterford. In the event that a successful station cannot be developed at Thompson Island, a third high-flow monitoring station will be required at Stillwater.
4.2.3.2 Contingency Monitoring
The Resuspension Standard provides monitoring and engineering contingencies that may be required in the event that the control level PCB criteria are exceeded. The Phase 2 RAM Scope details the planned sampling methodology, collection frequencies, analytical methods and monitoring contingencies. Of particular note, during periods when the 500 ng/l criteria are exceeded, sample analyses shall be on a 24-hour turnaround time schedule for the Thompson Island, Lock 5, and Waterford monitoring stations.
Reverting to Lower Monitoring Levels
Any reduction in contingency monitoring requires approval from EPA before the changes are made. EPA may approve a reduction in the level of monitoring when the following occurs:
For the exceedance of the 500 ng/L control level TPCB concentration at the far-field stations, 2 consecutive days of values below 500 ng/L TPCB at all stations are required before returning to routine monitoring.
Routine monitoring will resume in the Lower Hudson after non-routine monitoring has confirmed that the concentrations in the Lower Hudson are below 500 ng/L TPCBs and the estimated concentration at Waterford and Troy have fallen below 500 ng/L TPCBs for at least two consecutive days.
During any temporary halting of in-river remedial operations, routine monitoring of the Upper River far-field stations will continue. If the operations are temporarily halted, monitoring in the Lower Hudson will continue at non-routine frequency until the requirements listed above are met.
4.3 Estimating Baseline Loads and Loads due to Dredging
To estimate the net loads due to dredging, the gross measurements of load must subtract the baseline to determine impacts of dredging. Baseline concentrations and baseline load shall be based on the 2004-2008 BMP data. Statistical analysis conducted as part of EPA’s Phase 1 evaluation indicates that both parameters used to calculate load, i.e., concentration and flows, vary on a monthly basis. In the case of flows, annual differences are also significant.
Since flows are measured continuously and are available real-time from the USGS during remediation, the question then becomes one of establishing the appropriate baseline concentration of TPCB and Tri+ PCB to be used for load calculation. Because the regression relationships obtained using both flows and months are significant but weak, the following method which takes both the monthly variability and the

4-11
The Louis Berger Group, Inc. Revised EPS for Phase 2 Hudson River PCBs Site December 2010
weak correlation with flow into consideration shall be used to determine baseline mean and UCL concentrations for evaluating dredging impact during Phase 2:
The TPCB and Tri+ PCB during the BMP period from 2004 to 2008 (only May to November considered each year) shall be divided into months.
To account for the possible weak but statistically significant correlation between PCB concentrations and flow, the data shall be stratified into three flow categories: These flow categories include: flows less than 5,000 cubic feet per second (cfs) at Fort Edward, flows between 5,000 cfs and 10,000 cfs at Fort Edward, and flows > 10,000 cfs at Ft Edward. The 5,000 cfs and 10,000 cfs boundaries are logical break points suggested by the data.
The baseline mean and UCL concentrations shall be calculated for each month and flow bin and directly applied on a daily basis during dredging.
The formula to calculate load due to dredging is then:
7-day Average Net Load of Tri+ PCBs at the Far-field Station
0.02832 3600 24 110
1000
F7 = Seven-day average load of Tri+ PCBs at the far-field station due to dredging –related activities in g/day
= Flow-weighted average concentration of Tri+ PCBs at the far-field station as measured during the prior seven-day routine 24-hour composite sampling in ng/L.
This is given as:
Where:
Cffs = The Tri+ PCB concentration at the far-field station for day j. if more than one sample is collected in a day due to exceedance of the near-field or far-field criteria, the arithmetic average of all the measurements will be used.
Qj = The daily average flow at the far-field station for day j.
= Estimated 95 percent upper confidence limit (UCL) of the arithmetic mean baseline concentration of Tri+ PCBs at the far-field station for the month in which the sample was collected, in ng/L.
Q7 = Seven-day average flow at the far-field station, determined either by direct measurement or estimated from USGS gauging stations, in cfs.

4-12
The Louis Berger Group, Inc. Revised EPS for Phase 2 Hudson River PCBs Site December 2010
Far-field Net Tri+ PCB Seasonal (Cumulative) Load
One of the far-field standards is the Seasonal (cumulative) net Tri+ PCB load. This load will be calculated on a daily basis. The formula to calculate the net Tri+ PCB load at any time during the season is:
0.02832 3600 24 110
1000
Where:
Ftodate = load loss of Tri+ PCBs at the far-field station for the dredging period to date due to dredging-related activities in g/day.
= flow-weighted average concentration of Tri+ PCBs at the far-field station as measured from the start of the dredging period to date in ng/L. For one 24-hour composite sample per day, this is given as:
Where:
Cffstj = Tri+ PCB concentration at the far-field station for day j. if more than one sample is collected in a day, the arithmetic average of all the measurements will be used.
Qj = daily average flow at the far-field station for day j.
n = number of days from the start of dredging period
= Estimated arithmetic mean baseline concentration of Tri+ PCBs at the far-field station for the period in which the sample was collected, in ng/L. This value is determined from baseline monitoring data. Time-weighted averages are calculated as the sum of the arithmetic average of each day dividing by the number of days
Qtodate = average flow at the far-field station, determined either by direct measurement or estimated from USGS gauging station, in cfs.
4.4 Reporting and Notifications
Weekly progress reports shall be submitted to EPA, at the weekly EPA/GE coordination meeting, as described in the Phase 2 Performance Standards Compliance Plan to be prepared by GE, for the Agency’s use in determining compliance with the Resuspension Standard. The reports must summarize the results of far-field and near-field monitoring, exceedances of the Resuspension Standard criteria, and any corrective actions implemented. The description and results of engineering studies shall be provided to

4-13
The Louis Berger Group, Inc. Revised EPS for Phase 2 Hudson River PCBs Site December 2010
EPA separately within a week of completion. Upon request, laboratory data shall be made available to EPA upon receipt from the laboratory in a useable database format, subject to EPA approval. Data from continuous reading instruments must be made available to an EPA field representative and submitted to EPA within 24 hours of collection.
4.5 Special Studies
In addition to sampling that will be performed to assess compliance with the Resuspension Standard, other sampling will be needed to refine implementation of the standard, as necessary. This second category of sampling efforts is designated as “Special Studies” and is intended to be conducted for limited time periods to gather information for addressing specific conditions or issues that may be encountered during dredging. The Special Studies for Phase 2 are summarized in Table 2.4-1, and for Resuspension, include the following:
Diagnostic studies of automated monitoring stations to assess reproducibility of data collected from these devices and locations.
Identify the processes responsible for near-field releases of PCBs and examine the fate of PCBs in the near-field to provide better understand the origins of far-field observations and so that improvements may be made to in-river activities.
Establish the PCB levels and properties of the NAPL phase and determine whether the observed oil sheens indicate that PCB NAPLs are a significant contributor to the river PCB contamination.
Estimate PCB losses from water column at Thompson Island and Schuylerville dam locations and determine if volatilization of PCBs or NAPLs, especially at dam locations, potentially explain observed PCB losses in the downstream direction that exceed losses which might be attributed to conventional gas exchange.
Estimate PCB losses from water column over flat water and determine dissolved and suspended matter PCB fractions to assess the fractions losing mass. Evaluate whether settling of particulates is primarily responsible for observed decreases in PCBs downstream of Thompson Island, or if particle-associated PCBs are relatively insignificant compared to volatilization.
Determine PCB concentrations on suspended matter and dissolved phase concentrations above and below reaches where tributaries enter the river, and hence establish whether resuspension and additional solids input from tributaries downstream of the dredging scavenge dissolved PCBs and settle to the sediment bed.
Identify DQOs to examine the regression variables and evaluate the processes or mechanisms that control the kinetics of PCB release to the dissolved phase, and quantify PCB flux due to oil sheen for Near-field and Far-field locations.
Evaluate operational controls during Phase 2 dredging to determine effectiveness for reducing PCB releases during dredging.

5-1
The Louis Berger Group, Inc. Revised EPS for Phase 2 Hudson River PCBs Site December 2010
5. Productivity Performance Standard
5.1 Overview of Phase 2 Productivity Standard
The Productivity Standard establishes seasonal production targets for the dredging project and provides guidelines for monitoring the project’s progress to ensure that it is completed in a timely fashion. Maintaining an appropriate dredging production rate is one factor that will limit the duration of construction-related impacts.
The original Productivity Standard, published by the EPA in April, 2004, established a schedule six years in duration in accordance with the ROD. The initial year of this schedule, designated Phase 1, consisted of dredging initially at a reduced scale with extensive monitoring to evaluate compliance with the Engineering Performance Standards. Phase 1 dredging was completed in 2009. The remaining dredging seasons of the project, designated as Phase 2, are characterized by dredging at full production to remove the remainder of the contaminated sediments targeted for removal.
The original Engineering Performance Standards did not establish a hierarchy for compliance with of the Resuspension, Residuals, and Productivity Standards, but gave equal weight to each Standard. The Productivity Standard defined the volume of contaminated sediment required to be dredged each season and a slightly higher “target” volume established to promote completion of dredging in a shorter timeframe. Thus, under the original Productivity Standard, the dredging contractor was required to achieve a designated rate of productivity while, at the same time, attempting to meet the Residuals Standard and minimize resuspension of PCBs as required by the Resuspension Standard. The resulting tension between the three Standards proved difficult to manage during Phase 1. The application of best management practices aimed at reducing resuspension invariably caused some reduction in productivity, and the difficulties experienced in meeting the Residuals Standard reduced dredging productivity significantly.
During Phase 2, and as recommended by the Peer Review Panel, the Productivity Standard will be subordinate to the Resuspension and Residuals Standards. While EPA believes the project should be completed as quickly as is practicable, that should not come at the expense of conformance with the Resuspension Standard or Residuals Standard. In addition, because the full amount of material to be removed is currently unknown, the annual “required” dredging volumes have been eliminated and only target volumes are specified. The Peer Review Panel also recommended development of an annual metric for area dredged, which could be expressed as a number of CUs to close each year.
The Phase 2 Productivity Standard also de-emphasizes the six-year schedule, establishing a planning-level estimate of Phase 2 duration that balances the total removal volume with consequences of prolonged construction activities on the river rather than a rigid timeframe for completion. Finally, the corrective actions required in the event that the contractor fails to dredge the required sediment volume in any given year, specified in the original Productivity Standard, have been eliminated under the expectation that all parties have an interest in completing the project as expeditiously as possible. Given that all parties have an interest in completion of the project as expeditiously as possible, a review of productivity will be

5-2
The Louis Berger Group, Inc. Revised EPS for Phase 2 Hudson River PCBs Site December 2010
conducted at the completion of each season. This review will be conducted jointly by EPA field office staff, the GE project team and the contractors before the end of the calendar year, to identify potential revisions to both the processing facility operations and river operations that will increase overall efficiency and productivity and ultimately reduce the overall project duration, if possible.
The term “dredging,” as used in the Productivity Standard, includes removal of the contaminated sediment, dewatering and disposing of the dredged sediments, backfilling or capping dredged areas as appropriate, and stabilization of shoreline areas disturbed by the work. The volume of dredged sediment to be credited toward meeting each year’s target dredging volume is equal to the in-place volume removed as confirmed by bathymetric surveys, and includes all remedial and access dredging required to complete the work, including side slopes. This is a change from the original Productivity Standard, which divided remedial dredging into two categories: inventory and residual, and did not include sediment volumes removed during residuals dredging or those removed below the design cut line, referred to as missed inventory, in the volume counted toward meeting each year’s required production.
During design of Phase 1, it was noted that planting of submerged aquatic vegetation shall be done in the spring season rather than in the fall. Accordingly, EPA and GE agreed that this work would be done in the spring following each year’s dredging work. This change is carried through to the Phase 2 Productivity Standard. Therefore, the planting of submerged aquatic vegetation will take place in the spring following the year of dredging in any given area.
5.2 Basis for Changes to the Productivity Standard
5.2.1 Technical Background and Approach
The Phase 1 dredging work demonstrated that the depth of contamination had not been well-defined by the sampling performed to date and, as a result, no reliable engineering estimate of the volume of contaminated sediment remaining to be dredged is available. Current estimates of the remaining volume to be dredged range from about 2.3 to 3.0 million CY, but are not considered sufficiently reliable to establish an estimate for the length of Phase 2. Additional sediment sampling will be needed to improve the present estimate, particularly in areas where the currently available core sample results are not considered reliable, and it is likely that the estimate will change on a yearly basis as the work progresses.
In addition to a lack of a firm, engineering estimate of the volume of sediment to be dredged during Phase 2, Phase 1 did not meet a minimum sustained production rate high enough to demonstrate that an estimated total volume of approximately 2.6 million CY of sediment could be dredged in the five years as anticipated for Phase 2 when the original Productivity Standard was developed. During the peer review process, EPA provided analyses indicating that with improved scow availability during Phase 2, the annual productivity could meet the original productivity target of 96,000 CY per month (528,100 CY/year). The Peer Review Panel, however, stated that a more realistic annual target is 350,000 cubic yards. EPA accepts the Panel’s recommendation and is adopting 350,000 CY/year as a target, but the Agency remains cautiously optimistic that during Phase 2, it will be possible to dredge a larger amount of cubic yards each year. Finally, as noted above, the requirement to meet Resuspension, Residuals, and Productivity Standards simultaneously proved very difficult to manage during Phase 1. The Peer Review Panel summarized its recommendation regarding this issue on page v of the executive summary and again
5-3
The Louis Berger Group, Inc. Revised EPS for Phase 2 Hudson River PCBs Site December 2010
on page 78 of its report (Bridges, et al., 2010): “… the productivity schedule should be subordinated to the Resuspension EPS and Residuals EPS. Consequently the 5 year productivity criterion should be dropped to provide more flexibility to complete the work in a manner that protects the integrity of the project and its risk reduction objectives.” EPA has decided that as the Peer Review Panel has said, it is more important to the success of the project that the Resuspension and Residuals Standards are met than that the work be completed on a fixed schedule. As recommended by the Peer Review Panel, an area-based metric that can be used to assess productivity will also be evaluated as Phase 2 goes forward. An initial area-based metric for Year 1 of Phase 2 will be the area of the planned CUs to be dredged (when determined).
5.2.2 Supporting Analysis
During Phase 1, approximately 273,600 CY of sediment was dredged. The base target dredging volume for the first year of Phase 2 has been set at 350,000 CY. This value is based on the recommendation of the Peer Review Panel and reflects the Phase 1 experience. The following considerations also influenced determination of the baseline target volume:
The dredging should be planned for approximately 150 days for dredging and backfilling. Dredging may begin on or about May 15 each year and continue for 5 months until approximately October 1, depending on conditions, allowing 30 days to complete backfilling and capping, followed by 15 days to demobilize heavy equipment before the canal closes on or about November 15.
Improved estimates of the depth of contamination and the more efficient dredging approach described in the Phase 2 Residuals Standard (relative to the Phase 1 standard) should eliminate or minimize excessive time spent chasing missed inventory and residual material.
The scow unloading operation shall be improved to keep up with dredge production; scows shall be managed to minimize dredging delays due to a lack of an empty scow.
As indicated above, the Peer Review Panel findings were used to establish a target dredging volume of 350,000 CY per year for Phase 2. To arrive at this number, the Peer Review Panel applied the peak monthly outputs observed during Phase 1, 75,566 and 77,284 CY to the 5-month season and calculated an annual output range of 370,000 to 385,000 CY. The Panel stated that achieving Phase 1 peak removal output during every month of Phase 2 was not necessarily reasonable, and therefore recommended an annual target of 350,000 CY, a value corresponding to 90 percent of the monthly peak rate. This removal volume is a baseline target. Best management practices will be applied throughout the life of the project to improve this productivity rate. EPA is cautiously optimistic that the annual productivity could meet the original productivity target for of 96,000 CY per month (528,100 CY/year).
Although the Peer Review Panel recommended three different targets for productivity (dredging, processing, and shipping), EPA believes it would be more appropriate to have a single seasonal volume target. The target for Phase 2 productivity is therefore set at 350,000 CY.

5-4
The Louis Berger Group, Inc. Revised EPS for Phase 2 Hudson River PCBs Site December 2010
Dredging of inventory will be permitted in up to three continuous CUs as approved in Phase 1. Initial backfill will be placed in an upstream to downstream manner as grade is met. To increase productivity, dredging may be performed simultaneously in multiple areas of the river. These areas will be separated to minimize the potential for redeposition as upstream areas are completed above areas already dredged. This separation will be based on the ability to isolate work areas such as the landlocked area, West Griffin Island area, areas that are separated by a dam, and areas that are separated by more than 1,000 feet
5.3 Implementation of the Phase 2 Productivity Standard
While additional sampling of Phase 2 areas will be performed to better define the depth of contamination, implementation of the Phase 2 Productivity Standard shall require monitoring of dredge production with particular emphasis on identifying and recording any significant amounts of additional contaminated sediment found as each CU is dredged and closed. The experience gained during Phase 1, where approximately 1.8 times more contaminated sediment was found and dredged than shown on the design drawings, indicates that estimates of the depth of contamination were inaccurate. The current estimate of the quantities to be dredged in Phase 2 is not considered a rigorous engineering estimate and changes in the estimated volume can be expected.
In order to maintain a running record of the amount of sediment dredged, including sediment excavated for access purposes, the Phase 2 Productivity Standard calls for monthly and annual productivity progress reports to be submitted to the EPA. These reports shall document progress in meeting the target dredging areas and volumes listed in the Productivity Standard. Monthly productivity progress reports shall include daily reports of operations that will address the same information required by a USACE Daily Report of Operations for the appropriate dredge type. Monthly progress reports will be the primary means of keeping track of the volume of contaminated sediment dredged from each CU and will be used to compare the actual volume of sediment removed to the volume shown in the design. The estimate of the volume of contaminated sediment remaining to be dredged during the year may be adjusted, based on this comparison, and may increase or decrease as indicated by the data.
The Phase 2 Productivity Standard also requires that an annual summary report on the total volume dredged during the year, with a comparison of that volume to the volume anticipated in the design, be submitted to EPA at the end of each dredging season. This report must be submitted no later than two weeks after the end of dredging (backfilling and capping may still be in process) and will help inform the joint review of productivity by the EPA, GE and the contractor, any changes to the target dredging volumes for subsequent years.
By February 15 of each year of Phase 2 dredging, as part of the RAWP submittal, GE shall provide EPA with a production schedule showing anticipated monthly sediment production and CU’s to be dredged for the upcoming dredging season
5.4 Reporting and Notification
Reporting and notification requirements for the Phase 2 Productivity Standard are listed in Section 2.2.3 and consist, primarily, of monthly productivity progress reports and an annual report showing the total volume and area dredged, capped and backfilled during the year with a comparison to the design volume
5-5
The Louis Berger Group, Inc. Revised EPS for Phase 2 Hudson River PCBs Site December 2010
for those CUs dredged. These reports are needed to keep track of the volume of sediment dredged and to identify any changes in the volumes removed from each CU as needed to adjust the estimate of the total volume to be dredged during Phase 2 and the target dredging volume for the following seasons. Corrective action reports and specific actions to be taken, required under the original Productivity Standard if the contractor failed to dredge the required sediment volume in any given year, have been eliminated from the Phase 2 Productivity Standard under the expectation that all parties have an interest in completing the project as expeditiously as possible.
5.5 Special Studies
Although no special studies are proposed relative to productivity at this time, the EPA is requiring that daily scow tracking records be made available to EPA so that the impacts of scow unavailability can be evaluated. To achieve this, the status of each scow must be reported on a daily basis including at a minimum: at CU being loaded, in transit to unloading, at mooring awaiting space at the unloading dock, at the unloading dock awaiting unloading, being unloaded, at mooring awaiting transit to loading, in transit to loading.
6-1
The Louis Berger Group, Inc. Revised EPS for Phase 2 Hudson River PCBs Site December 2010
6. Water Quality Requirements for In-River Releases of Constituents Not Subject to Performance Standards
6.1 Substantive Water Quality Requirements
The EPA, in conjunction with the NYSDEC and the NYSDOH, has defined water quality standards in the near-field for a number of constituents, for example metals, that are not governed by the EPS and will be monitored for compliance during Phase 2. The experience from Phase 1 indicates that dredging operations did not significantly increase these constituents and for this reason, the program has been reduced (including removing the requirement to monitor the far-field stations and reducing the frequency of monitoring to weekly at the near-field station). However, if there are indications of impacts from the dredging operations, such as fish kills or increases in indicator constituent concentrations, EPA may, at its discretion, require more robust monitoring as was required during Phase 1. The objectives of these water quality requirements are:
Protection of aquatic species via Aquatic Acute Standards
Protection of drinking water supplies via health (water source) standards, if warranted by project circumstances.
Protection of drinking water supplies via NYSDOH standards and an action level, if warranted by project circumstances.
These are known as the Substantive Water Quality (WQ) Requirements, and consist of the following:
1) Requirements relating to in-river releases of constituents not subject to EPS, as set forth in Substantive Requirements Applicable to Releases of Constituents not Subject to Performance Standards;
2) The substantive requirements for discharges to the Hudson River and Champlain Canal, as set forth in Substantive Requirements of State Pollutant Discharge Elimination System Permit for Potential Discharges to Champlain Canal (land cut above Lock 7);
3) Substantive Requirements of State Pollutant Discharge Elimination System Permit for Potential Discharges to the Hudson River.
These three sets of requirements are contained in a letter document issued by EPA in January 2005, with slight modifications documented in Attachment A to CD Modification No. 1. Monitoring requirements are outlined in the Phase 2 RAM Scope.
6.1.1 Aquatic Acute Water Quality and Health (Water Source) Standards
6.1.1.1 Aquatic Acute Water Quality Standards at Near-Field Stations
Aquatic acute standards will be used to evaluate samples collected in the near-field. Some constituents of the aquatic acute standards are hardness-dependent; as hardness varies along the length of the project area, a range of standards will be calculated for those constituents. For example: based on the limited

6-2
The Louis Berger Group, Inc. Revised EPS for Phase 2 Hudson River PCBs Site December 2010
available data, average hardness values from Corinth and Waterford range from 18 to 55 ppm, respectively.
The ranges of water quality standards are as follows (where applicable, the formulas for calculating the standards are in brackets):
Cadmium: Aquatic Acute A(A): 0.6 μg/L to 2.0 μg/L [(0.85) exp(1.128 [ln (ppm hardness)] – 3.6867)]
Lead: Aquatic Acute A(A): 14.4 μg/L to 50.4 μg/L [{1.46203 – [ln (hardness) (0.145712)]} exp (1.273 [ln (hardness)] – 1.052)]
Chromium: Aquatic Acute A(A): 140 μg/L to 349 μg/L [(0.316) exp (0.819 ln (ppm hardness)) +3.7256)]
Chromium (hexavalent): Aquatic Acute A(A): 16 μg/L
Mercury: Aquatic Acute A(A): 1.4 μg/L.
Water quality standards for pH and DO are specified in NYCRR Title 6, Chapter X, Part 703.3
o pH will not be less than 6.5 nor more than 8.5 o DO for non-trout waters:
The minimum daily average will not be less than 5.0 mg/L At no time shall the DO concentration be less than 4.0 mg/L.
6.1.1.2 Health (Water Source) Standards at Far-Field Stations
The requirement for routine monitoring for compliance with Health (water source) standards has been removed based on the results of Phase 1 monitoring. However, if near-field monitoring or other factors, such as fish kills, indicate a need to return to monitoring, the following standards will apply. Health (water source) standards will be used to evaluate samples collected in the far-field. These standards are not hardness-dependent, and are applicable to the total phase of each constituent. The following standards shall not be exceeded at the Thompson Island, Schuylerville, or Waterford far-field stations:
Cadmium (Total): 5.0 μg/L
Chromium (Total): 50 μg/L
Mercury (Total): 0.7 μg/L
Lead (Total): 15.0 μg/L (NYSDOH action level)
A confirmed occurrence of a constituent above the standards and NYSDOH action level is required to determine an exceedence of the criteria. A confirmed occurrence is defined as a single, 24-hour composite sample collected in triplicate on the subsequent day exceeding the standard/action level. This represents a revision to the original Attachment A to CD Modification No. 1, and is subject to revisions after consultation with the State.
6.1.1.3 Implementation of the Substantive WQ Requirements, Near- and Far-Field
Routine monitoring for compliance with both the aquatic acute standards and the health (water source) standards will be limited to analyses for dissolved and total cadmium and lead collected on a weekly basis. Evaluation of the metals data from the BMP and Treatability Studies programs by GE
6-3
The Louis Berger Group, Inc. Revised EPS for Phase 2 Hudson River PCBs Site December 2010
indicate that the lead and cadmium standards would be exceeded before the mercury and chromium standards. If monitoring indicates that cadmium and/or lead concentrations exceed the above standards, near-field total and dissolved and far-field total samples for the entire suite of metals subject to the Aquatic Acute Standards will be collected and analyzed. These analyses will include:
All Target Analyte List (TAL) metals provided by EPA Method 200.8;
Mercury by EPA Method 1631; and
Hexavalent chromium by SW-846 Method 7196A.
The additional analyses will continue in the near-field until compliance with the aquatic acute standards is achieved. In the far-field, additional analyses will continue until compliance with the health (water source) standards is achieved and EPA has authorized a return to routine monitoring.
6.1.1.4 Additional Monitoring Based on Fish Observations
If distressed or dying fish are observed during in-water activities, EPA and NYSDEC shall be notified immediately. If the cause of the effects on fish is determined to be project-related, increased monitoring for metals and additional water quality parameters will be conducted. Details of this increased monitoring are provided in the Substantive WQ Requirements document issued by the EPA in January 2005, with slight modifications documented in Attachment A to CD Modification No. 1.
6.1.2 Discharges to Surface Water
The Substantive WQ requirements also define criteria for treated water discharged to the Champlain Canal Land Cut above Lock 7 via Outfall 001, and a letter issued by EPA to GE on September 14, 2006 presents requirements for non-contact (Type II) stormwater discharges to Bond Creek through Outfalls 002 and 003.
6.1.2.1 Treated Discharges to Champlain Canal
The water treatment system constructed for the RA will treat water originating from the sediment dewatering operations as well as Type I stormwater. Water from these sources will be discharged into the Champlain Canal through Outfall 001. The criteria for these are defined in the Substantive WQ Requirements are as follows:
Measure discharge flow continuously with a flow meter.
Monitor pH in the discharge on a monthly basis via grab sampling.
Analyze the following parameters via weekly grab samples: o TSS (Standard Method 2540D) o TOC (Standard Method 5310B) o Total Cadmium (EPA Method 200.8) o Total Chromium (EPA Method 200.8) o Total Copper (EPA Method 200.8) o Total Lead (EPA Method 200.8) o Total Mercury (EPA Method 1631) o DO (probe)

6-4
The Louis Berger Group, Inc. Revised EPS for Phase 2 Hudson River PCBs Site December 2010
Analyze PCBs as a 24-hour runtime composite sample (EPA Method 60; all reasonable attempts shall be made to achieve a Minimum Detection Level of 0.065 μg/L for each Aroclor.
6.1.2.2 Non‐Contact Stormwater (Type II) Discharges to Bond Creek
Type II discharges are defined as non-contact stormwater not directly in contact with PCB-related processes resulting from the overflow of the two sedimentation basins at the sediment processing facility. When these basins overflow, they discharge from Outfalls 002 and 003 into Bond Creek. Based on the letter issued by EPA on September 14, 2006, the following monitoring is required under basin overflow conditions:
Estimate discharge flow daily
Measure total settleable solids daily via Method 2540F in the Standard Methods for the Examination of Water and Wastewater
Monitor pH monthly in a grab sample
Monthly monitoring of: o pH (probe) o Oil and Grease (EPA Method 1664) o PCB Aroclors (EPA Method 608); all reasonable attempts shall be made to achieve a
Minimum Detection Level of 0.065 μg/L for each Aroclor.
Monitoring once every two months of: o Total Cadmium (EPA Method 200.8) o Total Chromium (EPA Method 200.8) o Total Copper (EPA Method 200.8)

7-1
The Louis Berger Group, Inc. Revised EPS for Phase 2 Hudson River PCBs Site December 2010
7. Estimation of PCB Mass in Phase 2 Remediation Areas
The objective of this section is to describe a procedure to estimate the mass of PCB in contaminated sediment (i.e., the PCB inventory of the sediment). This section includes methods for quantifying the mass of PCB inventory removed by dredging and for quantifying unexpected inventory left behind after dredging. These methods include procedures for both estimation of the inventory itself (point estimate) as well as for quantifying the uncertainty in the estimate (confidence limits). The calculation of mass estimates of PCBs in sediments for use in the EPS shall follow the statistically-based procedures given below. These procedures provide unbiased estimators of the inventory given the nature and spatial distribution of the sampling program. These procedures also provide rigorous estimates of the uncertainty in these estimates for consideration in the various calculations required by the EPS.
The methods presented here are tailored specifically to the nature of data available and the sampling design used to select sample locations. The proposed procedures derive their validity from the sample selection methods providing a basis for what is termed design-based estimation (Cochran 1977).
The population parameter of interest is PCB mass defined by
where terms in the equation must be estimated using sample data because they are incompletely known. The estimation procedure may vary depending on the information supporting each term and at what level the variables are measured, such as at the core-section, core, or full CU basis. For example, at the Hudson River, PCB concentration is known at each core section, but bulk density was only measured on a per-core basis. Methods also vary depending on the level of certainty with which the volume of sediment removed is known. Analysis methods, particularly for quantification of uncertainty, must carefully incorporate the sampling design and randomization procedures used to select locations and subsamples.
7.1 Guiding Principles
1) Procedures described below will provide estimates of the total mass of PCB inventory removed and remaining after dredging on a per CU basis.
2) The methods will include statistical uncertainty bounds (i.e. confidence limits) for estimated mass per each CU for inventory removed as well as inventory remaining after dredging.
3) Estimation methods will be unbiased and based on statistical procedures from the published literature, providing comparable estimates of inventory removed and left behind for each CU.
4) Methods for estimation of uncertainty will treat each core location as the primary experimental unit, and each core section will be treated as a subsample within the primary unit.
a. The number of degrees of freedom for variance estimation is determined by the number of core locations, not subsamples (i.e. individual core sections);
b. Subsamples do not contribute to the degrees of freedom for variance estimation. 5) Methods requiring use of imputed PCB concentrations or bulk densities are discouraged because:
a. Such methods are not expected to improve accuracy or precision of estimation;
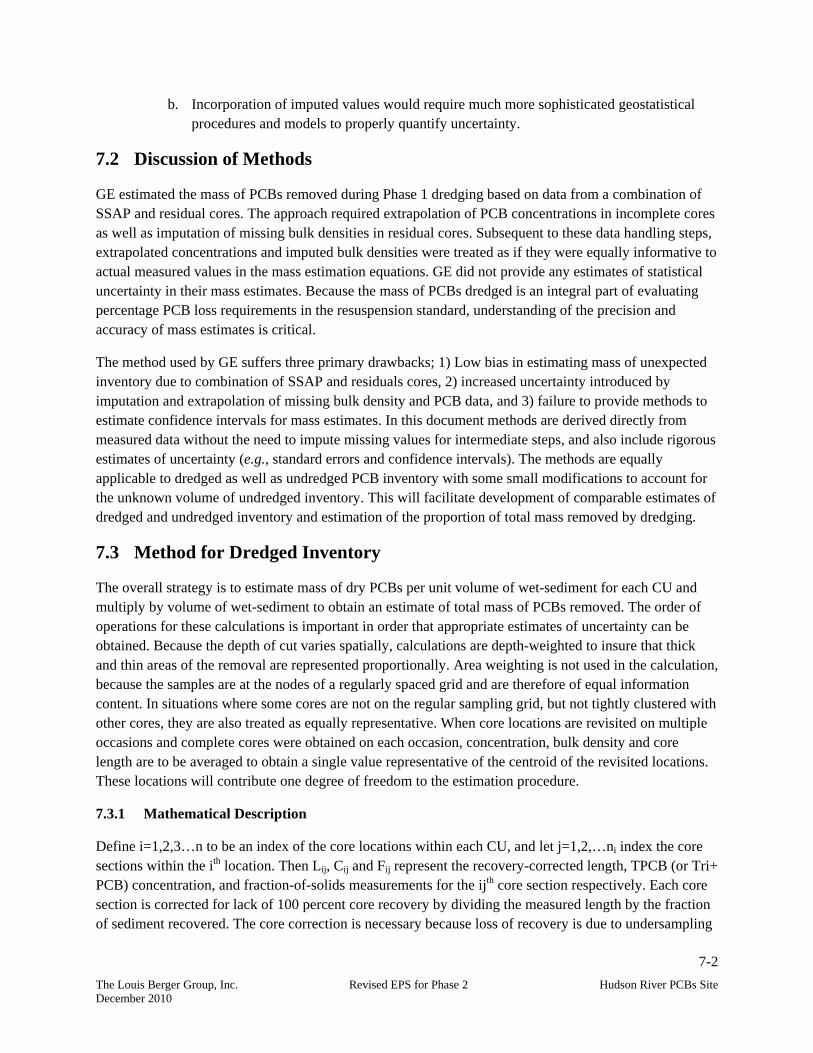
7-2
The Louis Berger Group, Inc. Revised EPS for Phase 2 Hudson River PCBs Site December 2010
b. Incorporation of imputed values would require much more sophisticated geostatistical procedures and models to properly quantify uncertainty.
7.2 Discussion of Methods
GE estimated the mass of PCBs removed during Phase 1 dredging based on data from a combination of SSAP and residual cores. The approach required extrapolation of PCB concentrations in incomplete cores as well as imputation of missing bulk densities in residual cores. Subsequent to these data handling steps, extrapolated concentrations and imputed bulk densities were treated as if they were equally informative to actual measured values in the mass estimation equations. GE did not provide any estimates of statistical uncertainty in their mass estimates. Because the mass of PCBs dredged is an integral part of evaluating percentage PCB loss requirements in the resuspension standard, understanding of the precision and accuracy of mass estimates is critical.
The method used by GE suffers three primary drawbacks; 1) Low bias in estimating mass of unexpected inventory due to combination of SSAP and residuals cores, 2) increased uncertainty introduced by imputation and extrapolation of missing bulk density and PCB data, and 3) failure to provide methods to estimate confidence intervals for mass estimates. In this document methods are derived directly from measured data without the need to impute missing values for intermediate steps, and also include rigorous estimates of uncertainty (e.g., standard errors and confidence intervals). The methods are equally applicable to dredged as well as undredged PCB inventory with some small modifications to account for the unknown volume of undredged inventory. This will facilitate development of comparable estimates of dredged and undredged inventory and estimation of the proportion of total mass removed by dredging.
7.3 Method for Dredged Inventory
The overall strategy is to estimate mass of dry PCBs per unit volume of wet-sediment for each CU and multiply by volume of wet-sediment to obtain an estimate of total mass of PCBs removed. The order of operations for these calculations is important in order that appropriate estimates of uncertainty can be obtained. Because the depth of cut varies spatially, calculations are depth-weighted to insure that thick and thin areas of the removal are represented proportionally. Area weighting is not used in the calculation, because the samples are at the nodes of a regularly spaced grid and are therefore of equal information content. In situations where some cores are not on the regular sampling grid, but not tightly clustered with other cores, they are also treated as equally representative. When core locations are revisited on multiple occasions and complete cores were obtained on each occasion, concentration, bulk density and core length are to be averaged to obtain a single value representative of the centroid of the revisited locations. These locations will contribute one degree of freedom to the estimation procedure.
7.3.1 Mathematical Description
Define i=1,2,3…n to be an index of the core locations within each CU, and let j=1,2,…ni index the core sections within the ith location. Then Lij, Cij and Fij represent the recovery-corrected length, TPCB (or Tri+ PCB) concentration, and fraction-of-solids measurements for the ijth core section respectively. Each core section is corrected for lack of 100 percent core recovery by dividing the measured length by the fraction of sediment recovered. The core correction is necessary because loss of recovery is due to undersampling
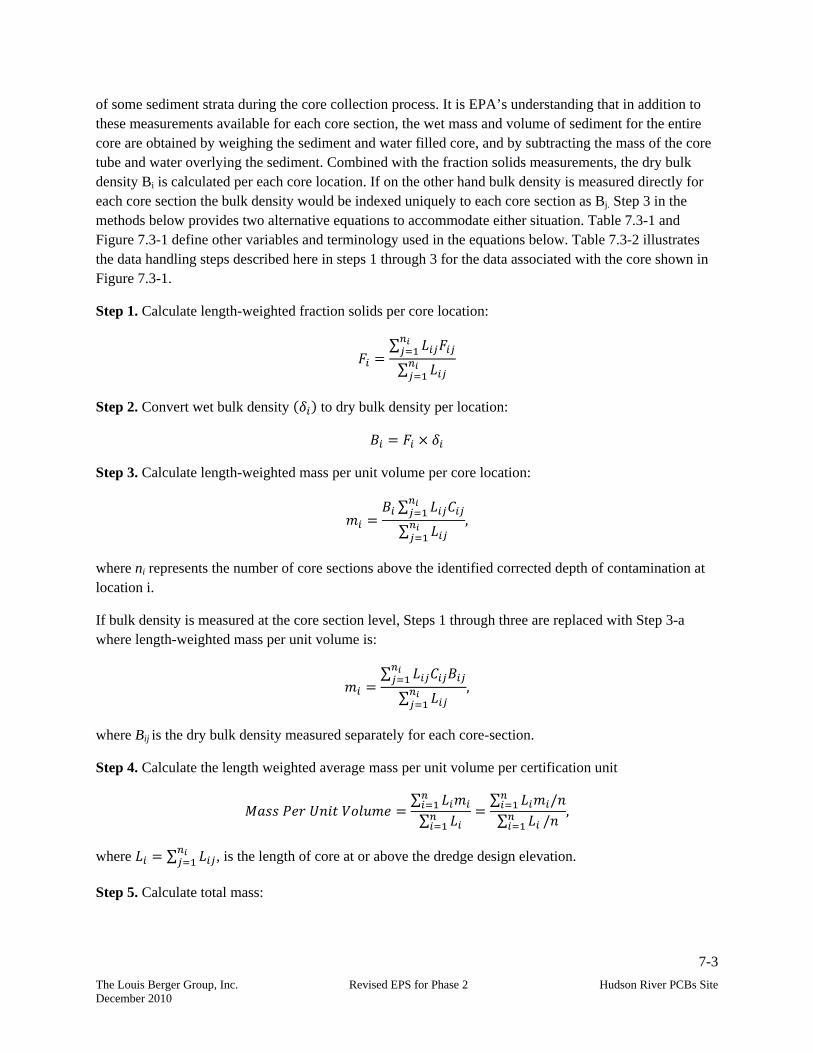
7-3
The Louis Berger Group, Inc. Revised EPS for Phase 2 Hudson River PCBs Site December 2010
of some sediment strata during the core collection process. It is EPA’s understanding that in addition to these measurements available for each core section, the wet mass and volume of sediment for the entire core are obtained by weighing the sediment and water filled core, and by subtracting the mass of the core tube and water overlying the sediment. Combined with the fraction solids measurements, the dry bulk density Bi is calculated per each core location. If on the other hand bulk density is measured directly for each core section the bulk density would be indexed uniquely to each core section as Bj. Step 3 in the methods below provides two alternative equations to accommodate either situation. Table 7.3-1 and Figure 7.3-1 define other variables and terminology used in the equations below. Table 7.3-2 illustrates the data handling steps described here in steps 1 through 3 for the data associated with the core shown in Figure 7.3-1.
Step 1. Calculate length-weighted fraction solids per core location:
∑
∑
Step 2. Convert wet bulk density to dry bulk density per location:
Step 3. Calculate length-weighted mass per unit volume per core location:
∑
∑,
where ni represents the number of core sections above the identified corrected depth of contamination at location i.
If bulk density is measured at the core section level, Steps 1 through three are replaced with Step 3-a where length-weighted mass per unit volume is:
∑
∑,
where Bij is the dry bulk density measured separately for each core-section.
Step 4. Calculate the length weighted average mass per unit volume per certification unit
∑
∑∑ /
∑ /,
where ∑ , is the length of core at or above the dredge design elevation.
Step 5. Calculate total mass:

7-4
The Louis Berger Group, Inc. Revised EPS for Phase 2 Hudson River PCBs Site December 2010
∑∑
,
where k=7.6456e-7 is a units conversion factor and V is the total wet-volume of sediment removed from the CU based on subtraction of bathymetric surveys.
7.3.2 Variance Estimation and Confidence Intervals (Known Volume Removed)
Because the numerator and denominator in the mass estimate are both functions of measurements that cannot be known prior to collection of the cores, both the numerator and denominator are random variables and therefore, the variance of the mass estimate Var(M) must be estimated using formulas for the variance of a ratio of random variables.
Defining the intermediate variable with ∑ , ∑ , and , the mass
estimate can be written as
.
Assuming that uncertainty in the volume of sediment removed is much smaller than that associated with the concentration estimates, the variance Var(M) is given by:
.
where is estimated from un-weighted sample mean, variance and covariance of the intermediate variables defined above (Casella and Berger 1990):
2,
,
where,
11
, 1
1 ,
and , is the sample covariance of the means which is equal to the sample covariance of u and L divided by n, the number of sample locations
,1
1.
Sample variance formulas are based on the assumption that core locations are statistically independent whereas it is understood that variables measured at adjacent locations may be positively correlated. Due to this tendency toward spatial correlation, these formulas could be improved by use of equations developed specifically for systematic sampling from populations that are positively spatially correlated. Wolter (1984) provides alternative formulas that could be considered for incorporation into this estimation procedure. In general, the standard variance formulas tend to overstate the true population
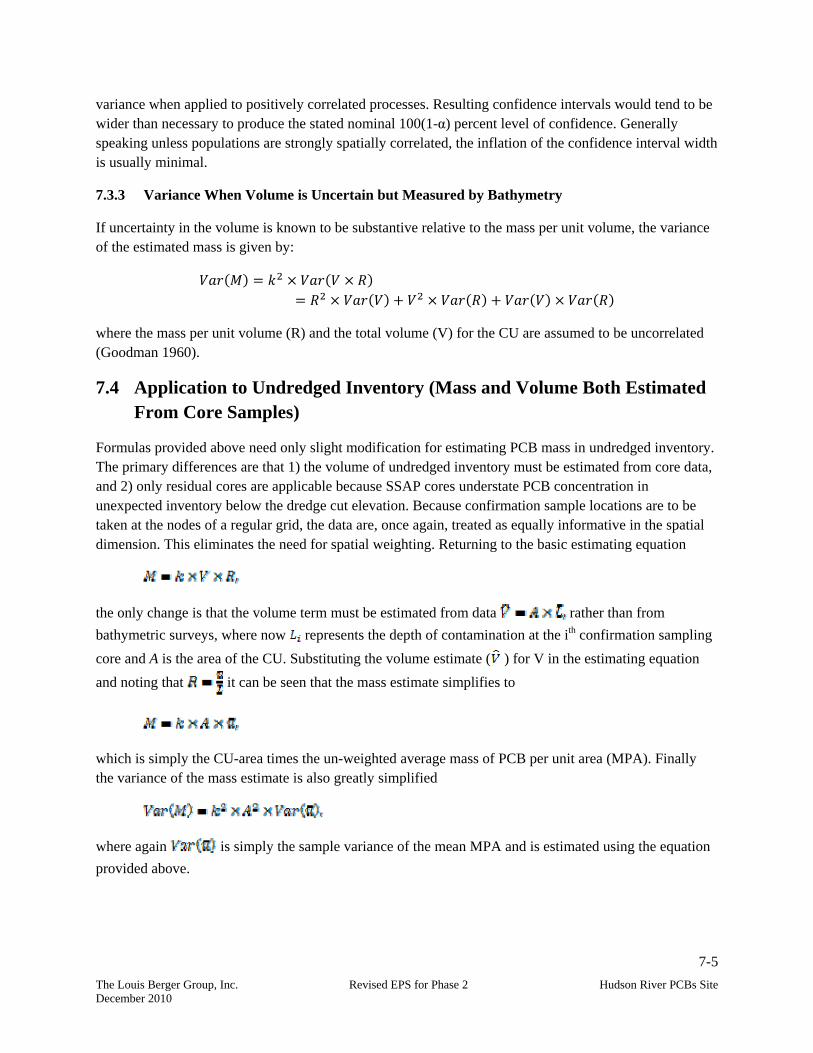
7-5
The Louis Berger Group, Inc. Revised EPS for Phase 2 Hudson River PCBs Site December 2010
variance when applied to positively correlated processes. Resulting confidence intervals would tend to be wider than necessary to produce the stated nominal 100(1-α) percent level of confidence. Generally speaking unless populations are strongly spatially correlated, the inflation of the confidence interval width is usually minimal.
7.3.3 Variance When Volume is Uncertain but Measured by Bathymetry
If uncertainty in the volume is known to be substantive relative to the mass per unit volume, the variance of the estimated mass is given by:
where the mass per unit volume (R) and the total volume (V) for the CU are assumed to be uncorrelated (Goodman 1960).
7.4 Application to Undredged Inventory (Mass and Volume Both Estimated From Core Samples)
Formulas provided above need only slight modification for estimating PCB mass in undredged inventory. The primary differences are that 1) the volume of undredged inventory must be estimated from core data, and 2) only residual cores are applicable because SSAP cores understate PCB concentration in unexpected inventory below the dredge cut elevation. Because confirmation sample locations are to be taken at the nodes of a regular grid, the data are, once again, treated as equally informative in the spatial dimension. This eliminates the need for spatial weighting. Returning to the basic estimating equation
the only change is that the volume term must be estimated from data rather than from
bathymetric surveys, where now represents the depth of contamination at the ith confirmation sampling
core and A is the area of the CU. Substituting the volume estimate ( ) for V in the estimating equation
and noting that it can be seen that the mass estimate simplifies to
which is simply the CU-area times the un-weighted average mass of PCB per unit area (MPA). Finally the variance of the mass estimate is also greatly simplified
where again is simply the sample variance of the mean MPA and is estimated using the equation
provided above.
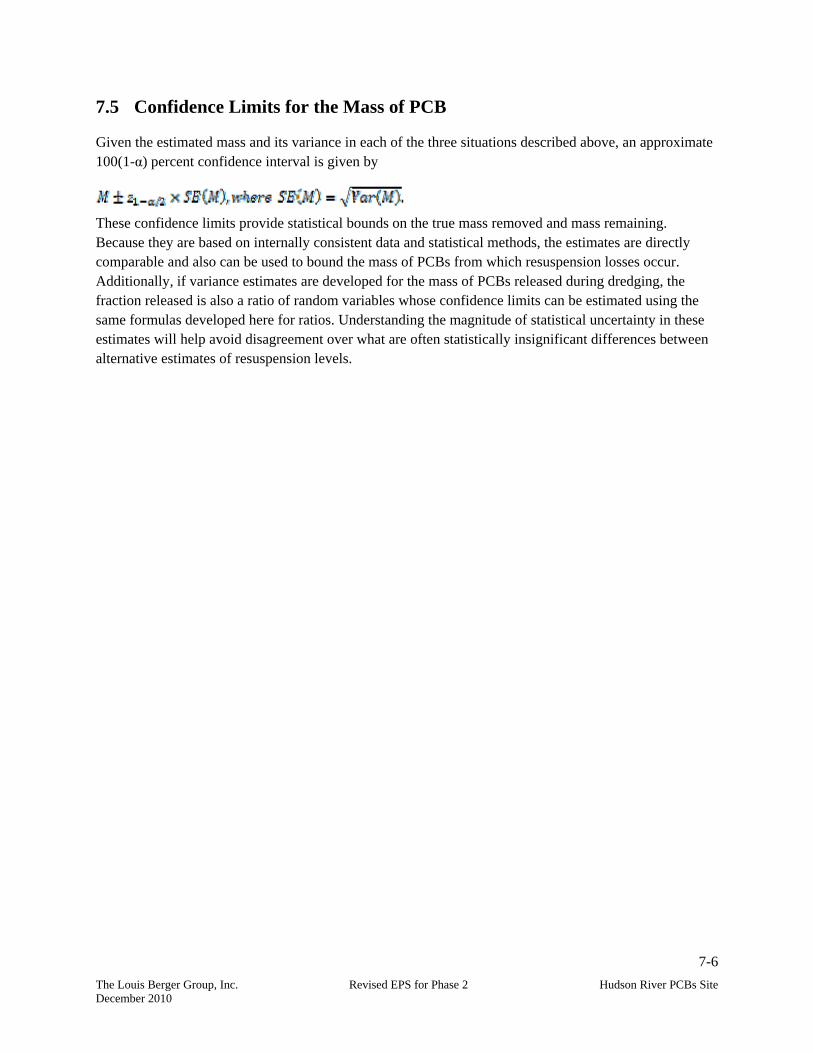
7-6
The Louis Berger Group, Inc. Revised EPS for Phase 2 Hudson River PCBs Site December 2010
7.5 Confidence Limits for the Mass of PCB
Given the estimated mass and its variance in each of the three situations described above, an approximate 100(1-α) percent confidence interval is given by
These confidence limits provide statistical bounds on the true mass removed and mass remaining. Because they are based on internally consistent data and statistical methods, the estimates are directly comparable and also can be used to bound the mass of PCBs from which resuspension losses occur. Additionally, if variance estimates are developed for the mass of PCBs released during dredging, the fraction released is also a ratio of random variables whose confidence limits can be estimated using the same formulas developed here for ratios. Understanding the magnitude of statistical uncertainty in these estimates will help avoid disagreement over what are often statistically insignificant differences between alternative estimates of resuspension levels.

8-1
The Louis Berger Group, Inc. Revised EPS for Phase 2 Hudson River PCBs Site December 2010
8. References
Bridges, T., R. Fox, P. Fuglevand, G. Hartman, V. Magar, P. Schroeder, T. Thompson, and SRA International, Inc. 2010. Hudson River PCBs Site, Peer Review of Phase 1 Dredging, Final Report. September 10, 2010.
Casella, G. and R.L. Berger. 1990. Statistical Inference. Duxbury Press, Belmont CA.
Cochran, W.G. 1977. Sampling Techniques. John Wiley and Sons, New York, NY
Goodman, L.A. 1960. On the exact variance of products. Journal of the American Statistical Association 55:708-713.
USEPA, December 2002. Record of Decision and Responsiveness Summary for Hudson River PCBs Site. February, 2002.
USEPA. 2004. Final Engineering Performance Standards for the Hudson River PCBS Superfund Site (Hudson EPS). Prepared for USEPA by Malcolm Pirnie, Inc. and TAMS Consultants, Inc. April, 2004.
USEPA, 2006. Letter to John Haggard, General Electric Corporation, November 9, 2006 Final Decision Regarding General Electric Company’s Disputes Regarding EPA’s June 23, 2006 Comments on Phase 1 Final Design Report.
Wolter, K.M. 1984. An investigation of some estimators of variance for systematic sampling. Journal of the American Statistical Association 79:781-790.

Hudson River PCBs Site The Louis Berger Group, Inc. Revised EPS for Phase 2 December 2010
TABLES

Hudson River PCBs Site The Louis Berger Group, Inc. Revised EPS for Phase 2 December 2010
CHAPTER 1 TABLES There are No Tables Associated with this Chapter

Hudson River PCBs Site The Louis Berger Group, Inc. Revised EPS for Phase 2 December 2010
CHAPTER 2 TABLES

Table 2.4-1 Proposed Special Studies for Phase 2
Hudson River PCBs Site The Louis Berger Group, Inc. Revised EPS for Phase 2 Page 1 of 2 December 2010
WHAT WHY HOW What are the objectives of the Special Study
Rationale to explain why a particular Special Study is necessary
Identify the methods and procedures that will be implemented to perform the Special Study
Proposed 2011 Special Studies for Residuals Standard Establish accuracy of design surface in targeting the 1 mg/kg TPCB elevation
Are the cores that define DoC adequate in removing targeted inventory of PCBs with minimum dredge passes and dredge cuts?
Compare targeted and actual cut lines after residuals sampling shows compliance with Residuals Standard
To quantify and evaluate stability of resettled and redistributed sediments associated with PCBs released during dredging
Are sediments resuspended during dredging redepositing in non-dredge areas?
1. Collocate sediment traps and shallow high-resolution cores based in locations upstream and downstream of areas targeted for dredging for use in sediment trap studies during Phase 2 dredging. 2. Collect sediment samples from the sediment traps and sediment cores for use in the sediment trap studies. 3. Analyze sediment and core samples for the listed parameters for the study using the procedures outlined in the QAPP after segmenting them as planned.
Proposed 2011 Special Studies for Resuspension Standard Evaluate the impact of automated sample techniques on PCB concentrations on the collected sample.
Does collection of a water sample using automated techniques alter the PCB concentration of sample, as compared to manual collection methodology?
Composite and individual samples collected using manual methodology will be compared to to composite and individual samples obtained using the automated station.
Characterize the NAPL in sediments slated for removal during Phase 2.
How can the impacts of NAPL in sediments delineated for removal in Phase 2 be addressed?
Collect cores during 2011 at locations occupied during the SSAP/SEDC programs where NAPL was observed. Extract the NAPL from all core sections, and analyze for physical and chemical properties for sections where the sediment TPCB concentration is 500 mg/kg or greater.
Establish baseline surface sediment concentrations.
What are the current surface sediment concentrations downstream of dredging?
Collect surface sediment samples and analyze for radionuclides to locate areas of likely recent or near-recent deposition. Analyze recently-deposited material for PCBs.
Evaluate PCB losses during transport to the far-field
What mechanisms and conditions result in the loss of PCBs from the water column during
Collect samples along boat-run transects in the near-field for comparison to far-field transects.

Table 2.4-1 Proposed Special Studies for Phase 2
Hudson River PCBs Site The Louis Berger Group, Inc. Revised EPS for Phase 2 Page 2 of 2 December 2010
WHAT WHY HOW What are the objectives of the Special Study
Rationale to explain why a particular Special Study is necessary
Identify the methods and procedures that will be implemented to perform the Special Study
transport from the near-field to the Waterford far-field station?
Time of travel will be considered to ensure that the same parcel of water is obtained in both locations. Also collect depth-integrated, 12 to 24 hour composite and large volume samples upstream and downstream of major tributaries during the far-field transect studies.
Estimate PCB losses from water column over dams.
Could volatilization of PCB NAPLs especially at dam locations potentially explain observed PCB losses in the downstream direction that exceed losses which might be attributed to conventional gas exchange?
Measure PCB concentrations upstream and downstream of dam. Use Lock 5 station as downstream station. Compare with TI Dam and other stations. Sample when NAPL is observed in TIP.
Determine PCB concentrations on suspended matter and dissolved phase concentrations above and below reaches where tributaries enter the river.
Does resuspension and additional solids input from tributaries downstream of the dredging scavenge dissolved PCBs and settle to the sediment bed?
Use vertically-integrated samples over 12 or 24 hours to represent upstream and downstream conditions
Establish the nature of PCB release due to dredging and ancillary activities in the near-field.
What are the properties and phase distribution of Hudson River PCBs in the near- and far-fields?
Instantaneous, vertically-integrated water samples will be collected on boat-run transects in the near-field to evaluate split-phase PCB concentrations, TSS, POC, DOC, grain size distribution, and particle settling speeds.
Proposed 2011 Special Study for Fish To evaluate the effect of Pumpkinseed age to the distribution of the PCB concentratons.
Does the age of Pumkinseed explain the wide distribution in PCB concentrations tissue samples in the previous study?
Record the age of individual Pumpkinseed upon yearly sample collection.

Hudson River PCBs Site The Louis Berger Group, Inc. Revised EPS for Phase 2 December 2010
CHAPTER 3 TABLES
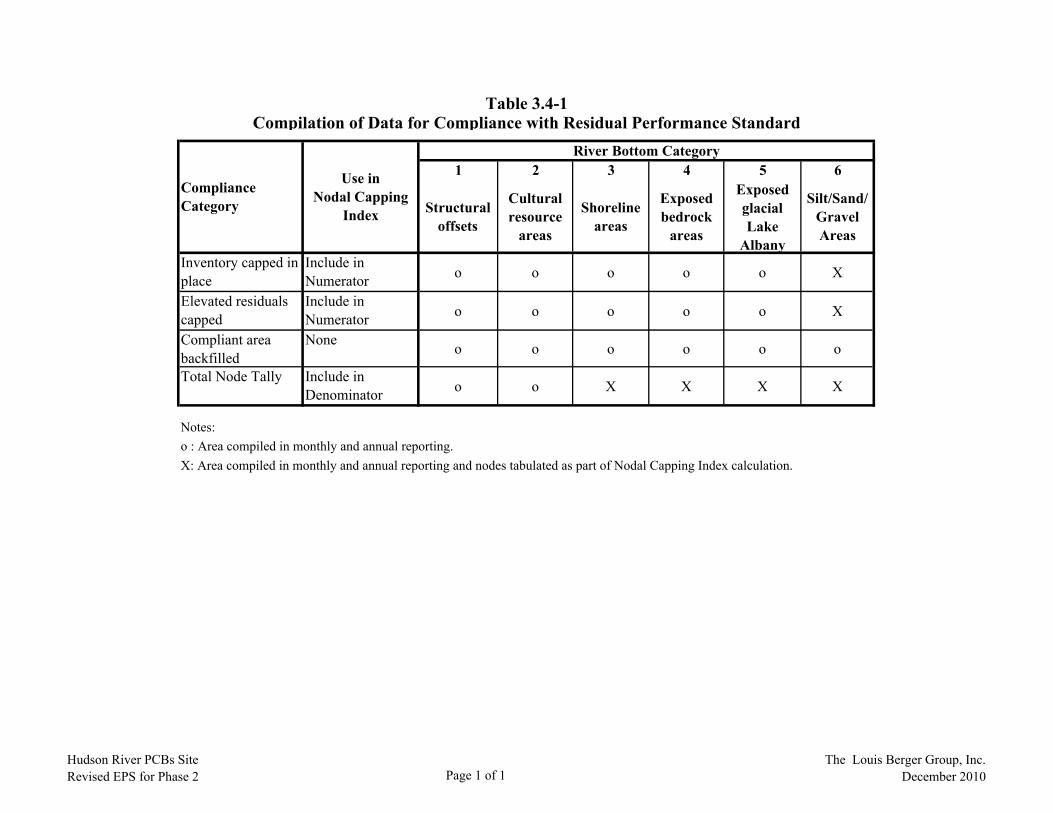
1 2 3 4 5 6
Structural offsets
Cultural resource
areas
Shoreline areas
Exposed bedrock
areas
Exposed glacial Lake
Albany
Silt/Sand/Gravel Areas
Inventory capped in place
Include in Numerator o o o o o X
Elevated residuals capped
Include in Numerator o o o o o X
Compliant area backfilled
None o o o o o o
Total Node Tally Include in Denominator o o X X X X
Notes:o : Area compiled in monthly and annual reporting.X: Area compiled in monthly and annual reporting and nodes tabulated as part of Nodal Capping Index calculation.
Table 3.4-1Compilation of Data for Compliance with Residual Performance Standard
River Bottom Category
Compliance Category
Use in Nodal Capping
Index
Hudson River PCBs SiteRevised EPS for Phase 2 Page 1 of 1
The Louis Berger Group, Inc.December 2010
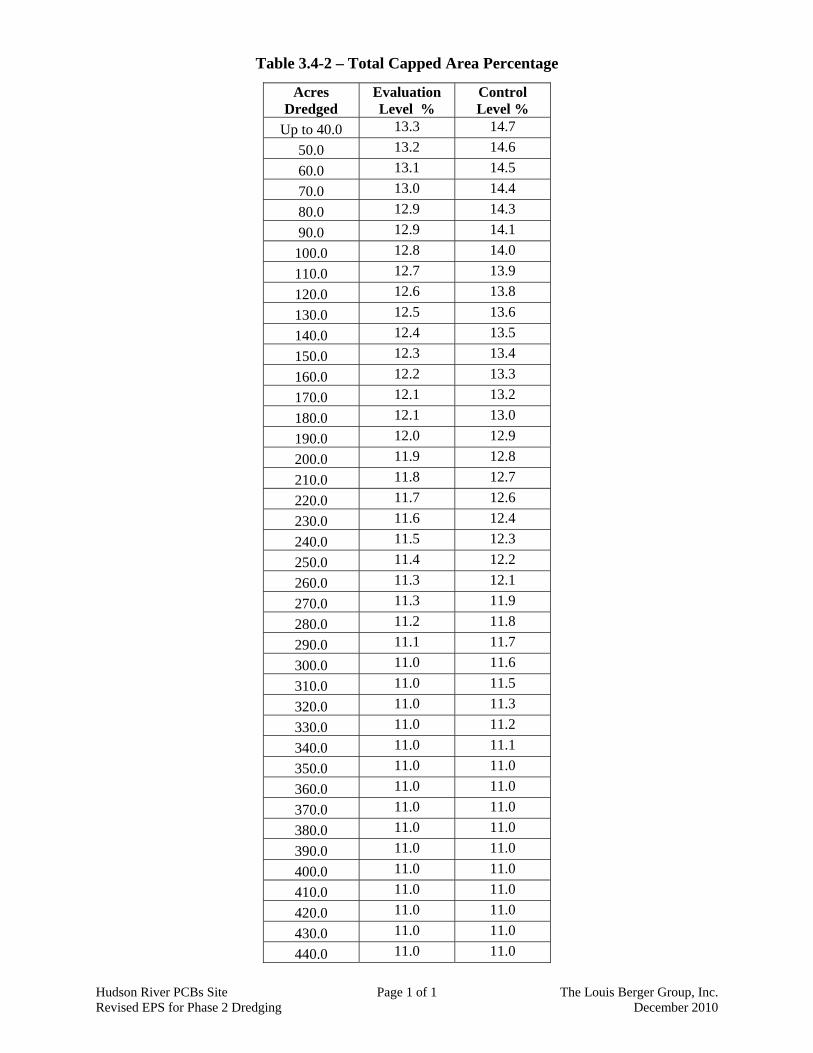
Hudson River PCBs Site Page 1 of 1 The Louis Berger Group, Inc. Revised EPS for Phase 2 Dredging December 2010
Table 3.4-2 – Total Capped Area Percentage
Acres Dredged
Evaluation Level %
Control Level %
Up to 40.0 13.3 14.7
50.0 13.2 14.6
60.0 13.1 14.5
70.0 13.0 14.4
80.0 12.9 14.3
90.0 12.9 14.1
100.0 12.8 14.0
110.0 12.7 13.9
120.0 12.6 13.8
130.0 12.5 13.6
140.0 12.4 13.5
150.0 12.3 13.4
160.0 12.2 13.3
170.0 12.1 13.2
180.0 12.1 13.0
190.0 12.0 12.9
200.0 11.9 12.8
210.0 11.8 12.7
220.0 11.7 12.6
230.0 11.6 12.4
240.0 11.5 12.3
250.0 11.4 12.2
260.0 11.3 12.1
270.0 11.3 11.9
280.0 11.2 11.8
290.0 11.1 11.7
300.0 11.0 11.6
310.0 11.0 11.5
320.0 11.0 11.3
330.0 11.0 11.2
340.0 11.0 11.1
350.0 11.0 11.0
360.0 11.0 11.0
370.0 11.0 11.0
380.0 11.0 11.0
390.0 11.0 11.0
400.0 11.0 11.0
410.0 11.0 11.0
420.0 11.0 11.0
430.0 11.0 11.0
440.0 11.0 11.0

Hudson River PCBs Site Page 1 of 1 The Louis Berger Group, Inc. Revised EPS for Phase 2 Dredging December 2010
Table 3.4-3 – Inventory Capped Area Percentage
Acres Dredged
EvaluationLevel %
ControlLevel %
Up to 40.0 3.6 4.0 50.0 3.6 4.0 60.0 3.6 4.0 70.0 3.5 3.9 80.0 3.5 3.9 90.0 3.5 3.9
100.0 3.5 3.8 110.0 3.5 3.8 120.0 3.4 3.8 130.0 3.4 3.7 140.0 3.4 3.7 150.0 3.4 3.7 160.0 3.3 3.6 170.0 3.3 3.6 180.0 3.3 3.6 190.0 3.3 3.5 200.0 3.2 3.5 210.0 3.2 3.5 220.0 3.2 3.4 230.0 3.2 3.4 240.0 3.1 3.4 250.0 3.1 3.3 260.0 3.1 3.3 270.0 3.1 3.3 280.0 3.0 3.2 290.0 3.0 3.2 300.0 3.0 3.2 310.0 3.0 3.1 320.0 3.0 3.1 330.0 3.0 3.1 340.0 3.0 3.0 350.0 3.0 3.0 360.0 3.0 3.0 370.0 3.0 3.0 380.0 3.0 3.0 390.0 3.0 3.0 400.0 3.0 3.0 410.0 3.0 3.0 420.0 3.0 3.0 430.0 3.0 3.0 440.0 3.0 3.0

Hudson River PCBs Site The Louis Berger Group, Inc. Revised EPS for Phase 2 December 2010
CHAPTER 4 TABLES
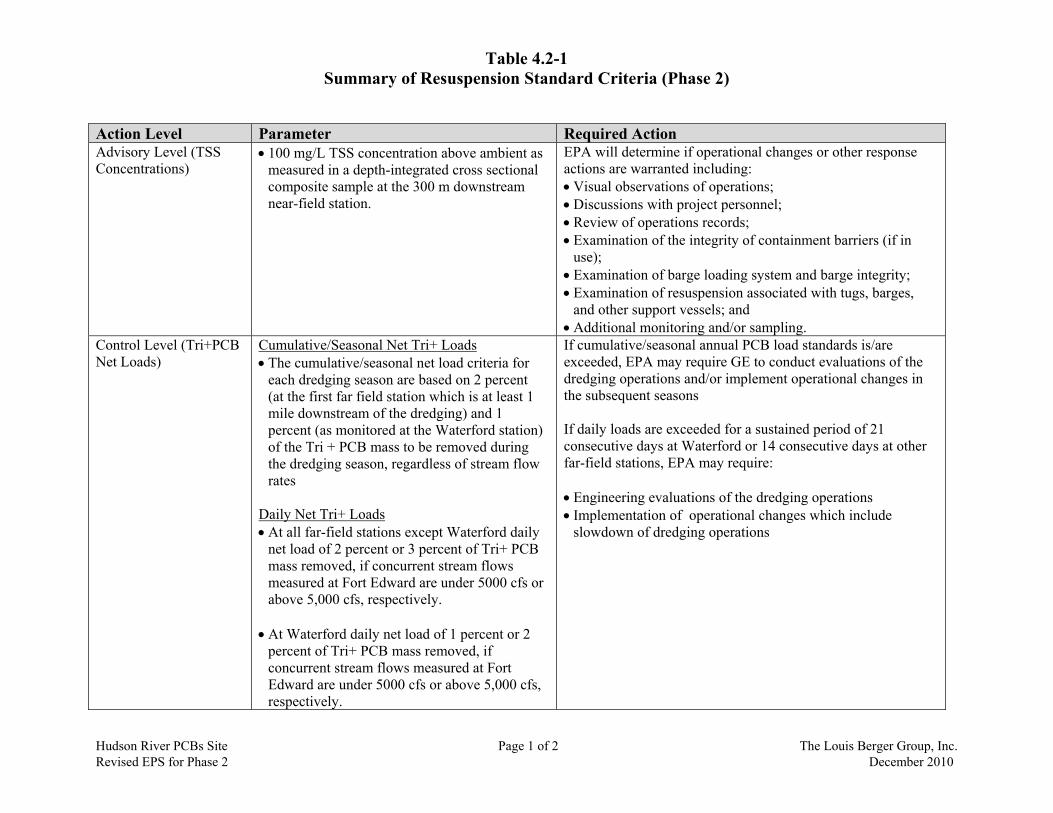
Table 4.2-1 Summary of Resuspension Standard Criteria (Phase 2)
Hudson River PCBs Site Page 1 of 2 The Louis Berger Group, Inc. Revised EPS for Phase 2 December 2010
Action Level Parameter Required Action Advisory Level (TSS Concentrations)
100 mg/L TSS concentration above ambient as measured in a depth-integrated cross sectional composite sample at the 300 m downstream near-field station.
EPA will determine if operational changes or other response actions are warranted including: Visual observations of operations; Discussions with project personnel; Review of operations records; Examination of the integrity of containment barriers (if in
use); Examination of barge loading system and barge integrity; Examination of resuspension associated with tugs, barges,
and other support vessels; and Additional monitoring and/or sampling.
Control Level (Tri+PCB Net Loads)
Cumulative/Seasonal Net Tri+ Loads The cumulative/seasonal net load criteria for
each dredging season are based on 2 percent (at the first far field station which is at least 1 mile downstream of the dredging) and 1 percent (as monitored at the Waterford station) of the Tri + PCB mass to be removed during the dredging season, regardless of stream flow rates
Daily Net Tri+ Loads At all far-field stations except Waterford daily
net load of 2 percent or 3 percent of Tri+ PCB mass removed, if concurrent stream flows measured at Fort Edward are under 5000 cfs or above 5,000 cfs, respectively.
At Waterford daily net load of 1 percent or 2 percent of Tri+ PCB mass removed, if concurrent stream flows measured at Fort Edward are under 5000 cfs or above 5,000 cfs, respectively.
If cumulative/seasonal annual PCB load standards is/are exceeded, EPA may require GE to conduct evaluations of the dredging operations and/or implement operational changes in the subsequent seasons
If daily loads are exceeded for a sustained period of 21 consecutive days at Waterford or 14 consecutive days at other far-field stations, EPA may require:
Engineering evaluations of the dredging operations Implementation of operational changes which include
slowdown of dredging operations
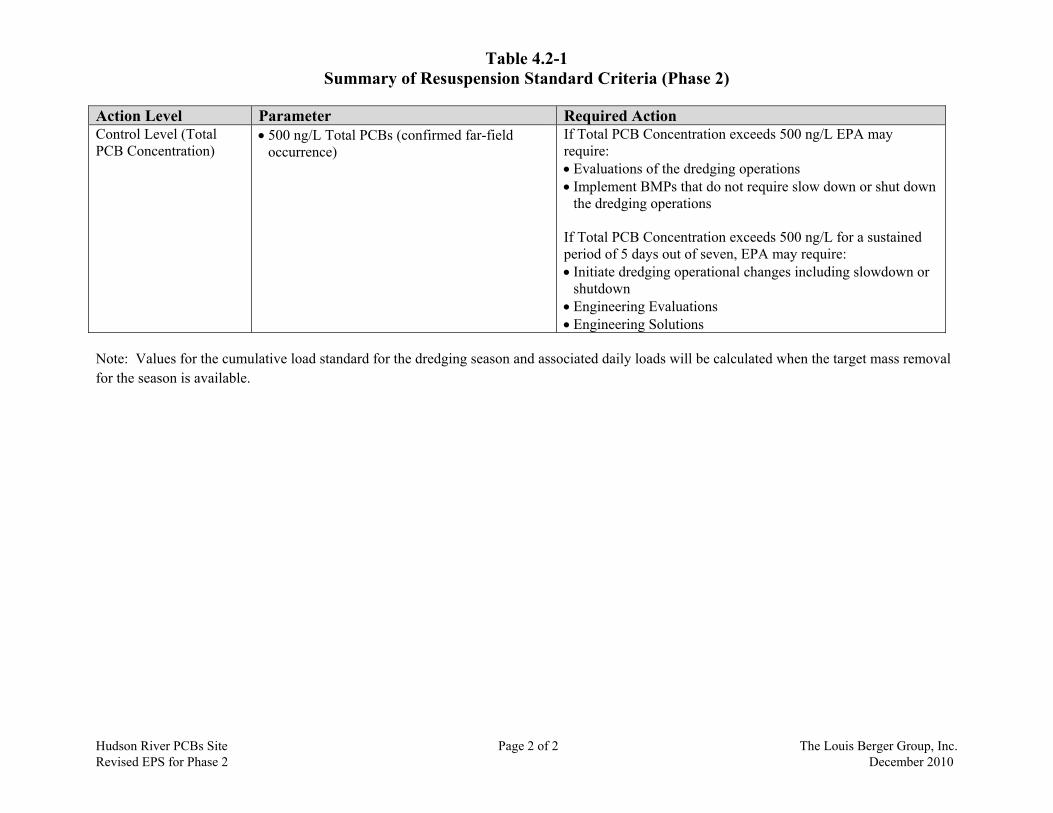
Table 4.2-1 Summary of Resuspension Standard Criteria (Phase 2)
Hudson River PCBs Site Page 2 of 2 The Louis Berger Group, Inc. Revised EPS for Phase 2 December 2010
Action Level Parameter Required Action Control Level (Total PCB Concentration)
500 ng/L Total PCBs (confirmed far-field occurrence)
If Total PCB Concentration exceeds 500 ng/L EPA may require: Evaluations of the dredging operations Implement BMPs that do not require slow down or shut down
the dredging operations If Total PCB Concentration exceeds 500 ng/L for a sustained period of 5 days out of seven, EPA may require: Initiate dredging operational changes including slowdown or
shutdown Engineering Evaluations Engineering Solutions
Note: Values for the cumulative load standard for the dredging season and associated daily loads will be calculated when the target mass removal for the season is available.
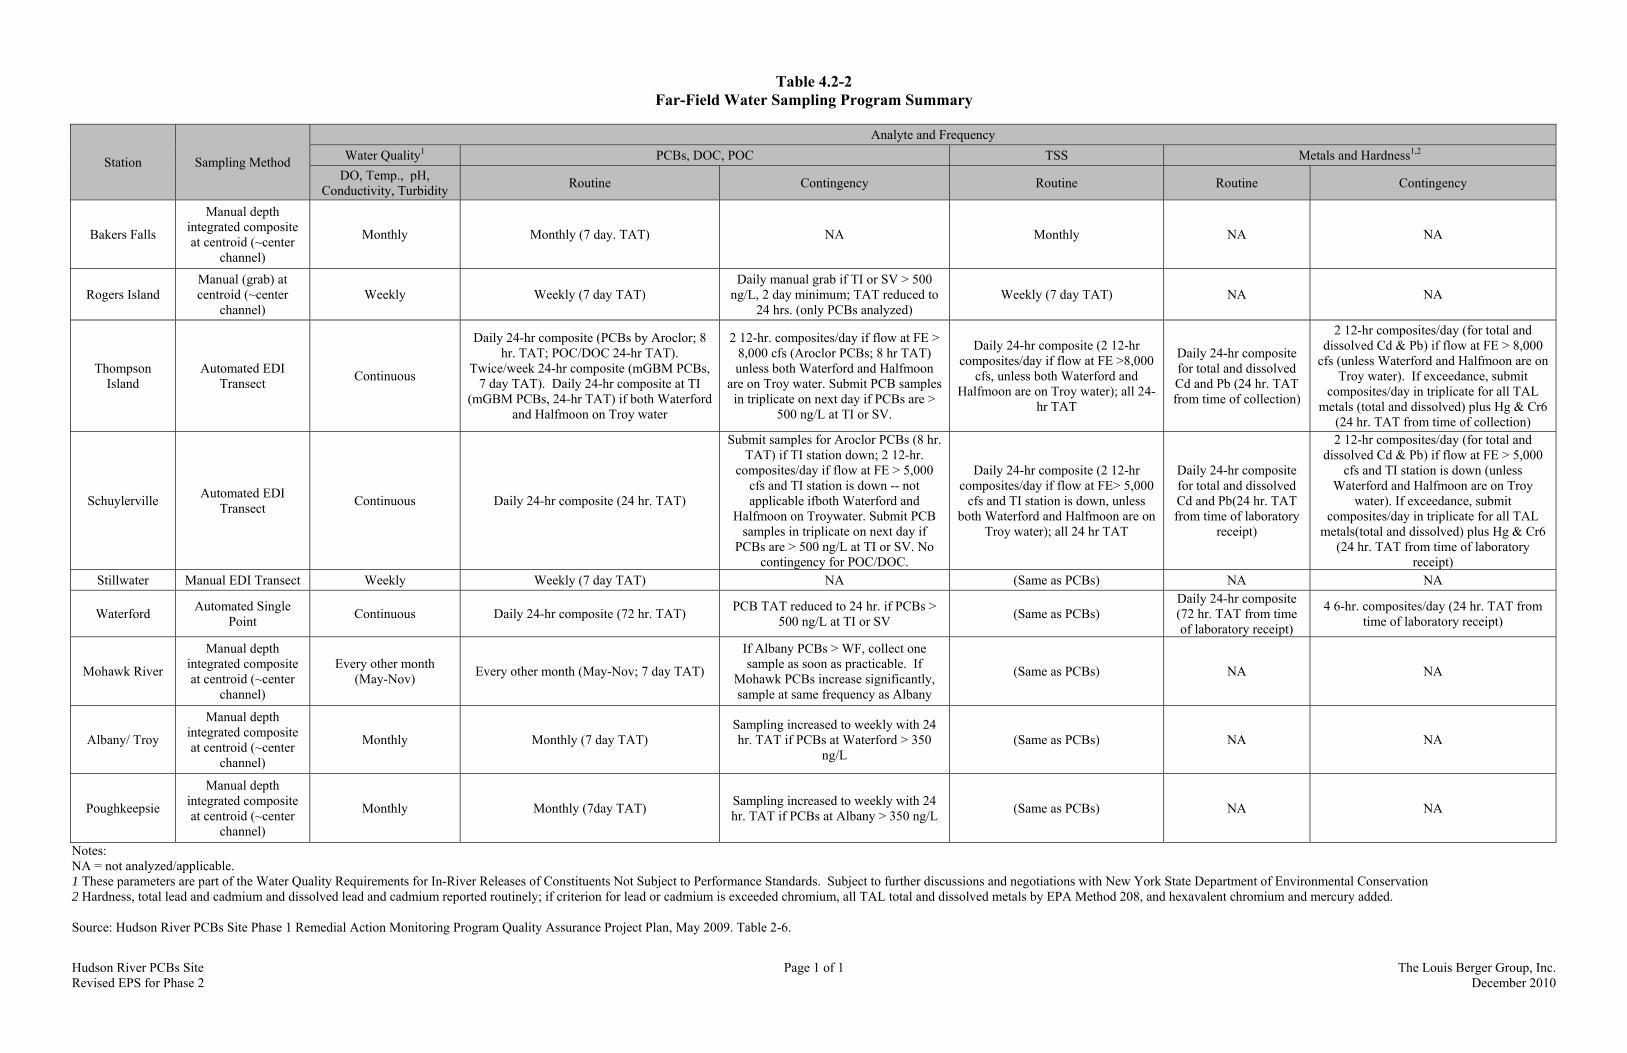
Hudson River PCBs Site Page 1 of 1 The Louis Berger Group, Inc. Revised EPS for Phase 2 December 2010
Table 4.2-2 Far-Field Water Sampling Program Summary
Station Sampling Method
Analyte and Frequency Water Quality1 PCBs, DOC, POC TSS Metals and Hardness1,2
DO, Temp., pH, Conductivity, Turbidity Routine Contingency Routine Routine Contingency
Bakers Falls
Manual depth integrated composite at centroid (~center
channel)
Monthly Monthly (7 day. TAT) NA Monthly NA NA
Rogers Island Manual (grab) at centroid (~center
channel) Weekly Weekly (7 day TAT)
Daily manual grab if TI or SV > 500 ng/L, 2 day minimum; TAT reduced to
24 hrs. (only PCBs analyzed) Weekly (7 day TAT) NA NA
Thompson Island
Automated EDI Transect Continuous
Daily 24-hr composite (PCBs by Aroclor; 8 hr. TAT; POC/DOC 24-hr TAT).
Twice/week 24-hr composite (mGBM PCBs, 7 day TAT). Daily 24-hr composite at TI
(mGBM PCBs, 24-hr TAT) if both Waterford and Halfmoon on Troy water
2 12-hr. composites/day if flow at FE > 8,000 cfs (Aroclor PCBs; 8 hr TAT) unless both Waterford and Halfmoon
are on Troy water. Submit PCB samples in triplicate on next day if PCBs are >
500 ng/L at TI or SV.
Daily 24-hr composite (2 12-hr composites/day if flow at FE >8,000
cfs, unless both Waterford and Halfmoon are on Troy water); all 24-
hr TAT
Daily 24-hr composite for total and dissolved Cd and Pb (24 hr. TAT from time of collection)
2 12-hr composites/day (for total and dissolved Cd & Pb) if flow at FE > 8,000
cfs (unless Waterford and Halfmoon are on Troy water). If exceedance, submit
composites/day in triplicate for all TAL metals (total and dissolved) plus Hg & Cr6
(24 hr. TAT from time of collection)
Schuylerville Automated EDI Transect Continuous Daily 24-hr composite (24 hr. TAT)
Submit samples for Aroclor PCBs (8 hr. TAT) if TI station down; 2 12-hr.
composites/day if flow at FE > 5,000 cfs and TI station is down -- not applicable ifboth Waterford and
Halfmoon on Troywater. Submit PCB samples in triplicate on next day if
PCBs are > 500 ng/L at TI or SV. No contingency for POC/DOC.
Daily 24-hr composite (2 12-hr composites/day if flow at FE> 5,000
cfs and TI station is down, unless both Waterford and Halfmoon are on
Troy water); all 24 hr TAT
Daily 24-hr composite for total and dissolved Cd and Pb(24 hr. TAT from time of laboratory
receipt)
2 12-hr composites/day (for total and dissolved Cd & Pb) if flow at FE > 5,000
cfs and TI station is down (unless Waterford and Halfmoon are on Troy
water). If exceedance, submit composites/day in triplicate for all TAL
metals(total and dissolved) plus Hg & Cr6 (24 hr. TAT from time of laboratory
receipt) Stillwater Manual EDI Transect Weekly Weekly (7 day TAT) NA (Same as PCBs) NA NA
Waterford Automated Single Point Continuous Daily 24-hr composite (72 hr. TAT) PCB TAT reduced to 24 hr. if PCBs >
500 ng/L at TI or SV (Same as PCBs) Daily 24-hr composite (72 hr. TAT from time of laboratory receipt)
4 6-hr. composites/day (24 hr. TAT from time of laboratory receipt)
Mohawk River
Manual depth integrated composite at centroid (~center
channel)
Every other month (May-Nov) Every other month (May-Nov; 7 day TAT)
If Albany PCBs > WF, collect one sample as soon as practicable. If
Mohawk PCBs increase significantly, sample at same frequency as Albany
(Same as PCBs) NA NA
Albany/ Troy
Manual depth integrated composite at centroid (~center
channel)
Monthly Monthly (7 day TAT) Sampling increased to weekly with 24 hr. TAT if PCBs at Waterford > 350
ng/L (Same as PCBs) NA NA
Poughkeepsie
Manual depth integrated composite at centroid (~center
channel)
Monthly Monthly (7day TAT) Sampling increased to weekly with 24 hr. TAT if PCBs at Albany > 350 ng/L (Same as PCBs) NA NA
Notes: NA = not analyzed/applicable. 1 These parameters are part of the Water Quality Requirements for In-River Releases of Constituents Not Subject to Performance Standards. Subject to further discussions and negotiations with New York State Department of Environmental Conservation 2 Hardness, total lead and cadmium and dissolved lead and cadmium reported routinely; if criterion for lead or cadmium is exceeded chromium, all TAL total and dissolved metals by EPA Method 208, and hexavalent chromium and mercury added.
Source: Hudson River PCBs Site Phase 1 Remedial Action Monitoring Program Quality Assurance Project Plan, May 2009. Table 2-6.

Hudson River PCBs Site Page 1 of 1 The Louis Berger Group, Inc. Revised EPS for Phase 2 December 2010
Table 4.2-3 Off-Season Water Sampling Program Summary1
Station Hudson RM Sample Type PCBs, Dissolved OC,
Suspended OC, TSS DO, Temp, pH,
Conductivity, Turbidity
Bakers Falls 197.0 Manual at centroid (~center channel) Monthly Monthly
Rogers Island 194.2 Manual at centroid (~center channel) Weekly Weekly
Thompson Island 187.5 Automated or Manual EDI Transect Weekly Weekly
Schuylerville 181.4 Automated or Manual EDI Transect
Weekly (Only performed if elevated PCB loading
is observed at TI)
Weekly (Only performed if elevated
PCB loading is observed at TI)
Waterford 156 Automated station or Manual EDI Transect Weekly Weekly
Mohawk River -- Manual at centroid (~center channel) Every other month Every other month
Albany/ Troy 145 Manual at centroid (~center channel) Monthly Monthly
Poughkeepsie 75 Manual at centroid (~center channel) Monthly Monthly
Notes:
1
Sampling will only be performed when weather/ice conditions permit working safely. Source: Hudson River PCBs Site Phase 1 Remedial Action Monitoring Program Quality Assurance Project Plan, May 2009, Table 2-10.

Hudson River PCBs Site The Louis Berger Group, Inc. Revised EPS for Phase 2 December 2010
CHAPTER 5 TABLES There are No Tables Associated with this Chapter
Hudson River PCBs Site The Louis Berger Group, Inc. Revised EPS for Phase 2 December 2010
CHAPTER 6 TABLES There are No Tables Associated with this Chapter

Hudson River PCBs Site The Louis Berger Group, Inc. Revised EPS for Phase 2 December 2010
CHAPTER 7 TABLES

Symbol Definition Units Measurement or calculationsi index for core locationj index for sections within cores
Lij Corrected length of jth core section at ith location InchesMeasured length of section divided by the fraction of sediment recovered per location.
Cij PCB in jth core section at ith location (mg/kg)Analytical measurement of total PCB concentraiton in each core section
Fij Fraction solids in jth core section at ith location Unitless Measured value for each core section
δi Wet bulk density at the ith core location (Wet-weight kg/m3 )Calculated by weighing core tubes and subtraction of mass of overlying water in the tube as well as the mass of the core tubing.
Bi Dry bulk density at ith location (Dry-weight kg/m3 )
Calculated value based on fraction solids in each core section and volume and mass of the core at each location. This value is not specific to the core sections, but rather is a fixed value per location.
mi mass per unit volume at ith location (Dry-weight mg/m3 )
V In place volume of sediment removed CY wet sedimentTotal volume of sediment removed per certification unit measured by subtraction of pre- and post-dredge bathymetric surveys.
k Units conversion factor 7.6456E-07 Converts mass estimate from measured units to dry kg PCB
Table 7.3-1. Symbols Used in Mathematical Specification of Mass Estimation.
Hudson River PCBs SiteRevised EPS for Phase 2 Page 1 of 1
The Louis Berger Group, Inc.December 2010

Depth Interval
Apparent Length (in)
Corrected Length1
(in)PCB
(mg/kg)Fraction
Solids
Target2
Section (mg/kg)
Corrected3
Target Length (Li)
Weighted tPCB
Weighted Solids
Length Weighted PCB Concentration
(Ci ) (mg/kg)
Length Weighted Fraction
Solids (Fi)0-2 2 2.5 15.4 0.2 1 2.5 38.5 0.52-12 10 12.5 1.5 0.4 1 12.5 18.75 512-24 12 15 0.8 0.6 1 15 12 9
24-36 12 15 0.053 0.6 0 0 0 0Total 30 69.25 14.5 2.3 0.48
Notes:1) For this example the fraction of sediment recovered (recovery) was 0.8, each core section is expanded by a factor of 1/0.8=1.252) Target core sections include all core sections shallower than the 1 mg/kg tPCB depth, defined as bottom of the shallowest core section below which no sample value exceeds 1 mg-tPCB/kg-sediment dry weight .3) The target length is corrected for incomplete recovery and is used to define the elevation of contamination and depth of contamination for subsequent mass calculations.
Depth of Contamination
Table 7.3-2. Example Calculation of Length Weighted Average Concentration and Percent Solids.
Hudson River PCBs SiteRevised EPS for Phase 2 Page 1 of 1
The Louis Berger Group, Inc.December 2010

Hudson River PCBs Site The Louis Berger Group, Inc Revised EPS for Phase 2 December 2010
FIGURES

Hudson River PCBs Site The Louis Berger Group, Inc Revised EPS for Phase 2 December 2010
CHAPTER 1 FIGURES There are No Figures Associated with this Chapter

Hudson River PCBs Site The Louis Berger Group, Inc Revised EPS for Phase 2 December 2010
CHAPTER 2 FIGURES There are No Figures Associated with this Chapter

Hudson River PCBs Site The Louis Berger Group, Inc Revised EPS for Phase 2 December 2010
CHAPTER 3 FIGURES
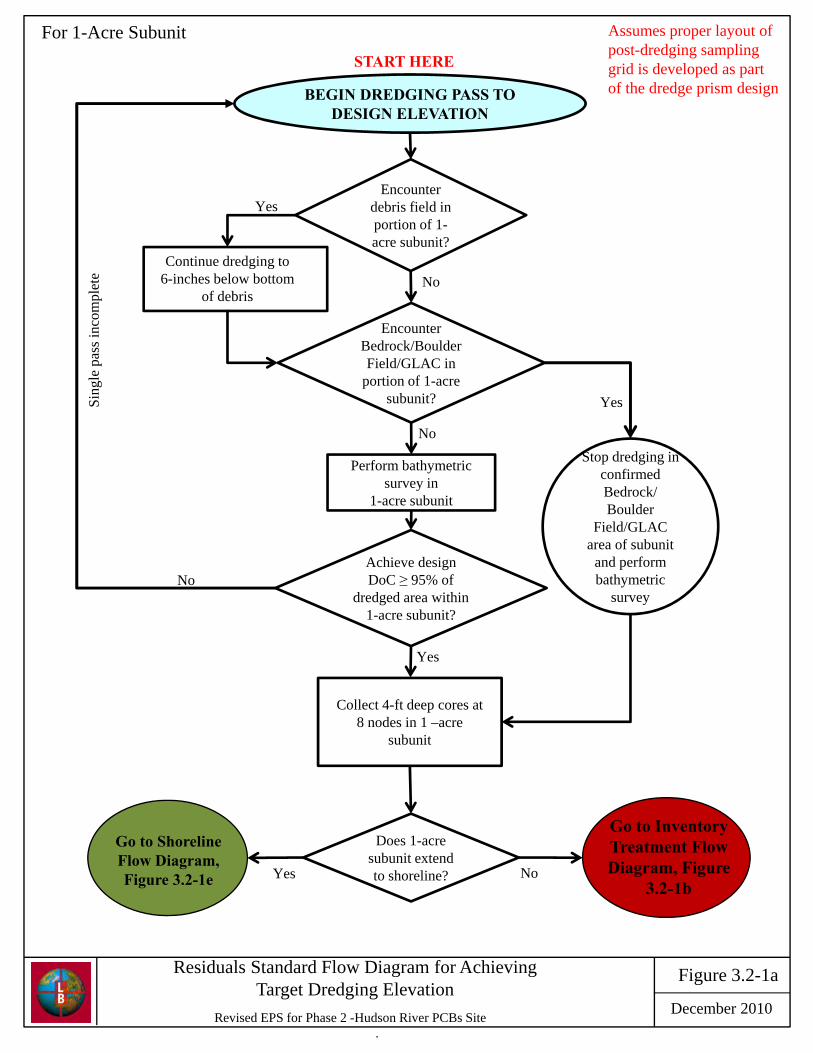
BEGIN DREDGING PASS TO DESIGN ELEVATION
START HERE
For 1-Acre Subunit Assumes proper layout of post-dredging sampling grid is developed as part of the dredge prism design
YesEncounter
debris field in portion of 1-acre subunit?
Continue dredging to
Encounter Bedrock/Boulder Field/GLAC in
portion of 1-acre b it?
No
ngle
pas
s in
com
plet
e
Continue dredging to 6-inches below bottom
of debris
subunit? YesSin
Stop dredging in confirmed Bedrock/Boulder
Field/GLAC
No
Perform bathymetric survey in
1-acre subunit
Achieve design DoC ≥ 95% of
dredged area within 1-acre subunit?
No
Field/GLAC area of subunit
and perform bathymetric
survey
YesYes
Collect 4-ft deep cores at 8 nodes in 1 –acre
subunit
Does 1-acre subunit extend to shoreline? NoYes
Go to Inventory Treatment Flow Diagram, Figure
3.2-1b
Go to Shoreline Flow Diagram, Figure 3.2-1e
Revised EPS for Phase 2 -Hudson River PCBs Site.
December 2010
Figure 3.2-1aResiduals Standard Flow Diagram for Achieving Target Dredging Elevation

For Individual NodesRepeat process until all nodes in unit are assessed
Start here from Achieve Target Depth, Figure 3.2-1a, or Navigation Channel Flow Diagram , Figure 3.2-1d, or Shoreline
Flow Diagram, Figure 3.2-1e.
Analyze each 6-inch segment from the 4-ft
core* for PCBs for all 8 nodes in 1-acre subunit
Two consecutive
6-inch segments with
TPCB
Yes DoC ≤ 6-inches
for
Yes
Go to Residuals Treatment
Flow Diagram
If first pass, is Tri+ < 27
mg/kg? If after first pass, is
Yes
or 40 nodes in 5-acre CU
Collect 8-ft deep core at
node
< 1mg/kg in 4-ft cores at each
node?
node?
No
No
Diagram, Figure 3.2-1c
TPCB < 500 mg/kg?
No
Go to Residuals Treatment
Flow Diagram,
Fi
Analyze bottom 8
6-inch segments for TPCB
Yes
Go to Navigation
Channel Flow
Diagram, Figure 3.2-
1d
Document location(s)
where TPCB or
Tri+exceeds criteria
Go to Beginning of Figure 3.2-1a for
next dredge pass
Has node been
addressed
Figure 3.2-1c
Two consecutive
6-inch segments with
TPCB < 1 mg/kg?
No
YesDocument location of
DoC
Tri+ PCB ≥ 6 mg/kg below 6 inches?
1d criteriaaddressed as per Figure 3.2-1d?
Was TPCB ≥
00
Go to Residuals Treatment
No
Yes
Yes
Yes
Document i< 1 mg/kg? inches?
Repeat process with deeper cores until two consecutive 6-inch segments TPCB < 1
mg/kg are found
Is node in Navigation Channel?
No
Yes
No
500 mg/kg
detected?
Was 2ndGo to
Flow Diagram,
Figure 3.2-1c
Yes
inventory location(s)
Tri+ PCB ≥ 27 mg/kg in top 6 inches (1st pass
l )?
Yes
Was 2dredging
pass conducted at node?
Beginning of Figure 3.2-1a for
second dredge pass
No* For areas where the pre-dredging DoC was less than 18 inches deep, only the top 2 feet of the core shall be analyzed, while the remaining 2 feet shall be preserved for contingency analyses if 2 consecutive 6-inch segments <1 mg/kg TPCB are not found in the top 2 feet.
Go to Residuals Treatment Flow
Diagram, Figure 3.2-1c
only)?
No
December 2010EPA Revised EPS for Phase 2 - Hudson River PCBs Site
Figure 3.2-1bResiduals Standard Flow Diagram (Inventory Treatment)

Start here from Inventory Treatment Flow Diagram, Figure 3.2-1b
For 1-Acre Subunit or 5-Acre CUApply initial 3-6 inch cover
Yes
Amass the data from cores not identified for
inventory capping
2-passes conducted
?
No
Yes
Evaluation Area in 1-acre
subunit or 5-acre CU
Subunit Average Tri+ PCB
Concentration ≤ 1 mg/kg
1-acre subunit
Combine evaluation of
< 5 nodes with nodes in
dj t 1
Yes
5-acre CU
CU Average Tri+ PCB
≤ 1 mg/kg
5-acre CU
No No
Group assess remaining compliant
nodes
≥ 5 adjacent nodes in 1-acre
s b nit?
adjacent 1-acre subunit
No
1-acre subunit
Does individual node cause mean
No
Concentration ≤ 1 mg/kg?
Group adjacent nodes and select type of cap based on Tri+ PCB concentration
subunit?
YesYes
5-acre CU
No
Tri+ PCB to exceed 1 mg/kg?
Yes
Cap or re
Re-dredgeIs node in
Navigation
Identify nodes to be capped for residual
Tri+ PCB concentration, DoC, location and bottom
velocity
YesGo to
Navigation
re-dredge?
Cap Go to Beginning of Figure 3.2-1a for
Navigation Channel?
contamination
Group adjacent nodes and select type of backfill based on location, water depth, habitat and bottom velocity
gChannel Flow
Diagram Figure 3.2-1d
3.2 1a for next
dredge pass
December 2010Revised EPS for Phase 2 - Hudson River PCBs Site
Figure 3.2-1cResiduals Standard Flow Diagram (Residuals Treatment)
p , y
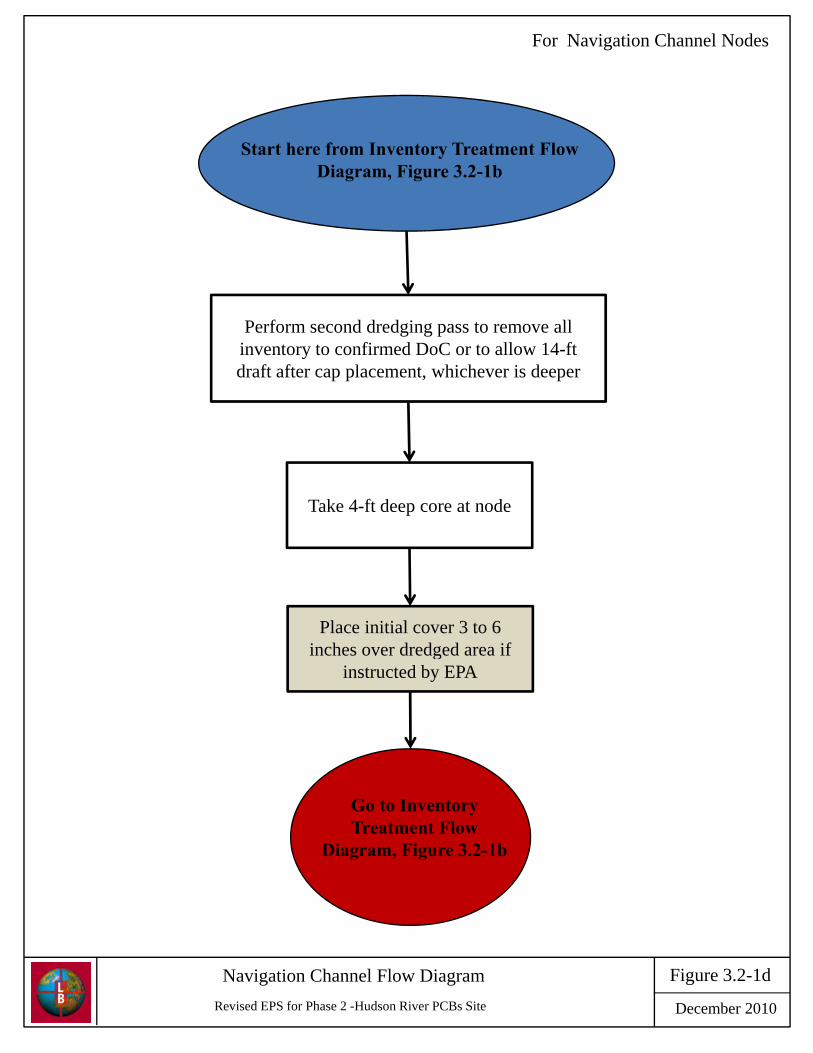
For Navigation Channel Nodes
Start here from Inventory Treatment Flow Diagram, Figure 3.2-1b
Perform second dredging pass to remove all inventory to confirmed DoC or to allow 14-ft draft after cap placement, whichever is deeper
Take 4-ft deep core at node
Place initial cover 3 to 6 inches over dredged area if g
instructed by EPA
Go to Inventory Treatment Flow
Diagram, Figure 3.2-1b
Revised EPS for Phase 2 -Hudson River PCBs Site December 2010
Figure 3.2-1dNavigation Channel Flow Diagram
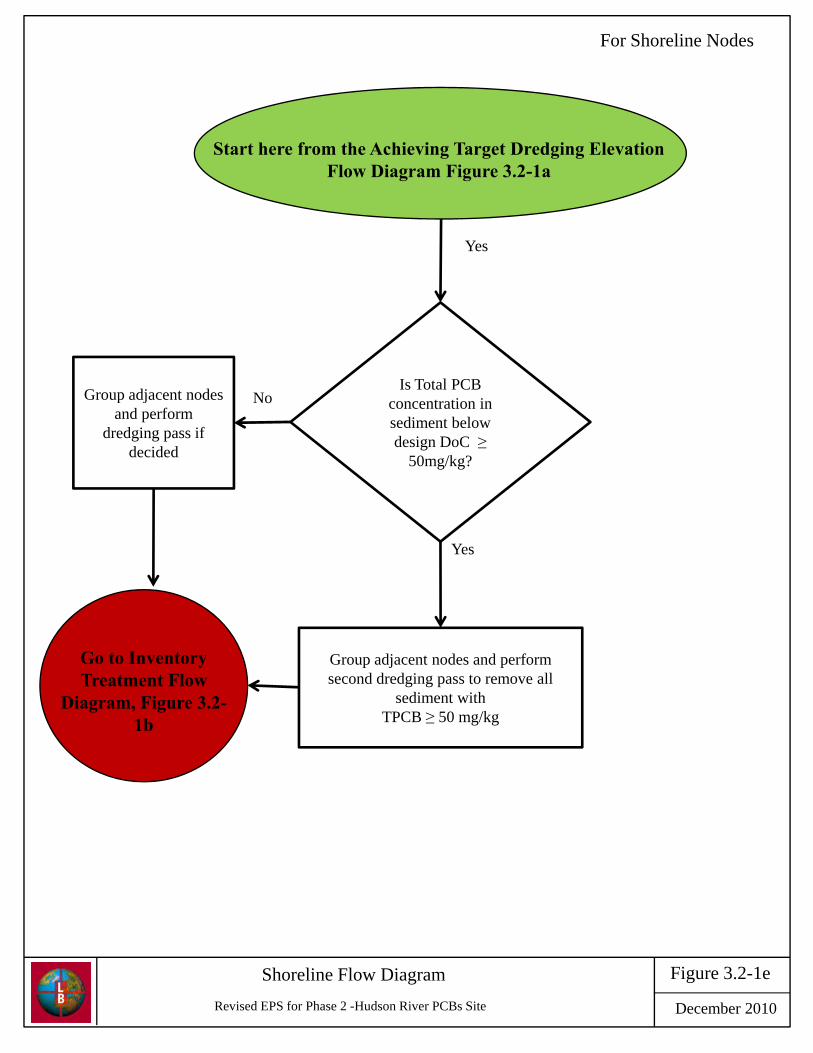
For Shoreline Nodes
Yes
Start here from the Achieving Target Dredging Elevation Flow Diagram Figure 3.2-1a
Is Total PCB Group adjacent nodes N concentration in
sediment below design DoC ≥
50mg/kg?
Group adjacent nodes and perform
dredging pass if decided
No
Group adjacent nodes and perform
Yes
Go to Inventory Group adjacent nodes and perform second dredging pass to remove all
sediment with TPCB ≥ 50 mg/kg
Go to Inventory Treatment Flow
Diagram, Figure 3.2-1b
Revised EPS for Phase 2 -Hudson River PCBs Site December 2010
Figure 3.2-1eShoreline Flow Diagram
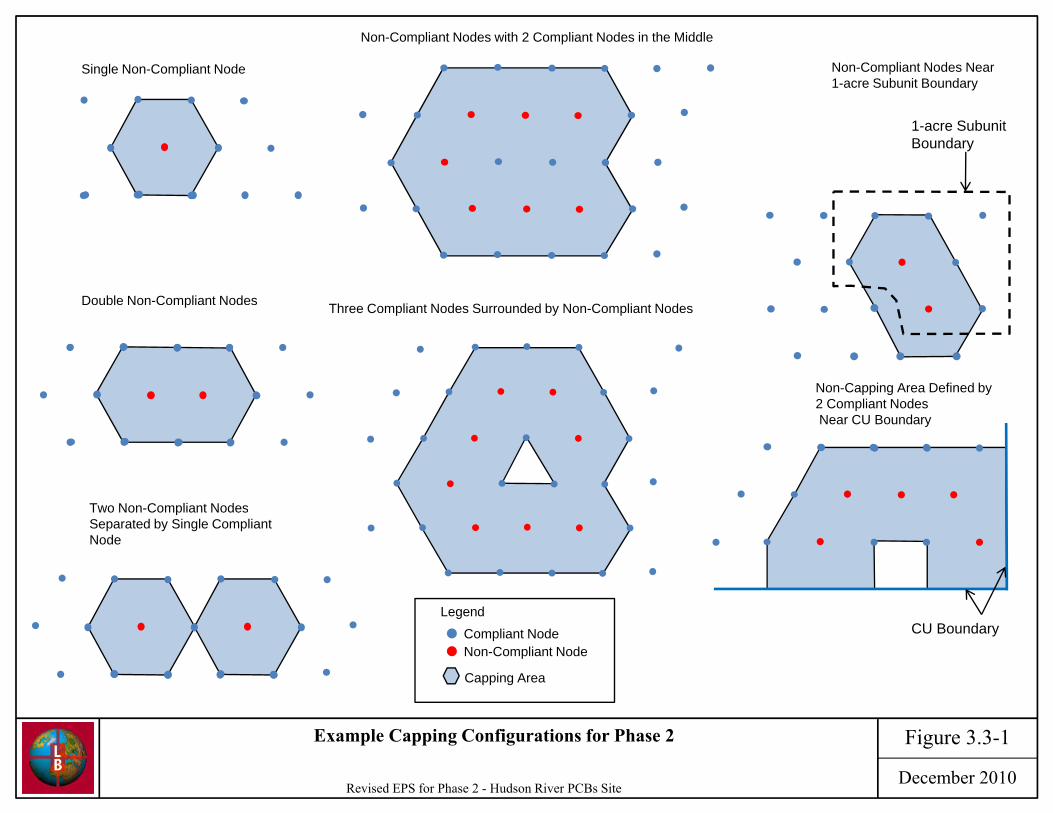
Single Non-Compliant Node
Non-Compliant Nodes with 2 Compliant Nodes in the Middle
Non-Compliant Nodes Near1-acre Subunit Boundary
1-acre Subunit Boundary
Double Non-Compliant NodesTh C li t N d S d d b N C li t N d
pThree Compliant Nodes Surrounded by Non-Compliant Nodes
Non-Capping Area Defined by2 Compliant Nodes
Two Non-Compliant Nodes
2 Compliant NodesNear CU Boundary
Two Non-Compliant NodesSeparated by Single CompliantNode
LegendCU Boundary
Legend
Compliant NodeNon-Compliant Node
Capping Area
December 2010Revised EPS for Phase 2 - Hudson River PCBs Site
Figure 3.3-1Example Capping Configurations for Phase 2

Hudson River PCBs Site The Louis Berger Group, Inc Revised EPS for Phase 2 December 2010
CHAPTER 4 FIGURES
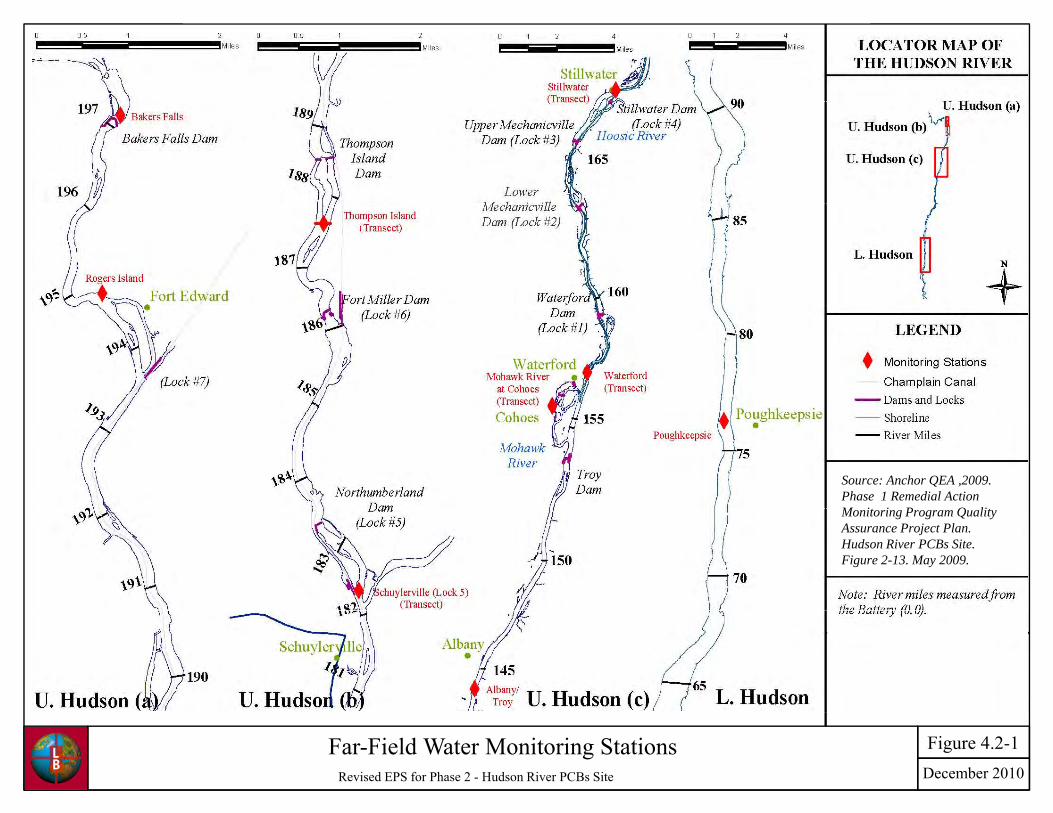
Source: Anchor QEA ,2009. Phase 1 Remedial Action M i i P Q liMonitoring Program Quality Assurance Project Plan. Hudson River PCBs Site. Figure 2-13. May 2009.
Source: QEA 2005. Technical Memorandum. August 2, 2005.
December 2010Revised EPS for Phase 2 - Hudson River PCBs Site
Far-Field Water Monitoring Stations Figure 4.2-1

Hudson River PCBs Site The Louis Berger Group, Inc Revised EPS for Phase 2 December 2010
CHAPTER 5 FIGURES There are No Figures Associated with this Chapter

Hudson River PCBs Site The Louis Berger Group, Inc Revised EPS for Phase 2 December 2010
CHAPTER 6 FIGURES There are No Figures Associated with this Chapter

Hudson River PCBs Site The Louis Berger Group, Inc Revised EPS for Phase 2 December 2010
CHAPTER 7 FIGURES
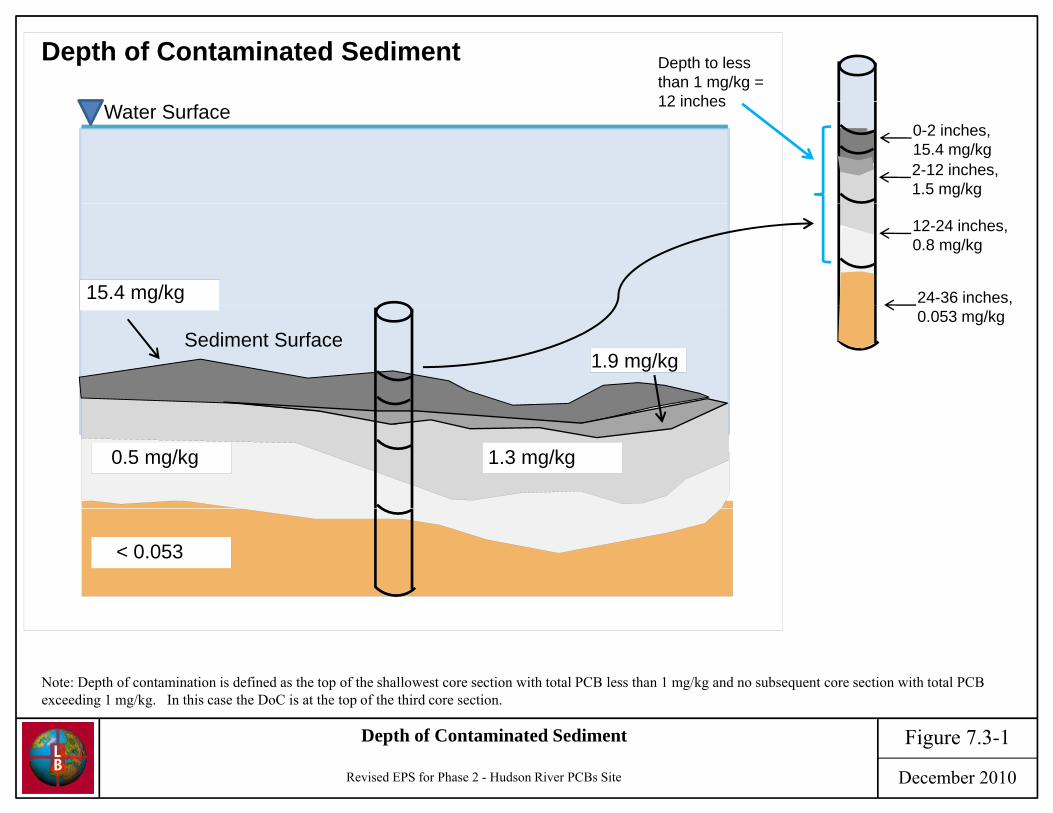
Depth of Contaminated Sediment Depth to less than 1 mg/kg = 12 inches
0-2 inches, 15.4 mg/kg2-12 inches, 1.5 mg/kg
12 inchesWater Surface
15.4 mg/kg
12-24 inches, 0.8 mg/kg
24-36 inches,
Sediment Surface0.053 mg/kg
1.9 mg/kg
0.5 mg/kg 1.3 mg/kg
< 0.053
Note: Depth of contamination is defined as the top of the shallowest core section with total PCB less than 1 mg/kg and no subsequent core section with total PCB exceeding 1 mg/kg. In this case the DoC is at the top of the third core section.
December 2010Revised EPS for Phase 2 - Hudson River PCBs Site
Figure 7.3-1Depth of Contaminated Sediment