Hudson River PCBs Site New York · Hudson River PCBs Site Record of Decision Table 8-23: Ratio of...
133
Hudson River PCBs Site New York Record of Decision
Transcript of Hudson River PCBs Site New York · Hudson River PCBs Site Record of Decision Table 8-23: Ratio of...
Hudson River PCBs SiteNew York
Record of Decision

Hudson River PCBs Site Record of Decision
TABLE OF CONTENTS
SECTION PAGE
PART 1: THE DECLARATION . . . . . . . . . . . . . . . . . . . . . . . . . . . . . . . . . . . . . . . . . . . . . . . . . . i
PART 2: THE DECISION SUMMARY . . . . . . . . . . . . . . . . . . . . . . . . . . . . . . . . . . . . . . . . . . . . 1
1. SITE NAME, LOCATION AND BRIEF DESCRIPTION . . . . . . . . . . . . . . . . . . 11.1 Site Name and Location . . . . . . . . . . . . . . . . . . . . . . . . . . . . . . . . . . . . . . 11.2 Brief Description . . . . . . . . . . . . . . . . . . . . . . . . . . . . . . . . . . . . . . . . . . . . 21.3 Lead Agency/Funding Information . . . . . . . . . . . . . . . . . . . . . . . . . . . . . . 3
2. SITE HISTORY AND ENFORCEMENT ACTIVITIES . . . . . . . . . . . . . . . . . . . 42.1 Site History . . . . . . . . . . . . . . . . . . . . . . . . . . . . . . . . . . . . . . . . . . . . . . . . 42.2 Actions to Date . . . . . . . . . . . . . . . . . . . . . . . . . . . . . . . . . . . . . . . . . . . . . 42.3 Enforcement Activities . . . . . . . . . . . . . . . . . . . . . . . . . . . . . . . . . . . . . . . 7
3. COMMUNITY/PUBLIC PARTICIPATION . . . . . . . . . . . . . . . . . . . . . . . . . . . . 83.1 Public Participation . . . . . . . . . . . . . . . . . . . . . . . . . . . . . . . . . . . . . . . . . . 83.2 Community Interaction Program . . . . . . . . . . . . . . . . . . . . . . . . . . . . . . . . 9
4. SCOPE AND ROLE OF RESPONSE ACTION . . . . . . . . . . . . . . . . . . . . . . . . . 10
5. PEER REVIEW . . . . . . . . . . . . . . . . . . . . . . . . . . . . . . . . . . . . . . . . . . . . . . . . . . 10
6. SITE CHARACTERISTICS . . . . . . . . . . . . . . . . . . . . . . . . . . . . . . . . . . . . . . . . 126.1 Conceptual Site Model . . . . . . . . . . . . . . . . . . . . . . . . . . . . . . . . . . . . . . . 126.2 Results of the Reassessment Remedial Investigation . . . . . . . . . . . . . . . 13
6.2.1 Site Overview . . . . . . . . . . . . . . . . . . . . . . . . . . . . . . . . . . . . . . . . 136.2.1.1 Hydrology . . . . . . . . . . . . . . . . . . . . . . . . . . . . . . . . . . . . 136.2.1.2 River Bed Geology . . . . . . . . . . . . . . . . . . . . . . . . . . . . . 146.2.1.3 Wetlands and Floodplains . . . . . . . . . . . . . . . . . . . . . . . . 156.2.1.4 Archaeological, Historic, and Cultural Resources . . . . . 15
6.2.2 Summary of Sampling Results . . . . . . . . . . . . . . . . . . . . . . . . . . 166.2.2.1 Nature of Contamination . . . . . . . . . . . . . . . . . . . . . . . . . 166.2.2.2 Sources . . . . . . . . . . . . . . . . . . . . . . . . . . . . . . . . . . . . . . 176.2.2.3 Contaminated Media . . . . . . . . . . . . . . . . . . . . . . . . . . . . 21
6.2.3 Geochemistry and Modeling Conclusions . . . . . . . . . . . . . . . . . . 266.2.4 Reassessment RI Conclusions . . . . . . . . . . . . . . . . . . . . . . . . . . . 27
7. CURRENT AND POTENTIAL FUTURE LAND AND WATER USES . . . . . 287.1 Current and Reasonably Anticipated Future Land Use . . . . . . . . . . . . . . 297.2 Surface Water Uses . . . . . . . . . . . . . . . . . . . . . . . . . . . . . . . . . . . . . . . . . 29

Hudson River PCBs Site Record of Decision
8. SUMMARY OF SITE RISKS . . . . . . . . . . . . . . . . . . . . . . . . . . . . . . . . . . . . . . . 318.1 Human Health Risk Assessment . . . . . . . . . . . . . . . . . . . . . . . . . . . . . . . 31
8.1.1 Data Collection and Analysis . . . . . . . . . . . . . . . . . . . . . . . . . . . . 328.1.2 Exposure Assessment . . . . . . . . . . . . . . . . . . . . . . . . . . . . . . . . . . 348.1.3 Toxicity . . . . . . . . . . . . . . . . . . . . . . . . . . . . . . . . . . . . . . . . . . . . 368.1.4 Risk Characterization . . . . . . . . . . . . . . . . . . . . . . . . . . . . . . . . . . 37
8.2 Ecological Risk Assessment . . . . . . . . . . . . . . . . . . . . . . . . . . . . . . . . . . 418.2.1 Problem Formulation . . . . . . . . . . . . . . . . . . . . . . . . . . . . . . . . . . 428.2.2 Exposure Assessment . . . . . . . . . . . . . . . . . . . . . . . . . . . . . . . . . . 438.2.3 Effects Assessment . . . . . . . . . . . . . . . . . . . . . . . . . . . . . . . . . . . 458.2.4 Risk Characterization . . . . . . . . . . . . . . . . . . . . . . . . . . . . . . . . . . 46
9. REMEDIAL ACTION OBJECTIVES . . . . . . . . . . . . . . . . . . . . . . . . . . . . . . . . 499.1 Remedial Action Objectives . . . . . . . . . . . . . . . . . . . . . . . . . . . . . . . . . . 509.2 Applicable or Relevant and Appropriate Requirements (ARARs) . . . . . 519.3 Effect of Other PCB Sources on Attaining Remediation Goals . . . . . . . 53
10. DESCRIPTION OF ALTERNATIVES . . . . . . . . . . . . . . . . . . . . . . . . . . . . . . . . 5410.1 Description of Remedy Components . . . . . . . . . . . . . . . . . . . . . . . . . . . 5610.2 Key/Common Elements . . . . . . . . . . . . . . . . . . . . . . . . . . . . . . . . . . . . . . 6210.3 Expected Outcomes of Each Alternative . . . . . . . . . . . . . . . . . . . . . . . . . 66
11. COMPARATIVE ANALYSIS OF ALTERNATIVES . . . . . . . . . . . . . . . . . . . . 6711.1 Overall Protection of Human Health and the Environment . . . . . . . . . . 6811.2 Compliance with Applicable or Relevant and Appropriate
Requirements (ARARs) . . . . . . . . . . . . . . . . . . . . . . . . . . . . . . . . . . . . . . 7611.3 Long-Term Effectiveness and Permanence . . . . . . . . . . . . . . . . . . . . . . . 7811.4 Reduction in Toxicity, Mobility, or Volume Through Treatment . . . . . . 8111.5 Short-Term Effectiveness . . . . . . . . . . . . . . . . . . . . . . . . . . . . . . . . . . . . 8211.6 Implementability . . . . . . . . . . . . . . . . . . . . . . . . . . . . . . . . . . . . . . . . . . . 8611.7 Cost . . . . . . . . . . . . . . . . . . . . . . . . . . . . . . . . . . . . . . . . . . . . . . . . . . . . . 9111.8 State Acceptance . . . . . . . . . . . . . . . . . . . . . . . . . . . . . . . . . . . . . . . . . . . 9211.9 Community Acceptance . . . . . . . . . . . . . . . . . . . . . . . . . . . . . . . . . . . . . . 93
12. PRINCIPAL THREAT WASTES . . . . . . . . . . . . . . . . . . . . . . . . . . . . . . . . . . . . 94
13. SELECTED REMEDY . . . . . . . . . . . . . . . . . . . . . . . . . . . . . . . . . . . . . . . . . . . . 9413.1 The Selected Remedy . . . . . . . . . . . . . . . . . . . . . . . . . . . . . . . . . . . . . . . 9413.2 Summary of the Estimated Costs of the Selected Remedy . . . . . . . . . . . 9813.3 Issues to be Addressed During the Remedial Design Phase
of the Selected Remedy . . . . . . . . . . . . . . . . . . . . . . . . . . . . . . . . . . . . . . 9813.4 Rationale for Selection of the Selected Remedy . . . . . . . . . . . . . . . . . . 102

Hudson River PCBs Site Record of Decision
14. STATUTORY DETERMINATIONS . . . . . . . . . . . . . . . . . . . . . . . . . . . . . . . . . 10514.1 Protection of Human Health and the Environment . . . . . . . . . . . . . . . . 10614.2 Compliance with ARARs . . . . . . . . . . . . . . . . . . . . . . . . . . . . . . . . . . . 10714.3 Cost-Effectiveness . . . . . . . . . . . . . . . . . . . . . . . . . . . . . . . . . . . . . . . . . 10714.4 Utilization of Permanent Solutions and Alternative Treatment
(or Resource Recovery) Technologies to the Maximum Extent Practicable . . . . . . . . . . . . . . . . . . . . . . . . . . . . . . . . . . . . . . . . . . . . . . . 108
14.5 Preference for Treatment as a Principal Element . . . . . . . . . . . . . . . . . . 10914.6 Five-Year Review Requirements . . . . . . . . . . . . . . . . . . . . . . . . . . . . . . 109
15. DOCUMENTATION OF SIGNIFICANT CHANGES FROM PREFERRED ALTERNATIVE OF PROPOSED PLAN . . . . . . . . . . . . . . . . . 109
PART 3: RESPONSIVENESS SUMMARYThe Responsiveness Summary is provided as a separate attachment to this Record of Decision.
APPENDIX A: Statement of Findings - Floodplains and Wetlands
APPENDIX B: New York State Concurrence Letter
APPENDIX C: Administrative Record IndexProvided on CD-ROM that also includes the Record of Decision and Responsiveness Summary

Hudson River PCBs Site Record of Decision
LIST OF FIGURES
Figure 1-1: Site Location MapFigure 1-2: Hudson River PCBs Site River SectionsFigure 6-1: Site Conceptual ModelFigure 6-2: Lipid-based Tri+ PCB Concentrations in Fish Thompson Island Pool (RM 189)Figure 6-3: Lipid-based Tri+ PCB Concentrations in Fish Stillwater ReachFigure 8-1: Ecological Conceptual ModelFigure 10-1: Mass Per Unit Area Calculation
LIST OF TABLES
Table 8-1: Summary of Chemicals of Concern and Medium-Specific Exposure PointConcentrations (EPCs) for Cancer Assessment - Fish
Table 8-2: Summary of Chemicals of Concern and Medium-Specific Exposure PointConcentrations (EPCs) for Non-Cancer Assessment - Fish
Table 8-3: Summary of Chemicals of Concern and Medium-Specific Exposure PointConcentrations (EPCs) for Dioxin-Like PCBs - Fish
Table 8-4: Summary of Chemicals of Concern and Medium-Specific Exposure PointConcentrations (EPCs) for Cancer and Non-Cancer Assessment - Sediment
Table 8-5: Summary of Chemicals of Concern and Medium-Specific Exposure PointConcentrations (EPCs) for Cancer and Non-Cancer Assessment - River Water
Table 8-6: Summary of Chemicals of Concern and Medium-Specific Exposure PointConcentrations (EPCs) for Cancer Assessment - Volatilized PCBs
Table 8-7: Conceptual Site ModelTable 8-8: Cancer Toxicity Data SummaryTable 8-9: Non-Cancer Toxicity Data Summary Table 8-10: Risk Characterization Summary for RME Exposures Exceeding 1 x 10E-6 in the Upper
Hudson River CarcinogensTable 8-11: Risk Characterization Summary for CT Exposures Exceeding 1 x 10E-6 in the Upper
Hudson River CarcinogensTable 8-12: Risk Characterization Summary for RME Exposures > HI = 1 for the Upper Hudson
River Non-CarcinogensTable 8-13: Risk Characterization Summary for CT Exposures > HI = 1 for the Upper Hudson River
Non-CarcinogensTable 8-14: NYS Rare and Listed Species and Habitats Occurring in the Vicinity of the Hudson
RiverTable 8-15: Ecological Assessment and Measurement EndpointsTable 8-16: Average Fish Tissue Concentrations from 1998 NYSDEC Sampling in the Upper
Hudson River, Reported as mg/kg Wet Weight and Converted to a Consistent Estimatorof Tri+PCBs
Table 8-17: Observed Avian Total PCB ConcentrationsTable 8-18: Dry Weight Sediment PCB Concentrations Based on USEPA Phase 2 DatasetTable 8-19: Whole Water PCB Concentrations Based on USEPA Phase 2 DatasetTable 8-20: Benthic Invertebrate PCB Concentrations Based On USEPA Phase 2 DatasetTable 8-21: Ratio of Modeled Dietary Doses to Toxicity Benchmarks for Female Mink for Tri+
Congeners for the Period 1993-2018Table 8-22: Ratio of Modeled Dietary Doses to Toxicity Benchmarks for Female Otter for Tri+
Congeners for the Period 1993-2018

Hudson River PCBs Site Record of Decision
Table 8-23: Ratio of Modeled Dietary Doses to Toxicity Benchmarks for Female Mink on a TEQBasis for the Period 1993-2018
Table 8-24: Ratio of Modeled Dietary Doses to Toxicity Benchmarks for Female Otter on a TEQBasis for the Period 1993-2018
Table 10-1: Summary of Area and Volume of Sediment Removed and Mass of PCBs RemediatedTable 11-1: Remedial Alternatives Comparative Analysis SummaryTable 11-2: Species-Weighted Fish Fillet Average PCB Concentration (mg/kg)Table 11-3: Upper Hudson River Largemouth Bass River Length-Weighted Whole Body Average
PCB Concentration (mg/kg)Table 11-4 Tri+ PCB Load Over Federal DamTable 11-5: Comparison of Present-Worth CostsTable 13-1: Areas of Sediments, Volumes of Sediment, and Mass of PCBs RemovedTable 13-2: Cost Analysis Alternative REM-3/10/SelectTable 14-1: Chemical-Specific ARARsTable 14-2: Location-Specific ARARsTable 14-3: Action-Specific ARARsTable 14-4: Location-Specific Criteria, Advisories and Guidance to be Considered (TBCs)Table 14-5: Action-Specific Criteria, Advisories and Guidance to be Considered (TBCs)
LIST OF PLATES
Plate 6-1: Sediment Texture Classification RM 194.8-188.5Plate 6-2: Sediment Texture Classification RM 188.5-181.0Plate 6-3: Sediment Texture Classification RM 181.0-174.0Plate 6-4: Sediment Texture Classification RM 174.5-170.5Plate 6-5: Sediment Texture Classification RM 170.5-166.5Plate 6-6: Sediment Texture Classification RM 167.0-160.0Plate 6-7: Sediment Texture Classification RM 160.0-153.9Plate 13-1: Alternative REM-3/10/Select Removal Areas and Depths RM 194.8-188.5Plate 13-2: Alternative REM-3/10/Select Removal Areas and Depths RM 188.5-181.0Plate 13-3: Alternative REM-3/10/Select Removal Areas and Depths RM 181.0-174.0Plate 13-4: Alternative REM-3/10/Select Removal Areas and Depths RM 174.5-170.5Plate 13-5: Alternative REM-3/10/Select Removal Areas and Depths RM 170.5-166.5Plate 13-6: Alternative REM-3/10/Select Removal Areas and Depths RM 167.0-160.0Plate 13-7: Alternative REM-3/10/Select Removal Areas and Depths RM 160.0-153.9

Hudson River PCBs Site Record of Decision
LIST OF ACRONYMS AND ABBREVIATIONS
AOC - Administrative Order on ConsentARAR - Applicable or Relevant and Appropriate RequirementAWQC - Ambient Water Quality Criterion
BMR - Baseline Modeling Report
CCC - Criteria Continuous ConcentrationCDI - Chronic Daily IntakeCERCLA - Comprehensive Environmental Response, Compensation, and Liability ActCFR - Code of Federal Regulationscfs - cubic feet per secondCIP - Community Interaction ProgramCOPC - Chemicals of Potential ConcernCSF - Cancer Slope FactorCSM - Conceptual Site ModelCT - Central TendencyCWA - Clean Water ActCZMA - Coastal Zone Management Act
DEIR - Data Evaluation and Interpretation ReportDOI - Department of InteriorDOT - Department of Transportation
ECL - Environmental Conservation Law (New York)EE/CA - Engineering Evaluation/Cost AnalysisEO - Executive OrderEPA - Environmental Protection AgencyEPC - Exposure Point ConcentrationERA - Ecological Risk AssessmentESA - Endangered Species Act
FEMA - Federal Emergency Management AgencyFISHRAND - Mechanistic Time-Varying Biouptake Model FR - Federal RegisterFS - Feasibility StudyFWQC - Federal Water Quality Criteria
g/m2 - Grams per square meterGE - General Electric Company
HHRA - Human Health Risk AssessmentHI - Hazard IndexHQ - Hazard QuotientHROC - Hudson River PCB Oversight CommitteeHUDTOX - Upper Hudson River Toxic Chemical Model
IRIS - Integrated Risk Information System

Hudson River PCBs Site Record of Decision
kg - Kilogram
LOAEL - Lowest Observed Adverse Effect Level
MCL - Maximum Contaminant LevelMCLG - Maximum Contaminant Level Goal:g/kg - Micrograms per Kilogram (Parts Per Billion)mg/kg - Milligrams Per Kilogram (Parts Per Million)MNA - Monitored Natural AttenuationMPA - Mass per Unit Area
NAAQS - National Ambient Air Quality StandardsNCP - National Oil and Hazardous Substances Pollution Contingency PlanNEPA - National Environmental Policy Actng/L - Nanograms per Liter (Parts Per Trillion)NHPA - National Historic Preservation ActNiMo - Niagara Mohawk Power CompanyNOAA - National Oceanic and Atmospheric AdministrationNOAEL - No Observed Adverse Effect LevelNPL - National Priorities ListNRC - National Research CouncilNRRB - National Remedy Review BoardNTCRA - Non-Time Critical Removal ActionNYCRR - New York Code of Rules and RegulationsNYSDEC - New York State Department of Environmental ConservationNYSDOH - New York State Department of HealthNYSDOS - New York State Department of StateNYSDOT - New York State Department of TransportationNYSPDES - New York State Pollutant Discharge Elimination System
O&M - Operation and Maintenance
PCB - Polychlorinated Biphenylppm - part(s) per million (mg/kg or mg/L)PRG - Preliminary Remediation Goal
RAO - Remedial Action ObjectiveRBMR - Revised Baseline Modeling ReportRCRA - Resource Conservation and Recovery ActRfD - Reference DoseRI - Remedial InvestigationRI/FS - Remedial Investigation/Feasibility StudyRM - River MileRME - Reasonable Maximum ExposureROD - Record of Decision
SARA - Superfund Amendments and Reauthorization Act of 1986SPDES - State Pollutant Discharge Elimination SystemSTC - Scientific and Technical Committee

Hudson River PCBs Site Record of Decision
TBC - To-be-considered (criteria)TCDD - 2,3,7,8-tetrachlorodibenzo-p-dioxinTEF - Toxicity Equivalency FactorTEQ - (Dioxin-like) Toxic EquivalentTI - Thompson IslandTID - Thompson Island DamTIP - Thompson Island PoolTri+ PCB - the sum of PCB congeners with three or more chlorine atomsTQ - Toxicity QuotientTRV - Toxicity Reference ValueTSCA - Toxic Substances Control Act
UCLM - Upper Confidence Limit on the MeanUSACE-NYD - United States Army Corp of Engineers - New York DistrictUSC - United States CodeUSGS - United States Geological SurveyUSEPA - United States Environmental Protection AgencyUSFWS - United States Fish and Wildlife Service
WHO - World Health Organization

Hudson River PCBs Site Record of Decision
i
PART 1: THE DECLARATION
Site Name and Location
The Hudson River PCBs Site (“Site”) (United States Environmental Protection Agency (EPA)Identification Number NYD980763841) includes a nearly 200 river-mile stretch of the HudsonRiver in eastern New York State from the Village of Hudson Falls to the Battery in New YorkCity. The Hudson River has been designated an American Heritage River because of itsimportant role in American history and culture. This federal Superfund Record of Decision(ROD) addresses the risks to people and ecological receptors associated with polychlorinatedbiphenyls (PCBs) in the in-place sediments of the Upper Hudson River.
The Site is divided into the Upper Hudson River (the length of river between Hudson Fallsand the Federal Dam at Troy, New York) and the Lower Hudson River (the length of riverbetween Federal Dam at Troy and the Battery). For purposes of this project, EPA further dividedthe Upper Hudson River area into three main sections known as River Section 1, River Section 2,and River Section 3. The Site also includes five Remnant Deposits, which are areas of PCB-contaminated sediment that became exposed after the river water level dropped followingremoval of the Fort Edward Dam in 1973.
This ROD selects a remedial action for sediments in the Upper Hudson River portion(approximately the upper 40 miles) of the Site. This remedial action will result in reduced risksto humans and ecological receptors living in and near the Upper Hudson and Lower HudsonRiver.
The Upper Hudson River region includes certain areas that have been and may continue to besources of PCB contamination to the river, including General Electric Company’s (GE’s)Hudson Falls plant and Fort Edward plant, and Remnant Deposits 1-5. These source areas havebeen and/or are planned to be addressed by response actions by EPA, the New York StateDepartment of Environmental Conservation (NYSDEC), and GE. Remedial actions for theseareas are not the focus of this decision document, although successful completion (i.e., reductionof PCB input into the river) of the expected source area work near the GE Hudson Falls plant isimportant to the full realization of the benefits of the remedial action called for in this ROD.
Statement of Basis and Purpose
This is the second ROD issued with respect to this Site. In the first ROD, issued by EPA onSeptember 25, 1984, EPA selected a remedy which included: in-place containment of theRemnant Deposits; evaluation of downstream domestic water quality at Waterford, New York;and interim “No Action” as to the PCB-contaminated river sediment. The 1984 ROD indicatedthat both the No Action decision for the river sediments and the containment remedy for theRemnant Deposits might be reexamined by EPA in the future. The containment remedy for theRemnant Deposits was performed by GE under a 1990 Consent Decree with EPA. In addition, in

Hudson River PCBs Site Record of Decision
ii
1990, NYSDEC completed the evaluation of downstream domestic water quality at Waterford,New York, which concluded that PCB concentrations were below analytical detection limits aftertreatment and met standards applicable to public water supplies.
In December 1989, EPA announced its decision to initiate a detailed Reassessment RemedialInvestigation/Feasibility Study (RI/FS) of the September 1984 decision concerning the PCB-contaminated Hudson River sediments. The Reassessment is culminating in this decisiondocument, which presents the remedial action selected by EPA for the PCB-contaminatedsediments in the Upper Hudson River. EPA selected this remedial action in accordance with theComprehensive Environmental Response, Compensation, and Liability Act (CERCLA) and, tothe extent practicable, with the National Oil and Hazardous Substances Pollution ContingencyPlan (NCP) (in accordance with CERCLA Section 121(a)). The decisions herein are based onthe Administrative Record for this Site. Occasional reference is made to specific documents inthe Administrative Record where the information is too voluminous to provide here. TheHudson River PCBs website (www.epa.gov/hudson) is also a source of information.
The United States Environmental Protection Agency is the lead agency for this project. TheState of New York, by the Department of Environmental Conservation, which is the supportagency for this project, concurs with EPA’s decision for this project. The United StatesDepartment of Interior (Fish and Wildlife Service) and the United States Department ofCommerce (National Oceanic and Atmospheric Administration), which are federal trustees ofnatural resources, and the New York State Attorney General also support an activeenvironmental dredging remedy.
Assessment of Site
The response action selected in this ROD is necessary to protect the public health, welfare, orthe environment from an imminent and substantial endangerment from actual or threatenedreleases of hazardous substances into the environment.
Description of Selected Remedy
The selected remedy includes the dredging of approximately 2.65 million cubic yards of PCB-contaminated sediments from the Upper Hudson River, which is estimated to contain 70,000 kg(about 150,000 lbs) of total PCBs (approximately 65% of the total PCB mass present within theUpper Hudson River). The selected remedy assumes a separate source control action near theGE Hudson Falls plant. The major components of the selected remedy include:
• Removal of sediments based primarily on a mass per unit area (MPA) of 3 g/m 2 Tri+PCBs or greater (approximately 1.56 million cubic yards of sediments) from RiverSection 1;
• Removal of sediments based primarily on an MPA of 10 g/m 2 Tri+ PCBs or greater(approximately 0.58 million cubic yards of sediments) from River Section 2;

Hudson River PCBs Site Record of Decision
iii
• Removal of selected sediments with high concentrations of PCBs and high erosionalpotential (NYSDEC Hot Spots 36, 37, and the southern portion of 39) (approximately0.51 million cubic yards) from River Section 3;
• Dredging of the navigation channel, as necessary, to implement the remedy and to avoidhindering canal traffic during implementation. Approximately 341,000 cubic yards ofsediments will be removed from the navigation channel (included in volume estimates inthe first three components, above);
• Removal of all PCB-contaminated sediments within areas targeted for remediation, withan anticipated residual of approximately 1 mg/kg Tri+ PCBs (prior to backfilling);
• Performance standards for air quality and noise are included in this ROD consistent withstate and federal law;
• Other performance standards (including but not necessarily limited to resuspension ratesduring dredging, production rates during dredging, and residuals after dredging) will bedeveloped during the design with input from the public and in consultation with the stateand federal natural resource trustees. These performance standards will be enforceable,and based on objective environmental and scientific criteria. The standards will promoteaccountability and ensure that the cleanup meets the human health and environmentalprotection objectives of the ROD.
• Independent external peer review of the dredging resuspension, PCB residuals, andproduction rate performance standards and the attendant monitoring program, as well asthe report prepared at the end of the first phase of dredging that will evaluate the dredgingwith respect to these performance standards;
• Performance of the dredging in two phases whereby remedial dredging will occur at areduced rate during the first year of dredging. This will allow comparison of operationswith pre-established performance standards and evaluation of necessary adjustments todredging operations in the succeeding phase or to the standards. Beginning in phase 1and continuing throughout the life of the project, EPA will conduct an extensivemonitoring program. The data EPA gathers, as well as the Agency’s ongoing evaluationof the work with respect to the performance standards, will be made available to thepublic in a timely manner and will be used to evaluate the project to determine whether itis achieving its human health and environmental protection objectives;
• Backfill of dredged areas with approximately one foot of clean material to isolate residualPCB contamination and to expedite habitat recovery, where appropriate;
• Use of rail and/or barge for transportation of clean backfill materials within the UpperHudson River area;
• Monitored Natural Attenuation (MNA) of PCB contamination that remains in the riverafter dredging;
• Use of environmental dredging techniques to minimize and control resuspension ofsediments during dredging;
• Transport of dredged sediments via barge or pipeline to sediment processing/transferfacilities for dewatering and, as needed, stabilization;
• Rail and/or barge transport of dewatered, stabilized sediments to an appropriate licensedoff-site landfill(s) for disposal. If a beneficial use of some portion of the dredged material

Hudson River PCBs Site Record of Decision
iv
is arranged, then an appropriate transportation method will be determined (rail, truck, orbarge);
• Monitoring of fish, water and sediment to determine when Remediation Goals arereached, and also monitoring the restoration of aquatic vegetation; and,
• Implementation (or modification) of appropriate institutional controls such as fishconsumption advisories and fishing restrictions by the responsible authorities, untilrelevant Remediation Goals are met.
The targeting of Hot Spots 36, 37 and the southern portion of 39, is based on currentlyavailable data showing that those areas have high PCB concentrations, and potential for loss tothe water column or uptake by biota. Additional sampling will be conducted during remedialdesign to determine whether other areas in River Section 3 have these characteristics andtherefore need to be remediated as part of the selected remedy.
Remedial dredging will be conducted in two phases. The first phase will be the firstconstruction season of remedial dredging. The dredging during that year will be implementedinitially at less than full scale operation. It will include an extensive monitoring program of alloperations. An independent external peer review of the dredging resuspension, PCB residuals,
and production rate performance standards will be conducted during design. Monitoring data will
be compared to performance standards identified in this ROD or developed during the remedialdesign with input from the public and in consultation with the State and federal natural resourcetrustees. The second phase will be the remainder of the dredging operation, which will beconducted at full-scale. During the full-scale remedial dredging, EPA will continue to monitor,evaluate performance data and make necessary adjustments.
EPA has identified performance standards that address air and noise emissions from thedredging operations and the sediment processing/transfer facilities. Performance standards forother issues will be developed during the first part of the design phase, as described below.
As to air emissions, operations and facilities will comply with the ARARs listed in Table 14-3which deal with such emissions (e.g., the National Primary and Secondary Ambient Air QualityStandards).
Regarding noise emissions, operations at the sediment processing/transfer facilities willcomply with the relevant noise abatement criteria (NAC) of the Federal Highway Administrationset forth at 23 CFR Part 772 (see Table 312685-1 of the Responsiveness Summary). Although itis EPA’s expectation that the facilities will be located in an industrial or commercial area, thedetermination of which NAC will apply will depend on where the sediment processing/transferfacilities are sited. The dredging will comply with the New York State Department ofTransportation construction noise impact guideline for temporary construction noise, whichdefines “impact” as occurring at levels exceeding Leq(1) = 80 dBA.

Hudson River PCBs Site Record of Decision
v
The performance standards referred to above regarding noise are being adopted preliminarily. During the remedial design phase, EPA will invite public input regarding these standards beforefinalizing the noise standards. Once implementation of the dredging begins, if the air or noiseperformance standards are exceeded, EPA will implement engineering controls or othermitigation measures, as appropriate, in order to address such exceedances.
In addition, during the remedial design phase, EPA will develop other performance standardswith input from the public and in consultation with the State and federal natural resource trustees. These standards will address (but may not be limited to) dredging resuspension, production rates,PCB residuals after dredging (or dredging with backfill, as appropriate), PCB air emissions, andcommunity impacts (e.g., odor). The dredging equipment and methods of operation will beselected based on their expected ability to meet the performance standards.
The information and experience gained during the first phase of dredging will be used toevaluate and determine compliance with the performance standards. Further, the data gatheredwill enable EPA to determine if adjustments are needed to operations in the succeeding phase ofdredging or if performance standards need to be reevaluated. EPA will make the data, as well asits final report evaluating the work with respect to the performance standards, available to thepublic.
As noted previously, a separate source control action near the GE Hudson Falls plant is to beimplemented by GE, under an administrative order issued by NYSDEC, in order to address thecontinuing discharge of PCBs from that facility. In the event that source control at Hudson Fallsis not successfully implemented pursuant to New York State law, EPA has authorized theperformance of an Engineering Evaluation/Cost Analysis to evaluate options for a Non-TimeCritical Removal Action at Hudson Falls pursuant to CERCLA in order to ensure that the PCBload to the river near the GE Hudson Falls plant is significantly reduced. Regarding the formeroutfall to the Hudson River (Outfall 004) from GE’s Fort Edward plant site, NYSDEC issued aRecord of Decision in January 2000 which calls for the excavation of PCB-contaminated soil andsediment in this area of the Upper Hudson River shoreline in order to eliminate this source ofPCBs to the river. EPA’s analyses assume significant reductions in loading to the river fromthese sources once the State’s plans for remediation are implemented.
EPA considered the recommendations of the National Research Council (NRC) report (ARisk-Management Strategy for PCB-Contaminated Sediments, March 2001) in the finalization ofthe selected remedy for the Hudson River PCBs Site. EPA agrees with the NRCrecommendation that there should be no presumption of a preferred or default risk-managementoption that is applicable to all PCB-contaminated sediment sites. This selected remedy includesa combination of remedial activities that are tailored to the conditions at the Site, includingremoval of contaminated sediment using environmental dredging techniques, institutionalcontrols, and MNA of PCB contamination in the river until acceptable PCB concentrations infish are attained.

Hudson River PCBs Site Record of Decision
vi
Statutory Determinations
The selected remedy meets the requirements for remedial actions set forth in Section 121 ofCERCLA, 42 U.S.C. § 9621. It is protective of human health and the environment, complieswith Federal and State applicable or relevant and appropriate requirements (ARARs) (unless astatutory waiver is justified), is cost effective, and utilizes permanent solutions and alternativetreatment technologies or resource recovery technologies to the maximum extent practicable.
The selected remedy will comply with the location-specific and action-specific ARARsidentified, as well as four of the seven chemical-specific ARARs. However, EPA is waiving theremaining three chemical-specific ARARs – the 1 ng/L total PCB federal Ambient Water QualityCriterion; the 0.12 ng/L total PCB New York State standard for protection of wildlife, and the0.001 ng/L total PCB New York State standard for protection of human consumers of fish – dueto technical impracticability. These three standards are not expected to be met because of PCBcontamination entering the Upper Hudson River from above Rogers Island (even after sourcecontrol at Hudson Falls and Fort Edward).
While the remedy will result in a long-term reduction in the mobility and volume of PCBs inthe river, it does not satisfy the statutory preference for treatment as a principal element of theremedy. EPA has determined that given the volume of material to be removed, treatment of thematerial prior to off-site disposal (other than the stabilization of the sediments for handlingpurposes) would not be cost-effective. During the remedial design or implementation, EPA willdetermine whether beneficial use (i.e., the manufacture of commercial products) is appropriatefor some portion of the dredged material.
Because the remedy will result in hazardous substances remaining on-site above levels thatallow for unlimited use and unrestricted exposure, the five-year review requirement applies tothis action. EPA will monitor PCB concentrations in the water and fish after completion of theremedy and make these data available to the public.
Public Participation
EPA has provided numerous opportunities for public participation and comment in theprocess leading up to this ROD. This included a 127 day public comment period and 11 publicmeetings on the Proposed Plan. EPA has received more than 70,000 comments, which have beenconsidered in reaching this decision. Following issuance of this ROD, EPA will continue itscommunity involvement program and will provide members of the public and elected officialsopportunity for early and meaningful input during the remedial design and implementation of thecleanup. The post-ROD community interaction program will build on the existing, extensivepublic process used for the Reassessment RI/FS. EPA will hold a series of public meetings todiscuss and take comment on a proposed post-ROD outreach program before it is finalized. This enhanced community involvement program will include opportunities for public commenton, for example, the proposed location(s) and design of sediment processing/transfer facilities;

Hudson River PCBs Site Record of Decision
vii
work hours; noise control and traffic control; other ways to minimize or mitigate possibleadverse local impacts (if any); the development of dredging performance standards; and datagathered during the first year of dredging with respect to performance standards. The programwill remain active throughout the subsequent construction and post-construction monitoringphases of the project.
ROD Data Certification Checklist
The following information is included in the Decision Summary section of this ROD. Additional information can be found in the Administrative Record for this Site.
< Remediation Goals for PCB concentrations in fish (Section 9.1) < Surface water and land use assumptions used in the baseline risk assessments and ROD
(Sections 7 and 8.1)< Risks due to PCBs under baseline conditions (Section 8)< Risks due to PCBs under the various remedial alternatives (Section 11)< Long- and short-term effects associated with the various remedial alternatives (Sections
11.3 and 11.5)< Estimated capital, operation and maintenance and total present-worth costs; and the time
to implement each of the various remedial alternatives (Sections 10.1, 11.7 and 13.2)< Findings of the Reassessment reports which support the selected remedy (Sections 6, 8
and 13.4)< How the selected remedy addresses sediments that constitute principal threats (Section
12)< Key factors that led to selecting the remedy (i.e., best balance of trade-offs with respect to
the balancing and modifying criteria) (Sections 11, 13.4 and 14)
------------------------- Recommending Signature ----------------------------------- Date Jane M. Kenny
Regional Administrator
-------------------------- Authorizing Signature ------------------------------------ Date Christine Todd Whitman
Administrator

Hudson River PCBs Site Record of Decision
1
PART 2: THE DECISION SUMMARY
1. SITE NAME, LOCATION AND BRIEF DESCRIPTION
1.1 Site Name and Location
The Hudson River PCBs Site (the “Site”) includes a nearly 200 river-mile stretch of theHudson River in eastern New York State. This federal Superfund Record of Decision (ROD)addresses the risks to people and ecological receptors associated with polychlorinated biphenyls(PCBs) in the in-place sediments of the Upper Hudson River. The United States EnvironmentalProtection Agency (EPA) identification number for the Site is NYD980763841.
The Site encompasses approximately the lower two thirds of the generally southerly flowingHudson River, from the Village of Hudson Falls (Washington County) in the north to the Batteryin New York City (New York County) in the south (Figure 1-1). The Site has traditionally beendivided into Upper Hudson River and Lower Hudson River segments based on physical andchemical characteristics such as river hydrology and PCB inventory. Reference is also made to aMid-Hudson River segment (Troy to just south of Poughkeepsie) in a number of Site reports (andthis decision document) to promote a more concise discussion of Site risks and modeling efforts.
The Site also includes five Remnant Deposits, which are areas of PCB-contaminated sediment
upstream of the location of the former Fort Edward Dam that became exposed after the waterlevel dropped following removal of the dam in 1973.
The Upper Hudson River portion of the Site extends from the Fenimore Bridge in Hudson
Falls (River Mile [RM] 197.3) to the Federal Dam at Troy (RM 153.9), a distance of just over 43river miles. The Lower Hudson River extends from the Federal Dam to the southern tip ofManhattan at the Battery in New York City (RM 153.9 to RM 0). The Mid-Hudson River, whichis primarily a subset of the Lower Hudson River, extends from the Federal Dam at Troy (RM153.9) to just south of Poughkeepsie (River Mile 63).
To facilitate effective project management and address Site complexities, the Upper HudsonRiver has been further divided into three major sections: River Sections 1, 2 and 3 (see Figure 1-2). Upstream of River Section 1 is a river segment between the Fenimore Bridge and the formerFort Edward Dam (RM 194.8), a distance of about 2.5 river miles. The Upper Hudson Riverincludes certain areas that have been and may continue to be sources of PCB contamination tothe river, including General Electric Company’s (GE’s) Hudson Falls plant and Fort Edwardplant, and Remnant Deposits 1-5. These source areas have been, are being, and/or are planned tobe addressed by response actions selected by EPA or the New York State Department ofEnvironmental Conservation (NYSDEC). Remedial actions for these areas are not the focus ofthis decision document although, as discussed later in this Decision Summary, successfulcompletion of the expected source control work near the GE Hudson Falls plant (i.e., reduction

Hudson River PCBs Site Record of Decision
2
of PCB loading to the river) is important to the full realization of the benefits of the remedialaction called for in this ROD.
River Sections 1, 2 and 3 extend from the location of the former Fort Edward Dam to theFederal Dam at Troy and are the focus of this decision document. River Section 1 consists of theThompson Island (TI) Pool. This river section extends about 6.3 miles from the former FortEdward Dam (RM 194.8) to the TI Dam at RM 188.5. The area between the former Fort EdwardDam and the northern end of Rogers Island, a distance of about 0.2 miles, contains minimal PCBcontamination and was not considered for remediation under this decision document. RiverSection 2 extends from the TI Dam to the Northumberland Dam near Schuylerville (RM 183.4),an extent of 5.1 river miles. River Section 3 extends from below the Northumberland Dam to theFederal Dam at Troy (RM 153.9), an extent of 29.5 river miles.
This ROD addresses active remediation of the in-place sediments in the Upper Hudson River. The Lower Hudson River is not being identified for active remediation in this ROD. Nevertheless, the reduced PCB load over the Federal Dam projected by the selected remedy willultimately result in reduced concentrations of PCBs in fish, sediment and water. This in turn willresult in reduced risks to humans and ecological receptors living in and near the Lower HudsonRiver from PCB contamination originating in the Upper Hudson River.
Within River Sections 1, 2 and 3 of the Upper Hudson River, Site delineation activities havebeen undertaken. Field investigatory activities by NYSDEC have identified depositional hot spotareas (where average total PCB concentrations in sediment of 50 parts per million or greater areknown to exist) and other areas with fine-grained sediment, which characteristically has higherPCB concentrations. In addition, modeling has been utilized to provide an integrated picture ofsediment concentrations throughout the three river sections.
Floodplain soils have been documented to contain PCBs. However, the purpose of theReassessment RI/FS was to determine the appropriate course of action for the contaminatedsediment in the Upper Hudson River. An investigation of the floodplains and other areasexternal to the river (i.e., historical dredge spoil disposal areas along the Upper Hudson River)was not included in the scope of the Reassessment RI/FS and is not addressed in this ROD. Inthe Upper Hudson River area, limited data also show low PCB uptake in forage crops, non-detectPCB levels in cow milk, and minimal risks via ingestion of foods other than Hudson River fish. Concerns related to possible exposure of residents and ecological receptors to PCBcontamination in the floodplains will be further evaluated concurrent with the design phase ofthis project in coordination with New York State.
1.2 Brief Description
The predominant sources of PCB contamination to the Upper Hudson River were twocapacitor manufacturing plants owned and operated by GE. The plants are located adjacent to ornear the Hudson River in the Village of Hudson Falls and the Town of Fort Edward. Over a 30-

Hudson River PCBs Site Record of Decision
3
year period, the plants discharged (including direct pipeline discharge) a substantial amount ofPCBs into the river. At the GE Hudson Falls plant, leakage of non-aqueous phase PCB-bearingoils through bedrock to the river continues to be a source of PCB contamination. Regarding theformer outfall to the Hudson River (Outfall 004) from the GE Fort Edward plant, NYSDECissued a Record of Decision in January 2000 that calls for the excavation of PCB-contaminatedsoil and sediment in this area of the Upper Hudson River shoreline in order to eliminate thissource of PCBs to the river. EPA’s analysis assumes a significantly reduced PCB loading to theriver from these sources once the State’s plans for remediation are implemented.
PCBs, the chemicals of concern addressed in this decision document, have been classified byEPA as probable human carcinogens. They are also linked to other serious non-cancer adversehealth effects based on observations in animals and emerging evidence in humans.
Once discharged from the GE plants, the PCBs adhered to river sediment and accumulateddownstream as they settled in impounded pools and other depositional areas. Historic fish andsediment data indicated PCBs were accumulating downstream of the old Fort Edward Dam aswell as accumulating behind the dam. The removal of the dam in 1973 resulted in aremobilization and downstream distribution of PCBs that had accumulated behind the dam. Historically, the highest PCB sediment concentrations have been detected in the cohesivesediments (fine grained sands, silts and clays) within the Upper Hudson River. Riverscouring/erosion and other mechanisms have mobilized PCB-contaminated sediments from theextensive cohesive deposits, redepositing them farther downstream all the way to the Battery(i.e., New York Harbor). The preponderance of data indicate that burial of contaminatedsediment by cleaner materials is not universally or uniformly occurring. Data also indicate thatcontaminated sediments in River Sections 1, 2 and 3 continue to serve as the major source ofPCBs to the water column and the fish within the Upper Hudson River.
1.3 Lead Agency/Funding Information
The United States Environmental Protection Agency is the lead agency for this project. TheState of New York, by the Department of Environmental Conservation, which is the supportagency for this project, concurs with EPA’s decision for this project. The United StatesDepartment of Interior (Fish and Wildlife Service) and the United States Department ofCommerce (National Oceanic and Atmospheric Administration), which are federal trustees ofnatural resources, and the New York State Attorney General also support an activeenvironmental dredging remedy.
The remedial action selected by this document is expected to be funded by GE, or by EPA(using Superfund monies) and the State of New York.

Hudson River PCBs Site Record of Decision
4
2. SITE HISTORY AND ENFORCEMENT ACTIVITIES
2.1 Site History
During an approximate 30-year period ending in 1977, GE used PCBs in its capacitormanufacturing operations at its Hudson Falls and Fort Edward, New York facilities. PCB oilswere discharged both directly and indirectly from these plants into the Hudson River. Thisincluded both non-permitted and permitted discharges. Even after GE received a permit in 1975,permit exceedances occurred. Estimates of the total quantity of PCBs discharged directly fromthe two plants into the river from the 1940s to 1977 are as high as 1,330,000 pounds (about605,000 kg).
Many of the PCBs discharged to the river adhered to sediments and accumulated with thesediments as they settled in the impounded pool behind the Fort Edward Dam, as well as otherdepositional areas farther downstream. Because of its deteriorating condition, the Fort EdwardDam was removed in 1973. Five areas of PCB-contaminated sediments were exposed due to thelowering of the river water level when the Fort Edward Dam was removed. These five areas areknown as the Remnant Deposits. During subsequent floods, PCB-contaminated sediments fromthe Fort Edward Dam area were scoured and transported downstream.
2.2 Actions to Date
The sediments of the Upper Hudson River were surveyed by NYSDEC in 1976-1978 and1984. Areas with average total PCB concentrations of 50 parts per million (ppm) or greater wereidentified and are known as the NYSDEC-defined PCB “hot spots.” There were 40 NYSDEC-defined hot spots, located between RM 194 at Rogers Island and Lock 2 at RM 163. Hot Spots 1through 4 were dredged by New York State for navigational purposes in the 1970s.
Legal action brought against GE by NYSDEC in 1975 resulted in a $7 million program for theinvestigation of PCBs and the development of methods to reduce or remove the threat of PCBcontamination. In 1975, the NYSDOH began to issue health advisories recommending thatpeople limit their consumption of fish from the Hudson River. In 1976, NYSDEC issued a banon all fishing in the Upper Hudson River from Hudson Falls to the Federal Dam at Troy, due tothe potential risks from consuming PCB-contaminated fish. A ban on most commercial fishing,including commercial fishing of striped bass, was issued for the Lower Hudson River. NYSDECreplaced the ban against fishing in the Upper Hudson River with catch-and-release fishingrestrictions in 1995. NYSDOH continues to recommend that people eat none of the fish from theUpper Hudson River, that children under the age of 15 and women of child-bearing age eat noneof the fish from the river for the entire 200 mile length of the Superfund site, and that the generalpopulation eat none of most species of fish caught between the Federal Dam at Troy and Catskill.The commercial striped bass fishery, as well as commercial fishing for eight other species in theLower Hudson River, is still closed. The striped bass fishery has been closed for approximately25 years.

Hudson River PCBs Site Record of Decision
5
In 1974, the New York State Department of Transportation (NYSDOT) dredgedapproximately 250,000 cubic yards of PCB-contaminated sediment in the vicinity of RogersIsland for navigational purposes. The dredged materials were placed in a disposal area known asSpecial Area 13, which is located along the west bank of the river just south of Rogers Island. Another approximately 380,000 cubic yards of sediment were dredged from the east and westchannels in 1974 and 1975 and disposed of in the Old Moreau Dredge Spoil Area, located on thewest shore of the river opposite the southern end of Rogers Island and north of Special Area 13.
In 1977, the manufacture and sale of PCBs within the United States were generally prohibitedunder provisions of the Toxic Substances Control Act (TSCA). Although commercial uses ofPCBs ceased in 1977, GE’s Fort Edward and Hudson Falls plants continue to contaminate theHudson River with PCBs, due primarily to releases of PCBs via bedrock fractures from the GEHudson Falls plant.
About 14,000 cubic yards of highly-contaminated sediments were removed by NYSDEC fromRemnant Deposit 3A in 1978 and were placed in a secure encapsulation site in Moreau, alongwith some 215,000 cubic yards of sediment that had been dredged by NYSDOT from the eastchannel of Rogers Island to clear the navigation channel just below the location of the formerFort Edward Dam. Unstable river banks of two of the Remnant Deposits were reinforced at thattime. Three remnant sites were re-vegetated to prevent public contact with the sediments and tominimize erosion and release of PCBs into the environment.
No navigational dredging has occurred in the Upper Hudson River since 1979, except forremoval of coarse sediments that periodically accumulate at the mouth of the Hoosic River, atributary that empties into the Hudson River at RM 167.5 near Schaghticoke. In addition, GEconducted remedial dredging in the area upstream of the Baker’s Falls dam, adjacent to the GEHudson Falls plant in 1997 and 1998.
The Site was proposed for inclusion on the National Priorities List (NPL) in September 1983and formally listed in September 1984.
In 1984, EPA completed a Feasibility Study (FS) and issued a ROD for the Site. EPArecognized that PCB contamination in the Upper Hudson River sediments was a problem, butselected an interim No Action remedy for the contaminated sediments because, in the Agency’sview, the reliability and effectiveness of remedial technologies available at that time wereuncertain and there were downward trends of PCBs in fish, sediment, and water at the time. (More recent data show that this downward trend has not continued.) The 1984 ROD did notaddress the PCB-contaminated oil leaking through bedrock in the vicinity of the GE HudsonFalls plant, which was not known to EPA at the time. The 1984 ROD contained the followingcomponents:
• An interim No Action decision with regard to PCBs in the sediments of the UpperHudson River;
Hudson River PCBs Site Record of Decision
6
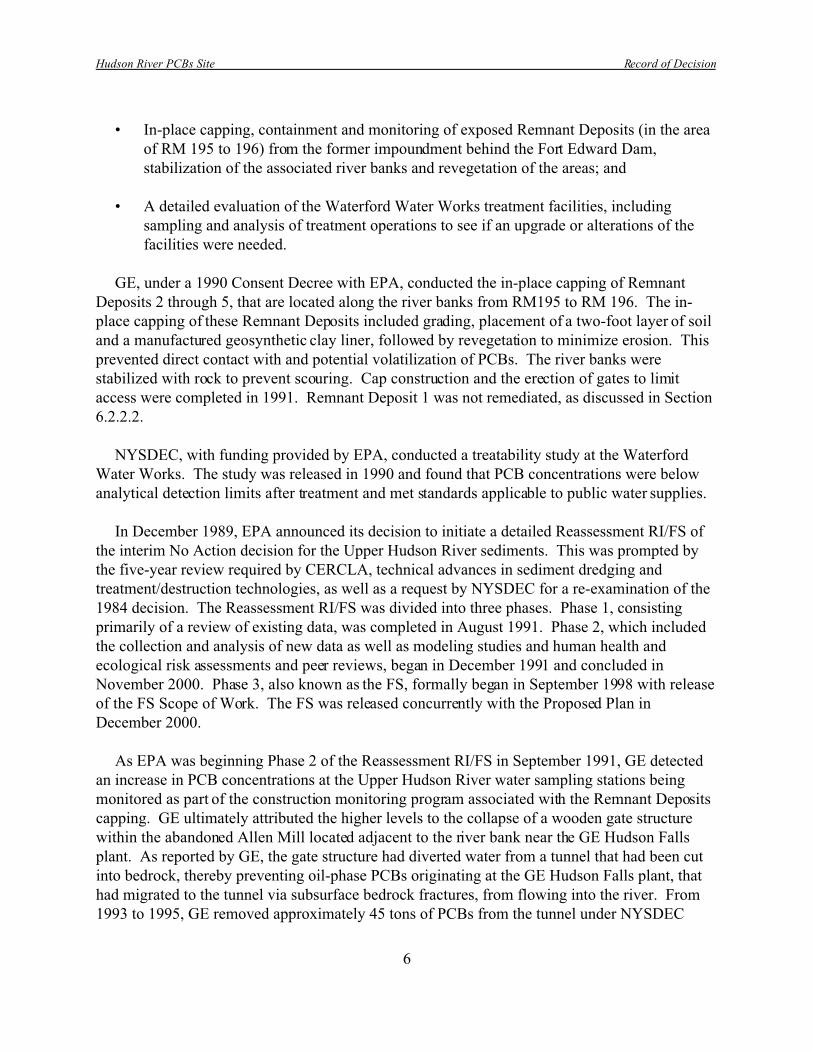
• In-place capping, containment and monitoring of exposed Remnant Deposits (in the areaof RM 195 to 196) from the former impoundment behind the Fort Edward Dam,stabilization of the associated river banks and revegetation of the areas; and
• A detailed evaluation of the Waterford Water Works treatment facilities, includingsampling and analysis of treatment operations to see if an upgrade or alterations of thefacilities were needed.
GE, under a 1990 Consent Decree with EPA, conducted the in-place capping of RemnantDeposits 2 through 5, that are located along the river banks from RM195 to RM 196. The in-place capping of these Remnant Deposits included grading, placement of a two-foot layer of soiland a manufactured geosynthetic clay liner, followed by revegetation to minimize erosion. Thisprevented direct contact with and potential volatilization of PCBs. The river banks werestabilized with rock to prevent scouring. Cap construction and the erection of gates to limitaccess were completed in 1991. Remnant Deposit 1 was not remediated, as discussed in Section6.2.2.2.
NYSDEC, with funding provided by EPA, conducted a treatability study at the WaterfordWater Works. The study was released in 1990 and found that PCB concentrations were belowanalytical detection limits after treatment and met standards applicable to public water supplies.
In December 1989, EPA announced its decision to initiate a detailed Reassessment RI/FS ofthe interim No Action decision for the Upper Hudson River sediments. This was prompted by the five-year review required by CERCLA, technical advances in sediment dredging andtreatment/destruction technologies, as well as a request by NYSDEC for a re-examination of the1984 decision. The Reassessment RI/FS was divided into three phases. Phase 1, consistingprimarily of a review of existing data, was completed in August 1991. Phase 2, which includedthe collection and analysis of new data as well as modeling studies and human health andecological risk assessments and peer reviews, began in December 1991 and concluded inNovember 2000. Phase 3, also known as the FS, formally began in September 1998 with releaseof the FS Scope of Work. The FS was released concurrently with the Proposed Plan inDecember 2000.
As EPA was beginning Phase 2 of the Reassessment RI/FS in September 1991, GE detectedan increase in PCB concentrations at the Upper Hudson River water sampling stations beingmonitored as part of the construction monitoring program associated with the Remnant Depositscapping. GE ultimately attributed the higher levels to the collapse of a wooden gate structurewithin the abandoned Allen Mill located adjacent to the river bank near the GE Hudson Fallsplant. As reported by GE, the gate structure had diverted water from a tunnel that had been cutinto bedrock, thereby preventing oil-phase PCBs originating at the GE Hudson Falls plant, thathad migrated to the tunnel via subsurface bedrock fractures, from flowing into the river. From1993 to 1995, GE removed approximately 45 tons of PCBs from the tunnel under NYSDEC

Hudson River PCBs Site Record of Decision
7
jurisdiction. In 1994, GE documented the presence of PCB-contaminated oils in bedrock seepsat Bakers Falls adjacent to its Hudson Falls plant. GE has instituted a number of mitigationefforts that have resulted in a decline, but not cessation, of PCBs entering the river through theseeps.
In 1998, EPA conducted an evaluation of whether an early response action to addresscontaminated sediments in the Thompson Island Pool would be warranted prior to completion ofthe Reassessment RI/FS. This evaluation was prompted by findings of the Low ResolutionSediment Coring Report, in which EPA determined that there were statistically significant lossesof PCBs from the sediment to the water column. EPA decided in December 1998 that nofeasible and appropriate interim action was available, and EPA would complete theReassessment RI/FS as planned.
Historical use of Rogers Island for staging and disposal of PCB-contaminated dredge spoils in
the late 1970's presented an environmental concern. This concern was prompted by historicalreports and information received by the NYSDEC from a citizen alleging that PCB-contaminated soils were being spread on the Island. In October 1998, EPA initiated anevaluation of the extent of PCB-contaminated soils to determine if health concerns existed for theresidents of the island. EPA’s sampling results indicated that surface soils on Rogers Islandwithin the floodplain of the Hudson River were contaminated with PCBs and lead. Based on adirect contact human health concern, between June and December of 1999, a total of 4,440 tonsof contaminated soil were excavated from nine Rogers Island properties and disposed of off-site(3,530 tons of PCB-contaminated soil were removed during this action). Backfilling with cleanmaterials and the installation of erosion controls followed the excavation activities.
The GE Fort Edward plant Outfall 004 has also been a source of PCBs to the river. In January2000, NYSDEC signed a Record of Decision that called for removal of PCB-contaminated soilsand sediments near Outfall 004. NYSDEC is currently undertaking the Remedial Design of thatremedy.
2.3 Enforcement Activities
EPA notified GE of the remedy selected in the 1984 ROD and offered the company theopportunity to implement the selected remedy with respect to the Remnant Deposits and theWaterford drinking water supply evaluation. GE declined EPA’s offer. NYSDEC, with fundingprovided by EPA, conducted the evaluation at the Waterford Water Works. In addition,NYSDEC prepared a design for the in-place containment of the Remnant Deposits. This designwas completed in 1988.
In March 1989, GE offered to assume responsibility for the implementation of the in-placecontainment remedy for the Remnant Deposits. EPA issued a September 27, 1989Administrative Order on Consent to GE which required the company to prepare a remedialdesign report for the construction of access roads to the Remnant Deposits and to submit a design

Hudson River PCBs Site Record of Decision
8
for the in-place containment of the Remnant Deposits incorporating the NYSDEC-prepareddesign, plus any EPA-approved refinements to that design. EPA also issued a September 27,1989 Administrative Order to GE requiring the company to construct and maintain the accessroads to the Remnant Deposits. GE constructed the in-place containment of the RemnantDeposits under a 1990 Consent Decree with EPA. EPA will evaluate the need for furtherremedial action for the Remnant Deposits after completion of a 5-year review of the RemnantDeposit containment remedy, performed pursuant to CERCLA §121(c). See further discussionof the Remnant Deposits in Section 6.2.2.2 below.
The GE manufacturing plants in Hudson Falls and Fort Edward are listed under the New YorkState Inactive Hazardous Waste Disposal Sites Remedial program. GE currently is conductingremedial activities near the GE Hudson Falls and Fort Edward plants pursuant to Orders onConsent with NYSDEC. GE has thus far declined to implement the January 2000 NYSDECRecord of Decision for the Fort Edward plant Outfall 004. The NYSDEC is conducting theremedial design for that ROD.
3. COMMUNITY/PUBLIC PARTICIPATION
3.1 Public Participation
Community/public participation activities to support selection of the remedy were conductedin accordance with CERCLA § 117 and the NCP Section 300.430(f)(3). The Hudson RiverPCBs Reassessment RI/FS was unique from a community/public participation standpoint. TheSite, whose boundaries encompass rural, suburban and metropolitan areas in 14 differentcounties in the State of New York, as well as portions of New Jersey, draws a large and diversepopulation for recreational, commercial, industrial, and cultural reasons. The Site generatedenormous public interest based on this diversity, the Site history and its geographic extent.
To provide the maximum opportunity for all interested parties to participate in the project,EPA employed both customary and expanded approaches. First, EPA provided for extensivecommunity/public participation and kept citizens, government officials, environmental groups,and private interest groups aware of and updated on each step of the Reassessment RI/FS processthrough personal communications, the distribution of fact sheets and press releases, andnumerous public meetings. Also, a Technical Assistance Grant, which provides funding foractivities to help the community located along the Hudson River understand the technical detailsof the Reassessment RI/FS and participate in the decision-making process, was issued to theenvironmental group, Scenic Hudson, Inc. In addition, EPA established a CommunityInteraction Program (CIP), a description of which follows.
EPA established and maintained 16 Information Repositories, located in public buildingsfrom Glens Falls to New York City, and placed copies of the Reassessment RI/FS reports intothese repositories. Many of the reports are also available on the internet at EPA’s website for theSite (www.epa.gov/hudson). EPA held more than 75 public meetings during the course of the

Hudson River PCBs Site Record of Decision
9
Reassessment RI/FS. EPA also responded to public comment on the Reassessment RI/FS reportsand has placed these Responsiveness Summaries in the Information Repositories. In addition,peer reviews were held in which panels of independent experts reviewed and commented onEPA’s Reassessment RI/FS reports. The public was invited to attend the peer review meetingsand to provide comment. Responses to peer review comments were also developed. In addition,the Administrative Record file, including the Reassessment RI/FS reports, the ResponsivenessSummaries, the Feasibility Study and the Proposed Plan, was made available to the public. These documents were made available at the Crandall Public Library in Glens Falls, theAdriance Memorial Library in Poughkeepsie and the EPA Superfund Records Center in NewYork City.
The Proposed Plan was released for public comment on December 12, 2000. Due to severalrequests by the public, the comment period, originally intended to conclude on February 16,2001, was extended to April 17, 2001. During the comment period, a total of 11 public meetingswere held to provide the public with information on the preferred remedy and receive publiccomments. There were approximately 5,000 people who attended the public meetings. Meetingswere held in Saratoga Springs (December 2000), Poughkeepsie (December 2000, January 2001),New York City (January 2001), Albany (February 2001), Hudson Falls (February 2001),Haverstraw (February 2001), Newburgh (April 2001), Troy (April 2001), Queensbury (April2001), and Saddle Brook, New Jersey (March 2001). EPA also held a number of meetings withpublic officials concerning the Proposed Plan.
3.2 Community Interaction Program
The CIP, entirely unique to the Reassessment RI/FS, is based on the community relationsplan, and consisted of a three-tiered committee structure starting with four community-levelliaison groups (Agricultural, Citizen, Environmental and Governmental). The CIP began in early1991. This program provided expanded and systematic opportunities for all interested parties toparticipate in the project. The Steering Committee, the Hudson River PCB Oversight Committee(HROC), and the Scientific & Technical Committee (STC) also were established. AllReassessment RI/FS reports were sent to these groups for review and were made available toother members of the public interested in the Site. Comments received during the meetings andfrom written submissions were considered in the deliberative process that led to the ProposedPlan.
The Steering Committee, HROC and STC included representatives from the Liaison Groups,
NYSDEC, NYSDOH, EPA (including the Project Managers, Community Relations Coordinator,and Deputy Director of Region 2's Superfund Division), GE, and researchers and scientistsfamiliar with the Site, PCBs, modeling, toxicology and other relevant disciplines. EPA considersthe STC to constitute peer input but not peer review. (See Section 5.0 below for a discussion ofpeer review conducted for the Site). More detailed information on the CIP can be found in theCommunity Relations Plan for the Hudson River PCBs Reassessment RI/FS. EPA’s

Hudson River PCBs Site Record of Decision
10
implementation of the CIP is consistent with the NRC recommendation that all affected partiesand communities should be involved early and actively in the process.
As is discussed in Section 13.3, during design and implementation of the remedy EPA willlimit, to the maximum extent practicable, adverse impacts to local communities. Through thecommunity interaction program, EPA will further discuss with the public and State and localgovernmental bodies the potential for adverse impacts; where negative impacts might occur,EPA will seek to mitigate them during design and remedial implementation.
4. SCOPE AND ROLE OF RESPONSE ACTION
The primary objective of this response action is to address the risks to human health and theenvironment due to PCBs in the in-place sediments of the Upper Hudson River. PCBconcentrations remain elevated in the Hudson River in the sediments, in the water column and inthe fish. PCB concentrations (averages) associated with the Site in all three media generallydecrease with distance down river. Removal of the PCB-contaminated sediments will result inreduced PCB concentrations in fish tissue, thereby accelerating the reduction in potential futurehuman health and ecological risks. In addition, by addressing the sediments, the remediation willcontrol a source of PCBs to the water column, which contributes to fish tissue concentrations andtransports PCBs downstream.
The Reassessment RI/FS focused primarily on the approximately 40 river miles from thenorthern end of Rogers Island to the Federal Dam at Troy. While the Superfund Site covers boththe Upper and the Lower Hudson River, the Reassessment FS evaluates options to address thePCB-contaminated sediments of the Upper Hudson River only, as this portion contains all of thehistorical PCB hot spots. The Upper Hudson River was also the focus of the 1984 ROD.
The selected remedy recognizes that source control measures are already in place near the GEHudson Falls plant and assumes reasonable further reductions in PCBs entering the river throughbedrock at Bakers Falls near the GE Hudson Falls plant, as a result of the implementation ofadditional source control measures by GE under NYSDEC authorities. Successful completion ofthe source control near the GE Hudson Falls plant is important to the full realization of thebenefits from the remedial action called for in this ROD. In addition, NYSDEC issued a Recordof Decision in January 2000, which calls for source control measures for the Fort Edward plantOutfall 004 in order to eliminate this source of PCBs to the river.
5. PEER REVIEW
To ensure the credibility of the scientific work conducted during the Reassessment RI, EPAutilized both forms of peer involvement: peer input and peer review. Peer input was conductedthrough internal Agency reviews, reviews by other agencies, and STC reviews of ReassessmentRI reports. Peer review was conducted in accordance with EPA guidance, as outlined in the PeerReview Handbook (dated December 1998, updated December 2000). The peer review was

Hudson River PCBs Site Record of Decision
11
conducted by independent experts who were unaffiliated with EPA, NYSDEC or GE, and wasundertaken on the major scientific works that form the basis for this decision.
Five separate peer review panels were convened. The review process consisted of individualreview by each of the six or seven panel members, followed by a panel discussion which wasopen to the public. Public comments were accepted during this process. The Reassessment RIreports reviewed were the October 1996 Preliminary Model Calibration Report, the geochemistryreports (the February 1997 Data Evaluation and Interpretation Report and the July 1998 LowResolution Sediment Coring Report), the August 1999 Human Health Risk Assessment, theAugust 1999 Ecological Risk Assessment and the January 2000 Revised Baseline ModelingReport. Each peer review panel was asked to address specific questions, together called the“charge,” regarding the report being reviewed and controversial issues that were identified byEPA and the public prior to and during the peer review meeting. In addition, the panels wereinvited to address any other issues that were not specifically identified in the charge. The publicwas invited to submit proposed charge questions and to attend and make comments at each of thefive peer review meetings.
The peer reviewers generally agreed with the findings and conclusions of the reports, althoughthey also requested revisions (including extensive revisions to the Ecological Risk Assessment). EPA issued Responses to Peer Review Comments for each of the peer reviews.
The following summarizes some of the major findings of each of the panels:
• Modeling Approach - The reviewers recommended changes to the sediment transportalgorithms and the use of a mechanistic bioaccumulation model.
• Geochemistry reports - The reviewers agreed that the river is a dynamic system and thatsequestration of PCBs through burial is not widespread. They agreed that there was aloss of PCB inventory from the sediments of the Thompson Island Pool, although theybelieved that it was important to express the percentage of loss as a range rather than as asingle number so that the uncertainty in the estimate was more apparent. Theyrecommended that multivariate statistical analyses be conducted.
• Revised Baseline Modeling Report - The reviewers agreed that the model calibration fitthe data, but that the uncertainties in the model forecasts should be acknowledged.
• Human Health Risk Assessment - The reviewers agreed that there is an unacceptablehuman health risk in the Upper Hudson River from consumption of fish. They recommended that EPA address fetal and infant exposure and provide further discussionon uncertainties. EPA issued a Revised Human Health Risk Assessment, whichincorporates all changes made to address the peer review comments.

Hudson River PCBs Site Record of Decision
12
• Ecological Risk Assessment - The reviewers heavily criticized the report, especially withrespect to the lack of site-specific field studies. EPA issued a Revised Ecological RiskAssessment, which incorporates all changes made to address the peer review comments. (Subsequent to the issuance of the Revised Ecological Risk Assessment, NYSDECreleased data from recent collections of Upper Hudson River mink and otter that werefound to have PCB body burdens at levels where harmful effects would be expected,which is consistent with the conclusions of the Revised Ecological Risk Assessment.)
In the FS, EPA considered the results of the peer review in evaluating remedial alternatives. EPA utilized peer involvement on the evaluation of alternatives and the identification of thepreferred alternative through review by the Agency’s National Remedy Review Board (NRRB). The NRRB’s recommendations and EPA Region 2's responses are set forth in Agencymemoranda that were issued in December 2000 and January 2001, respectively.
EPA will establish an additional independent external peer review panel of scientific expertsto review the dredging resuspension, PCB residuals and production rate performance standardsand the attendant monitoring program, as well as the report prepared after the first phase ofdredging that will evaluate the dredging with respect to these performance standards.
6. SITE CHARACTERISTICS
6.1 Conceptual Site Model
The conceptual site model for the Hudson River PCBs Site describes the source to receptorsuccession in simple terms and identifies the major contamination sources, contaminant releasemechanisms, secondary sources, and pathways and receptors of concern (see Figure 6-1). Thedesign of field investigations and human and ecological risk assessments reflect the basiccomponents of the conceptual site model.
In the conceptual site model, PCBs are released from two GE capacitor plants located adjacentto the Upper Hudson River in the towns of Hudson Falls and Fort Edward. The major releasemechanism is the direct discharge of PCB oils into the river. Five Remnant Deposits (sediments)also exist, along with other lesser sources of PCBs up-river and down river that contribute to theoverall PCB load in the Hudson River.
Once introduced into the river, the PCBs adhere to sediments, with some fraction beingcarried in the water column. Physical, chemical and biological release mechanisms allow PCBsin the sediment to be available for redistribution and be a source of PCB contamination to thewater column. The sediments will continue to release contamination to the water column andbiota, through aquatic and benthic food chains, as well as other not easily modeled processessuch as boat scour, ice rafting, and bioturbation, unless they are managed or remediated in somemanner.

Hudson River PCBs Site Record of Decision
13
Because the river is a dynamic system with variable energy regimes, the PCB-laden sedimentsare not sequestered or stable. Some PCB-contaminated sediment is buried by deposition ofcleaner sediments at times, but in other places and at other times the sediments are redistributed. This redistribution may be local or more regional depending on the energy of flow events and/orphysical type or size of the sediment particles. The redistributed sediments releasecontamination to the water column and high flow events (e.g., floods) further increase thebioavailability of contaminants to organisms in the water column. Scouring during high flowevents is also considered an important release mechanism.
The conceptual site model shows that the fish ingestion pathway is a completed exposureroute for the Site. Receptors include humans (anglers and their families), piscivorous (fisheating) fish, piscivorous birds (including threatened and endangered species) and mammals. Additional information on the human and ecological receptor populations is provided in the risksection (Section 8) of this document.
6.2 Results of the Reassessment Remedial Investigation
This section presents a summary of the Reassessment RI. Detailed discussions of the RIfindings are found in the December 2000 Reassessment FS and associated documents.
6.2.1 Site Overview
The Hudson is a large river with both fresh and estuarine waters that has been contaminatedwith PCBs for more than 50 years. The Upper Hudson River portion considered for sedimentremediation includes variations in hydrology and river bed geology, which create a complexenvironmental setting with varying levels of PCB contamination.
6.2.1.1 Hydrology
The Upper Hudson River is entirely freshwater and non-tidal. The annual mean flow of theHudson River at Fort Edward is approximately 4,800 cubic feet per second (cfs). Downstream ofFort Edward, the river is joined by several tributaries, the largest of which are the Batten Kill, Fish Creek, and the Hoosic River. The combined total of the tributaries significantly increasesthe flow of the Upper Hudson by the time it reaches Waterford, where the mean annual flow ofthe river is approximately 8,400 cfs. According to the U.S. Geological Survey (USGS), at itsconfluence with the Mohawk River (RM 156), the river flow reaches an annual average of12,300 cfs.
The flow in the Upper Hudson River is primarily controlled by several reservoirs above GlensFalls, including the Great Sacandaga Lake. It is expected that minimum average daily flow atFort Edward will be maintained in the range of 1,500 cfs to 4,000 cfs, depending on conditions atthe Great Sacandaga Lake. In addition, there are eight dams with locks in the portion of theUpper Hudson River that was considered in the Reassessment RI/FS. The locks and dams form a

Hudson River PCBs Site Record of Decision
14
series of pools in the river. The flow in the Upper Hudson River is controlled by these dams, andto a lesser degree, by wetlands and backwaters in the vicinity of the river, which act as a bufferfor high and low flow conditions.
The mean gradient of the river between Fort Edward and the Federal Dam at Troy is aboutthree feet per mile. The gradient within each pool is much smaller than the mean gradient, withmajor elevation drops between the pools at the dams. The width of the Upper Hudson aboveLock 4 in Stillwater is approximately 400 feet. The Upper Hudson has an average depth of lessthan 8 feet in the shoal areas and approximately 18 feet in the channel, with a maximum depth ofmore than 45 feet in a section (western branch) below the TI Dam. The total surface area of theUpper Hudson is approximately 3,900 acres.
The Champlain Canal is coincident with portions of the Hudson River, extending fromWaterford (RM 158) on the Hudson to Whitehall at the southern end of Lake Champlain. TheChamplain Canal is 60 miles long, including 37 miles of channel in and along the Hudson Riverfrom Waterford to Fort Edward, and 23 miles of land-cut sections. The canal diverges from theriver at Fort Edward just below Lock 7 and proceeds in a northeasterly direction to LakeChamplain. Land cut areas exist at Stillwater, Northumberland, and Fort Miller. The portion ofthe river from Waterford to the Federal Dam is considered part of the Erie Canal.
6.2.1.2 River Bed Geology
Sediments of the Upper Hudson have been extensively investigated during Phase 2 of theReassessment RI/FS, including a geophysical investigation consisting of side-scan sonar,bathymetric soundings, and sub-bottom profiling. Plates 6-1 through 6-7 provide sedimenttexture classification maps for the Upper Hudson (RM 194.8 to 153.9) including areas withcohesive sediments and PCB hot spot areas.
Evaluation of sonar images and other data suggest that sediment distribution patterns arelocally complex (i.e., nonhomogeneous areas of deposition and scour exist along with variabilityof sediment grain size).
Bedrock, cut away to form the Champlain Canal, is exposed in some areas, while lacustrinesilts and clays of glacial age are exposed in other areas. Coarser-grained sediments are oftenobserved in the channel while finer sediments are more common in shallow water. Wood chipsfrom prior pulp and paper industry dumping upstream of the former Fort Edward Dam arepresent in surface sediments in many locations. Sediment mounds created by historic disposal ofdredged spoils in the river are still found at some locations. PCB hot spots previously defined bythe NYSDEC are generally coincident with areas of fine-grained sediments, including silts andclays, where suspended matter with a high affinity for PCBs is most likely to settle. Channelmaintenance dredging has removed substantial portions of Hot Spots 1 through 4, located in thechannels around Rogers Island, although deposition of PCBs from upstream since that time hasmost likely recontaminated some areas.

Hudson River PCBs Site Record of Decision
15
Sediment texture classifications were also reported in the 1984 NYSDEC sediment survey of
the Thompson Island Pool. These classifications, based on an average of grab and core samples,indicated a composition of about 37 percent gravel, 26 percent fine sands, 11 percent fine sandwith wood chips, 9.4 percent clay, 5.4 percent coarse sand, and the remainder consisting of othertypes (including combinations of the listed types, such as “gravel with wood chips” and “finesand and gravel”).
6.2.1.3 Wetlands and Floodplains
Both federal and State freshwater wetlands exist throughout the Upper Hudson region.Wetlands along the Upper Hudson River are identified on U.S. Fish and Wildlife ServicesNational Wetland Inventory maps and NYSDEC wetland maps. The 100-year floodplains of theUpper Hudson and tributaries are shown on Flood Insurance Rate Maps prepared by the FederalEmergency Management Agency (FEMA). The width of the 100-year floodplain extends up to5,000 feet in the vicinity of the Upper Hudson River. Areas adjacent to the Upper Hudson Riverinclude forested shoreline wetlands, transitional uplands, and vegetated backwaters such asemergent marsh and scrub-shrub wetlands.
6.2.1.4 Archaeological, Historic, and Cultural Resources
The Upper Hudson River has been an important source of energy, natural resources, andtransportation to the region from prehistoric time to the present. During the thousands of yearsfollowing the final northerly retreat of the Wisconsin Glacier approximately 14,000 years ago,the river and its drainages gradually transformed the landscape, providing a rich habitat andsupporting a substantial prehistoric population.
The Hudson Valley has figured prominently in the historical and cultural development of theUnited States. The valley was home to Native Americans from the mid-1400s to approximately1600. Following Henry Hudson’s exploration up the Hudson River in 1609, looking for a quickpassage to China for the Dutch East India Company, the area was heavily settled by the Dutch.From the 17th through 19th centuries, this region was gradually settled by European immigrantswho cleared more of the land, established towns, and built a variety of industries along the river. Efforts to maximize the industrial use of the river led to the construction of locks, dams, gates,channels, and related structures.
During the French and Indian War and the American Revolution, the Hudson River oftenproved to be of vital logistical importance and was the site of numerous military engagements. The Revolutionary War Battle of Saratoga fought along the Hudson River in 1777 was won bythe Americans and led to the French alliance and eventual victory and independence. Thefoundry at West Point supplied cannons and munitions to the Union forces during the Civil War.

Hudson River PCBs Site Record of Decision
16
The 60-mile (96.5-km) Champlain Canal was completed in 1825. This canal linked the UpperHudson River at Troy, New York with the southern end of Lake Champlain at Whitehall, NewYork. During the heyday of the Champlain Canal, between 1825 and the early 20th century,thousands of canal boats passed between Lake Champlain and the Hudson River, transportingraw materials and finished products.
In 1998, the Hudson River was federally designated an American Heritage River because ofits important role in American history and culture. This designation rendered it eligible fortechnical assistance in achieving natural resource and environmental protection, economicrevitalization, and historic and cultural preservation.
EPA has prepared a Phase 1A Cultural Resources Assessment in order to initiate substantivecompliance with Section 106 of the National Historic Preservation Act with respect to theselected remedy. EPA’s assessment is included as an appendix to the Responsiveness Summary. EPA has identified a number of previously surveyed cultural resources that are either listed onthe National Register of Historic Places, or have been determined to be National Registereligible, and that are located within 2,000 feet of the banks of the Upper Hudson River. EPA hasalso identified cultural resources within this area that have been previously identified but not yetevaluated for their eligibility on the National Register. In addition, there is a potential foradditional cultural resources (both historic architectural resources and archaeological sites) to belocated either in the immediate vicinity of the remediation areas, or buried within the riversediments. These potential additional resources have not yet been identified, surveyed orevaluated.
6.2.2 Summary of Sampling Results
For the Reassessment RI/FS, EPA used data collected during its own sampling investigations,as well as data collected by many other agencies, institutions, and GE. The investigationsinclude sediment surveys, river flow and water quality investigations, fish and biota sampling,and air monitoring.
6.2.2.1 Nature of Contamination
The contaminants studied in the Reassessment RI/FS are, by definition, polychlorinatedbiphenyls. PCBs consist of a group of 209 distinct chemical compounds, known as congeners,that contain one to ten chlorine atoms attached to a biphenyl molecule, with the generic formulaof C12H(10-x)Cl x, where x is an integer from one to ten. Homologue groups are identified based onthe number of chlorine atoms present. For example, monochlorobiphenyls contain one chlorineatom, dichlorobiphenyls contain two chlorine atoms, and trichlorobiphenyls contain threechlorine atoms. Some PCB congeners are structurally and mechanistically similar to dioxin(sometimes called dioxin-like PCBs).
Hudson River PCBs Site Record of Decision
17
Commercially manufactured PCBs consisted of complex mixtures of congeners, known undervarious trade names. The PCBs utilized by GE were manufactured by Monsanto Corporation,the company that manufactured 95 percent of the PCBs sold in the US. These PCBs weremarketed under the general trade name “Aroclors.” About 140 to 150 different congeners havebeen identified in the various commercial Aroclors, with about 60 to 90 different congenerspresent in each individual Aroclor.
Detailed information on the analysis of PCBs, measurement of PCBs and chemical, physical,biological and toxicological properties of PCBs may be found in the FS and other Reassessmentreports. Aroclor quantitation methods have changed over time. These changes have implicationsfor the interpretation of historical trends in the data and the development of statisticalrelationships. Further, the 1984 NYSDEC PCB data are reported on a concentration basis asppm (parts per million or milligram per kilogram [mg/kg] or microgram per gram [:g/g]) insediment on a dry-weight basis. For mass estimation, these concentrations must be converted bymultiplying by the sediment density. Summing mass in the vertical dimension (i.e., at depth)yields mass per unit area (MPA) (See Figure 10-1). Mass units are additive (unlikeconcentration) and appropriate for spatial statistical analysis, such as kriging or polygonaldeclustering. MPA units are utilized in the Reassessment RI/FS to develop and screenappropriate technologies and alternatives. MPA was identified as the most useful measure forthis task due to the high variability of PCB sediment concentrations.
When PCBs are released into the environment, various processes can alter the pattern of PCBsfrom the original Aroclors. Analytical techniques vary and have improved over time. Congener-specific analyses were conducted for the Reassessment RI/FS, but most of the older data werereported by groups of, or total, Aroclors. Therefore, a translation method was developed for theReassessment RI/FS to allow use of historic and recent data sets on a common basis. Theparameter common to all data sets is known as Tri+ PCBs and represents the sum of PCBs with 3to 10 chlorine atoms per molecule.
6.2.2.2 Sources
Upstream Baseline - Niagara-Mohawk Power Corporation Queensbury Site
Sources of PCBs upstream of the Fenimore Bridge include atmospheric deposition and theNiagara-Mohawk Power Corporation (“NiMo”) site at Queensbury (located at about RM 209). These sources are considered anthropogenic (man-made) and serve as a baseline for purposes ofthe FS. Since specific information on the PCB load resulting from atmospheric deposition orother potential sources is not available, the discussion on the upstream baseline is focused on theNiMo Queensbury site.
Remedial activities were conducted at the NiMo Queensbury site, including the river, underthe direction of the NYSDEC. Subsequently, PCB contamination in fish in the vicinity of thesite was reduced. Some PCB contamination remains in the river near the site and PCBs are

Hudson River PCBs Site Record of Decision
18
found in fish collected near the site. Even though the current contribution of the NiMo site to thePCB load at Hudson Falls has not been quantified, its effect is minimal, particularly incomparison to the source conditions between Hudson Falls and Rogers Island. The concentrationfrom all sources above Hudson Falls is in the range of 1 to 2 nanograms per liter (ng/L) totalPCBs in the water column as it flows into the Site. NYSDEC is evaluating possible furtherremediation at the NiMo site that may reduce the baseline upstream PCB input into the HudsonRiver PCBs Superfund Site.
Sources of PCBs in the Upper Hudson River
Rogers Island (RM 194.6) forms the northern boundary of the Thompson Island Pool anddefines the upstream end of the PCB fate and transport modeling grid (see Section 6.2.3 formodel description). Monitoring at Rogers Island is used to assess PCB loads originating abovethe Thompson Island Pool and entering the model (i.e., the upstream boundary load). The regionabove Rogers Island that contributes PCBs to the model’s upstream boundary load can bedivided into two domains: 1) sources of PCBs entering the river north of the Fenimore Bridge inHudson Falls (RM 197.3) and 2) sources of PCBs entering the river between Hudson Falls andRogers Island.
There are four potentially important PCB sources to the Upper Hudson River between HudsonFalls and Rogers Island, each at various stages of remediation. The four potentially importantsources are the GE Hudson Falls plant, the GE Fort Edward plant, Remnant Deposit 1, andRemnant Deposits 2 through 5. The grouping of the Remnant Deposits is based on differences inthe degree of remediation completed.
GE Hudson Falls Plant
This source represents one of the two original discharge locations for PCB contaminationfrom GE. The facility is no longer in operation and the only activity on-site is related to itsremediation. Since the cessation of manufacturing discharges, extensive evidence has beenfound to show that this facility continues to leak PCBs into the Hudson River. The largestdocumented leakage event occurred during 1991 to 1993, apparently initiated by a partial failureof the gate structure within the abandoned Allen Mill structure near Bakers Falls in 1991. TotalPCB loads originating from this structure were quite large during this period (e.g., 260 kg or 570lbs in September 1991) but have since been greatly reduced. Remedial work conducted by GEunder NYSDEC jurisdiction reduced loads by more than 90 percent by 1996 (relative to early1990s), although the load appears to have increased somewhat in the 1998–99 time frame.
Based on a review of recent water column data (1998 to 2000), it is estimated that leakagefrom the GE Hudson Falls plant contributes the vast majority of the roughly 3 to 8 kg (about 6 to18 lbs) of total PCBs per month that travel past Rogers Island under current conditions. Congener patterns in PCB loads at Rogers Island predominantly resemble unweathered Aroclor
Hudson River PCBs Site Record of Decision
19
1242, consistent with the observed leakage of non-aqueous phase PCB-bearing oils from thebedrock beneath the GE facilities.
In March 2001, under a Consent Order with the NYSDEC, GE proposed additional sourcecontrols at the Hudson Falls plant. NYSDEC and EPA are evaluating GE’s proposal. It isassumed in models used for the Reassessment RI/FS that, as a result of this additional sourcecontrol action, the upstream Tri+ PCB load at Fort Edward (Rogers Island) will be reduced fromits average current value of 0.16 kg/day (equivalent to an average concentration of 13 ng/L) to anaverage of 0.0256 kg/day (equivalent to an average concentration of 2 ng/L). If successful, theseadded reductions of the input from the GE Hudson Falls plant are likely to have a substantial impact on the overall attainable PCB concentrations in all media (air, water, sediment, and fish)in the Upper Hudson after sediment remediation, much more so than the effect of any reductionsupstream of Hudson Falls.
GE Fort Edward Plant
The GE Fort Edward plant is located slightly farther from the Hudson River than the GEHudson Falls facility. PCB contamination exists under the GE Fort Edward plant which isunderlain by a layer of silt and clay, as opposed to the fractured bedrock at the GE Hudson Fallsfacility. Thus, while historical discharges from the GE Fort Edward plant were undoubtedlylarge, since the elimination of PCB usage and upgrading of the wastewater treatment plant,discharges and leakages to the river have been reduced. It is believed that the majority of post-1977 contamination originating from this source is probably associated with bank erosion ofcontaminated soils and sediments around the former discharge pipe. These materials are beingaddressed under a January 2000 NYSDEC Record of Decision. It is presumed thatimplementation of the remedy selected in the NYSDEC Record of Decision will reduce the PCBloads into the river at this location.
Remnant Deposit 1
Remnant Deposit 1 is the only one of the five Remnant Deposits not addressed by theremedial efforts conducted by GE from 1989 to 1991, as most of Remnant Deposit 1 had alreadywashed downstream, and because it was not practical to cap the island. As such, the sedimentsof this deposit have been available for subsequent resuspension and transport downstream. It ismost likely that this occurs during high flow events when river velocities are sufficient toresuspend large quantities of sediment. Diffusive exchange can also occur during lower flowconditions. While these processes undoubtedly occur to some extent, evidence suggests thatthese processes are not now major contributors to the annual load at Rogers Island. This is basedon the knowledge that this source would yield a somewhat weathered congener pattern, which isnot evident in the weekly monitoring data at Rogers Island. Thus, similar to the source areaassociated with the GE Fort Edward plant, this area may have been important historically, but itis unlikely to contribute a significant portion of the PCB load at Rogers Island under the normalrange of flow conditions. However, given the fact that this area remains uncontrolled, the

Hudson River PCBs Site Record of Decision
20
possibility remains that a large flow event such as a 100-year flood may release an additionalportion of the PCBs remaining in Remnant Deposit 1. EPA will conduct further sampling todetermine whether Remnant Deposit 1 needs to be remediated.
Remnant Deposits 2 through 5
Prior to their remediation, data on water column loads of PCBs, as well as the deposition ofsediment in the river, all pointed to the transport of PCB-contaminated materials from theRemnant Deposits downstream. However, since the completion of the engineered caps, whichraised the elevation at Remnant Deposits 2 through 5 to above the 100-year flood level in 1991,movement of these materials has been greatly limited. PCB contamination that originates fromthese deposits would have to reach the river via groundwater; however, available data areinsufficient to evaluate the extent to which PCBs may be introduced by groundwater through theRemnant Deposits, given that the water column PCB load is dominated by PCBs from the GEHudson Falls and Fort Edward plants. EPA’s analysis of congener patterns of the 1997 to 1999Rogers Island water column samples and the partition coefficient data do not suggest significanttransport of PCBs to the river from these Remnant Deposits. The Rogers Island pattern of PCBsclearly matches that of the measured leakages from the Hudson Falls plant, both of which areconsistent with a release of unweathered PCBs. Remedial efforts at Remnant Deposits 2 through5 apparently have alleviated a formerly important source.
EPA will conduct a 5-year review for the Remnant Deposit remedy pursuant to CERCLASection 121(c). EPA may not be able to fully evaluate the need for additional remediation atRemnant Deposits 2 through 5 until source control activities are completed near the GE HudsonFalls and Fort Edward plants, since the continuing release of PCBs to the River from thesefacilities makes it difficult to isolate the PCB load contributed by Remnant Deposits 2 through 5.
Summary of PCB Sources between Rogers Island and Hudson Falls
Of the four potential sources in the portion of the Hudson River between Hudson Falls andRogers Island, the source from the GE Hudson Falls plant is best documented as an importantcontributor to the PCB loads measured in the water column at Rogers Island. The monitoringdata at Rogers Island clearly define the source as one originating from “fresh” unweatheredAroclors, thus eliminating the Remnant Deposits as potential sources. PCB loads originatingabove Hudson Falls have also been reduced recently and are unlikely to contribute more than afew percent of the annual load at Rogers Island. For perspective, the sediment in the ThompsonIsland Pool downstream of Rogers Island contributes between three and four times as muchPCBs to the river as do all the sources upstream of Rogers Island.

Hudson River PCBs Site Record of Decision
21
6.2.2.3 Contaminated Media
Sediment
Areas of elevated concentrations of PCBs in sediment, i.e., hot spots, are found indepositional areas throughout the Upper Hudson (River Sections 1, 2, and 3). The hot spotscontain PCB concentration of 50 ppm or more. Hot spots are graphically presented on the platesaccompanying Section 6.2.1.2 - River Bed Geology (Plates 6-1 through 6-7) of this document. River Section 1 (Thompson Island Pool) contains 20 of the 40 hot spots identified by NYSDECin 1977 and 1984. The sediments exhibit a high degree of heterogeneity with respect to thedistribution of PCBs. Historically, the highest concentrations of PCBs in sediments have beenobserved within the cohesive sediments of River Section 1, and generally lower PCBconcentrations are found within the non-cohesive sediments. The maximum concentrationmeasured in River Section 1 was approximately 2000 mg/kg total PCBs, in a slice of a sedimentcore. The average concentration in sediments 0 to 25 cm (0 to about 10 inches) in River Section1 in 1991 was approximately 42 mg/kg total PCBs. It is estimated that there are approximately45,200 kg (about 100,000 lbs) of total PCB mass in the sediments in River Section 1.
River Section 2 (TI Dam to Northumberland Dam near Lock 5) contains 15 of the 40NYSDEC-defined hot spots. The average concentration of total PCBs in sediment 0 to 25 cm (0to about 10 inches) in River Section 2 in 1991 was approximately 26 mg/kg. The maximumconcentration of PCBs in the Hudson, 4000 mg/kg total PCBs, was found in this river section in1991 in Hot Spot 28 within a thin slice of a sediment core. It is estimated that there areapproximately 28,200 kg (about 62,000 lbs) of total PCB mass in the sediments in River Section2.
River Section 3 (Northumberland Dam to Federal Dam at Troy) contains five of the 40NYSDEC-defined hot spots. The average concentration in sediment 0 to 25 cm (0 to about 10inches) in River Section 3 in 1991 was approximately 9 mg/kg total PCBs. Certain areas inRiver Section 3, i.e., NYSDEC Hot Spots 36, 37, and the southern portion of Hot Spot 39, haveextensive PCB inventory and show signs of potential loss of this PCB inventory. For example, acomparison of 1977 and 1994 sediment data showed that over two thirds of the PCB inventorywas lost from Hot Spot 37. It is estimated that there are approximately 34,000 kg (about 75,000lbs) of total PCB mass in the sediments in River Section 3.
Transport of PCBs in Upper Hudson River Sediments
The original sources of the vast majority of PCB contamination in the Upper Hudson Riverwere the discharges from the GE plants in Fort Edward and Hudson Falls, New York. Over thepast 50 years, these PCBs have adhered to the sediments (sands, silts and clays), and thesesediments now serve as a continuing source of contamination for the water column and biota. These sediments migrate downstream by both suspended-load and bed-load transport. Bed-loadtransport represents particles that roll or bounce along the river bottom without being brought

Hudson River PCBs Site Record of Decision
22
into resuspension. Since these particles are not transported into the water column, they have noeffect on the suspended sediment concentration. However, the effects of bed-load transport areimportant in the changes in the thickness of the sediment bed and increase the rate of PCBdesorption from the transported sediments into the water column.
The processes that determine the fate of PCBs in the Upper Hudson River may be divided intotwo categories, i.e. transport, and transfer and reaction. Transport is the physical movement ofPCBs caused by the net advective movement of water, mixing, and resuspension/deposition ofsolids to which PCBs are adsorbed. It is dependent on the flow and dispersion characteristics inthe water column and the settling velocity and resuspension rate of the solid particles. Transferand reaction include movement of PCBs among air, water, and solid phases of the system, andbiological (or biochemical) transformation or degradation (i.e., break down) of the PCBs. Theprocesses involved in transfer and reaction include volatilization, adsorption, dechlorination (i.e.,change of PCBs to less chlorinated congeners), bioturbation, biotransport and biodegradation. PCBs are present in the Upper Hudson River in three phases that interact with each other: freelydissolved, sorbed to particulate matter or solids, and complexed with dissolved (or colloidal)organic matter.
These complex sediment and water exchange processes govern the mechanisms that in turncontribute to bioaccumulation of PCBs in the fish via both benthic and pelagic food webs. Thesehighly variable and complex processes include sediment resuspension and settling, biologicalmixing (bioturbation), sediment bed-load transport, anthropogenic disturbances such as boat andbarge traffic, flood events, ice-rafting, and other such related processes. The net result of theseprocesses is that, in general, the distribution of PCBs in the sediments of the Upper HudsonRiver is very heterogeneous. This heterogeneity is apparent from examination of the 1977 and1984 NYSDEC data (including the hot spot delineation); the 1994 EPA data; and the 1991, 1998and 1999 GE data.
PCB loss or gain from the sediment can take many forms. Scour, diffusion, groundwateradvection (a process by which contaminants are transported by the movement of groundwater),and biological activity can all potentially remove PCBs from a given location. Biologicalactivity in the form of anaerobic microbial dechlorination can also serve to decrease PCBconcentrations in the sediments. Sediment PCB inventories can be increased chiefly bydeposition, either with sediment contaminated by newly released PCBs or with redepositedsediments from other contaminated locations.
Long-Term Sequestration of PCBs
Long-term sediment sequestration of PCBs is clearly not assured, as demonstrated by severalfindings of the Phase 2 investigation. These include:
• The statistically significant loss of the sediment PCB inventory from highly-contaminatedsediments in the Thompson Island Pool between 1984 and 1994. Samples collected by

Hudson River PCBs Site Record of Decision
23
GE in 1998 also show sediment PCB inventory loss in comparison to 1984 data. Loss ofthe sediment PCB inventory in this case indicates that these highly-contaminatedmaterials are migrating within certain areas making them available to the water columnand available for deposition at other locations.
• The continued loading of PCBs from the sediments of the Upper Hudson to the watercolumn despite the controls placed on releases from the GE Hudson Falls plant.
• Sixty percent of the sediment cores showing the highest concentration of PCBs in the topnine inches of sediment (indicating the contaminated material is not deeply buried and isavailable for redistribution) .
• The scouring of PCB-contaminated sediments from the Upper Hudson resulting from theHoosic River spring flow in 1993.
• The apparent loss of the sediment inventory in Hot Spot 28 based on a comparison of GEand EPA data.
• The occurrence of high PCB concentrations in surface sediment of Hot Spot 28.
• The occurrence of high PCB concentrations in the surface sediments of Hot Spot14 as documented by GE in 1999.
PCB Transport from the Upper Hudson to the Lower Hudson
PCBs are transported from the Upper Hudson River to the Lower Hudson (i.e., south of theFederal Dam at Troy). The mass of PCBs transported over the Federal Dam to the LowerHudson declined from about 3,000 to 4,000 kg/year Tri+ PCBs (6,610 to 8,820 lbs/year) in thelate 1970s to about 150 to 500 kg/year Tri+ PCBs (331 to 1,100 lbs/year) by the late 1980s orearly 1990s. The most recent estimate of Tri+ PCBs, based on 1998 GE data from a monitoringstation at Schuylerville, is 214 kg/year Tri+ PCBs (472 lbs/year); the estimated (modeled)average for the 1990s is about 290 kg/yr Tri+ PCBs (639 lbs/year) over Federal Dam, with amodeled daily average Tri+ PCB water column concentration of 30 ng/L. Total PCBconcentrations are 1.45 times the Tri+ PCB concentrations in the water column passing theFederal Dam.
PCBs in Lower Hudson River Sediments
An evaluation of PCB concentrations in sediments below Federal Dam is limited by the lackof a detailed study of this region. An assessment of the Lower Hudson region performed in the1980s indicated that sediments in New York Harbor had a total PCB concentration of 0.8 mg/kgin the 1970s and 0.5 to 0.7 mg/kg in the 1980s. Sampling data from the 1993 ecologicalinvestigation showed a sharp drop in PCB concentrations in sediment below RM 150, with PCB

Hudson River PCBs Site Record of Decision
1 For purpose of mod el analysis and consistency, PCB levels in fish have been converted to a Tri+ basis. It
should be noted, however, that total PCBs present in fish closely relate to Tri+ PCB concentrations. It was found
that the Tri+ PCB concentration ranged from 98 to 100 percent of the total PCB concentration in fish collected as
part of the P hase 2 sam pling. Th us, in reality th e terms T ri+ PCB s and total P CBs m ay be use d intercha ngeab ly
herein when measu ring, comparing, or projecting fish tissue PCB concentrations. Therefore, the generic term
“PCBs” will be used in dealing with fish tissu e conce ntrations fro m this po int forwa rd. The ra tio betwe en Tri+
PCBs and total PCBs in the water column and sediment does not approach unity and therefore the terms cannot be
used interc hange ably for w ater and se dimen t.
24
concentrations ranging from less than 0.1 mg/kg to about 1.5 mg/kg (with a fairly high degree ofscatter) at nine stations between RM 144 and RM 24.
Water Column
The dominant current sources of PCBs to the water column of the Upper Hudson River maybe separated into two groups: PCB-contaminated sediments on the river bottom; and PCB-contaminated oil from bedrock seeps from the GE Hudson Falls plant.
U.S. Geological Survey monitoring of PCBs in the water of the Upper Hudson River began in1977. GE, in accordance with a Consent Decree with EPA, began monitoring of the UpperHudson River in 1991. In River Section 1, PCB concentrations in the water column indicate thatthe sediments of the Thompson Island Pool are the major source of PCBs to the water column ofthe Upper Hudson during low flow conditions, which are important as they coincide with theperiod of greatest biological activity and uptake by ecological receptors.
During the summer of 1998 (June through September), the average PCB concentration in thewater column at the Thompson Island Dam-West station was 134 ng/L total PCBs. Concentrations from January 1996 through March 2000 averaged 90 ng/L total PCBs. Fiveobservations in excess of 300 ng/L total PCBs were noted during the winter of 1999-2000. Aswater flows over the six mile stretch of the Thompson Island Pool, the PCB concentration (andmass load) increases 3 to 4 times.
Fish and Other Biota
PCB concentrations in fish are a result of the fish’s exposure to PCBs in water and surfacesediment, through an aquatic food chain and/or a benthic food chain, respectively. NYSDECcontinues to collect and analyze fish tissue data from locations in the Upper Hudson River. Converted to a Tri+ PCB (1) basis, the concentrations in River Section 1 (Thompson Island Pool)in 1999 averaged about 21 mg/kg (wet weight in fish fillet) in largemouth bass and 13 mg/kg inbrown bullhead. Recent maximum PCB concentrations measured were 114 mg/kg in largemouthbass and 31 mg/kg in brown bullhead. The overall maximum PCB concentration in 1999 in theThompson Island Pool was 288 ppm in white sucker fillet. Fish PCB concentrations areprovided in mg/kg wet weight in fish fillet unless otherwise noted.

Hudson River PCBs Site Record of Decision
2 PCBs ex pressed a s the sum of Aroc lors analyz ed by th e NYS DEC .
25
Fish in River Section 2 (Hot Spot 28 and the Fort Miller Pool just below the Thompson IslandDam) were first sampled in 1999. These data reflect elevated PCB concentrations, consistentwith other fish data for the Upper Hudson River.
PCB concentrations in fish collected in River Section 3 (Stillwater) in 1999 averaged about 6mg/kg in largemouth bass and 6 mg/kg in brown bullhead. Recent maximum PCBconcentrations measured were 23 mg/kg in largemouth bass and 15 mg/kg in brown bullhead. The recent overall 1998 maximum was 483 ppm PCB in carp fillet. For comparison purposes,EPA has determined that 0.05 mg/kg is an acceptable PCB concentration for Hudson River fish(See Section 9.1).
Because PCBs tend to accumulate in fatty tissues, it is also useful to examine PCBconcentrations in fish on a lipid (fat) basis for an analysis of trends. The lipid-basedconcentrations for brown bullhead and largemouth bass in 1998 were generally similar to thoseobserved from 1995 to 1997 in both River Section 1 and River Section 3, with little evidence of aconsistent decline. Time trends of lipid-based concentrations for pumpkinseed in River Section3 for the Stillwater reach (RM 168.1) show that PCB concentrations in the fish appear to havebeen nearly stable in recent years. Figures 6-2 and 6-3 provide the lipid-based concentrations infish for the Thompson Island Pool (RM189, River Section 1) and Stillwater (River Section 3). There are insufficient PCB data for fish in River Section 2 for a time trend analysis.
EPA’s analysis of all the data indicates that the PCB concentrations in fish generally decreasewith distance downstream of the Thompson Island Pool.
Data recently released by NYSDEC found elevated levels of PCBs in biota. Snapping turtleshad greater than 3000 mg/kg PCBs(2) in fat and nearly 4 mg/kg PCBs in muscle. Short-tailedshrews had a mean of 7 mg/kg PCBs and a maximum of 38 mg/kg PCBs. Mink and otter thatlive near the river showed elevated PCB levels. The average PCB level in river otter within 10kilometers of the Upper Hudson River was 172 mg/kg PCBs (lipid based, liver) and the averagelevel for mink within one kilometer of the river was 33 mg/kg PCBs (lipid based, liver).
Air
PCBs can enter the air via volatilization from PCB-contaminated water and soil althoughvolatilization of PCBs is generally considered to be limited. Air monitoring at the Site in 1991,associated with the capping of the Remnant Deposits, measured PCB concentrations above thedetection limit in only 13 of 985 samples. The maximum concentration detected was 0.13 :g/m3
of Aroclor 1242. PCBs were detected only when high PCB concentrations released from nearthe GE Hudson Falls plant were also detected in the water column.
Hudson River PCBs Site Record of Decision
26
Air exposure was not expected to present a significant risk to human health, based on thePhase 1 Report, and therefore additional air monitoring was not conducted as part of theReassessment RI/FS. The Human Health Risk Assessment calculated risk values for exposure toPCBs from inhalation of volatilized PCBs and found that inhalation does not present a significantrisk.
6.2.3 Geochemistry and Modeling Conclusions
In the Reassessment RI/FS, EPA evaluated PCB contamination at the Site using a number oftools. These tools include geochemical analyses of the water and sediment, analyses of thebiological monitoring data, and synthesis of the data by the application of a set of complexmathematical (computer) models.
PCB physical/chemical transport and fate and PCB bioaccumulation models were applied topredict future levels of Tri+ PCBs in the Upper Hudson River sediment, water and fish. TheUpper Hudson River Toxic Chemical Model (HUDTOX) simulated transport and fate in thewater column and sediments for 40 miles of the Upper Hudson. HUDTOX was calibrated to a21-year historical data set, validated utilizing observed data from 1998, and run for a 70-yearforecast period from 1998 through 2067. The Farley model (An Integrated Model of OrganicChemical Fate and Bioaccumulation in the Hudson River Estuary) was used to calculate LowerHudson River sediment and water concentrations. The modeling efforts provided EPA withvaluable insights regarding the factors that control transport and fate of PCBs in the UpperHudson River. The modeled responses are sensitive to changes in hydrology, solids loadings andsediment particle mixing depth and initial conditions.
A mechanistic time-varying model known as FISHRAND was used to predict future fish Tri+PCB body burdens, which were subsequently used in the Human Health and Ecological RiskAssessments and FS. FISHRAND model predictions were provided for six fish species: brownbullhead, largemouth bass, white perch, yellow perch, pumpkinseed, and spottail shiner. Thesespecies were selected to get a representative trophic and spatial distribution of bottom feeders,species at the top of the food chain, and semi-piscivorous species. Model estimates of total PCBconcentrations in each species were based on all PCB congeners with three or more chlorineatoms.
Both the HUDTOX and FISHRAND models were calibrated using the extensive database forthe Upper Hudson River PCBs Reassessment RI/FS (EPA, 2000, Release 5.0). The databasecontains approximately 750,000 measurements for sediments, fish and aquatic biota, surfacewater flow and surface water quality from EPA, NYSDEC, USGS, NOAA and GE. Almost350,000 of these records contain data acquired by EPA as part of the Phase 2 ReassessmentRI/FS sampling effort. The remaining records contain data from a large number of historical andongoing monitoring efforts in the Hudson River.

Hudson River PCBs Site Record of Decision
27
Key findings of the geochemistry studies and modeling included:
• Sediment deposition is occurring, on average, in most of the Upper Hudson River, but notat rates or with a consistency sufficient for sequestration of PCB-contaminated sediments.
• PCB concentrations in water are driven by PCBs stored in sediments.
• Over the long term, the concentrations of PCBs entering the river upstream of RogersIsland will limit the reductions of PCB levels in fish tissues.
• Occurrence of a 100-year peak flow does not appear likely to cause massive mobilizationof PCB-contaminated sediments.
• Concentrations of PCBs in both the sediment and water column represent importantsources of exposure to biota over the long term.
6.2.4 Reassessment RI Conclusions
The following summarize the key conclusions of the Reassessment RI.
• PCBs were released from the two GE capacitor manufacturing plants in Hudson Falls andFort Edward into the Hudson River. Once in the river, the PCBs generally adhered tosediments or were carried in the water column.
• PCBs in the fine-grained sediments (and, to a lesser extent, the coarse-grained sediments)are a continuing source of contamination to the water column and biota, through aquaticand benthic food chains and through processes that have been empirically measured butare not easily modeled. Because the river is a dynamic system, the PCB-contaminatedsediments are not stable. Some PCB-contaminated sediment may be buried by depositionof cleaner sediments at some times, but in other places and at other times, they may beredistributed by scouring. Data show that the burial that is occurring of PCB-contaminated sediment by cleaner sediment in the Thompson Island Pool is not sufficientto mitigate exposure to biota.
• Sixty percent of the low resolution sediment cores show the highest concentrations ofPCBs in the top nine inches of sediment.
• As of 1994, there had been a statistically significant loss of PCB inventory from highlycontaminated sediments in the Thompson Island Pool and a net loss of PCB inventoryfrom hot spot sediments between the Thompson Island Dam and the Federal Dam atTroy.

Hudson River PCBs Site Record of Decision
28
• High flow events (e.g., floods) may increase the bioavailability of PCBs to organisms inthe water column. Water column sampling from a high flow event in January 1998showed elevated PCB concentrations.
• PCBs in sediments will not be “naturally remediated” via dechlorination. The extent ofdechlorination is limited, resulting in less than a ten percent loss of PCB mass.
• The area of the Site upstream of the Thompson Island Dam represents the primary sourceof PCBs to fish within the freshwater Hudson. This includes the GE Hudson Falls andFort Edward plants, the Remnant Deposits and, most importantly, the sediments of theThompson Island Pool.
• PCB concentrations in fish, the primary pathway of concern, are still well aboveacceptable risk-based and advisory levels, particularly in the Upper Hudson.
• Alleviating the upstream source is important to the long-term recovery of the river. GE
has submitted a proposal to the NYSDEC (under its existing Consent Order with theNYSDEC) to address PCB sources in bedrock that are still releasing to the river fromGE’s Hudson Falls plant. NYSDEC and EPA are evaluating this source control proposalsubmitted by GE.
• PCBs are transported from the Upper Hudson River to the Lower Hudson River (i.e.,south of the Federal Dam at Troy). The mass of PCBs transported over the Federal Damto the Lower Hudson declined from about 3,000 to 4,000 kg/year Tri+ PCBs (6,600 to8,800 lbs/year) in the late 1970s to about 150 to 500 kg/year Tri+ PCBs (330 to 1,100lbs/year) by the late 1980s to early 1990s. Based on data reported by GE from amonitoring station at Schuylerville, 214 kg Tri+ PCBs (471 lbs) of PCBs weretransported over the Federal Dam at Troy in 1998.
• Trends of PCB concentrations in the Upper Hudson in water column and fish tissue showa leveling off with little, if any, reduction occurring in the last decade when the effects ofthe Allen Mill event are excluded.
In summary, the PCB-contaminated sediments of the Thompson Island Pool release PCBs tothe water column and contaminate the water column and fish. Burial of contaminated sedimentby cleaner material is not occurring universally and stability of the sediment deposits is notassured.
7. CURRENT AND POTENTIAL FUTURE LAND AND WATER USES
As one of America’s great rivers, the Hudson has played and will continue to play a majorrole in the history, culture, and economy of the area. The Hudson has been designated anAmerican Heritage River because of its important role in American history and culture. Current

Hudson River PCBs Site Record of Decision
29
and reasonably-anticipated future land use and surface water use are described below. One newwater allocation request is noted below (Section 7.2).
7.1 Current and Reasonably Anticipated Future Land Use
Current land use includes a variety of residential, commercial and industrial activities. Use ofthe river and lands surrounding the river are projected to remain the same. At this time, nochanges in future land use are known, nor are any new uses expected.
The Site passes through 14 different counties as the river flows to its final discharge point inNew York Harbor. Four counties (Albany, Washington, Rensselaer, and Saratoga) lie adjacent tothe more highly contaminated portions (areas of proposed active remediation in River Sections 1,2 and 3) of the Upper Hudson River between Troy (Federal Dam) and Hudson Falls. Withinthese four counties, forests and farmlands surround urban centers and historic villages. There areapple orchards and dairy farms, parks, nature preserves and gardens. In addition to the GEHudson Falls and Fort Edward plants, the area is home to technology companies, oil servicecompanies and food companies.
Saratoga and Washington Counties have experienced population growth between 1990 and
1999 of 10.2 percent and 1.4 percent, respectively, while Rensselaer and Albany Counties haveexperienced population declines of 1.9 percent and 0.3 percent, respectively. Total population ofthese four counties, according to July 1999 estimates by the US Department of CommerceBureau of the Census, is just under 700,000. Warren County, in which the City of Glens Falls islocated, has a population of just over 60,000 and is just to the northwest of the Hudson RiverPCBs Site.
7.2 Surface Water Uses
Current surface water uses include the following:
• Public water supplies: The cities of Waterford and Poughkeepsie, the Dutchess CountyWater and Wastewater Authority, the Village of Rhinebeck, the Castle Point Medical Center, aswell as the Highland and Port Ewen Water Districts, obtain at least a portion of their watersupplies directly from the Hudson River. In addition, a water intake near Chelsea, which is southof Poughkeepsie, may be used to supplement New York City's water supply during periods ofdrought. Waterford is the only municipal water supply intake in the Upper Hudson River. Thetreatability study at Waterford Water Works, which was completed in 1990 pursuant to the 1984Record of Decision, indicated that the treated water met standards applicable to public watersupplies at that time. The Town of Halfmoon is developing the facilities to use the UpperHudson River as a source of public water supply.
• Industrial and commercial purposes: Hudson River water is used extensively forhydroelectric and thermal power generation, as well as for manufacturing processes, cooling and

Hudson River PCBs Site Record of Decision
30
fire protection. Industrial use is typically located near urban centers such as Albany and Troyand includes brake lining, paper products, clothing and garden equipment manufacturingfacilities, as well as paper mills. A commercial striped bass fishery in the Lower Hudson Riverremains closed due to the contamination. Other commercial fishery closures are also in place.
The river serves as a transportation corridor within the region. The Champlain Canal was amajor transportation route in the past. Commercial traffic has declined on the canal over the last30 years, but may experience some growth, such as the recent increase in tour boats, in the futurethrough revitalization programs such as the American Heritage River initiative.
Due to the PCB contamination, navigational dredging within the Upper Hudson has beenseverely limited in the past 25 years. As a result, commercial navigational uses have beenreduced and recreational navigational uses impeded. The New York State Canal Corporation hascited the cost to dispose of PCB-contaminated sediment as a critical aspect to the resumption ofthe dredging program necessary to keep the canal functional. In addition, private dredgingoutside the navigational channel for such uses as marinas has been limited as well.
• Residential/Domestic: Hudson River water is used for watering domestic lawns andgardens. The use of Hudson River water for domestic drinking supplies is described above(Public water supplies).
• Agricultural: Hudson River water is used for irrigating agricultural lands. There are norecords of water withdrawal for agricultural uses, however, as permits are not required forirrigation withdrawals. Portions of the agricultural land adjacent to the Site lie within New YorkState Agricultural Districts and include parcels considered to be prime farmland. In addition toapples, crops include corn and hay used for forage, and small quantities of cash crops such asoats and wheat.
• Recreation: The Hudson River supports a variety of water-based recreational activitiesincluding sport fishing, waterfowl hunting, swimming and boating. Boating (both power andnon-power) is available on the river and on the Erie and Champlain Canals; marinas and dockscan be found along the waterway. Schaghticoke Canal Park sits at Lock 4 of the ChamplainCanal, Schuylerville has a large waterside town park, and other town parks lie along the river,including two in Fort Edward. A marina and hotel complex have been proposed for the southernend of Rogers Island. Area festivals include various county fairs such as those in Washingtonand Rensselaer Counties. Tourism is popular and important to the local economy throughout theHudson River Valley.
In 1975, the NYSDOH began to issue health advisories recommending that people limitconsumption of fish from the Hudson River. In 1976, NYSDEC issued a ban on fishing in theUpper Hudson River from Hudson Falls to the Federal Dam at Troy, due to the potential risksfrom consumption of PCB-contaminated fish, and a ban on commercial fishing of striped bassand other species which migrate into the Lower Hudson. NYSDEC replaced the ban against
Hudson River PCBs Site Record of Decision
31
fishing in the Upper Hudson River with a catch-and-release fishing program in 1995. NYSDOHcontinues to recommend that people eat none of the fish from the Upper Hudson River, thatchildren under the age of 15 and women of child-bearing age eat none of the fish from the riverfor the entire 200 mile length of the Superfund site, and that the general population eat none ofmost species of fish caught between the Federal Dam at Troy and Catskill.
• Ecological Resources: The Hudson River supports 206 species of fish as well as 143 speciesof resident and migrating birds. Sixty-four (64) species are listed as Threatened, Endangered,Rare or of Special Concern by federal and New York State authorities. There are 39 areas ofsignificant habitat identified in the Lower Hudson River.
The Hudson River provides diverse habitats for all trophic levels of the river’s ecosystem. Plants, plankton, aquatic invertebrates, fish, amphibians, reptiles, birds and mammals use theHudson River for feeding, reproduction and shelter. In addition to the aquatic communitiesassociated with the river, animals living in wetlands, floodplains and upland communities arealso dependent on the river.
Both federal and state freshwater wetlands exist throughout the Upper Hudson region. Tidalwetlands are found in the Lower Hudson River. Also present in the Lower Hudson are NewYork State Department of State (NYSDOS) significant coastal habitats, United States Fish andWildlife Service (USFWS) significant habitats, and marshes identified by the United StatesArmy Corps of Engineers (USACE). The 100-year floodplain extends up to 5,000 feet wide atplaces in the Upper Hudson.
8. SUMMARY OF SITE RISKS
Baseline human health and ecological risk assessments were conducted to evaluate thepotential for current and future impacts of site-related contaminants on receptors visiting,utilizing or inhabiting the Hudson River. In the Revised Human Health Risk Assessment(HHRA), cancer risks and non-cancer health hazards were evaluated both for the Upper HudsonRiver and the Mid-Hudson River. In the Revised Ecological Risk Assessment (ERA), ecologicalrisks were evaluated for both the Upper and Lower Hudson. Under baseline conditions, thehuman health and ecological risks are unacceptable. The HHRA and ERA support the selectedremedy.
8.1 Human Health Risk Assessment
The site-specific HHRA evaluated both cancer risks and non-cancer health hazards fromexposure to PCBs in the Hudson River, as documented in the Revised HHRA. The RevisedHHRA combines into a single report the August 1999 HHRA for the Upper Hudson River and itsMarch 2000 Responsiveness Summary, the December 1999 HHRA for the Mid-Hudson Riverand its August 2000 Responsiveness Summary, and the November 2000 Response to PeerReview Comments (on the August 1999 HHRA).

Hudson River PCBs Site Record of Decision
32
This discussion emphasizes cancer risks and non-cancer health hazards due to PCBs in theUpper Hudson that exceed EPA’s goals for protection, which are a one-in-one million excesscancer risk and a non-cancer hazard index (HI) of 1. Cancer risks and non-cancer hazard indicesin the Mid-Hudson were calculated to be about one-half those of the Upper Hudson, due to lowerconcentrations of PCBs in Mid-Hudson fish, sediment and surface water. The cancer risk andnon-cancer hazard indices in the Upper Hudson and Mid-Hudson are above EPA’s levels ofconcern for fish consumption.
Consistent with Superfund policy and guidance, the HHRA is a baseline risk assessment andtherefore assumes no actions (remediation) to control or mitigate hazardous substance releasesand no institutional controls, such as the fish consumption advisories and fishing restrictions thatare currently in place, which are intended to control exposure to hazardous substances. Cancerrisks and non-cancer hazard indices were calculated based on an estimate of the reasonablemaximum exposure (RME) expected to occur under current and future conditions at the Site. The RME is defined as the highest exposure that is reasonably expected to occur at a site. EPAalso estimated cancer risks and non-cancer hazard indices based on central tendency (CT), oraverage, exposures at the Site. The following discussion summarizes the HHRA with respect tothe basic steps of the Superfund HHRA process: 1) Data Collection and Analysis, 2) ExposureAssessment, 3) Toxicity Assessment and 4) Risk Characterization.
8.1.1 Data Collection and Analysis
The HHRA utilizes documents relating to the nature and extent of PCB contamination at theSite developed as part of the Reassessment RI/FS (e.g., February 1997 Data Evaluation andInterpretation Report, July 1998 Low Resolution Sediment Coring Report, Database for theHudson River PCBs Reassessment RI/FS [Release 5.0, October 2000], January 2000 RevisedBaseline Modeling Report (RBMR), November 2000 Revised Baseline Ecological RiskAssessment and associated responsiveness summaries). These Reassessment RI/FS documentsprovided both current and projected future concentrations of PCBs in air, fish, sediments andriver water. To calculate cancer risks and non-cancer hazard indices, the information onconcentrations in these media (air, water, sediment, fish) are then combined with otherinformation on exposure (see Section 8.1.2) and toxicity (see Section 8.1.3).
• Chemicals of Concern: PCBs, including dioxin-like PCBs, are the chemicals of concernfor the Site. Fish at the Site have been collected by the NYSDEC for more than 25 years. Fish samples have been analyzed for PCBs, total DDT, total chlordane, total endrin, totalendosulfan, dieldrin, aldrin, mirex, total heptachlor, total hexachlorobenzene, toxaphene,methoxychlor, individual polycyclic aromatic hydrocarbons, cadmium, mercury, dioxins,and dibenzofurans. PCBs (Total and dioxin-like) were identified as the chemicals ofconcern based on previous analytical results, the toxicity values for the chemicals, and thesite definition (i.e., the Site was placed on the Superfund NPL as a result of PCBcontamination in the river).

Hudson River PCBs Site Record of Decision
33
The exposure point concentration (EPC) is the concentration of PCBs in a givenenvironmental medium at the point of human contact. Estimates of the EPC represent theconcentration term used in the exposure assessment component of the quantitative riskevaluation. EPCs for PCBs are provided for fish, sediment, drinking/river water, and air. EPCsare also provided for dioxin-like PCBs for fish. The EPCs for PCBs in each of these media arebased upon modeled projections of future concentrations in each medium for the RME and CTindividuals. These modeled projections are based upon a large monitoring record.
• Fish EPCs: EPCs in fish are based on wet-weight PCB concentrations in fish fillets forbrown bullhead, largemouth bass, and yellow perch generated by EPA’s peer-reviewedbioaccumulation model, FISHRAND. The fillet represents the portion of the fish mostcommonly consumed. The fish EPCs were derived by weighting the model output byreported angler preference for species consumption (i.e., weighting the modeled PCBconcentrations in fish to reflect the species caught and consumed by anglers) and byaveraging over location within the study area. The fish EPCs range from 2.0 mg/kgPCBs wet-weight (for the adult exposed for 22 years under the RME cancer scenario) to3.3 mg/kg (for the young child exposed for six years under CT non-cancer scenario), dueto averaging times for different individuals’ exposures for the Upper Hudson (see Tables8-1 to 8-2).
• Fish EPCs for Dioxin-Like PCBs: EPCs in fish for dioxin-like PCBs were based onFISHRAND output for dioxin-like PCB congeners and the toxic equivalencies (TEQs) ofthose congeners (see Table 8-3). The TEQs were developed using the 1998 World HealthOrganization/International Programme for Chemical Safety Toxic Equivalency Factors. Calculated cancer risks associated with dioxin-like PCBs in fish were found to becomparable to the cancer risks from non-dioxin-like PCBs and therefore are not discussedfurther.
• Sediment EPCs: EPCs in surficial sediment (0 to 4 cm) in the Upper Hudson weremodeled using HUDTOX, EPA’s peer-reviewed PCBs fate and transport model for theUpper Hudson, assuming baseline conditions of a constant upstream boundary conditionof 13 ng/L Tri+ PCBs in river water. Sediment EPCs were derived from the HUDTOXresults by weighting for the respective areal extent of cohesive and non-cohesivesediment. The sediment EPCs for the Upper Hudson range from 3.8 ppm (3.8 mg/kg)Tri+ PCBs for the adult RME to 7.2 ppm (7.2 mg/kg) Tri+ PCBs for the adolescent andchild CT (see Table 8-4).
• River/Drinking Water EPCs: Surface water from the Hudson River is used for drinkingwater. EPCs in Upper Hudson river water were derived from concentrations of PCBs inthe water column modeled by HUDTOX. The river water EPCs range from 0.034 ppb(3.4E-05 mg/L) total PCB for the adult RME to 0.048 ppb (4.8E-05 mg/L) total PCB forthe adolescent and child CT (see Table 8-5). Cancer risks and non-cancer hazard indices

Hudson River PCBs Site Record of Decision
34
due to PCBs in river water were not at levels of concern (at or below EPA’s goals forprotection) and therefore are not discussed further in this ROD.
• Air EPCs: EPCs in air were derived for the Upper Hudson (see Table 8-6). Cancer risksand non-cancer hazard indices due to PCBs in air are at or below EPA’s goals forprotection and therefore are not discussed further in this ROD. (see HHRA and alsoResponsiveness Summary).
8.1.2 Exposure Assessment
The exposure assessment evaluates exposure pathways by which people are or can be exposedto the contaminants of concern in different media (e.g., soil, water, fish). Factors relating to theexposure assessment include, but are not limited to, the concentrations that people are or can beexposed to and the potential frequency and duration of exposure.
• Conceptual Site Model. Table 8-7 provides the rationale for inclusion or exclusion ofexposure pathways. Exposure through fish ingestion and recreational exposure throughdermal contact and ingestion of sediments are the pathways of greatest concern. Exposures from floodplain soil, non-fish biota (i.e., turtles, ducks, etc.), homegrowncrops including vegetables, beef and dairy products were evaluated qualitatively but notquantitatively. These pathways are not discussed further based on the discussionpresented in the HHRA, which indicated they are unlikely to be significant pathways forPCB exposure.
• Exposed Populations. Adults (over 18 years old), adolescents (aged 7 to 18 years old)and young children (aged 1 to 6 years old) are or can be exposed to PCBs in the HudsonRiver due to fish consumption and recreational activities (swimming and wading). Sensitive populations that were qualitatively evaluated include highly exposed (e.g.,subsistence) anglers and their families as well as infants of mothers who ingest fish thatare exposed in utero and/or through consumption of breast milk. With respect tosubsistence or highly exposed angler populations in New York State, review of thelimited literature suggests that these populations are likely to be adequately represented inthe HHRA. With respect to infants (less than one year old), exposure to PCBs in utero and via ingestion of breast milk are known exposure routes that may pose risks to fetaldevelopment and the infant. Several ongoing studies are evaluating whether there is arelationship between fetal/infant PCB exposure and developmental effects. StandardEPA default factors were used for angler body weight (e.g., 15 kgs for a young child and70 kgs for an adult).
• Fish Ingestion Rate. Based on the 1991 New York Angler survey of fish consumptionby licensed anglers, the RME fish ingestion rate was determined to be 31.9 grams perday, or about 51 half-pound meals per year for adults and the CT (average) fish ingestionrate was determined to be 4.0 grams/day, or about six half-pound meals per year. Fish
Hudson River PCBs Site Record of Decision
35
ingestion rates for adolescents and young children were reduced based on the ratio ofadolescent or child body weight to that of an adult. Fish ingestion rates for youngchildren and adolescents are generally consistent with the limited information provided inEPA’s 1997 Exposure Factors Handbook.
• Exposure Duration. Population mobility data from the U. S. Census Bureau for the fivecounties surrounding the Upper Hudson River (Albany, Rensselaer, Saratoga, Warren,and Washington) and fishing duration data from the 1991 New York Angler survey werecombined to determine the length of time an angler fishes in the Upper Hudson River(i.e., exposure duration). For cancer risks the exposure duration for fish ingestion was 40years for the RME exposure estimate (sum of 22, 12, and 6 years for adult, adolescent,and young children exposures, respectively) and 12 years for the CT (average) exposureestimate (sum of 6, 3, and 3 years for adult, adolescent and young child exposures,respectively).
For non-cancer health hazards, three exposure durations for fish ingestion under the RMEexposure estimate were used: 7 years (the chronic exposure period) for the adult, 7 yearsfor the adolescent and 6 years for the young child (aged 1 to 6). These non-cancerexposure durations were selected because they are exposure periods for chronic non-cancer health effects that yield a high-end average daily dose (i.e., the dose an RMEindividual would receive), based on the decline in PCB concentration with time forecastby EPA’s peer-reviewed models. The exposure duration for the CT (average) exposureestimate was set at 12 years, which is the sum of 6 years for the adult and 3 years each forthe adolescent and the young child.
• PCB Cooking Loss. PCB losses during cooking were assumed to be 0% (no loss) for theRME estimate and 20% for the CT (average) exposure estimate, based on studies reportedin the scientific literature. Potential PCB loss mechanisms include removing skin and fat,draining cooking fluids from the fish and grilling to allow oil to drip away from the fish.
• Recreational Exposure Assumptions. For direct exposure to river water and sediment,there are no site data available to quantify the frequency of exposure. The RME exposureestimates for adults and young children (aged 1 to 6 years old) were assumed to be oneday a week (assuming an adult would accompany a young child to the river) for the 13weeks of summer (13 days/year), and the CT (average) exposure estimates were assumedto be one day every other week for the 13 weeks of summer (7 days/year). Adolescents(aged 7 to 18 years old) were assumed to have about three times more frequent exposure,with an RME estimate of 39 days/year and a CT (average) exposure estimate of 20days/year. In addition, an avid recreator scenario was evaluated for which the RMEexposure estimate for adults, adolescents and young children was assumed to be fourtimes a week for 6 months of the year (104 days/year), and the CT (average) exposureestimate was assumed to be approximately twice a week for 6 months of the year (52days/year).

Hudson River PCBs Site Record of Decision
36
• Monte Carlo Probabilistic Analysis. Monte Carlo simulation is a form of probabilistic
analysis. In addition to the point estimate analyses, a Monte Carlo analysis wasperformed to provide a range of estimates of the cancer risks and non-cancer healthhazards associated with the fish ingestion pathway. The Monte Carlo analysis helps toevaluate variability in exposure parameters (e.g., differences within a population’s fishingestion rates, number of years anglers are exposed, body weight, etc.) and uncertainty(i.e., lack of complete knowledge about specific variables).
8.1.3 Toxicity
The toxicity assessment determines the types of adverse health effects associated with PCBexposures and the relationship between the magnitude of exposure (dose) and severity of adverseeffects (response). Potential health effects for PCBs include the risk of developing cancer over alifetime. Other non-cancer health effects, such as changes in the normal functions of organswithin the body (e.g., changes in the effectiveness of the immune system), are also associatedwith PCB exposure. Some of the 209 PCB congeners are considered to be structurally andmechanistically similar to dioxin and exert dioxin-like effects.
• Sources of Toxicity Information. The HHRA used the current consensus toxicity valuesfor PCBs from EPA’s Integrated Risk Information System (IRIS) in evaluating the cancerrisk and non-cancer health effects of PCBs. IRIS provides the primary database ofchemical-specific toxicity information used in Superfund risk assessments. More recenttoxicity data are provided in Appendix D of the HHRA. These data do not change EPA’suse of IRIS values. For the dioxin-like PCBs, the HHRA used toxicity information fordioxin (2,3,7,8-TCDD) provided in EPA’s 1997 Health Effects Assessment SummaryTables.
• Cancer. EPA has determined that PCBs cause cancer in animals and probably causecancer in humans (B2 classification or likely to cause cancer in humans). EPA’s cancerslope factors (CSFs) for PCBs represent plausible upper bound estimates, which meansthat EPA is reasonably confident that the actual cancer risks will not exceed the estimatedrisks calculated using the CSFs.
For fish ingestion, the pathway determined to be of greatest concern, CSFs of 2 (mg/kg-day)-1 and 1 (mg/kg-day)-1 were used for the RME and CT (average) exposure,respectively. For dermal and inhalation exposures, a CSF of 2 (mg/kg-day) -1 was usedwith a dermal absorption fraction of 14%, consistent with the IRIS chemical file. Forinhalation, a CSF of 0.4 (mg/kg-day) -1 was used. For the dioxin-like PCBs, the CSF for2,3,7,8-TCDD of 150,000 (mg/kg-day) -1 was used. Table 8-8 summarizes the cancertoxicity values used in the HHRA.

Hudson River PCBs Site Record of Decision
37
• Non-Cancer Health Effects. Serious non-cancer health effects have been observed inanimals exposed to PCBs. Studies of Rhesus monkeys exposed through ingestion ofPCBs (i.e., Aroclors 1016 and 1254) indicate a reduced ability to fight infection andreduced birth weight in offspring exposed in utero. Studies of non-cancer health effects,including effects observed in children of mothers who consume PCB-contaminated fish,are being evaluated by EPA as part of the Agency’s IRIS process.
The toxicity assessment is an evaluation of the chronic (7 years or more) adverse healtheffects from exposure to PCBs. The chronic Reference Dose (RfD) represents anestimate (with uncertainty spanning perhaps an order of magnitude or greater) of a dailyexposure level for the human population, including sensitive populations (e.g., children),that is likely to be without an appreciable risk of deleterious effects during a lifetime. Chemical exposures exceeding the RfD do not predict specific disease. For the fishingestion pathway, the oral RfD for Aroclor 1254 of 2 x 10⁻⁵ mg/kg-day was used for theRME and CT (average) exposures, because the congener analysis of fish samples mostclosely resembled Aroclor 1254. For the sediment and water ingestion pathways, the oralRfD for Aroclor 1016 of 7 x 10⁻⁵ mg/kg-day was used because analyses of sediment andwater samples most closely resemble Aroclor 1016. For the dermal contact pathway,dermal RfDs were extrapolated from the oral RfD for Aroclor 1016. Table 8-9summarizes the non-cancer toxicity values used in the HHRA.
8.1.4 Risk Characterization
This final step in the HHRA combines the exposure and toxicity information to provide aquantitative assessment of site risks. Exposures are evaluated based on the potential risk fordeveloping cancer and the potential for non-cancer health hazards.
Cancer Risks
Cancer risk is expressed as a probability. For example, a 10-4 cancer risk means a “one in10,000 excess cancer risk,” or an increased risk of an individual developing cancer of one in10,000 as a result of exposure to site contaminants under the conditions used in the ExposureAssessment. Under the federal Superfund program, EPA’s goal for protection is an excesscancer risk of 10-6 or less for the RME individual. Acceptable exposures are an individuallifetime excess cancer risk at or below the range of 10-4 to 10-6 (corresponding to a one in 10,000to a one in 1,000,000 excess cancer risk).
Excess lifetime cancer risk is calculated from the following equation:
Risk = CDI x CSF
where: Risk = a unitless probability (e.g., 1 x 10⁻³ of an individual developingcancer)

Hudson River PCBs Site Record of Decision
38
CDI = Chronic Daily Intake averaged over 70 years (mg/kg-day)CSF = Cancer Slope Factor, expressed as (mg/kg-day)-1
At this Site, cancer risks to the RME individual associated with ingestion of fish are aboveEPA’s generally acceptable levels, as shown below (see also Table 8-10). In addition, cancerrisks to the average (CT) individual associated with ingestion of fish are above EPA’s goal forprotection (see also Table 8-11). Cancer risks from exposure to dioxin-like PCBs (i.e.,approximately 1 x 10⁻³) were comparable to the cancer risks from the non-dioxin-like PCBspresented below for fish ingestion.
Point Estimate Cancer Risk Summary – Upper H udson River
Pathway CT (Average) Cancer Risk RME Cancer R isk
Ingestion of Fish
Adult
Adolescent
Young Ch ild
Total
1 x 10⁻⁵ (1 in 100,000)
7 x10⁻⁶ (7 in 1,000,000)
1 x 10⁻⁵ (1 in 100,000)
3 x 10⁻⁵ (3 in 100,000)
6 x 10⁻⁴ (6 in 10,000)
4 x 10⁻⁴ (4 in 10,000)
4 x 10⁻⁴ (4 in 10,000)
1 x 10⁻³ (1 in 1,000)
Expo sure to Sed iment*
Baseline Recreator
Avid Recreator
2 x 10⁻⁷ (2 in 10,000,000)
1 x 10⁻⁶ (1 in 1,000,000)
2 x 10⁻⁶ (2 in 1,000,000)
9 x 10⁻⁶ (9 in 1,000,000)
*Total risk for young child (aged 1-6), adolescent (aged 7-18), and adult (over 18).
In addition to these point estimate calculations, EPA calculated cancer risks for ingestion of fishin the Upper Hudson River using a Monte Carlo analysis. The Monte Carlo analysis, which wascomposed of 72 combinations of input parameters for 10,000 simulated anglers (for a total of720,000 computer simulations), showed that EPA’s RME point estimates were generally withinthe high-end (> 90th percentile) for cancer risks. For the cancer risk assessment, the pointestimate RME value for fish ingestion (1 x 10⁻³) falls approximately at the 95th percentile fromthe Monte Carlo base case analysis. The point estimate CT (average) value (3 x 10⁻⁵) and theMonte Carlo base case 50th percentile value (6 x 10⁻⁵) are similar. The results of the Monte Carloanalysis support the point estimate calculations.
Non-Cancer Health Hazards
The potential for non-cancer health effects is evaluated by comparing an exposure level over aspecified time period (e.g., 7 years) with an RfD derived for a similar exposure period. An RfDrepresents a level that an individual may be exposed to that is not expected to cause anydeleterious effect. The ratio of exposure to toxicity is called a Hazard Quotient (HQ). An HQless than 1 indicates that a receptor’s dose of a single contaminant is less than the RfD, and thattoxic non-carcinogenic effects from that chemical are unlikely. An HI represents the sum of theindividual exposure levels for different chemicals and different media (e.g., soil, fish) compared
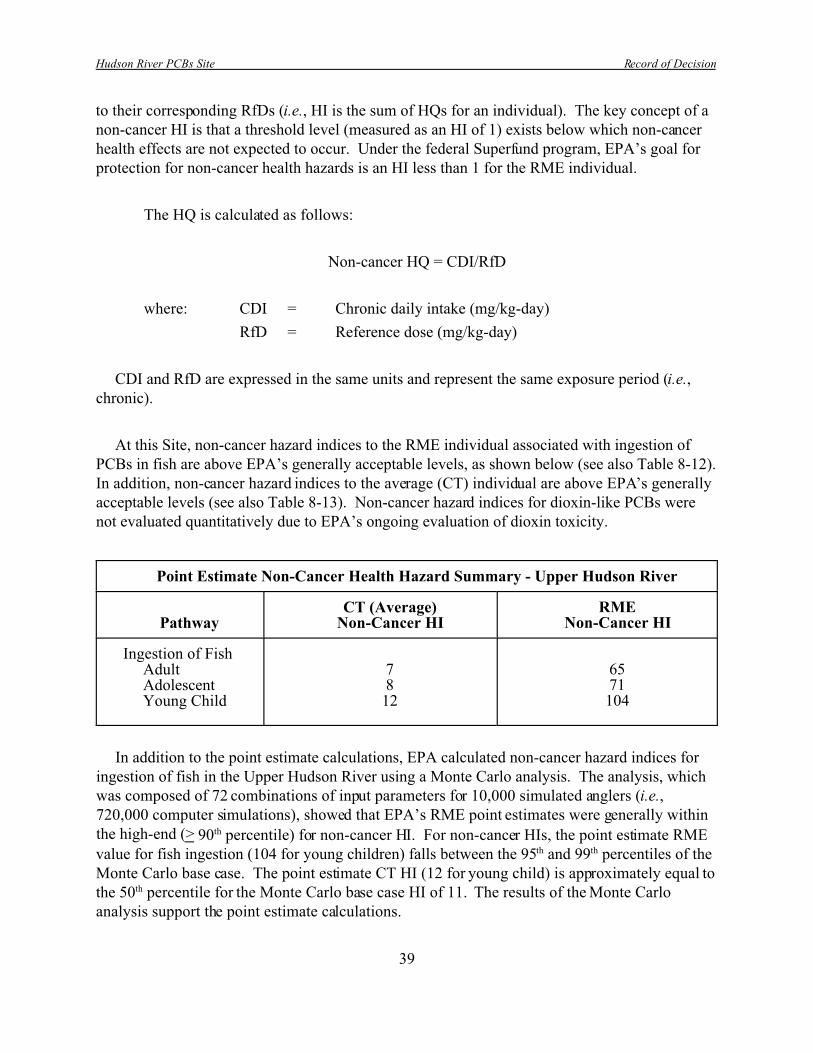
Hudson River PCBs Site Record of Decision
39
to their corresponding RfDs (i.e., HI is the sum of HQs for an individual). The key concept of anon-cancer HI is that a threshold level (measured as an HI of 1) exists below which non-cancerhealth effects are not expected to occur. Under the federal Superfund program, EPA’s goal forprotection for non-cancer health hazards is an HI less than 1 for the RME individual.
The HQ is calculated as follows:
Non-cancer HQ = CDI/RfD
where: CDI = Chronic daily intake (mg/kg-day)
RfD = Reference dose (mg/kg-day)
CDI and RfD are expressed in the same units and represent the same exposure period (i.e.,chronic).
At this Site, non-cancer hazard indices to the RME individual associated with ingestion ofPCBs in fish are above EPA’s generally acceptable levels, as shown below (see also Table 8-12). In addition, non-cancer hazard indices to the average (CT) individual are above EPA’s generallyacceptable levels (see also Table 8-13). Non-cancer hazard indices for dioxin-like PCBs werenot evaluated quantitatively due to EPA’s ongoing evaluation of dioxin toxicity.
Point Estimate Non-Cancer Health Hazard Summary - Upper Hudson River
PathwayCT (Average)
Non-Cancer HIRME
Non-Cancer HI
Ingestion of Fish Adult Adolescent Young Child
7812
6571104
In addition to the point estimate calculations, EPA calculated non-cancer hazard indices foringestion of fish in the Upper Hudson River using a Monte Carlo analysis. The analysis, whichwas composed of 72 combinations of input parameters for 10,000 simulated anglers (i.e.,720,000 computer simulations), showed that EPA’s RME point estimates were generally withinthe high-end (> 90th percentile) for non-cancer HI. For non-cancer HIs, the point estimate RMEvalue for fish ingestion (104 for young children) falls between the 95th and 99th percentiles of theMonte Carlo base case. The point estimate CT HI (12 for young child) is approximately equal tothe 50th percentile for the Monte Carlo base case HI of 11. The results of the Monte Carloanalysis support the point estimate calculations.

Hudson River PCBs Site Record of Decision
40
Uncertainty
The process of evaluating human health cancer risks and non-cancer hazard indices involvesmultiple steps. Inherent in each step of the process are uncertainties that ultimately affect thefinal cancer risks and non-cancer hazard indices. Uncertainties may exist in numerous areas. Important sources of uncertainty in the HHRA are as follows:
• PCB Bioaccumulation Modeling Uncertainty. The use of a bioaccumulation model togenerate future concentrations of PCBs in fish introduces uncertainty in the fish EPCsused in the HHRA calculations. EPA minimized this unavoidable source of uncertaintyto the extent possible by developing a bioaccumulation model specifically for the UpperHudson (FISHRAND), calibrating the model to the extensive database for the UpperHudson and submitting the model to external peer review. Based on the modelcalibration (i.e., the ability of the fish bioaccumulation model to capture the historicalobserved lipid-normalized PCB measurements in fish) and the feedback received duringthe peer review, the model uncertainty is not sufficient to change the overall conclusionof the HHRA that cancer risks and non-cancer hazard indices due to ingestion of fish areabove acceptable levels. Furthermore, the sensitivity/uncertainty analysis conducted forthe Monte Carlo analysis showed that this overall conclusion remains the same despitechanges in the fish EPCs due to variations in the fish species caught (different speciestend to have different characteristic PCB uptake) and variations in fishing location (theconcentration tends to decline substantially between the upper and lower reaches of theUpper Hudson River).
• Fish Ingestion Rate. Uncertainty is associated with the fish ingestion rate. Thisuncertainty is unavoidable because the fish consumption advisories that are in place donot represent baseline conditions, so the surveys of anglers in the Upper Hudson Rivercould not be used to quantify fish consumption in the absence of remediation andinstitutional controls. EPA minimized this source of uncertainty by using fishconsumption data for freshwater bodies in New York State without specific consumptionadvisories taken from a 1991 New York Angler survey published in a 1992 CornellUniversity report by Dr. Connelly and colleagues. In addition, the sensitivity/uncertaintyanalysis conducted for the Monte Carlo analysis showed that, despite the use of differentfish ingestion rates based on Maine, Michigan, and Lake Ontario angler surveyspublished in the scientific literature, the overall conclusion of the HHRA--that cancerrisks and non-cancer hazard indices due to ingestion of fish are above levels of concern--remains the same. Lastly, the HHRA peer reviewers specifically evaluated the fishingestion rate for the RME adult used in the HHRA calculations (31.9 grams/day orapproximately one-half pound fish meal per week) and found it to be reasonable andconsistent with the NYSDOH level of 32.0 grams/day (current general advisory byNYSDOH for years 2000-2001).
Hudson River PCBs Site Record of Decision
41
• PCB Toxicity. Toxicity values are inherently uncertain. EPA describes the uncertaintyin the cancer toxicity values as extending in both directions (i.e., contributing to possibleunderestimation or overestimation of cancer slope factors). However, the CSFs weredeveloped to represent plausible upper bound estimates, which means that EPA isreasonably confident that the actual cancer risk will not exceed the estimated riskcalculated using the CSF. The CSFs used in the HHRA were externally peer reviewedand supported by the panel of expert scientists (separately from the Hudson River peerreview) and are the most current values recommended by EPA in IRIS.
Non-cancer toxicity values are also uncertain. The current oral RfDs for Aroclor 1016 and1254, which were used in the HHRA, have uncertainty factors of 100 and 300, respectively. TheRfD for Aroclor 1016 was externally peer-reviewed and supported by the panel of scientists. The RfD for Aroclor 1254 was developed using the same methodology as Aroclor 1016 and wasinternally peer-reviewed. Since these RfDs were developed, a number of recent national andinternational studies have reported possible associations between developmental and neurotoxiceffects in children from prenatal or postnatal exposures to PCBs. In light of these new studies,the current RfDs are currently being evaluated as part of the IRIS process. It would beinappropriate to prejudge the results of the IRIS evaluation at this time.
• PCB Body Burden. The fact that any previous exposures (either background or pastconsumption of PCB-contaminated fish) may still be reflected in an individual’s bodyburden today is an additional source of uncertainty and may result in an underestimate ofnon-cancer hazard indices and cancer risks.
8.2 Ecological Risk Assessment
The site-specific ERA evaluated the likelihood of current and future adverse ecological effectsas a result of exposure to PCBs, as documented in the Revised ERA. The Revised ERAsynthesizes into a single report the August 1999 Ecological Risk Assessment, the December1999 Ecological Risk Assessment for Future Risks in the Lower Hudson River, their respectiveResponsiveness Summaries issued in March 2000 and August 2000, and the November 2000Response to Peer Review Comments (on the August 1999 Ecological Risk Assessment).
The Hudson River has a variety of ecosystems. The Upper Hudson River is non-tidal,consists of a series of pools separated by dams and is entirely freshwater. In contrast, the LowerHudson River is tidal, does not have dams and is freshwater in the vicinity of the Federal Dam,becoming brackish and increasingly more saline toward the Battery. Both the Upper and LowerHudson River have deep water environments as well as shallow nearshore areas with aquaticvegetation. The Lower Hudson area has areas designated as significant habitats, which are

Hudson River PCBs Site Record of Decision
42
unique, unusual or necessary for the propagation of key species. These include freshwater andbrackish shallows, mudflats, marshes, swamp forests, deepwater areas and creeks.
Plants and animals in all portions of the Hudson River are natural resources and need to beprotected. Habitats of the Hudson River support threatened or endangered fish, reptiles, birds,and mammals, in addition to rare, threatened and endangered plants. The bald eagle, the Karnerblue butterfly and the Indiana bat are three species identified by the U.S. Fish and WildlifeService as under their jurisdiction which could be affected by the Hudson River PCB cleanup. The shortnose sturgeon has been identified by the National Marine Fisheries Service as afederally-listed endangered species that is found in the Lower Hudson River south of the FederalDam at Troy. The need for additional survey activities regarding these species will be addressedduring the remedial design. Table 8-14 provides the listing of New York State Rare and ListedSpecies and Habitats occurring in the vicinity of the Hudson River. All threatened, endangeredand special concern species listed in the table have been sighted in and along the Lower HudsonRiver, and some of them (e.g., bald eagle and short-eared owl) are also found in the UpperHudson River Valley.
This discussion emphasizes ecological risks due to PCBs in the Upper Hudson that exceedEPA’s goals for protection. Ecological risks in the Lower Hudson from PCBs are generallylower than those of the Upper Hudson, due to the lower concentrations of site-related PCBs inthe Lower Hudson. Nevertheless, ecological risks in the Lower Hudson are also above EPA’slevels of concern.
Consistent with Superfund policy and guidance, the ERA is a baseline risk assessment andtherefore assumes no actions (remediation) to control or mitigate hazardous substance releases. The following discussion summarizes the ERA with respect to the four basic steps of theSuperfund ERA process: 1) Problem Formulation, 2) Exposure Assessment, 3) EffectsAssessment, and 4) Risk Characterization.
8.2.1 Problem Formulation
Problem Formulation establishes the goals, breadth, and focus of the ecological riskassessment. Through Problem Formulation, the questions and issues that will be addressed aredefined based on identifiable complete or potentially complete exposure pathways and ecologicaleffects and a conceptual model is developed that illustrates the relationships among sources,pathways, and receptors.
The chemicals of concern at the Site are PCBs, including dioxin-like PCBs. Fish at the Sitehave been collected by the NYSDEC for more than 25 years. Fish samples have been analyzedfor PCBs, total DDT, total chlordane, total endrin, total endosulfan, dieldrin, aldrin, mirex, total

Hudson River PCBs Site Record of Decision
43
heptachlor, total hexachlorobenzene, toxaphene, methoxychlor, individual polycyclic aromatichydrocarbons, cadmium, mercury, dioxins, and dibenzofurans. PCBs (total and dioxin-like) wereidentified as the chemicals of concern based on previous analytical results, the toxicity values forthe chemicals, and the site definition (i.e., the Site was placed on the Superfund NPL as a resultof PCB contamination in the river).
Animals and plants living in or near the river, such as invertebrates, fish, amphibians, andwater-dependent reptiles, birds, and mammals, are or can be exposed to PCBs directly and/orindirectly through the food chain. Ecological exposure to PCBs is primarily an issue ofbioaccumulation through the food chain rather than direct toxicity, because PCBs bioaccumulatein the environment by bioconcentrating (being absorbed from water and accumulated in tissue tolevels greater than those found in surrounding water) and biomagnifying (increasing in tissueconcentrations as they go up the food chain through two or more trophic levels). As a result, theecological risk assessment emphasizes indirect exposure at various levels of the food chain toaddress PCB-related risks at higher trophic levels. The ecological conceptual model is providedin Figure 8-1.
The assessment endpoints are benthic community structure, which is a food source for localfish and wildlife, sustainability (survival, growth, and reproduction) of local forage fishpopulations, local piscivorous fish populations and local omnivorous fish populations, andprotection (survival and reproduction) of insectivorous bird and mammal populations, waterfowlpopulations, piscivorous bird and mammal populations and omnivorous mammal populations(see Table 8-15). The bald eagle, a federally-listed and New York State-listed threatenedspecies, was evaluated under the assessment endpoint for piscivorous birds. Measurementendpoints were defined for each assessment endpoint.
Receptors were selected to be representative of various feeding preferences, predatory levelsand habitats (aquatic, wetland, shoreline). Receptors of concern include the benthicmacroinvertebrate community and seven species of fish, as represented by the pumpkinseed(Lepomis gibbosus), spottail shiner (Notropis hudsonius), brown bullhead (Ictalurus, nowAmeiurus nebulosus), white perch (Morone americana), yellow perch (Perca flavescens),largemouth bass (Micropterus salmoides) and striped bass (Morone saxatilis). Five birdreceptors were selected: the tree swallow (Tachycineta bicolor), mallard (Anas platyrhychos),belted kingfisher (Ceryle alcyon), great blue heron (Ardea herodias) and bald eagle (Haliaeetusleucocephalus). Four mammal receptors were selected: the little brown bat (Myotis lucifugus),raccoon (Procyon lotor), mink (Mustela vison) and river otter (Lutra canadensis).
8.2.2 Exposure Assessment
The exposure assessment includes a quantitative evaluation of contaminant release, migration,and fate; characterization of exposure parameters; and measurement or estimation of exposure

Hudson River PCBs Site Record of Decision
44
point concentrations. Complete exposure pathways and exposure parameters (e.g., body weight,prey ingestion rate, home range) used to calculate the concentrations or dietary doses to whichthe receptors of concern may be exposed were obtained from EPA references, the scientificliterature and directly from researchers.
The ERA utilizes documents on the nature and extent of PCB contamination at the Sitedeveloped as part of the Reassessment RI/FS (e.g., February 1997 Data Evaluation andInterpretation Report, July 1998 Low Resolution Sediment Coring Report, Database for theHudson River PCBs Reassessment RI/FS [Release 5.0, October 2000], January 2000 RevisedBaseline Modeling Report and associated responsiveness summaries). These ReassessmentRI/FS documents provided both current and future (i.e., forecast) concentrations of PCBs in fish,sediments and river water. A food chain model was then used to estimate receptor exposure.
• PCBs in Fish: PCB concentrations in fish (pumpkinseed, spottail shiner, brown bullhead,largemouth bass, yellow perch and white perch) were based on measured wet-weightPCB concentrations in the sampling database and modeled concentrations generated byEPA’s peer-reviewed bioaccumulation model, FISHRAND, for the period 1993 to 2018. Concentrations of PCBs in striped bass were estimated from the FISHRAND results forlargemouth bass by applying a ratio of striped bass to largemouth bass body burdens asmeasured in the fish sampling database. Average concentrations of PCBs measured infish in 1998 (converted to Tri+ PCBs) range from 41.25 mg/kg for carp in the Stillwaterreach of the Upper Hudson (RM 168-178) to 1.16 mg/kg for yellow perch below theFederal Dam at Troy (RM 142-153.2) (see Table 8-16).
• PCBs in Birds: The U.S. Fish and Wildlife Service has analyzed PCB concentrations intree swallow eggs and nestlings collected in 1994 and 1995 and is currently analyzingsamples from tree swallows, great blue herons, bald eagles, and bald eagle prey collectedby the U.S. Fish and Wildlife Service and New York State Department of EnvironmentalConservation in 1997-1999 (see Table 8-17). Tree swallow egg total PCB concentrationaverages in 1994 range from 42.1 mg/kg at location SA13 to 6.28 mg/kg at Lock 9. Scientific papers published in peer reviewed journals summarized the two years of study. Tree swallow egg total PCB concentrations averaged between the two years of samplecollection range from 29.5 mg/kg at location SA13 to 5.904 mg/kg at Locks 8 and 9 ofthe Champlain Canal. Nestling PCB concentrations averaged between 1994 and 1995range from 62.2 mg/kg at location REMN to 0.721 mg/kg at Locks 8 and 9 of theChamplain Canal. Average concentrations of total PCBs in nestlings in 1994 range from55.8 mg/kg at location SA13 to 0.377 mg/kg at Lock 9. Bald eagle eggs collected fromthe Lower Hudson River in 1998 and 1999 contain between 62 mg/kg and 20 mg/kgPCBs. Plasma collected from Lower Hudson River bald eagles from 1997 through 1999contained PCB concentrations ranging from 14.2 mg/kg to 0.214 mg/kg.

Hudson River PCBs Site Record of Decision
45
• PCBs in Sediment: PCB concentrations in surface sediment (0 to 5 cm) were based on1993 measured concentrations and modeled concentrations generated by EPA’s peer-reviewed PCB fate and transport model, HUDTOX, for the period 1993 to 2018. The95% upper confidence limit on the mean (UCLM) Tri+ PCB concentrations measured insediment in 1993 range from 54.17 mg/kg at Stillwater in the Upper Hudson (RM 168) tojust above 1 mg/kg at RM 122.4 in the Lower Hudson (see Table 8-18).
• PCBs in River Water: PCB concentrations in river water were based on measured
concentrations in the Reassessment database as well as modeled concentrations generatedby HUDTOX. The 95% UCLM Tri+ PCB concentrations measured in the Upper Hudsonwater column were 2.33E-04 mg/L in Thompson Island Pool (RM 189), 4.15E-4 mg/L atStillwater (RM 168) and 1.96E-4 mg/L at the Federal Dam (RM 154). The 95% UCLMTri+ PCB concentrations measured in Lower Hudson water were 7.70E-4 mg/L at theupper end of the Lower Hudson (RM 137.2-143.5) and just under 9.5E-5 mg/L at thelower end of the Lower River. Table 8-19 presents the average and 95% UCLMconcentrations of Tri+ PCBs in the Upper and Lower Hudson river water.
• PCBs in Benthic Invertebrates: PCB concentrations in benthic invertebrates were basedon 1993 measured concentrations. The 95% UCLM Tri+ PCB concentrations measuredin benthic invertebrates in 1993 range from about 46 mg/kg at Stillwater in the UpperHudson (RM 168) to just less than 1 mg/kg in portions of the Lower Hudson (see Table8-20).
Subsequent to the release of the ERA, in April 2001 NYSDEC announced preliminaryfindings of studies of wild mink, river otter and shrew in the Upper Hudson River Valley. NYSDEC stated that these studies raise concerns about the health of wildlife resulting from thePCB contamination in the river. The studies show elevated levels of PCBs in mink and otter thatlive near the river, with an average PCB level in river otter within 10 kilometers of the UpperHudson River of 172 mg/kg on a lipid based PCB concentration in the liver and an average levelfor mink within one kilometer of the river of 33 mg/kg on a lipid based PCB concentration in theliver. The results for mink are comparable to those of NYSDEC’s last Hudson River minksurvey, which was conducted in 1982-1984. NYSDEC reported that the PCB levels also aresimilar to concentrations found in fish in the Hudson River, which have not dropped significantlysince the mid-1980s. Based on scientific research of mink and European otters, NYSDECdetermined that the PCB levels found in Upper Hudson River mink and otter may cause adversehealth effects and reproductive problems in these animals.
8.2.3 Effects Assessment
PCBs have been shown to cause lethal and sub-lethal reproductive, developmental,immunological and biochemical effects. The risk assessment limited its focus to adverse impacts

Hudson River PCBs Site Record of Decision
46
on survival, growth and reproduction. The ecological effects assessment includes literaturereviews, field studies and toxicity tests that correlate concentrations of PCBs to effects onecological receptors. Toxic equivalency factors, based on the toxicity of dioxin, have beendeveloped for the dioxin-like PCB congeners.
Toxicity reference values (TRVs) were used to estimate the potential for ecological risk at theSite as a result of exposure to PCBs (see Revised ERA tables 4.25a-b, 4.26a-b, and 4.27a-b) forfish, birds, and mammals, respectively. TRVs were selected based on Lowest Observed AdverseEffects Levels (LOAELs) and/or No Observed Adverse Effects Levels (NOAELs) fromlaboratory and/or field based studies reported in the scientific literature. LOAELs are the“lowest” values at which adverse effects have been observed, and NOAELs are the highest doseor body burden at which an adverse effect was not observed. These TRVs reflect the effects ofPCBs and dioxin-like PCB congeners on the survival, growth, and reproduction of fish andwildlife species in the Hudson River. Reproductive effects (e.g., egg maturation, egghatchability and survival of juveniles) were generally the most sensitive endpoints for animalsexposed to PCBs.
8.2.4 Risk Characterization
This final step in the ERA combines the exposure and toxicity information to provide aquantitative assessment of site risks to ecological receptors at various trophic levels. Risks wereestimated by comparing the results of the Exposure Assessment (measured or modeledconcentrations of PCB in receptors of concern) to the TRVs developed in the EffectsAssessment. The ratio of these two numbers is called a Toxicity Quotient (TQ). TQs equal to orgreater than 1 are typically considered to indicate potential risk to ecological receptors.
The risk characterization indicates that receptors in close contact to the Upper and LowerHudson River are above EPA’s level of concern as a result of exposure to PCBs. For example,as shown below and in Tables 8-21, 8-22, 8-23, and 8-24, TQs for the river otter and mink inRiver Section 1 (RM 189) are significantly above one, on both a NOAEL and a LOAEL basis,for the entire forecast period (i.e., beginning in 1993 and ending in 2018). The TQs for the riverotter in River Section 3 (RMs 168 and 154) and in the Lower Hudson River (RMs 152, 113, 90,and 50) are all greater than one for the entire forecast period.

Hudson River PCBs Site Record of Decision
47
Toxicity Quotients (TQs) for Dietary DoseUpper Hudson River - Thompson Island Pool (RM 189)
Receptor &Year
Tri+ PCBs Dioxin-like PCBs
NOAEL LOAEL NOAEL LOAEL
River Otter 1993 2018
1329 246
133 25
3003 554
107 20
Mink 1993 2018
25765
266.5
737171
266.1
In addition to the point estimate calculations, EPA calculated toxicity quotients forrepresentative ecological receptors in a probabilistic dose response analysis. The probabilisticdose response analysis for the river otter showed, for example, in 2015 female otters at RM 189have a greater than 80 percent probability of experiencing a substantial (greater than 80 percent)decrease in fecundity. At RM 154, female otters have a 30 percent probability of experiencing atleast a 50 percent reduction in fecundity. The probabilistic dose response analysis showedsimilar, but somewhat less severe, effects for the mink. For example, in 2015, female mink atRM 189 have a greater than 95 percent probability of experiencing a substantial (greater than 50percent) reduction in fecundity.
The major findings of the ERA are:
• Birds and mammals that eat PCB-contaminated fish from the Hudson River, such as thebald eagle, belted kingfisher, great blue heron, mink and river otter are at risk at thepopulation level. PCBs may adversely affect the survival, growth, and reproduction ofthese species. Piscivorous mammals, represented by the river otter, are at the greatestrisk due to their feeding patterns.
• Fragile populations of threatened and endangered species, represented by the bald eagle,are particularly susceptible to adverse effects from PCB exposure.
• Piscivorous fish (e.g., largemouth bass and striped bass) and omnivorous fish (e.g., brownbullhead and shortnose sturgeon) in the Hudson River may be adversely affected (i.e.,reduced survival, growth and/or reproduction) from exposure to PCBs.

Hudson River PCBs Site Record of Decision
48
• Omnivorous animals, such as the raccoon, that derive a large portion of their food fromthe Hudson River may be adversely affected (i.e., reduced survival, growth, and/orreproduction) from exposure to PCBs.
• Birds and mammals that feed on insects with an aquatic stage spent in the Hudson River,such as the tree swallow and little brown bat, may be adversely affected (i.e., reducedsurvival, growth and/or reproduction), particularly insectivorous mammals living in theThompson Island Pool area.
• The risks to fish and wildlife are greatest in the Upper Hudson River (in particular theThompson Island Pool) and decrease in relation to PCB concentrations down river. Based on modeled future PCB concentrations, piscivorous species are expected to be atconsiderable risk through 2018 (the entire forecast period).
• PCB concentrations in water and sediments in the Upper and Lower Hudson Rivergenerally exceed standards and criteria and guidelines established to be protective of theenvironment.
• Forage fish, such as the pumpkinseed and spottail shiner, are unlikely to be affectedoutside of the Thompson Island Pool.
• Waterfowl, excluding piscivorous birds, feeding on animals and plants in the HudsonRiver are unlikely to be adversely affected (i.e., reduced survival, growth and/orreproduction) from exposure to PCBs.
Uncertainty
The process of evaluating ecological risks involves multiple steps. Inherent in each step areuncertainties that ultimately affect the final calculated risks. Important sources of uncertainty inthe ERA are as follows:
• PCB Bioaccumulation Modeling Uncertainty: The use of a bioaccumulation model togenerate future concentrations of PCBs in fish introduces uncertainty. As noted for theHHRA, EPA took steps to minimize this unavoidable source of uncertainty to the extentpossible. Model uncertainty is not sufficient to change the overall conclusion that birdsand mammals that eat fish from the Hudson River are at risk above levels of concern.
• Exposure Uncertainty: Uncertainty in the exposure assessment is present due to a lack ofcomplete knowledge regarding exposure, such as the ingestion rates of contaminated prey

Hudson River PCBs Site Record of Decision
49
by receptor species. This source of uncertainty was reduced by applying the most localdiet information available (e.g., data for NYS populations where Hudson River data werenot available), using median values and contacting researchers directly to determineappropriate exposure parameters.
• Toxicological Uncertainty: There is uncertainty associated with the selection of theTRVs. To minimize this uncertainty, EPA reviewed and summarized hundreds of studiesof the effects of PCBs on animals, including a wide variety of laboratory and field basedstudies that examined a variety of test species, doses, exposures, instruments andanalytical methods prior to selection of the final TRVs. In addition, EPA quantitativelyexamined the uncertainty associated with interspecies variability in sensitivity to PCBsby developing alternative TRVs for some Hudson River receptor species. Uncertaintyassociated with the toxicity of dioxin-like PCBs was reduced by developing TRVs basedon the toxicity of individual PCB congeners rather than on the toxicity of 2,3,7,8,-TCDD(dioxin).
Despite the uncertainty, the sensitivity and uncertainty analyses conducted in the ERAshowed that, even at the 5th percentile, TQs for bald eagle egg, kingfisher egg, mink and riverotter do not fall below 1 for any location or year, except for mink at RM 154 in 2015. Therefore,ecological risk remains above levels of concern under the federal Superfund program.
Basis for Action
The excess cancer risk and non-cancer health hazards associated with human ingestion of fish,as well as the ecological risks associated with ingestion of fish by birds, fish and mammals, areabove acceptable levels under baseline conditions. The response action selected in this ROD isnecessary to protect the public health or welfare and the environment from actual releases ofhazardous substances into the environment.
9. REMEDIAL ACTION OBJECTIVES
Consistent with the NCP and RI/FS Guidance, EPA developed remedial action objectives(RAOs) for protection of human health and the environment. RAOs specify the contaminantsand media of concern, exposure routes and potential receptors, and an acceptable concentrationlimit or range for each contaminant for each of the various media, exposure routes and receptors. RAOs were then used to establish specific preliminary remediation goals (PRGs) for the Site. PRGs were established after review of both the preliminary chemical-specific ARARs and risk-based concentrations and serve to focus the development of alternatives or remedial technologiesthat can achieve the remedial goals.

Hudson River PCBs Site Record of Decision
50
9.1 Remedial Action Objectives
RAOs address the protection of human health and protection of the environment. Thefollowing five RAOs have been established for the Hudson River PCBs site.
• Reduce the cancer risks and non-cancer health hazards for people eating fish from theHudson River by reducing the concentration of PCBs in fish.
The risk-based PRG for the protection of human health is 0.05 mg/kg PCBs in fish filletbased on non-cancer hazard indices for the RME adult fish consumption rate of one half-pound meal per week (this level is protective of cancer risks as well). Other targetconcentrations are 0.2 mg/kg PCBs in fish fillet, which is protective at a fish consumptionrate of one half-pound meal per month and 0.4 mg/kg PCBs in fish fillet, which isprotective of the CT or average angler, who consumes one half-pound meal every twomonths. Attaining such levels might facilitate the relaxation of the fish consumptionadvisories and fishing restrictions (e.g., the “eat none” advisory for the Upper Hudsoncould be relaxed as conditions improve).
• Reduce the risks to ecological receptors by reducing the concentration of PCBs in fish.
The risk-based PRG for the ecological exposure pathway is a range from 0.3 to 0.03mg/kg PCBs in fish (largemouth bass, whole body), based on the LOAEL and theNOAEL for consumption of fish by the river otter. The ecological PRG is consideredprotective of all the ecological receptors evaluated because it was developed for the riverotter, the piscivorous mammal calculated to be at greatest risk from PCBs at the Site. Inaddition, a range from 0.7 to 0.07 mg/kg PCBs in spottail shiner (whole fish) wasdeveloped based on the NOAEL and LOAEL for the mink, which is a species known tobe sensitive to PCBs. Other species, such as the bald eagle, were considered but are atless risk than the river otter.
• Reduce PCB levels in sediments in order to reduce PCB concentrations in river(surface) water that are above surface water ARARs.
The ARARs for surface water are: 0.5 :g/L [500 ng/L] total PCBs, the federal maximumcontaminant level (MCL) for drinking water; 0.09 :g/L [90 ng/L] total PCBs, the NewYork State standard for protection of human health and drinking water sources; 1 ng/Ltotal PCBs, the federal Ambient Water Quality Criterion; 0.12 ng/L total PCBs, the NewYork State standard for protection of wildlife; 0.001 ng/L total PCBs, the New York Statewater quality standard for the protection of the health of human consumers of fish; 0.014:g/L [14 ng/L] total PCBs, the criteria continuous concentration (CCC) Federal Water

Hudson River PCBs Site Record of Decision
51
Quality Criterion (FWQC) for freshwater; and 0.03 :g/L [30 ng/L] total PCBs, the CCCFWQC for saltwater.
• Reduce the inventory (mass) of PCBs in sediments that are or may be bioavailable.
PCBs in sediments may become bioavailable by various mechanisms (e.g., groundwateradvection, pore water diffusion, scour, benthic food chains, etc.). Reducing the inventoryof PCBs in sediments that are susceptible to such mechanisms will ultimately reducePCB levels in fish and the associated risks to human health and the environment.
• Minimize the long-term downstream transport of PCBs in the river.
PCBs that are transported downstream in the water column are available to biota,contributing to the risks from the Site. Downstream transport also moves PCBs fromhighly contaminated areas to lesser contaminated or clean areas, and from the UpperHudson River to the Lower Hudson River.
There are no federal or New York State cleanup standards for PCBs in sediment. Althoughthere is no specific PRG for sediment, the concentrations in biota are driven by exposure to PCBsin both the water and sediment through the aquatic and benthic food chains, respectively. Inaddition, current and future concentrations of PCBs in the water column entering the UpperHudson River are expected to limit the ability of remedial actions to achieve the site-specificPRGs for PCBs in species-weighted fish, as described above.
EPA has adopted the PRGs identified above as the final Remediation Goals for the Site.
9.2 Applicable or Relevant and Appropriate Requirements (ARARs)
Under the description of ARARs set forth in the NCP and CERCLA, many federal and stateenvironmental requirements must be considered. ARARs and “To-Be-Considered” requirements(TBCs) fall into three broad categories, based on the manner in which they are applied at a site. These include chemical-specific, location-specific and action-specific requirements. Thesecategories are described as follows:
Chemical-specific: These are health- or risk-based numerical values or methodologies thatestablish concentration or discharge limits, or a basis for calculating such limits, for particularcontaminants. Chemical-specific ARARs for total PCBs in the water column are:

Hudson River PCBs Site Record of Decision
52
• 0.5 ug/L [500 ng/L] (federal MCL);
• 0.09 ug/L [90 ng/L] (NYS standard for protection of human health and drinkingwater sources);
• 0.03 :g/L [30 ng/L] criteria continuous concentration (CCC) Federal WaterQuality Criterion (FWQC) for saltwater;
• 0.014 :g/L [14 ng/L] CCC FWQC for freshwater;
• 1 ng/L (federal Ambient Water Quality Criterion);
• 0.12 ng/L (NYS standard for protection of wildlife); and
• 0.001 ng/L (NYS standard for protection of human consumers of fish).
If more than one such requirement applies to a contaminant, compliance with the morestringent ARAR is required. No ARARs were identified for the cleanup of contaminated riversediments.
Location-specific: These are restrictions based on the concentration of hazardous substancesor the conduct of activities in specific locations such as wetlands, floodplains and habitats ofendangered species. Examples of man-made features potentially affected include historicdistricts and archaeological sites. Remedial action alternatives may be restricted or precludeddepending on the location or characteristics of a site and the requirements that apply to it.
Action-specific: Action-specific requirements set controls or restrictions on particular kindsof activities related to the management of hazardous substances, pollutants, or contaminants, andare primarily used to assess the feasibility of remedial technologies and alternatives. Examplesof action-specific ARARs include Resource Conservation and Recovery Act (RCRA) monitoringrequirements and TSCA disposal requirements.
Chemical-specific, location-specific, and action-specific ARARs and TBCs are all consideredin the development and evaluation of remedial alternatives. ARARs and TBCs that may beapplicable to various remedial alternatives at this Site were identified in the FS. TBCs are non-promulgated criteria, advisories, guidance, and proposed standards issued by federal or stategovernments. TBCs are not potential ARARs because they are neither promulgated norenforceable, although it may be necessary to consult TBCs to interpret ARARs, or to determinepreliminary remediation goals when ARARs do not exist for particular contaminants, or are notsufficiently protective. Compliance with TBCs is not mandatory, as it is for ARARs, thoughARARs may be waived in certain circumstances.
According to CERCLA Section 121(d)(4), an ARAR may be waived by EPA, providedprotection of human health and the environment is still achieved, under the following six specificconditions:

Hudson River PCBs Site Record of Decision
53
• The selected remedial action is only part of a total remedial action that will attain suchARAR when completed;
• Compliance with such ARAR will result in greater risk to human health and theenvironment than alternative options;
• Compliance with such ARAR is technically impracticable from an engineeringperspective;
• The selected remedial action will attain a standard of performance that is equivalent tothat required under the given ARAR, through use of another method or approach;
• The requirement is a state requirement that has been inconsistently applied in similarcircumstances at other remedial actions within the state; or
• For Superfund-financed remedial actions only, attainment of the ARAR would notprovide a balance between the need for protection of public health and welfare and theenvironment at the facility under consideration, and the availability of money from theFund to respond to other sites that pose a threat, taking into account the relativeimmediacy of such threats.
Compliance with or waiver of ARARs at this Site is discussed in Sections 11.2 and 14.2below.
9.3 Effect of Other PCB Sources on Attaining Remediation Goals
Current and future concentrations of PCBs in the water column entering the Upper HudsonRiver are expected to limit the ability of remedial actions to achieve the stringent RemediationGoals for fish and some of the ARARs for the water column that have been identified for theSite. The upstream (north of Rogers Island) Tri+ PCB load, currently an average of about 13ng/L, is expected to be reduced by further source control work near the GE Hudson Falls plant tobe conducted by GE under NYSDEC authorities. For purposes of its mathematical modelingduring the Reassessment RI/FS, EPA has assumed that such source control will lower theupstream load to an average of 2 ng/L Tri+ PCB beginning January 1, 2005. Whether that levelwill be attained, and whether an even greater reduction is possible -- thus making achievement ofthe PRGs easier -- is not yet clear.
Both the current and projected future combined upstream PCB load (Rogers Island belowHudson Falls but upstream of the hot spots), although low, exceeds the New York State standardfor protection of human consumers of fish (0.001 ng/L total PCBs), the New York State standardfor protection of wildlife (0.12 ng/L total PCBs), and the federal Ambient Water QualityCriterion (AWQC) (1 ng/L total PCBs). However, it does not exceed the New York Statestandard for protection of human health and drinking water sources (0.09 :g/L total PCBs ), thefederal MCL (0.5 :g/L total PCBs) for potable drinking water supplies, the 0.03 :g/L (30 ng/L)CCC FWQC for saltwater, and the 0.014 :g/L (14 ng/L) CCC FWQC for freshwater.

Hudson River PCBs Site Record of Decision
54
Over the long term, concentrations of PCBs in the surface sediments and the water columnwill trend toward equilibrium. As long as a non-zero PCB load exists in the upstream watercolumn, sediment concentrations in the Upper Hudson will also be non-zero, even if thecontaminated sediments were to be fully remediated. The upstream boundary load will result innon-zero PCB concentrations in fish (see Section 13.4). EPA has determined, however, that theselected remedy will significantly reduce the risks to human health and the environment at theSite.
10. DESCRIPTION OF ALTERNATIVES
Following development of the RAOs, EPA conducted a rigorous screening and evaluationprocess in accordance with CERCLA and the NCP. First, potentially applicable remedialtechnologies or process options for addressing PCB-contaminated sediments in the UpperHudson were identified and screened (evaluated) based on effectiveness and technicalimplementability at the Site. Retained technologies were then evaluated in a second screeningbased on effectiveness, implementability and cost. After the second screening, the following fourtechnologies were retained for consideration in the analysis of remedial alternatives : 1) noaction, evaluation of which is required by the NCP; 2) MNA; 3) capping followed by MNA; and4) removal/dredging (i.e., environmental dredging) followed by MNA.
Process options for treatment and disposal that were retained include near-river treatment, off-site disposal, and beneficial use of dredged materials. During the screening analysis, EPAdetermined that it would not be administratively feasible to dispose of dredged sediments in alocally-sited landfill. As a result, EPA eliminated near-river disposal of dredged sediments fromfurther consideration. Treatment technologies, such as thermal desorption, were determined tobe technically feasible but were not retained because of their high cost, and a locally-sitedthermal treatment facility was not expected to be administratively feasible.
After the technology screening, EPA developed and screened remedial alternatives. Aspecified “cleanup value” for PCBs in sediment was not developed for purposes of evaluatingremedial alternatives. Because consumption of fish is the major pathway of concern, EPAdeveloped remedial goals based on PCB concentrations in fish (see Section 9). Therefore, EPAevaluated remedial alternatives based on their ability to reduce PCB concentrations in fish. PCBconcentrations in fish are controlled by PCB concentrations in both the sediment and the watercolumn and, therefore, sediment cleanup is considered the means to the goal of protecting humanhealth and the environment.
For the active technologies (capping and removal), areas of sediment targeted for remediationwere selected based on the potential for those areas to contribute PCBs to the water column andfish through the food chain. The delineation of the target areas considered a number of factors,primarily the inventory of PCBs in the sediment, but also surface sediment concentrations,

Hudson River PCBs Site Record of Decision
55
sediment texture, bathymetry and depth at which the PCB contamination is found. Areas where12 inches or greater of relatively clean surface sediment exist were eliminated fromconsideration. Target areas for remediation were defined as approximately 50,000 square feet (alittle over an acre) or greater, due to practical limitations on the number of separate remediationzones that could be accommodated for a project of this size. In addition, rocky areas, as definedby side-scan sonar, were excluded from consideration due to the difficulty of remediating rockyareas. Moreover, rock outcrop areas generally do not contain much sediment.
Due to the high variability of PCB concentrations in sediment, mass per unit area (MPA),rather than concentration, was identified as the most useful measure of the potential contributionof an area to PCB concentrations in water and fish. MPA measurements (i.e., grams of PCBs persquare meter) indicate the total mass of PCBs within the sediment. An example MPAcalculation is provided in Figure 10-1. MPA was plotted against areas of cohesive and non-cohesive sediment for the Thompson Island Pool (and against PCB mass remediated) todetermine breakpoints where a small change in MPA would mean a large increase in sedimentarea or mass to be remediated. This provides an evaluation of the efficiency of remediation bycomparing the mass of PCBs remediated to the amount of the sediment surface that wouldrequire remediation. Breakpoints were found at approximately 3 g/m2 Tri+ PCBs and 10 g/m2
Tri+ PCBs.
The preliminary evaluation of alternatives included MNA (no sediment remediation) withadditional source control in the vicinity of the GE Hudson Falls plant, and remediation ofsediment with 10 g/m2 Tri+ PCBs, 3 g/m2 Tri+ PCBs, and 0 g/m2 (full section) Tri+ PCBs inRiver Sections 1 and 2. In River Section 3, only 10 g/m2 Tri+ PCBs and 3 g/m2 Tri+ PCBs wereconsidered. The 0 g/m2scenario was not considered for River Section 3 because it would haverequired remediation of an unreasonably large area (over 2,800 acres).
EPA used its peer-reviewed models, HUDTOX and FISHRAND, to evaluate the extent towhich remediation of different breakpoint target levels in sediment reduced the PCBconcentrations in fish. The model results showed that remediation of sediment in River Section1, the Thompson Island Pool, had the greatest benefit with respect to reducing PCBconcentrations in fish. Remediation of sediment in River Section 2 also showed substantialreductions. However, the model results did not show substantial reductions in PCBconcentrations in fish from remediation of sediment in River Section 3. EPA determined thatthe models were likely insensitive to sediment remediation in River Section 3, due to the spatialscale of the model in that river section.
Because the models are not sensitive to remediation in River Section 3, EPA also consideredthe historical data for River Section 3, which show increased PCB concentrations in the watercolumn resulting from tributary high flow events that caused scour in the main part of theHudson. EPA identified certain select areas in River Section 3 for remediation, specificallyNYSDEC Hot Spots 36, 37, and the southern portion of Hot Spot 39, based on PCB inventory

Hudson River PCBs Site Record of Decision
56
and signs of potential loss of PCB inventory. For example, a comparison of 1977 and 1994sediment data showed that over two thirds of the PCB inventory was lost from Hot Spot 37. EPArecognized that additional sampling would need to be conducted during remedial design todetermine whether other areas in River Section 3 have high PCB concentrations and the potentialfor loss to the water column or uptake by biota.
EPA performed preliminary modeling, engineering modeling and refined engineeringmodeling of more than 50 different capping or removal alternatives, including model runs thattested the sensitivity to different assumptions for the upstream boundary condition. Detailsregarding these modeling results are provided in the FS. For this document, the terms “dredging”or “removal” mean environmental dredging.
Based on its review of all the model results and in consideration of the geochemical analysesand historical data for the Site, EPA selected five remedial alternatives for detailed analysis: NoAction, MNA, CAP-3/10/Select, REM-3/10/Select and REM-0/0/3. This limited number ofalternatives covers a range of viable approaches to remedial action and includes a no-actionalternative, which is required by the NCP. Pertinent information regarding each of the fivealternatives is summarized below (see also Table 10-1).
10.1 Description of Remedy Components
Each of the five alternatives is presented with its respective cost and time frame to construct. The cost figures include both capital costs associated with performing the remedial work and thecosts associated with any long-term operation and maintenance (O&M) of the alternative. Thepresent-worth costs are calculated using a discount rate of seven percent and a 30-year timeinterval for O&M. In this document, present-worth costs are rounded to the nearest ten million dollars (with the exception of Alternatives 1 and 2).
The construction time frames represent the estimated time required for mobilization, operationand demobilization of the remedial work, but do not include the time required for long-termmonitoring or O&M.
Further, the time frames do not include the time required to design the remedy or procurecontracts for design and construction, or the time period that might be associated with anynegotiation with the potentially responsible party for the performance of the remedy.

Hudson River PCBs Site Record of Decision
57
Estimated Capital Costs: $0
Operation and Maintenance Costs: $140,000
(present-worth)
Present-Worth Cost: $140,000
Construction Time: 0 Years
Alternative 1: No Action (no Upstream Source Control)
The No Action alternativeconsists of refraining from theactive application of anyremediation technology tosediments in all three sections ofthe Upper Hudson River. The NoAction alternative also does notassume any source control action near the GE Hudson Falls plant, any administrative actions(including institutional controls, such as fish consumption advisories and fishing restrictions,which are considered to be limited action under the NCP), and any monitoring. A review of Siteconditions would be conducted at five-year intervals, as required by CERCLA. The estimatedmonitoring cost per event is approximately $77,000. Over a 30-year period, six such eventswould be completed.
Alternative 2: Monitored Natural Attenuation (MNA) with
Upstream Source Control
The Monitored NaturalAttenuation (MNA) alternativerelies on naturally occurringattenuation processes to reducethe concentration of PCBs in theUpper Hudson River sediments and assumes a separate source control action near the GEHudson Falls plant. Natural attenuation processes may include biodegradation,biotransformation, bioturbation, diffusion, dilution, adsorption, volatilization, chemical reactionor destruction, resuspension, downstream transport, and burial by cleaner material. Long-termmonitoring would be conducted in sediments, in the water column, and in fish to confirm thatcontaminant reduction is occurring and that the reduction is achieving Remedial ActionObjectives.
Monitoring will include measurements of PCB concentrations in river water, dated sedimentcores, PCB inventory in sediment, sediment physical properties (geophysics), andbioaccumulation in resident fish. Reductions in PCB concentrations and the PCB inventory couldbe documented by historical trends or PCB concentration distributions that show a reduction inthe total mass of PCBs in sediments, water and/or biota, or by the presence of degradationproducts in sediments. The monitoring data would also be used as input parameters in themathematical models to evaluate progress of the natural attenuation processes against the originalpredictions.
Capital Cost: $417,000
Operation and Maintenance Costs: $38,000,000
(present-worth)
Present-Worth Cost: $39,000,000Construction Time: 0 Years

Hudson River PCBs Site Record of Decision
58
Institutional controls would be implemented as long-term control measures as part of theMNA alternative, including continuation of fish consumption advisories and fishing restrictions,which are currently in place.
The present-worth cost does not include any capital cost nor any O&M costs associated withsource control actions (proposed by GE) at the Hudson Falls plant. The capital cost associatedwith MNA includes the costs of developing and running the mathematical models; this cost isincluded with alternatives 3, 4 and 5 as well because they contain MNA as a necessarycomponent. A review of Site conditions would be conducted at five-year intervals, as requiredby CERCLA.
Alternative 3: CAP 3/10/Select - Capping, with Removal to Accommodate Cap, followedby MNA, with Upstream Source Control
This alternative includesremediation by capping (afterremoval of more than 1.73 millioncubic yards of sediment in areasthat either cannot be capped(navigation channels) or requiresediment removal to allow for placement of the cap) of sediments based primarily on an MPA of3 g/m 2 Tri+ PCBs or greater in River Section 1, sediments based primarily on an MPA of 10 g/m2 Tri+ PCBs or greater in River Section 2 and selected sediments with high concentrations ofPCBs and potential for scour in River Section 3 (NYSDEC Hot Spots 36, 37 and the southernportion of 39).
This alternative includes sediment removal in the navigation channel, as necessary, to allowfor implementation of the remediation and allow normal boat traffic during remediation. Thetotal area of sediments to be remediated is 493 acres, of which approximately 207 acres would becapped. The estimated volume of sediments to be removed is 1.73 million cubic yards. It wouldtake approximately 3 years to design and 6 years (assuming a phased implementation approachfor CAP-3/10/Select; see Section 11.5 below) to implement this remedy. This alternativeassumes a separate source control action near the GE Hudson Falls plant and also relies onnaturally occurring attenuation processes to reduce the concentration of the remaining PCBs inthe Upper Hudson River sediments after the construction is completed. A review of Siteconditions would be conducted at five-year intervals, as required by CERCLA.
Capping involves placement of an engineered cap consisting of low permeability material ontop of the PCB-contaminated sediment. A layer of fill is placed on top of the cap. The lowpermeability material limits scour or other flow-related erosion, prevents or retards themovement of contaminated pore water into the water column and minimizes exposure of benthicorganisms to the PCB-contaminated sediments. The likely process option for containment is the
Capital Cost: $344,000,000
Operation and Maintenance Costs: $24,000,000(present-worth)
Present-Worth Cost: $370,000,000Construction Time: 6 Years
Hudson River PCBs Site Record of Decision
59
use of a manufactured product consisting of a composite of gravel particles encapsulated withbentonite (AquaBloktm or a similar material).
The cap (containment layer) would be designed to have a high probability of withstandingdamage from ice scour and navigational incidents, as well as erosion due to normal or storm-induced flows, without exposing the high concentrations of PCBs that currently exist in thesurface sediments at some locations.
A 6-inch benthic substrate layer would be placed on top of the containment layer to preventbioturbation of the cap material and to serve as a clean habitat for the benthic organisms torepopulate. This material would also serve as a sacrificial layer in the event of erosion ordamage, possibly allowing repairs to be conducted before further damage occurs. Placement of18 inches (1.5 feet) of capping material over the existing surface, especially in shallower areas,could affect the hydraulics of the river, as well as actually move the shoreline toward the channelby as much as 25 to 50 feet in some areas. Therefore, in order to prevent changing theconfiguration of the river, 1.5 feet of sediment would be removed prior to the placement of thecap in shallow areas. Sediment removal would be accomplished with similar equipmentdescribed for the removal alternatives below.
Production rates and sediment processing facilities would be similar to other removalalternatives, but with appropriate quantity changes. In shallower areas with less than three feet ofwater, an appropriate dredge type (e.g., shallow hydraulic dredge mounted on a pontoon) wouldbe used.
After construction is completed, this alternative relies on institutional controls, such as thefish consumption advisories and fishing restrictions, and perhaps restrictions on activities thatcould compromise the integrity of the cap, and MNA in areas not remediated until the RemedialAction Objectives are achieved. A long-term monitoring program would be implemented toverify the integrity of the cap, ensure that thicknesses of the cap and backfill were maintainedand that the river was responding with reduced contamination levels over the long run, and toassess the effectiveness of the cap with natural attenuation processes toward achieving theRemedial Action Objectives.
If any portion of the cap became eroded, it would require replacement. As with Alternative 2,the present-worth cost does not include any capital cost or O&M costs associated with sourcecontrol actions near the GE Hudson Falls plant. If some of the dredged sediment could be givena beneficial use, substantial cost savings could be realized through reduced transportation anddisposal fees.
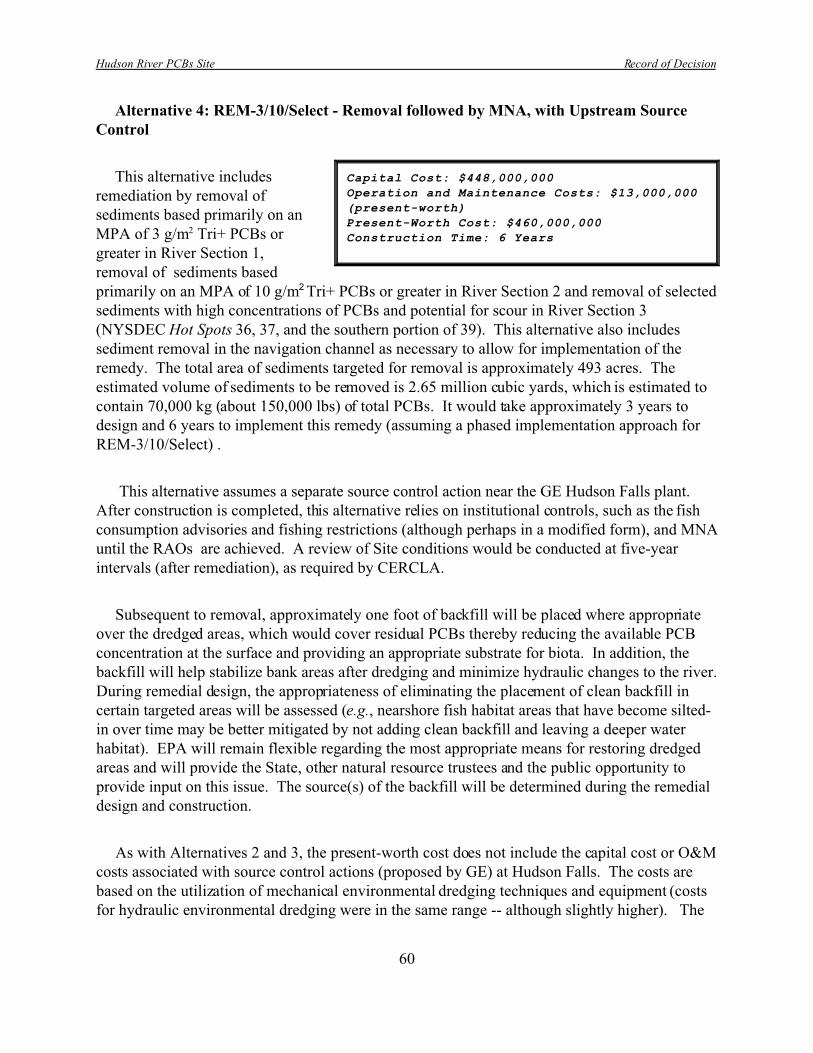
Hudson River PCBs Site Record of Decision
60
Alternative 4: REM-3/10/Select - Removal followed by MNA, with Upstream SourceControl
This alternative includesremediation by removal of sediments based primarily on anMPA of 3 g/m2 Tri+ PCBs orgreater in River Section 1,removal of sediments basedprimarily on an MPA of 10 g/m2
Tri+ PCBs or greater in River Section 2 and removal of selectedsediments with high concentrations of PCBs and potential for scour in River Section 3(NYSDEC Hot Spots 36, 37, and the southern portion of 39). This alternative also includessediment removal in the navigation channel as necessary to allow for implementation of theremedy. The total area of sediments targeted for removal is approximately 493 acres. Theestimated volume of sediments to be removed is 2.65 million cubic yards, which is estimated tocontain 70,000 kg (about 150,000 lbs) of total PCBs. It would take approximately 3 years todesign and 6 years to implement this remedy (assuming a phased implementation approach forREM-3/10/Select) .
This alternative assumes a separate source control action near the GE Hudson Falls plant. After construction is completed, this alternative relies on institutional controls, such as the fishconsumption advisories and fishing restrictions (although perhaps in a modified form), and MNAuntil the RAOs are achieved. A review of Site conditions would be conducted at five-yearintervals (after remediation), as required by CERCLA.
Subsequent to removal, approximately one foot of backfill will be placed where appropriateover the dredged areas, which would cover residual PCBs thereby reducing the available PCBconcentration at the surface and providing an appropriate substrate for biota. In addition, thebackfill will help stabilize bank areas after dredging and minimize hydraulic changes to the river. During remedial design, the appropriateness of eliminating the placement of clean backfill incertain targeted areas will be assessed (e.g., nearshore fish habitat areas that have become silted-in over time may be better mitigated by not adding clean backfill and leaving a deeper waterhabitat). EPA will remain flexible regarding the most appropriate means for restoring dredgedareas and will provide the State, other natural resource trustees and the public opportunity toprovide input on this issue. The source(s) of the backfill will be determined during the remedialdesign and construction.
As with Alternatives 2 and 3, the present-worth cost does not include the capital cost or O&Mcosts associated with source control actions (proposed by GE) at Hudson Falls. The costs arebased on the utilization of mechanical environmental dredging techniques and equipment (costsfor hydraulic environmental dredging were in the same range -- although slightly higher). The
Capital Cost: $448,000,000
Operation and Maintenance Costs: $13,000,000
(present-worth)Present-Worth Cost: $460,000,000Construction Time: 6 Years
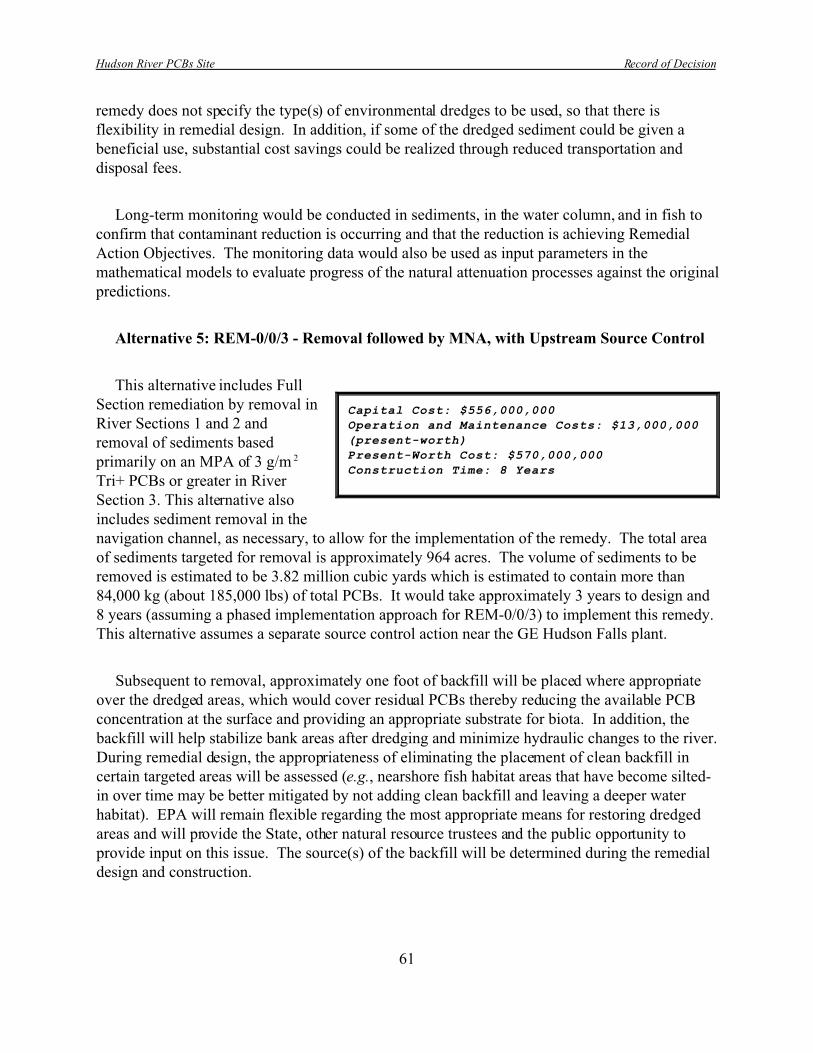
Hudson River PCBs Site Record of Decision
61
remedy does not specify the type(s) of environmental dredges to be used, so that there isflexibility in remedial design. In addition, if some of the dredged sediment could be given abeneficial use, substantial cost savings could be realized through reduced transportation anddisposal fees.
Long-term monitoring would be conducted in sediments, in the water column, and in fish toconfirm that contaminant reduction is occurring and that the reduction is achieving RemedialAction Objectives. The monitoring data would also be used as input parameters in themathematical models to evaluate progress of the natural attenuation processes against the originalpredictions.
Alternative 5: REM-0/0/3 - Removal followed by MNA, with Upstream Source Control
This alternative includes FullSection remediation by removal inRiver Sections 1 and 2 andremoval of sediments basedprimarily on an MPA of 3 g/m 2
Tri+ PCBs or greater in RiverSection 3. This alternative alsoincludes sediment removal in thenavigation channel, as necessary, to allow for the implementation of the remedy. The total areaof sediments targeted for removal is approximately 964 acres. The volume of sediments to beremoved is estimated to be 3.82 million cubic yards which is estimated to contain more than84,000 kg (about 185,000 lbs) of total PCBs. It would take approximately 3 years to design and8 years (assuming a phased implementation approach for REM-0/0/3) to implement this remedy. This alternative assumes a separate source control action near the GE Hudson Falls plant.
Subsequent to removal, approximately one foot of backfill will be placed where appropriateover the dredged areas, which would cover residual PCBs thereby reducing the available PCBconcentration at the surface and providing an appropriate substrate for biota. In addition, thebackfill will help stabilize bank areas after dredging and minimize hydraulic changes to the river. During remedial design, the appropriateness of eliminating the placement of clean backfill incertain targeted areas will be assessed (e.g., nearshore fish habitat areas that have become silted-in over time may be better mitigated by not adding clean backfill and leaving a deeper waterhabitat). EPA will remain flexible regarding the most appropriate means for restoring dredgedareas and will provide the State, other natural resource trustees and the public opportunity toprovide input on this issue. The source(s) of the backfill will be determined during the remedialdesign and construction.
Capital Cost: $556,000,000Operation and Maintenance Costs: $13,000,000
(present-worth)Present-Worth Cost: $570,000,000
Construction Time: 8 Years

Hudson River PCBs Site Record of Decision
62
After construction is completed, this alternative relies on institutional controls, such as thefish consumption advisories and fishing restrictions (although perhaps in a modified form), andMNA in areas not remediated until the Remedial Action Objectives are achieved. A review ofsite conditions would be conducted at five-year intervals, as required by CERCLA. As withAlternatives 2 through 4, the present-worth cost does not include any capital cost or O&M costsassociated with source control actions near the GE Hudson Falls plant. The remedy does notspecify the type(s) of environmental dredges to be used, so that there is flexibility in remedialdesign. In addition, if some of the dredged sediment could be given a beneficial use, significantcost savings could be realized through reduced transportation and disposal fees.
Long-term monitoring would be conducted in sediments, in the water column, and in fish toconfirm that contaminant reduction is occurring and that the reduction is achieving RemedialAction Objectives. The monitoring data would also be used as input parameters in themathematical models to evaluate progress of the natural attenuation processes against the originalpredictions.
10.2 Key/Common Elements
The following discussion applies to all three active alternatives: CAP-3/10/Select, REM-3/10/Select, and REM-0/0/3.
Phasing
Remedial dredging will be conducted in two phases. The first phase will be the firstconstruction season of remedial dredging. The dredging during that year will be implementedinitially at less than full scale operation. It will include an extensive monitoring program of alloperations. Monitoring data will be compared to performance standards identified in this RODor developed during the remedial design, with input from the public and in consultation with theState and federal natural resource trustees. Performance standards shall address (but may not belimited to) resuspension rates during dredging, production rates, residuals after dredging ordredging with backfill as appropriate, and community impacts (e.g., noise, air quality, odor,navigation). The information and experience gained during the first phase of dredging will beused to evaluate and determine compliance with the performance standards. Further, the datagathered will enable EPA to determine if adjustments are needed to operations in the succeedingphase of dredging, or if performance standards need to be reevaluated. EPA will make the data,as well as its final report evaluating the work with respect to the performance standards, availableto the public.

Hudson River PCBs Site Record of Decision
63
Institutional Controls
Institutional controls (fish consumption advisories and fishing restrictions) will be utilizedwith the MNA, Capping and Removal alternatives. Institutional controls are considered to belimited action alternatives, and therefore are not included under the No Action alternative.
Source Control
For purposes of EPA’s model comparisons of remedial alternatives, source control at the GEHudson Falls plant was projected to decrease the current concentration of PCBs in the water -column of approximately 13 ng/L Tri+ PCB to 2 ng/L Tri+ PCB, by January 1, 2005. Greaterreductions in the upstream loading, through even more effective source control measures near theGE Hudson Falls plant, would serve to further enhance the effectiveness of the remedy.
Monitored Natural Attenuation
MNA refers to reliance on natural biological, physical, and chemical processes within amonitored site cleanup approach. Natural attenuation processes for the Hudson River PCBs sitemay include biodegradation, biotransformation, bioturbation, diffusion, dilution, adsorption,volatilization, chemical reaction or destruction, resuspension, downstream transport, and burialby clean sediment. The relative importance of each of these mechanisms in reducing PCBconcentrations in Hudson River fish is not easily estimated based on available data. Some or allof these processes may be occurring at any given time and location within the river. During thedesign phase, a monitoring program will be developed to measure the net effects of the naturalattenuation processes until the remediation goals are reached.
The following discussion applies to all three active alternatives: CAP-3/10/Select, REM-3/10/Select, and REM-0/0/3.
Cleanup Values
Because consumption of fish is the major pathway of concern and PCB concentrations in fishare controlled by PCB concentrations in both sediment and water, a specified “cleanup value” forsediment was not selected as a goal. Instead, sediment cleanup is considered the means to the goal of protecting human health and the environment. Areas of sediment targeted forremediation were selected based on the potential for those areas to contribute PCBs to the watercolumn and fish through the food chain. The delineation of the target areas considered a numberof factors, primarily the inventory of PCBs in the sediment, but also surface sedimentconcentrations, sediment texture, bathymetry and depth at which the PCB contamination is

Hudson River PCBs Site Record of Decision
64
found. (Areas where 12 inches or greater of clean overburden exist were eliminated.) Targetareas for remediation were defined as approximately 50,000 square feet (a little over an acre)because of practical limitations on the number of separate remediation zones that could beaccommodated for a project of this size. In addition, areas considered to be rocky, as defined byside-scan sonar, were excluded.
Sediment Concentrations
Sediments that may significantly contribute to the PCB levels in fish, both now and in the future, are considered principal threats. The determination of the significance of the sedimentcontribution to fish is based primarily on model projections, in conjunction with geochemicalanalyses. The model projections indicate that the significance of the sediment contribution variesby river section; therefore, the sediment levels that are considered principal threats willcorrespondingly vary by river section. The PCB-contaminated sediment concentrationsconsidered to be principal threats, as represented by mass per unit area measurements, are 3 g/m2
Tri+ PCBs in River Section 1 and 10 g/m2 Tri+ PCBs in River Section 2.
Due to the high variability of PCB concentrations in sediment, mass per unit area (MPA),rather than concentration, was identified as the most useful measure of the potential contributionof an area to PCBs in surface water and fish. MPA measurements (i.e., grams of PCBs persquare meter) indicate the total mass of PCBs within the sediment. An example MPAcalculation is provided in Figure 10-1. MPA was plotted against areas of cohesive and non-cohesive sediment for the Thompson Island Pool (and against PCB mass remediated) todetermine breakpoints where a small change in MPA would mean a large increase in sedimentarea or mass to be remediated. This provides an evaluation of the efficiency of remediation bycomparing the mass of PCBs remediated to the amount of the sediment surface that wouldrequire remediation. Breakpoints were found at approximately 3 g/m2 Tri+ PCBs and 10 g/m2
Tri+ PCBs. Therefore, the screening of alternatives evaluated MNA (no sediment remediation)plus source control, 10 g/m2 Tri+ PCBs , 3 g/m2 Tri+ PCBs, and 0 g/m2 (full section) Tri+ PCBsfor River Sections 1 and 2.
In River Section 3, the 0 g/m2 scenario was excluded because it would have requiredremediation of an unreasonably large area (over 2,800 acres). Similarly, a cleanup level such as1 mg/kg (as sometimes used at other sites) would have targeted unreasonably large areas inSection 3.
The target levels are defined as: 0 g/m2 - Full Section Remediation, 3 g/m2 Tri+ PCBs -Expanded Hot Spot Remediation, and 10 g/m2 Tri+ PCBs - Hot Spot Remediation. Modelingwas conducted to evaluate the impact of remediation for combinations of the target levels foreach river section on fish tissue PCB levels. It was found that remediation in River Section 1,the Thompson Island Pool, had the greatest benefit with respect to lowering PCB levels in fish

Hudson River PCBs Site Record of Decision
65
and surface water. River Section 2 also showed significant benefits in this regard. The modeldid not show substantial fish tissue benefits from remediation in River Section 3. However, thedata show increased PCB concentrations in the water column in this reach resulting fromtributary high flow events that caused scour in the main part of the Hudson. Therefore, certainareas in River Section 3, specifically NYSDEC hot spots 36, 37, and the southern portion of 39,were selected for remediation based on PCB inventory and signs of potential loss of PCBinventory. For example, a comparison of 1977 and 1994 sediment data showed that over twothirds of the PCB inventory was lost from Hot Spot 37. The 5-year review will be tailored toexamine any potential erosion from hot spots not targeted for remediation under this remedy.
Treatment
Treatment technologies, such as thermal desorption, are technically feasible; however, theassociated costs would be substantially greater than off-site landfill disposal. Moreover, alocally-sited thermal treatment facility would not be expected to be administratively feasible.
Sediment Processing/Transfer Facilities
It is expected that either one or two sediment processing/transfer facilities will be establishedto handle materials from the environmental dredging process. The locations of these facilitieswill be selected by EPA in consultation with New York State during the remedial design phaseof the remedy, after consideration of community input, engineering issues (such as thoseassociated with the type of dredging selected), real property issues, noise, air impacts and otherappropriate factors. Although it is projected that these facilities will be land-based, water-basedfacilities will also be evaluated.
Mechanically dredged sediment will arrive at the facilities via barge and will be decanted toremove excess water. The dredged material will then be stabilized with Portland cement, or anequivalent stabilizing agent, cured, and loaded onto rail and/or barge for transport to disposalfacilities. If hydraulic dredging is used, the sediment will arrive at the northern sedimentprocessing/transfer facility via pipeline. The hydraulically dredged material will then bemechanically dewatered and loaded onto rail and/or barge for transport to disposal facilities.
The water that is separated will undergo treatment to remove fine sediment particles anddissolved PCBs. Ultimately, the water will be discharged back into the Hudson River incompliance with substantive New York State Pollutant Discharge Elimination Systemrequirements, which are ARARs for this Site.

Hudson River PCBs Site Record of Decision
66
Transportation
Dredged materials will be transported from the dredging site to the sedimentprocessing/transfer facilities by barge or in-river pipeline. Transportation from the sedimentprocessing/transfer facilities to disposal facilities will be by rail (or possibly barge). Transportation of material for backfill and capping will also be by rail or barge. Communityinput will be taken regarding the methods utilized for the transport of materials if a beneficial usescenario becomes available.
Disposal
During the screening analysis, it was determined that if a remedy that included dredging wereto be selected, it would not be administratively feasible to dispose of that material in a locally-sited landfill. Therefore, only off-site disposal options (at an existing licensed TSCA or solidwaste landfill outside of the Hudson Valley) were carried through into the Detailed Analysis inthe Reassessment FS. Although off-site landfilling is projected, a beneficial use scenario (fornon-TSCA dredged materials) will be evaluated during the design phase. Value engineering toreduce waste volumes (that will also reduce costs) will be explored and, if appropriate, finalizedduring the remedial design.
Testing will be conducted during construction to evaluate dredged material for otherhazardous wastes or constituents to determine the applicability of, and compliance with, federaland State RCRA regulations. This information will be utilized in the determination of acceptableoff-site disposal facilities.
Monitoring
Short- and long-term (i.e., pre-, during, and post-construction) monitoring programs will bedeveloped to ensure compliance with performance standards and to ensure protection of humanhealth and the environment. The types and frequency of pre-construction monitoring will bedeveloped during remedial design. Plans for monitoring during and after construction will bedeveloped during the remedial design and modified during and after construction as appropriate. This is consistent with the NRC Report recommendation that long-term monitoring evaluate theeffectiveness of the approach as well as ensure protection of public health and the environment.
10.3 Expected Outcomes of Each Alternative
The time to reach target PCB concentrations in fish was a primary factor in comparingremedial alternatives. As more fully described in Section 11.1 - Overall Protection of Human

Hudson River PCBs Site Record of Decision
67
Health and the Environment, the time to reach target levels (e.g., 0.2 and 0.4 mg/kg) favors theactive remediation alternatives. In fact, in River Sections 1 and 2, the No Action alternative doesnot meet the Remediation Goal of 0.05 ppm in fish, the 0.2 ppm or the 0.4 ppm targets within themodel time frame (by 2067). A reduction in risk is realized for each of the four remainingalternatives in the following ascending (lesser to more improvement) order: MNA, CAP-3/10/Select, REM-3/10/Select, and REM-0/0/3. In River Section 3, all of the active remediationalternatives meet the concentration of 0.05 mg/kg within 42 years, MNA reaches it in 48 yearsand the No Action alternative does not meet the Remediation Goal within the modeling timeframe.
In addition, comparisons of the model outputs to data trends suggest that the model may beoverly optimistic with regard to the rate of PCB decline in fish predicted for the No Action andMonitored Natural Attenuation (assuming source control) alternatives which would suggest aneven stronger preference for active remediation alternatives.
Fish consumption advisories and fishing restrictions would be continued by the appropriateState authorities as part of the No Action and MNA alternatives. For the active remediationalternatives, upon reaching specified target concentrations in fish, consumption advisories couldbe relaxed from the current “eat none” recommendation for the Upper Hudson River.
As a part of the active remediation alternatives, navigational dredging is necessary in order toimplement environmental dredging, so as to allow movement of the dredging and supportvessels, as well as to allow for use of the river by recreational and commercial vessels duringremediation.
11. COMPARATIVE ANALYSIS OF ALTERNATIVES
In selecting a remedy for a site, EPA considers the factors set forth in CERCLA § 121, 42U.S.C. § 9621, by conducting a detailed analysis of the viable remedial alternatives pursuant tothe NCP, 40 CFR § 300.430(e)(9), EPA’s Guidance for Conducting Remedial Investigations andFeasibility Studies, OSWER Directive 9355.3-01, and EPA’s A Guide to Preparing SuperfundProposed Plans, Records of Decision, and Other Remedy Selection Decision Documents,OSWER 9200.1-23.P. The detailed analysis consists of an assessment of the individualalternatives against each of nine evaluation criteria (two threshold, five primary balancing andtwo modifying criteria) and a comparative analysis focusing upon the relative performance ofeach alternative against those criteria. Table 11-1 provides the Remedial AlternativesComparative Analysis Summary.
The comparison of the effectiveness of alternatives is based on the results of modeling eachremedial alternative as well as data projections. Comparisons of the model outputs to data trends

Hudson River PCBs Site Record of Decision
68
suggest that the model may be overly optimistic with regard to the rate of PCB decline in fishpredicted for the No Action (no source control) and MNA (assuming source control) alternatives(i.e., the fish tissue PCB data do not show the same type of declines as predicted by the model). As discussed in the Feasibility Study, this occurs because, among other things, the modelpredictions are averaged over larger spatial scales than the foraging range of many resident fishspecies and there is uncertainty surrounding the PCB concentration in surface sediment andsediment mixing depths used in the model. Under the modeled remedial alternatives, this over-optimism is minimized to some degree wherever PCBs are removed or capped, because projectedrates of decline are replaced by specified concentrations in the remediated areas. Consequently,the benefits of remediation are likely underestimated by comparisons of the active remediationalternatives to the No Action and MNA alternatives.
In order to bound this uncertainty in the No Action and MNA alternatives, an estimated upperbound was also calculated. Assuming that the over-optimism in the model projections stems inpart from the model predictions being averaged over larger spatial scales than the foraging rangeof many resident fish species and the uncertainty surrounding the PCB concentration in surfacesediment calculated by the model, an alternative method was used to calculate surface sedimentvalues based on certain fish data. PCB concentrations in brown bullhead, which are affectedprimarily by concentrations of PCBs in surface sediment, were used to back-calculateconcentrations of PCBs in surface sediment that would produce the decline seen in the data. Thenewly-calculated concentrations of PCBs in surface sediment were then used in the model as anupper bound estimate instead of the model-calculated surface sediment values. Therefore, boththe upper bound estimates and the model-calculated values for No Action and MNA were used aspoints of comparison in the evaluation of effectiveness of the capping and removal alternatives.
Threshold Criteria - The first two Superfund criteria are known as “threshold criteria”because they are the minimum requirements that each response measure must meet in order tobe eligible for selection as a remedy.
11.1 Overall Protection of Human Health and the Environment
Overall protection of human health and the environment addresses whether an alternativeeliminates, reduces, or controls threats to public health and the environment throughinstitutional controls, engineering controls, or treatment.
EPA evaluated the overall protectiveness of the No Action and MNA alternatives using themodel results and the upper bound results based on recent fish data, as discussed in Section 10.3. The overall protectiveness of the CAP-3/10/Select alternative was evaluated based on modelingof a five-year implementation schedule and zero PCB loss due to resuspension. The riskscalculated for the CAP-3/10/Select alternative assume an equilibration period of two years rather
Hudson River PCBs Site Record of Decision
3 EPA did not run the models assuming PCB loss due to resuspension or phased implementation for the
CAP-3/10/Select and REM-0/0/3 alternatives, based on the model runs of the REM-3/10/Select alternative which
predict little or n o differen ce for PC B conc entrations in fish assum ing differe nt PCB lo ss due to resuspension (zero,
0.13 % or 2.5%) and a 5 or 6 year implementation schedule.
69
than one year to approximate the additional year for phased implementation, such that risks werecalculated with a start year of 2010. The overall protectiveness of the selected alternative, REM-3/10/Select, is based on modeling of a six-year implementation schedule, 0.13% PCB loss due toresuspension, and a one-year equilibration period, such that risks were calculated with a startyear of 2010. The overall protectiveness of the REM-0/0/3 alternative is based on a seven-yearimplementation schedule, zero PCB loss due to resuspension and a one-year equilibration period,such that risks were calculated with a start year of 2011.3 The modeling of all alternatives exceptNo Action assumes additional source control measures near the GE Hudson Falls plant (i.e.,reduction of the upstream contribution from the current average of 0.16 kg/day to an average of0.0256 kg/day on January 1, 2005).
Overall Protection of Human Health
EPA evaluated overall protection of human health in three ways. The first is the relativereduction in cancer risks and non-cancer hazard indices associated with the five remedialalternatives. The second is the time that it would take under each of the alternatives to reach theremediation goal and other targets of PCB concentrations in species-weighted fish fillet. Thethird is the PCB load transported over the Federal Dam into the Lower Hudson, which also is ameasure of the overall protection of the environment. Transport of PCBs over the Federal Damis discussed for both human health and the environment together at the end of this section.
Relative Reductions in Cancer Risk and Non-Cancer Hazard Indices
Relative reductions in cancer risks and non-cancer hazard indices were calculated to providean estimate of risk reductions under the various remedial alternatives. The formula used tocalculate the percentages of risk reduction is:
1 - Alternative-Specific Risk X 100
No Action Risk or MNA Risk
Cancer Risks
As shown in the table below, substantial reductions in the RME adult cancer risk are achievedby all active remediation alternatives compared to the No Action and MNA alternatives. The

Hudson River PCBs Site Record of Decision
70
MNA alternative achieves a 51% to 24% reduction in risk compared to the No Action alternative(modeled and upper bound, respectively). The CAP-3/10/Select alternative achieves a 73% to83% reduction compared to No Action and a 45% to 78% reduction compared to MNA. TheREM-3/10/Select alternative achieves a 76% to 85% reduction compared to No Action and a50% to 80% reduction compared to MNA. The REM-0/0/3 alternative achieves a 82% to 89%reduction compared to No Action and a 63% to 85% reduction compared to MNA.
Cancer Risks - RME Adult Upper Hudson River1
Alternative Cancer Risk
No Action2 4.1E-04 to 6.6E-04
MNA2 2.0E-04 to 5.0E-04
CAP-3/10/Select 1.1E-04
REM-3/10/Select 9.9E-05
REM-0/0/3 7.5E-05
1 Uppe r Hudso n River a verage is w eighted b y river sectio n length. R iver Sectio n 1: 6.3 m iles = 15.4% ;
River Section 2: 5.1 miles = 12.5%; and River Section 3: 29.5 miles = 72.1%.
2 Highe r value is up per bou nd.
Non-Cancer Health Hazards
As shown in the table below, substantial reductions in the RME adult non-cancer hazardindices are achieved by all active remediation alternatives compared to the No Action and MNAalternatives. The MNA alternative achieves a 30% to 16% reduction compared to the No Actionalternative (modeled and upper bound, respectively). The CAP-3/10/Select alternative achieves a68% to 77% reduction compared to No Action and a 55% to 73% reduction compared to MNA.The REM-3/10/Select alternative achieves a 71% to 79% reduction compared to No Action and a58% to 75% reduction compared to MNA. The REM-0/0/3 alternative achieves a 80% to 86%reduction compared to No Action and a 72% to 83% reduction compared to MNA.

Hudson River PCBs Site Record of Decision
71
Non-Cancer Hazard Indices - RME Adult Upper Hudson River1
Alternative Non-Cancer Hazard Index
No Action2 27 to 38
MNA2 19 to 32
CAP-3/10/Select 8.6
REM-3/10/Select 7.9
REM-0/0/3 5.3
1 Uppe r Hudso n River a verage is w eighted b y river sectio n length. R iver Sectio n 1: 6.3 m iles = 15.4% ;
River Section 2: 5.1 miles = 12.5%; and River Section 3: 29.5 miles = 72.1%.
2 Highe r value is up per bou nd.
Time to Reach Human Health Risk-Based PCB Concentrations in Fish
The Remediation Goal for the protection of human health is 0.05 mg/kg PCBs in species-weighted fish fillet. In addition, EPA considered target concentrations of 0.2 mg/kg and 0.4mg/kg PCBs in species-weighted fish fillet. Meeting these target concentrations might facilitatethe relaxation of fish consumption advisories from the current “eat none” recommendation in theUpper Hudson River to one of limited fish ingestion. The table below summarizes the years inwhich these concentrations are projected to be met for various remedial alternatives. It showsthat significant benefits are achieved by implementation of one of the active remedies comparedto the No Action and MNA alternatives.
For the Upper Hudson River as a whole (length-weighted average), none of the alternativesmeets the Remediation Goal of 0.05 mg/kg PCBs in species-weighted fish fillet within themodeled time frame (i.e., by 2067). The continuing upstream source of PCBs must be virtuallyeliminated in order to meet the Remediation Goal within the modeled time frame (see Section9.3). All of the alternatives except No Action assume additional upstream source controlmeasures and meet the 0.05 mg/kg Remediation Goal in River Section 3 within the modeled timeframe, although in different years (in 2059 for MNA, in 2051 for CAP-3/10/Select and REM-3/10/Select, and in 2050 for REM-0/0/3).
The alternatives differ greatly in how close they each come to meeting the Remediation Goalfor the Upper Hudson River as a whole (length-weighted average) within the modeled timeperiod. The No Action alternative reduces PCB concentrations to approximately 0.5 to 0.9mg/kg (upper bound), which is up to 18 times greater than the Remediation Goal. The MNAalternative reduces PCB concentrations to approximately 0.1 to 0.5 mg/kg (upper bound), whichis up to 10 times greater than the Remediation Goal. The CAP-3/10/Select, REM-3/10/Select
Hudson River PCBs Site Record of Decision
72
and REM-0/0/3 alternatives reduce PCB concentrations to approximately 0.1 mg/kg, which is 2times the Remediation Goal (see Table 11-2).
The three active remediation alternatives significantly reduce the time necessary to reach the0.2 mg/kg target concentration of PCBs in species-weighted fish fillet compared to the NoAction and MNA alternatives. The No Action alternative would not meet the 0.2 mg/kg targetby 2067 in the Upper Hudson as a whole (length-weighted average). The MNA alternative meetsthe 0.2 mg/kg target in the Upper Hudson as a whole (length-weighted average) in 2035 or wouldnot meet it by 2067 (upper bound). In contrast, the CAP-3/10/Select and REM-3/10/Selectalternatives meet the 0.2 mg/kg target for the Upper Hudson as a whole (length-weightedaverage) in 2024 and the REM-0/0/3 alternatives meets the 0.2 mg/kg target in 2018. There arealso differences among the alternatives for the time to meet the 0.2 mg/kg target in certain riversections. For example, in River Section 2, the No Action alternative would not meet the 0.2mg/kg target and the MNA alternative would meet it in 2062 or would not meet it by 2067(upper bound). However, the CAP-3/10/Select and REM-3/10/Select alternatives would meetthe 0.2 mg/kg target in River Section 2 in 2044 and the REM-0/0/3 alternative would meet it in2034.
The three active remediation alternatives also significantly reduce the time necessary to reachthe 0.4 mg/kg target concentration of PCBs in species-weighted fish fillet compared to the NoAction and MNA alternatives. The No Action alternative would not meet the 0.4 mg/kg targetby 2067 for the Upper Hudson as a whole (length-weighted average). The MNA alternativewould meet the 0.4 mg/kg target in 2024 or would not meet it by 2067 (upper bound). The CAP-3/10/Select and REM-3/10/Select alternatives would meet the 0.4 mg/kg target in 2013 and 2012,respectively, and the REM-0/0/3 alternative would meet the 0.4 mg/kg target in 2010.
There also are differences among the alternatives for the time to meet the 0.4 mg/kg target incertain river sections. For example, in River Section 1, the No Action alternative would not meetthe 0.4 mg/kg target and the MNA alternative would meet it in 2039 or would not meet it by2067 (upper bound). However, the CAP-3/10/Select alternative would meet the 0.4 mg/kg targetin River Section 1 in 2026, the REM-3/10/Select alternative would meet it in 2025, and theREM-0/0/3 alternative would meet it in 2013.
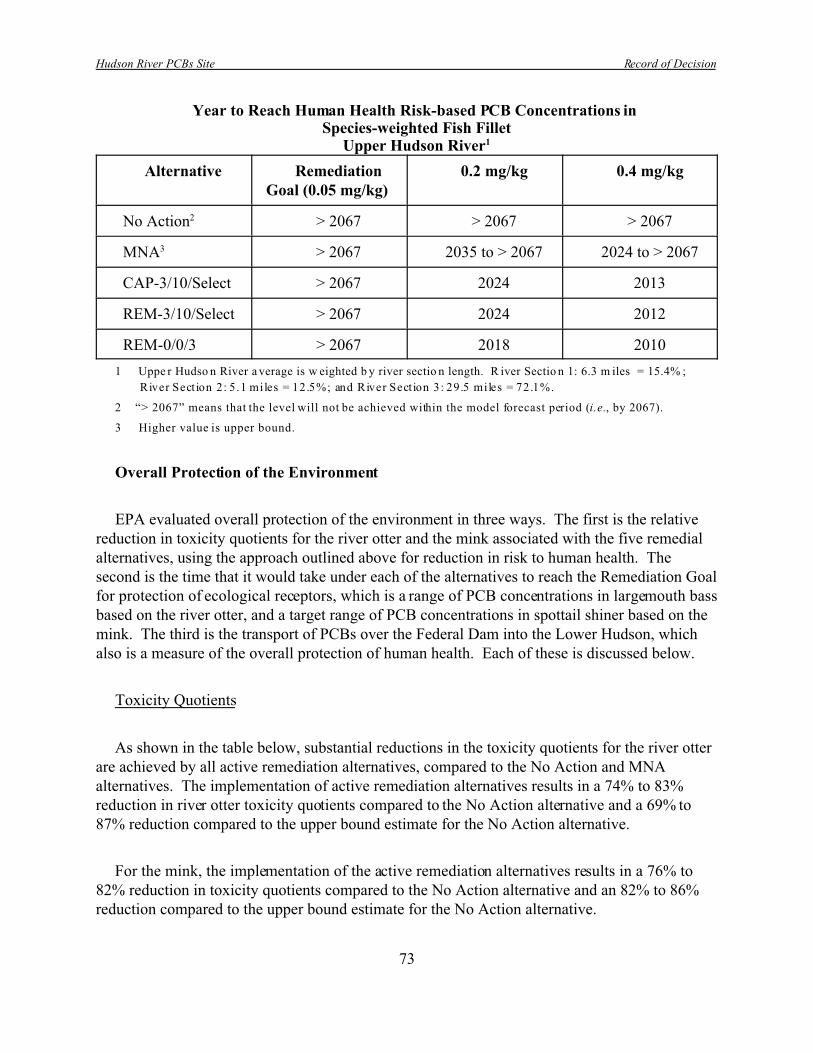
Hudson River PCBs Site Record of Decision
73
Year to Reach Human Health Risk-based PCB Concentrations in Species-weighted Fish Fillet
Upper Hudson River1
Alternative RemediationGoal (0.05 mg/kg)
0.2 mg/kg 0.4 mg/kg
No Action2 > 2067 > 2067 > 2067
MNA3 > 2067 2035 to > 2067 2024 to > 2067
CAP-3/10/Select > 2067 2024 2013
REM-3/10/Select > 2067 2024 2012
REM-0/0/3 > 2067 2018 2010
1 Uppe r Hudso n River a verage is w eighted b y river sectio n length. R iver Sectio n 1: 6.3 m iles = 15.4% ;
River Section 2: 5.1 miles = 12.5%; and River Section 3: 29.5 miles = 72.1%.
2 “> 2067” means that the level will not be achieved within the model forecast period (i.e., by 2067).
3 Higher value is upper bound.
Overall Protection of the Environment
EPA evaluated overall protection of the environment in three ways. The first is the relativereduction in toxicity quotients for the river otter and the mink associated with the five remedialalternatives, using the approach outlined above for reduction in risk to human health. Thesecond is the time that it would take under each of the alternatives to reach the Remediation Goalfor protection of ecological receptors, which is a range of PCB concentrations in largemouth bassbased on the river otter, and a target range of PCB concentrations in spottail shiner based on themink. The third is the transport of PCBs over the Federal Dam into the Lower Hudson, whichalso is a measure of the overall protection of human health. Each of these is discussed below.
Toxicity Quotients
As shown in the table below, substantial reductions in the toxicity quotients for the river otterare achieved by all active remediation alternatives, compared to the No Action and MNAalternatives. The implementation of active remediation alternatives results in a 74% to 83%reduction in river otter toxicity quotients compared to the No Action alternative and a 69% to87% reduction compared to the upper bound estimate for the No Action alternative.
For the mink, the implementation of the active remediation alternatives results in a 76% to82% reduction in toxicity quotients compared to the No Action alternative and an 82% to 86%reduction compared to the upper bound estimate for the No Action alternative.

Hudson River PCBs Site Record of Decision
74
Toxicity Quotients for River Otter and Mink (Tri+ dietary dose)Upper Hudson River1
Alternative
TQ River Otter TQ Mink
LOAEL NOAEL LOAEL NOAEL
No Action2 6.9 to 9.4 69 to 94 1.0 to1.3 9.9 to13
MNA2 3.3 to 5.9 33 to 59 0.4 to 0.7 4.1 to 7.5
CAP-3/10/Select 1.8 18 0.2 2.4
REM-3/10/Select 1.7 17 0.2 2.3
REM-0/0/3 1.2 12 0.2 1.8
1 Uppe r Hudso n River a verage is w eighted b y river sectio n length. R iver Sectio n 1: 6.3 m iles = 15.4% ;
River Section 2: 5.1 miles = 12.5%; and River Section 3: 29.5 miles = 72.1%.
2 Higher value is upper bound.
Time to Reach Ecological Risk-Based Concentrations in Fish
The Remediation Goal for the protection of ecological receptors is a range from 0.3 mg/kg to0.03 mg/kg PCBs in largemouth bass (whole body), based on the LOAEL and NOAEL for theriver otter. In addition, EPA considered a target concentration of 0.7 mg/kg to 0.07 mg/kg PCBsin spottail shiner (whole body), based on the LOAEL and NOAEL for the mink. As shown inTable 11-3 and summarized in the table below, the Remediation Goal is met up to approximately30 to 40 years earlier for active remediation alternatives than for the No Action and MNAalternatives. The target range based on the mink is met up to approximately 60 years earlier foractive remediation alternatives than for the No Action and MNA alternatives.

Hudson River PCBs Site Record of Decision
75
Year to Reach Ecological Risk-based PCB Concentrations in Whole Body Fish
Upper Hudson River1
AlternativeRemediation Goal
(0.3 to 0.03 mg/kg PCBsin largemouth bass)
Target Range for Mink0.7 to 0.07 mg/kg
spottail shiner
No Action2,3 > 2067 2013 to > 2067
MNA2,3 2044 to > 2067 2010 to > 2067
CAP-3/10/Select 2035 2006
REM-3/10/Select 2033 2006
REM-0/0/3 2025 2006
1 Upp er Hud son Rive r averag e is weigh ted by riv er section len gth. River Section 1 : 6.3 miles = 15.4% ;
River Section 2: 5.1 miles = 12.5%; and River Section 3: 29.5 miles = 72.1%.
2 Higher value is upper bound.
3 “> 2067” means that the level will not be achieved within the model forecast period (i.e., by 2067).
Transport of PCBs over the Federal Dam
Reduction of the PCB load transported over the Federal Dam and into the Lower Hudsonunder the various remedial alternatives is a measure of the overall protection of human health andthe environment. Reduced PCB loading from the Upper Hudson into the Lower Hudson willultimately reduce the concentrations of PCBs in sediment, water and fish, and thereby reduce riskto humans and ecological receptors in the Lower Hudson.
As shown in Table 11-4 and summarized on the table below, substantial reductions in the loadof PCBs over the Federal Dam are achieved by all active remediation alternatives compared tothe No Action and MNA alternatives. Implementation of the CAP-3/10/Select alternative resultsin a 26% reduction in the cumulative total PCB load to the Lower Hudson from 2011 (the yearfollowing the completion of dredging) to 2020, compared to MNA. The REM-3/10/Selectalternative results in a 38% reduction in the total PCB load, compared to MNA. The REM-0/0/3alternative results in a 42% reduction in total PCB load compared to MNA. These percentreductions under the active alternatives may be underestimates due to the potential over-optimism of the model. All of the active alternatives assume source control upstream. Comparisons of the active remedies to the No Action alternative would exhibit even greaterreductions, because the No Action alternative does not assume source control.
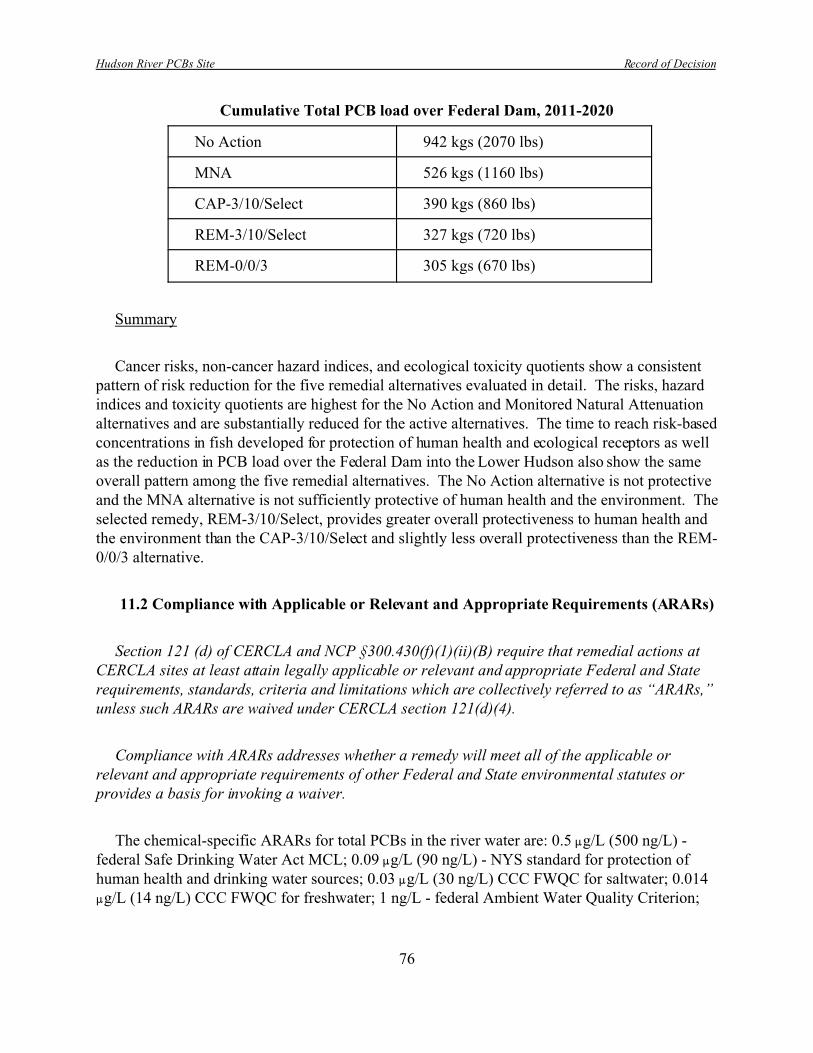
Hudson River PCBs Site Record of Decision
76
Cumulative Total PCB load over Federal Dam, 2011-2020
No Action 942 kgs (2070 lbs)
MNA 526 kgs (1160 lbs)
CAP-3/10/Select 390 kgs (860 lbs)
REM-3/10/Select 327 kgs (720 lbs)
REM-0/0/3 305 kgs (670 lbs)
Summary
Cancer risks, non-cancer hazard indices, and ecological toxicity quotients show a consistentpattern of risk reduction for the five remedial alternatives evaluated in detail. The risks, hazardindices and toxicity quotients are highest for the No Action and Monitored Natural Attenuationalternatives and are substantially reduced for the active alternatives. The time to reach risk-basedconcentrations in fish developed for protection of human health and ecological receptors as wellas the reduction in PCB load over the Federal Dam into the Lower Hudson also show the sameoverall pattern among the five remedial alternatives. The No Action alternative is not protectiveand the MNA alternative is not sufficiently protective of human health and the environment. Theselected remedy, REM-3/10/Select, provides greater overall protectiveness to human health andthe environment than the CAP-3/10/Select and slightly less overall protectiveness than the REM-0/0/3 alternative.
11.2 Compliance with Applicable or Relevant and Appropriate Requirements (ARARs)
Section 121 (d) of CERCLA and NCP §300.430(f)(1)(ii)(B) require that remedial actions atCERCLA sites at least attain legally applicable or relevant and appropriate Federal and Staterequirements, standards, criteria and limitations which are collectively referred to as “ARARs,”unless such ARARs are waived under CERCLA section 121(d)(4).
Compliance with ARARs addresses whether a remedy will meet all of the applicable orrelevant and appropriate requirements of other Federal and State environmental statutes orprovides a basis for invoking a waiver.
The chemical-specific ARARs for total PCBs in the river water are: 0.5 :g/L (500 ng/L) -federal Safe Drinking Water Act MCL; 0.09 :g/L (90 ng/L) - NYS standard for protection ofhuman health and drinking water sources; 0.03 :g/L (30 ng/L) CCC FWQC for saltwater; 0.014:g/L (14 ng/L) CCC FWQC for freshwater; 1 ng/L - federal Ambient Water Quality Criterion;

Hudson River PCBs Site Record of Decision
77
0.12 ng/L - NYS standard for protection of wildlife; and 0.001 ng/L - NYS standard forprotection of human consumers of fish.
The first four chemical-specific ARARs for surface water listed above would be met by allfive remedial alternatives, while the remaining three chemical-specific ARARs for surface waterare not expected to be met by any of the five alternatives for the 70-year forecast period. Due toupstream sources of PCBs, EPA has determined that it is technically impracticable to meet the 1ng/L total PCB federal Ambient Water Quality Criterion, the 0.12 ng/L total PCB NYS standardfor protection of wildlife, and the 0.001 ng/L total PCB NYS standard for protection of humanconsumers of fish. Although these three ARARs will be waived due to technicalimpracticability, the selected alternative will still be protective. Evaluation of the projected PCBconcentrations in the water column by river section shows that the source control action near theGE Hudson Falls plant affects the difference (separation) between the rate of decline for the NoAction and MNA alternatives. The benefits of active remediation of the sediments are readilyapparent in the differences between the rate of decline for the MNA alternative and those for theactive remediation alternatives. As expected, the water quality is best for the REM-0/0/3alternative and substantially improved for the CAP-3/10/Select and REM-3/10/Select alternativescompared to MNA. The relative benefits of active remediation are greatest for the first 20 yearsafter remediation begins (from 2006 to 2025). However, even at the end of the forecast period(in 2067), the PCB concentrations in the water column associated with the No Action alternativeare substantially higher (approximately 30 ng/L Tri+ PCBs at Thompson Island Dam andSchuylerville and 10 ng/L Tri+ PCBs at Federal Dam) than for the other four alternatives(approximately 5 ng/L Tri+ PCBs at Thompson Island Dam and Schuylerville and 1.7 ng/L Tri+PCBs at Federal Dam).
Because there is no active remediation associated with the sediments for the No Action andMNA alternatives, action-specific and location-specific ARARs do not apply to thosealternatives. The three active remedial alternatives would comply with action-specific ARARs(e.g., Clean Water Act Section 404; Toxic Substances Control Act; Section 10 of the Rivers andHarbors Act; New York State ECL Article 17, Titles 3 and 8 and Article 27, Titles 3, 7 and 9)and location-specific ARARs (e.g., Endangered Species Act; Fish and Wildlife CoordinationAct; Coastal Zone Management Act; National Historic Preservation Act; and New York StateFreshwater Wetlands Act). During remedial design, mitigation measures will be evaluated inorder to reduce impacts on floodplains, wetlands, and submerged aquatic vegetationcommunities, as necessary, to ensure compliance with Executive Orders 11990 and 11988.
Since the Lower Hudson (south of the Federal Dam at Troy) is located within a coastal zonemanagement area, and since the active remedial alternatives might affect a coastal use orresource, the federal Coastal Zone Management Act requires that the remedy be undertaken in amanner consistent, to the maximum extent practicable, with New York State’s coastal zonemanagement policies. It is expected that the requirement would be satisfied by each of the activeremedial alternatives.

Hudson River PCBs Site Record of Decision
78
Primary Balancing Criteria - The next five Superfund criteria, 3 through 7, are known as“primary balancing criteria.” These five criteria are factors with which tradeoffs betweenresponse measures are assessed so that the best option will be chosen, given site-specific dataand conditions.
11.3 Long-Term Effectiveness and Permanence
Long-term Effectiveness and Permanence considers the ability of an alternative to maintainprotection of human health and the environment over time.
Reduction of Residual Risk
The No Action and MNA alternatives result in a continuation of the degraded condition of thesediments and surface water quality of the Upper Hudson River, especially in the ThompsonIsland Pool, for at least several decades, regardless of any reduced PCB concentrations in theupstream water quality. The No Action alternative removes no PCBs from the river and effectsno active reduction in PCB levels in fish. The MNA alternative does assume upstream sourcecontrol and therefore shows reduced risks when compared to the No Action alternative.
For the CAP-3/10/Select alternative, residual risk is reduced through the capping of 207 acresof PCB-contaminated sediments and removal of 1.73 million cubic yards of sediments. The totalarea remediated (capped plus removed) via this alternative encompasses 493 acres, and the totalquantity of total PCBs remediated is approximately 70,000 kg (150,000 lbs). The reduction incancer risks through fish consumption ranges from 73% to 83% compared to the No Actionalternative and from 45% to 78% compared to the MNA alternative. The reduction in non-cancerhazard indices ranges from 68% to 77% compared to the No Action alternative and from 55% to73% compared to the MNA alternative.
For the REM-3/10/Select alternative, residual risk is reduced through the removal of 2.65million cubic yards of sediments containing approximately 70,000 kg (150,000 lbs) of totalPCBs over an area of 493 acres. The reduction in cancer risks through fish consumption rangesfrom 76% to 85% compared to the No Action alternative and from 50% to 80% compared to theMNA alternative. The reduction in non-cancer hazard indices ranges from 71% to 79% comparedto the No Action alternative and from 58% to 75% compared to the MNA alternative.
For the REM-0/0/3 alternative, residual risk is reduced through the removal of 3.82 millioncubic yards of sediments containing more than 84,000 kg (185,000 lbs) of total PCBs over anarea of 964 acres. The reduction in cancer risks through fish consumption ranges from 82% to

Hudson River PCBs Site Record of Decision
79
89% compared to the No Action alternative and from 63% to 85% compared to the MNAalternative. The reduction in non-cancer hazard indices ranges from 80% to 86% compared tothe No Action alternative and from 72% to 83% compared to the MNA alternative.
Adequacy of Controls
The No Action and MNA alternatives do not provide for active engineering controls on theriver sediments. The MNA alternative does assume source control near the GE Hudson Fallsplant and institutional controls. NYSDOH’s 1996 study of anglers in the Upper and LowerHudson found that, despite a ban on fish consumption in the Upper Hudson and highly restrictiveadvisories in the Lower Hudson, about 18% of the Upper Hudson respondents had fish in theirpossession when interviewed and 11% had more than one fish. Most of the fish were largemouthbass, smallmouth bass, and bluegill, species that are often eaten. In the Mid-Hudson region,about 8% actually had fish in their possession when interviewed. Therefore, the existinginstitutional controls, which rely heavily on voluntary compliance, do not adequately eliminateexposure to PCBs due to consumption of contaminated fish. In addition, institutional controlsare inadequate for protection of the environment (e.g., the birds, mammals and fish that consumefish). Given the survey data, it is unlikely that sole reliance on these types of controls would bereliable in the long term to ensure human health and ecological protection.
The CAP-3/10/Select alternative provides for select removal of some PCB-contaminatedsediments in target areas and placement of an engineered cap over the remaining target areas. Like the MNA alternative, this alternative also provides for institutional controls, such as the fishconsumption advisories and fishing restrictions (although perhaps in a modified form), and otherSite use restrictions in capped areas (e.g., prohibition of sediment disturbance activities inwaterfront improvements by private residences or commercial/industrial establishments along theshoreline). Although institutional controls would still be required for the two removalalternatives, the risk to consumers of fish would be greatly reduced by these alternatives.
The REM-3/10/Select and REM-0/0/3 alternatives provide for removal of PCB-contaminatedsediments in targeted areas. These two alternatives also provide for institutional controls, such asthe fish consumption advisories and fishing restrictions (although perhaps in a modified form),but they are unlikely to require additional Site use restrictions after removal activities arecompleted.
All alternatives will require some degree of monitoring. Monitoring programs will bedeveloped, as appropriate, for all phases of the project.

Hudson River PCBs Site Record of Decision
80
Reliability of Controls
The No Action alternative is the least reliable. Although the MNA alternative is better thanthe No Action alternative, the institutional controls associated with the MNA alternative do notprotect ecological receptors, and human risk reduction under that alternative relies on knowledgeand observance of the fish consumption advisories and fishing restrictions to a greater degreethan under the two removal alternatives, which reduce the risk to consumers of fish to a fargreater extent than MNA.
For the active remedies and MNA, fish consumption advisories and fishing restrictions willcontinue to provide some measure of protection of human health until PCB concentrations in fishare reduced to the point where the fish consumption advisories and fishing restrictions can berelaxed or lifted. Among the active alternatives, sediment capping, sediment removal (dredgingand excavation), habitat replacement/backfilling and off-site disposal/treatment of removedsediments are all established technologies.
The CAP-3/10/Select alternative relies upon proper design, placement and maintenance of thecap in perpetuity for its effectiveness, continued performance and reliability. A cap integritymonitoring and maintenance program should provide reasonable reliability, although there areinherent challenges in monitoring and maintaining a cap in the Upper Hudson riverineenvironment. The CAP-3/10/Select alternative is less reliable than the removal alternatives dueto the potential for damage to the cap, thereby exposing PCBs. In addition, the CAP- 3/10/Selectalternative is vulnerable to a catastrophic flow event, such as might be seen during a 500-yearflood or a dam failure.
In general, the REM-3/10/Select and REM-0/0/3 alternatives are the most reliable, as there islittle or no long-term additional maintenance associated with the remedial work. Of the removalalternatives, REM-0/0/3 is the most reliable, as it permanently removes the greatest amount ofsediment (leaving the least amount of PCBs in the river) and achieves the greatest reduction ofthe potential scour-driven resuspension of PCB-contaminated sediments south of the confluencewith the Hoosic River.
Summary
Based on the above analysis of reduction in residual risk and adequacy and reliability ofcontrols, the three active remedial alternatives are far superior to the No Action and MNAalternatives due to the much greater differences in risk reduction and mass of PCBs removedfrom the river. The three action alternatives are similar to each other in terms of risk reductionwith REM-0/0/3 being the most effective; however, the REM-3/10/Select and REM-0/0/3alternatives rank higher than the CAP-3/10/Select alternative due to the quantities of PCBs

Hudson River PCBs Site Record of Decision
81
removed from the river and the permanence of such removal versus the long-term operation andmaintenance required by capping PCB-contaminated sediments. EPA’s analysis of residual riskfor each alternative is consistent with the NRC report recommendation to consider options toreduce risk and to consider residual risks associated with material left behind.
11.4 Reduction in Toxicity, Mobility, or Volume Through Treatment
Reduction in Toxicity, Mobility, or Volume of Contaminants through Treatment evaluates analternative's use of treatment to reduce the harmful effects of principal contaminants, theirability to move in the environment and the amount of contamination present.
The No Action and MNA alternatives do not involve any containment or removal ofcontaminants from the Upper Hudson River sediments. Because the MNA alternative assumes aseparate source control action near the GE Hudson Falls plant, the Tri+ PCB load to the watercolumn upstream of the Thompson Island Pool is projected by EPA modeling to be reduced from0.16 kg/day to 0.0256 kg/day by January 1, 2005. The No Action and MNA alternatives rely onnatural attenuation processes such as burial by cleaner sediments, biodegradation, bioturbationand dilution to reduce concentrations of PCBs in sediments and surface water.
Biodegradation processes have been found to partially convert some of the more highly-chlorinated PCB congeners to less-chlorinated congeners and thereby slightly reduce theirtoxicity. At the same time, individual fish and other biota will preferentially bioaccumulate themore toxic PCB congeners. Nevertheless, concentrations of PCBs in fish populations willrespond slowly over time to slow natural decreases in concentrations in sediments and surfacewater.
For the CAP-3/10/Select alternative, the mobility of the PCBs in capped areas (approximately207 acres) would be reduced because these PCBs are sequestered under the cap. However,capping does not satisfy the CERCLA statutory preference for treatment. In addition, there is noreduction in the toxicity or volume of the PCBs under the cap. Under this alternative, the mass ofPCBs and the volume of contaminated sediments within the Upper Hudson River arepermanently reduced because approximately 1.73 million cubic yards of sediment would beremoved. A total of approximately 70,000 kg (about 150,000 lbs) of total PCBs would beremoved or isolated from the ecosystem by this alternative. Because the CAP-3/10/Selectalternative also assumes source control near the GE Hudson Falls plant, the Tri+ PCB load to thewater column is projected by EPA modeling to be reduced from 0.16 kg/day to 0.0256 kg/day byJanuary 1, 2005. In addition, after construction of the remedy is completed, natural attenuationprocesses would provide additional reductions in PCB concentrations in the remainingsediments and surface water.

Hudson River PCBs Site Record of Decision
82
For the REM-3/10/Select and REM-0/0/3 alternatives, the mass of PCBs and volume ofcontaminated sediments in the Upper Hudson River are permanently reduced because sedimentvolumes from 2.65 to 3.82 million cubic yards, respectively, containing a mass of total PCBsfrom approximately 70,000 kg (about 150,000 lbs) to an estimated mass of greater than 84,000kg (about 185,000 lbs), respectively, are removed from the ecosystem. Because these removalalternatives also assume source control near the GE Hudson Falls plant, the Tri+ PCB load to thewater column is projected by EPA modeling to be reduced from 0.16 kg/day to 0.0256 kg/day byJanuary 1, 2005. Also, as stated for the CAP-3/10/Select alternative, after construction of theremedy is completed, natural attenuation processes would provide additional reductions in PCBconcentrations in the remaining sediments and surface water.
While the active remedial alternatives would permanently remove large volumes of PCBsfrom the river (thereby reducing their mobility), they do not satisfy the statutory preference fortreatment as a principal element of the remedy. Given the volume of material to be removed,treatment of the dredged material prior to off-site disposal would not be cost-effective, other thanthe stabilization of the sediments for handling purposes. During remedial design, EPA willconsider whether there are any new treatment options for the dredged sediment. During theremedial design or implementation, EPA also will determine whether beneficial use (i.e., themanufacture of commercial products) is appropriate for some portion of the dredged material.
11.5 Short-Term Effectiveness
Short-term Effectiveness considers the length of time needed to implement an alternative andthe risks the alternative poses to workers, residents and the environment during implementation.
Length of Time Needed to Implement the Remedy
The implementation times for the active alternatives are 6 years for CAP-3/10/Select andREM-3/10/Select and 8 years for REM-0/0/3. This represents the estimated time required formobilization, operation and demobilization of the remedial work, but does not include the timerequired for long-term monitoring or O&M. The No Action and MNA alternatives do notinvolve any active remediation.
For the active remediation alternatives, remedial dredging will be conducted in two phases. The first phase will be the first construction season of remedial dredging. The dredging duringthat year will be implemented initially at less than full scale operation. It will include anextensive monitoring program of all operations. These monitoring data will be compared toperformance standards identified in this ROD or developed during the remedial design. Performance standards will address (but might not be limited to) resuspension rates duringdredging, production rates, residuals after dredging and community impacts (e.g., noise, air, odor

Hudson River PCBs Site Record of Decision
83
and navigation). EPA will consider the New York State regulations that specify ChamplainCanal navigational channel dimensions in developing the navigation performance standard. Anindependent external peer review of the dredging resuspension, PCB residuals and productionrate performance standards will be conducted during design. The information and experiencegained during the first phase of dredging will be used to demonstrate compliance with theperformance standards. Further, the data gathered will enable EPA to determine if adjustmentsare needed to operations in the succeeding phase of dredging, or if performance standards needto be reevaluated. EPA will make the data, as well as any evaluation of the success or failure ofthe work in meeting the performance standards, available to the public. See the discussion inSection 13.3 of the Decision Summary regarding community participation during the remedialdesign and construction periods.
Protection of the Community During Remedial Actions
No construction activities are associated with the remediation of sediments for the No Actionand MNA alternatives, so neither alternative increases or decreases the potential for directcontact with or ingestion and inhalation of PCBs from the surface water and sediments.
A community involvement process will be incorporated into this project. EPA will provideopportunities for the public to have involvement and meaningful input throughout project designand construction, including input into the siting and design aspects of sedimentprocessing/transfer facilities.
A Community Health and Safety Plan will be developed by EPA with New York State inputduring remedial design. The intent of the Community Health and Safety Plan is to protect thecommunity, including persons in residences and businesses, from potential exposures as a directresult of investigative and remedial work activities. The Community Health and Safety Plan willprovide for community notification of ongoing health and safety issues, monitoring ofcontaminants and protection of the community from physical and other hazards. The plan willinclude a section that outlines the actions to be followed should monitoring of contaminantsshow contaminant levels above action levels.
Access to sediment processing/transfer facilities and process and treatment areas under theactive remediation alternatives will be restricted to authorized personnel. Controlling access tothe dredging locations and sediment processing/transfer facilities along with monitoring andengineering controls developed during the design phase will minimize potential short-term risksto the community. The design will also provide for appropriate control of air emissions, noiseand light through the use of appropriate equipment that meets all applicable standards. Compliance with these design provisions will be monitored during construction, operation anddemobilization. Vehicular traffic will increase due to workers and supply deliveries at thesediment processing and transfer facilities. The potential for traffic accidents might increase

Hudson River PCBs Site Record of Decision
84
marginally as additional vehicles are on the road. These effects are likely to be minimal, in partbecause the transportation of sediments for disposal and the transportation, within the UpperHudson River area, of material for backfill and capping is expected to be accomplished by railand/or barge. If a beneficial use of some portion of the dredged material is arranged, then anappropriate transportation method will be determined (rail, truck, or barge).
For the active remediation alternatives, work in the river will also be designed with provisionsfor control of air emissions, noise and light. Work areas outside the channels will be isolated(access-restricted), with an adequate buffer zone so that pleasure craft and commercial shippingcan safely avoid such areas. Environmental dredging in the channels will be conducted at timesand in ways to minimize disruption to river traffic. Provisions will be made in the routing ofbarges to avoid impacts to recreational and commercial use of the river. Finally, targeteddredging will be sequenced and directed to ensure minimal impacts to navigation within theriver. To help ensure that navigation is not impeded, EPA will consult with the New York StateCanal Corporation during remedial design and construction phases on issues related to canalusage, navigational dredging, and other remedy-related activities within the navigational channel. Discrete areas of the river will be subject to dredging and related activities only over shortperiods of time; once an area is dredged, dredging equipment will move to another area, therebylessening locational impacts.
Air impacts at dredging sites, on barges and at land based facilities are expected to beminimal. Action levels will be established, monitoring conducted and appropriate engineeringcontrol measures employed to ensure that any air releases do not exceed acceptable levels. Acommunity notification system, which will be established during the remedial design, will keepthe residents informed regarding the data from EPA’s air monitoring program.
EPA believes that implementation of REM-3/10/Select, the selected remedy, will have little ifany adverse impact on local businesses or recreational opportunities. Indeed, as discussed in theResponsiveness Summary, the Agency believes that the remedy will have substantial positiveeconomic impacts on local communities and will facilitate enhanced recreational activities in andalong the river. To the extent that any adverse local impacts do occur, EPA expects that they willbe short-term and manageable. Moreover, EPA believes that any such impacts will be faroutweighed by the long-term benefits of the remediation on human health and the environment.
In summary, the active remedial alternatives would not pose significant risk to the nearbycommunities.

Hudson River PCBs Site Record of Decision
85
Protection of Workers During Remedial Actions
For the No Action alternative, occupational risks to persons performing the samplingactivities (for the 5-year reviews) will be unchanged from current levels. There is some minimalincrease in occupational risk associated with the MNA alternative due to the greater degree ofsampling involved in the river.
For the three active remediation alternatives (CAP-3/10/Select, REM-3/10/Select and REM-0/0/3), potential occupational risks to Site workers from direct contact, ingestion and inhalationof PCBs from the surface water and sediments, as well as routine physical hazards associatedwith construction work and working on water, are higher than for the No Action and MNAalternatives. For these alternatives, as well as the No Action and MNA alternatives, personnelwill follow a site-specific health and safety plan and OSHA health and safety procedures andwear the necessary personal protective equipment; thus, no unacceptable risks would be posed toworkers during the implementation of the remedies.
Vehicles used for the transportation of hazardous waste will be designed and operated inconformance with DOT regulations. EPA will provide the community and local government theopportunity to have input on plans related to the off-site transportation of hazardous wastes. Thisapproach is consistent with the NRC recommendation to involve the local communities in riskmanagement decisions.
Potential Adverse Environmental Impacts During Construction
No construction activities associated with the river sediments are conducted for the No Actionand MNA alternatives. Neither continuation of the existing limited sampling activities for theNo Action alternative nor the increased monitoring program for the MNA alternative isanticipated to have any adverse effect on the environment, beyond that already caused by thePCB contamination of the sediments in the Upper Hudson River. For the three activeremediation alternatives (CAP-3/10/Select, REM-3/10/Select and REM-0/0/3), the release ofPCBs from the contaminated sediments into the surface water during construction (dredging andcap placement), will be controlled by operational practices (e.g., control of sediment removalrates, use of environmental dredges and use of sediment barriers). Although precautions tominimize resuspension will be taken, it is likely that there will be a localized temporary increasein suspended PCB concentrations in the water column and possibly in fish PCB body burdens. Analysis of yearly sediment resuspension rates, as well as resuspension quantities during yearlyhigh flow events, shows the expected resuspension due to dredging to be well within thevariability that normally occurs on a yearly basis. The performance standards and attendantmonitoring program, that are developed and peer reviewed during design, will ensure thatdredging operations are performed in the most efficacious manner, consistent with theenvironmental and public health goals of the project.

Hudson River PCBs Site Record of Decision
86
Remedial activities may also result in short-term temporary impacts to aquatic and wildlifehabitat of the Upper Hudson. Where appropriate, habitat replacement/backfilling measures willbe implemented to mitigate these impacts. A monitoring program will be established to verifythe attainment of the habitat replacement objectives. Although the degree of impact will bedirectly related to the area remediated and volume dredged, these differences among thealternatives are not considered to be significant due to their temporary nature and the mitigationmeasures which will be utilized. In addition, because of existing erosion of the river bed, thepresence of invasive species and other adverse impacts to wetlands along the Hudson River,remediation can result in collateral benefits in the course of mitigation, including removal ofnuisance species, reintroduction of native species, aeration of compacted and anaerobic soils andother enhancements of wetland habitats.
EPA has consulted with the natural resource trustees (NOAA, DOI and NYSDEC), and theysupport an environmental dredging remedy since the long-term benefits outweigh the short-termimpacts. Short-term impacts are for a limited time scale, will be greatest in the area of activeremediation and will dissipate in a downstream direction.
For the CAP-3/10/Select alternative, there is the additional potential transient impact from thetemporary exposure of deeper, potentially highly contaminated sediments during the intervalbetween excavation and cap placement. This impact would be minimized by placement of thecap as soon as practicable after the removal operations are complete, assumed to be no more than30 days. Therefore, regarding this issue, there is not a significant difference in transient impactbetween the CAP-3/10/Select, REM-3/10/Select and REM-0/0/3 alternatives.
The magnitude of the short-term impacts discussed above varies with the overall scope of thealternative, in terms of volume of material excavated and area remediated. The implementationtimes for the active alternatives are 6 years for CAP-3/10/Select and REM-3/10/Select, and 8years for REM-0/0/3.
Time Until Protection is Achieved
The projected time required to reach remedial goals and PCB target levels in fish for each ofthe remedial alternatives is discussed in Section 11.1 (Overall Protection of Human Health andthe Environment).
11.6 Implementability
Implementability addresses the technical and administrative feasibility of a remedy fromdesign through construction and operation. Factors such as availability of services and

Hudson River PCBs Site Record of Decision
87
materials, administrative feasibility and coordination with other governmental entities are alsoconsidered.
Technical Feasibility
Both the No Action and MNA alternatives are technically feasible as no active measureswould be taken for the PCB-contaminated sediments. Source controls are expected to beimplemented at and near the GE Hudson Falls plant site under an existing Consent Orderbetween NYSDEC and GE.
Technical feasibility for the active remediation alternatives is discussed below in terms of themain components of the alternatives. Additional information is provided in the FS.
• Sediment Processing/Transfer Facilities - Alternatives CAP-3/10/Select, REM-3/10/Select and REM-0/0/3 require sediment processing/transfer facilities. At thesefacilities, the transfer, dewatering and stabilization of dredged material would beconducted. Each of these activities is considered a readily implementable, commonlyengineered activity. Design of sediment processing/transfer facilities will includerequirements for the control of light, noise, air emissions, and water discharges.
EPA has not determined the location of the sediment processing/transfer facilities. A processwhich includes a community/public involvement component will be developed to evaluate andselect sites. Preliminary criteria were utilized to establish a list of preliminary candidate sites toallow for the preparation of a cost estimate. In preparing the cost estimate in the FeasibilityStudy, EPA assumed two technically feasible locations, a northern facility adjacent to theHudson River near the Thompson Island Pool and a southern facility near Albany. Thesetransfer facilities are to be temporary and will be removed after completion of the active remedialactivities.
Removal - Alternatives CAP-3/10/Select, REM-3/10/Select and REM-0/0/3 require thedredging of contaminated sediments. Dredging of sediments is a readily implementableengineering activity. Environmental dredges will be used to minimize the resuspension anddownstream transport of PCBs from the dredging activities. The type of dredging equipment(mechanical and/or hydraulic) will be selected during the remedial design, using the mostappropriate equipment for the specific conditions in the river. The use of silt screens or otherbarriers (e.g., coffer dams, sheet piling), as appropriate, could further assist in limitingdownstream migration of PCBs and may be used as well.
Remedial dredging will be conducted in two phases. The first phase will be the firstconstruction season of remedial dredging. The dredging during that year will be implemented

Hudson River PCBs Site Record of Decision
88
initially at less than full scale operation. It will include an extensive monitoring program of alloperations. These monitoring data will be compared to performance standards identified in thisROD or developed in consultation with the State, other natural resource trustees, and the public,during the remedial design. Performance standards will address (but may not be limited to)resuspension rates during dredging, production rates, residuals after dredging, and communityimpacts (e.g., noise, air, odor and navigation). These performance standards will be enforceable,and based on objective environmental and scientific criteria. The standards will promoteaccountability and ensure that the cleanup meets the human health and environmental protectionobjectives of the ROD. The information and experience gained during the first phase of dredgingwill be used to evaluate and determine compliance with the performance standards. Further, thedata gathered will enable EPA to determine if adjustments are needed to operations in thesucceeding phase of dredging or if performance standards need to be reevaluated. EPA willmake the data, as well as any evaluation of the work with respect to the performance standards,available to the public. See the discussion in Section 13.3 of the Decision Summary regardingcommunity participation during the remedial design and construction periods.
Capping - Alternative CAP-3/10/Select requires capping of sediments. The placement ofcapping materials is a readily implementable engineering activity. This alternative will requirelong-term monitoring of the cap, and may require boating restrictions to be placed on certainsections of the river. Sand, gravel and/or fine materials may be utilized for capping. The type(e.g., texture/size and sorting) of cap material will be determined on a location specific basis. Inaddition, an evaluation of the AquaBloktm system is currently in progress at several remedialsites (e.g., Ottawa River, Ohio; Fort Richardson, AK). The implementability and long-termperformance of the AquaBloktm system have not yet been established, but it is expected thatconsiderable performance data will become available in the near future. However, the principalcomponent of this system is bentonite, which is considered a very stable, low-permeabilitybarrier. Bentonite has been used in multimedia and clay capping systems for many years and hasdemonstrated effectiveness for the long-term encapsulation of contaminants.
Backfilling - Alternatives REM-3/10/Select and REM-0/0/3 require backfilling whereappropriate. The placement of backfill is a readily implementable engineering activity. Sand,gravel and fine materials may be utilized for backfill. Backfill materials will be transportedwithin the Upper Hudson River area by rail and/or barge. The source of backfill material will bedetermined during the design phase.
Transportation and Disposal - Dredged materials may be transported in-river to sedimentprocessing/transfer facilities using barges or pipelines. These are considered readilyimplementable engineering activities. Transportation via pipeline is limited to certain distancesas a result of pumping limitations. Consequently, in some areas of the river, pipelines may notbe implementable.
Hudson River PCBs Site Record of Decision
89
Off-site transportation of dredged materials to disposal facilities will be by rail and/or barge. These forms of transportation are routine engineering activities that have been employed at manySuperfund sites and are technically implementable. EPA will comply with rules for transportingboth hazardous and non-hazardous wastes. The location, layout and process integration of railline and spur connections will be determined in conjunction with the siting process of thesediment processing/transfer facilities (during the design phase). The preliminary screening ofrail viability indicated that current rail capacity may require more than one rail connection.
Off-site disposal is a common activity at Superfund sites. The number and location of off-site(outside the Hudson River Valley) disposal facilities will be based on a combination ofcontaminant concentration, dredged material volume, transportation and cost considerations. Abeneficial use analysis will also be performed during the design phase.
REM-3/10/Select is more implementable from a technical feasibility perspective than REM-0/0/3 due to the smaller volume of material to be dredged and handled, as well as theaccessibility of the areas to be dredged. Both removal alternatives are more technicallyimplementable than the CAP 3/10/Select alternative due to the combination of capping anddredging issues associated with the capping alternative.
An ex-situ treatment alternative, thermal desorption, was determined to be technically feasiblebut was eliminated from further consideration during the screening analysis for two reasons: 1)the associated costs of such treatment technologies are significantly greater than off-site landfilldisposal; and, 2) a locally-sited thermal treatment facility would not be expected to beadministratively feasible.
Administrative Feasibility
Local Landfill - A locally-sited landfill for sediments dredged from the Upper Hudson Riverwas eliminated from consideration during the screening of technologies and alternatives. Thiswas based on the likely administrative infeasibility of siting a local landfill, given the long-standing opposition of local communities to disposal of PCB-contaminated sediments within theHudson River Valley, as well as the need for a permitting process (should the landfill not be “on-site”). In recognition of the concerns of the local community, permitted facilities outside theHudson River Valley will be utilized for disposal.
Both No Action and MNA require no active measures; therefore, they are the mostimplementable from an administrative feasibility perspective. The active remedial measures aresomewhat more difficult to implement from an administrative feasibility perspective due to theneed for siting the sediment processing/transfer facilities and addressing the associated real

Hudson River PCBs Site Record of Decision
90
property issues, and the need to make arrangements to utilize the river with minimal interruptionof boat traffic.
For the active remediation alternatives (CAP-3/10/Select, REM-3/10/Select, and REM-0/0/3),the transfer facilities, constructed on land adjacent to the river, or in-river, are considered “on-site” for the purposes of the permit exemption under CERCLA Section 121(e), although any suchfacilities will comply with the substantive requirements of any otherwise necessary Federal orState permits. Operations under these alternatives will have to be performed in conformancewith the substantive requirements of regulatory programs implemented by the U.S. Army Corpsof Engineers under Section 10 of the Rivers and Harbors Act and Section 404 of the Clean WaterAct. In addition, discharges during remediation will conform to substantive NYS regulationsrelated to maintenance of Hudson River water quality. Habitat replacement/backfilling will beimplemented as appropriate in accordance with federal and State requirements. The State,federal natural resource trustees and the public will be given the opportunity to provide inputregarding the habitat replacement/backfill plan.
In addition, it is expected that contract documents for any of the active remediationalternatives will contain substantial controls on construction activity, including controls on thetypes of dredging and capping equipment to be used, specifics on the speed of operations,constraints on barge filling practices and controls on temporary storage of contaminated dredgespoils. Construction activities will also be coordinated with the New York State CanalCorporation, which operates the locks on the Upper Hudson River from May through Novemberand controls navigation in the Champlain Canal. Finally, requirements of any other regulatoryprograms will be incorporated as necessary on the basis of design information developed duringsubsequent phases of the project.
Following the issuance of this ROD, EPA will involve the community in the selection processof possible locations for the sediment processing/transfer facilities before selecting the finallocation(s). EPA also will provide the public with opportunities to provide input regardingdesign aspects of the remedy and performance standards, so that community concerns andsuggestions regarding, for example, potential noise, light, odor and traffic impacts can beconsidered by EPA during the design phase.
Availability of Services and Materials
For the No Action and MNA alternatives, all needed services and materials are available. Forthe CAP-3/10/Select, REM-3/10/Select and REM-0/0/3 alternatives, because commercialoperations on the Champlain Canal system have largely ceased, equipment such as barges andtugs may no longer be available in the project vicinity. However, it is expected that theconstruction contractors will obtain the needed equipment for a project of the scale envisioned

Hudson River PCBs Site Record of Decision
91
under these alternatives. Backfill materials (e.g., sand and gravel) are readily available fromcommercial sources.
11.7 Cost
Cost includes estimated capital and annual operation and maintenance costs, as well aspresent worth cost. Present worth cost is the total cost of an alternative over time in terms oftoday's dollar value. Cost estimates are expected to be accurate within a range of +50 to -30percent. (This is a standard assumption in accordance with EPA guidance.)
The discussions of the alternatives below do not include any costs for source control measuresthat will be taken near the GE Hudson Falls plant. Table 11-5 provides a comparison of presentworth costs by alternative with additional information on the area remediated and the mass ofcontamination removed.
Net Present Worth
The net present worth (year 2000 dollars) of the remedial alternatives ranges from $140,000for No Action to $570,000,000 for REM-0/0/3. The net present worth of REM/3/10/Select is$460,000,000, which is $110,000,000 less than REM-0/0/3. For the active remedial alternatives(CAP-3/10/Select, REM-3/10/Select and REM-0/0/3), these costs are based on the use ofmechanical dredging techniques to remove PCB-contaminated sediments from the Upper HudsonRiver and the disposal of all dredged materials at licensed TSCA and non-TSCA landfills locatedoutside of the Hudson River Valley. For the option where the non-TSCA material is utilized forbeneficial uses, the net present worth of the active remedial alternatives ranges from$338,000,000 for CAP-3/10/Select to $496,000,000 for REM-0/0/3. There is no significantdifference in the net present worth costs for the option where hydraulic dredging techniques areutilized to remove PCB-contaminated sediments.
Capital Cost
The No Action alternative has no capital cost. The MNA alternative has a present worthcapital cost of $417,000 for further refining the mathematical model for the Upper Hudson River. The present worth of the capital costs for the active remedial alternatives ranges from$344,000,000 for CAP-3/10/Select to $556,000,000 for REM-0/0/3. The present worth of thecapital costs for REM-3/10/Select is $448,000,000, some $108,000,000 less than the presentworth of the capital costs for REM-0/0/3. For these active remediation alternatives, the presentworth of the capital costs includes the disposal of the stabilized dredged materials at licensedTSCA and non-TSCA landfills (located outside the Hudson Valley) and assumes the use of

Hudson River PCBs Site Record of Decision
92
mechanical environmental dredging techniques to remove PCB-contaminated sediments from theriver.
For the option where the non-TSCA material is utilized for beneficial uses, present worth ofthe capital costs for the active remedial alternatives ranges from $314,000,000 for CAP-3/10/Select to $483,000,000 for REM-0/0/3. The present worth of the capital costs of REM-3/10/Select under the beneficial use option is $399,000,000. These beneficial use option costsare also based on the use of mechanical environmental dredging techniques. There is nosignificant difference in the present worth of capital costs for the option where hydraulicdredging techniques are utilized to remove PCB-contaminated sediments.
O & M Cost
Due to the varying frequency of different elements of the monitoring program, as well as thefive-year reviews required by the NCP, O&M costs will vary on an annual basis. The presentworth of the O&M cost for the No Action alternative is $140,000 and for the MNA alternative is$38,000,000. The present worth of the O&M costs for CAP-3/10/Select is $24,000,000, forREM-3/10/Select is $13,000,000 and for REM-0/0/3 is $13,000,000. There is no significantdifference in the present worth of the O&M costs for the option in which hydraulic dredgingtechniques are utilized to remove PCB-contaminated sediments.
Modifying Criteria - The final two evaluation criteria, 8 and 9, are called “modifyingcriteria” because new information or comments from the state or the community on theProposed Plan may modify the preferred response measure or cause another response measureto be considered.
11.8 State Acceptance
State Acceptance indicates whether based on its review of the RI/FS reports and the ProposedPlan, the state supports, opposes, and /or has identified any reservations with the selectedresponse measure.
The New York State Department of Environmental Conservation, which is the support agencyfor this project, concurs with EPA’s decision for this Site.
Hudson River PCBs Site Record of Decision
93
11.9 Community Acceptance
Community Acceptance considers whether the local community agrees with EPA's analysesand preferred alternative. Comments received on the Proposed Plan are an important indicatorof community acceptance.
There are numerous stakeholders involved with the Site with varying positions on activeremediation of the Upper Hudson River. EPA received tens of thousands of comments on theProposed Plan, some in support of dredging the Hudson and some in opposition to dredging. Forexample, a number of organizations including environmental groups from the Mid- and LowerHudson region are in favor of remediation. This includes the environmental group ScenicHudson, Inc., which was awarded a Technical Assistance Grant for the Site. Groups in favor ofan active remedy argue that there would be continued unacceptable human health risks if noremediation is conducted, continued economic loss of commercial fisheries, continued anglerconsumption of contaminated fish despite advisories and insignificant breakdown of PCBsthrough dechlorination processes. They further point to the fact that PCB-contaminatedsediments are not being universally buried and that the peer review findings support EPA’stechnical analyses and conclusions.
Many residents of communities immediately adjacent to the areas where dredging would haveits greatest construction impacts oppose active remediation, preferring to leave the contaminationin place. Among other things, these groups cite concern over the remedy being ecologicallydevastating, that there is ongoing natural cleanup through dechlorination and burial, that EPA’sPCB load estimates are flawed, that the models and data do not support materially acceleratedreductions of PCBs in fish from dredging (as compared to results under MNA or No Action) andthat EPA’s conclusions about the toxicity of PCBs are overstated.
During the comment period on the Proposed Plan, Upper Hudson communities raised concerns about the location and design features of needed dredge material sedimentprocessing/transfer facilities. As discussed below, EPA is not siting these facilities as part of thisRecord of Decision. Rather, during the remedial design, EPA will provide opportunities for thepublic to have involvement and meaningful input into the siting and design of such facilities.
The Agricultural, Citizen and Governmental Liaison Groups are generally against activeremediation, while most members of the Environmental Liaison Group are in favor of it. Many municipalities have formally endorsed EPA’s remedy proposal, while many other municipalitieshave opposed it.
EPA’s responses to the significant public comments received in response to the FeasibilityStudy and Proposed Plan are contained in the attached Responsiveness Summary.

Hudson River PCBs Site Record of Decision
94
12. PRINCIPAL THREAT WASTES
Sediments which may contribute to the PCB levels in fish, both now and in the future, areconsidered principal threat wastes at the Site. The determination of the significance of thesediment contribution to fish is based primarily on model projections, in conjunction withgeochemical analyses. The model projections indicate that the significance of the sedimentcontribution varies by river section; therefore, the sediment levels that are considered principalthreats will correspondingly vary by river section. Due to the high variability of PCB sedimentconcentrations, MPA, rather than concentration, was identified as the most useful measure of thepotential contribution of an area to PCBs in surface water and fish. An evaluation of theefficiency of potential remedies was conducted by comparing the mass of Tri+ PCBs remediatedto the sediment surface area that would require remediation. The PCB contaminated sedimentconcentrations considered to be principal threats, as represented by mass per unit areameasurements, are 3 g/m2 Tri+ PCBs in River Section 1 and 10 g/m2 Tri+ PCBs in River Section2.
Alternative REM-3/10/Select includes removal of sediments based primarily on an MPA of 3g/m2 Tri+ PCBs or greater in River Section 1, removal of sediments based primarily on an MPAof 10 g/m2 Tri+ PCBs or greater in River Section 2, and removal of selected sediments with highconcentrations of PCBs in River Section 3 (NYSDEC Hot Spots 36, 37, and the southern portionof 39).
13. SELECTED REMEDY
13.1 The Selected Remedy
The selected remedy is the alternative REM-3/10/Select. This remedy includes the targetedenvironmental dredging of approximately 2.65 million cubic yards of PCB-contaminatedsediment from the Upper Hudson River, which is estimated to contain 70,000 kg (about 150,000lbs) of total PCBs (approximately 65% of the total PCB mass present in the Upper HudsonRiver). Table 13-1, Areas of Sediments, Volumes of Sediments, and Mass of PCBs Remediated,provides environmental dredging information by River Section. Plates 13.1 through 13.7 providethe removal areas (locations) and depths, as estimated during the Reassessment FS.
In combination with the additional source control action near the GE Hudson Falls plant, theREM-3/10/Select remedy includes the following components:
• Removal of sediments based primarily on a mass per unit area (MPA) of 3 g/m 2 Tri+PCBs or greater (approximately 1.56 million cubic yards of sediments) from RiverSection 1;

Hudson River PCBs Site Record of Decision
95
• Removal of sediments based primarily on an MPA of 10 g/m 2 Tri+ PCBs or greater(approximately 0.58 million cubic yards of sediments) from River Section 2;
• Removal of selected sediments with high concentrations of PCBs and high erosionalpotential (NYSDEC Hot Spots 36, 37, and the southern portion of 39) (approximately0.51 million cubic yards) from River Section 3;
• Dredging of the navigation channel, as necessary, to implement the remedy and to avoidhindering canal traffic during implementation. Approximately 341,000 cubic yards ofsediments will be removed from the navigation channel (included in volume estimates inthe first three components, above);
• Removal of all PCB-contaminated sediments within areas targeted for remediation, withan anticipated residual of approximately 1 mg/kg Tri+ PCBs (prior to backfilling);
• Performance standards for air quality and noise are included in this ROD consistent withstate and federal law;
• Other performance standards (including but not necessarily limited to resuspension ratesduring dredging, production rates during dredging, and residuals after dredging) will bedeveloped during the design with input from the public and in consultation with the stateand federal natural resource trustees. These performance standards will be enforceable,and based on objective environmental and scientific criteria. The standards will promoteaccountability and ensure that the cleanup meets the human health and environmentalprotection objectives of the ROD;
• Independent external peer review of the dredging resuspension, PCB residuals, andproduction rate performance standards and the attendant monitoring program, as well asthe report prepared at the end of the first phase of dredging that will evaluate the dredgingwith respect to these performance standards;
• Performance of the dredging in two phases whereby remedial dredging will occur at areduced rate during the first year of dredging. This will allow comparison of operationswith pre-established performance standards and evaluation of necessary adjustments todredging operations in the succeeding phase or to the standards. Beginning in phase 1and continuing throughout the life of the project, EPA will conduct an extensivemonitoring program. The data EPA gathers, as well as the Agency’s ongoing evaluationof the work with respect to the performance standards, will be made available to thepublic in a timely manner and will be used to evaluate the project to determine whether itis achieving its human health and environmental protection objectives;
• Use of environmental dredging techniques to minimize and control resuspension ofsediments during dredging;
• Transport of dredged sediments via barge or pipeline to sediment processing/transferfacilities for dewatering and, as needed, stabilization;
• Rail and/or barge transport of dewatered, stabilized sediments to an appropriate licensedoff-site landfill(s) for disposal. If a beneficial use of some portion of the dredged materialis arranged, then an appropriate transportation method will be determined (rail, truck, orbarge);
Hudson River PCBs Site Record of Decision
96
• Backfill of dredged areas with approximately one foot of clean material to isolate residualPCB contamination and to expedite habitat recovery, where appropriate;
• Use of rail and/or barge for transportation of clean backfill materials within the UpperHudson River area;
• Monitored Natural Attenuation (MNA) of PCB contamination that remains in the riverafter dredging;
• Monitoring of fish, water and sediment to determine when Remediation Goals arereached, and also monitoring the restoration of aquatic vegetation; and
• Implementation (or modification) of appropriate institutional controls such as fishconsumption advisories and fishing restrictions by the responsible authorities, untilrelevant Remediation Goals are met.
The targeting of Hot Spots 36, 37 and southern portion of 39, is based on currently availabledata showing that those areas have high PCB concentrations, and potential for loss to the watercolumn or uptake by biota. Additional sampling will be conducted during remedial design todetermine whether other areas, such as previously identified hot spots, in River Section 3 havethese characteristics and therefore need to be remediated as part of the selected remedy.
Remedial dredging will be conducted in two phases. The first phase will be the firstconstruction season of remedial dredging. The dredging during that year will be implementedinitially at less than full scale operation. It will include an extensive monitoring program of alloperations. An independent external peer review of the dredging resuspension, PCB residuals,and production rate performance standards will be conducted during design. Monitoring datawill be compared to performance standards identified in this ROD or developed during theremedial design with input from the public and in consultation with the State and federal naturalresource trustees. The second phase will be the remainder of the dredging operation, which willbe conducted at full-scale. During the full-scale remedial dredging, EPA will continue tomonitor, evaluate performance data and make necessary adjustments.
EPA has identified performance standards that address air and noise emissions from thedredging operations and the sediment processing/transfer facilities. Performance standards forother issues will be developed during design, as described below.
As to air emissions, operations and facilities will comply with the ARARs listed in Table 14-3which deal with such emissions (e.g., the National Primary and Secondary Ambient Air QualityStandards).
Regarding noise emissions, operations at the sediment processing/transfer facilities willcomply with the relevant noise abatement criteria (NAC) of the Federal Highway Administrationset forth at 23 CFR Part 772 (see Table 312685-1 of the Responsiveness Summary). Although it

Hudson River PCBs Site Record of Decision
97
is EPA’s expectation that the facilities will be located in an industrial or commercial area, thedetermination of which NAC will apply will depend on where the sediment processing/transferfacilities are sited. The dredging will comply with the New York State Department ofTransportation construction noise impact guideline for temporary construction noise, whichdefines “impact” as occurring at levels exceeding Leq(1) = 80 dBA.
The performance standards referred to above regarding noise are being adopted preliminarily. During the remedial design phase, EPA will invite public input regarding these standards beforefinalizing the noise standards. Once implementation of the dredging begins, if the air or noiseperformance standards are exceeded, EPA will implement engineering controls or othermitigation measures, as appropriate, in order to address such exceedances.
In addition, during the remedial design phase, EPA will develop other performance standardswith input from the public and in consultation with the State and federal natural resource trustees. These standards will address (but may not be limited to) dredging resuspension, production rates,PCB residuals after dredging (or dredging with backfill, as appropriate), PCB air emissions, andcommunity impacts (e.g., odor). The dredging equipment and methods of operation will beselected based on their expected ability to meet the performance standards.
The information and experience gained during the first phase of dredging will be used toevaluate and determine compliance with the performance standards. Further, the data gatheredwill enable EPA to determine if adjustments are needed to operations in the succeeding phase ofdredging, or if performance standards need to be reevaluated. EPA will make the data, as well asits final report evaluating the work with respect to the performance standards, available to thepublic.
EPA has carefully considered the issues raised by some members of the public pertaining topotential adverse local impacts of a dredging remedy, and these issues are discussed in detail inthe Responsiveness Summary. During the remedial design and remedial action, as part of thepublic involvement program, EPA will work with local communities to identify, minimize, andmitigate adverse local impacts (if any) to the maximum extent practicable.
A separate source control action near GE’s Hudson Falls plant is to be implemented by GE,under an administrative order issued by NYSDEC, to address the continuing discharge of PCBsfrom that facility. Regarding the former outfall to the Hudson River (Outfall 004) from GE’sFort Edward plant site, NYSDEC issued a Record of Decision in January 2000 that calls for theexcavation of PCB-contaminated soil and sediment in this area of the Upper Hudson shoreline inorder to stop these PCBs from entering the river. EPA’s analysis assumes significant reductionsin loading to the river from these sources once the State’s plans for remediation are implemented.
Hudson River PCBs Site Record of Decision
98
EPA carefully considered the recommendations of the National Research Council report (ARisk Management Strategy for PCB-Contaminated Sediments, March 2001) in the finalization ofthe selected remedy for the Hudson River PCBs Site. EPA agrees with the NRCrecommendation that there should be no presumption of a preferred or default risk-managementoption that is applicable to all PCB-contaminated sediment sites. EPA’s selected remedy for theSite includes a combination of remedial activities that were tailored to the conditions at the Site,including removal of contaminated sediment using environmental dredging techniques,institutional controls, and monitored natural attenuation of residual PCB contamination untilacceptable PCB concentrations in fish are attained.
If major changes are made to the selected remedy as a result of the remedial design orremedial construction processes, such changes will be documented, as appropriate, in the form ofa memorandum in the administrative record, an Explanation of Significant Differences (ESD),or a ROD Amendment.
13.2 Summary of the Estimated Costs of the Selected Remedy
The total estimated present-worth cost of the selected remedy is $460 million. A breakdownof the costs is presented in Table 13-2 and is based on the best available information. This is anengineering cost estimate that is expected to be within +50 to -30 percent of the actual projectcost (based on year 2000 dollars). Changes in the cost elements are likely to occur as a result ofnew information and data collected during the remedial design. Major changes may bedocumented in a memorandum in the administrative record, an ESD, or a ROD amendment.
13.3 Issues to be Addressed During the Remedial Design Phase of the Selected Remedy
Following issuance of this ROD, EPA will implement a community involvement program thatwill provide members of the public and elected officials the opportunity for early and meaningfulinput during the decision-making phases of the remedial design. The post-ROD communityinteraction program will build on the existing, extensive public process used for theReassessment RI/FS. EPA will hold a series of public meetings to discuss and take comment ona proposed post-ROD outreach program before it is finalized. This enhanced communityinvolvement program will include opportunities for public comment on, for example, theproposed location(s) and design of sediment processing/transfer facilities; work hours; noisecontrol and traffic control; other ways to minimize or mitigate possible adverse local impacts (ifany); the development of dredging performance standards; and data gathered during the first yearof dredging with respect to performance standards. This enhanced community involvementprogram will remain active throughout the subsequent construction and post-constructionmonitoring phases of the project. It is anticipated that the post-ROD community involvementprogram will have two major elements: frequent and regular interaction with communitiesthrough meetings focused on specific issues of concern and a notable EPA presence in the

Hudson River PCBs Site Record of Decision
99
upriver community (i.e., a field office which will be established during the remedial design phaseand be staffed on a full-time basis during the remedial construction period). These measures willenable EPA to fully involve the public and local communities during the remedial design.
One of the first major issues to be addressed during the remedial design will be the siting ofsediment processing/transfer facilities. Siting of the sediment processing/transfer facilities iscritical to the implementation of the remedy. This is also one of the most sensitive issues to thecommunities in the Upper Hudson. The process to select the location(s) of sedimentprocessing/transfer facilities will include:
• public notification of potential facility locations that satisfy necessary engineeringcriteria;
• public meetings and a public comment period on the proposed locations; and,
• issuance of a document notifying the public about EPA’s final decision on the facility location(s) and explaining the reasons for the decision.
Potential adverse impacts to properties near the sediment processing/transfer facilities will beminimized through careful siting and design of the facilities. EPA intends to locate the facilitiesin industrial or commercial areas. (As noted earlier, although it is projected that the facilities willbe land-based, water-based facilities will also be evaluated.) After completion of active remedialactivities, the parcels will be restored in a manner that takes into account the anticipated futureland use of the parcels, such as redevelopment for commercial or recreational use.
If a sediment processing/transfer facility for the selected remedy is to be located south of theFederal Dam, coastal zone consistency will need to be evaluated for that facility (see Section11.2). Wetlands, floodplains, endangered species and historical and cultural resourceassessments will be conducted for the sediment processing/transfer facilities as well. In addition,EPA will consult with appropriate federal and State agencies in determining whether anyespecially sensitive or unique habitats exist in the Upper Hudson River that may warrant specialconsideration as the remedy is designed.
Sampling and monitoring programs will be developed and implemented during the design,construction and post-construction phases to establish sediment cut lines, verify environmentaldredging accuracy and completeness, determine releases during dredging and to measure the neteffect of upstream source control as well as natural attenuation processes (Section 10.2). Thesemonitoring programs will include sampling of biota, water and sediment such that both short-andlong-term impacts to the Upper and Lower Hudson River environs, as a result of the remedialactions undertaken, can be determined and evaluated. EPA will increase monitoring of water

Hudson River PCBs Site Record of Decision
100
supply intakes during each project construction phase to identify and address possible impacts onwater supplies drawn for drinking water. The locations, frequency and other aspects ofmonitoring of the water supplies in the Upper and Lower Hudson will be developed with publicinput and in consultation with New York State during remedial design.
Other details that will need to be addressed in the remedial design are the type of dredges tobe used (mechanical and/or hydraulic), areas to be backfilled, specific processes and equipmentfor backfilling, dewatering or materials stabilization and ultimate disposal locations. Preliminaryreviews of successful environmental dredging projects indicate that both mechanical andhydraulic dredges should be considered at this Site. The use of computerized systems to controland monitor sediment removal, and contaminated sediment resuspension controls such as dredgeshrouds, silt curtains, air curtains, sheet piling, and oil booms, will also be reviewed. TheReassessment FS provides additional information on various dredge types considered, theirtechnical implementability, and costs. The remedial design will also evaluate the sedimenthandling, processing and transportation, and backfilling processes. EPA will consider whetherthere are any new treatment options or beneficial uses for the dredged sediment and any valueengineering methods (e.g., waste volume or toxicity reductions) that would improve the cost-effectiveness of the remedy. The $460 million net present-worth cost estimate of the selectedremedy is based on the assumption that no such treatment methods, beneficial uses or valueengineering methods are employed.
During the remedial design, EPA, in consultation with the State (NYSDEC), federal naturalresource trustees and the public, will establish performance standards for implementation of theremedy. Performance standards shall include (but may not be limited to): resuspension duringdredging, production rates, residuals after dredging and community impacts (e.g., noise, air odor,lights and navigation). The dredging equipment and methods of operation will be selected basedon their expected ability to meet the performance standards.
The design will call for remedial dredging to be conducted in two phases. In the first phase,the first season of remedial dredging will be implemented initially at less than full-scale, duringwhich extensive monitoring of operations will be performed. These data will be compared to theperformance standards established for the project. The information and experience gained duringthis phase will be used to evaluate and determine compliance with the performance standards andto make any necessary adjustments to operations in the succeeding phase. The second phase willbe the remainder of the dredging operation, which will be conducted at full-scale. During thefull-scale remedial dredging, EPA will continue to monitor, evaluate performance data and makenecessary adjustments.
The design for the project will plan for a construction period of six years (which includes oneyear at less than full-scale and five years at full-scale operation). EPA expects to complete the

Hudson River PCBs Site Record of Decision
101
remedial design and mobilization that would be necessary for dredging to begin during the 2005construction season.
Based on available wetland mapping, the dredging operations will occur in locationscontiguous to approximately 129 acres of wetlands, although no wetlands are currently expectedto be dredged or backfilled. In addition, an estimated 177 acres of submerged aquatic vegetationwill be dredged and an additional 46 acres of submerged aquatic vegetation are locatedcontiguous to areas to be dredged. Wetlands and submerged aquatic vegetation in andcontiguous to the remediation areas and the sediment processing/transfer facilities will be fielddelineated during remedial design. A Statement of Findings that supports the determination toinclude wetland areas in the areas to be remediated is provided in Appendix A. In order toensure compliance with Executive Order 11990, Protection of Wetlands, Section 404 of theClean Water Act, and New York wetland-related ARARs (See Section 9.2 and 14.2), followingthe delineation of areas to be dredged and identification of sediment processing/transfer facilitylocation(s) during the remedial design, EPA will determine appropriate measures to avoid,minimize or mitigate impacts to wetlands. EPA also will consider measures to control orminimize potential migration of PCBs into wetlands if high-flow events occur duringremediation. EPA will develop such appropriate measures in consultation with NYSDEC andthe federal natural resource trustees.
It is likely that the sediment processing/transfer facilities required for the remedy will need tobe located in the floodplain, given the need for the facilities to have direct access to the river. EPA will develop measures to either avoid or minimize potential impacts that the sedimentprocessing/transfer facilities may have on the floodplain after locations are determined duringremedial design, in accordance with Executive Order 11988, Floodplain Management. AStatement of Findings that indicates why it is necessary to conduct these remediation-associatedactivities in the floodplain is provided in Appendix A. EPA also will employ measures tocontrol resuspension and downstream migration of PCBs during remediation, including sedimentbarriers (e.g., silt curtains) and operational controls, in order to minimize potential impacts to thefloodplains from resuspended PCBs.
The Lower Hudson is located within a coastal zone management area. Since the activeremedial alternatives might affect a coastal use or resource, the federal Coastal ZoneManagement Act (CZMA) requires that the selected remedy be undertaken in a mannerconsistent, to the maximum extent practicable, with New York State’s coastal zone managementpolicies. EPA has concluded that the targeted environmental dredging of the PCB contaminatedsediments in the Upper Hudson River is consistent with the New York State CZMA policies. Acoastal zone consistency analysis regarding the sediment transfer/processing facilities will beprepared and submitted to New York State after the locations of such facilities are determinedbut before the remedial design is finalized.

Hudson River PCBs Site Record of Decision
102
EPA will conduct additional identification and evaluation efforts during remedial design todetermine the extent of potential effects to National Register listed or eligible resources. OnceEPA has completed the identification and evaluation efforts, it will then determine if and to whatextent National Register listed or eligible resources will be adversely affected by the selectedremedy, and will identify appropriate methods to mitigate those effects.
Because contamination will remain on-site above health-based levels even after the remedy isimplemented, five-year reviews in accordance with CERCLA (Section 121) are required.
13.4 Rationale for Selection of the Selected Remedy
The selection of a remedy is accomplished through the evaluation of the nine criteria asspecified in the NCP. A remedy selected for a site will be protective of human health and theenvironment, comply with ARARs (or justify a waiver) and offer the best balance of tradeoffswith respect to the balancing and modifying criteria in the NCP.
Through the analyses conducted for the Reassessment RI/FS, EPA has determined that thereis an unacceptable risk to human health and the environment from the consumption of fish fromthe Hudson River. It has also been determined that the unacceptable risk will continue for manydecades without active remediation of the PCB-contaminated sediments and control of theupstream sources. Accordingly, the No Action alternative is not protective of human health andthe environment and therefore could not be selected for the Site.
The MNA alternative, which does not include any active remediation of the sediments butdoes account for future upstream source control, will reduce risks from consumption of fish, butit is predicted to take at least twenty years longer than the selected remedy to reach target levelsin fish tissue in River Sections 1 and 2. Comparisons of the model output to recent data trendssuggest that the model may be overly optimistic with regard to the rate of PCB decline in fishpredicted for the MNA alternative (as well as for No Action). Consequently, the models mayoverstate the benefits of those approaches and underestimate the relative benefits of activeremediation.
All of the three active remediation alternatives, REM- 3/10/Select, CAP-3/10/Select, andREM-0/0/3, would be protective of human health and the environment as they permanentlyremove large volumes of PCBs from the river, which will result in significant reductions in riskfrom consumption of fish from the Hudson. REM-0/0/3 would provide the greatest degree ofprotectiveness, because it removes the largest volume of PCB-contaminated sediment andaddresses the largest area. However, the predicted difference in fish tissue concentrationsbetween REM-0/0/3 and REM-3/10/Select, and correspondingly, the difference in risk, is small.

Hudson River PCBs Site Record of Decision
103
Therefore, the lesser cost associated with REM-3/10/Select makes REM-3/10/Select more costeffective.
The modeling projects that the target concentration of 0.4 mg/kg PCB in fish fillet (wetweight), which is protective of the average adult who consumes one fish meal from the UpperHudson every two months, will be attained within 5 years of completion of dredging (before orby 2013) for the three active remediation alternatives. The target of 0.2 mg/kg PCB, protectiveof an adult who consumes one fish meal from the Upper Hudson per month, is projected to beattained within 16 years of completion of dredging for the three active remediation alternatives. It is projected to take at least 10 additional years for MNA to reach the 0.2 mg/kg and 0.4 mg/kgPCB target levels, as compared to the active remediation alternatives, but this time frame wouldbe decades longer based on the upper bound estimate of MNA. The Remediation Goal of 0.05mg/kg PCB for human consumption of fish, which is protective of an adult who consumes onefish meal from the Upper Hudson per week, will not be attained by any of the alternatives withinthe modeling time frame in the Upper Hudson River as a whole (length-weighted average). However, in River Section 3, the model projections show that the selected remedy will meet the0.05 mg/kg PCB Remediation Goal, within 43 years after completion of the active remediation. As a result, the Remediation Goal of 0.05 mg/kg also is expected to be attained in the majority ofthe Lower Hudson River, due to the lower initial concentration of Site-related PCBs in the LowerHudson compared to the Upper Hudson.
Due to the continuing Tri+ PCB load of 0.0256 kg/d assumed after implementation of thesource control action in the vicinity of the GE Hudson Falls plant, the PCB concentration in fishaveraged over the Upper Hudson is projected by EPA’s models to be reduced to a range of 0.09to 0.14 mg/kg by the selected remedy within the 70-year modeled time period, which is slightlyabove the Remediation Goal of 0.05 mg/kg. If GE’s proposed source control is able to reducethe Tri+ load to zero, then the selected remedy is predicted to reach the Remediation Goal of0.05 mg/kg PCBs in fish tissue by 2039 in River Section 1, by 2041 in River Section 2, and by2025 in River Section 3. The CAP-3/10/Select and REM-0/0/3 alternatives are expected to reachthe Remediation Goal in similar time frames. Under MNA with an upstream load of zero Tri+PCBs, the model predicts it would take until 2063 in River Section 1, 2061 in River Section 2,and 2032 in River Section 3. This emphasizes the impact of reducing the upstream PCB load tothe greatest extent possible, as well as the need for remediation of the sediments.
The active remedial alternatives would permanently remove large volumes (and thereforereduce mobility) of PCBs from the river, although they do not satisfy the statutory preference fortreatment as a principal element of the remedy. Given the volume of material to be removed,treatment of the dredged material prior to off-site disposal, other than the stabilization of thesediments for handling purposes, would not be cost-effective. During remedial design, EPA willconsider whether there are any new treatment options for the dredged sediment and whether thereare value engineering recommendations (e.g., waste volume or toxicity reductions) that couldimprove the cost-effectiveness of the remedy. During the remedial design or implementation,

Hudson River PCBs Site Record of Decision
104
EPA will determine whether beneficial use (i.e., the manufacture of commercial products) isappropriate for some portion of the dredged material.
MNA, CAP-3/10/Select, REM-3/10/Select and REM-0/0/3 rely on institutional controls (fishconsumption advisories and fishing restrictions) to protect human health until target PCBconcentrations in fish are achieved. The MNA alternative relies more heavily on institutionalcontrols than the active remedial alternatives because of the significantly longer times needed tomeet target concentrations under MNA. Institutional controls do not protect ecological receptors,and human health risk reduction relies on knowledge of and voluntary compliance with theconsumption advisories and fishing restrictions. Consequently, the active remedial alternativesare substantially more protective of people who do not follow the fish consumption advisories,because of the residual risk in consuming fish and the shorter time required to reach fish PCBtarget levels under those alternatives.
The selected remedy is also protective of the environment, because the selected remedy willreduce PCB concentrations in fish averaged over the entire Upper Hudson, and in the LowerHudson, to levels that are at or within the range of 0.3 to 0.03 mg/kg in whole largemouth bass(equivalent to 0.12 to 0.012 mg/kg in fish fillet), which is the Remediation Goal for ecologicalexposure. The selected remedy is therefore protective of the piscivorous or semi-piscivorousbirds such as the belted kingfisher, great blue heron and bald eagle, and the piscivorous or semi-piscivorous mammals, such as the river otter and mink, which are the ecological receptors atgreatest risk at the Site. By removing PCBs from the Upper Hudson River, the selected remedyalso is protective of piscivorous fish, such as the largemouth bass and striped bass, omnivorousfish, such as the brown bullhead, insectivorous birds, such as the tree swallow, insectivorousmammals, such as the little brown bat, and omnivorous mammals, such as the raccoon, whichalso are at risk at the Site.
Overall reductions in ecological risk achieved by the selected remedy are large, especially incomparison with the No Action and MNA alternatives. The selected remedy is protective of thepiscivorous birds and mammals which are the ecological receptors at greatest risk at the Site.
The selected remedy, REM-3/10/Select, is more cost-effective than the REM-0/0/3alternative. The selected remedy is $110 million less expensive than REM-0/0/3, withoutsubstantially greater reductions in ecological and human health risks. In addition, the cappingalternative that was considered (CAP-3/10/Select) would not be as permanent or reliable as theselected remedy and would raise significant long-term maintenance concerns.
The selected remedy will comply with the location-specific and action-specific ARARsidentified, as well as four of the seven chemical-specific ARARs for the site. However, althoughthe selected remedy will approach some of these numbers, three of the chemical-specific ARARsare not expected to be met because the PCB contamination entering the Upper Hudson River

Hudson River PCBs Site Record of Decision
105
from above Rogers Island (even after source control near the GE Hudson Falls plant) will likelyexceed those ARARs. Therefore, technical impracticability ARAR waivers are required for threechemical-specific ARARs (1 ng/L total PCBs federal Ambient Water Quality Criterion; 0.12ng/L total PCBs New York State standard for protection of wildlife; and, 0.001 ng/L total PCBsNew York State standard for protection of human consumers of fish). Even the most aggressiveremoval alternative, REM-0/0/3, would require these same waivers.
Implementation of the selected remedy will greatly reduce the mass of PCBs in the sedimentsand lower the average PCB concentration in surface sediments, which in turn will reduce PCBlevels in the water column and fish and other biota, thereby reducing the level of risk to humanand ecological receptors. Reduced amounts of PCBs in the water column and reduced surfacesediment concentrations will also reduce the long-term transport of PCBs from each river sectionto the next and from the Upper Hudson River to the Lower Hudson River. For example, there isexpected to be a 38 percent reduction of the PCB load that is transported into the Lower HudsonRiver in the 10 years following remediation as compared to MNA alone (with upstream sourcecontrol).
The selected remedy is technically and administratively feasible and is implementable. All ofthe necessary personnel, equipment and services required are expected to be readily available orreasonably arranged.
In summary, the REM-3/10/Select alternative was chosen based on the need for activeremediation in order to protect human health and the environment. The REM-3/10/Selectalternative fulfills the statutory requirement for permanent remedies, to the maximum extentpracticable, whereas capping does not, and the REM-3/10/Select alternative is more cost-effective than the REM-0/0/3 alternative.
14. STATUTORY DETERMINATIONS
EPA and the State of New York believe that the selected remedy complies with the CERCLAand NCP provisions dealing with remedy selection. This includes selection of remedies that areprotective of human health and the environment, comply with applicable or relevant andappropriate requirements (or justify a waiver from such requirements), are cost effective andutilize permanent solutions and alternative treatment technologies or resource recoverytechnologies to the maximum extent practicable. In addition, CERCLA includes a preference forremedies that employ treatment that permanently and significantly reduce the volume, toxicity ormobility of hazardous substances as a principal element. The following sections discuss how theselected remedy meets these statutory requirements.

Hudson River PCBs Site Record of Decision
106
14.1 Protection of Human Health and the Environment
The selected remedy is protective of human health and the environment. Risk is reducedthrough removal of PCB-contaminated sediment, followed by backfilling and MNA. Risk fromhuman consumption of fish in River Sections 1, 2, and 3, as well as in the Lower Hudson River,is significantly reduced. The modeling projects that one of the targets of this remedy, a fish PCBconcentration of 0.4 mg/kg, which is protective of the average adult who consumes one fish mealfrom the Upper Hudson every two months, will be attained within the entire upper Hudson Riverwithin 20 years of active remediation. The modeling also projects that the target PCB fishconcentration of 0.2 mg/kg, protective of an adult who consumes one fish meal from the UpperHudson per month, is expected to be attained in River Section 2 within 32 years of activeremediation. These time periods are significantly shorter than the time periods projected forattaining the 0.4 mg/kg and 0.2 mg/kg targets in these sections of the river under either the NoAction alternative or the MNA alternative. Moreover, as discussed earlier, the actual timedifferentials may be greater that those calculated by EPA’s models. The selected remedyachieves a 76% to 85% reduction in the RME cancer risk and a 71% to 79% reduction in theRME non-cancer hazard index compared to No Action. The selected remedy achieves a 50% to80% reduction in the RME cancer risk and a 58% to 75% reduction in the RME non-cancerhazard index compared to the MNA alternative.
As stated above, according to EPA’s model projections for the Upper Hudson River, theselected remedy will meet the Remediation Goal for human consumption of fish, 0.05 mg/kg, inRiver Section 3 within 43 years after completion of the active remediation. Therefore, theRemediation Goal of 0.05 mg/kg, or one fish meal per week for an adult, also is expected to beattained in the majority of the Lower Hudson River within this time frame, due to the lowerinitial concentration of Site-related PCBs in the Lower Hudson compared to the Upper Hudson. Because of the continuing Tri+ PCB load of 2 ng/L assumed after implementation of the sourcecontrol action in the vicinity of the GE Hudson Falls plant, the PCB concentration in fishaveraged over the Upper Hudson is expected to be reduced to a range of 0.09 to 0.14 mg/kg,within the 70-year modeled time period, which is slightly above the Remediation Goal of 0.05mg/kg. However, the protectiveness of the selected remedy is further enhanced throughcontinuation of institutional controls, such as the fish consumption advisories and fishingrestrictions.
If GE’s proposed source control is able to reduce the upstream Tri+ load to zero, then theselected remedy is predicted to reach the Remediation Goal of 0.05 mg/kg PCBs in fish tissue by2039 in River Section 1, by 2041 in River Section 2, and by 2025 in River Section 3.
The selected remedy is also protective of the environment. The selected remedy will reducePCB concentrations in fish averaged over the entire Upper Hudson, and in the Lower Hudson, tolevels that are at or within the range of 0.3 to 0.03 mg/kg in whole fish, which is the Remediation

Hudson River PCBs Site Record of Decision
107
Goal for ecological exposure. The selected remedy is therefore protective of the piscivorous orsemi-piscivorous birds such as the belted kingfisher, great blue heron and bald eagle, and thepiscivorous or semi-piscivorous mammals, such as the river otter and mink, which are theecological receptors at greatest risk at the Site. By removing PCBs from the Upper HudsonRiver, the selected remedy also is protective of piscivorous fish, such as the largemouth bass andstriped bass, omnivorous fish, such as the brown bullhead, insectivorous birds, such as the treeswallow, insectivorous mammals, such as the little brown bat, and omnivorous mammals, suchas the raccoon, which also are at risk at the Site.
By greatly reducing the mass of PCBs in the sediments and lowering the averageconcentrations of PCBs in surface sediments, the selected remedy will also reduce the long-termtransport of PCBs from each River Section to the next and from the Upper Hudson River to theLower Hudson River.
14.2 Compliance with ARARs
The selected remedy will comply with the location-specific and action-specific ARARsidentified, as well as four of the seven chemical-specific ARARs for the Site. However, althoughthe selected remedy will approach some of these numbers, three of the chemical-specific ARARsare not expected to be met because the PCB contamination entering the Upper Hudson Riverfrom above Rogers Island (even after source control near the GE Hudson Falls plant) will likelyexceed those ARARs. Therefore, because of technical impracticability, three chemical-specificARARs pertaining to water column concentrations (1 ng/L total PCBs federal Ambient WaterQuality Criterion; 0.12 ng/L total PCBs New York State standard for protection of wildlife; and,0.001 ng/L total PCBs New York State standard for protection of human consumers of fish) arehereby waived (CERCLA Section 121(d)(4)(c) and 40 CFR 300.430(f)(1)(ii)(C)(3)). Even themost aggressive removal alternative, REM-0/0/3, would require these same waivers. Even withthe technical impracticability waivers, the selected remedy is protective of human health and theenvironment.
The ARARs for the selected remedy are provided in Tables 14-1 through 14-3. The TBCs areprovided in Tables 14-4 and 14-5.
14.3 Cost-Effectiveness
The cost of the selected remedy, REM-3/10/Select, is proportional to its overall effectiveness. The selected remedy’s overall effectiveness is determined based on a consideration of its long-term effectiveness and permanence (Section 11.3, above), reduction in toxicity, mobility orvolume through treatment (Section 11.4, above); and short-term effectiveness (Section 11.5,above).

Hudson River PCBs Site Record of Decision
108
The selected remedy is significantly more protective of human health and the environment inthe long-term than the No Action and MNA alternatives. Although the MNA ($39 Million) andNo Action ($0.14 Million) alternatives are considerably less expensive than the selected remedy,those alternatives are not sufficiently protective of human health and the environment. NoAction and MNA would result in a continuation of unacceptably elevated fish PCBconcentrations at the Site, and the continued degradation of the sediments and surface waterquality of the Upper Hudson River, especially in River Section 1, for at least several decadeslonger than any of the active remedial alternatives. While the CAP-3/10/Select alternative isapproximately $90 million less expensive than the selected remedy and provides a degree of riskreduction that is similar to the risk reduction under the selected remedy, CAP-3/10/Select is lesspermanent and reliable than the selected remedy. CAP-3/10/Select does not effectively eliminatelong-term risks for target areas that are capped because of long-term effectiveness andmaintenance concerns associated with the cap, and it would also require certain Site userestrictions in the capped areas.
The selected remedy is more cost-effective than the REM-0/0/3 alternative. REM-3/10/Selectis $110 million less expensive than REM-0/0/3, without substantial differences in the amount ofecological or human health risk reduction.
In summary, the selected remedy is cost-effective.
14.4 Utilization of Permanent Solutions and Alternative Treatment (or ResourceRecovery) Technologies to the Maximum Extent Practicable
EPA has determined that the selected remedy represents the maximum extent to whichpermanent solutions and treatment technologies can be utilized in a practicable manner at theSite. Of those alternatives that are protective of human health and the environment and complywith ARARs (or provide a basis for invoking an ARAR waiver), EPA has determined that theselected remedy provides the best balance of trade-offs in terms of the five balancing criteria,while also considering the statutory preference for treatment as a principal element and the biasagainst off-site disposal without treatment and considering State and community acceptance.
Implementation of the selected remedy will greatly reduce the mass of PCBs in the sedimentsand lower the average PCB concentration in surface sediments, which in turn will reduce PCBlevels in the water column and fish and other biota, thereby reducing the level of risk to humansand ecological receptors. These permanent reductions will also reduce the long-term transport ofPCBs from each river section to the next and from the Upper Hudson River to the Lower HudsonRiver. For example, as noted above, EPA projects that there will be at least a 38 percentreduction of the PCB load that is transported into the Lower Hudson River in the 10 yearsfollowing the implementation of the selected remedy as compared to MNA alone (with upstreamsource control).

Hudson River PCBs Site Record of Decision
109
14.5 Preference for Treatment as a Principal Element
The selected remedy results in the targeted removal of 2.65 million cubic yards ofcontaminated sediments containing approximately 70,000 kg (about 150,000 lbs) of total PCBs(approximately 65% of the total PCB mass present within the Upper Hudson River) from theriver environment. This results in a long-term reduction in the mobility and volume of PCBs inthe river, even though treatment is not a principal element of the remedy. As explained above(Section 14.3), EPA has determined that given the volume of material to be removed, treatmentof the material prior to off-site disposal (other than the stabilization of the sediments for handlingpurposes) would not be cost-effective. During remedial design, EPA will consider whether thereare any new treatment options for the dredged sediment and whether there are value engineeringrecommendations (e.g., waste volume or toxicity reductions) that could improve the cost-effectiveness of the remedy. During the remedial design or implementation, EPA will determinewhether beneficial use (i.e., the manufacture of commercial products) is appropriate for someportion of the dredged material.
14.6 Five-Year Review Requirements
Because the selected remedy will result in hazardous substances, pollutants, or contaminantsremaining on-site above levels that allow for unlimited use and unrestricted exposure, a statutoryreview will be conducted within five years after initiation of remedial action. The five-yearreview will evaluate the results from monitoring programs established as part of this remedy toensure that the remedy remains protective of human health and the environment.
The protectiveness of the selected alternative will be further enhanced through continuation ofinstitutional controls, including the continuation of fish consumption advisories and fishingrestrictions, as needed, until such time as the Remediation Goals are achieved.
15. DOCUMENTATION OF SIGNIFICANT CHANGES FROM PREFERRED
ALTERNATIVE OF PROPOSED PLAN
The Proposed Plan for the Hudson River PCBs Site was released in December 2000. TheProposed Plan identified Alternative 4: REM-3/10/Select (active removal of sediments withbackfilling followed by MNA in River Sections 1, 2, and 3) as the preferred alternative forremediating the contaminated sediments. EPA reviewed all written (including electronic formatssuch as e-mail) and oral comments during the public comment period. EPA has determined thatno significant changes to the remedy, as originally identified in the Proposed Plan, are necessaryor appropriate. At the same time, EPA notes the following items that were not included in the

Hudson River PCBs Site Record of Decision
110
Proposed Plan (these items are not significant changes for purposes of Section 117(b) ofCERCLA):
• A community involvement program will provide members of the public and electedofficials the opportunity for early and meaningful input during the remedial design. Thisenhanced community involvement program will remain active throughout the subsequentconstruction and post-construction monitoring phases of the project.
• The remedial dredging will be conducted in two phases. In the first phase, the firstconstruction season of remedial dredging will be implemented initially at less than full-scale, during which extensive monitoring of operations will be performed. The secondphase will be the remainder of the dredging operation, which will be conducted at full-scale and is expected to last five years;
• Performance standards will be established for the project. These will be used to evaluatethe first season of dredging and provide information to make any necessary adjustmentsto the operations of the succeeding phase. During the full-scale remedial dredging, EPAwill continue to evaluate performance data and make necessary adjustments;
• Backfill material will be transported within the Upper Hudson River area by rail and/orbarge. By movement of this material as well as dredged sediment in this manner, impactson local traffic will be minimized. Throughout design, further steps to avoid/mitigatetraffic impacts and other potentially adverse impacts on the quality of life will beexplored.
In the Proposed Plan, EPA indicated that the preferred remedy would be performed inconjunction with a separate Non-Time Critical Removal Action to address the ongoing release ofPCBs to the river from the vicinity of the GE Hudson Falls plant. Source control at Hudson Fallsis currently being addressed by GE under New York State order pursuant to State law. In theevent that source control at Hudson Falls is not successfully implemented pursuant to State law,EPA has authorized the performance of an Engineering Evaluation/Cost Analysis to evaluateoptions for a Non-Time Critical Removal Action at Hudson Falls pursuant to CERCLA in orderto ensure that the PCB load to the river is significantly reduced.
PART 3: RESPONSIVENESS SUMMARY
The Responsiveness Summary is provided as a separate attachment to this Record ofDecision.

Hudson River PCBs Site Record of Decision
A-1
Appendix A
Record of Decision
Hudson River PCBs Superfund Site
Statement of Findings: Floodplains and Wetlands
Need to Affect Floodplains and Wetlands
The selected remedy (REM 3/10/Select - Removal followed by MNA, assuming UpstreamSource Control) entails excavation of PCB-contaminated sediments, which have been determinedto pose a threat to human health and ecological receptors, within a 40-mile reach of the UpperHudson River. Implementation of the selected remedy will greatly reduce the levels of PCBcontamination in Hudson River sediments and the separate source control action will substantiallyreduce the potential for recontamination of remediated areas. EPA has determined that there is nopracticable alternative that is sufficiently protective of human health and the environment and wouldnot result in excavation of these sediments. Because certain submerged aquatic vegetation (SAV)communities along the Upper Hudson are contaminated by PCBs, they have been included in theareas targeted for dredging. In addition, certain wetlands adjacent to PCB-contaminated SAVcommunities may be affected by the dredging operations.
In addition to the selected remedy, the following four remedial alternatives were considered inthe December 2000 Feasibility Study:
• No Action (no Upstream Source Control);
• Monitored Natural Attenuation (MNA) with Upstream Source Control;
• CAP-3/10/Select - Capping, with Removal to Accommodate Cap, followed by MNA,with Upstream Source Control; and
• REM-0/0/3 - Removal followed by MNA with Upstream Source Control.
The No Action alternative and the MNA alternative do not entail excavation of contaminatedsediments. The former does not include any physical remedial measures, and the latter relies onnatural attenuation and a separate source control action only. Under both alternatives, contaminationcurrently in the Upper Hudson River sediments would remain in place and remain a potential sourcefor contamination of Hudson River floodplain sediments and floodplain, wetland, and SAVecological communities. The No Action alternative would not be protective of human health andthe Hudson River environment. Although the MNA alternative assumes a separate source control

Hudson River PCBs Site Record of Decision
A-2
action, it would not mitigate the ongoing adverse effect the contaminated sediments are having onthe floodplain, wetlands and SAV communities.
Implementation of the CAP-3/10/Select and REM-0/0/3 alternatives would entail excavation ofUpper Hudson River sediments, resulting in temporary disturbance to the floodplain, wetlands andSAV communities. Approximately 1.73 million and 3.82 million cubic yards of PCB-contaminatedsediment would be excavated under the CAP-3/10/Select and REM-0/0/3 alternatives, respectively.The CAP-3/10/Select also would entail the capping of 207 acres of contaminated sediments. Likethe selected remedy, the CAP-3/10/Select and REM-0/0/3 alternatives, by removing PCB-contaminated sediments from the Upper Hudson River, would be protective of human health and theenvironment, including the floodplain, wetlands and SAV communities.
Effects of Proposed Action on Floodplains and Wetlands
A principal benefit of EPA's selected remedy will be removal of a considerable sediment-boundcontaminant mass from the river. PCB-contaminated sediments removed from the Upper HudsonRiver no longer will function as a source of contamination of Hudson River floodplains, wetlandsand SAV communities. As removal work proceeds, the mass of PCBs available to betransported during flood events into the floodplains and wetlands bordering the river will diminish.In this context, the selected remedy will have a substantial positive impact, especially during floodevents when the potential for sediment resuspension is greatest. Further, removal of PCB-contaminated sediments will greatly reduce the risk to ecological receptors resident in the HudsonRiver floodplain, wetlands and SAV communities.
Excavation of sediments may result in temporary, localized disturbance to the floodplain,wetlands and SAV communities. Approximately 2.65 million cubic yards of PCB-contaminatedsediment will be excavated. The selected remedy calls for 0.8 million cubic yards of fill to be placedin the river as a follow-up activity to dredging operations. Thus, EPA will remove considerably morematerial from the river bottom than it will place as fill. In addition, backfilling will not affect theactive storage capacity of the Upper Hudson because it is a series of impounded pools controlled bydams. For both these reasons, it is not expected that backfilling will exacerbate conditions duringflood events. No permanent impact (positive or negative) to the capacity of the floodplain to carryflood flows will result from implementation of the selected remedy.
Based on available wetland mapping, the dredging operations will occur in locations contiguousto approximately 129 acres of wetlands, although no wetlands are currently expected to be dredgedor backfilled. In addition, an estimated 177 acres of submerged aquatic vegetation will be dredgedand an additional 46 acres of submerged aquatic vegetation are located contiguous to areas to bedredged. Wetlands and SAV communities in and contiguous to the remediation areas and thesediment processing/transfer facilities will be field delineated during remedial design.
Hudson River PCBs Site Record of Decision
A-3
Dredging and backfilling will result in changes to the sediment supply and channel morphology,which in turn may lead to river bed and bank erosion and sedimentation. To minimize river bankinstability that could adversely affect floodplains, wetlands and SAV, the selected remedy calls forshoreline stabilization measures, where appropriate. In addition, the selected remedy will employengineering and operational controls to reduce resuspension of sediments during dredging andbackfilling. These measures will reduce impacts on SAV communities due to reduced lightpenetration through the water column. In any event, impacts to SAV communities are expected tobe temporary and localized.
Construction of sediment processing/transfer facility(ies) called for in the selected remedy mayrequire the placement of fill in the floodplain. The discharge of water from the facility(ies) willcomply with all substantive state and federal requirements.
The selected remedy will comply with applicable or relevant and appropriate substantiverequirements relating to floodplains and wetlands, including Executive Order 11988: FloodplainManagement; Executive Order 11990: Protection of Wetlands, 40 CFR Part 6, Appendix A; and theNew York State Freshwater Wetlands Act.
Measures to Mitigate Potential Harm to the Floodplains and Wetlands
The following mitigation measures will be undertaken to reduce impacts on floodplains, wetlandsand SAV communities:
• EPA will employ measures to control resuspension and downstream migration ofPCBs during remediation, including sediment barriers (e.g., silt curtains) andoperational controls, in order to minimize potential impacts to floodplains, wetlandsand SAV communities;
• A habitat replacement program will be implemented in an adaptive managementframework to replace SAV communities, wetlands, and river bank habitat;
• A shoreline stabilization program will be implemented;
• Wetlands adjacent to the remediation area and at the sediment processing/transferfacility location(s) will be field delineated during remedial design;
• During remedial design, EPA will consider in detail the need to minimizeencroachments or impacts to wetlands in the vicinity of the sedimentprocessing/transfer facility(ies); and
• If it is determined that the selected remedy requires unavoidable impacts towetlands, EPA will implement compensatory wetland mitigation, as appropriate,in consultation with USACE, the federal trustees, and NYSDEC.